Abstract
Shade trees may have contrastive effects on Robusta coffee (Coffea canephora Pierre ex A. Froehner) yield, which may be additionally influenced by soil properties and reproductive stages of the plant. The current study is aimed at examining the interaction effects of shade trees, soils with different properties, and reproductive stages on coffee yield and identifying key factors influencing the yield. The current study was conducted in Dakha, Kontum of Vietnam on 133 farms, randomly selected from two soils, and two reproductive stages of coffee plants planted with and without shade trees. The coffee yield was measured, and surface soil samples were taken from these farms to be analyzed for 16 variables. The results showed that shade trees enhanced coffee yield significantly (by 28%) in the young reproductive stage but exhibited an insignificant effect in the old stage. The silt fraction, total nitrogen, cation exchange capacity, and shade trees were key factors determining 52% of the coffee yield in the sandy clay loam soil, while silt content and shade trees determined 23% of the yield in the clay soil. These findings suggest that shade trees, together with some soil properties, should be considered to improve coffee production under a tropical monsoon climate region.
1. Introduction
Coffee (Coffea spp.) is an important perennial crop with its product being traded globally in second place after oil [1]. The crop has been planted in different countries such as Vietnam, Brazil, and Indonesia [2,3], and its product involves more than 120 million people worldwide [4]. The coffee yield may be determined by many factors [4,5,6], which, generally, could be separated into three primary categories, including microclimatic condition-related factors, soil property-related factors, and management practices [2,7,8,9]. Coffee plants are sensitive to changes in climatic conditions, such as rainfall and minimum temperature [10]. Soil properties, such as organic carbon, available potassium, boron, sulfur, zinc, phosphorus, total nitrogen, exchangeable calcium, magnesium, and soil pH, are important factors used to build a computer model to predict coffee yield in Vietnam [11]. Some management practices such as mulching, inorganic fertilizer application, and organic farming practices were also reported to have a substantial impact on coffee yield in various countries [12,13,14].
To minimize climatic stresses and improve soil properties for better coffee yield, shade trees have been used and examined in many studies. The effects of shade trees on coffee yield can be either negative or positive, depending on study circumstances [15,16,17,18,19]. Towards the positive way, shade trees may greatly increase coffee yield by ameliorating harsh microclimatic conditions, resolving nutrient imbalances, protecting against temperature change and erosion, excessive radiation, and preserving soil moisture content, which could be dependent on the shade-tree density and intercepted radiation [15,16,19,20,21]. In the negative direction, shade trees may reduce coffee yield by reducing carbon assimilation due to light interception, stimulating vegetative development, and increasing competition for nutrients, water, and sunlight with the main crop [17,18]. These findings suggest that shade trees can alter coffee yield by influencing microclimatic condition-related factors and soil property-related factors. These two groups of factors were limitedly addressed, necessitating more studies to clarify the outcomes. Moreover, the effects of shade trees might vary depending on the age of the coffee plants. For example, Piato et al. [19] found that shade trees exhibited a significantly positive influence on old coffee plants but a negligible or negative impact on young coffee plants. This finding may need more studies to confirm these results because young coffee plants could be more sensitive to the changes in the environmental conditions caused by shade-tree management than old coffee plants. Therefore, our first hypothesis is that the shade-tree effect on the coffee yield of young plants could be stronger than that of old plants.
Coffee production can also be influenced by soil properties. Better soil fertility via enhanced soil properties such as soil carbon, nitrogen, phosphorus, potassium, calcium, and magnesium by mulching improved coffee yield, and the effect was site-specific [22]. Similarly, the coffee yield was positively correlated with soil characteristics such as pH, the concentration of Ca, Mg, total N, and available P, while it was adversely connected to aluminum saturation in acid soils in Southern Rwanda [23]. These findings indicate that better soil fertility may lead to an improvement in coffee yield and low-fertility soils may have more coffee yield-limiting factors. Therefore, our second hypothesis is that more soil characteristics could contribute to influencing coffee yield in the less fertile soil than in very fertile soil. Moreover, as the crop develops, some soil properties such as pH and organic matter concentration may deteriorate, leading to a reduction in coffee yield [24]. Changes in soil properties during the coffee growing period could additionally be influenced by agronomic practices. The overuse of inorganic fertilizers for coffee farms in major coffee-producing regions in Vietnam [2] suggests that the concentration of some inorganic fertilizer-related soil properties may be greater in old coffee farms than in young farms. This leads to our final hypothesis, that old coffee farms could have greater soil nutrient content than young coffee farms.
Therefore, the current study was carried out in Dakha, Kontum, a major coffee-producing province in Vietnam [25]. The aims of the current study were to examine the interaction effects of shade trees, soils with different properties, and reproductive stages on the coffee yield and to identify key factors influencing the crop yield.
2. Materials and Methods
2.1. The Study Area
The current study was conducted in Dakha district, Kontum Province, Vietnam at 14°23′ to 14°53′ N and 107°51′ to 108°8′ E (Figure 1). The province was located in the Central Highlands, which were the most prone to drought in the country [26]. The study area was approximately 844 km2 in size and had a total population of 74,805 people distributed over 11 administrative communes. The topography of the study area included 580 to 650-m-high hills (meters above sea level) and mountains along with low-terrain areas. Several huge dams within the region have been constructed to store water for agricultural production. The study area has a tropical monsoon climate with total annual rainfall ranging from 1600 to 1800 mm, the majority falling during the rainy season (from April to December). The dry season has relatively low monthly rainfall, varying from 7 to roughly 38 mm [27]. Low rainfall during the blooming period (January and February) might result in a considerable loss of coffee yield for the following harvest. The temperature in the area ranged from 20.8 to 25.8 °C with the highest values in March and April.
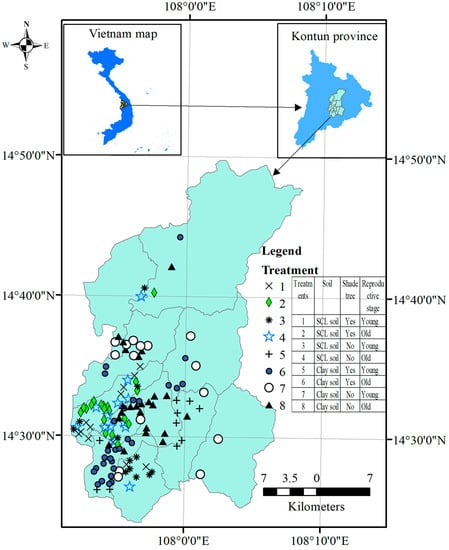
Figure 1.
Map of the study area and sampling sites in Dakha, Kontum, Vietnam. SCL = sandy clay loam. The map was drawn using ArcGIS 10.7 (Esri, CA, USA).
The Central Highlands had two main soil types of Acrisols [28] formed from acidic granites and Ferrasols [28] generated from basic and neutral basalts [25]. The former was planted with coffee in a much lower proportion than the latter. The soil used for the current study was a Rhodic Ferralsol [28] that was planted with coffee of varying ages. Two soils (sandy clay loam (SCL) soil and clay soil) with distinct features, particularly soil textures, were selected for the current study (more information about soil properties shown in Table 1, Table 2 and Table 3).

Table 1.
The number of coffee farms, the values of sand, silt, clay, pH, and OC (organic carbon) of the examined soils. Within the mean column, data attached with the same letter were not significantly different from each other. Details of the main and interaction effects of three experimental factors were shown in Supplementary Table S1. SCL = sandy clay loam; SD = standard deviation.
Table 2.
The concentration of TKN (Total Kjeldahl nitrogen), total P, total K, available P and K, and CEC of the examined soils. Within the mean column, data attached with the same letter were not significantly different from each other. Details of the main and interaction effects of three experimental factors were shown in Supplementary Table S2. SCL = sandy clay loam; SD = standard deviation.
Table 3.
The concentrations (mg kg−1) of selected micronutrients in the examined soils. Within the mean column, data attached with the same letter were not significantly different from each other. Details of the main and interaction effects of three experimental factors were shown in Supplementary Table S3. SCL = sandy clay loam; SD = standard deviation.
2.2. Coffee Farms and Experimental Factors and Setup
Coffee farms: The coffee crop was established over the study area with ages varying from a few years to more than twenty-five years with Robusta (Coffea canephora) being the most common species. The planting space was 3.5 × 2.5 m, which resulted in 1142 plants per ha. Shade trees of Leucaena (Leucaena leucocephala (Lam.) De Wit) were intercropped to coffee farms at the same time as coffee planting after 1 year in a nursery. The planting density of shade trees was around 69 trees ha−1 (spacing 12 × 12 m), and shade covered approximately 34% of the coffee farm. The shade trees were not applied with any fertilizers during their whole lifespan. When the shade trees grew well, their horizontal branches were regularly pruned off, keeping their canopy at least 2 m away from the coffee’s canopy in the early stages and 4 m or more in the reproductive stages. More information on shade-tree management can be referenced in [20].
Experimental factors: The current study included three combined factors, which were soil, coffee stages, and shade trees. For the current study, one hundred and thirty-three coffee farms were randomly selected from two soils of SCL soil and clay soil, forming the soil-related factor. These coffee farms were chosen based on some criteria, including the fact that coffee plants were the first generation after a poor forest; these coffee farms used similar agronomic practices, such as fertilizer application, weeding, tree maintenance, pruning, and water management. Biomass after pruning was used to mulch coffee plants for better soil protection and coffee growth. These farms were located in relatively flat areas with average elevations ranging from 587 to 656 m (above sea level) and size varying from 0.75 to 1.4 ha per farm. These coffee farms were also selected based on the reproductive stages of the crop. The entire economic lifespan of Robusta coffee plants may be divided into two major stages, which were the vegetative stage occurring after transplantation to the fields and the reproductive stage beginning from the end of the vegetable stage when coffee plants started the first flowers [29]. The reproductive stage was further subdivided into the young reproductive stage and the old reproductive stage. Because coffee plants in the current study had an entire lifespan of around 25 years, of which the first five years belonged to the vegetable stage, the reproductive stage of coffee plants was equally subdivided into two stages of the young reproductive stage (from year 5 to year 15) and old reproductive stage (from year 16 to year 25), forming an experimental factor of coffee stages. In addition, coffee farms intercropped with and without shade trees of Leucaena were randomly selected to form the third experimental factor of shade trees.
Experimental setup: Three experimental factors in the current study included (1) soil (SCL soil and clay soil), (2) coffee stage (young reproductive stage and old reproductive stage), and shade trees (applied with and without shade trees). These three experimental factors were crossed with each other, forming eight combinations (treatments) and the number of farms corresponding to individual treatments were shown in Table 1. The current three-factor experiment was set up as a completely randomized design with varying replicates as shown in Table 1 (number of farms in each combination of the three experimental factors). The spatial distribution of 133 selected farms, which were randomly selected over two soils, two reproductive stages, and two shade tree statuses, were shown in Figure 1.
2.3. Measurements
In October 2019, one hundred and thirty-three coffee farms were randomly selected from the study area, and soil samples from the 0–30 cm surface layer [30,31] were taken for chemical analysis. Ten sites relatively evenly distributed over one coffee farm were randomly chosen and soil material from these sites was taken and thoroughly mixed to form a composite sample. The ten sampling sites were located between two rows of coffee plants. A hoe was used to dig a small hole to a depth of 30 cm, and soil particles from the hole walls were collected using a stainless-steel knife. The one hundred and thirty-three composite soil samples were transferred to a laboratory, air-dried, and gently crushed to pass through a 2-mm sieve [32,33] before chemical analysis. The owners of these farms were also asked to record the total weight (kg) of coffee beans to be harvested in November and December as well as the farm size for yield estimation.
2.4. Chemical Analysis
The one hundred and thirty-three soil samples were analyzed for particle size distribution, pH, organic carbon (OC), total Kjeldahl nitrogen (TKN), total phosphorous (total P), total potassium (total K), Mehlich-1 P, available potassium (available K), cation exchange capacity (CEC), copper (Cu), zinc (Zn), boron (B), molybdenum (Mo), and cobalt (Co). These microelements (Cu, Zn, B, Mo, and Co) could be beneficial to the coffee crop, but they may become harmful when present in excess concentrations [34,35]. The 2-mm sieve-passed soil was added with 1N KCl solution at a 1:5 (w/w) ratio and the extract was measured for pH using a Thermo Scientifc™ Orion™ 3-Star Benchtop pH Meter. The particle size distribution of all 133 soil samples was determined using the pipette method [36]; OC was with the dichromate redox methods [36], and total Kjeldahl nitrogen was measured using the Kjeldahl method [37]. Total P was determined following soil digestion with a mixture of sulfuric acid and perchloric acid; the extract was measured using the Murphy-Riley colorimetric method [38]; and the Mehlich-1 P was determined using the Mehlich-1 method [39]. Total K and available K were determined using the method by [40] and [41], respectively. Briefly, total K and available K in the soil were measured using inductively coupled plasma-optical emission spectrometry (ICP-OES) (SPECTRO Analytical Instruments GmbH, Boschstrasse, Germany) after the soil was digested with a mixture of hydrofluoric acid and perchloric acid or extracted with a 1-M ammonium acetate solution, respectively. CEC was quantified using the ammonium acetate method as used in Nguyen and Lehmann [42]. The concentration of the micro-elements was measured using the method by [43].
2.5. Statistical Analyses
All measured data were statistically analyzed using a three-way Analysis of Variance (ANOVA) for a completely randomized design. A full statistical model applied to examine the three-way interaction of shade trees, soil, and the reproductive stage was , where is the response of individual combination; is the overall mean; is a fixed effect of the ith shade trees; is the fixed effect of the jth soil; is the interaction effect of shade trees and soil; is the fixed effect of eth reproductive stage; is the interaction effect of shade trees and the reproductive stage; is the interaction effect of soil and reproductive stage; is the interaction effect of shade trees, soil, and reproductive stage, and is the random error with a mean Zero and having a normal distribution [44]. When the ANOVA result indicated a significant effect at p ≤ 0.05, the Tukey’s Honest Significant Difference test was used to classify treatment means. A simple linear regression analysis was performed to examine the relationship between coffee yield and individual soil variables. Multiple regression analysis was carried out to quantify the contributive percentage of individual soil variables and shade-tree effects to the total variance of the coffee yield. The stepwise method was implemented to eliminate any uncorrelated variables to establish a final meaningful multiple regression model [45]. All statistical analyses were carried out using JMP pro 13 (SAS Institute Inc., Cary, NC, USA). Figures were established using Sigmaplot 12 (Systat Software Inc., San Jose, CA, USA).
3. Results
3.1. Coffee Yield
The interaction effect of soils, reproductive stage, and shade trees on coffee yield was not significant, whereas the interaction impact of reproductive stage and shade trees was significant (Figure 2). In the SCL soils and the young reproductive stage, coffee farms planted with shade trees exhibited a much higher yield (4.4 ton ha−1) than farms planted with no shade trees (3.3 ton ha−1), while in the old reproductive stage, coffee farms planted with or without shade trees showed a similar yield (4.0 and 3.5 ton ha−1, respectively) (Figure 2a). Similarly, in the clay soil, shade trees showed a much greater coffee yield (4.2 ton ha−1) than no shade trees (3.4 ton ha−1) in the young reproductive stage, but shade trees and no shade trees resulted in similar coffee yields (3.9 and 3.7 tone ha−1, respectively) in the old reproductive stage (Figure 2b). The coffee yield was similar between the two examined soils.
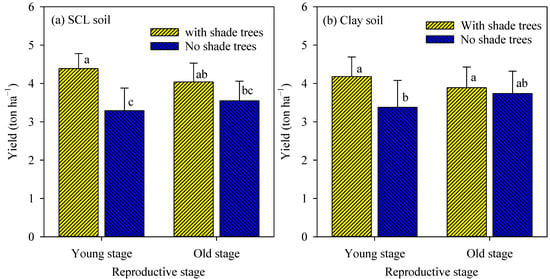
Figure 2.
Coffee yield in the two reproductive stages in SCL soil (a) and clay soil (b) as affected by shade trees. For each panel, columns attached with the same letter were not significantly different from the others at p ≤ 0.05. The error bars indicated standard deviation. SCL = sandy clay loam.
3.2. Soil Properties
The interaction between the three experimental factors on the sand, silt, and clay content, pH, and OC concentration of the tested soils was not significant, nor was the interaction effect between any two experimental factors (Supplementary Table S1 and Table 1). The two examined soils showed significant differences in these characteristics. The sand, silt, and clay content of the SCL soil varied from 52.7 to 56.1, 19.1 to 21.4, and 23.0 to 28.0%, respectively, and these of the clay soil ranged from 26.0 to 31.1, 29.8 to 35.0, and 38.2 to 42.1%, respectively. The pH value of the SCL soil was approximately 4.2, which was much lower than the pH value of the clay soil, which was around 4.5. The concentration of OC in the SCL (1.43%) was significantly lower than that in the clay soil (1.89%).
The three experimental factors showed no significant interaction impact on the concentration of TKN, total P, total K, Mehlich-1 P, available K, and CEC (Supplementary Table S2 and Table 2). While all these variables differed considerably between the two soils, total P was significantly different between the two reproductive stages (Supplementary Table S2). In the SCL soil, the concentration of TKN, total P, total K, Mehlich-1 P, available K, and CEC varied from 0.11 to 0.17%, 0.10 to 0.16%, 0.25 to 0.4%, 35.2 to 50.6 (mg kg−1), 81.0 to 93.7 (mg kg−1), and 5.06 to 8.15 (cmol(+) kg−1, respectively. These concentrations in the clay soil ranged from 0.16 to 0.20%, 0.13 to 0.17%, 0.47 to 0.58%, 95.4 to 137.5 (mg kg−1), 81.8 to 95.5 (mg kg−1), and 11.9 to 14.2 (cmol(+) kg−1), respectively. The concentration of total P was significantly greater in the old stage (0.143) than in the young stage (0.139 mg kg−1). The concentration of some micronutrients such as Cu and Bo was significantly affected by the interaction between the reproductive stage and shade trees and between the reproductive stage and the soil, respectively (Supplementary Table S3 and Table 3). The concentration of all five measured micronutrients (Cu, Zn, Bo, Mo, and Co) was also much lower in the SCL soil than in the clay soil.
3.3. Relationships between Coffee Yield and Soil Variables
The simple linear regression analysis revealed that four of the 16 measured variables of the SCL soil, including OC, TKN, Mehlich-1 P, and CEC had a significant inter-relationship with coffee yield (Figure 3). Over the OC concentration range from 1.36 to 1.49%, the coffee yield was improved considerably at a rate of 5.6 ton ha−1 for every increasing unit of OC (Figure 3a). Similarly, the yield-increasing rate for each increasing unit of TKN (Figure 3b), Mehlich-1 P (Figure 3c), and CEC (Figure 3d) was roughly 6.4, 0.08, and 0.3 ton ha−1, respectively. In the clay soil, out of the 16 measured soil properties, only silt and clay content exhibited a strong linkage with coffee yield (Figure 4). The coffee yield rose proportionally with silt content at a rate of 0.23 ton ha−1 for every increasing one percent of silt content (Figure 4a), whereas it dropped proportionally with clay content at a rate of −0.18 ton ha−1 for each increasing percent of the material (Figure 4b).
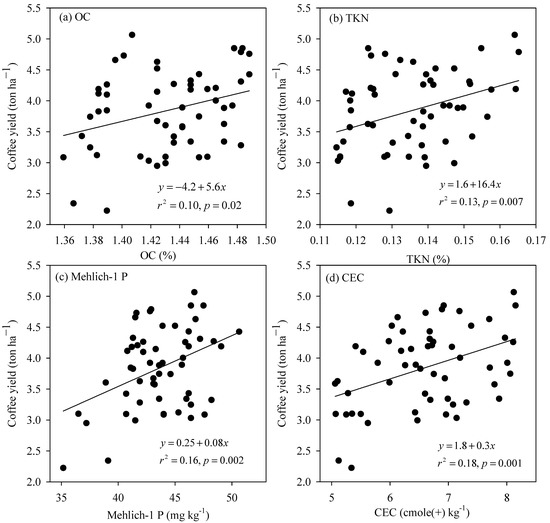
Figure 3.
The relationship between coffee yield and (a) OC, (b) TKN (Total Kjeldahl nitrogen), (c) Mehlich-1 P, and (d) CEC of the SCL soil.
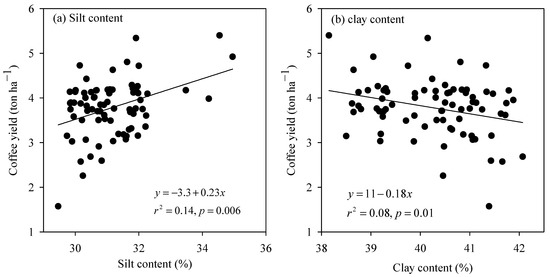
Figure 4.
The relationship between coffee yield with (a) silt and (b) clay content of the clay soil.
Multiple regression analysis showed that the full model (15 soil characteristics, reproductive stage, and shade trees) explained 64% and 33% of the total variance of the coffee yield in the SCL soil and clay soil, respectively (Table 4). The multiple regression accompanied by a stepwise procedure to eliminate any insignificant variable in the full model revealed that the coffee yield in the SCL soil was significantly correlated with silt content, the TKN concentration, CEC, and shade trees. These variables together explained 52% of the total variance of the coffee yield (individuals explaining 5.01, 6.57, 12.20, and 28.52%, respectively). In the clay soil, the reduced model responsible for the change in the coffee yield included silt content and shade trees, explaining 14.53 and 8.33% of the total variance of the coffee yield, respectively.
Table 4.
The contribution of examined factors to the total variance of coffee yield in two soils. * indicates the associated effect is significant at p < 0.05. TKN = total Kjeldahl nitrogen.
4. Discussion
4.1. The Coffee Yield as Affected by the Three Experimental Factors
4.1.1. Overall Coffee Yield
Overall, Robusta coffee yield in the current study, varying from 2.2 to 5.1 ton ha−1 in the SCL soil and 1.6 to 5.4 ton ha−1 in the clay soil, covered the yield range (from 2.1 to 4.2 ton ha−1) reported by Byrareddy et al. [2] in the Central Highlands of Vietnam. Arabica and Robusta coffee may produce maximum yields varying from 8 and 12 ton ha−1, respectively, as reported by DaMatta et al. [17]. The coffee yield in the current study was greater than the yield reported in Brazil, which ranged from around 0.8 to 1.7 ton ha−1 [3]. This is likely because Arabica coffee, the species studied in Brazil, had much lower growth and production than Robusta coffee [17], the coffee species in the current study. The yield range in the current study was greater than those reported by Kouadio et al. [9] in the same coffee-planting region, varying from 1.2 to 3.0 ton ha−1 in Kontum province. These authors reported for an entire province, which included some regions with low soil fertility and low coffee yield. Whereas our study area (Dakha) was the main coffee-producing district with the greatest coffee production in the province, leading to a greater coffee yield (Figure 2).
4.1.2. The Impacts of Shade Trees on Coffee Yield
An interesting finding from the current study was a strong interaction effect of shade trees and reproductive stage on coffee yield (Figure 2) in the two examined soils. Shade trees had a positive influence on the young reproductive stage but had no significant effect on the old stage. Several studies found that shade trees had a major impact on coffee yield. For example, Piato et al. [19] demonstrated that shade trees enhanced the growth and yield of Robusta coffee, and Anhar et al. [46] concluded that the density of shade trees had a substantial impact on coffee productivity. Nonetheless, these authors highlighted that shade trees exhibited a significant influence on old coffee plants but had an insignificant or negative impact on young coffee plants. This contradicted the finding in the present study (Figure 2). In the environmental conditions of prone drought (low rainfall and high temperature during blooming period) as in the current study, shade trees may provide some protective effects such as lowering radiation leading to a reduction of photooxidative damage, declining wind speed and temperature variation, and elevating air humidity [17]. These effects could be stronger in the young reproductive stage than in the old reproductive stage of coffee plants, supporting our first hypothesis. This may be because young plants could be more responsive to environmental changes due to the robust/active growth than old plants, leading to an enhancement of coffee yield in the young stage intercropped with shade trees (Figure 2). Furthermore, coffee farms with shade trees produced a yield comparable to farms without shade trees in the old reproductive stage (after 15 years of harvest). The findings indicate that old coffee plants may have a limited response to the changes in microclimatic conditions caused by shade trees. Therefore, some protective services induced by shade trees may be beneficial on young coffee plants but ineffective on old plants.
4.1.3. Soil Properties
Two soils, the SCL soil and clay soil with different features, were examined in the current study. The SCL soil had lower values of clay content, pH, OC, TKN, total P, total K, Mehlick-1 P, available K, CEC, and five measured micronutrients than the clay soil (Table 1, Table 2 and Table 3). Soils with a high clay proportion had a greater density of negative surface charges, which led to more CEC, OC, and other mineral elements [47]. Reduced nutrient leaching by increased clay fraction [48] may also contribute to the enhanced concentration of mineral elements of the clay soil, relative to the SCL soil. The coffee farms in the current study were located in mountainous areas, which facilitated leaching and surface erosion. Consequently, soil with lower clay content (SCL soil) could be of lesser quality than soil with higher clay concentration (clay soil). Nevertheless, the coffee yield was not statistically different between the two tested soils in the current study, which will be discussed in the following section.
Recently, Tiemann et al. [25] reported that coffee yield in the Central Highlands of Vietnam declined, and farmers opted to use more inorganic fertilizers to reverse the yield-decreasing trend. Similarly, Byrareddy, et al. [2] found that inorganic fertilizers were overapplied to the coffee fields in the Central Highlands of Vietnam to increase productivity. These findings may result in a greater concentration of some soil nutrients related to the applied inorganic fertilizers, such as N, K, and P in old coffee farms than in young coffee farms. Nonetheless, the current study found that the concentration of these nutrients and the others, except for total P, were not statistically different between the two reproductive stages (Table 1, Table 2 and Table 3, and Supplementary Tables S1–S3). The finding, except for total P, was not in agreement with our last hypothesis. The concentration of soil nutrients in the current study could be the consequence of the nutrient loss and gain happening during coffee growing. The higher concentration of total P in the old reproductive stage than in the young reproductive stage might indicate that more P was added as fertilizers than P was lost due to various reasons such as plant use, leaching, and erosion. The two soils in the current study had low pH, which may cause aluminum and iron to fix P [49], accumulating total P in soils over time. The relatively unchanged content of the other soil properties over the two reproductive stages could be attributed to various causes, including (1) erosion to transport applied fertilizers to lowland regions [50], (2) gaseous losses of N fertilizer [51], (3) nutrient losses due to leaching from the surface layer [52], and (4) nutrient removal with coffee bean and pruned leaf and branches annually [25]. No difference in soil properties between coffee farms applied with shade trees and without shade trees was also found (Table 1, Table 2 and Table 3). The shade-tree impacts on soil properties were site-specific which showed stronger effects on conventional management than on organic management of coffee fields [53]. These findings may support that the soil properties, except for the total P, of the two soils in the current study were not affected by shade trees and varied insignificantly with the reproductive stages of coffee plants.
4.2. Key Factors Influencing the Coffee Yield
The results from the current study showed that certain soil properties and shade-tree management can be the major factors determining coffee productivity in the study area. The shade trees had a considerable impact on coffee yield during the young reproductive stage but showed no influence on soil properties. The findings suggest that shade trees’ impacts could primarily reduce microclimatic stresses such as strong wind, hard dry season, and air humidity [54] rather than improve soil fertility. The study area had a severe dry season from December to March with low humidity and monthly rainfall ranging from 7 to roughly around 38 mm (with the lowest rainfall of around 7 mm occurring in January and February) [27]. The highest temperatures were also recorded in the study area in March and April. The dry season was a critical period for coffee plants to establish buds and blossoms in order to prepare cherries for the coming harvest. Reducing the adverse effects during the dry season by lowering solar radiation and enhancing air humidity and soil moisture content might be two main roles of shade trees in the current study. As young coffee plants could be more responsive to these climatic stresses than old plants, coffee farms intercropped with shade trees had greater yield during the young reproductive stage than in the old stage, as shown in Figure 1.
Soil properties are important factors, which could be used to predict coffee productivity [11]. Of the 16 soil characteristics measured in the current study, OC, TKN, Mehlich-1 P, and CEC were significantly correlated with coffee yield in the SCL soil, and silt content and clay content were strongly correlated with crop yield in the clay soil (Figure 3 and Figure 4). The findings indicate that OC, TKN, Mehlich-1 P, and CEC may be soil-related limiting factors for the coffee plants in the SCL soil, whereas silt and clay content could be the limiting factors in the clay soil. These findings also confirm our second hypothesis that coffee yield could be determined by more soil properties in the less fertile soil than in more fertile soil. OC and TKN in the SCL soil were strongly correlated with each other with a coefficient of determination (r2) of 0.20 (data not shown), and a similar correlation was reported in other studies [55,56]. Nitrogen was a macronutrient for coffee plants and its deficiency could be site specific [14,53]. Likewise, the significant correlation between TKN and coffee yield in the SCL soil but not in the clay soil suggests that N deficiency for coffee plants could occur in the SCL soil but not in the clay soil. A substantial association between coffee yield and Mehlich-1 P concentration in the SCL soil implies that available P could be an additional yield-limiting factor in the SCL soil but not in the clay soil. Compared to the SCL soil, the clay soil had a much higher concentration of Mehlich-1 P, which may fulfill the coffee’s need for P, therefore available P was not a yield-limiting constraint in the clay soil. CEC is another important soil characteristic that is strongly correlated with coffee yield in the lower-CEC soil (SCL soil) but not in the higher-CEC soil (clay soil). This finding suggests that CEC may be a coffee yield-limiting factor in the SCL soil but not in the clay soil in the current study. On the other hand, the silt concentration in the clay soil might be a coffee yield-limiting factor. Physical properties such as particle size distribution and pore size may have an impact on the root system of the coffee crop [57]. The clay soil, which contained more clay content than the SCL soil, may restrict the root development of coffee plants. Consequently, the current study found that coffee yield was inversely correlated with clay content and proportionally linked to the silt content in the clay soil.
Finally, multiple regression analysis accompanied by the stepwise procedure showed that the coffee yield can be determined by silt content and the concentration of TKN, CEC, and shade trees in the SCL soil but by the silt content and shade trees in the clay soil (Table 4). While the coffee yield in both soils was greatly dependent on shade trees, the yield in the clay soil with higher contents of the measured variables exhibited less dependency on soil-related factors, but that in the SCL soil showed more dependency on soil properties. The findings may confirm that these soil properties and shade trees could be the primary factors determining coffee yield in the current study.
5. Conclusions
The current study examined coffee yield in two reproductive stages, two soils with varied properties, and as influenced by shade-tree management. The shade trees improved coffee yield in the young reproductive stage but exhibited little effect in the old reproductive stage. The shade trees showed no significant influence on soil properties. These findings suggest that the impacts of shade trees on improved coffee yield may be primarily attributable to changes in microclimatic conditions rather than soil properties. The coffee yield was comparable in the two examined soils, although the clay soil had improved soil characteristics than the sandy clay loam soil. Silt content, TKN concentration, and CEC value were the soil-related key factors determining coffee yield in the sandy clay loam soil, but silt content was the sole soil-related key factor in the clay soil. In summary, shade trees and some soil properties in the sandy clay loam soil, as well as shade trees and silt content in the clay soil, are the main contributors to boosting coffee yield under a tropical monsoon climate region.
Supplementary Materials
The following supporting information can be downloaded at: https://www.mdpi.com/article/10.3390/agronomy13010065/s1.
Author Contributions
Conceptualization, C.T.T., B.T.N. and A.H.L.; methodology, B.T.N. and V.H.L.; software, B.T.N.; validation, V.H.L. and C.T.T.; formal analysis, B.T.N.; investigation, V.H.L.; resources, C.T.T. and V.H.L.; data curation, V.H.L.; writing—original draft preparation, V.H.L. and C.T.T.; writing—review and editing, B.T.N. and A.H.L.; visualization, A.H.L.; supervision, A.H.L.; funding acquisition, V.H.L. All authors have read and agreed to the published version of the manuscript.
Funding
This research received no external funding.
Institutional Review Board Statement
Not applicable.
Informed Consent Statement
Not applicable.
Data Availability Statement
The data presented in this study are available on request from the corresponding author.
Acknowledgments
The authors would like to express their gratitude to the Industrial University of Ho Chi Minh City (IUH) and the IUH Institute of Environmental Science, Engineering, and Management (IESEM). The authors are also grateful to the farmers having coffee farms examined in the current study. The first author also would like to thank the Kon Tum Department of Science and Technology for its help during his Ph.D. study. Many thanks are given to the students at Vietnam National University Ho Chi Minh City—the University of Science for their assistance with field trips.
Conflicts of Interest
The authors declare no conflict of interest.
References
- Davis, A.P.; Gole, T.W.; Baena, S.; Moat, J. The Impact of Climate Change on Indigenous Arabica Coffee (Coffea arabica): Predicting Future Trends and Identifying Priorities. PLoS ONE 2012, 7, e47981. [Google Scholar] [CrossRef] [PubMed]
- Byrareddy, V.; Kouadio, L.; Mushtaq, S.; Stone, R. Sustainable production of robusta coffee under a changing climate: A 10-year monitoring of fertilizer management in coffee farms in Vietnam and Indonesia. Agronomy 2019, 9, 499. [Google Scholar] [CrossRef]
- Volsi, B.; Telles, T.S.; Caldarelli, C.E.; Camara, M.R.G.d. The dynamics of coffee production in Brazil. PLoS ONE 2019, 14, e0219742. [Google Scholar] [CrossRef]
- Pham, Y.; Reardon-Smith, K.; Mushtaq, S.; Cockfield, G. The impact of climate change and variability on coffee production: A systematic review. Clim. Change 2019, 156, 609–630. [Google Scholar] [CrossRef]
- Hoang, T.M.; Doan, T.N.T.; Jiancheng, C. Input factors to sustainable development of coffee production in the Dak Lak province. Open Access Libr. J. 2016, 3, 1–10. [Google Scholar]
- Tadesse, T.; Tesfaye, B.; Abera, G. Coffee production constraints and opportunities at major growing districts of southern Ethiopia. Cogent Food Agric. 2020, 6, 1741982. [Google Scholar] [CrossRef]
- Chemura, A. The growth response of coffee (Coffea arabica L.) plants to organic manure, inorganic fertilizers and integrated soil fertility management under different irrigation water supply levels. Int. J. Recycl. Org. Waste Agric. 2014, 3, 59. [Google Scholar] [CrossRef]
- Tully, K.; Lawrence, D.; Wood, S. Organically managed coffee agroforests have larger soil phosphorus but smaller soil nitrogen pools than conventionally managed agroforests. Biogeochemistry 2013, 115, 385–397. [Google Scholar] [CrossRef][Green Version]
- Kouadio, L.; Tixier, P.; Mittahalli Byrareddy, V.; Marcussen, T.; Mushtaq, S.; Rapidel, B.; Stone, R. Performance of a process-based model for predicting robusta coffee yield at the regional scale in Vietnam. Ecol. Model. 2021, 443, 109469. [Google Scholar] [CrossRef]
- Kath, J.; Mittahalli Byrareddy, V.; Mushtaq, S.; Craparo, A.; Porcel, M. Temperature and rainfall impacts on robusta coffee bean characteristics. Clim. Risk Manag. 2021, 32, 100281. [Google Scholar] [CrossRef]
- Kouadio, L.; Deo, R.C.; Byrareddy, V.; Adamowski, J.F.; Mushtaq, S.; Nguyen, V.P. Artificial intelligence approach for the prediction of Robusta coffee yield using soil fertility properties. Comput. Electron. Agric. 2018, 155, 324–338. [Google Scholar] [CrossRef]
- Wang, N.; Jassogne, L.; van Asten, P.J.A.; Mukasa, D.; Wanyama, I.; Kagezi, G.; Giller, K.E. Evaluating coffee yield gaps and important biotic, abiotic, and management factors limiting coffee production in Uganda. Eur. J. Agron. 2015, 63, 1–11. [Google Scholar] [CrossRef]
- Piato, K.; Subía, C.; Pico, J.; Calderón, D.; Norgrove, L.; Lefort, F. Organic farming practices and shade trees reduce pest infestations in robusta coffee systems in Amazonia. Life 2021, 11, 413. [Google Scholar] [CrossRef] [PubMed]
- Salamanca-Jimenez, A.; Doane, T.A.; Horwath, W.R. Nitrogen use efficiency of coffee at the vegetative stage as influenced by fertilizer application method. Front. Plant Sci. 2017, 8, 223. [Google Scholar] [CrossRef] [PubMed]
- Mekonnen, M. Effect of tree shade on coffee crop production. J. Sustain. Dev. 2015, 8, 66. [Google Scholar] [CrossRef]
- Waktola, T.U.; Fekadu, K. Adoption of coffee shade agroforestry technology and shade tree management in Gobu Seyo district, East Wollega, Oromia. Adv. Agric. 2021, 2021, 13. [Google Scholar]
- DaMatta, F.M.; Ronchi, C.P.; Maestri, M.; Barros, R.S. Ecophysiology of coffee growth and production. Braz. J. Plant Physiol. 2007, 19, 485–510. [Google Scholar] [CrossRef]
- Nigussie, A.; Taye, E.; Bukero, G. Survey on potentials and constraints of shade tree species for arabica coffee production in south ethiopia. Int. J. Recent Res. Life Sci. 2014, 1, 1–11. [Google Scholar]
- Piato, K.; Lefort, F.; Subía, C.; Caicedo, C.; Calderón, D.; Pico, J.; Norgrove, L. Effects of shade trees on robusta coffee growth, yield and quality. A meta-analysis. Agron. Sustain. Dev. 2020, 40, 38. [Google Scholar] [CrossRef]
- Long, V.; Ngoc, N.; Dung, N.; Kristiansen, P.; Yunusa, I.; Fyfe, C. The effects of shade tree types on light variation and robusta coffee production in Vietnam. Engineering 2015, 7, 742–753. [Google Scholar] [CrossRef]
- Debela, A.; Struik, P. Effects of shade on growth, production and quality of coffee (Coffea arabica) in Ethiopia. J. Hortic. For. 2011, 3, 336–341. [Google Scholar]
- Nzeyimana, I.; Hartemink, A.E.; Ritsema, C.; Mbonigaba, J.J.M.; Geissen, V. Mulching effects on soil nutrient levels and yield in coffee farming systems in Rwanda. Soil Use Manag. 2020, 36, 58–70. [Google Scholar] [CrossRef]
- Cyamweshi, R.A.; Nabahungu, N.L.; Mukashema, A.; Ruganzu, V.; Gatarayiha, M.C.; Nduwumuremyi, A.; Mbonigaba, J.J. Enhancing nutrient availability and coffee yield on acid soils of the central plateau of Southern Rwanda. Glob. J. Agric. Res. 2014, 2, 44–55. [Google Scholar]
- Zhao, Q.; Xiong, W.; Xing, Y.; Sun, Y.; Lin, X.; Dong, Y. Long-term coffee monoculture alters soil chemical properties and microbial communities. Sci. Rep. 2018, 8, 6116. [Google Scholar] [CrossRef]
- Tiemann, T.; Aye, M.; Dung, N.; Minh, T.; Fisher, M.; Paulo, E.; Oberthur, T. Crop nutrition for Vietnamese robusta coffee. Better Crops Plant Food 2018, 102, 20–23. [Google Scholar] [CrossRef]
- Byrareddy, V.; Kouadio, L.; Mushtaq, S.; Kath, J.; Stone, R. Coping with drought: Lessons learned from robusta coffee growers in Vietnam. Clim. Serv. 2021, 22, 100229. [Google Scholar] [CrossRef]
- Climate-Data. Climate Kontum (Vietnam). Available online: https://en.climate-data.org/asia/vietnam/kon-tum-province/kon-tum-4238/ (accessed on 15 October 2021).
- WRB. World Reference Base for Soil Resources 2014, Update 2015 International Soil Classification System for Naming Soils and Creating Legends for Soil Maps; World Soil Resources Reports No. 106; FAO: Rome, Italy, 2015. [Google Scholar]
- Salamanca-Jimenez, A. Coffee crop fertilization in Colombia: A mini-review. Electron. Int. Fertil. Corresp. 2017, 50, 22–30. [Google Scholar]
- Ramos, P.; Pimentel, A.; Almonte, I.; Sotomayor, D.; Martínez, N.; Pérez, A.; Cespedes, C. Soil fertility evaluation of coffee (coffea spp.) production systems and management recommendations for the Barahona Province, Dominican Republic. J. Soil Sci. Plant Nutr. 2010, 11, 127–140. [Google Scholar] [CrossRef]
- Mohammed, K.; Taye, K.; Bayu, D. Assessment of soil chemical properties and coffee leaf analysis in Goma Woreda of Oromia region. Agric. For. Fish. 2021, 10, 93–101. [Google Scholar] [CrossRef]
- Bittelli, M.; Campbell, G.S.; Flury, M. Characterization of particle-size distribution in soils with a fragmentation model. Soil Sci. Soc. Am. J. 1999, 63, 782–788. [Google Scholar] [CrossRef]
- Miller, B.A.; Schaetzl, R.J. Precision of soil particle size analysis using laser diffractometry. Soil Sci. Soc. Am. J. 2012, 76, 1719–1727. [Google Scholar] [CrossRef]
- Covre, A.M.; Partelli, F.L.; Bonomo, R.; Gontijo, I. Micronutrients in the fruits and leaves of irrigated and non-irrigated coffee plants. J. Plant Nutr. 2018, 41, 1119–1129. [Google Scholar] [CrossRef]
- Singh, A.; Jat, R.S.; Chaudhari, V.; Bariya, H.; Sharma, S. Toxicities and tolerance of mineral elements boron, cobalt, molybdenum and nickel in crop plants. Plant Stress 2010, 4, 31–56. [Google Scholar]
- Carter, M.R.; Gregorich, E.G. Soil Sampling and Methods of Analysis, 2nd ed.; CRC Press, Taylor & Francis Group: Boca Raton, FL, USA, 2008. [Google Scholar]
- Phares, C.A.; Atiah, K.; Frimpong, K.A.; Danquah, A.; Asare, A.T.; Aggor-Woananu, S. Application of biochar and inorganic phosphorus fertilizer influenced rhizosphere soil characteristics, nodule formation and phytoconstituents of cowpea grown on tropical soil. Heliyon 2020, 6, e05255. [Google Scholar] [CrossRef] [PubMed]
- Murphy, J.; Riley, J.P. A modified single solution method for the determination of phosphate in natural waters. Anal. Chim. Acta 1962, 27, 31–36. [Google Scholar] [CrossRef]
- Novak, J.; Johnson, M.; Spokas, K. Concentration and release of phosphorus and potassium from lignocellulosic- and manure-based biochars for fertilizer reuse. Front. Sustain. Food Syst. 2018, 2, 54. [Google Scholar] [CrossRef]
- TCVN 8660: 2011. Soil Quality—Method for Determination of Total Potasium. 2011. Available online: https://vanbanphapluat.co/tcvn-8660-2011-chat-luong-dat-phuong-phap-xac-dinh-kali-tong-so (accessed on 20 May 2022).
- TCVN 8662: 2011. Soil Quality—Method for Determination of Bio-Available Potassium. 2011. Available online: https://vanbanphapluat.co/tcvn-8662-2011-chat-luong-dat-phuong-phap-xac-dinh-kali-de-tieu (accessed on 20 May 2022).
- Nguyen, B.T.; Lehmann, J. Black carbon decomposition under varying water regimes. Org. Geochem. 2009, 40, 846–853. [Google Scholar] [CrossRef]
- EPA Method 7000B. Method 7000b: Flame Atomic Absorption Spectrophotometry. 2007. Available online: https://www.epa.gov/sites/default/files/2015-12/documents/7000b.pdf (accessed on 27 March 2022).
- Akhtar, M.S.; Memon, M. Biomass and nutrient uptake by rice and wheat: A three-way interaction of potassium, ammonium and soil type. Pak. J. Bot. 2009, 41, 2965–2974. [Google Scholar]
- Putri, M.; Lou, C.-H.; Syai’in, M.; Ou, S.-H.; Wang, Y.-C. Long-term river water quality trends and pollution source apportionment in Taiwan. Water 2018, 10, 1394. [Google Scholar] [CrossRef]
- Anhar, A.; Abubakar, Y.; Widayat, H.P.; Muslih, A.M.; Romano; Baihaqi, A. Altitude, shading, and management intensity effect on Arabica coffee yields in Aceh, Indonesia. Open Agric. 2021, 6, 254–262. [Google Scholar] [CrossRef]
- Moghimi, A.; Jol, H.; Shamshuddin, J.; Samsuri, A.W.; Abtahi, A. Physicochemical properties and surface charge characteristics of arid soils in southeastern Iran. Appl. Environ. Soil Sci. 2013, 2013, 252861. [Google Scholar] [CrossRef]
- Tahir, S.; Marschner, P. Clay addition to sandy soil reduces nutrient leaching—Effect of clay concentration and ped Size. Commun. Soil Sci. Plant Anal. 2017, 48, 1813–1821. [Google Scholar] [CrossRef]
- Qaswar, M.; Dongchu, L.; Jing, H.; Tianfu, H.; Ahmed, W.; Abbas, M.; Lu, Z.; Jiangxue, D.; Khan, Z.H.; Ullah, S.; et al. Interaction of liming and long-term fertilization increased crop yield and phosphorus use efficiency (PUE) through mediating exchangeable cations in acidic soil under wheat–maize cropping system. Sci. Rep. 2020, 10, 19828. [Google Scholar] [CrossRef] [PubMed]
- Van De, N.; Douglas, I.; Mcmorrow, J.; Lindley, S.; Thuy Binh, D.K.N.; Van, T.T.; Thanh, L.H.; Tho, N. Erosion and nutrient loss on sloping land under intense cultivation in southern Vietnam. Geogr. Res. 2008, 46, 4–16. [Google Scholar] [CrossRef]
- Ding, H.; Zheng, X.; Zhang, Y.; Zhang, J.; Chen, D. Gaseous losses of fertilizer nitrogen from a citrus orchard in the red soil hilly region of Southeast China. Soil Sci. Plant Nutr. 2017, 63, 419–425. [Google Scholar] [CrossRef]
- Tully, K.; Lawrence; Scanlon, T. More trees less loss: Nitrogen leaching losses decrease with increasing biomass in coffee agroforests. Agric. Ecosyst. Environ. 2012, 161, 137–144. [Google Scholar] [CrossRef]
- Sauvadet, M.; den Meersche, K.V.; Allinne, C.; Gay, F.; de Melo Virginio Filho, E.; Chauvat, M.; Becquer, T.; Tixier, P.; Harmand, J.-M. Shade trees have higher impact on soil nutrient availability and food web in organic than conventional coffee agroforestry. Sci. Total Environ. 2019, 649, 1065–1074. [Google Scholar] [CrossRef]
- Villarreyna, R.; Avelino, J.; Cerda, R. Ecosystem-based adaptation: Effect of shade trees on ecosystem services in coffee plantations. Agron. Mesoam. 2020, 31, 499–516. [Google Scholar] [CrossRef]
- Deng, L.; Shangguan, Z.-P.; Sweeney, S. Changes in soil carbon and nitrogen following land abandonment of farmland on the loess plateau, China. PLoS ONE 2013, 8, e71923. [Google Scholar] [CrossRef]
- Bahar, I. Distribution of earthworms at different habitats in Tangail, Bangladesh and significantly impacts on soil pH, organic carbonand nitrogen. Am. J. Life Sci. 2015, 3, 238. [Google Scholar] [CrossRef]
- Silva, É.; Silva, S.; Oliveira, G.; Carducci, C. Root spatial distribution in coffee plants of different ages under conservation management system. Afr. J. Agric. Res. 2016, 11, 4970–4978. [Google Scholar] [CrossRef]


Disclaimer/Publisher’s Note: The statements, opinions and data contained in all publications are solely those of the individual author(s) and contributor(s) and not of MDPI and/or the editor(s). MDPI and/or the editor(s) disclaim responsibility for any injury to people or property resulting from any ideas, methods, instructions or products referred to in the content. |
© 2022 by the authors. Licensee MDPI, Basel, Switzerland. This article is an open access article distributed under the terms and conditions of the Creative Commons Attribution (CC BY) license (https://creativecommons.org/licenses/by/4.0/).