Article

Impact of Store Design and Atmosphere on Shoppers’ Purchase Decisions: An Empirical Study with Special Reference to Delhi-NCR

1
Department of Accountancy, College of Administrative and Financial Sciences, Saudi Electronic University, Riyadh 11673, Saudi Arabia
2
Department of Commerce and Business Studies, Jamia Millia Islamia, New Delhi 110025, India
3
Centre for Distance and Online Education, Jamia Millia Islamia, New Delhi 110025, India
4
Department of Business Administration, College of Administrative and Financial Science, Saudi Electronic University, Riyadh 11673, Saudi Arabia
*
Authors to whom correspondence should be addressed.
Sustainability 2023, 15(1), 95; https://doi.org/10.3390/su15010095
Submission received: 27 September 2022 / Revised: 3 December 2022 / Accepted: 14 December 2022 / Published: 21 December 2022
(This article belongs to the Special Issue Sustainable Retailing and Marketing)

Abstract

:
The main objective of this research is to identify the impact of store design and ambience on consumer purchase decisions in retail chain outlets in Delhi-NCR, India. The foremost purpose of this research was to examine if the design and ambience of retail stores have any effect on the decisions of customers’ purchases. The study was descriptive in nature. For this research, a sample of 100 consumers was drawn who generally visit retail stores for shopping. A systematic questionnaire was prepared to collect the data and to analyze it; SEM, reliability, Convergent, Discriminate Validity and model fitness were achieved through SmartPLS3. The current study’s findings indicate that variables, such as window and mannequin display, visual merchandising, and store design and atmosphere have an effective impact on shoppers’ purchase decisions, whereas lighting and color, music, and signage have negligible effects. The findings of this study will provide managerial involvement to the industry in order to emphasize purchase ambition in order to improve profitability and sustainability. More examination of the factors that contribute to purchase aspiration and in other geological areas is advised for future scrutiny. This study presents a validated instrument for measuring the association between design atmosphere and consumer purchasing behavior and serves as a tool for evaluating the influence of various design atmospheric indicators. It is important to keep a steady staff of well-trained, polite salespeople on hand at all times. Customers are more likely to come back and eventually recommend the store to others if their needs are met by customer-focused salespeople who provide excellent service. This helps the merchant to compete in the market.

1. Introduction

Background of the study: There is tough competition in the retail industry. Quick responses and the ability to understand shoppers’ behaviors are the factors by which the success of this kind of business is impacted [1]). The emphasis must be on the preferences of customers and factors impacting shoppers’ purchase decisions in the retail business. Store design features, such as store interior and exterior, and ambience features, such as color, sales personnel, music, and lighting, are some important attributes by which customers make decisions about store selection and sponsorship. Research done on the retail environment in the past has suggested that these factors influence the impression of the store [2]. Now, retailers perceive the significance of these factors and extensively endeavor to change the atmosphere, including with appropriate colors, window displays, music, visual merchandising, and many more things that will draw the attention of buyers [3]. Furthermore, the variety of products and services available in retail stores makes it difficult to make a purchase decision. Defining and illustrating the concepts of the study: Atmospherics simply means the physical attributes related to the outlets. These attributes comprise interior and exterior components, as well as layout planning and display [4]. Visual merchandising Atmospherics, also known as display, is important to attract customers to the outlets, build brand positioning for the store, upgrade the standard of the service experience, and raise the consumer-retention ratio [5]. Retail space management is another important concept [6]. Effective space management strives to ensure maximum utilization of space while also being suitable for customers and employees. Research gap analysis: Several researchers have identified the effect of atmosphere on the behavior of consumers in the store [7], but empirical research on the impact of store atmosphere on the behavior of consumers is limited [8]. Previous research limited the scope of consumer studies [9]. Many studies were conducted, but they focused on one atmospheric variable at a time and left others. In reality, several atmospheric cues collectively affect consumer behavior [10].
Purpose of the study: Store design and ambience management are crucial factors for any kind of retail business [11]. Their significance emerges from the link between shopping behavior and physical environmental factors [12]. There are some physical environmental factors, such as layout, lighting, window display, internal fittings, and so on that affect the shopping time and the evaluation of sale and purchase [13]. Thus, it is important for retailers to plan and organize all the aspects associated with the ambience, space, and atmosphere of retail effectively in order to generate more profit by using scarce resources [14]. The Introduction section first describes the background of the study and then provides a definition and introduction regarding the effects of store design and atmosphere on shoppers’ purchase decisions. After that, the focus is on gap analysis and, lastly, the purpose of the study [15].

2. The Concept and Purpose of Store Design

Consumers’ expectations from retail outlets have shifted. The consumer is the king of the market in this era, and he is also clear and discerning about his needs, as well as aware of the products that meet those needs and where he will buy them [16]. Nowadays, a customer does not go to the stores just to purchase a product, as the shopping is now an acute personal task that is all about the experience [12]. This is especially pertinent and noticeable where the fashion brands and luxurious segments are being operated by the retailers. For example, international retailer Prada focuses on creating beautiful places that enable it to show off the brand [13].
Let us take the example of two coffee retail chains operating in the country: Barista and Cafe Coffee Day. Both primarily sell the same product; however, the type of consumer visiting each store is different. Batista focuses heavily on the experience that is created in the store, and, as a consequence, will have a different clientele that would be comfortable in the store. Cafe Coffee Day, on the other hand, caters to young people [17]. The entire store experience here is different; consequently, the consumer set is different [18]. Thus, while the product remains the same, it is retailed differently to different target audiences and with a different consumer experience.
The term “design” is defined as a scheme or plan used to indicate the end result, specifically the outlook of a design process, and it also applies to physical products and systems, services, and other non-tangible dimensions [19]. The word “design” is also used to describe the visible aspects or physical positioning of articles, including colors, shapes, layouts, textures, and patterns, and is similarly allied to the sensory aspects of the physical world [20]. Further, design has been explained as an important creative solution to a perceived issue, through which the designing process has been shown as an experiment to furnish a solution to any issue, problem, or need by the formation of something unique or the innovative conversion of an already existing thing [21].
Retail marketing theories have not been formulated for some important observations, such as management, application, and integration of design inside retailing because they have been mainly restricted to the attention of retail designers inscribed to other designers [22]. Retail store design influences customer perceptions of any brand or retailer, as well as the quality of the goods, on both conscious and subconscious levels.
Thus, the concept of “retail store design” covers all the dimensions of store design, from the store frontage, fascia, and signage to the internal features, such as furniture, merchandising, display, lighting, decoration, graphics, and point of sale [23]. Adding these elements does not merely assist in the artistic outlook of space; it also plays a significant role in functionality and from a commercial point of view, it can improve budgets and help in the regulations governing the utilization of a public space [17]. The concept of retail design was introduced in the sixties and seventies, but then it was mainly based on art and not much related to functionality [19]. Now, it has evolved into an innovative science whose aim is to facilitate economies of scale and to enable a retailer to generate multiples of the same experience worldwide.
The two main objectives of store design are:
  • To sustain the market position of the retailer in preserving its consumer image by focusing on the needs and urges of the customer;
  • To assist in the operational needs of the company by maintaining low cost and keeping an adequate amount of stock to supply to consumers;
To build and maintain its customer image, store design needs to:
  • Consider the inclination of customers, such as: a. A sense of status to confirm expectations of quality or fashion; b. A sense of entertainment or theatre in hedonistic shopping situations, particularly for clothing and restaurants.
  • Acknowledge and resolve customers’ need to access the store, such as: a. Special facilities for differently abled persons. b. Sufficient parking space for major grocery shopping.
  • Assisting consumers to easily access merchandise wherever possible for instance: a. Proper labelling for the elderly. b. Fitting rooms in clothing stores.
  • Provide a sense of comfort and belonging to the customers through: a. Rest rooms and refreshment facilities in big stores. b. Store image with local attributes and the surrounding area.
  • Respect consumers’ sense of ethic, such as making charity and fair-trade shops appear efficient but not plush.
To maintain low cost and keep abundant stock, store design has to:
  • Keep the structure consistent with the retailer’s general policy and market position.
  • Relate store layout and display to the image of the store and the merchandise offered.
  • Have the flexibility to adjust to changes in sales patterns and display methods.
  • Support the sales methods used (such as self-service) and the services provided.
  • Use on-site storage and administration facilities efficiently.
  • Be consistent with safety and security requirements [21].

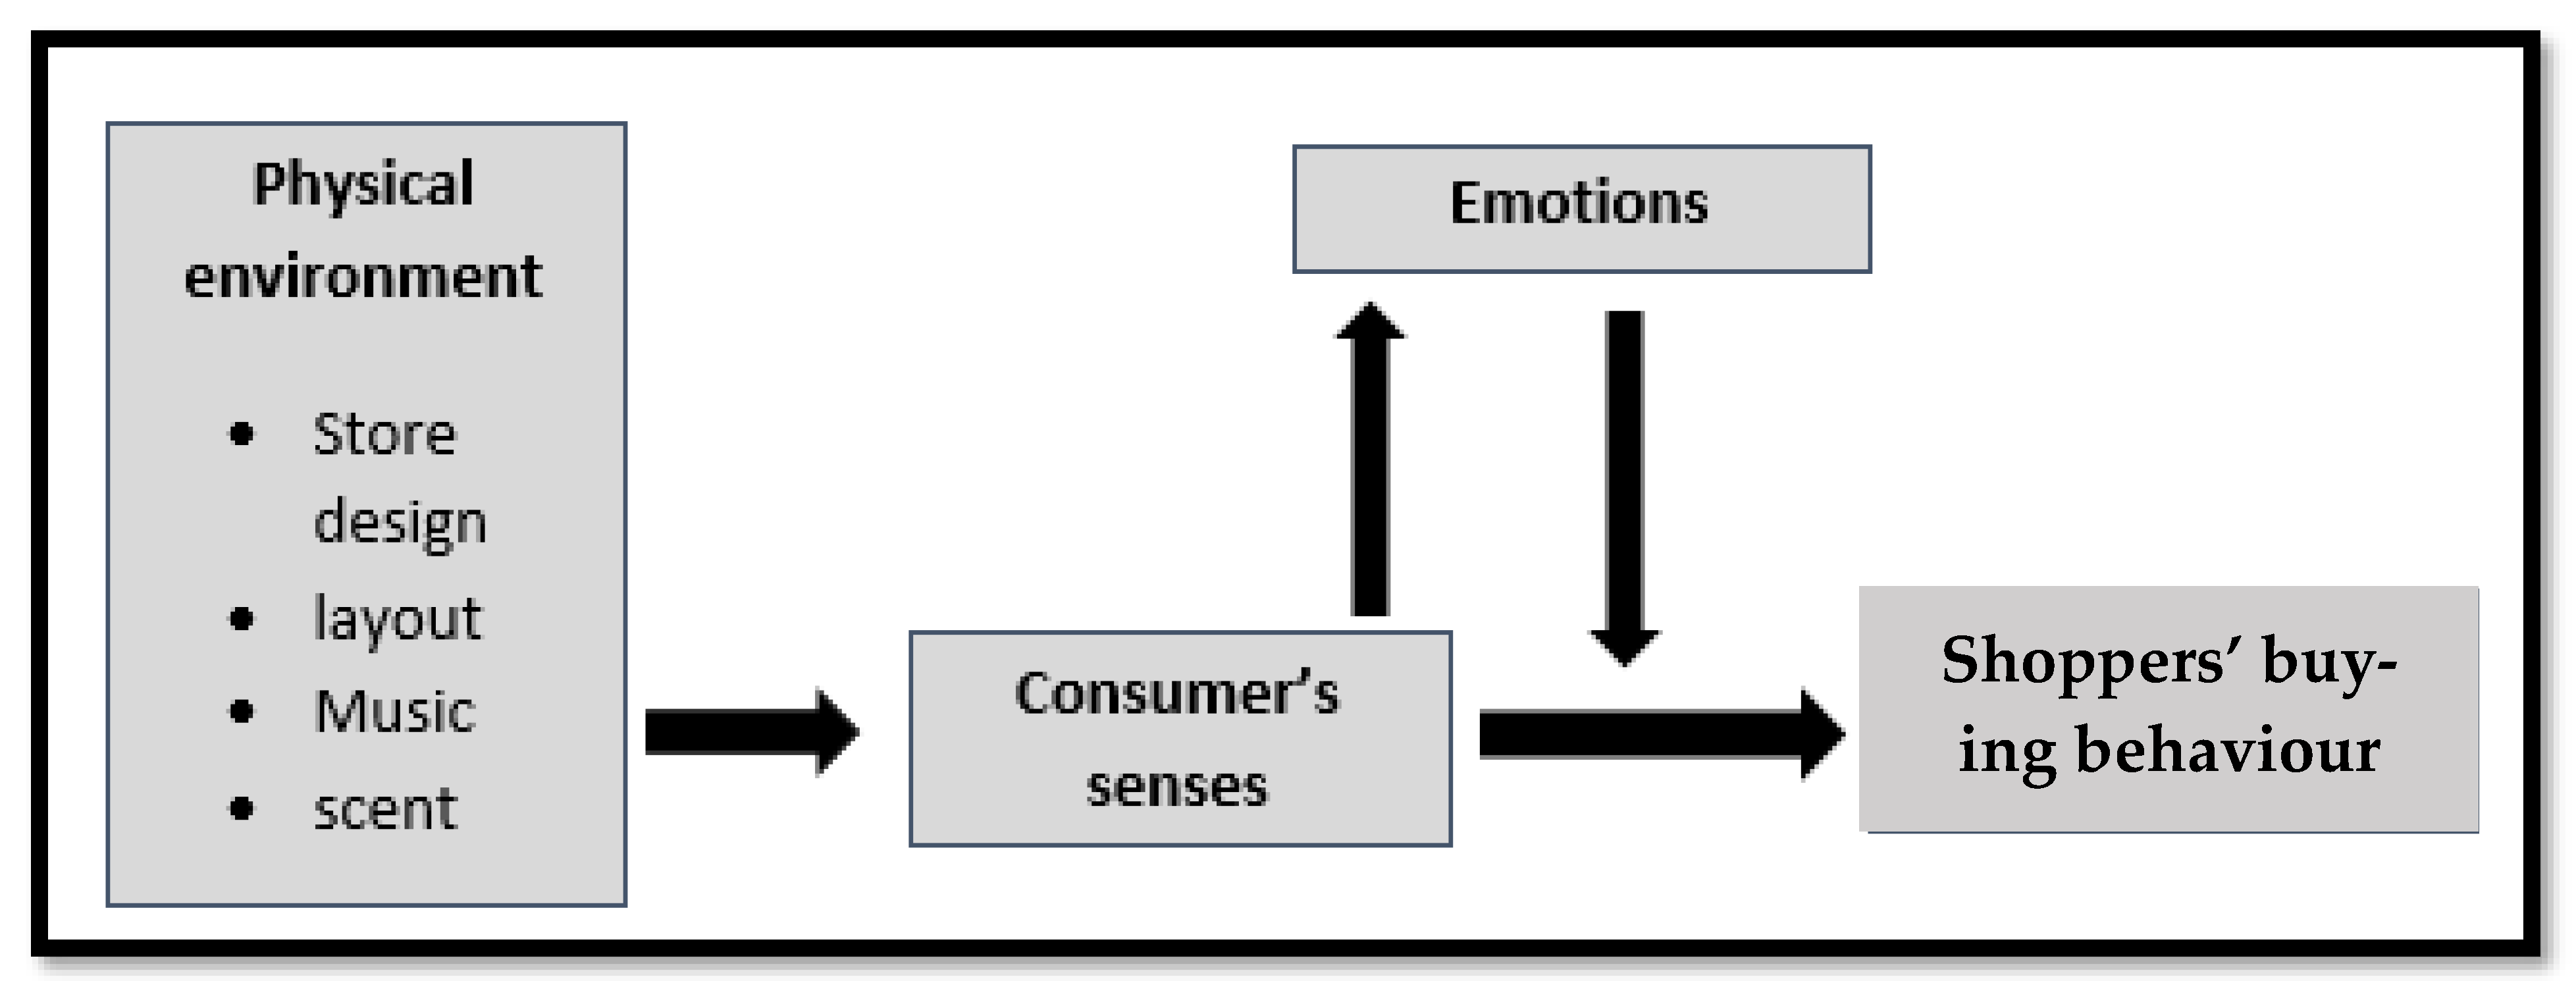
3. Effects of Retail Store Environment

It claims that a person’s emotional state is affected by the way that person interprets their surroundings. These feelings have underlying aspects that can be measured. In 1974, Mehrabian and Russell proposed the bipolar dimensions of pleasure, arousal, and dominance (abbreviated PAD), wherein (1) pleasure refers to how much one enjoys one’s current location, (2) arousal refers to how much one is stimulated by one’s current environment, and (3) dominance refers to how much one feels they can exert control over one’s current environment and situation.
The three main effects of retail store environment stimuli are pleasure, muss, and dominance in the minds of the customers.

3.1. Pleasure/Displeasure

Pleasure: Pleasure is defined as the degree to which a person feels good, joyful, happy, or pleased in a given situation. [23] revealed that the pleasure and arousal dimensions are effective predictors of customer behavior in retail service environments, but evidence for the dominance dimension is less strong [24].
This type of effect can be understood as the “effective reaction” of customers in the environment of service [23]. This determines if the environment is or is not enjoyable for customers, for instance: playing classical music in Hindi can improve shoppers’ particular type of service settings in North India, while similar music can have a negative effect on the shopping experience in retail stores in Tamil Nadu.

3.2. Arousal

It is useful to determine how much the ambiance prompts the customers. Playing slow instrumental music in service settings may reduce customers’ activity levels in restaurants as compared to no music or fast music [25]. Thus, the type of music played in a specific retail environment can either reduce or increase arousal.
As revealed in several empirical studies based on insights from environmental psychology, visual merchandising and the interior design of stores should inspire an optimum level of arousal in customers. However, an accurate verbal assessment of arousal is challenging.

3.3. Dominance

They designed this exhibit so that all of the products shown can be worn together. The customer can see how the things can be worn and will be inspired to purchase them. Something is seen as dominant if it has higher prominence within a setting or composition [26]. Emphasis, on the other hand, is described as the intensity of something or the stress placed on something to give it significance or importance. The dominant element will attract attention and stand out from the other elements of a composition. It can establish the focal point within a display or window that compels the viewer to return repeatedly.
The third aspect is related to the feelings of the consumer, whether they are in control or compliant in the service environment. This feeling can be associated with environmental elements, such as the height of the ceiling, which can make one feel in control). The dominant color in the outlet can also be a reason for the consumer’s reaction. People link the color red with confident and wayward moods, while they relate the blue color with calmness, composure, and a repression of feelings [27]. Thus, the kind of mood that needs to be personified can be the result of the correct choice of color. This type of decision is mainly significant in apparel and furniture retail outlets, as the choice of these things depends heavily on the lifestyle of the consumers.
The environment can be set up to motivate or demotivate certain behaviors. For instance, bright colors may stimulate shoppers to enter a fast-food restaurant, while uncomfortable seating may discourage extended stays. The physical environment of a retail store has a considerable impact on the shopping behavior of consumers, as shown in Figure 1.

4. Review of Literature Hypothesis’s Development

This section presents the outline of the present literature in the form of the research problems. All of the literature is being discussed which is focused on the particular nature of the pertinent literatures that are linked to this study.

4.1. Window Display

Window display plays an important role by creating a first impression of the outlets on consumers. It stimulates consumers to the outlets [28]. Similarly, a store front also assists the consumers to determine whether to go into the store or not. Therefore, the composition of the commodities in the store front must be attractive in such a way that it could encourage consumers to go in [29]. Another significant feature of visual merchandising is signage, which assists consumers to buy the commodity all by himself.
H1. 
Window displays have an effective impression on store design and atmosphere.
H2. 
Window displays have a positive effect on shoppers’ purchase decisions.

4.2. Music

Music can be described as a pleasurable sound that consciously and unconsciously affects the consumers’ decisions. In the retail outlets where music is being played, the consumer’s buying decisions are remarkably affected [30]. Music styles and tempos can affect sales positively in retail stores. Pleasant music promotes longer consumption. The consumer preferences and point of views are affected by the kinds of music played in the background. According to the study, consumers pass shorter time periods in those stores where the music is loud [31]. Effect of loudness on musical inclination depends on gender; females react to louder music more adversely in comparison to males [32]. Although music mostly impacts positively, fast tempo music intervenes the impact of the consumer’s perception in a mall. Music also effectively impacts even the consumers’ total time and money spent by providing magnificent environmental conditions.
H3. 
Music positively affects Store design and atmosphere.
H4. 
Music positively impacts shopper’s purchase decisions.

4.3. Mannequin Display

Retail outlets should display their products in the manner that could draw consumers’ attention. A mannequin display in retail stores is used for the same purpose, consequently consumers do impulse purchases [33]. Overall, 25% of sales of retail outlets depends on the “Design and display” of products. Display can be described as collections of shelf space, products and allotment of floor space, departmental allotment, and wall decorations. Layout can be understood as sections of selling area, space utilized and classification of commodities. Consumer’s view points towards the products and buying intension are remarkably influenced by the product display. Entry of consumers to the stores is impacted by the products’ displayed in the outlets.
H5. 
Mannequin displays have a positive effect on Store design and atmosphere.
H6. 
Mannequin displays soundly influence shoppers’ buying decisions.

4.4. Lighting and Color

Lighting can be explained in many ways. It can be understood as an activity to embellish or to magnify the light settings to build special impact; an effect takes place by the light arrangements and the manner by which light falls upon objects, products or faces in different situations [34]. According to Taylor, lighting is an essential design feature to enhance the visual quality, comfort, and identity of a retail outlet. Reports from [35] show that a bigger donor to an alluring store ambience is the use of lighting. In various specialty outlets, to evince the store’s image, to enhance the store’s merchandise and to improve business selling strategy, lighting design is used.
Natural lighting from the window glass also has significant impact, besides lighting in a store. Many automotive retailers prefer to have more glass window arrangements for natural lighting in their stores. Consumers prefer naturalness as much as possible, and it can be demonstrated in important features, such as quality [36]. Customer’s feelings, behaviors and attitudes can be affected by color. It can arouse thoughts, experiences, and memories. For example; “red retail environments tend to be generally unpleasant, negative, tense, and less attractive than green and blue” [37]. Color plays a crucial role in a consumer’s perception towards the merchandise [38]. Consumers’ attention can be drawn by choosing a better color for the retail chain store that can further positively build the perception of the consumer towards the merchandise.
H7. 
Lighting and color has a positive impact on Store design and atmosphere.
H8. 
Lighting and color has a positive impact on shoppers’ purchase decisions.

4.5. Visual Merchandising

Visual merchandising is more significant in the retail sector [39]. It acts to enhance the products presentation, grow store traffic, merchandise, and brand support, and it adds visual excitement, through strategic arrangements and embellishment of the principal destinations in a store’s ambience, which are the main parts of it [32].
According to [40], visual merchandising can be described as the presentation of an outlet to sell the services and products provided by the stores; it assists the consumers through the store’s advertising, display, decor and furnishing, merchandise arrangement, special events, showroom coordination, and merchandising sections [41]. Visual merchandising has been become more popular in providing a store with a competitive lead, as numerous stores share merchandise sources and thus have the same objects. Furthermore, good visual merchandising provides the seller with a crucial competitive edge and defines a store’s worth in today’s market [42].
H9. 
Visual merchandising has a positive impact on store design and atmosphere.
H10. 
Visual merchandising has a positive effect on shoppers’ buying decisions.

4.6. Signage

Signage can be described as any type of “graphic display” to impart information to the public. Mainly, signage is inclined to some general objectives, such as promotion, giving information, identification, providing directions or to lifting safety acknowledgement.
H11. 
Signage has a positive impact on store design and atmosphere.
H12. 
Signage has a positive effect on shoppers’ buying decisions.

4.7. Store Design and Atmosphere

Retail store design is a properly planned strategy to set up an outlet in a specific way, to use space properly, to develop an attracting ambience and to increase sales [37]. Ambience consists of the store exterior and layout, the common interior and the interior displays [19]. Physical store attributes intend an image and attracts consumers to the retail store. Effects of crowding can be decreased by developing an ancillary ambience in store. A captivating store design will draw the attention of many consumers to the store.
H13. 
Store design and atmosphere have a positive effect on shoppers’ buying decisions.
H14. 
Store design and atmosphere mediates the association between window displays and shoppers’ purchase decisions.
H15. 
Store design and atmosphere mediates the association between music and shoppers’ purchase decisions.
H16. 
Store design and atmosphere mediates the association between mannequin displays and shoppers’ purchase decisions.
H17. 
Store design and atmosphere mediates the association between lighting and color and shoppers’ purchase decisions.
H18. 
Store design and atmosphere mediates the association between visual merchandising and shoppers’ purchase decisions.
H19. 
Store design and atmosphere mediates the association between signage and shoppers’ purchase decisions.

5. Methodology of the Study

The methodology adopted by the researchers consists of various sections which are as follows:

5.1. Research Method and Design

The researchers used quantitative research methods for data collection since it helped in inducing data that can be transformed into usable statistics and the quantitative data collection technique is more structured than qualitative data collection. Previous studies describe the research design as a blueprint, or outline, for conducting the study in such a way that maximum control will be exercised over factors that could interfere with the validity of the research results. The present study was a descriptive-cum-cross sectional, under which SEM was used. This type of research is suitable because the researcher has to obtain information regarding the current status of the Impact of Retail Store Design and Atmosphere on Shopper’s Purchase Decisions. This research is done to collect detailed factual information without changing the environment where study is to be conducted. Structure Equation Modelling (SEM), Reliability, Convergent, Discriminate Validity and model fitness are achieved with establishing relationships between two or more variables in the same population or between the same variables in two populations.

5.2. Sampling Design and Sources of Data Collection

The participants of the survey were the consumers who usually prefer shopping at retail stores. The primary data for the study were collected through the administration of a structured questionnaire. For the purpose of data collection, convenience sampling technique was used in the present study. In all, 120 questionnaires were distributed to the consumers of the retail stores located in Delhi-NCR. Of the 120 questionnaires distributed, 100 filled in questionnaire were retrieved and the other 20 questionnaires were either partly filled or incomplete. During the data-collection process, the researchers observed a variation in the behavior of consumers. There were a few consumers who appeared to be more lenient and uninterested in filling in the questionnaires.

5.3. Data Analysis

At this juncture of research, the data that has already been collected, was processed and examined. The processing stage included the coding, editing, classification and tabulation of collected data that was ready to be examined. The research first formed rapport with the respondents and briefed them about the research and the purpose of the questionnaire. Participation in this study was on a voluntary basis and the respondents were assured about confidentiality and anonymity with regard to their responses. After assuring the participants they were asked to volunteer a portion of their time. Once all the data had been collected, it was scored and compiled for further analyses. Each scale was scored separately using the 5-point Likert scale. The total score on the scale was obtained by adding the scores on all items. Structure Equation Modelling (SEM), Reliability, Convergent, Discriminate Validity and model fitness were achieved through SmartPLS3.

6. Results and Discussion

This section comprises the empirical analysis of the survey data collected through the questionnaire. The empirical analysis deals with the analysis and interpretation of the feedback of the sample respondents. The findings from the analysis of qualitative collected sample dataset gathered from the present study are depicted below.

6.1. Profile of the Sample Respondents

The demographic data collected from the respondents through questionnaire has been processed by editing, coding, classification, and tabulation. The data was analyzed using SPSS and SmartPLS3. It was further interpreted and the findings were drawn from the analysis.
Table 1 reveals that female respondents were dominant at (55%) compared to male respondents (45%). The above table also represents the classification of the sample in terms of their age groups. It is observed from the Table that a majority of the respondents belong to the age group 31–50 years followed by respondents belonging to the age group of 30 years (40%), with the rest (11%) of the respondents in the age bracket of above 50 years. The data of classification of the sample respondents on their marital status reveals that 66% of respondents were married, while the remaining 34% were unmarried.
Furthermore, Table 1 represents the classification of the sample on the basis of their level of education. The data collected shows that most of the respondents are graduates, i.e., 54%, whereas the lowest was 10th/high school drop outs (1%). However, post-graduates and above were found to be 28%, while the remaining 17% of respondents belonged to the intermediate class.
The data collected from the respondents about their occupational status depicts that sample respondents who were working in the private sector dominated the research with 56% while respondents from the public sector were 24%. On the other hand, professional respondents constituted 5% of the total sample, 13% were students and the least among the sample respondents, i.e., 2% were self-employed. The collected sample dataset also shows that most of the respondents with income in a range between Rs. 30,001–50,000 was 47%, before long the respondents had a monthly income of up to Rs. 30,000, whereas 15% of respondents belonged to the monthly income bracket of Rs. 50,001–70,000, and the remaining 10% had a monthly income of above Rs. 70,000.

6.2. Analysis and Interpretation of the Collected Sample Dataset

The data collected from the sample respondents was processed by editing, coding, classification, and tabulation. The data was analyzed using Microsoft Excel and SPSS. It was further interpreted and the findings drawn from the analysis have been presented in the following paragraphs.

6.3. How Often Do You Go Shopping?

When it comes to frequency of visits that respondents take for shopping, the majority (42%) opined that they went shopping occasionally, while 38% go monthly. Only 2% visit shops daily, while the remaining 18% go shopping on a weekly basis (Table 2).

6.4. Do You Think Retail Store Design and Atmosphere Creates Impulse Buying?

The Table 3 represents the impulsive purchase made by the respondents due to store design and atmosphere. It is found that most of the respondents expressed that indeed it impelled them to make impulsive purchases.

6.5. Do you Feel Hesitant While Entering Any Store with a Luxurious Design and Layout?

Table 4 indicates that 54% of the respondents are of the opinion they do not feel hesitant when entering a store with a luxurious store design and atmosphere, while the remaining 46% opined that they indeed felt hesitant.

6.6. Do You Think Stores with a Theme Design Are More Attractive Than Those with a Non-Theme Store Design?

When it comes to the attractiveness of a store with a theme or a non-theme design, a majority of the respondents, i.e., 81%, affirmed that they find a themed store design more attractive, while 19% negated (Table 5).

6.7. Influence of Window Displays

From the above data, we can conclude that most of the respondents have agreed to all the situations, i.e., 47%, 53%, and 36%, respectively. As far as “I tend to enter the store when I am attracted by an eye-catching window display’’ is concerned, 47% agreed to it, 35% strongly agreed, 13% were neutral, 4% disagreed and 1% strongly disagreed with it. In the case of “Window display gives me an idea about the products available in the store”, it is found that a majority of the respondents agreed to it, that is, 53%, while 1% strongly disagreed, 30% respondent strongly agreed, 11% were neutral, 5% disagreed and 1% strongly disagreed with it.
Furthermore, regarding “I like more product display than props/decorative in window display” most of the respondents agreed, with 36% and least with 2% strongly disagreed. On the other hand, respondents who strongly agreed and remained neutral were 28% and 26%, respectively (Table 6).

6.8. Influence of Mannequin Display

Table 7 depicts the respondent’s responses pertaining to influence of mannequin display. When asked about “I get an idea of what I want to buy after looking through Mannequin Display”, it was found that 37% of the respondents agreed to it, while 30% strongly agreed to it and 9% strongly disagreed, 11% disagreed, and 13% were neutral.
When it comes to “When I see clothing that I like on mannequin display, I tend to buy it.” 36% of respondents agreed to it, while 35% strongly agreed to it, and 11% of respondents were neutral, 14% disagreed, and 4% strongly disagreed.

6.9. Influence of Visual Merchandising

Table 8 analysis shows that 45% of respondents strongly agreed to the proposition that “when I see clothing that catches my eye I tend to try” and 18% disagreed to it. However, 20% remained neutral about it, while 10% disagreed and 6% strongly agreed. Further, it is also observed that 44% agreed and 14% disagreed with the statement “It helps me to avoid assistance of sales person”, while 27% strongly agreed and 8% strongly disagreed and 7% remained neutral. In respect of the statement, i.e., “It gives a feel of large variety and variation in products” 7% of respondents strongly disagreed, while 12% strongly agreed with it; however, 33% remained neutral, while 37% agreed with it and 11% disagreed.

6.10. Influence of Signage

Table 9 represents the influence of signage on the buyer’s perception towards the retail outlet. It was found that a majority of the respondents (43%) agreed and 5% strongly agreed that sale/clearance signs attract them to look over the clothing, while 12% disagreed and 21% strongly disagreed, and 19% were neutral. When it comes to unplanned purchases due to sale or clearance signage, 42% have agreed while only 12% disagreed, 7% strongly agreed, 19% strongly disagreed, and 20% remained neutral.

6.11. Influence of Lighting and Color

Table 10 reveals that 45% of the respondents agreed that the use of lighting in the store assists them to check the products properly, while 13% strongly disagreed; respondents who strongly agreed and strongly disagreed were 23% and 3%, respectively. The remaining respondents (16%) were found to be neutral.
A total of 46% agreed that color combination indeed creates a positive mood, whereas 3% disagreed. On the other hand, 19% strongly agreed and 7% strongly disagreed, while 25% were neutral.
When respondents were asked about whether store color creates a desire to purchase, 40% agreed while 38% were found to be neutral and 3% strongly disagreed; however, 9% disagreed and 10% strongly agreed.

6.12. Influence of Music

In Table 11, it can be seen that when it comes to ‘the tempo of the background music makes me stay longer in the store,’ a majority of the respondents (40%) agreed to it, while 23%were neutral on it. Apart from that, 13% disagreed and 20% strongly disagreed but 4% strongly agreed. In addition, 44% of respondents agreed that music in the outlets magnify their interest to stay in the store, 14% disagreed, 26% remained neutral, while 2% and 12% strongly agreed and strongly disagreed, respectively.

6.13. Influence of Store Design and Atmosphere

Table 12 shows that all statements related to the store design and atmosphere indicates positive responses from customers. It was found that only a few respondents disagreed and strongly disagreed as compare to most of the responses on the agree and strongly agree side. So, all the responses combined together indicate a positive judgement related to store design and atmosphere.

6.14. Impact on Shopper Purchase Decision

Table 13 shows that all statements related to the store design and atmosphere indicate positive responses from customers. It is found that only a few respondents disagree and strongly disagree as compared to most of the responses on the agree and strongly agree side. So, all the responses combined together indicate a positive judgement related to the shopper’s purchase decisions.

6.15. Measurement Model

In Figure 2, Window Display (W.D), Mannequin Display (M.D), Visual Merchandising (V.M), Music, Light and Color (L and C), Signage, Store Design and Atmosphere (S.D and A) and Shoppers’ Purchase Decisions (S.P.D) are represented by circles since they are the Latent Constructs used by the researcher in the study. W.D is measured through three statements codes as W.D1 to W.D2, M.D is measured through two statements codes as M.D1 and M.D2, V.M is measured through three statements codes as V.M1 to V.M3, Music is represented through two statements codes as music1 and music2, L and C is represented through codes as L and C1 to L and C3 and Signage is represented through codes as Signage1 and Signage2. In the same way, S.D and A is represented through six statements codes as S.D and 1 to S.D and 6 and S.P.D is represented through eight statement codes as S.P.D1 to S.P.D8. The factor loading values are shown near the arrows pointing to the respective items/constructs.
In Figure 2, W.D, M.D, V.M.I, music, L&C, and signage are represented by circles since they are the latent constructs used by the researcher in the study. SD & A represent mediator in the study. S.P.D respresnet as depdendent variable. The factor loading values are shown near the arrows pointing to the respective items/constructs.
Table 14 represents that the mean values of all the items of each construct are more than 3; it indicates the positive responses of shoppers towards Store Design and Atmosphere. In this study, researchers used the 5-point Likert scale ranging from “Strongly Disagree (1) to Strongly Agree (5)”. Standard deviation is a statistic that measures the dispersion of a dataset relative to its mean and is calculated as the square root of the variance. If the data points are further from the mean, there is a higher deviation within the data set; thus, the more spread out the data, the higher the standard deviation. The factor loadings of all the items of each construct are more than the prescribed limit of 0.70. So, it indicates that all the statements clearly explain their respective theoretical assumed construct.

6.16. Convergent Validity Result

Cronbach Alpha, Rho and convergent validity of the measurement model results of present study are shown below in Table 15.
Table 15 clearly shows that all eight constructs satisfy the prescribed limit as the value of Composite Reliability (C.R) was more than 0.7 and “Average Variance Extracted (AVE)” surpassed 0.5 [43]. The value of “Cronbach’s Alpha” and “rho-a” value confirmed internal consistency as the value obtained was greater than 0.7 [44]. Hence, the convergent validity of the constructs was proved [45].

6.17. Discriminant Validity Result

The Fornell–Larcker and cross-loading criteria were used to verify the discriminant validity. Discriminant validity shows “the extent to which the measure is adequately distinguishable from related constructs within the nomological net”.
Table 16 represents the Fornell–Larcker criterion, to achieve this result you take the “square roots of Average Variance Extracted” of the available constructs. The values were as follows, Light and Color (0.893), Mannequin Display (0.891), Music (0.881), Store Design and Atmosphere (0.846), Shoppers’ Purchase Decisions (0.841), Signage (0.914), Visual Merchandising (0.849), and Window Display (0.848), which were greater than the correlation values between each construct, in addition to the other constructs. Hence, discriminant validity was obtained as per the Fornell–Larcker criterion [46].
Table 17 represents the cross-loading criterion where all the constructs’ loadings were greater than cross-loadings with another construct over the columns. Hence, discriminant validity was obtained consistent with the cross-loading criterion [47].

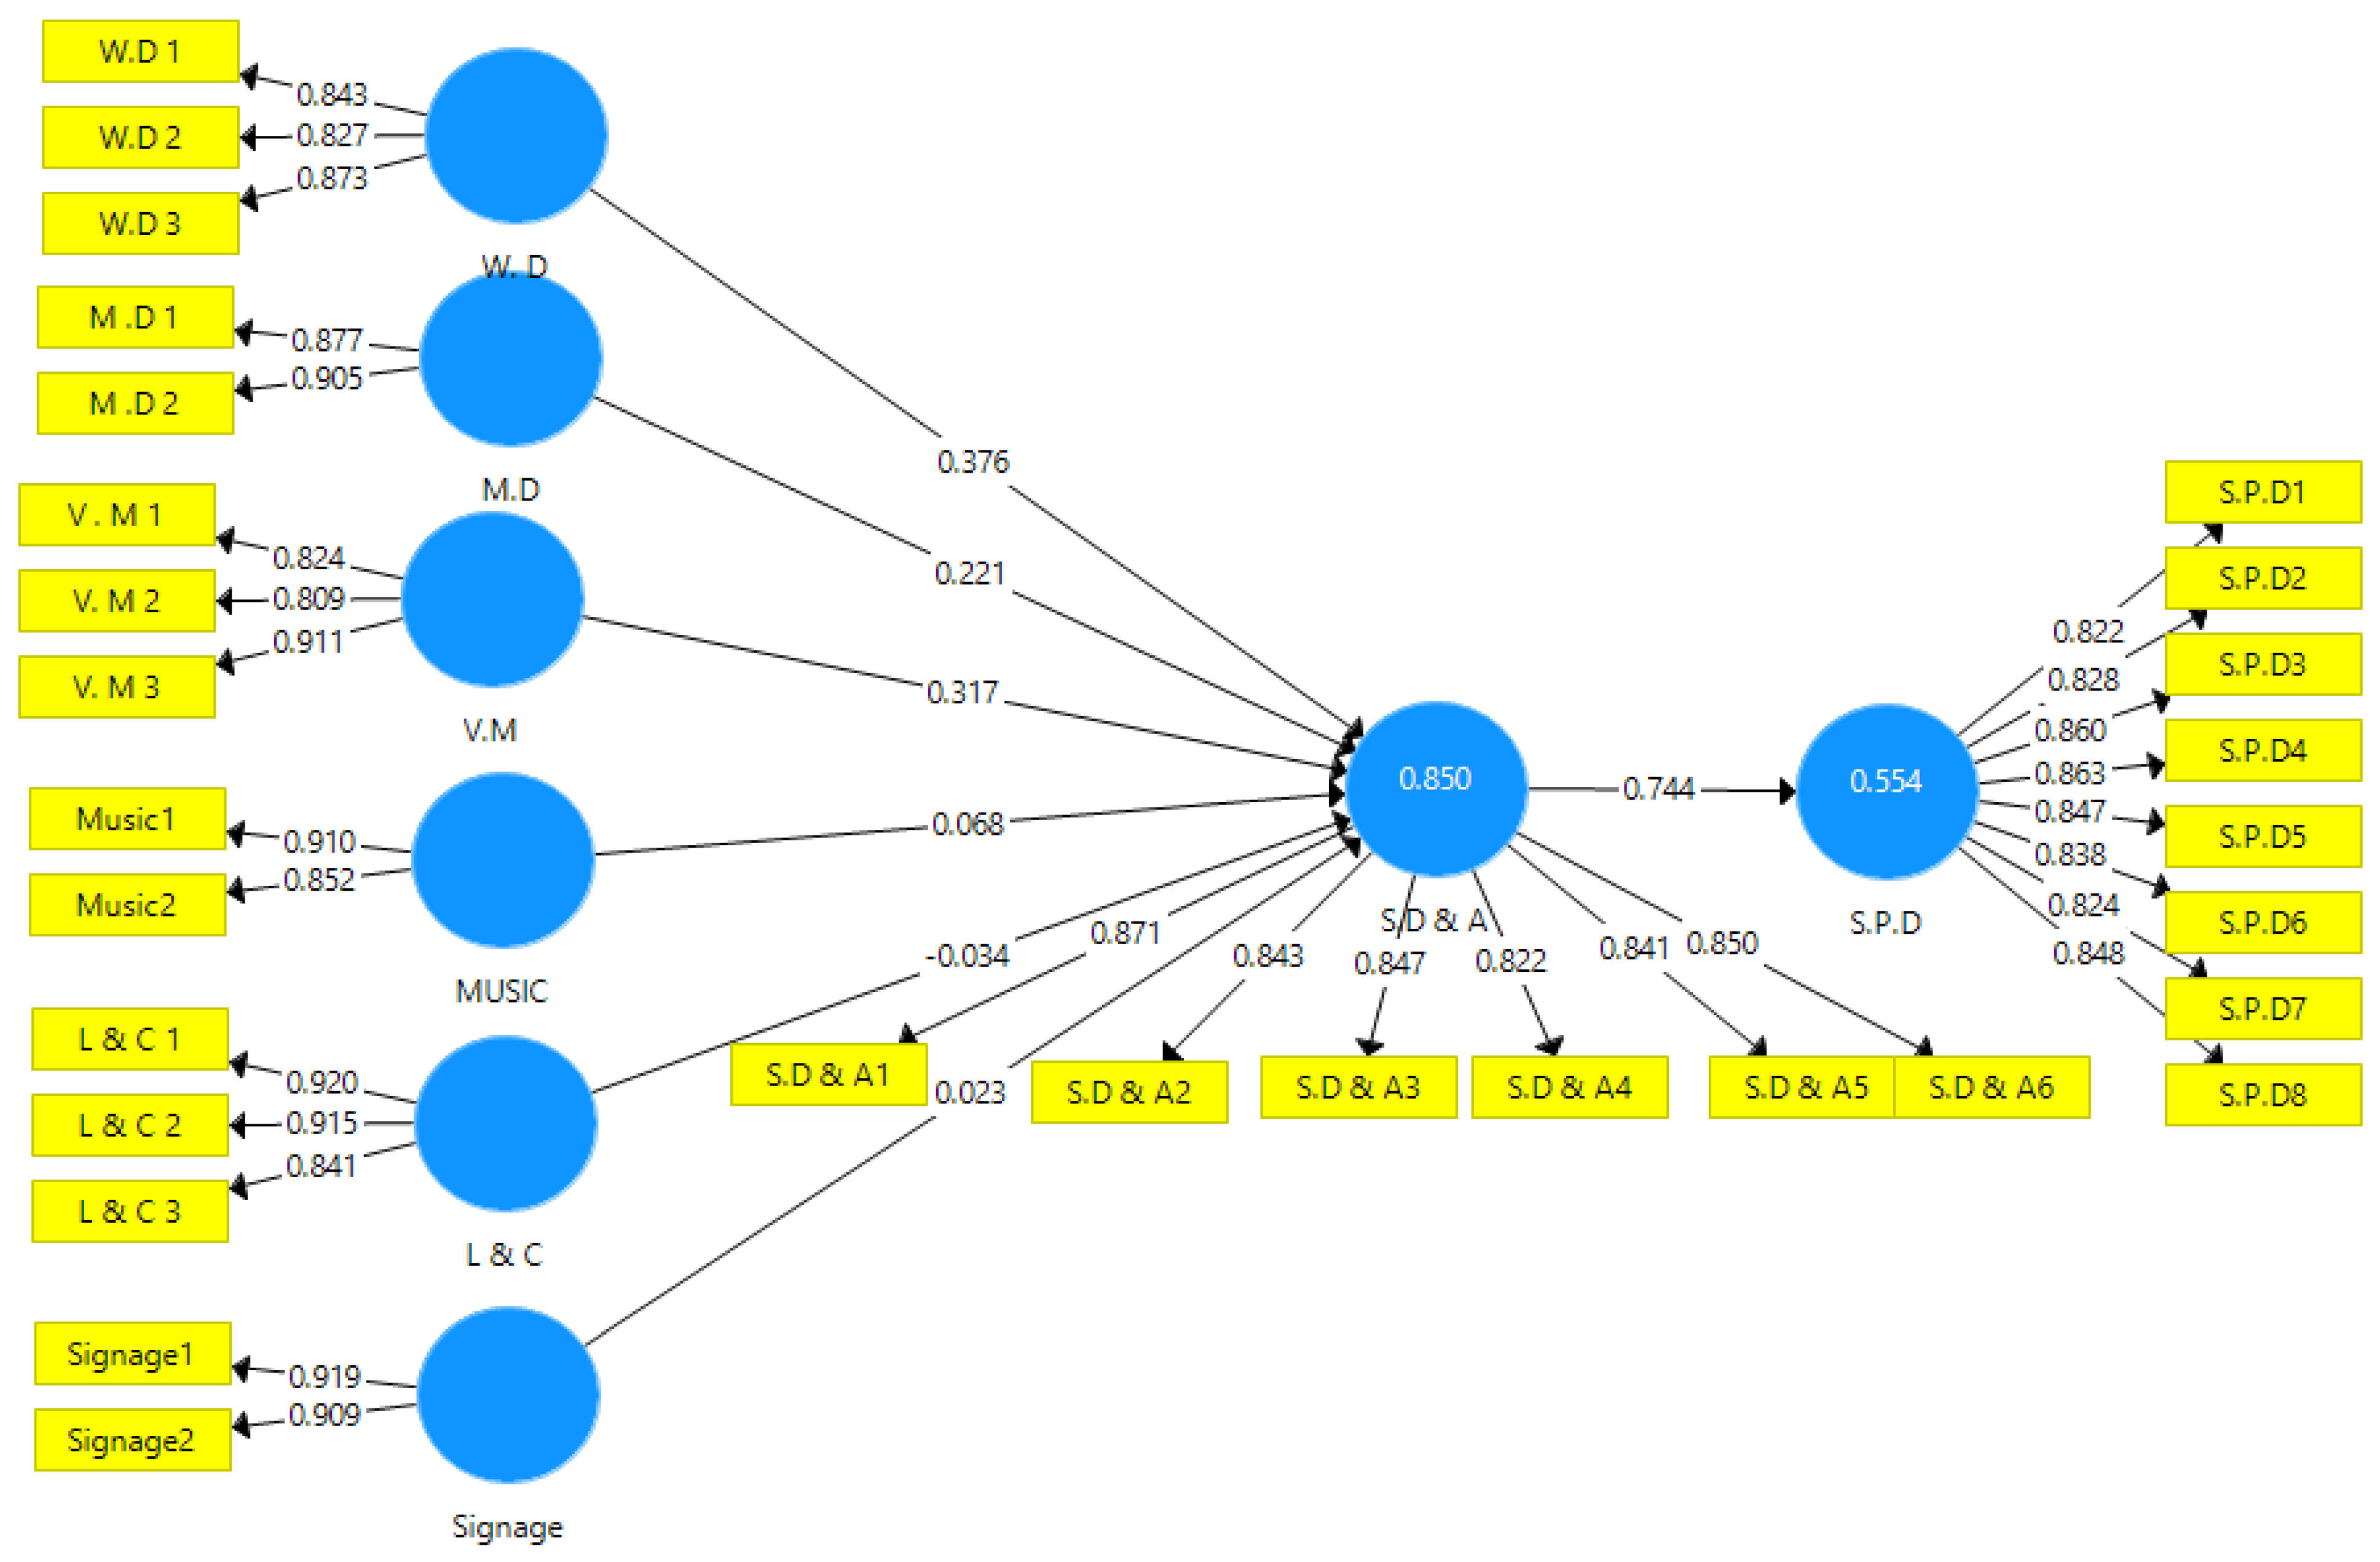
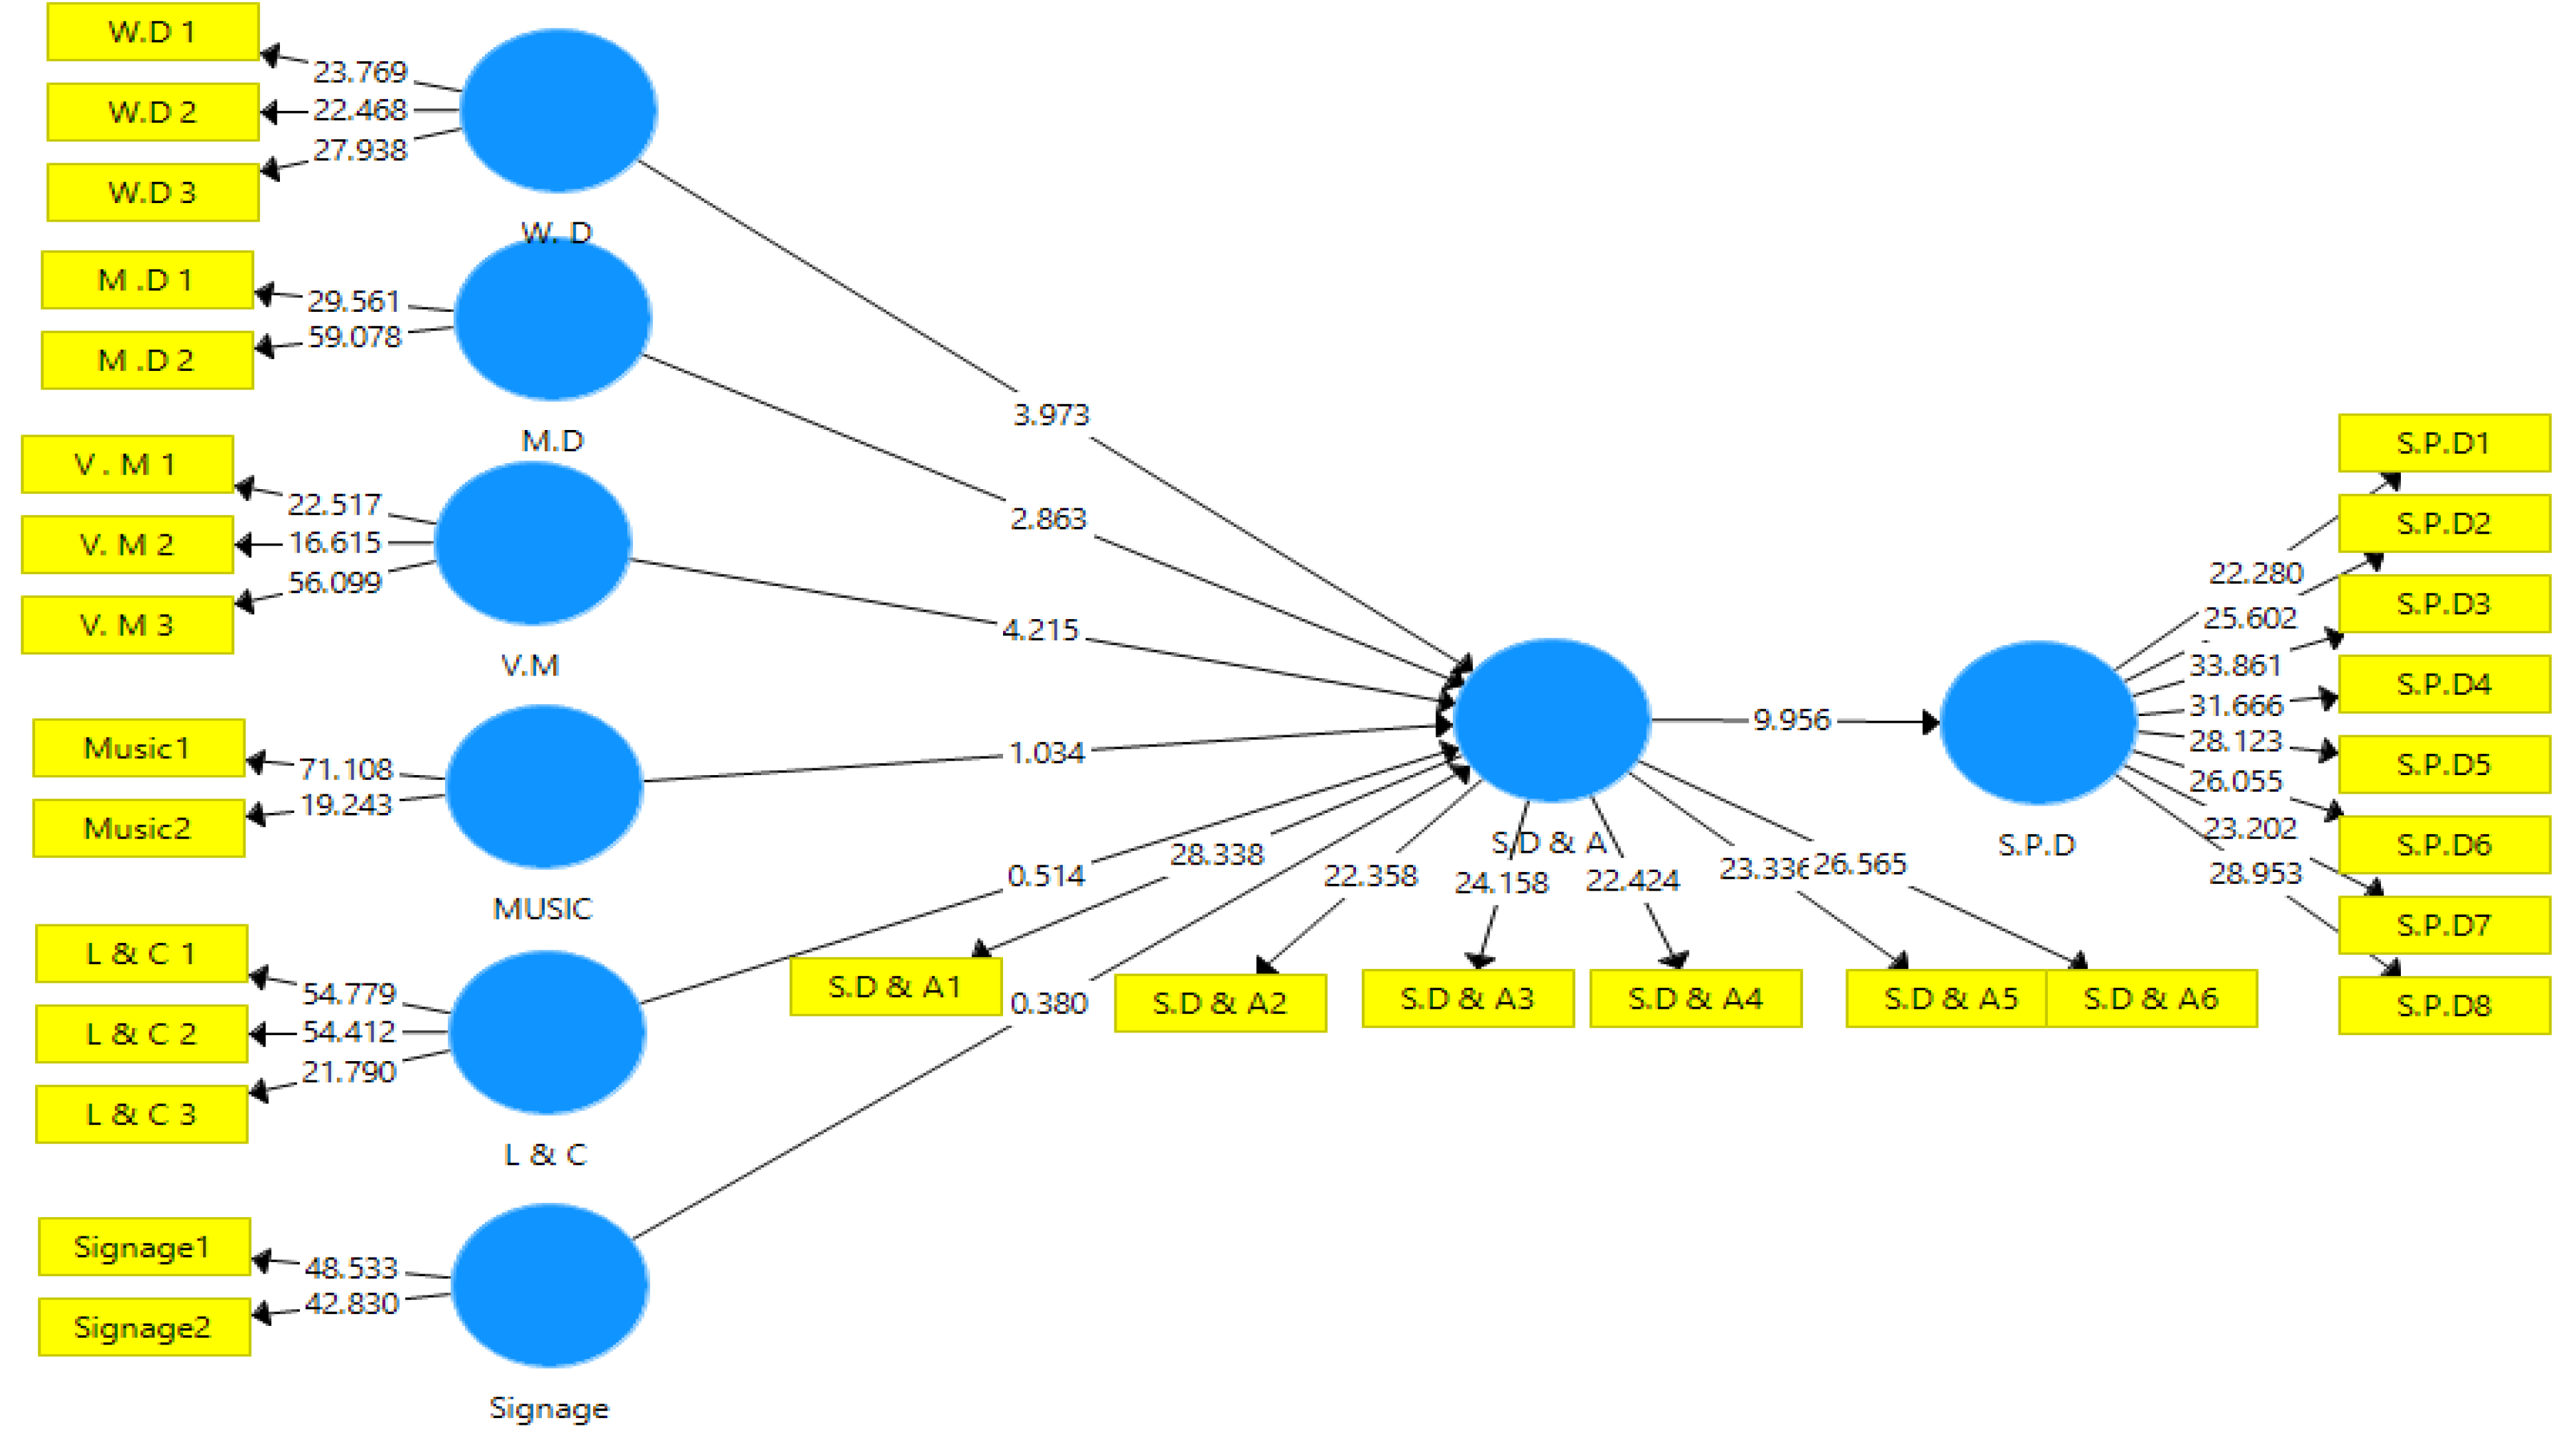
6.18. Structural Equation Model

When evaluating the structural model, multicollinearity must be examined to ensure that the outcomes are valid. The “Variance Inflation Factor (VIF)” values ranged from 1.709 to 3.155, represent that the model lacked multicollinearity [48]. Following that, the structural model was tested using the bootstrapping approach (3000 resamples) to determine the relevance of the hypotheses of the present study.
The above Figure 3 of PLS-SEM model reveals that whenever the t-values are more than the prescribed limit of 1.96, the regression weights conclude that each path is significant at the 5 percent significance level or better (i.e., the estimated path parameter is significant). The results extracted from the SEM model are exhibited in Table 18 given below.
Table 18 shows that hypothesis H1, H2, H5, H6, H9, H10 and H13 were supported, and H3, H4, H7, H8, H11 and H12 were not supported. Window display (W.D) (β = 0.382, t-value = 3.973), Visual Merchandising (V.M) (β = 0.313, t-value = 4.215) and Mannequin Display (M.D) (β = 0.216, t-value = 2.863) have significance and are positively related to the Store Design and Atmosphere (S.D and A). In the same way, Window Display (W.D) (β = 0.282, t-value = 3.698), Visual Merchandising (V.M) (β = 0.232, t-value = 3.713) and Mannequin Display (M.D) (β = 0.158, t-value = 2.929) have significance and are positively related to Shoppers’ Purchase Decisions (S.P.D). Store Design and Atmosphere (S.D and A) (β = 0.737, t-value = 9.956) have significance and are positively related to the Shoppers’ Purchase Decisions (S.P.D).
On the other hand, music (β = 0.070, t-value = 1.034), light and color) (β = 0.034, t-value = 0.514) and Signage (β = 0.02, t-value = 0.380) do not have significance related to Store Design and Atmosphere (S.D and A). In the same way, music (β = 0.052, t-value = 1.019), light and color) (β = 0.024, t-value = 0.528) and Signage (β = 0.014, t-value = 0.385) do not have significance related to Shoppers’ Purchase Decisions (S.P.D).
Table 19 shows that hypothesis H14, H16 and H18 were supported and H15, H17 and H19 were not supported. The mediating role of Store Design and Atmosphere has also been examined between the six factors and shoppers buying decisions. The outcomes indicate Store Design and Atmosphere partially mediate Window Display (W.D) (β = 0.282, t-value = 3.698), Visual Merchandising (V.M) (β = 0.232, t-value = 3.713) and Mannequin Display (M.D) (β = 0.158, t-value = 2.929).
Contrastingly, Store Design and Atmosphere did not play a mediating role between music (β = 0.052, t-value = 1.019), L and C (β = 0.024, t-value = 0.528) and Signage (β = 0.014, t-value = 0.385) with shoppers’ purchase decisions.

6.19. Regression Analysis

Next, the R2 value (coefficient of determination) was calculated as shown in Table 20. Store Design and Atmosphere (S.D and A) and Shoppers’ Purchase Decisions (S.P.D) together represented 85% and 55.4% of the explained variance for consumers. Lastly, adjusted R square was employed using the blindfolding technique to check the predictive relevance of the model. The adjusted R square values were above zero or store Design and Atmosphere (0.844) and Shoppers’ Purchase Decisions (0.551), thus, the model’s predictive relevance is supported.

7. Discussion

Music: Music shows an insignificant impact on the consumer purchase intention. The insignificant relationship between music and consumer purchase intention is in contrast to findings of [49] which state music has a positive impact on mood and purchase behavior. Lighting and color: Lighting and color shows an insignificant impact on the consumer purchase intention which means the lighting and color of the retail chain outlets does not impact consumers while shopping. The result is in contrast to the findings of [50]. Display/Layout of outlet: which means that there is a significant relationship between the consumers’ purchase intention and product display/layout. The same finding was reported in the studies of [51]. Mannequin Display: Retail outlets should display their products in a manner that could draw consumers’ attention. Mannequin displays in the retail stores are used to the same purpose, consequently consumers make impulse purchases [52]). Overall the sales of retail outlets depends on the “Design and display” of products. Display can be described as the collection of shelf space, products and allotment of floor space, departmental allotment, and wall decorations. Signage: Signage can be described as any type of “graphic display” to impart information to the public. Mainly, signage is inclined to some general objectives, such as promotion, giving information, identification, and providing directions or to lifting safety acknowledgement. Store Design and Atmosphere: Retail store design is a properly planned strategy to set up an outlet in a specific way, to use space properly, to develop an attracting ambience and to increase sales [53]. Ambience consists of the store exterior and layout, the common interior and the interior displays. Physical store attributes intend an image and attract consumers to the retail store [54]. Effects of crowding can be decreased by developing an ancillary ambience in stores. A captivating store design will draw the attention of many consumers to the store.

8. Conclusions

The main purpose of conducting this research was to discover the effect of retail store design and ambience variables on shoppers’ buying decisions. It was found that, indeed, retail store design and ambience have a remarkable effect on shoppers’ buying decisions. As a result, a retail outlet must be designed with a focus on the major aspects of store design and atmosphere, such as window display, visual merchandising, and mannequin display, while paying less attention to signage, lighting and color, and background music.
Moreover, the research discloses that window and mannequin display and visual merchandising have a positive effect on shoppers’ buying decisions, whereas signage, color and lighting, and background music do not have any significant impact but do have some relationship with purchase decisions.
Window displays, music, mannequin displays, lighting and color, visual merchandising, signage, store design, and atmosphere are all important factors that store owners should think about in order to appeal to their customers. The visual displays in stores should appeal to all genders. Customers should be able to easily examine and handle the items on display in the window. Managers should think about the Mannequin Display to encourage and motivate customers to return. It is recommended that consumers have adequate lighting to see the merchandise. Stores could benefit from using many lighting schemes and colors without sacrificing customer safety or the store’s ability to blend in with its environment. A calming atmosphere can be achieved by playing music.

8.1. Implication of Study

This study presents a validated instrument for measuring the association between design atmosphere and consumer purchasing behavior and serves as a tool for evaluating the influence of various design atmospheric indicators. This study’s objective was to assess the retail shop capability in Indian retail stores, particularly in the setting of retail market stores. The results of the confirmatory factor analysis and reliability tests suggested that all six elements of store atmospherics—window, mannequin display, visual merchandising, lighting and color, music, and signage—are very suitable and dependable for determining retail shop effectiveness. In terms of customers’ intentions to visit, buy, and refer the business to friends and family, the atmosphere and layout of retail stores are also substantially correlated with future consumption behavior. Keeping employee turnover low is an additional essential aspect of business success. Despite the fact that they are fundamentally goods dealers, retailers must still offer services to facilitate the sale of their products. This is made possible by their helpful sales staff, who are tasked with guiding consumers through the purchasing process. It is important to keep a steady staff of well-trained, polite salespeople on hand at all times. Customers will be more likely to return and eventually suggest the store to others if their needs are met through superior service offered by customer-focused salespeople, allowing the merchant to effectively compete in the marketplace. All of the underlying aspects of a retail store’s capability contribute to repeat store visits and the propagation of positive word-of-mouth. Having been shown to be valid and trustworthy, the retail shop aptitude scale is useful for practitioners and academics who wish to investigate retail shop ability in greater depth. The gadget is useful for collecting data that may be utilized for benchmarking current levels of retail atmosphere and layout and for conducting periodic inspections to measure service performance and enhancement.

8.2. Limitations and Direction for Future Research

This study draws on the larger retail business to examine the effects of Store Design and Atmosphere on Shoppers in the Delhi-National Capital Region (NCR). Furthermore, the survey is limited to shoppers who make purchases at Store Design stores or shoppers of other retail kinds. Only customers who had shopped at one or more retail stores in the Delhi-National Capital Region and were randomly selected to fill out questionnaires were included in the population analysis. Researchers use convenience sampling, and the total number of respondents is 100, a number that will inevitably increase in future studies. Last but not least, the research variables were constrained to a single framework of six independent factors, despite the fact that many more drivers were eliminated. To acquire a more comprehensive understanding of Indian consumer behavior, future research should examine the entire nation or a substantial sample of both major and small cities. Probability sampling with a sizeable sample in mind should be incorporated in future studies to increase the generalizability of the findings.

Author Contributions

All authors contributed to conceptualization, formal analysis, investigation, methodology, and writing and editing of the original draft. All authors have read and agreed to the published version of the manuscript.

Funding

This research received no external funding.

Institutional Review Board Statement

Not Applicable.

Informed Consent Statement

Informed consent was obtained from the respondents of the survey.

Data Availability Statement

The data used to support the findings of this study are available from the corresponding author upon request.

Conflicts of Interest

The authors declare no conflict of interest.

References

  1. Kusumowidagdo, A.; Sachari, A.; Widodo, P. The Impact of Atmospheric Stimuli of Stores on Human Behavior. Procedia Soc. Behav. Sci. 2012, 35, 564–571. [Google Scholar] [CrossRef] [Green Version]
  2. Bawa, R.; Sinha, A.K.; Kant, R. Effect of store atmospherics on customer buying behaviour. Asian J. Home Sci. 2015, 10, 386–394. [Google Scholar] [CrossRef]
  3. Hassouneh, D.; Brengman, M. Retailing in social virtual worlds: Developing a typology of virtual store atmospherics. J. Electron. Commer. Res. 2015, 16, 218–241. [Google Scholar]
  4. Sharma, B.; Singh, N.K.; Sengar, V. A Review Paper to Comprehend Impulse Buying Behavior. MANTHAN J. Commer. Manag. 2019, 6, 92. [Google Scholar] [CrossRef]
  5. Badgaiyan, A.J.; Verma, A.; Dixit, S. Impulsive buying tendency: Measuring important relationships with a new perspective and an indigenous scale. IIMB Manag. Rev. 2016, 28, 186–199. [Google Scholar] [CrossRef] [Green Version]
  6. Khan, M.A. Financial Analysis of Dairy Companies in India A Comparative Study of Selected Companies. 2021. Available online: https://www.shin-norinco.com/article/financial-analysis-of-dairy-companies-in-india-a-comparative-study-of-selected-companies (accessed on 27 September 2022).
  7. Khan, M.A.; Hussain, M.M.; Pervez, A.; Atif, M.; Bansal, R.; Alhumoudi, H.A. Intraday Price Discovery between Spot and Futures Markets of NIFTY 50: An Empirical Study during the Times of COVID-19. J. Math. 2022, 2022, 2164974. [Google Scholar] [CrossRef]
  8. Ali, M.S.I.; Mubarak, K.M. Exterior Atmospherics and There Impact on Consumer Purchasing Behavior at Self- Serving Convenience Stores. Int. J. Sci. Res. (IJSR) 2016, 5, 263–268. [Google Scholar] [CrossRef]
  9. Bohl, P. The Effects of Store Atmosphere on Shopping Behaviour—A Literature Review. Corvinus Mark. Tanulmányok 2012, 2012, 1–23. Available online: http://unipub.lib.uni-corvinus.hu/669/1/CMT_2012-1.pdf (accessed on 1 October 2015).
  10. Iva, S.; Robert, W.R. The Impact of the in Store Environment on Consumer Behaviour. I Manag. J. Manag. 2019, 14, 15. [Google Scholar] [CrossRef]
  11. Mowlaie, S.; Aminosharieh, S. An Investigation into Individual and Situational Factors Effective in the Level of Impulse Buying Behavior of Customers. J. Ecophysiol. Occup. Health 2017, 17, 68–71. Available online: http://www.informaticsjournals.com/index.php/JEOH/article/view/18067 (accessed on 16 July 2018).
  12. Moore, C.M.; Lochhead, M. The management of retail design: Demystifying the activity. J. Consum. Stud. Home Econ. 1998, 22, 121–130. [Google Scholar] [CrossRef]
  13. Ramya, N.; Ali, M. Factors affecting consumer buying behavior. Int. J. Appl. Res. 2016, 2, 76–80. Available online: https://www.allresearchjournal.com/archives/?year=2016&vol=2&issue=10&part=B&ArticleId=2683 (accessed on 10 September 2016).
  14. Banat, A.; Wandebori, H. Store Design and Store Atmosphere Effect on Customer Sales per Visit. In Proceedings of the 2nd International Conference on Business, Economics, Management and Behavioral Sciences, Bali, Indonesia, 13–14 October 2012; pp. 84–89. Available online: http://psrcentre.org/images/extraimages/10%201012545.pdf (accessed on 15 October 2012).
  15. Hanaysha, J.R. An examination of the factors affecting consumer’s purchase decision in the Malaysian retail market. PSU Res. Rev. 2018, 2, 7–23. [Google Scholar] [CrossRef]
  16. Kakkar, S.; Mathur, S. Organised retail in India and consumer buying behaviour: A review of literature. J. Crit. Rev. 2020, 7, 804–814. [Google Scholar] [CrossRef]
  17. Sathyanarayana, S.; Harshini, C.S.; Sudhindra, G. An Analytical Study on the Impact of Visual Merchandising on Impulsive Buying Behaviour in Shopper Stop. Int. J. Sci. Basic Appl. Res. (IJSBAR) 2017, 36, 112–132. Available online: https://www.gssrr.org/index.php/JournalOfBasicAndApplied/article/view/8243 (accessed on 20 December 2017).
  18. Bucko, J.; Kakalejčík, L.; Ferencová, M. Online shopping: Factors that affect consumer purchasing behaviour. Cogent Bus. Manag. 2018, 5, 1535751. [Google Scholar] [CrossRef]
  19. Michon, R.; Yu, H.; Smith, D.; Chebat, J.C. The influence of mall environment on female fashion shoppers’ value and behaviour. J. Fash. Mark. Manag. 2008, 12, 456–468. [Google Scholar] [CrossRef]
  20. Victor, V.; Thoppan, J.J.; Nathan, R.J.; Maria, F.F. Factors influencing consumer behavior and prospective purchase decisions in a dynamic pricing environment-an exploratory factor analysis approach. Soc. Sci. 2018, 7, 153. [Google Scholar] [CrossRef] [Green Version]
  21. Hwang, J.; Seo, S. A critical review of research on customer experience management: Theoretical, methodological and cultural perspectives. Int. J. Contemp. Hosp. Manag. 2016, 28, 2218–2246. [Google Scholar] [CrossRef]
  22. Bäckström, K. Shopping as leisure: An exploration of manifoldness and dynamics in consumers shopping experiences. J. Retail. Consum. Serv. 2011, 18, 200–209. [Google Scholar] [CrossRef]
  23. Koch, J.; Frommeyer, B.; Schewe, G. Online shopping motives during the COVID-19 pandemic—Lessons from the crisis. Sustainability 2020, 12, 10247. [Google Scholar] [CrossRef]
  24. Khan, M.A.; Minhaj, S.M. Dimensions of E-Banking and the mediating role of customer satisfaction: A structural equation model approach. Int. J. Bus. Innov. Res. 2022, 1, 1. [Google Scholar] [CrossRef]
  25. Zhang, B.; Comite, U.; Yucel, A.G.; Liu, X.; Khan, M.A.; Husain, S.; Sial, M.S.; Popp, J.; Oláh, J. Unleashing the Importance of TQM and Knowledge Management for Organizational Sustainability in the Age of Circular Economy. Sustainability 2021, 13, 11514. [Google Scholar] [CrossRef]
  26. Mehta, N.P.; Chugan, P.K. Impact of Visual Merchandising on Consumer Behavior: A Study of Furniture Outlets. Univers. J. Manag. 2014, 2, 207–217. [Google Scholar] [CrossRef]
  27. Bashar, A.; Ahmad, I. Visual Merchandising and Consumer Impulse Buying Behavior: An Empirical Study of Delhi & NCR. Int. J. Retail. Manag. Res. (IJRMR) 2012, 2, 31–41. Available online: https://www.researchgate.net/publication/234032745_VISUAL_MERCHANDISING_AND_CONSUMER_IMPULSE_BUYING_BEHAVIOR_AN_EMPIRICAL_STUDY_OF_DELHI_NCR (accessed on 10 September 2012).
  28. Xu, L.; Koh, C.H.; Chan, H.C. The effect of background music-induced arousal on online consumer search behavior: Evaluating search performance and experience. In Proceedings of the 14th Americas Conference on Information Systems, AMCIS, Toronto, ON, USA, 14–17 August 2008; Volume 4, pp. 2317–2325. Available online: https://aisel.aisnet.org/amcis2008/260/ (accessed on 27 August 2008).
  29. Holbrook, M.B.; Anand, P. Effects of Tempo and Situational Arousal on the Listener’s Perceptual and Affective Responses to Music. Psychol. Music 1990, 18, 150–162. [Google Scholar] [CrossRef]
  30. Kellaris, J.J.; Cox, A.D.; Cox, D. The Effect of Background Music on Ad Processing: A Contingency Explanation. J. Mark. 1993, 57, 114. [Google Scholar] [CrossRef]
  31. Abratt, R.; Goodey, S.D. Unplanned buying and in-store stimuli in supermarkets. Manag. Decis. Econ. 1990, 11, 111–121. [Google Scholar] [CrossRef]
  32. Freyssinier, J.P.; Frering, D.; Taylor, J.; Narendran, N.; Rizzo, P. Reducing lighting energy use in retail display windows. In Proceedings of the Sixth International Conference on Solid State Lighting, San Diego, CA, USA, 13–17 August 2006; Volume 6337, p. 63371L. [Google Scholar] [CrossRef]
  33. Tantanatewin, W.; Inkarojrit, V. Effects of color and lighting on retail impression and identity. J. Environ. Psychol. 2016, 46, 197–205. [Google Scholar] [CrossRef]
  34. Elliot, A.J. Color and psychological functioning: A review of theoretical and empirical work. Front. Psychol. 2015, 6, 368. [Google Scholar] [CrossRef] [Green Version]
  35. Crowley, A.E. The two-dimensional impact of color on shopping. Mark. Lett. 1993, 4, 59–69. [Google Scholar] [CrossRef]
  36. Brengman, M.; Centrum, L.U. The Four Dimensional Impact of Color on Shopper’s Emotions. Adv. Consum. Res. 2004, 31, 122–128. Available online: http://ideas.repec.org/p/rug/rugwps/03-204.html (accessed on 12 July 2004).
  37. Ali Soomro, D.Y.; Abbas Kaimkhani, S.; Iqbal, J. Effect of Visual Merchandising Elements of Retail Store on Consumer Attention. J. Bus. Strateg. 2017, 11, 21–40. [Google Scholar] [CrossRef] [PubMed]
  38. Maheshwari, N. Determining Elements of Visual Merchandising: A Study on its Influential Role on Customers Buying Decision Making. Amity J. Mark. 2017, 2, 84–97. Available online: https://amity.edu/UserFiles/admaa/d26bfPaper%205.pdf (accessed on 8 August 2017).
  39. Case, B.A.; Specialty, F. Visual Merchandising and Customers’ Impulse Buying Behavior: A Case of a Fashion Specialty Store. Int. J. Serv. Manag. Sustain. 2019, 4, 1–24. [Google Scholar] [CrossRef] [Green Version]
  40. Gopal, K.; Mahajan, V.; Sen, S.; Hiremath, R.; Priya, R. Visual merchandising and interior design environment impact on consumer apparel buying behaviour with special reference to the apparel stores in Mumbai and Pune. In Proceedings of the 9th Annual International Conference on 4C’s-Communication, Commerce, Connectivity, Culture, SIM-SARC 2018, Pune, India, 17–19 December 2018. [Google Scholar] [CrossRef]
  41. Sreedhara, R.; Agarwal, V. Visual Merchandizing: Soul of Retailing. Pac. Bus. Rev. Int. 2014, 7, 47–54. Available online: http://www.pbr.co.in/2014/2014_month/Dec/3.pdf (accessed on 18 September 2014).
  42. Hussain, R.; Ali, M. Effect of Store Atmosphere on Consumer Purchase Intention. Int. J. Mark. Stud. 2015, 7, 35–43. [Google Scholar] [CrossRef]
  43. Sarstedt, M.; Ringle, C.M.; Hair, J.F. Handbook of Market Research; Springer: Cham, Switzerland, 2020. [Google Scholar] [CrossRef]
  44. Adepoju, A.; Adeniji, A. Technology Acceptance of E-Banking Services in an Unnatural Environment. SEISENSE J. Manag. 2020, 3, 34–50. [Google Scholar] [CrossRef]
  45. Khanifar, H.; Molavi, Z.; Jandaghi, G.R.; Niya, M.J.M. Factors influencing the intendancy of e-banking: An integration of TAM & TPB with eservice quality. J. Appl. Sci. Res. 2012, 8, 1842–1852. Available online: https://www.semanticscholar.org/paper/Factors-influencing-the-intendancy-of-E-Banking%3A-An-Khanifar-Niya/aa68456bd18c87a82b55ee38c2c8f2558ba6d270 (accessed on 13 December 2012).
  46. Ab Hamid, M.R.; Sami, W.; Mohmad Sidek, M.H. Discriminant Validity Assessment: Use of Fornell & Larcker criterion versus HTMT Criterion. J. Phys. Conf. Ser. 1981, 890, 012163. Available online: https://iopscience.iop.org/article/10.1088/1742-6596/890/1/012163/pdf (accessed on 11 June 2018).
  47. Henseler, J.; Ringle, C.M.; Sarstedt, M. A new criterion for assessing discriminant validity in variance-based structural equation modeling. J. Acad. Mark. Sci. 2015, 43, 115–135. [Google Scholar] [CrossRef] [Green Version]
  48. Akinwande, M.O.; Dikko, H.G.; Samson, A. Variance Inflation Factor: As a Condition for the Inclusion of Suppressor Variable(s) in Regression Analysis. Open J. Stat. 2015, 5, 754–767. [Google Scholar] [CrossRef] [Green Version]
  49. Ali, M.A.; Pervez, A.; Bansal, R.; Khan, M.A. Analyzing Performance of Banks in India: A Robust Regression Analysis Approach. Discret. Dyn. Nat. Soc. 2022, 2022, 1–9. [Google Scholar] [CrossRef]
  50. Khan, M.A.; Khan, M.I.; Illiyan, A.; Khojah, M. The economic and psychological impacts of COVID-19 pandemic on Indian migrant workers in the Kingdom of Saudi Arabia. Healthcare 2021, 9, 1152. [Google Scholar] [CrossRef] [PubMed]
  51. Khan, M.A.; Roy, P.; Siddiqui, S.; Alakkas, A.A. Systemic Risk Assessment: Aggregated and Disaggregated Analysis on Selected Indian Banks. Complexity 2021, 2021, 8360778. [Google Scholar] [CrossRef]
  52. Khan, M.A.; Zeeshan, K.; Ahmad, M.F.; Alakkas, A.A.; Farooqi, M.R. A Study of Stock Performance of Select Ipos in India. Acad. Account. Financ. Stud. J. 2021, 25, 1–11. [Google Scholar]
  53. Khan, M.A.; Alhumoudi, H.A. Performance of E-Banking and the Mediating Effect of Customer Satisfaction: A Structural Equation Model Approach. Sustainability 2022, 14, 7224. [Google Scholar] [CrossRef]
  54. Khan, M.A.; Minhaj, S.M. Performance of online banking and direct effect of service quality on consumer retention and credibility of consumer and mediation effect of consumer satisfaction. Int. J. Bus. Inf. Syst. 2021, 1, 1. [Google Scholar] [CrossRef]
Figure 1. Impact of Physical Environmental Factors on Shoppers’ Buying Behavior.
Sustainability 15 00095 g001
Figure 2. Measurement Model from SmartPLS 3.0.
Sustainability 15 00095 g002
Figure 3. Structural Equation Model (SEM).
Sustainability 15 00095 g003
Table 1. Demographic Information of the Sample Respondents.
BasisCategoriesFrequencyCumulative FrequencyPercentage
GenderMale454545.0
Female5510055.0
Age
Group
Up to 30 years404040.0
31–50 years498949.0
Above 50 years1110011.0
Marital
Status
Married666666.0
Unmarried3410034.0
Educational
Qualification
High School01011.0
Intermediate171817.0
Graduate547254.0
Post Graduate and above2810028.0
Occupational StatusPrivate Sector565656.0
Public Sector248024.0
Professional05855.0
Self-Employed02872.0
Student1310013.0
Monthly
Income
Up to Rs. 30,000282828.0
Rs. 30,001–50,000477547.0
Rs. 50,001–70,000159015.0
Above Rs. 70,0001010010.0
Table 2. Frequency of Shopping.
ResponseFrequencyPercentage
Daily022.0
Weekly1818.0
Monthly3838.0
Occasionally4242.0
Total100100.0
Table 3. Impulsive Buying.
ResponseFrequencyPercentage
Yes7777.0
No2323.0
Total100100.0
Table 4. Hesitation while Entering Store.
ResponseFrequencyPercentage
Yes4646.0
No5454.0
Total100100.0
Table 5. Store with Theme Design.
ResponseFrequencyPercentage
Yes8181.0
No1919.0
Total100100.0
Table 6. Influence of Window Displays.
Section 1: Influence of Window DisplayStrongly AgreeAgreeNeutralDisagreeStrongly Disagree
I tend to enter the store when I am attracted by an eye-catching window display.35471341
Window displays gives me an idea about the products available in the store.30531151
I like more product display than props/decoration in window displays.28362682
Table 7. Influence of Mannequin Display.
Section 2: Influence of Mannequin DisplayStrongly AgreeAgreeNeutralDisagreeStrongly Disagree
I get an idea of what I want to buy after looking at the Mannequin Display.303713119
When I see clothing that I like in a mannequin display, I tend to buy it.353611144
Table 8. Influence of Visual Merchandising.
Section 3: Influence of Visual MerchandisingStrongly AgreeAgreeNeutralDisagreeStrongly Disagree
When I see clothing that catches my eye I tend to try them on.451820107
It helps me to avoid the assistance of the sales person.27447148
It gives a feel of a large variety and variation in products123733117
Table 9. Influence of Signage.
Section 4: Influence of SignageStrongly AgreeAgreeNeutralDisagreeStrongly Disagree
Sale/clearance signs attract me to look over the clothing.543191221
I am more likely to make an unplanned purchase if the clothing has a sale or clearance sign.742201219
Table 10. Influence of Lighting and Color.
Section 5: Influence of LightingStrongly AgreeAgreeNeutralDisagreeStrongly Disagree
The lighting used in the store allows me to examine the products clearly.234516133
For me, the choice of the color combination creates a positive mood.19462537
The color used in the store creates a desire to purchase.10403893
Table 11. Influence of Music.
Section 5: Influence of LightingStrongly AgreeAgreeNeutralDisagreeStrongly Disagree
The tempo of the background music makes me want to stay longer in the store440231320
The background music played in the store can enhance my interest244261412
Table 12. Influence of Store Design and Atmosphere.
Section 5: Store Design and AtmosphereStrongly AgreeAgreeNeutralDisagreeStrongly Disagree
The right place used in the store allows me to examine the products clearly234516133
Scents or aromas designed to excite and entice the shopper39401830
Create a pleasant, congruent shop ambience and consider all the senses18422947
More attractive and appealing85718314
Maintain normal temperature of store19462537
Decorations which represent the brand10403893
Table 13. Influence of Shoppers’ Purchase Decisions.
Section 5: Shopper Purchase DecisionStrongly AgreeAgreeNeutralDisagreeStrongly Disagree
The atmosphere and decorations in the store encourage me to visit it again.234516133
When I am attracted in by an eye-catching window display, I am more likely to enter the store.18422947
After looking through the Mannequin Display, I have a better notion of what I want to buy.39401830
When I see various types of products facility available that catches my eye I tend to try them.254015128
Product allocation is made easier with category signage.85718314
This store’s brand is very concerned with environmental protection.19462537
The use of both natural and artificial lights creates a relaxing atmosphere.10403893
The color used in the store creates a desire to purchase.304510105
Table 14. Mean, Standard Deviation and Factor Loading.
ConstructItemMeanSDLoading
Light and ColorL and C 14.2400.9570.920
L and C 24.1330.9560.915
L and C 33.8801.0640.841
Mannequin DisplayM.D 14.1730.9840.877
M. D 24.000.9670.905
MusicMusic 14.0200.8900.910
Music 23.8931.0780.852
Store Design and AtmosphereS.D and A14.1930.9290.871
S.D and A24.0400.8550.843
S.D and A34.0930.9330.847
S.D and A44.1270.9610.822
S.D and A53.8530.9820.841
S.D and A64.2270.9320.850
Shoppers’ Purchase DecisionsS.P. D13.8671.0180.822
S.P. D23.8401.0330.828
S.P. D33.8000.9450.860
S.P. D43.7671.0350.863
S.P. D53.9000.9850.847
S.P. D63.9111.0690.838
S.P. D73.9271.0590.824
S.P. D83.9931.0420.848
SignageSignage 14.2000.9730.919
Signage 24.1330.9500.909
Visual MerchandisingV. M 14.0070.9340.824
V. M 23.9801.0420.809
V. M 34.0400.9010.911
Window DisplayW.D14.1070.8570.843
W.D24.2470.9520.827
W.D34.0200.9620.873
Table 15. Convergent Validity Result.
ConstructsCronbach’s AlphaRho-AComposite Reliability (C.R)Average Variance Explained (AVE)
Light and Color0.8730.8890.9220.797
Window Display0.8040.8040.8850.721
Music0.7160.7430.8740.777
Visual Merchandising0.8050.8210.8850.721
Mannequin Display0.7410.7490.8850.794
Signage0.8030.8050.9100.835
Shoppers’ Purchase Decisions0.9410.9420.9510.708
Store Design and Atmosphere0.9210.9210.9380.716
Table 16. Discriminant validity–Fornell–Larcker criterion.
ConstructsLight and Colour (L and C)Managing Display (M.D)MusicStore Design and Atmosphere (S.D and A)Shoppers’ Purchase Decisions (S.P.D)SignageVisual Merchandising (V.M)Window Display (W.D)
Light and Color
(L & C)
0.893
Managing Display (M.D)0.7910.891
Music0.8150.7760.881
Store Design and Atmosphere (S.D and A)0.8010.8400.8120.846
Shoppers’ Purchase Decisions (S.P.D)0.8090.7100.8020.7440.841
Signage0.8190.7670.7940.7850.7770.914
Visual Merchandising (V.M)0.8420.8340.8430.8400.8310.8150.849
Window Display (W.D)0.8380.8320.8370.8390.7770.8180.8390.848
Table 17. Discriminant validity–loading and cross-loading criterion.
ConstructsLight and Color (L and C)Managing Display (M.D)MusicStore Design and Atmosphere (S.D and A)Shoppers’ Purchase Decisions (S.P.D)SignageVisual Merchandising (V.M)Window Display (W.D)
L and C 10.9200.7620.7780.7690.7220.7780.8060.800
L and C 20.9150.7420.7270.7580.6800.7280.7650.774
L and C 30.8410.5990.6730.6000.7770.6850.7100.660
M.D10.6400.8770.6510.7170.5800.6250.6960.740
M.D10.7630.9050.7280.8110.6810.7360.7860.825
Music10.7140.7270.9100.7910.6550.7250.7630.785
Music20.7290.6340.8520.6250.7780.6730.7230.682
S.D and A10.6970.7490.6350.8710.6050.6190.7410.753
S.D and A20.6660.7120.7040.8430.6090.7010.7340.749
S.D and A30.7950.7360.7600.8470.7050.6890.8030.791
S.D and A40.6090.7060.6960.8220.5850.6460.7060.738
S.D and A50.6570.7070.6390.8410.6210.6420.7390.738
S.D and A60.6280.7530.6780.8500.6440.6830.7220.769
S.P.D10.6800.5440.6680.5760.8220.5950.6250.600
S.P.D20.6500.5590.6320.6160.8280.6200.6810.633
S.P.D30.6460.5810.6710.6530.8600.6350.7260.656
S.P.D40.6930.6080.7060.6200.8630.6620.7120.681
S.P.D50.6880.6000.6590.6240.8470.6560.7130.657
S.P.D60.7000.6500.7320.6560.8380.6810.7330.695
S.P.D70.6620.6040.6560.6110.8240.6880.7000.632
S.P.D80.7300.6300.6730.6460.8480.6860.6950.672
Signage10.7880.7030.7490.7380.7390.9190.7830.762
Signage20.7070.6990.7010.6950.6790.9090.7030.733
V.M10.7320.7340.7180.7170.6320.6570.8240.758
V.M20.7050.6400.7170.6670.8060.6950.8090.690
V.M30.7390.7470.7200.8370.6950.7250.9110.776
W.D10.7340.7360.7620.7640.6660.6630.7390.843
W.D20.7020.7830.6810.7660.6690.7280.7330.827
W.D30.6950.7190.6830.7440.6410.6890.7500.873
Table 18. Direct impact of Service quality and Efficiency and Reliability.
HypothesisPathΒt-valueResult
H1(W.D) → (S.D and A)0.3823.973Supported
H2(W.D) → (S.P.D)0.2823.698Supported
H3Music → (S.D and A)0.0701.034Not supported
H4Music → (S.P.D)0.0521.019Not supported
H5(M.D) → (S.D and A)0.2162.863Supported
H6(M.D) → (S.P.D)0.1582.929Supported
H7(L and Color) → (S.D and A)0.0340.514Not supported
H8(L and Color) → (S.P.D)0.0240.528Not supported
H9(V.M) → (S.D and A)0.3134.215Supported
H10(V.M) → (S.P.D)0.2323.713Supported
H11Signage → (S.D and A)0.0200.380Not supported
H12Signage → (S.P.D)0.0140.385Not supported
H13(S.D and A) → (S.P.D)0.7379.956Supported
Table 19. Indirect impact of Service quality and Efficiency & Reliability.
HypothesisPathΒt-valueResult
H14(W.D) → (S.D and A) → (S.P.D)0.2823.698Supported
H15Music → (S.D and A) → (S.P.D)0.0521.019Not supported
H16(M.D) → (S.D and A) → (S.P.D)0.1582.929Supported
H17(L and C) → (S.D and A) → (S.P.D)0.0240.528Not supported
H18(V.M) → (S.D and A) → (S.P.D)0.2323.713Supported
H19Signage → (S.D and A) → (S.P.D)0.0140.385Not supported
Table 20. Regression Result.
ModelR SquareAdjusted R Square
Store Design and Atmosphere (S.D and A)0.8500.844
Shoppers’ Purchase Decisions (S.P.D)0.5540.551
Disclaimer/Publisher’s Note: The statements, opinions and data contained in all publications are solely those of the individual author(s) and contributor(s) and not of MDPI and/or the editor(s). MDPI and/or the editor(s) disclaim responsibility for any injury to people or property resulting from any ideas, methods, instructions or products referred to in the content.

