Abstract
Historical and future drought and surplus periods in the Colorado River basin are evaluated based on eight climate scenarios. Unimpaired streamflow from 17 stations in the Colorado River are evaluated based on U.S. Geological Survey, Bureau of Reclamation, and Coupled Modeled Intercomparison Projection 5 downscaled data from 1950–2099. Representative Concentration Pathway (RCP) 4.5 and 8.5 emission scenarios are considered for four climate models (HadGEM2-ES, CNRM-CM5, CanESM2, MI-ROC5). Drought (surplus) quantities, magnitudes, severities, and water year flows are compared for the historical and future periods. Results indicate that there is a significant difference between the historical record and future projections. The results are not consistent in terms of increase of drought or surplus; however, the intensity (as measured by magnitude and duration) will likely increase for both RCP 4.5 and 8.5. The CanESM2 and CNRM-CM5 models project wetter scenarios, and HadGEM2 and MI-ROC5 models project drier scenarios. For the critical Lees Ferry station, models indicate a chance of higher drought and surplus length and magnitude on the order of two times the historical period. In addition, basin wide flow at Lees Ferry had a shift in the future mean ensemble of approximately 3–10% for the water year. Future hydrologic changes will heighten the need for appropriate management and infrastructure options available to adapt to these changes.
1. Introduction
The Colorado River basin is one of the most important basins in the United States and provides critical water resource for seven States (Colorado, Utah, Wyoming, New Mexico, Nevada, Arizona, and California) and Mexico. It serves a population of over 36 million people, supports an economy of $26 billion based on recreation, provides water for 4 million acres of farmland and sustains 30 endemic fish species [1]. It is also a highly managed system with over 50 million acre-ft of storage available between the two largest reservoirs (Lake Mead and Lake Powell). This large amount of storage is critical for sustaining water supplies during droughts, hydropower generation, recreation, and environmental productivity. Much of the southwestern United States has experienced sustained drought over the past 20 years and this has resulted in declines in water supplies in many basins and reservoirs. For instance, the Colorado River basin experienced Tier 1 and 2 shortage for the first time in 2022 and 2023 which trigger mandatory water consumption cuts for southwestern states. In addition, drought continency plans will need to be developed to ensure long term sustainability of water supplies and reservoir [2]. There is a need to understand if this is the “new normal” for the future or are these changes part of drought and surplus cycles that are experienced over years.
Extensive research has been conducted on the impact of climate change on the water conditions of the Colorado River basin. Early studies [3] used specific warming scenarios (e.g., 1, 2, 3 °C warming) along with hydrologic and system models to evaluate changes. Rajagopalan et al. [4] demonstrated how increased demand and changing climate were taxing the reliability of water supply. As Coupled Model Intercomparison Project (CMIP) projections of future climate have become available, studies have focused on impacts in headwater basins [5,6], uncertainties in precipitation projections [7], the role of increasing temperature on reduction of streamflow [8,9], and implications of changes in future flows in the basin [10]. Others such as Woodhouse et al. [11] have evaluated hypothetical droughts from 1–4 °C warming and implications for reliability of Colorado River flows. Finally, the Bureau of Reclamation [12] has studied this extensively using paleo records and future flows into major reservoirs (Lake Mead and Lake Powell). Most studies that have evaluated the future projections, use the entire suite of models from CMIP5 (on the order of 32 models) and usually for Representative Concentration Pathway (RCP) 4.5 and 8.5.
This work fills a gap in research where both drought and surplus periods from the historical records and future projections that are likely in the Colorado River. The contributions from the work presented here include the evaluation of both drought and surplus periods from 2021–2099 based on specific climate model projections that are most likely for this region. It is important to note that paleo records are not considered here as the focus is on evaluating the impact of future streamflow conditions in relation to historical (as measured from gauge records). Finally, observations and conclusions are drawn on changes in extremes (both droughts and surpluses) to stations that contribute to the entire basin and those for specific states (e.g., Arizona).
2. Materials and Methods
2.1. Data
The main data used in this study is yearly streamflow for various locations in the Colorado River basin from past periods and for the future. The selected stations represent a combination of headwater locations that are important for understanding high water generating portions of the basin, a main river station (e.g., Lees Ferry) that is important for water management, and lower basin stations that contribute only to Arizona flows and are important for understanding monsoonal impacts. A total of 17 stations noted below are used in the analysis of droughts and surpluses.
2.1.1. Historical Streamflow
Unimpaired streamflow stations are needed to conduct this analysis and remove any anthropogenic effects. Unimpaired stations were initially identified by Wallis et al. [13] updated by Tootle et al. [14]. For this study, those locations within the Colorado River basin are used from the larger U.S. data set. This results in 16 stations that were updated from the U.S. Geological Survey (USGS) NWISWeb Data retrieval (Available online: https://waterdata.usgs.gov/nwis/, accessed on 1 January 2022) to water year 2021, so the analysis is performed using the time period water year 1951–2021. This time period was selected by Tootle et al. [13] as being ideal for having a large number of streamflow stations and sufficient number of years of data for long-term analyses. In addition, the use of NWIS streamflow data allows for these results to be compared in the future with other analyses that may be conducted in the west on other unimpaired streamflow data. In addition, the Lees Ferry data was obtained for water years 1906–2021 from the Bureau of Reclamation who maintains natural flow that accounts for consumptive uses and losses. (Available online: https://www.usbr.gov/lc/region/g4000/NaturalFlow/index.html, accessed on 1 January 2022). In the analysis performed for all the stations (Section 3.1), the period of 1951–2021 was used for Lees Ferry to allow for appropriate comparisons. For specific analysis of Lees Ferry (Section 3.2), additional analysis was performed using the extended record 1906–2021.
Monthly data for all the stations is used to compute the water year cumulation defined as the months October–September. The 17 stations noted above are summarized and show in Table 1 and Figure 1. These are also locations where future flow data is available (see Section 2.1.2). For these stations, water year streamflow data is calculated in million acre-ft (MAF) which is a common unit used for water management. (Note: 1 MAF = 1233 million cubic meters MCM).

Table 1.
List of Stations with characteristics.
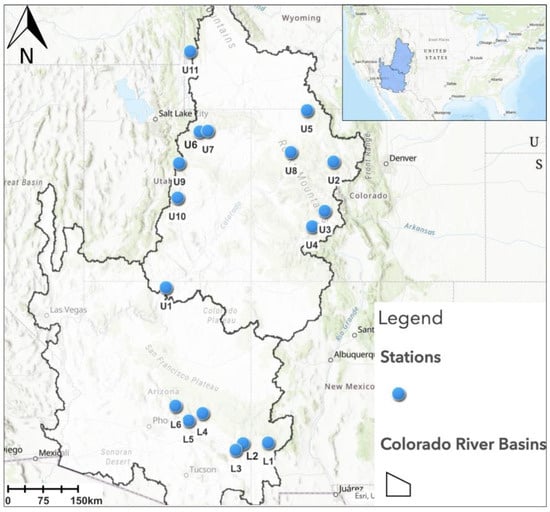
Figure 1.
Map of stations used in this study for Upper and Lower Colorado River basin.
Of the 17 stations identified in Table 1, 11 stations are from the Upper basin and six are from the Lower basin. It is noteworthy that 10 of the Upper basin stations contribute flows to Lees Ferry which is a measure of total Upper basin. The inclusion of all the stations allows for a spatial analysis of how flows may change in the future and eventually contribute to the overall flow at Lees Ferry. In addition, the inclusion of the six Lower basin stations allows for further spatial analysis of the entire Colorado River (Upper and Lower).
2.1.2. Future Projections of Streamflow
Future water year streamflow values were obtained from the comprehensive database of downscaled hydrology projections using Bias Correction and Spatial Disaggregation (BCSD) and made available by Bureau of Reclamation [14]. These projections represent downscaled climate projections (e.g., wind, temperature, precipitation) of the Coupled Modeled Intercomparison Project 5 (CMIP) projections to grid scales of ½ degree 12 km using BCSD [15]. The downscaled climate data is then used in the VIC hydrologic models for the western U.S. and values aggregated to subbasin scale [16]. The VIC hydrologic model used to develop the downscaled streamflow projections is physically based for various subbasins of the Colorado River basin and routes to key points that provide streamflow projections. This results in 97 projections of monthly and daily hydrology at specified locations (e.g., streamflow stations) over the contiguous U.S. using BCSD on CMIP5 projections. In the Reclamation archive [14], there are 18 CMIP5 models and Representative Concentration Pathways (RCP) 4.5 and 8.5 scenarios available to the year 2099.
A total of eight projections were used that represent four models (of the 18 noted above) at two emission levels as RCP 4.5 and 8.5. The emission level of RCP 4.5 is an intermediate climate change scenario that minimizes greenhouse gas emissions. RCP 8.5 is the highest level of greenhouse gas emissions resulting from a large population with high energy [17]. The Fourth National Climate Assessment [18] identified RCP 4.5 and 8.5 as the core scenarios representing the appropriate range of future conditions. The four model simulations are those used by Pierce et al. [19] and Lynam and Piechota [20] to evaluate various scenarios of California streamflow and include HadGEM2-ES, CNRM-CM5, CanESM2, and MIROC5. While there is no direct evidence that these models behave well for the Colorado River basin, these models are selected here based on their ability to simulate historical climate spatial and temperature structure at the global, Southwestern U.S. and California scales [19]. In addition, the range of these models will give a representative sample of the scenarios while still allowing for a detailed analysis of what specific futures may look like in terms of water supply. For this study there is no assumption about the model bias (e.g., water, wet, average) and direct reference is made to the models that best represent climate of the region.
To best represent the overall impact of the models for the two climate scenarios (RCP 4.5 and 8.5), ensemble water year means are calculated based on the average of the four models. This is a common practice in climate change studies where multiple models are evaluated and there is a need to establish a best estimate of the “average” of the models, e.g., [21].
2.2. Drought and Surplus Definitions
Following a definition used by Lynam and Piechota [20] drought was defined as periods where there was two or more consecutive years of deficit flow (below average flow) with the period ending only when two consecutive years of surplus occurred. The average flow for the historical period is used for all analyses to ensure analyses are evaluating the impact in relation to current hydrologic conditions. Similarly, surplus periods were defined as two or more consecutive years of excess flow (above average flow) with the period ending only when two consecutive years of deficit occurred. Other studies in the west have used drought definitions where in any given year a drought can occur if the index (i.e., PDSI) drops below zero or alternatively using a three-year moving average to determine drought years [12]. The approach used here recognizes the varied nature of drought (and surplus) definitions while using a standard statistical measure appropriate for a basin that has significant storage (i.e., 4 years of storage in the two major reservoirs). For both drought and surplus periods, duration, magnitude (defined as the cumulative of the departure from the average), and the severity (defined as magnitude/duration) were compiled.
2.3. Testing of Differences
The difference in the total number of droughts and surplus periods for each scenario (i.e., historical vs. future periods) was evaluated using the F-test. In this test, the variance in two populations is evaluated to see if there is a significant difference. In this study, the population consist of the number of drought and surplus periods. For all tests, the historical population of drought and surplus periods is evaluated against the future population of drought and surplus periods determined in the analysis. Results are displayed and discussed in Section 3.
The sample populations of drought and surplus for each scenario are also presented as box and whisker plots where the middle of the box represents the median, the top and bottom represent the 75th and 25th percentiles of the population and the top and bottom of the whisker represent the 90th and 10th percentiles of the population (see Section 3.2).
3. Results
3.1. Station Specific Results for the Basin
The station specific results of the entire basin for historical and future droughts (surpluses) are shown in Table 2, Table 3 and Table 4, and Figure 2 and Figure 3. These results are shown for future flows including drought and surplus periods (duration and magnitude) along with changes in the mean water year flow. For all analysis presented in this Section 3.1, the historical time period of 1951–2021 is used for all stations.
Table 2.
Duration (in years) of drought and surplus for Upper (U) and Lower (L) Basin stations based on 1951–2021 for all stations and also the time period 1907–2021 for Lees Ferry. For drought duration, red values are higher than the historical record and blue values are lower. For surplus duration, blue values are higher than the historical record and red values are lower.
Table 3.
Magnitude (in MAF) of drought and surplus periods for Upper (U) and Lower (L) Basin stations based on 1951–2021 for all stations and also the time period 1907–2021 for Lees Ferry. Blue values are higher than the historical record and red values are lower (Note: 1 MAF = 1233 million cubic m).
Table 4.
Table of historical and future annual water year mean flow (MAF) for all eight scenarios and historical period of 1951–2021 for all stations. For Lees Ferry, the historical mean is also show for the time period 1907–2021. Ensemble means are also provided as the average of the four models for each RCP 4.5 and 8.5. Blue values are higher than the historical record and red values are lower. (Note: 1 MAF = 1233 million cubic m).
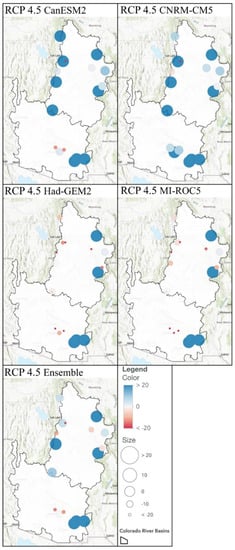
Figure 2.
Spatial distribution of percentage change in mean projected water year streamflow for the period 2022–2099 for 4.5 RCP scenario, four models and ensemble.
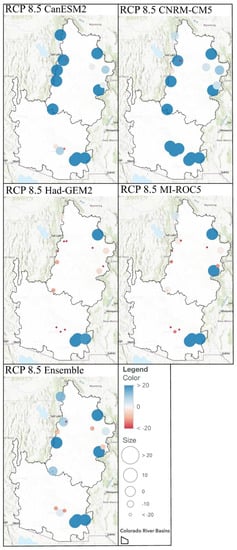
Figure 3.
Spatial distribution of percentage change in mean projected water year streamflow for the period 2022–2099 for 8.5 RCP scenario, four models and ensemble.
3.1.1. Drought (Surplus) Duration
For the evaluation of drought duration and magnitude, the changes appear to be larger under the RCP 8.5 scenario as compared to the historical record and RCP 4.5 (Table 2 and Table 3). The longest duration droughts occur in the Lower basin (e.g., Salt Creek stations). Historically, the longest drought was 27 years at Salt Creek, and in the future (MI-ROC5 scenario), droughts may be up to 44–65 years long (Table 2). In the Upper basin, Lees Ferry station has two models (HadGEM2-ES and MI-ROC5) where the drought duration is longer (14–32 years compared to 11 years in the historical record. All other models show shorter drought periods than the historical record.
The duration of surplus periods is longer for many of the stations in the Upper basin. For instance, Lake Fork has seven of the eight scenarios with longer duration, and Slater Fork has all the scenarios with longer surplus duration (increasing from 9 years in the historical record to 20–43 years depending on the model scenario). In comparison, Lees Ferry six of the eight scenarios had longer duration surplus periods than the historical record (increasing in duration from 10 years in the historical record to 11–23 years in the future).
3.1.2. Drought (Surplus) Magnitude
The largest changes in drought magnitude (as indicated by negative values in Table 3) appear in four Upper Basin stations (East River, Yellowstone River, White River, Fish Creek) that show a higher magnitude in all scenarios corresponding to the longer drought periods (Table 2). The change in magnitude is very large and, in some cases, shows droughts that are 5–20 times larger than the historical record. It should be noted that these are much smaller headwater basins as compared to Lees Ferry that represents the entire Upper basin. For Lees Ferry, two of the models (HadGEM2-ES and MI-ROC5) had drought magnitudes larger than the historical record (on the order of two to four times larger). For instance, HadGEM2-ES2 and MI-ROC5 models under the RCP 8.5 scenarios had largest drought magnitudes of −95.8 MAF and −44.2 MAF over multiple years, compared to the largest drought in the historical record that was −20.9 MAF.
For the magnitudes of future surplus, the CanESM2 and CNRM-CM5 models’ conditions were likely to be wetter. Similar to the results for surplus duration periods, Lake Fork and Slater Fork had all the scenarios with higher surplus magnitudes (increasing from 2–20 times in magnitude depending on scenario). For Lees Ferry, two of the models had higher surplus magnitudes (CanESM2 and CNRM-CM5) on the order of two to three times larger than the historical record.
3.1.3. Changes in Water Year Mean Flow
To understand the implications of changes in the mean water supply for a given year, it is important to understand how the water year (October–September) flows change from the historical record to the future. This is different from the results show in Table 3 which are the average drought (surplus) that is expected over a longer period for the historical record and the future projections. Table 4 presents the historical water year average flow for each station and the change in water year average flow that would occur under each of the future climate scenarios. Of all the scenarios (RCP 4.5 and 8.5 and four models), 60% of the results indicated a future mean water year flow that would be higher than the historical mean. As noted earlier, the CanESM2 and CNRM-CM5 models are wetter than the HadGEM2-ES and MI-ROC5 that tend to have drier conditions as noted in the water year flows. For the RCP 4.5 and 8.5 scenarios using CanESM2 and CNRM-CM5 models, 85% of analyses had higher (or wetter) water year means. Similarly, for the HadGEM2-ES and MI-ROC5 models, 66% had lower (or drier) water year means.
When comparing the RCP 4.5 and 8.5 results in Table 4, there does not appear to be much of a difference. For instance, both RCPs have similar changes in the ensemble water year mean-six (6) stations are lower (drier) and 11 are higher (wetter). Of note, is the approximate 10% (from 13.8 MAF to 15.2 MAF) increase in water year flow at Lees Ferry in Table 4 based on the historical record (1951–2021) and 3% increase (from 14.7 MAF to 15.2 MAF) based on the historical record (1907–2021). It is important to note that this is an ensemble from two models that produce higher averages (on the order of 17 MAF) and two models that produce lower average (on the order of 12–13 MAF). If realized, this would have significant implications for water management in the region.
Figure 2 and Figure 3 present the spatial changes in the basin and the magnitude of the water year flows. There is a slight tendency for higher magnitude of changes in water year flows under the RCP 8.5 scenarios than 4.5 scenarios. For instance, at Lees Ferry, the ensemble for RCP 4.5 and 8.5 is 15.2 MAF. Figure 2 and Figure 3 also show the tendency for wetter conditions in CanESM2 and CNRM-CM5 streamflow projections and generally drier in the Had-GEM2 and MI-ROC5 streamflow projections (for both RCP 4.5 and 8.5). This is consistent with results seen in California climate change analysis [19,20]. However, the spatial results for the Had-GEM2 and MI-ROC5 were not as consistent as the CanESM2 and CNRM-CM5 scenarios. For the Had-GEM2 and MI-ROC5 scenarios (both RCP 4.5 and 8.5) there was a mix of wet and dry signals in the streamflow projections in both the Upper and Lower basin.
3.2. Further Analysis for Lees Ferry
Specific results of historical flows (using the entire record from 1907–2021) and climate projections (RCP 4.5 and 8.5) are presented in Figure 4, Figure 5 and Figure 6 for Lees Ferry. This is the most critical station in the Colorado River basin and represents the dividing point between the Upper and Lower basin located downstream of Lake Powell (Glen Canyon Dam).
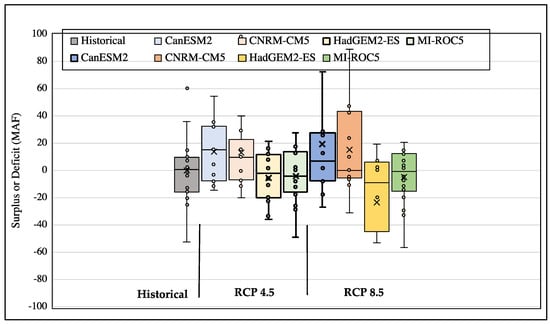
Figure 4.
Boxplot of cumulative deficit and surplus (MAF) for all years and all RCP 4.5 and 8.5 scenarios and all models (CanESM2, CnRM-CM5, HadGEM2-ES, MI-ROC5) at Lees Ferry. (Note: 1 MAF = 1233 million cubic m).
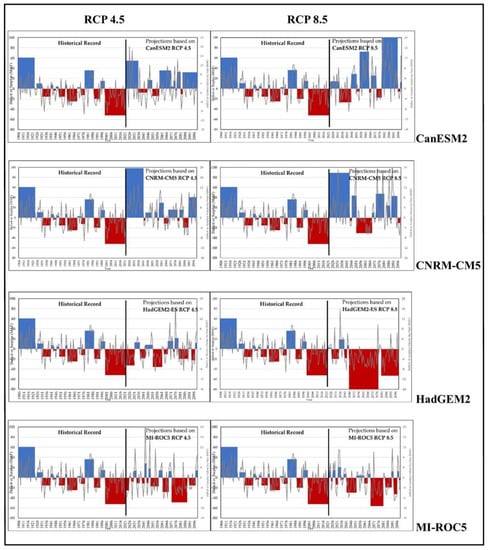
Figure 5.
Time series of historical and future projections at Lees Ferry for all scenarios. Blue areas are surplus periods and red areas are deficit periods. (Note: 1 MAF = 1233 million cubic m).
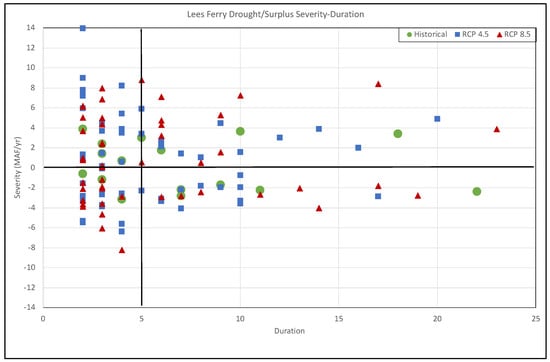
Figure 6.
Scatter plot of duration vs. severity for historical and all RCP 4.5 and 8.5 scenarios at Lees Ferry. (Note: 1 MAF = 1233 million cubic m).
The variation in surplus and deficit quantities is presented with boxplots in Figure 4. Each boxplot represents the population of droughts and surplus for the specified scenario. For the CanESM2 and CNRM-CM5 models (RCP 4.5 and 8.5), the overall tendency is more surplus (positive flows) periods. For instance, the 25th, 50th and 75th percentiles change from historical values of −15, 0, 10 MAF, respectively, to values under CNRM-CM5 (RCP 8.5) of −5, 0, 43 MAF, respectively. For the HadGEM2-ES and MI-ROC5 (RCP4.5 and 8.5) scenarios, the overall tendency was more deficit (negative flows) periods. For instance, the 25th, 50th and 75th percentiles change from historical values of −15, 0, 10 MAF, respectively, to values under HadGEM2-ES (RCP 8.5) of −44, 0, 6 MAF, respectively. In Figure 4, it appears there is a large range in values (i.e., larger box) in the RCP 8.5 scenarios as compared to RCP 4.5. This is further evaluated in Figure 6.
Further representation of model specific variations at Lees Ferry is shown in Figure 5 for all models and RCP 4.5 and 8.5. As noted earlier, the CanESM2 and CNRM-CM5 are wetter scenarios, and HadGEM2 and MI-ROC5 are drier. Example scenarios include a range of surplus periods for CanESM2 (RCP 8.5) with durations of 17 to 2 years and magnitudes of 143 to 2 MAF compared to historical surpluses with durations of 18 to 3 years and magnitudes of 61 to 3 MAF. Similar example scenarios include a range of deficit periods for HadGEM2 (RCP 8.5) with durations of 32 to 3 years and magnitudes of −123 to −18 MAF compared to historical surpluses with durations of 22 to 2 years and magnitudes of −52 to −1 MAF. This indicates more extreme surplus and deficit periods in the future when an ensemble of all models is used.
The severity (defined as magnitude divided by duration) of drought and surplus for all scenarios in comparison to the historical data is presented in Figure 6. The green circles represent the historical drought and surplus periods (16 total) ranging from −3.1 to 3.9 MAF/year with durations from 2 to 22 years. Under future conditions, maximum drought and surplus severity increases to levels of −8.2 to 14.0 MAF/year. The number of drought and surplus periods is also noteworthy. In the historical record, there are eight (8) drought and eight (8) surplus periods. Where in the future record for RCP 4.5 (8.5), there are 26 (22) drought periods and 30 (26) surplus periods. Thus, the ensemble of model scenarios shows a slightly wetter condition for Lees Ferry and more extreme drought and surplus periods. Many of these are under 5 years in duration reflecting the rapidly changing conditions in the future.
4. Discussion
In this study, historical and future streamflow projections for the Colorado River basin were evaluated with a perspective of drought and surplus periods. The results of this study conform with past studies of the region. For instance, Lynam and Piechota [20] and Pierce et al. [19] found that the HadGEM2-ES model had drier conditions (lower streamflow) in California and CNRM-CM5 model to have wetter conditions (higher streamflow). The results for the Colorado River basin in this research have similar signatures in the model output for streamflow projections at Lees Ferry (i.e., surplus flows for CNRM-CM5 and drier flows for HadGEM2-ES). This does highlight the potential of either connections between California basins and Colorado River, and/or similarities in which models before well in the western United States for climate change studies. This also highlights the range of climate scenarios that can be provided from GCMs. In general, Pierce et al. [19] found that all the GCMs had warming in the future, but some of the models were warming at higher levels than others and the cooler/wetter models were less warm. This range in model scenarios could be viewed as contradictory, or it could be viewed as a measure of the uncertainty of potential future projections. This does have implications on water management as the range of future conditions are planned for and assigned levels of risk.
Other research in the Colorado River basin has shown the potential for declines at Lees Ferry under future climate ensemble mean projections below a critical threshold of 13.8 MAF [11]. The results in the study presented here show many scenarios are above this threshold (i.e., wetter conditions) and highlight the importance of understanding the appropriate models for the region. It is noteworthy that some of the previous studies [12] have shown the change in seasonal runoff with higher streamflow (10–20%) occurring during the December–March period and less during the critical April–July period. This may be important in establishing the timing of future streamflow under warmer conditions. In addition, other studies use many models (32) from CMIP5 which adds to the variability shown in results. It is believed that the study presented here is a more focused approached that has specific results for certain model scenarios. This will lead to a better understanding of climate change impacts in the western United States.
Various studies have confirmed the wet signal identified in the research presented here. Hoerling et al. [9] noted an increase in the median precipitation from CMIP5 projections for both RCP 4.5 and 8.5 precipitation over Colorado by the middle of the 21st century. Ayers et al. [21] showed higher precipitation projections in CMIP5 (compared to CMIP3) along with streamflow for the Upper Colorado River basin. Lukas et al. [22] also noted this potential for higher streamflow along with an earlier snowmelt
5. Conclusions
The research presented here provides interesting findings related to how the Colorado River may respond to future climates. While the results are not always consistent in terms of how drought or surplus periods will change in the future, the intensity (as measured by magnitude and duration) will likely increase for both RCP 4.5 and 8.5. There did not appear to be large difference between the results for the RCP 4.5 and RCP 8.5 scenarios. There were more pronounced differences between models where the CanESM2 and CNRM-CM5 models had a wet signal, and HadGEM2 and MI-ROC5 models had a dry signal. The spatial results for the Had-GEM2 and MI-ROC5 were not as consistent (i.e., mix of dry and wet) as the CanESM2 and CNRM-CM5 scenarios which were mostly wet. Most interesting results were for the Lees Ferry station where models indicate a chance of higher drought and surplus length and magnitude on the order of two times the historical period. It was a surprise that the future mean ensemble water flow for the Lees Ferry was approximately 3–10% of the historical and highlights the sensitivity of record length used in the analysis.
The hydroclimatology and future water supply of the Colorado River basin is an active area of research, discussion and management. While there remains a lot of uncertainties with future projections, the future will likely have more extremes (wet and dry). These uncertainties include the large-scale climate models that are downscaled for local climate conditions and the different hydrologic modeling methods (e.g., physically based, distributed, semi-distributed, statistical). Regardless, the results of this study, highlight that the future may have extended dry or wet periods that were not always seen in the historical (or paleo) record and may question the use of paleo records given that future climates may look very different. Having the appropriate management and infrastructure options available will be critical to adapt to these changes.
Author Contributions
Conceptualization, R.B. and T.P.; methodology, R.B. and T.P.; formal analysis, R.B.; writing—original draft preparation, R.B. and T.P.; writing—R.B. and T.P.; All authors have read and agreed to the published version of the manuscript.
Funding
This research received no external funding.
Institutional Review Board Statement
Not applicable.
Informed Consent Statement
Not applicable.
Data Availability Statement
Data for this study was access at the U.S. Geological Survey (USGS) NWISWeb Data retrieval (Available online: https://waterdata.usgs.gov/nwis/, accessed on 1 January 2022) and available at the Bureau of Reclamation who maintains natural flow that accounts for consumptive uses and losses. (Available online: https://www.usbr.gov/lc/region/g4000/NaturalFlow/index.html, accessed on 1 January 2022).
Acknowledgments
We would like to thank Chapman University for providing the opportunity to author this research as part of the Research and Creative Activity Course (491 in Spring 2022). Piechota acknowledges the sabbatical support from Chapman University.
Conflicts of Interest
The authors declare no conflict of interest.
References
- Western Resources Advocates. Protecting the Colorado River Through Smarter Water Management Throughout the West. 2022. Available online: https://westernresourceadvocates.org/colorado-river-basin/ (accessed on 1 June 2022).
- Bureau of Reclamation. Interior Department Announces Actions to Protect Colorado River System, Sets 2023 Operating Conditions for Lake Powell and Lake Mead. Available online: https://www.usbr.gov/newsroom/news-release/4294 (accessed on 1 June 2022).
- Christensen, N.S.; Wood, A.W.; Voisin, N.; Lettenmaier, D.P.; Palmer, R.N. The Effects of Climate Change on the Hydrology and Water Resources of the Colorado River Basin. Clim. Chang. 2004, 62, 337–363. [Google Scholar] [CrossRef]
- Rajagopalan, B.; Nowak, K.; Prairie, J.; Hoerling, M.; Harding, B.; Barsugli, J.; Udall, B. Water Supply Risk on the Colorado River: Can Management Mitigate? Water Resour. Res. 2009, 45. [Google Scholar] [CrossRef]
- Miller, W.P.; Piechota, T.C. Trends in Western U.S. Snowpack and Related Upper Colorado River Basin Streamflow. J. Am. Water Resour. Assoc. 2011, 47, 1197–1210. [Google Scholar] [CrossRef]
- Miller, W.P.; Butler, R.A.; Piechota, T.C.; Prairie, J.; Grantz, K.; DeRosa, G.M. Water Management Decisions using Multiple Hydrologic Models within the San Juan River Basin Under Changing Climate Conditions. J. Water Resour. Plan. Manag. 2012, 138, 412–420. [Google Scholar] [CrossRef]
- Dettinger, M.; Udall, B.; Georgakakos, A. Western Water and Climate Change. Ecol. Appl. 2015, 25, 2069–2093. [Google Scholar] [CrossRef] [PubMed]
- McCabe, G.J.; Wolock, D.M.; Pederson, G.T.; Woodhouse, C.A.; McAfee, S. Evidence that recent warming is reducing upper Colorado River flows. Earth Interact. 2017, 21, 1–14. [Google Scholar] [CrossRef]
- Hoerling, M.; Barsugli, J.; Livneh, B.; Eischeid, J.; Quan, X.; Badger, A. Causes For the Century-Long Decline in Colorado River Flow. J. Clim. 2019, 32, 8181–8203. [Google Scholar]
- Udall, B.; Overpeck, J. The Twenty-First Century Colorado River Hot Drought and Implications for the Future. Water Resour. Res. 2017, 53, 2404–2418. [Google Scholar] [CrossRef]
- Woodhouse, C.A.; Smith, R.M.; McAfee, S.A.; Pederson, G.T.; McCabe, G.J.; Miller, W.P.; Csank, A. Upper Colorado River Basin 20th Century Droughts Under 21st Century Warming: Plausible Scenarios for the Future. Clim. Serv. 2021, 21, 100206. [Google Scholar] [CrossRef]
- Bureau of Reclamation. West-Wide Climate and Hydrology Assessment, Technical Memorandum No. ENV-2021-011. March 2021. Available online: https://www.usbr.gov/climate/secure/docs/2021secure/westwidesecurereport.pdf (accessed on 1 June 2022).
- Wallis, J.R.; Lettenmaier, D.P.; Wood, E.F. A Daily Hydroclimatological Data Set for the Continental United States. Water Resour. Res. 1991, 27, 1657–1663. [Google Scholar] [CrossRef]
- Tootle, G.A.; Piechota, T.C.; Singh, A.K. Coupled Interdecadal and Interannual Oceanic/Atmospheric Variability and United States Streamflow. Water Resour. Res. 2005, 41, W12408. [Google Scholar]
- Bureau of Reclamation. Downscaled CMIP3 and CMIP5 Hydrology Projections—Release of Hydrology Projections. 2014. Available online: https://gdo-dcp.ucllnl.org/downscaled_cmip_projections/techmemo/BCSD5HydrologyMemo.pdf (accessed on 1 January 2022).
- Maurer, E.P.; Wood, A.W.; Adam, J.C.; Lettenmaier, D.P. A Long-Term Hydrologically Based Dataset of Land Surface Fluxes and States for the Conterminous United States. J. Clim. 2002, 15, 3237–3251. [Google Scholar] [CrossRef]
- Riahi, K.; Rao, S.; Krey, V.; Cho, C.; Chirkov, V.; Fischer, G.; Rafaj, P. RCP 8.5—A Scenario of Comparatively High Greenhouse Gas Emissions. Clim. Chang. 2011, 109, 33–57. [Google Scholar]
- U.S. Global Change Research Program (USGCRP). Impacts, Risks, and Adaptation in the United States: Fourth National Climate Assessment, Volume II; U.S. Global Change Research Program: Washington, DC, USA, 2018. [Google Scholar]
- Pierce, D.; Kalansky, J.; Cayan, D. Climate, Drought, and Sea Level Rise Scenarios for California’s Fourth Climate Change Assessment; Scripps Institution of Oceanography: La Jolla, CA, USA, 2018; pp. 52–56. Available online: https://www.energy.ca.gov/sites/default/files/2019-11/Projections_CCCA4-CEC-2018-006_ADA.pdf (accessed on 1 January 2022).
- Lynam, L.; Piechota, T. California Drought Outlooks Based on Climate Change Models’ Effects on Water Availability. Water 2021, 13, 3211. [Google Scholar] [CrossRef]
- Ayers, J.; Ficklin, D.L.; Stewart, I.T.; Strunka, M. Comparison of CMIP3 and CMIP5 Projected Hydrologic Conditions over the Upper Colorado River Basin. Int. J. Climatol. 2016, 36, 3807–3818. [Google Scholar] [CrossRef]
- Lukas, J.; Barsugli, J.; Doesken, N.; Rangwala, I.; Wolter, K. Climate Change in Colorado: A Synthesis to Support Water Resources Management and Adaptation; University of Colorado; Colorado Water Conservation Board; Western Water Assessment, 2014; 114p., Available online: https://wwa.colorado.edu/climate/co2014report/Climate_Change_CO_Report_2014_FINAL.pdf (accessed on 1 June 2022).
Publisher’s Note: MDPI stays neutral with regard to jurisdictional claims in published maps and institutional affiliations. |
© 2022 by the authors. Licensee MDPI, Basel, Switzerland. This article is an open access article distributed under the terms and conditions of the Creative Commons Attribution (CC BY) license (https://creativecommons.org/licenses/by/4.0/).