Article

Analyzing the Bitcoin Network: The First Four Years

Institute of Information Systems, Humboldt-Universität zu Berlin, Spandauer Str. 1, 10178 Berlin, Germany
*
Author to whom correspondence should be addressed.
Future Internet 2016, 8(1), 7; https://doi.org/10.3390/fi8010007
Submission received: 4 October 2015 / Revised: 19 December 2015 / Accepted: 2 February 2016 / Published: 7 March 2016

Abstract

:
In this explorative study, we examine the economy and transaction network of the decentralized digital currency Bitcoin during the first four years of its existence. The objective is to develop insights into the evolution of the Bitcoin economy during this period. For this, we establish and analyze a novel integrated dataset that enriches data from the Bitcoin blockchain with off-network data such as business categories and geo-locations. Our analyses reveal the major Bitcoin businesses and markets. Our results also give insights on the business distribution by countries and how businesses evolve over time. We also show that there is a gambling network that features many very small transactions. Furthermore, regional differences in the adoption and business distribution could be found. In the network analysis, the small world phenomenon is investigated and confirmed for several subgraphs of the Bitcoin network.

Graphical Abstract

1. Introduction

Bitcoin is an important electronic and decentralized cryptographic currency system proposed by Satoshi Nakamoto [1]. It is based on a peer-to-peer architecture and there is no need for a central authority or central bank to control the money supply within the system [2]. Bitcoin relies on a proof-of-work system to verify and authenticate the transactions that are carried out in the network. For further verification purposes all transactions are public [2]. On the high economic relevance of Bitcoin cf. a plethora of online press articles such as those at the website of The Economist [3].
In this article, we analyze the public transaction history of the first four years of Bitcoin with respect to economic and network aspects. We have chosen this time period in order to limit the amount of data to be analyzed and to have a specific time frame that can be compared with later analyses in future work. This period gives valuable insights into the birth of an important electronic currency. The objective is to investigate the evolution of the Bitcoin economy during this initial period by enriching the data from the public ledger with off-network data such as business categories and geo-locations. These novel analyses supersede some preliminary results [4], especially in the geographic dimension, give insights on the business distribution by countries and how businesses evolve over time in the network. The descriptive statistics reveal what the major Bitcoin businesses and markets are. Furthermore, regional differences in the business distribution could be found. In the network analysis, the small world phenomenon is investigated and is established for several subgraphs of the Bitcoin network. The analysis of the degree distribution and power law on the time, business, and country aggregation level reveals that large portions of the network follow a power law distribution and can be considered as scale-free networks. Moreover, further network characteristics will be investigated.
This paper is structured as follows. In Section 2, we will give an introduction into the technology of Bitcoin and the major entities and roles of this economy. In Section 3, related work is discussed. Section 4 presents the methods used in our study, in particular the data collection and storage and the metrics from social network analysis and graph theory that are applied in the later analysis. The empirical data we collected, its structure and refinement are presented in Section 5. Section 6 presents the results of our investigation, starting with the business-related analyses before turning the focus to the network structure of Bitcoin transactions. Section 7 concludes the article with a discussion of limitations and an outlook on future work.

2. Bitcoin Technology and Economy

A Bitcoin can be defined as a chain of digital signatures. By transferring the electronic coin to the next user it gets digitally signed with a hash of the previous transaction and the public key of the next owner; adding these together to the end of the Bitcoin. The signatures can be verified by the payee to prove the chain of ownership [1].
To avoid inflation in the system, a unique feature of the currency is that it has a predetermined limited number of 21 million coins in circulation. Until that point, which might be reached around the year 2140, the money supply will increase at a certain rate [5]. To provide some sort of anonymity, direct personally identifiable information is omitted from the transaction. Therefore, the source and destination address are encoded in the form of public keys. Every public key that serves as a pseudonym has a corresponding private key which is stored in the electronic wallet. These are used to sign or authenticate any transactions. To become part of the peer-to-peer network, one needs to have a client software that runs either on the own device or as cloud service [6].
A node in the network will not accept multiple transactions using the same inputs. The nodes accept only the first transaction they receive and reject all subsequent. This is done to prevent double spending from malicious users and is part of the proof-of-work concept [5].
The main idea behind the proof-of-work system is to make it expensive for a single user or a group of users to rewrite the history of transactions once it has been accepted as definite. This should prevent malicious users from double spending their Bitcoins [6].
The solution that Nakamoto [1] proposed is the use of a timestamp server that takes the hash of a block of items, timestamps it, and widely publishes the hash. The proof of work involves using hash algorithms such as SHA-256 to find a specific value. The objective is to increment a nonce in the block until a value is found that results in a required number of zero bits. The average work to do so is exponential with the number of zero bits, but the result can be easily verified. There is a predetermined target difficulty that is updated for every 2016 blocks that have been generated. This ensures that the time it takes to generate one block is on average about 10 min. The block is only accepted by users if all transactions in it are valid and the Bitcoins have not been spent previously. Users show their acceptance by using the newly found hash in the “previous hash” section of the next block they attempt to generate; thus adding a new block to the chain. This chain is called the block chain or transaction log and contains the entire history of all transactions that have been carried out in the network [5].
The generation of blocks by users is called mining and is achieved through providing a certain amount of computation power to the network to solve the proof-of-work problem. The expending of computation power is rewarded when generating a block. There is competition to get the reward, and the more computation power a user or group possesses the better the chance to get it. The reward is predetermined and started at 50 BTC. It will decrease by half every 210,000 blocks. In that way new Bitcoins are introduced to the network. This procedure will continue until the predetermined final amount of 21 million Bitcoins is in circulation, around the year 2140.
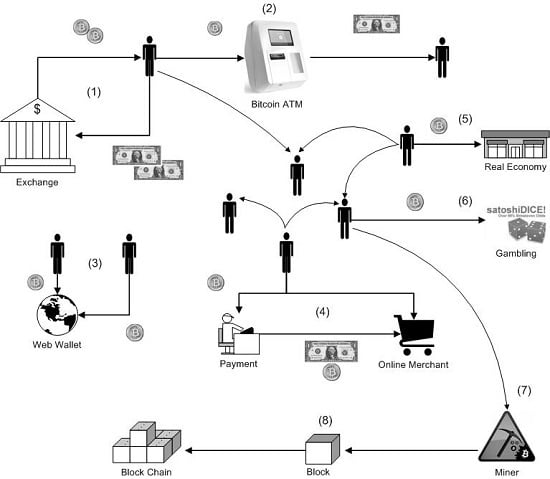
Figure 1 shows a general overview of the Bitcoin economy with its major participants. Users can exchange their fiat currencies into Bitcoins via exchange platforms or local exchanges (1); withdraw money from recently introduced Bitcoin ATMs (2); store Bitcoins in an online wallet (3); use payment services in transactions with online merchants (4); pay with Bitcoins in local shops or bars (5); gamble with Bitcoins on various gaming platforms (6); incorporate transactions in a block, called mining (7); thus verifying the transactions and publish it to the network via the block chain (8).
There is a vast amount of merchants and services that already accept Bitcoins as a currency in exchange for their offerings. The services can be mainly categorized into exchanges, wallets, mining, payments, gambling, and vendors.
  • Exchanges: on exchanges one can trade their fiat currencies, other crypto currencies, and even gold into Bitcoins. The exchange platforms are mainly electronic but there are also local exchanges.
  • Wallets: web wallets are similar to banks in the real economy where Bitcoins owned by users can be centrally stored on online platforms. The major advantage is that users can access their Bitcoins from every device connected to the web and have less effort to protect their wallet.
  • Mining: mining is the contribution to the coin generation process, mainly executed in a mining pool. For a definition and comparison of mining pools see [7]. In such mining pools, miners share their computing resources and each participant receives a reward for the particular contribution of computing power.
  • Payments: payment services enable online merchants to accept Bitcoins in the same way as they accept Visa or Paypal payments in their local currency. It reduces transaction costs, avoids chargebacks, Bitcoin exchanges rate risks, and identity thefts.
  • Gambling: gambling services offer a wide variety of online games such as dice games, roulette, and other casino related games where users can gamble with their Bitcoins.
  • Vendors: via online merchants users can exchange their Bitcoins for almost every kind of product such as multimedia content, electronics, travel, gift cards, clothing etc. There are also vendors that function as marketplaces such as Ebay.
The nature of Bitcoin services is quite unstable due to regulations or unsecure platforms that facilitate theft. The online merchant Silk Road was shut down because of trading illegal goods while the online wallet services MyBitcoin and Instawallet were closed due to several thefts [8].

3. Related Work

Most of the recent research focuses on the de-anonymization of Bitcoin users by introducing clustering heuristics to form a user network. To gain knowledge and get novel insights about the economic relationships between users this is an essential criterion. Furthermore, linking external information, relate to executed transactions, is an important step in analyzing the Bitcoin economy.
Reid and Harrigan [2] developed a clustering heuristic to form a user network by creating meaningful groups of users out of the vast amount of pseudonymous addresses (public keys) involved in transactions. The main idea is that multiple inputs of different public keys into a single transaction probably belong to the same user since the use of the corresponding private keys is highly coordinated. In order to construct the user network, all public keys that belong to the same user need to be clustered into one node or user entity. This user network represents the flow of Bitcoins between users over time. This clustering heuristic holds true if users do not share their private keys, but this is not always the case, for example in the case of web wallets that pool many private keys and would therefore mistakenly be clustered as a single user [9]. The clustering approach was extended by Androulaki et al. [10] who use another property in the Bitcoin protocol that is more complex but not that reliable in comparison to multi-input transactions. Since Bitcoins transacted from a single address need to be fully spent, the change is collected back to a newly generated address, the “shadow” or “change” address. In a transaction with two outputs, where one address has never appeared before in the block chain while the other address is public in the block chain, one can assume that the new address belongs to the user who initiated the transaction [10]. This approach is very reliable under the assumption that users rarely issue transactions to two different users. Pay-outs from mining pools or bets on gaming sites are examples where this is not always the case. Hence, Meiklejohn et al. [8] refined the clustering heuristics to account for these and other circumstances to increase the reliability.
Beside the clustering heuristics one want to add further information (e.g., IP addresses, geo-locations, businesses, and trade data from exchanges), which are related to transactions, to the user network. In their research Reid and Harrigan [2] also proposed several methods to overcome anonymity including the integration from off-network information such as email addresses, shipping addresses, IP addresses, or bank and credit card details. This information is mainly held by businesses that accept Bitcoin as payment and other services like exchanges, laundry services and mixers. The researchers use a number of publicly available sources and integrate their information with the user network. For instance, they scraped the web site Bitcoin Faucet over time and were able to associate IP addresses with the public keys involved in the transaction. Thus, they could plot a map of geo-located IP addresses belonging to users who received Bitcoins over a period of one week and overlay it with the user network.
Another approach of getting an IP address related to a transaction, was introduced by Kaminsky [11]. It exploits a leakage at the TCP/IP layer in the Bitcoin system. When a user is connected to every node in the peer-to-peer network, then the first node that publishes a transaction can be safely assumed the initiator of it; thus, the related IP address can be linked to that user [11].
Ortega [12] downloaded and analyzed the publicly available IP addresses related to transactions from the site Blockchain.info for a short time horizon. The data was then linked to public known IP addresses from anonymizing services such as Tor and Proxies. The results show that around one percent of transactions could be related to anonymizing services.
One more valuable source of identifying information is the voluntary disclosure of public keys by users on Bitcoin forums or other social network sites such as Twitter streams [2].
Meiklejohn et al. [8] gathered external data from various Bitcoin services such as gambling, mining, exchanges, and vendors to link it with public keys that interact with those businesses. Therefore they engaged in 344 transactions with a wide variety of different types of services. Another approach they propose is the collection from publicly available sources where users claim their own addresses. The site Blockchain.info provides the information in a convenient way via tagging the transactions with the associated business. With the collected data and the applied clustering heuristics they were able to classify a vast number of transactions in the user network [8].
Spagnuolo [9] introduced a tool called BitIodine that includes several external data from various sources such as Mt.Gox, Bitcointalk, and Blockchain.info in the analysis of the Bitcoin network. Through the APIs from Mt.Gox and Blockchain.info and several scrapers the researcher is able to gather most recent data about the transactions and the associated Bitcoin users [9].
Linking external information to transactions and subsequently to the formed user network gives meaningful insights in transaction flows and the overall Bitcoin economy.

4. Methods

Data management and network metrics for our study are introduced in the following.

4.1. Data Collection and Management

The Python 2.7 [13] based data scraper [14] builds the Bitcoin user network from the Bitcoin data files generated by the official Bitcoin client [15]. The programming and execution of the tool was conducted by Brugere [16] and is therefore out of scope in this work, but part of the complete architecture.
For gathering additional data from the websites blockchain.info and ipinfo.io, which are related to Bitcoin transactions, two Java-based data scrapers were programmed with the workbench Eclipse SDK [17]. The data was managed using an Oracle 11g database system.
NetworkX [18] is a Python based software package, which provides a large number of algorithms to analyze complex networks. It also comes with the functionality to visualize networks. Packages that can be used for visualization include MatPlotLib (PyLab) [19] or PyGraphviz [20], a Python interface to the Graphviz graph layout and visualization package. The tool is an essential part in analyzing the Bitcoin user network. Another powerful tool for network analysis, and especially for visualization of networks, is Gephi [21]. The tool will be used to visualize interesting subgraphs of the Bitcoin network.
The software environment Cran-R [22] is used for a wide area of statistical computing and graphics. We use it in our study for explorative spatial data analysis. This requires specific packages that can handle geographic data and are able to produce plots of maps. The general package for spatial data is [23]. For reading geographic data such as shape files the package maptools [24] is required. To visualize colored maps according to variables, the package RColorBrewer [25] is adopted.

4.2. Network Metrics

Several network metrics are used to analyze the structure and the dynamics of the Bitcoin network.

4.2.1. Degree Distribution and Power Laws

The degree distribution captures the structure of the network in terms of the individual connectivity of nodes. The degree of a node can be calculated for ingoing and outgoing connections as well as the total, i.e., the sum of ingoing and outgoing connections of a node [26,27]. The degree distribution P ( k ) gives the probability that a randomly selected node has exactly the degree k . In random networks the majority of nodes have approximately the same degree, close to the average degree k ¯ of the network; thus following a Poisson distribution with a peak at P ( k ¯ ) [28].
In contrast to random networks, real networks, such as social networks, the Internet, or citation networks, often follow a power law or scale-free distribution. The power law in terms of networks states that there are is a non-negligible number of highly connected nodes even though the majority of nodes are low connected. The probability that a new incoming node connects to an existing node is proportional to the degree k of that node; hence, becoming a scale-free network. This can be expressed in the form P ( k )   ~   k a   where a denotes a constant and k is the degree of a node in the network [29,30,31].
An important way for investigating the long tail of high degree nodes is to use the cumulative distribution function, which is the probability that the degree is greater than or equal to k .
P ( k ) = k = k P ( k ) P ( k ) ~ k = k k a ~ k ( a 1 )
This has the advantage that all the original data is represented, in contrast to conventional histograms [30]. The cumulative distribution function P ( k ) also follows a power law but with an exponent of a 1 , which is one less than the original exponent a . The most common way to estimate a is fitting a slope of the line in plots of the cumulative distribution [31]. Power law distributions can be found in many real networks. Newman [31] summarized several of them, such as word frequency, citations, telephone calls, web hits, or the wealth of the richest people. Barabasi, Albert and Jeong [32] have investigated this phenomenon for the World Wide Web and Inaoka et al. [33] for financial transaction networks.

4.2.2. Clustering

The clustering coefficient measures the network’s transitivity. If a node A is connected to node B, and node B to node C, then there could be an increased probability that node A is also connected to node C. In the social network context this is described with: the friend of your friend is likely also your friend. In terms of network topology this reflects the presence of an increased number of triangles within the network [30]. A large number of networks show the tendency of such a formation between neighboring nodes in contrast to uncorrelated random networks. Equation (2) shows the formula for the local clustering coefficient (above) and for the average or global clustering coefficient (below).
C i = 2 T ( i ) k i ( k i 1 ) C G = 1 N i N C i
The local clustering coefficient C i is defined as the number of triangles in which node i participates normalized by the maximum number of such triangles. T ( i ) denotes the number of triangles through node i and k is the degree of node i . If C i = 0 then none of the neighbors of a node are connected, and if C i = 1 then all of the neighbors are connected.
The average clustering coefficient or global clustering coefficient C G is the mean of all local coefficients C i [34]. With the average clustering coefficient C G one can measure the global cliquishness in the graph. Watts and Strogatz [35] introduced the clustering coefficient to graphs as part of discovering the small world phenomenon within networks.

4.2.3. Shortest Path Length

The Average Shortest Path Length is defined as the average number of steps along the shortest paths for all possible pairs of nodes and measures the efficiency of information or mass transport in the network. Examples are the number of average clicks to reach a website or the people one has to communicate through in a social network to contact a complete stranger.
The average shortest path length is defined as follows. In a network G with a set of nodes N the shortest distance between node i and j ( i ,   j   N ) is defined as d i s t ( n i , n j ). If n i =   n j or n i cannot be reached from n j then d i s t ( n i , n j ) = 0 and if n i =   n j or there is no path between n i and n j then h a s _ p a t h ( n i , n j ) = 0. With the existence of a path from n i to n j , h a s _ p a t h ( n i , n j ) = 1 and the average shortest path length for network G ( A S P L G ) can be calculated as shown in Equation (3) (top).
A S P L G = i , j N d i s t ( n i , n j ) i , j N h a s _ p a t h ( n i , n j ) A S P L G = i , j N d i s t ( n i , n j ) N ( N 1 )
N denotes the number of nodes in network G , i , j N d i s t ( n i , n j ) is the value of all-pairs shortest path length of network G and i , j N h a s _ p a t h ( n i , n j ) is the number of paths that exist in the network G . For a connected undirected graph i , j N h a s _ p a t h ( n i , n j ) can be replaced by N ( N 1 ) as seen in Equation (5) (bottom), because paths exist between any pair of nodes [36].
The average shortest path length is used in combination with the average clustering coefficient to identify the small world phenomenon [35].

4.2.4. Centrality

Centrality measures the importance, influence or power of a node in the network and is widely applied in social network analysis. Important metrics have been introduced by Freeman [37]: degree centrality, betweenness centrality, and closeness centrality. Betweenness and closeness centrality count only geodesic paths, assuming that messages or transactions in a network flow only along the shortest possible paths. The eigenvector measure [38] counts walks, which assumes that trajectories can also revisit nodes and edges multiple times [39].
The degree centrality is based on the degree, i.e., the number of links or direct connections that one node i has. To compare the degree centrality among networks of different size, one has to normalize by dividing the measure by the maximum possible number of adjacent connections, N 1 (Equation (4), below).
C D ( n i ) = i N a i j C D ( n i ) = i N a i j N 1
Nodes with higher degree centrality C D ( n i ) or connections are more central to the network structure and tend to have more influence on others [37].
The betweenness centrality is based on the number of shortest paths passing through a node. Nodes with high betweenness play a central role in connecting different groups in a network. In Equation (5) g j k ( i ) is all geodesics linking node j and node k which pass through node i , and g j k is the geodesic distance between node j and k .
C B ( n i ) = j < k N g j k ( i ) g j k C B ( n i ) = j < k N g j k ( i ) g j k 1 2 N ( N 1 )
In social networks, nodes with high betweenness are the brokers and connectors that bring other groups in the network together. Nodes with the highest betweenness centrality measure result in the largest increase in a typical distance between others when they are removed [40]. The normalized version of the formula is shown in Equation (5) (bottom). It is normalized by the maximum number of pairs of nodes excluding the node itself [41].
The closeness centrality emphasizes the distance of a node to all other nodes in the network by focusing on the geodesic distance from each node to all others. Closeness centrality can be regarded as measure of how long it will take information to spread from a given node to others in the network. In Equation (6), C c ( n i ) is the closeness centrality and calculated by the sum of the inverse distances d ( n i , n j ) between two nodes in the network [40].
C c ( n i ) = i N 1 d ( n i , n j ) C c ( n i ) = [ i N d ( n i , n j ) N 1 ] 1
The node decentrality or inverse centrality grows when nodes are far apart, and centrality in this context means closeness. Information or other goods originated in the most central position of the network would spread throughout the network in minimum time. The most central node in the network is that with the minimum costs or time for communicating with all others. To remove the impact of the network size for comparability the formula is adjusted as seen in Equation (6) (bottom) [37].
The introduced centrality measures can be used to examine important hubs (degree) and brokers (betweenness) as well as to assess how efficiently information flows (closeness) within the network.

5. Data

The initial dataset that needs to be extracted is the Bitcoin transaction data, which is publicly available due to the proof-of-work concept for verification of transactions. This data can be scraped either from sites such as Blockexplorer.com or Blockchain.info, or by using a Bitcoin client that stores the entire transaction history (block chain). Secondly, additional data is scraped to enhance the dataset with meaningful information (e.g., IP, Geo, and Trade data) about transactions. In a third step, the data model is derived and loaded into the database. Figure 2 illustrates the data flow process.

5.1. Bitcoin Transaction Data

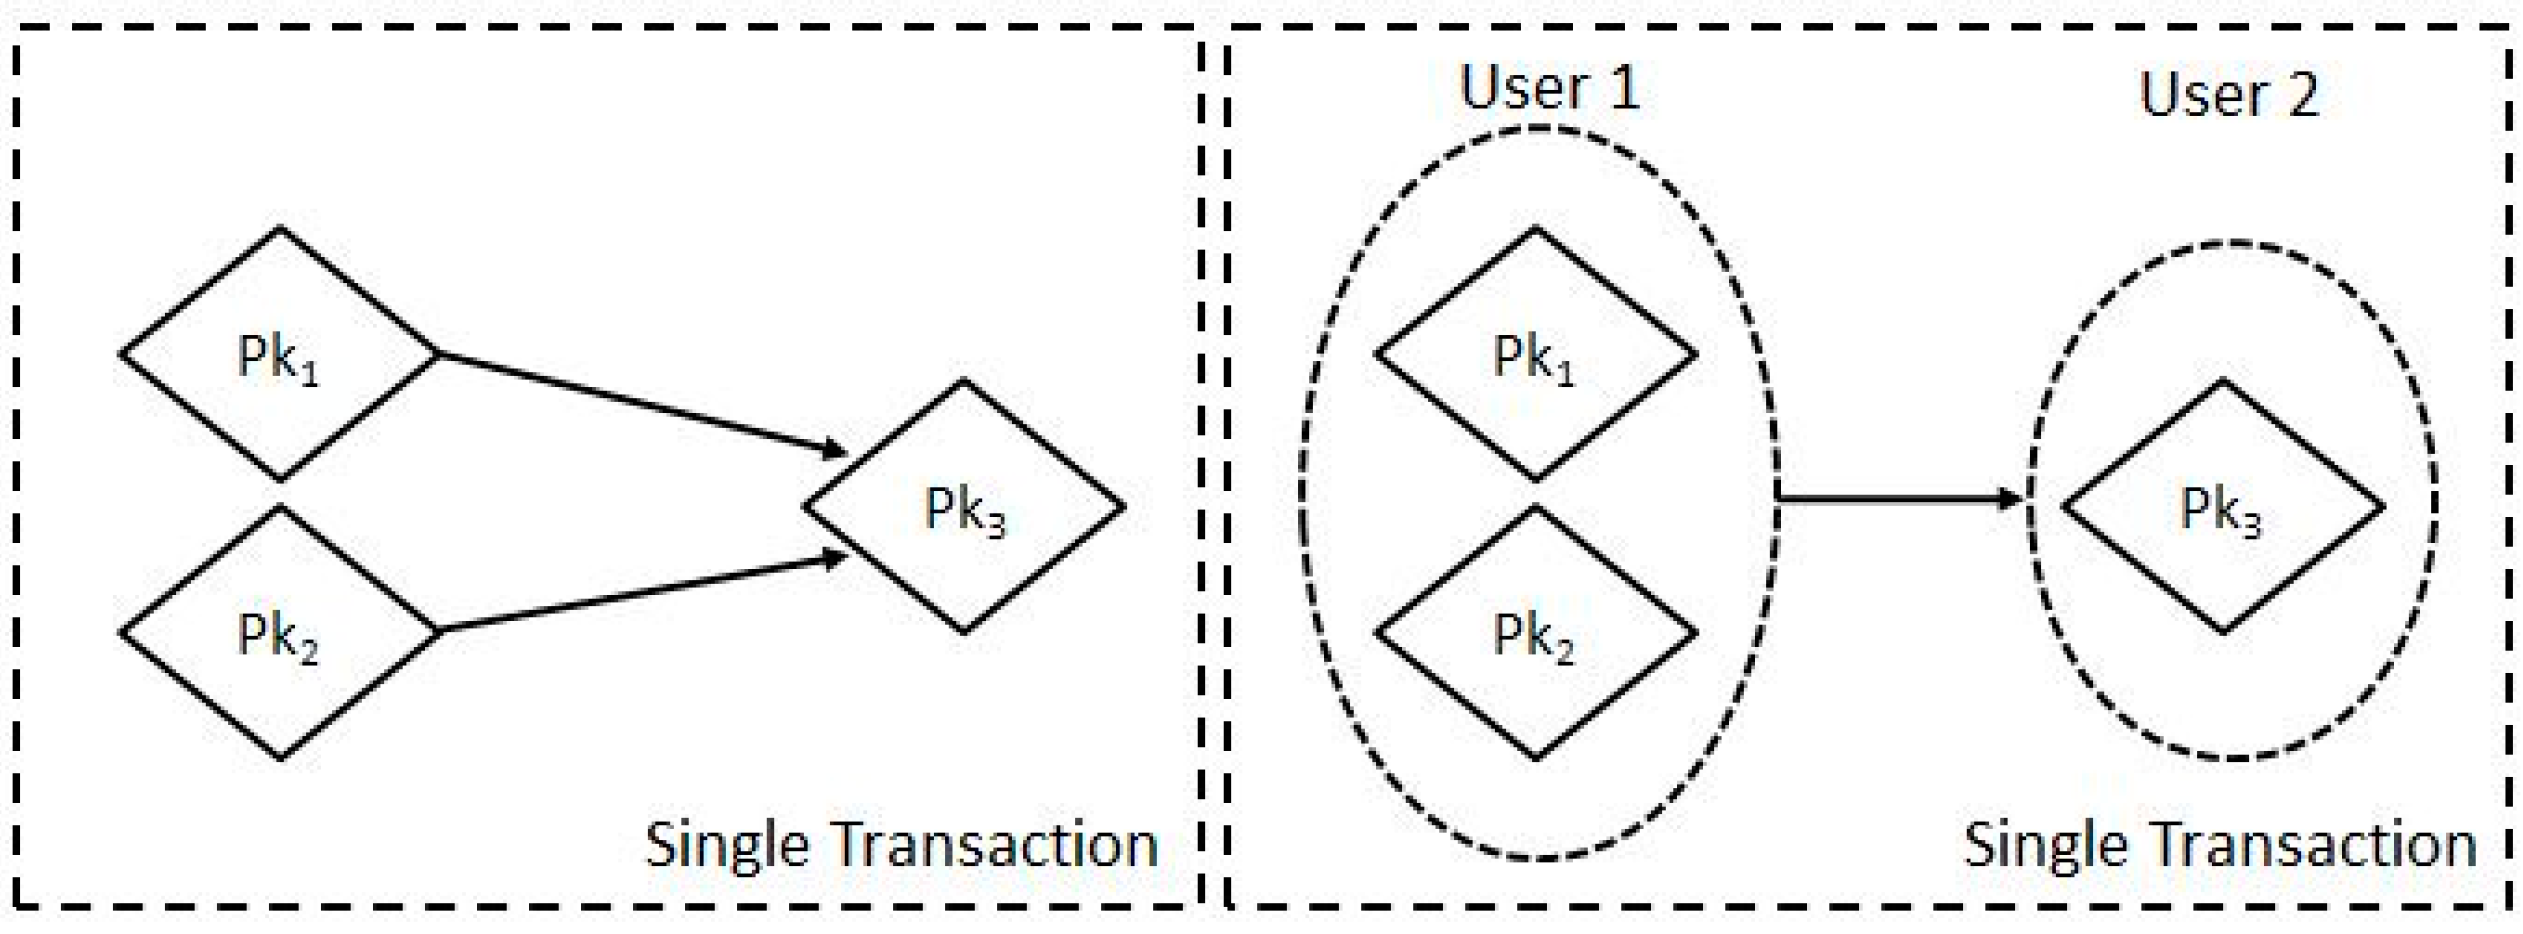
The transaction dataset that serves as a basis for this analysis was extracted from a full node Bitcoin client (version 0.5.3.1) with a Python 2.7 data scraper. The data scraper tool [42] from Brugere [16] extends the Bitcoin tools developed by Martin Harrigan and Gavin Andresen. With these extensions it is possible to create the user network that was introduced by Reid and Harrigan [2]. The tool processes the Bitcoin.dat binary files that are part of the synchronized Bitcoin client software and transforms it into human readable raw text files as CSV. The first group of files, public_key.txt and transaction_key.txt contain the real hash values used in transactions within the Bitcoin network. With these values, additional information to the public key or the transaction can be retrieved from sites like Blockchain.info or Blockexplorer.com. The user information is organized by the second group of files (input_transaction_keys.txt, input_public_keys.txt, and user_keys.txt), where a “user” is a grouping of public keys that were used as inputs into a single transaction (user owns the private key to each address) as proposed by Reid and Harrigan [2]. Each line in user_keys.txt is a grouping of public keys as illustrated in Figure 3.
The file user_edges.txt contains the primary network data, which includes the transaction key, the users (transaction from user_from to user_to) involved in this particular transaction, the time the transaction occurred in the block chain, and the transmitted value in Bitcoins of this transaction.
The initial data for this study originates from the data scraper execution by Brugere on the 10th April 2013 [16]. It contains 230,686 blocks and has the size of 1.51 GB, resulting in around 37.4 million edges and 6.3 million nodes.
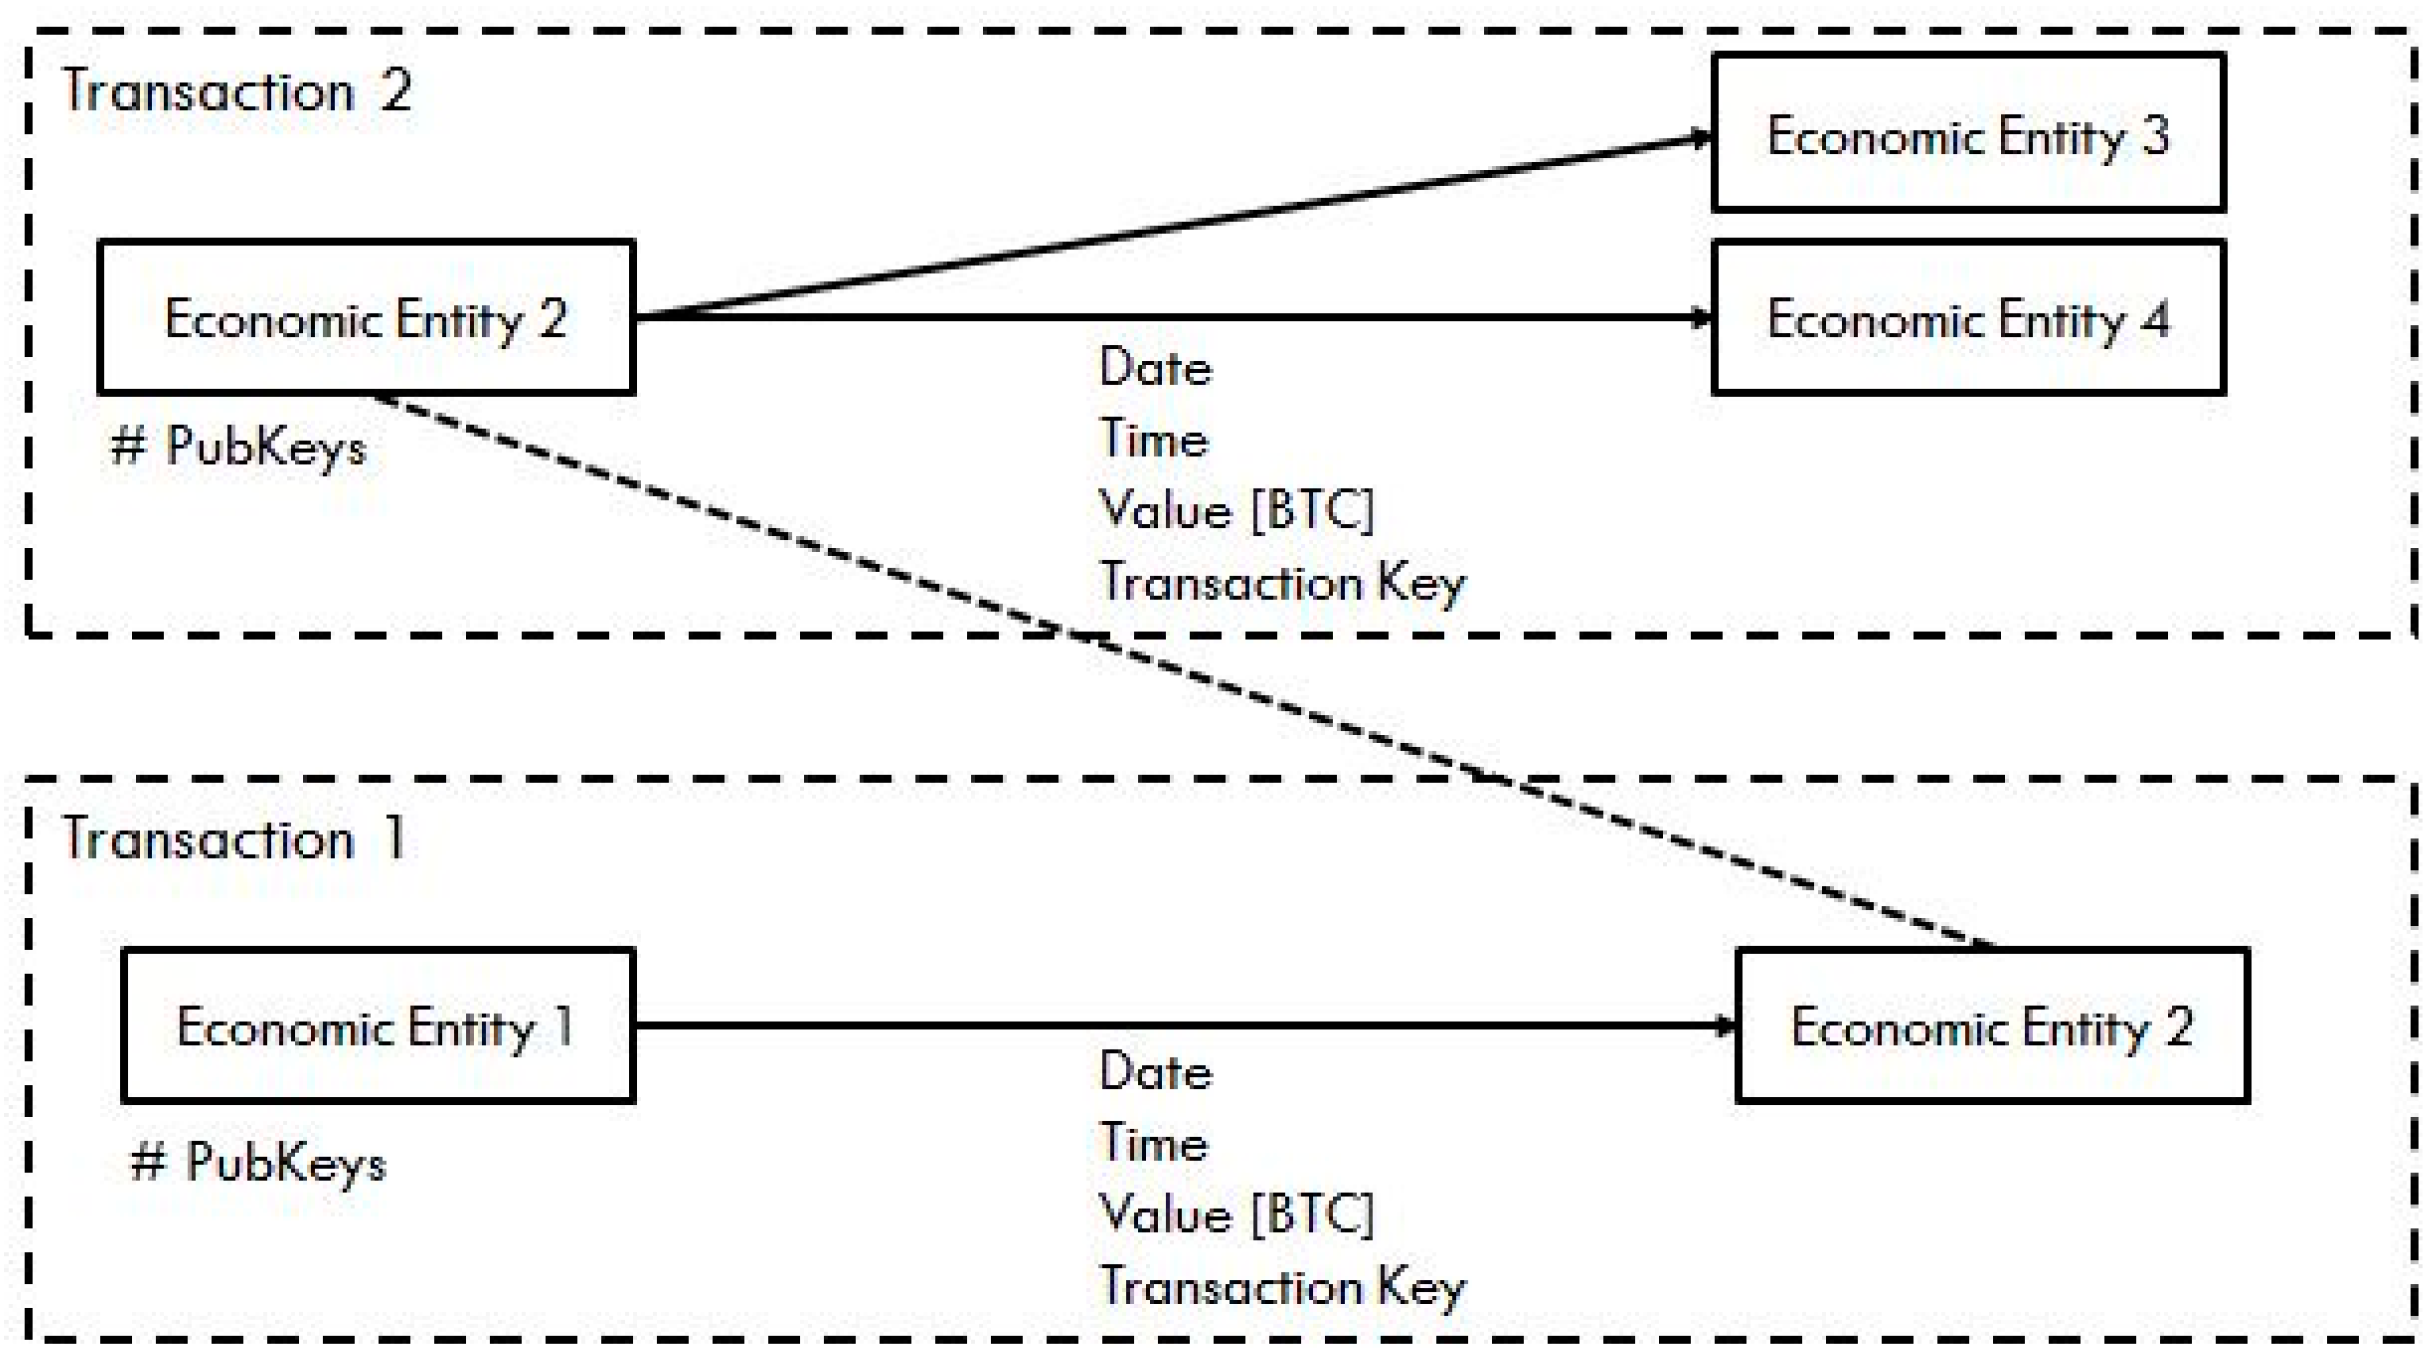
Users can be seen as economic entities with a certain size determined by their number of public keys. The transactions between these economic entities are the relationships or edges in the network that come with additional properties. A simplified illustration of the entity network with nodes, edges, and their respective properties of the Bitcoin transactions are shown in Figure 4.

5.2. Enriching the Dataset

To get more insight in the Bitcoin economy and the relationship between different entities and geographic regions, additional data related to transactions was scraped from several web sites. The retrieved information included the IP addresses from the initiators of transactions, a Business tag related to that particular transaction, the geo-location information from the IP addresses, anonymous Tor IP addresses, and trade data from the Mt.Gox exchange.

5.2.1. IP and Business Tags

The most relevant information needed for this study is the IP address and the business tag from the initiator of a transaction. With the IP address one can derive information on how transactions are distributed geographically and generate aggregations based on country, region, or city level. Blockchain.info publishes the “relayed by” IP address which is derived with techniques introduced by Kaminsky [11], which means that the first node that informs about a transaction is, with high probability, also the source of it.
The tag for public key addresses is provided voluntary by the owner and can be used to categorize and aggregate transactions on different business levels such as gambling, mining, or exchanging. The IP addresses and tags, as well as other information, related to transactions are publicly available and can be accessed via a JSON API (JavaScript Object Notation) [43]. This technique makes the information accessible in a convenient way. The only parameter that is needed is the real transaction key. Since there are over 15.8 million transactions, an unlimited API access was requested and granted by the Blockchain.info administrator. The built Java scraper executes an URL request with the required parameter and retrieves the data from the JSON format via regular expressions (java regex). With “rawtx” one gets all available information to a single transaction in JSON format, such as the block height, the transacted values and the public keys involved.
Around 400 thousand transactions and their respective IP and tag data could be retrieved per day; thus, it took over 40 days to scrap the entire data from Blockchain.info.

5.2.2. IP Geo-location

With the previously scraped IP addresses one can derive additional information about the geo location, hostname, or the organization that is related to the IP. The site ipinfo.io provides all this information in the JSON format and can be accessed with an API, in the same way as Blockchain.info. Therefore, a second java scraper was built to retrieve the data from ipinfo.io. The database query resulted in over 223 thousand distinct IP addresses used in around 15.8 million transactions.

5.2.3. Tor and Proxy Nodes

To obfuscate the IP address from transactions, some users adopt anonymous proxies, VPNs, or Tor. For the geo-location of IP addresses and their respective economic entities one has to identify transactions that were executed via the Tor network, because one cannot surely determine the location based on these IP addresses. Therefore, all current Tor server and Tor server exit node IP addresses were downloaded as CSV files from the site torstatus.blutmagie.de. Another site that provides a list of Tor servers is dan.me.uk/torlist, where an additional list of IP addresses was extracted. Besides the Tor network, there are other proxy services that can be used; hence, IP addresses from known proxy servers were extracted from the site vpngeeks.com/proxylist. Subsequently, a combined list of Tor and proxy IP addresses was created that contains around 960 Tor exit nodes, 11,000 Tor servers, and 950 proxy servers.

5.2.4. Trade Data

The trade data from one of the most liquid exchange platforms for Bitcoins give insights on the money in- and outflows of the Bitcoin economy. To get an appropriate time horizon according to the network data and an exchange rate of the preferred currency used in the economy, the trading platform Mt.Gox and the exchange rate BTC/USD were chosen. The site bitcoincharts.com [44] provides historical trading data from the BTC/USD exchange rate for the chosen time horizon 17th July 2010 to 23rd December 2013. The data contain the trading date, open, high, low, and close price, the trading volume in BTC and USD, and the weighted price. To analyze a particular trading day or special trades more thoroughly, the granularity can be adjusted down to one minute if preferred.

5.3. Final Data Model

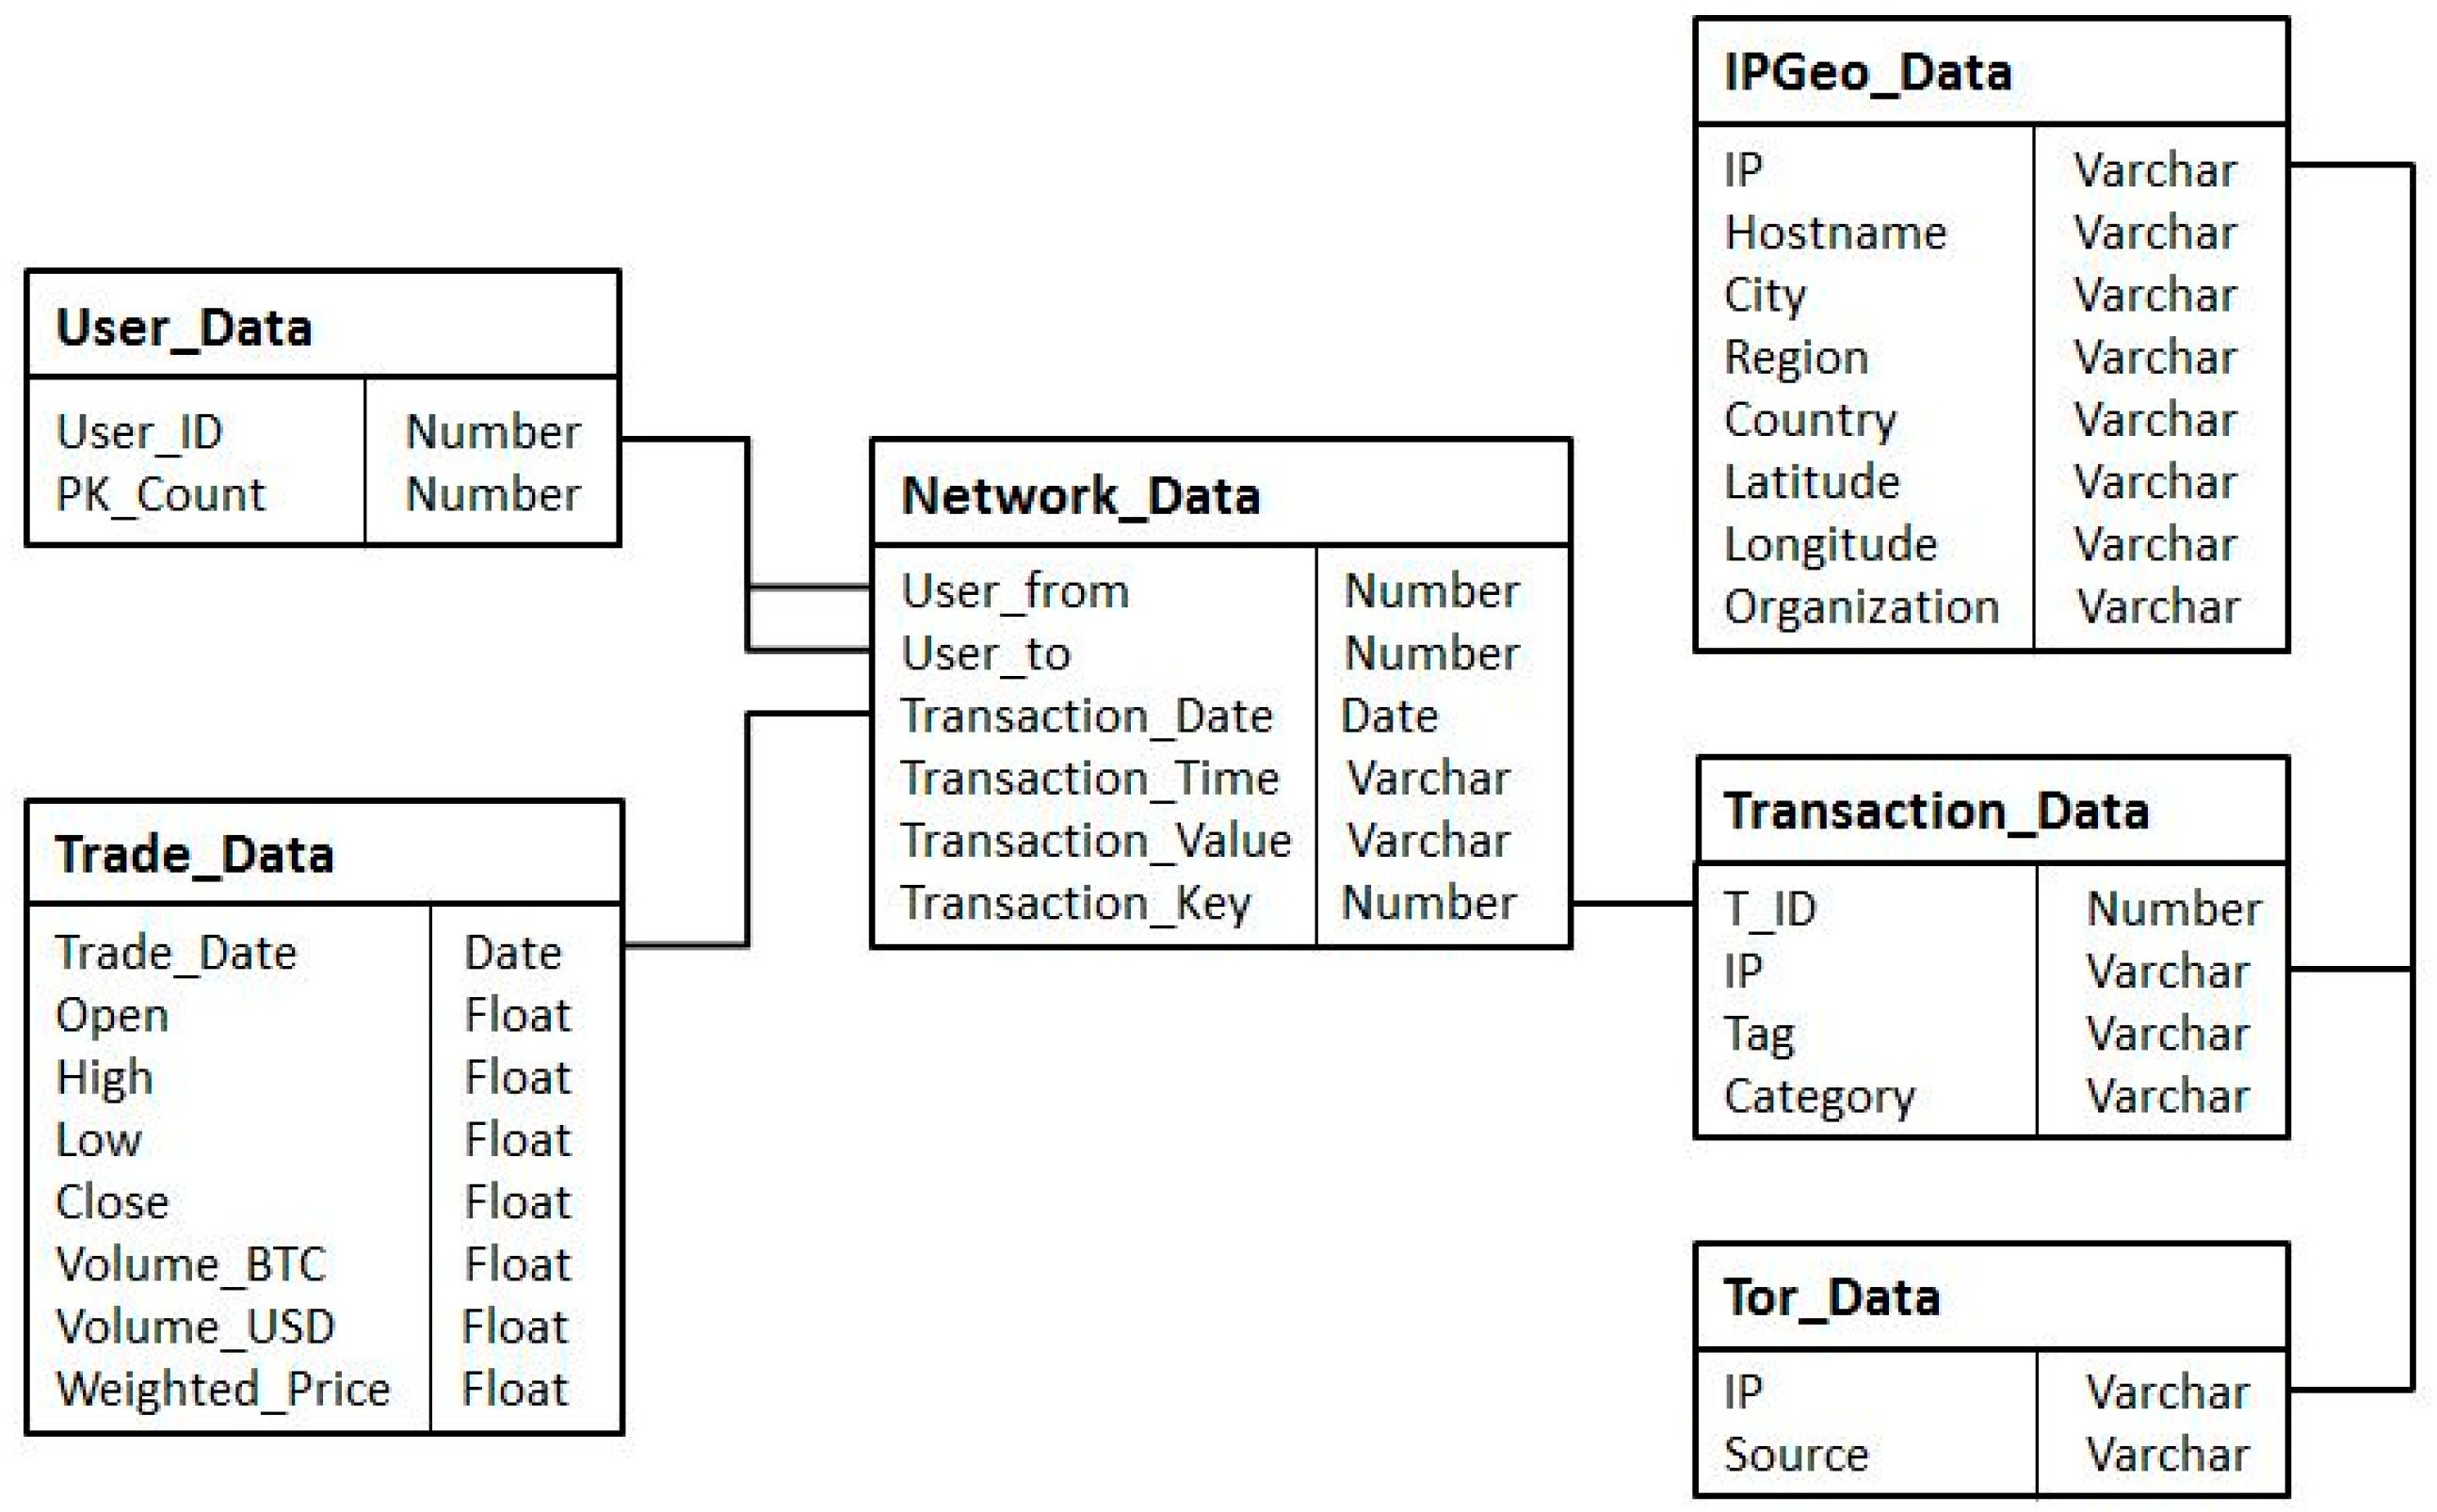
After extracting data from several web sites, one has to incorporate it into a data model that can be used for further analyses and aggregations. Figure 5 shows the final data model for this study that contains all relevant information. Model and data are loaded into the Oracle 11g database. The central table is the Bitcoin transaction network, which is enriched by transaction-related data.

6. Analysis and Results

In this section, the analyses on the previously introduced final data model are conducted. Several aggregations on the business category, geo-location and time level will be examined to get a thorough insight into the Bitcoin economy. Furthermore, the network metrics will be applied to analyze the structure of the Bitcoin economy and identify important hubs, clusters, brokers, and to investigate the existence of the small world phenomenon within the network.

6.1. Statistics

6.1.1. Bitcoin General Statistics

Table 1 comprises some general descriptive statistics of the network data. In the time from 3rd January 2009, when the first transaction was carried out, until the 10th April 2013, around 6.3 million user entities were engaged in over 15.8 million transactions in the Bitcoin network. Since users can spend Bitcoins with different amounts to many other nodes, the entire network has over 37.4 million relationships. Hence, the Bitcoin economy can be seen as a large-scale transaction network.
The statistics of the Bitcoin network were aggregated on a daily bases. The transaction value ranges from a minimum of 50 BTC (initial transaction) to almost 30 million BTC per day, which was reached on the 19th September 2012. The low median and mean as well as the high skewness indicate that the majority of executed transactions have very low values. On the 9th April 2013, the number of active users reached its peak (36,120) and can be related to the speculation hype at this time, resulting in a new record high on the exchange rate with around 201 BTC/USD. The highest number of transactions (189,284) on the network occurred in the same time horizon and was reached on the 3rd April 2013. The distributions of users and transactions indicate a rather low activity on an average daily bases in the network according to the statistics.
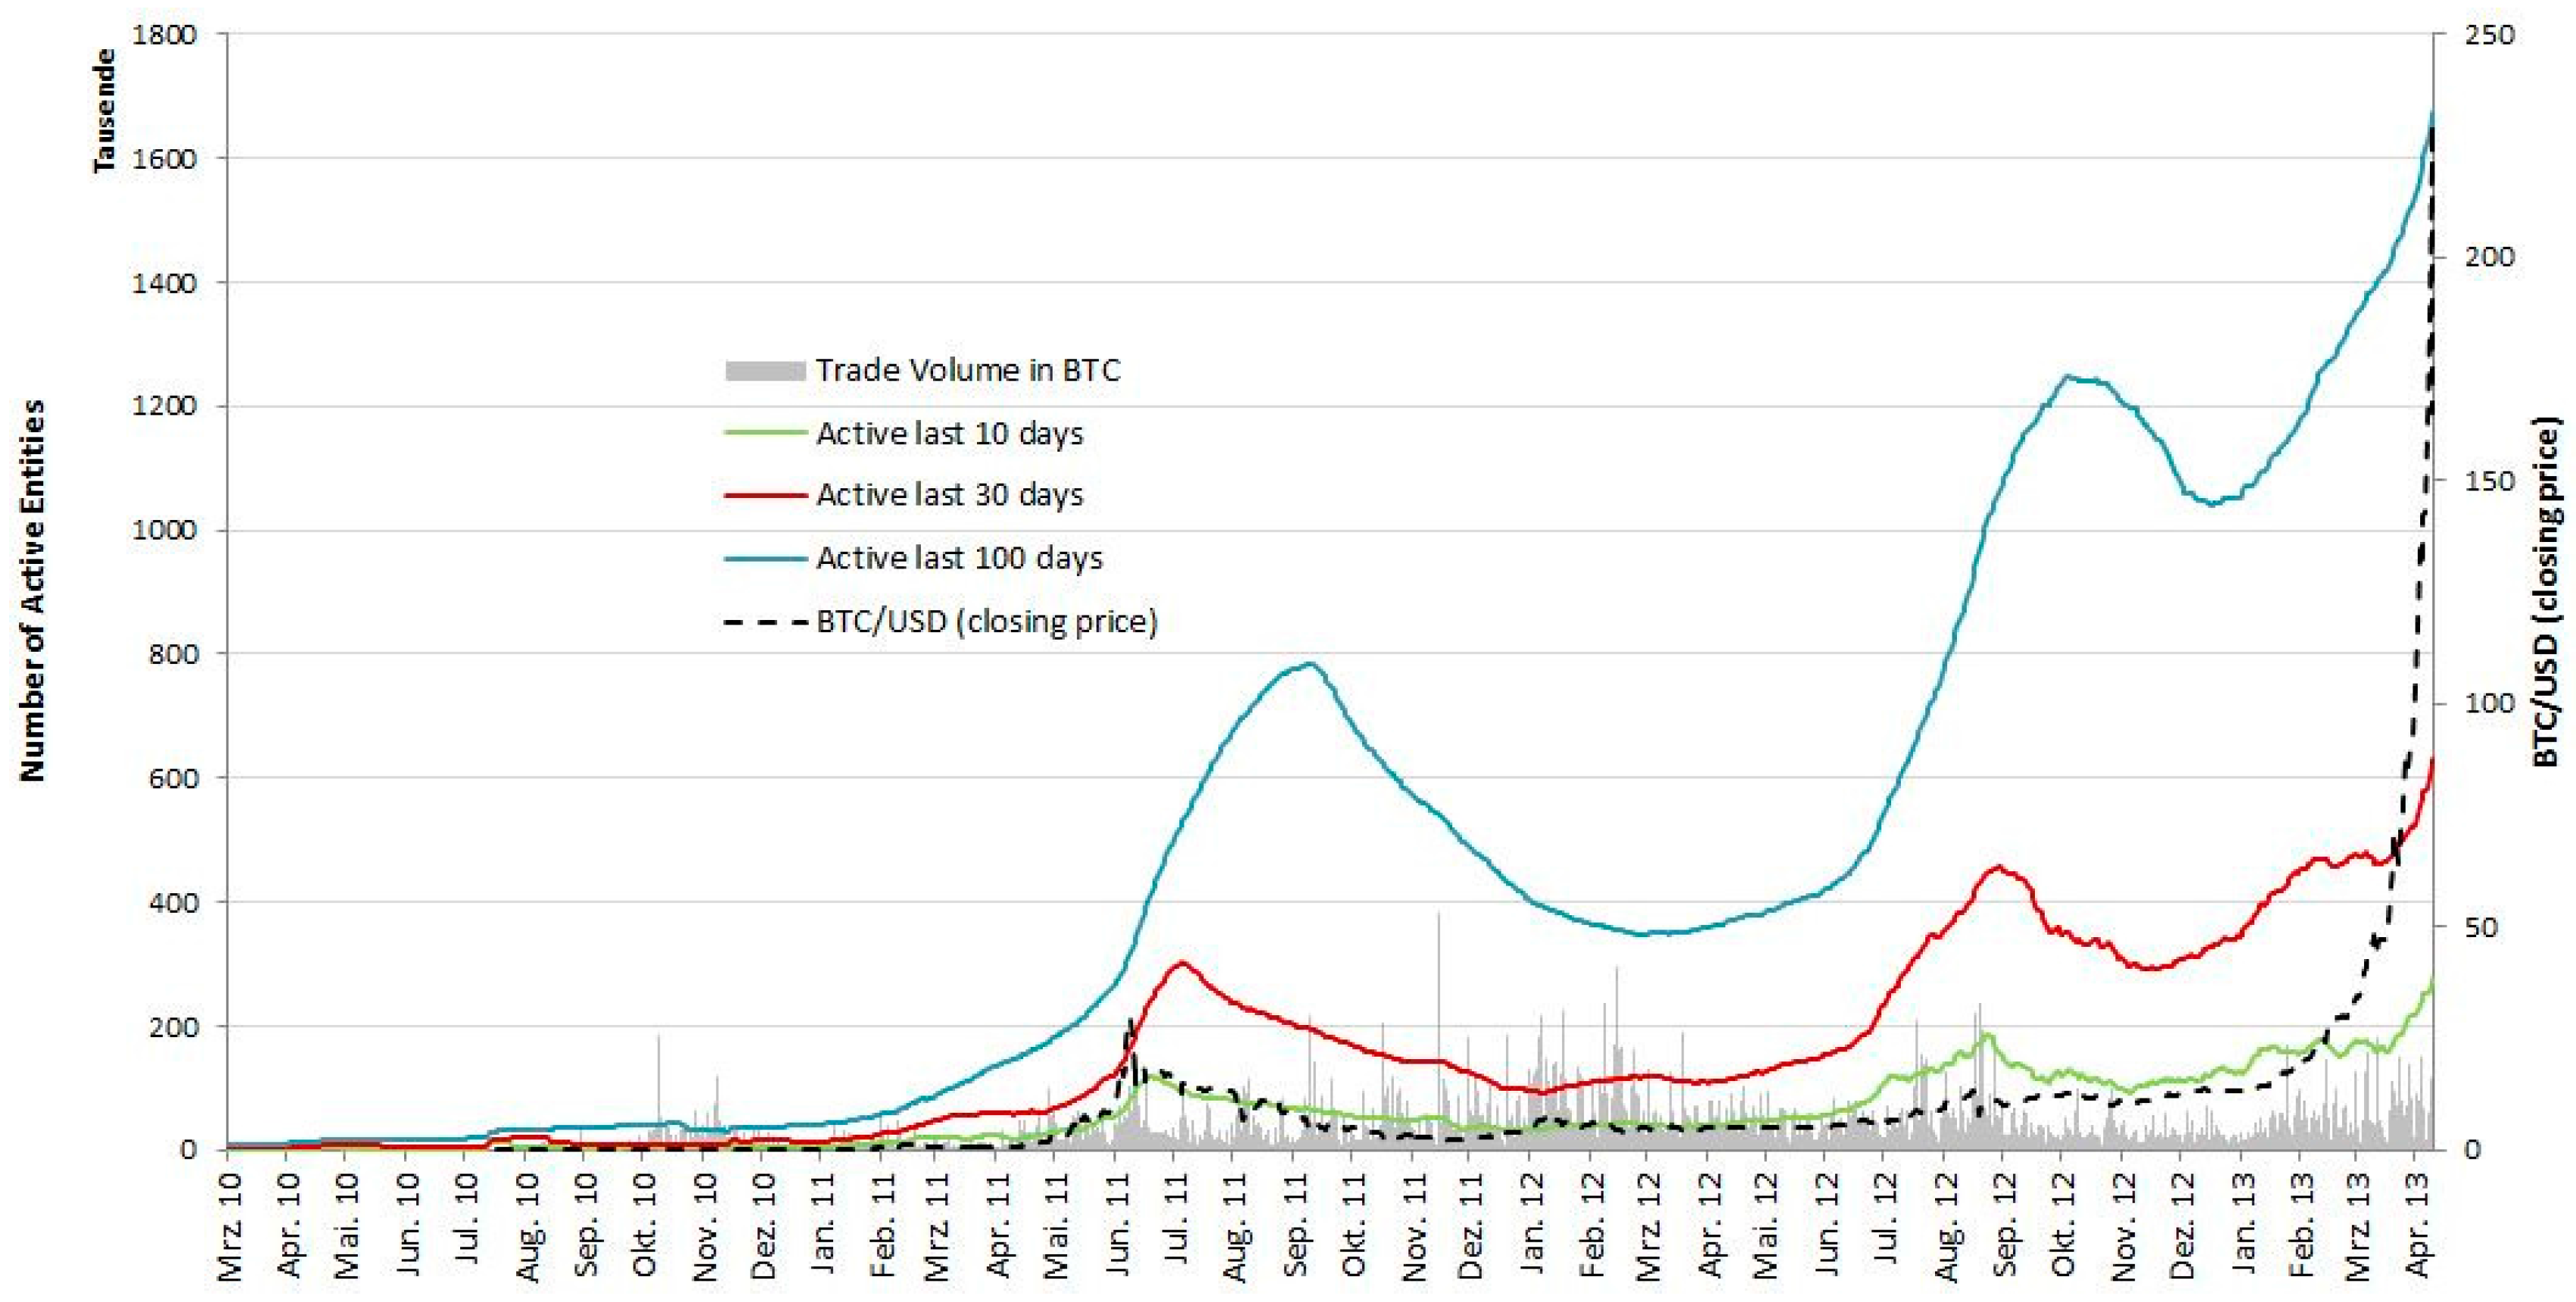
To examine the relationship between the user activity and the trading behavior on exchanges (here Mt.Gox as a representative), the time series of the trading volume and the exchange rate from Mt.Gox are compared to the user activity with different rolling windows over time. There is a strong relationship between the user activity and the exchange rate when considering the correlation coefficients in Table 2. Although there is a positive relationship of activity in the network to the trading behavior, the correlation to the trade volume is rather low. This indicates that a majority of users might not be active in the exchange business and therefore have no relationship to the traded volume. Another point is that the volume is not separated into buys and sells; hence, the correlation coefficient between the exchange rate and the volume is 0.22. In Figure 6, one can see that peaks in the exchange rate are followed by an increase in user activity; thus giving sign for high interest and speculative behavior in the Bitcoin economy. The relationship between user activity and trading behavior is very close to the actual exchange rate movements, as can be seen by the correlation coefficients for the 1 day and 10 days rolling window.
One can conclude that there is a strong positive relationship between the user activity and the trading behavior but a rather low correlation to the trade volume. The overall user activity in the network increases steadily over time.

6.1.2. Bitcoin Business Statistics

The combined analysis of Bitcoin transactions and their associated businesses categories requires the classification of the extracted business tags. Since there are 1704 different tags which would need a manual lookup, the classification was done on tags that have ten or more transactions. This resulted in 383 tags that were classified in 13 different categories as shown in Table 3.
Overall, 54.56% of all transactions could be categorized. With 47.90%, the largest portion of it contains gambling services followed by mining and exchanges. Because leaving out business tags with fewer than 10 transactions, 5151 or 0.032% are not categorized.
To give insights into the major businesses in the Bitcoin economy and how they are distributed among the categories, statistics over the top 25 businesses were taken. Although 54.56% of transactions are categorized, the gambling business SatoshiDICE alone comprises 46.9% of them; the mining pool Deepbit is associated to 4.3% of all transactions; and the exchange platform Mt.Gox comprises around 1.7% of transactions. Since it is clear that these three services incorporate over 52.9% of all transactions, they are excluded from the first statistics to get a better view and comparison on the other businesses in the economy.
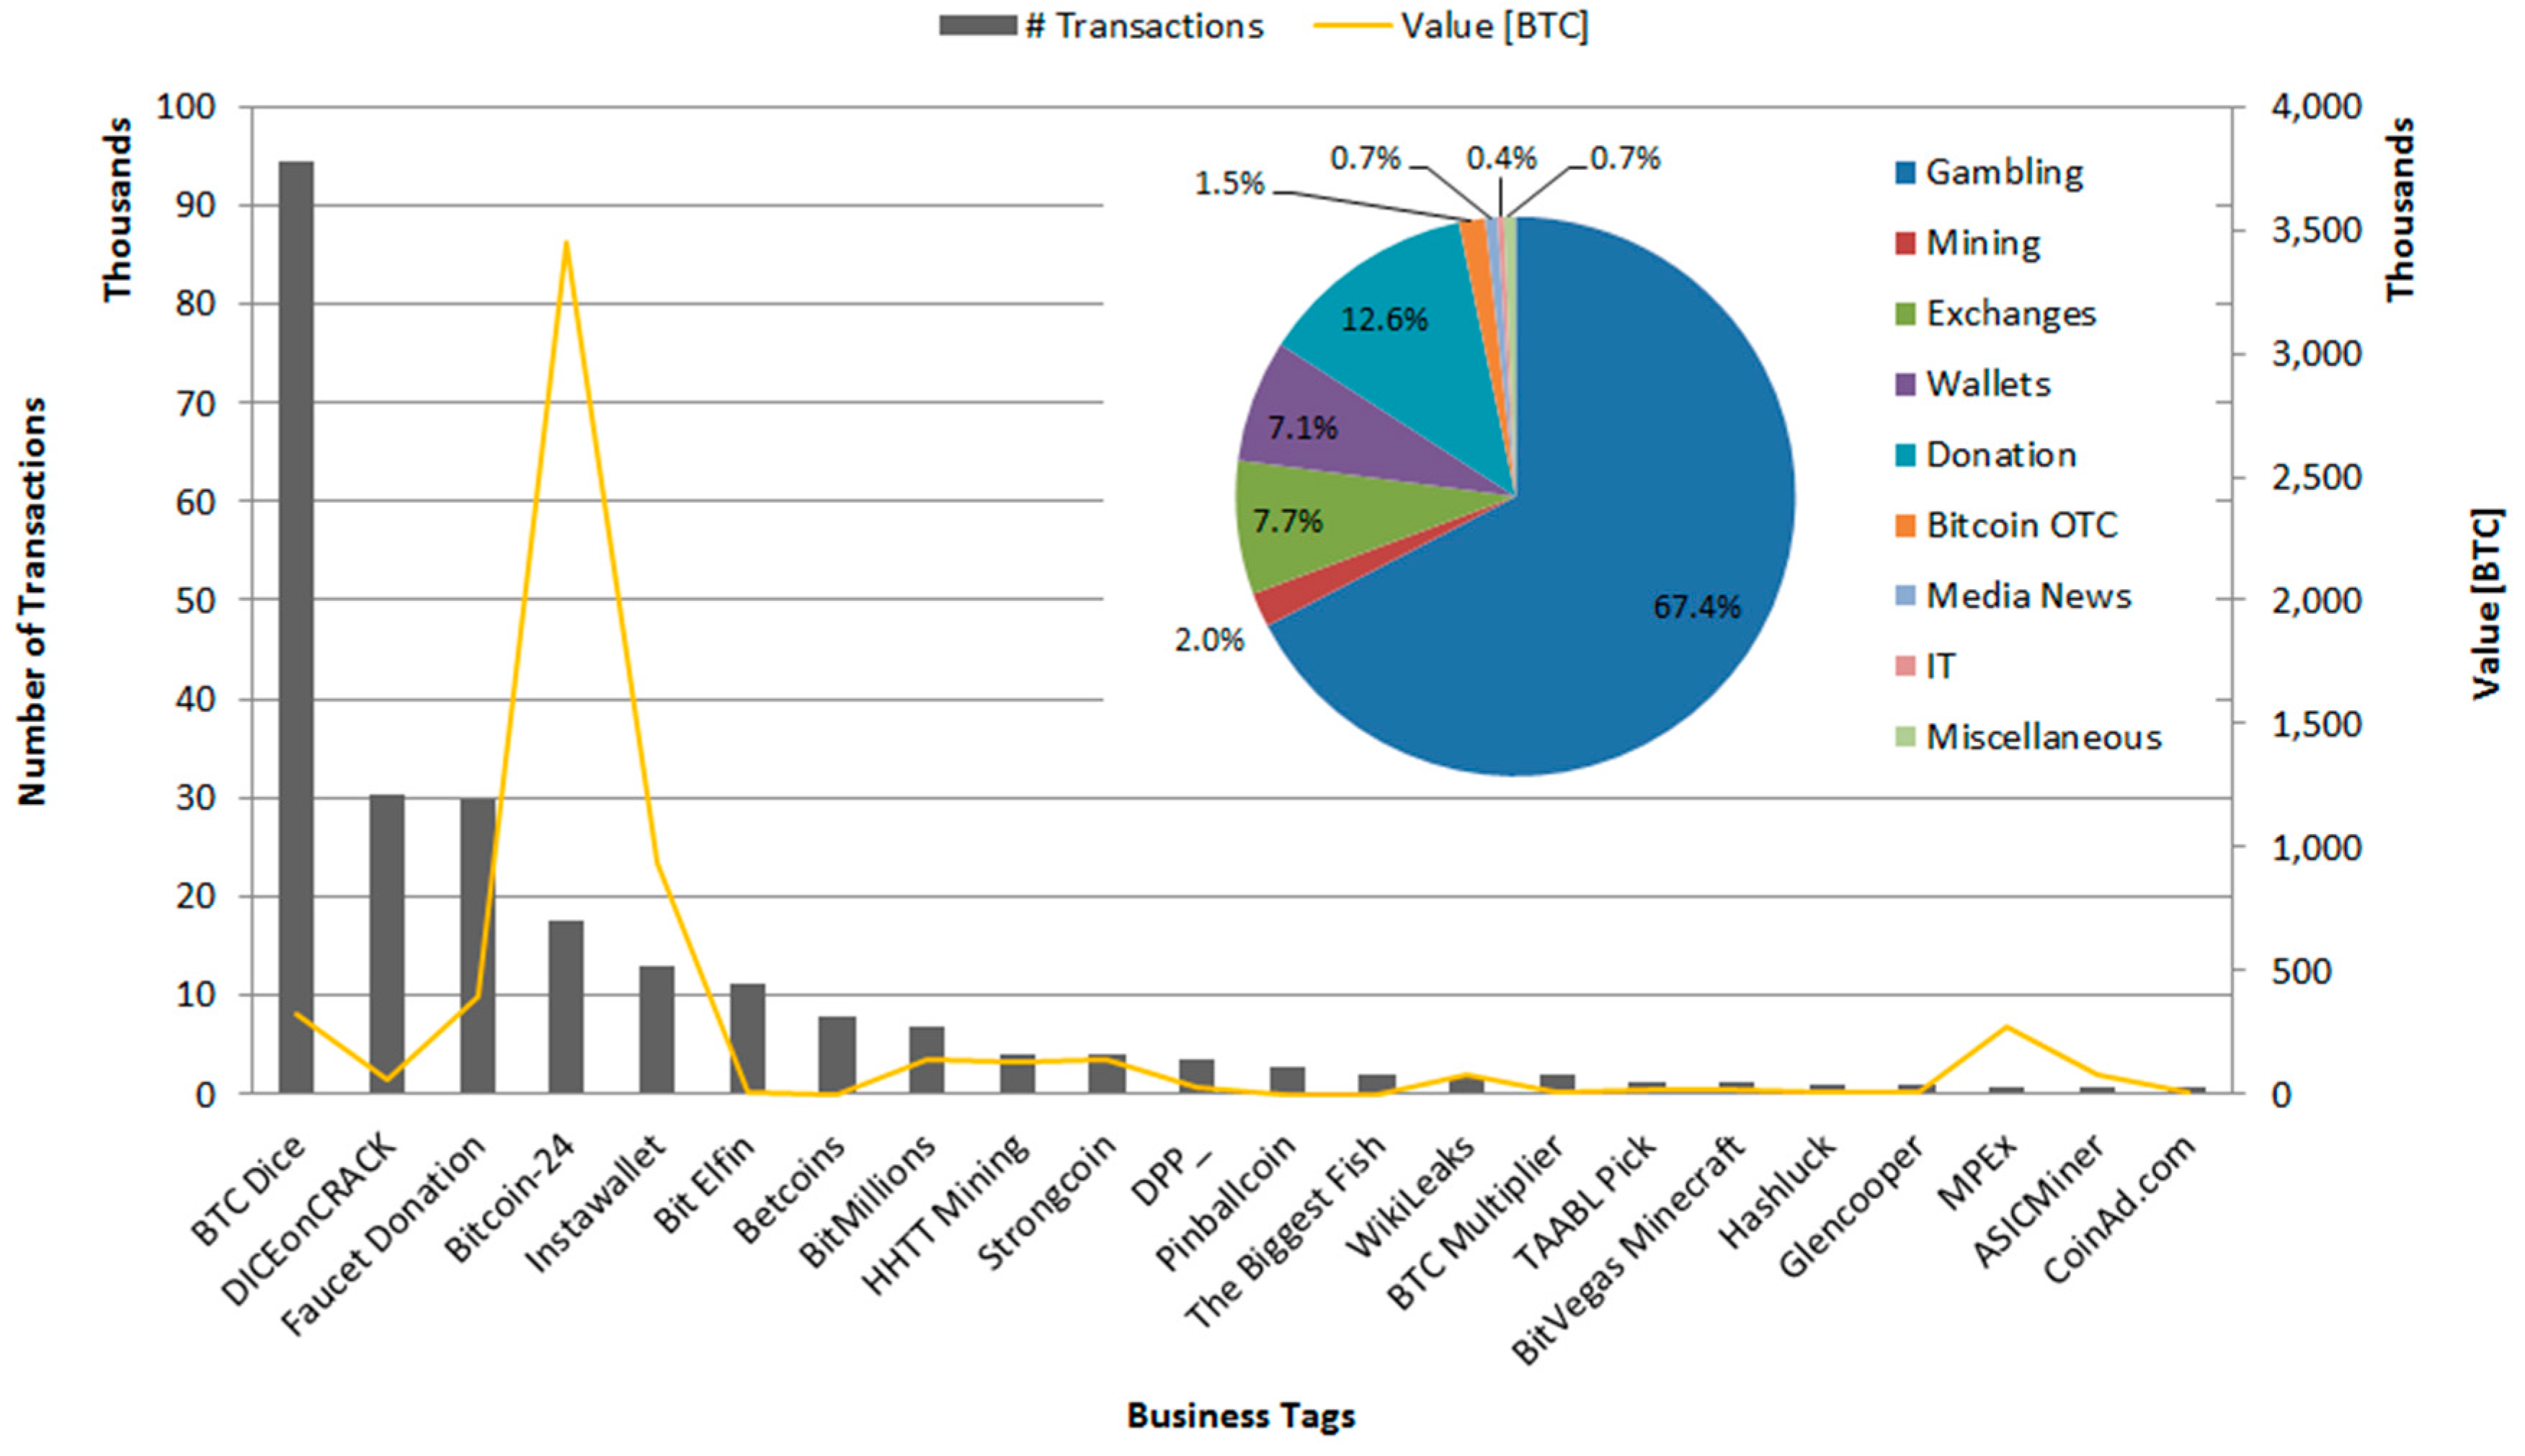
Figure 7 shows the number of transactions, their value in BTC, and their distribution among categories (inset) of the top 25 businesses. The statistic comprises around 1.5% (236,747 TXs) of all transactions after excluding SatoshiDICE, Deepbit, and Mt.Gox. One can see that gambling services (67.4%) are by far the most active businesses in the economy. Donations are the second largest business group and account for 12.6% of transactions. When comparing the number of transactions and the associated value one recognizes that the value in the business category gambling (e.g., BTC Dice, DICEonCRACK, Bit Elfin) is abnormally low. The opposite is the case for the business category exchanges (e.g., Bitcoin-24, MPEx), where the value is abnormally high in comparison to the number of transactions.
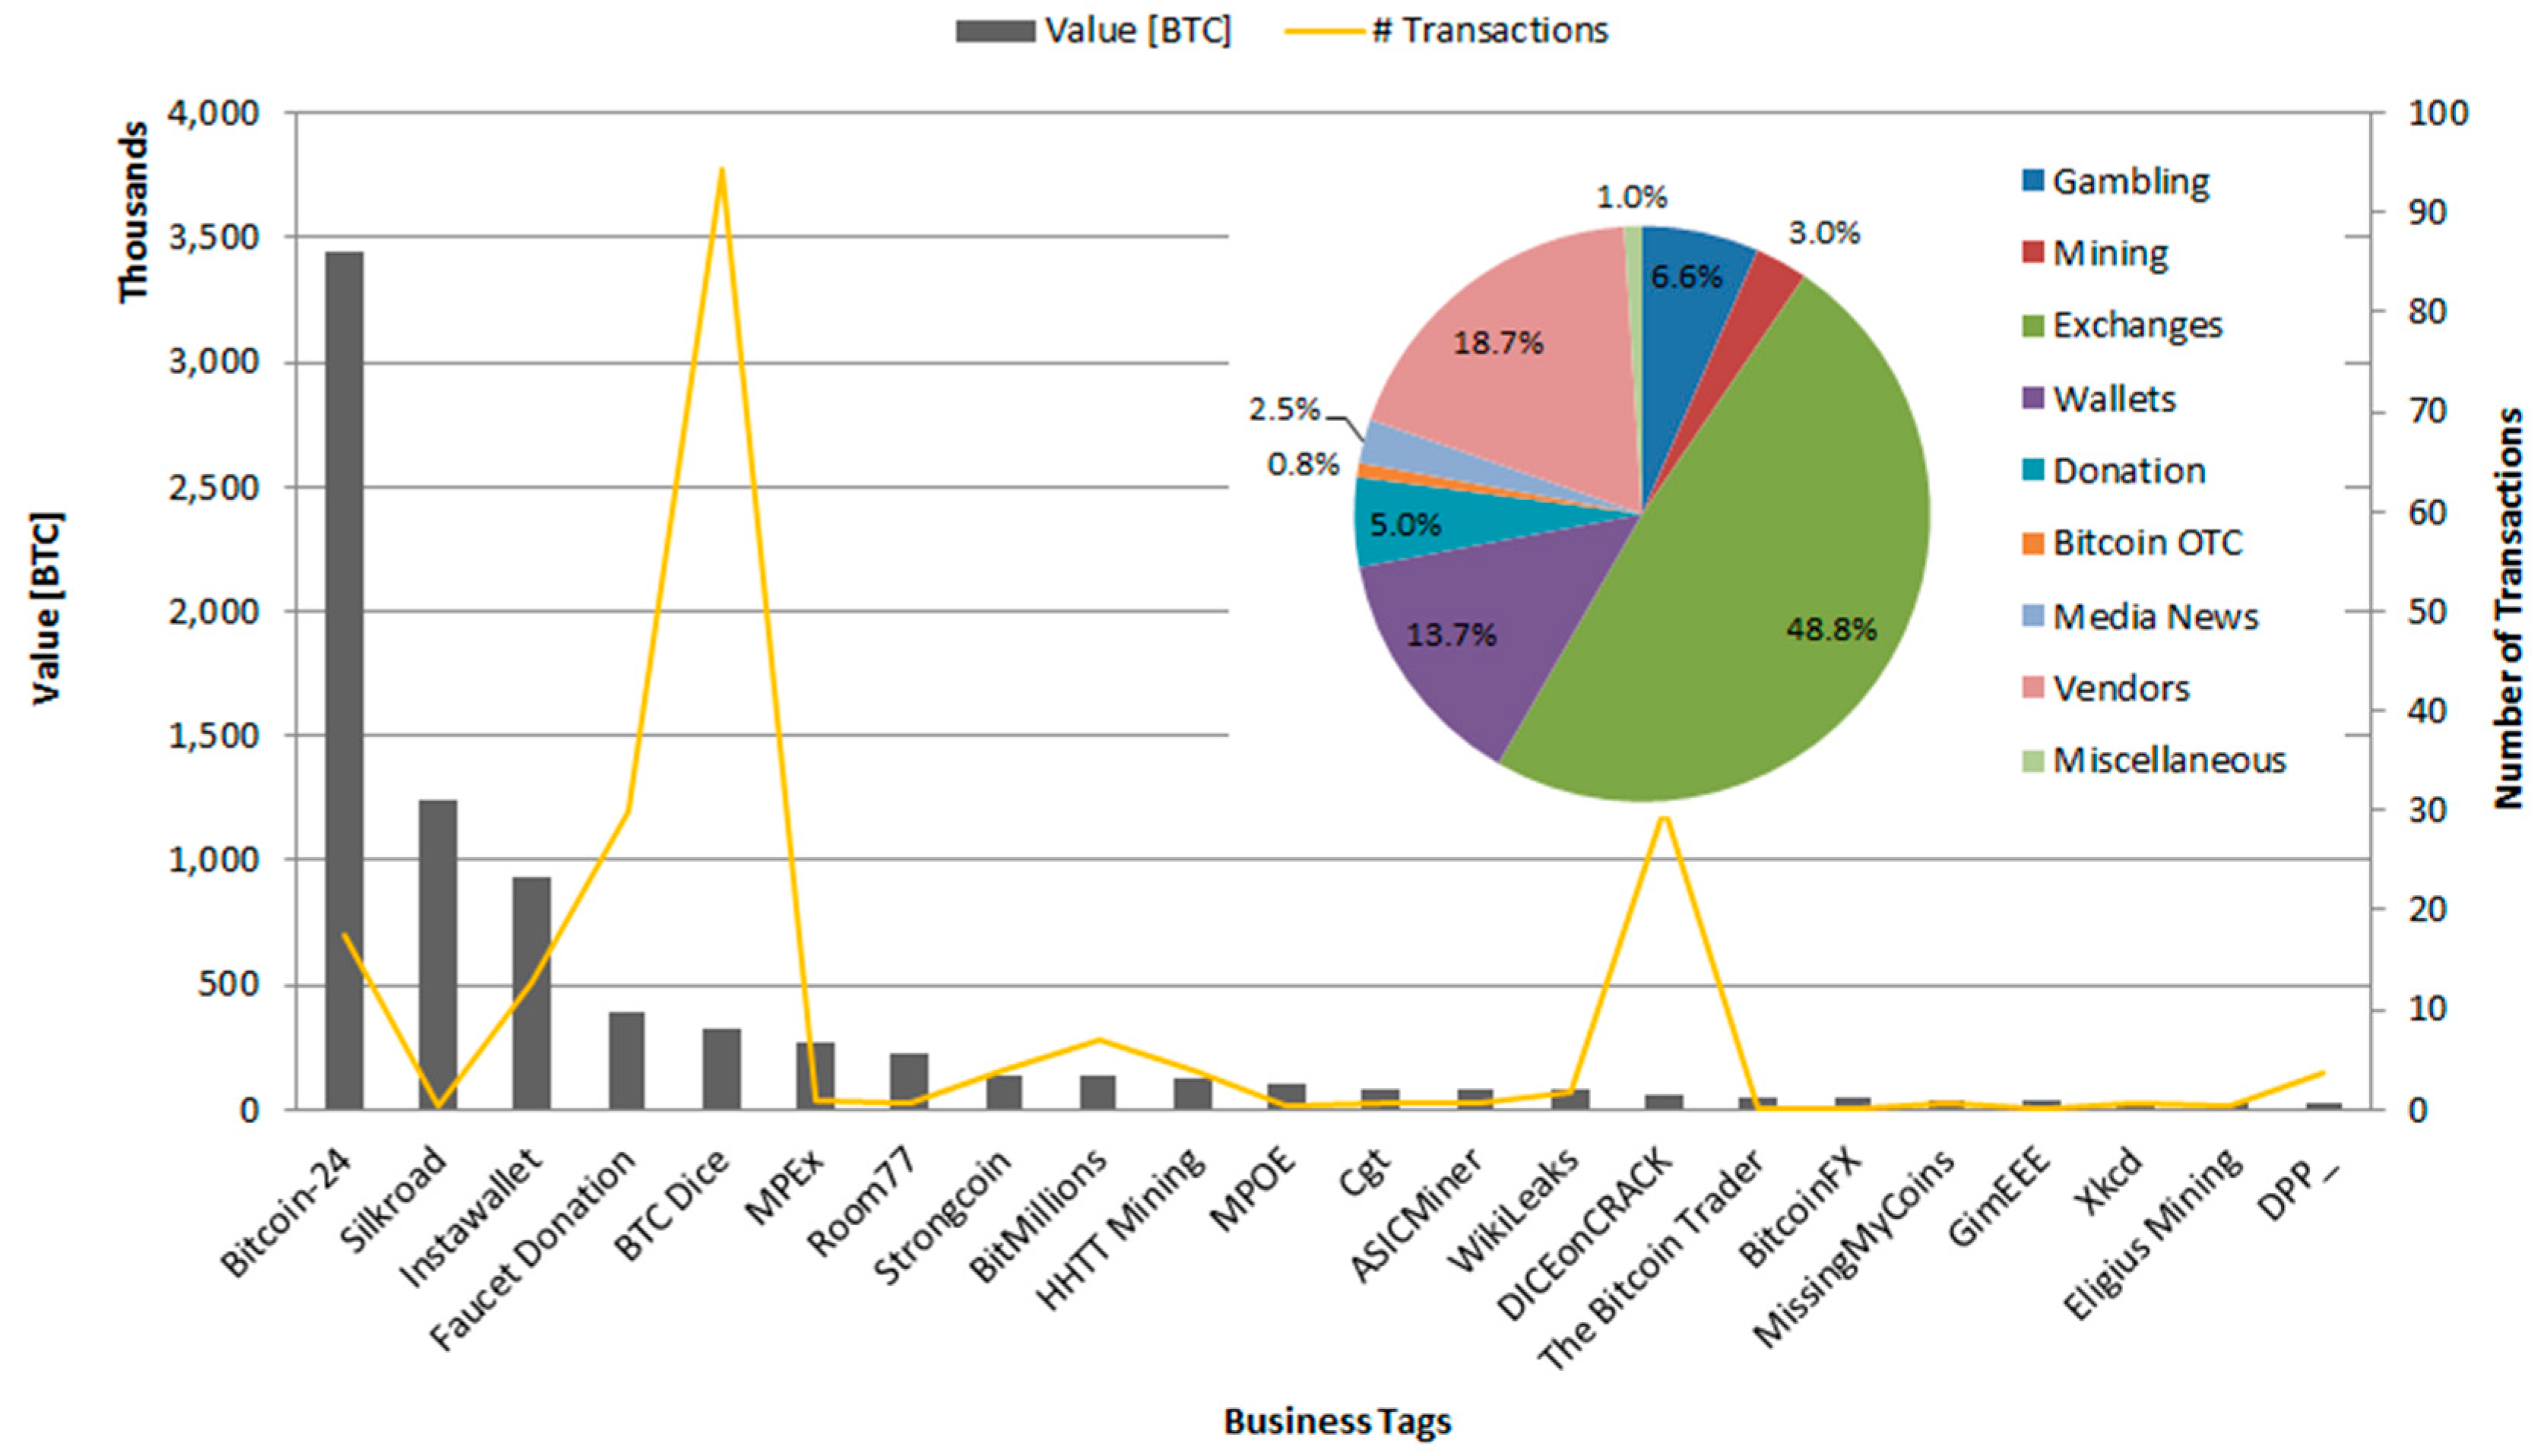
For comparison reason a similar statistic was conducted with the focus on the transacted value in BTC. Figure 8 shows a completely different distribution of the top 25 businesses among the categories when considering the transaction value. The largest business category is exchanges that comprise 48.8% of transacted volume followed by the vendor business with 18.7%.
Especially the vendor Silkroad shows a large trading volume of around 1.23 million BTC in comparison to 285 executed transactions. In contrast, the gambling businesses transact very small Bitcoin volumes while a huge amount of transactions are executed. From a business view this makes sense that exchanges and vendors transact larger volumes because of transaction costs and reasonable prices for traded goods. On the other hand, risky gambling activities and donations incorporate rather small volumes per transaction.
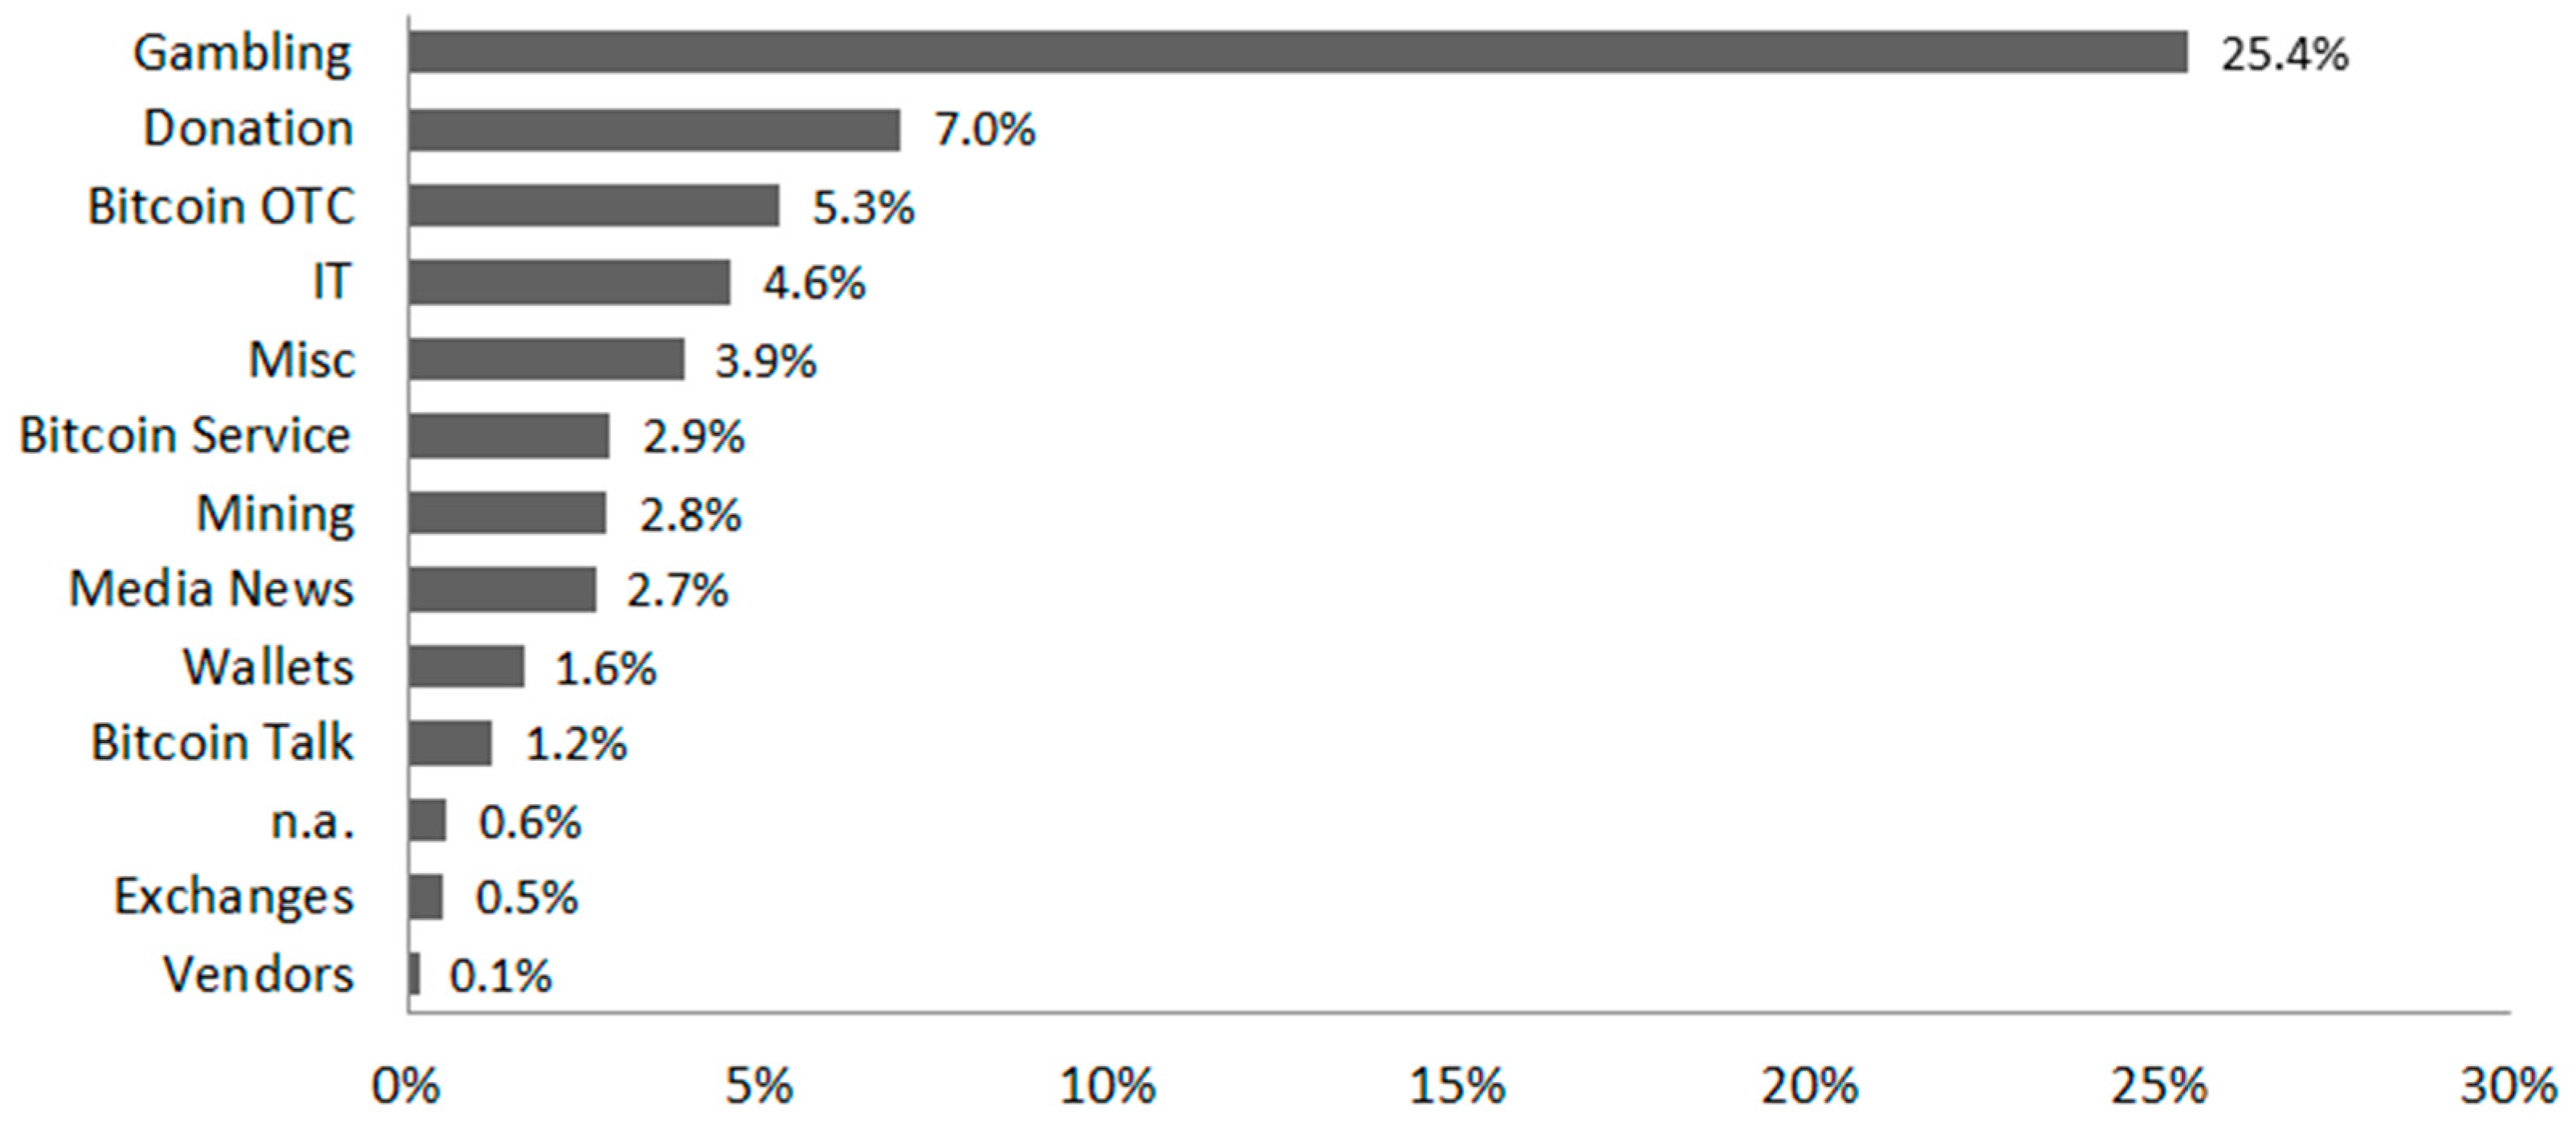
This relationship can be seen when computing the ratio of the number of executed transactions divided by their respective value (T/V ratio). Figure 9 shows the ratio, aggregated for every business category. As indicated in the top 25 statistics above, the T/V ratio for the entire dataset confirms the previous result. With a ratio of 25.4, the gambling services carry by far the smallest amount of Bitcoins per transaction; around four Bitcoins are transferred in one transaction on average. The exchanges and vendor business have the smallest ratio with 0.5 and 0.1, respectively. Hence, even on a much larger scale of classified data (~54.56%, exclude n.a.) in comparison to the top 25 businesses (~1.5%), the relationship between the number of transactions and the value stays quiet stable among the business categories.
To analyze the transaction value distribution more thoroughly, the transacted value in BTC is arranged in several bins from the lowest transacted value (0.00000001 BTC) to the largest transacted value (500,000 BTC). The business activity in each range is measured by the number of transactions (relationships). A transaction can incorporate several output relationships with different values; hence, the number of relationships was taken to cover the entire spectrum of transacted values. The business categories were ranked according to their portion of relationships within the range, and the top three businesses are presented in Table 4. The first eight bins, which include the transaction values from 0.00000001 to 1.0 BTC, cover around 63% of all relationships.
As indicated above, the gambling businesses encompass most of the transactions (relationships) in the network, but with a decreasing trend in higher value regions. In ranges with transacted values above 50 BTC, the major business switches to mining and above 100 BTC to exchanges. An interesting fact is that gambling is the second major business in the range from 50 to 10,000 BTC. The vendors appear at the very end of the range as second major business, which is not surprising when considering the large volumes traded on Silkroad. Other business categories such as gambling, mining, and exchanges are driven by SatoshiDICE, Deepbit, and Mt.Gox, respectively. One needs to be aware of the n.a. column in the table that states what percentage of transactions (relationships) within a range are not associated to a business category. Although this table gives a good indication on how business categories are distributed within different value ranges, the numbers might change due to increased tagged services in the Bitcoin economy.
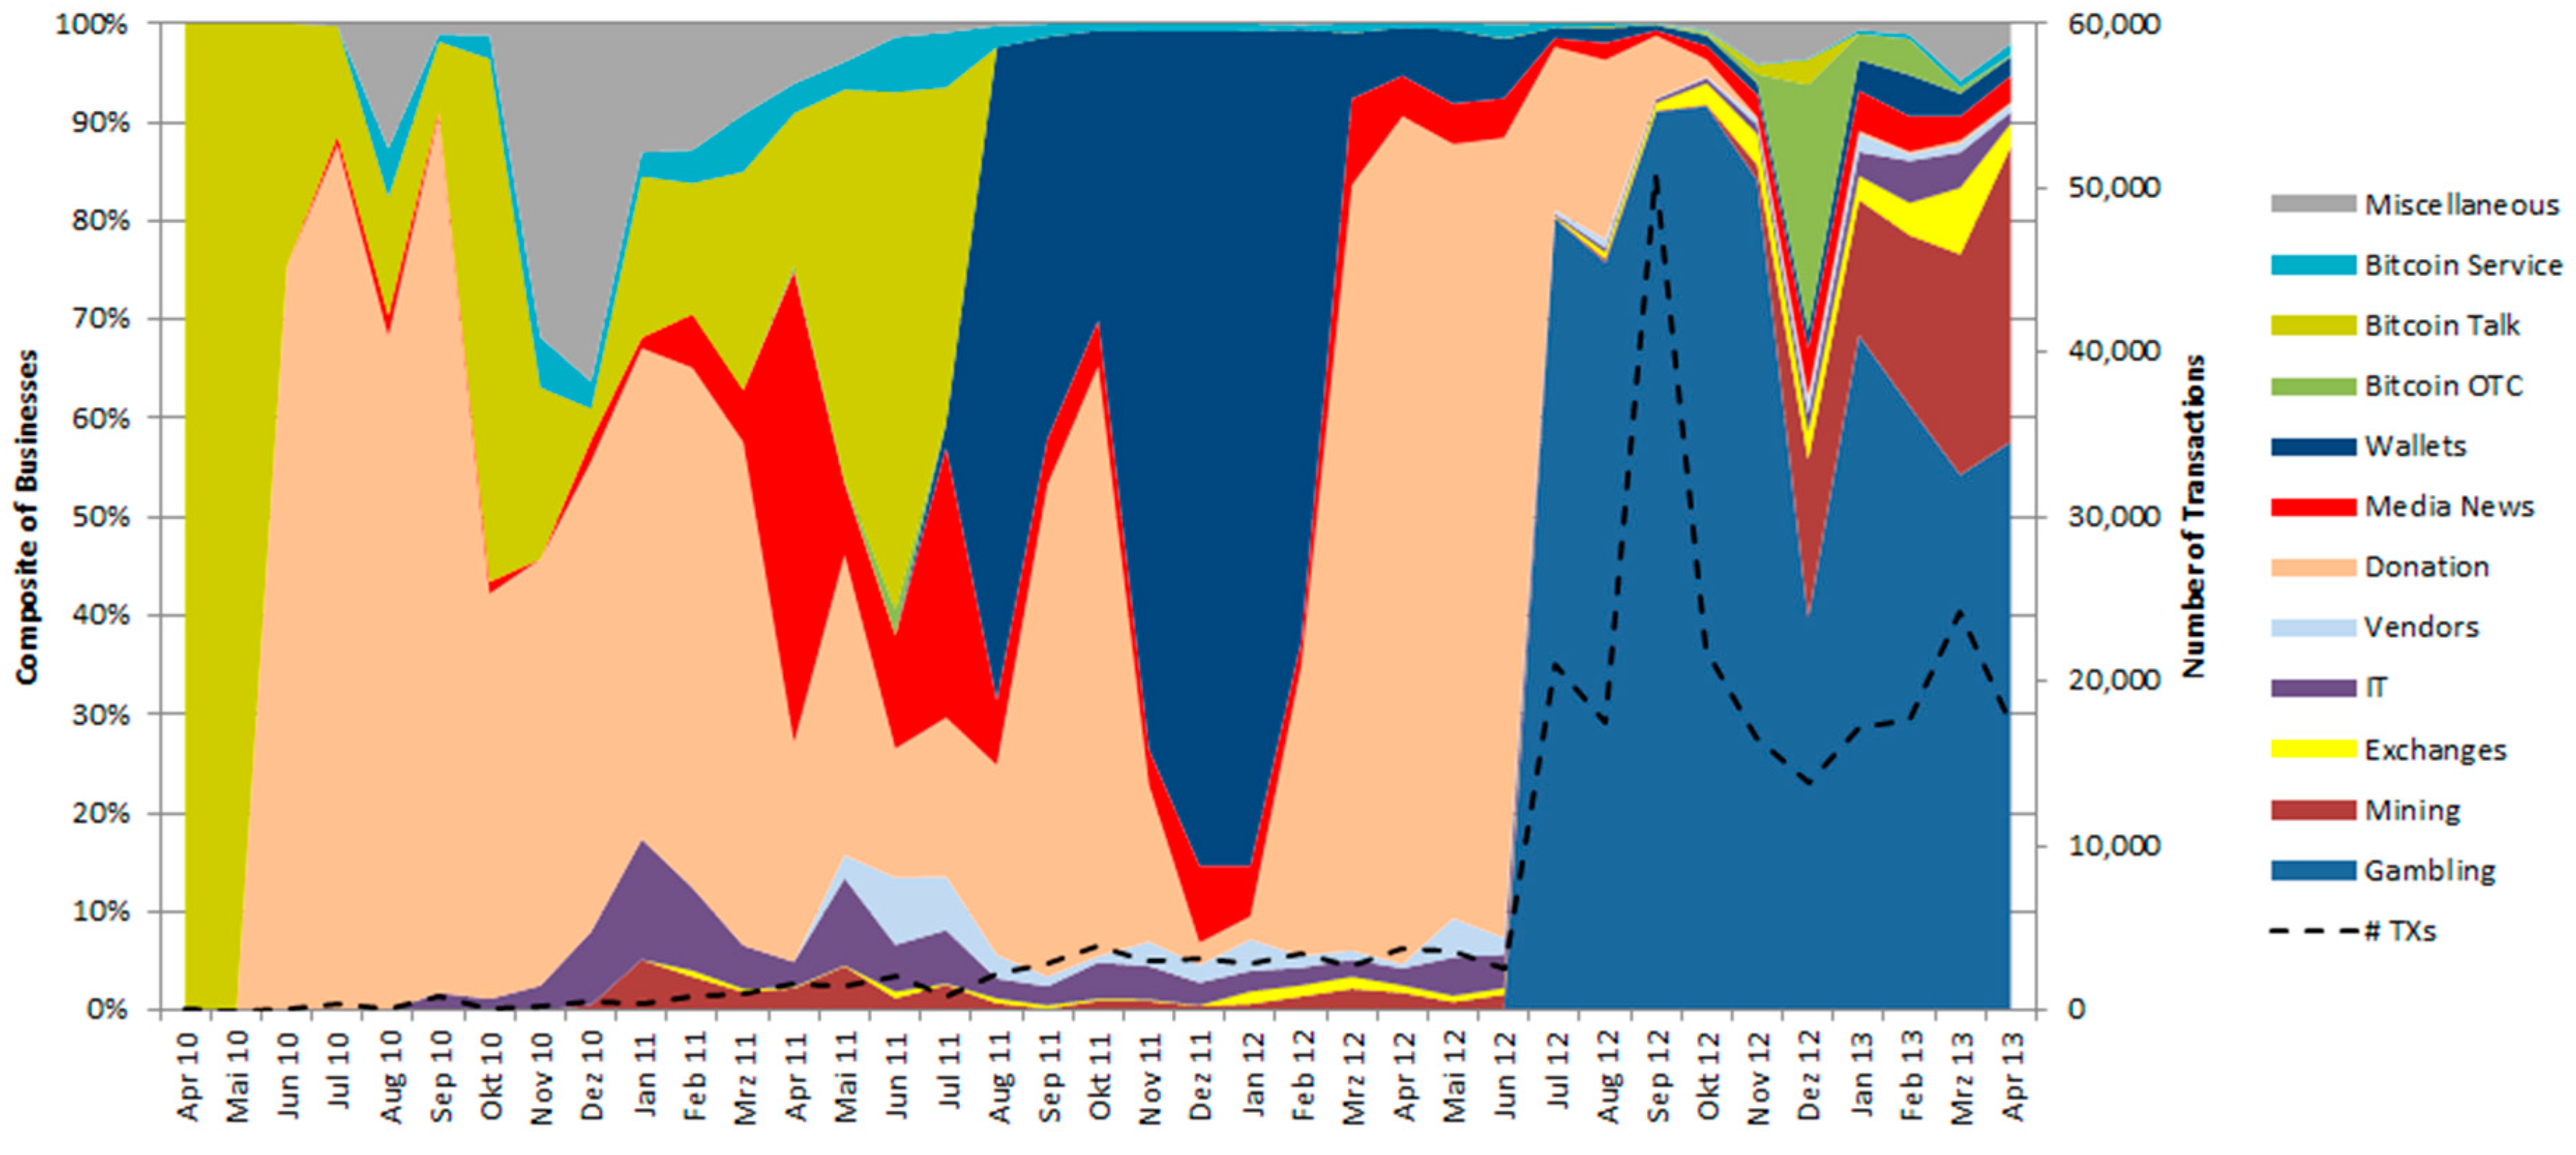
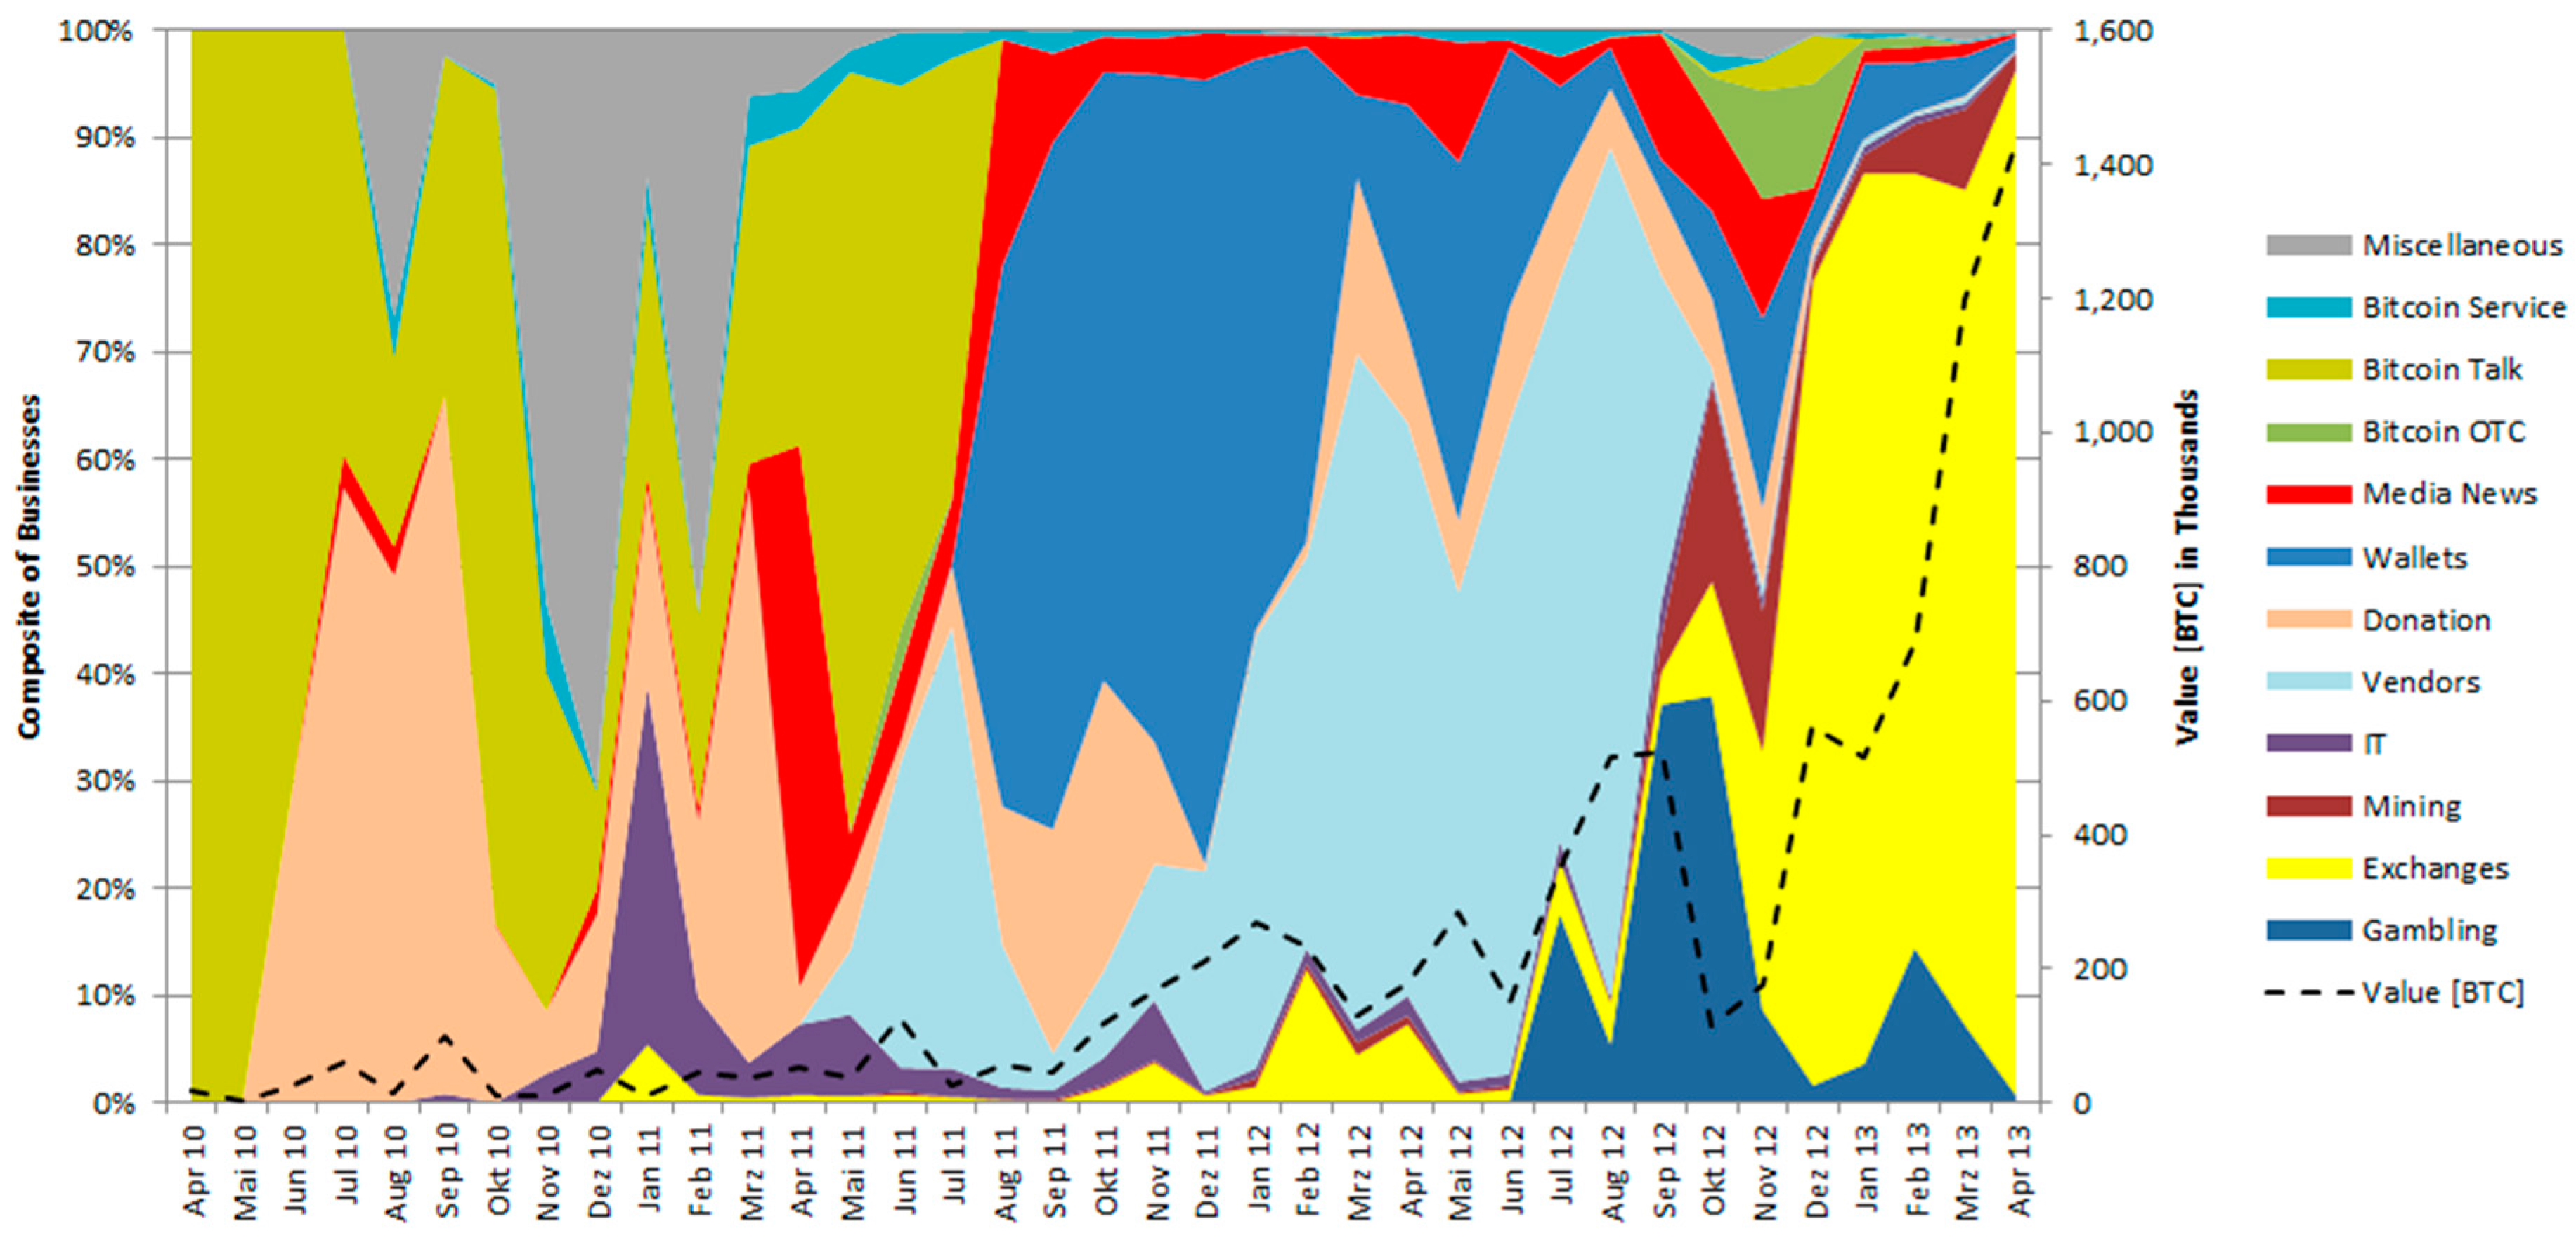
In the next statistic the composite of business categories over time are shown. Figure 10 displays the composition in terms of the number of transactions aggregated per month. For comparison reasons, the actual numbers of transactions executed per month (as sum over all business categories; but only tagged transactions, ~1.7%) are inserted as an indicator for network activity. The Bitcoin Talk users were the first business category that could be associated with transactions in April 2010. Although they make up 100% of all transactions, the network activity measured by number of transactions is very low. This group of users can be seen as the supporter of the Bitcoin economy that actively exchange information and discuss several issues regarding Bitcoins on the known forum [45]. Hence, it is not surprising that they were among the first active participants. One can see that the business category donation became more active over time. This fact can be attributed to services such as the Faucet Donation, which donate small amounts of Bitcoins to attract more users to the economy. In the time from June to December 2010 more and more businesses were attracted to the Bitcoin economy such as Media News, Bitcoin Services, Mining, provider of IT services as well as miscellaneous businesses. In the beginning of the year 2011 exchange platforms such as Mt.Gox and Bitcoin-24 entering the economy. In comparison to other business categories, the exchanges can be attributed to a rather small number of transactions over time.
In February 2011 the well-known vendor Silkroad started its business. The following media attention about the goods that were sold on this platform attracted more users and subsequently the network activity increased. Support of independent and liberal media and news platforms and the donation via Bitcoins made up a large portion of transactions in the first half of 2011. With the emergence of online or web wallets to hold Bitcoins, more users could then easily store and transact their Bitcoins in a convenient way; thus increasing activity and transactions related to the web wallet business. In this statistic the category is mainly driven by one of the first services called Instawallet that launches its business in April 2011. The most active time for wallet services were in the time from August 2011 to February 2012, compared to other business categories. The introduction of Bitcoin games in mid-2012, especially dice games such as SatoshiDICE and BTC Dice, resulted in an inflation of executed transactions in the Bitcoin economy. The gambling category makes up the largest portion of transactions in the network since its introduction. Between October 2012 and March 2013, the speculation on exchange rate movements surged and one can see that Bitcoin OTC trader become very active in this phase. The activity of the mining business also increased, since it is more profitable to donate computing power in times where miners can exchange their Bitcoins at higher exchange rates into fiat currencies.
Overall, one can see a high fluctuation in the activity of different business categories. Again, these results can just be seen as an indicator because conclusions about transactions that do not have a business tag cannot be made. Comparing the results in case of the three major businesses in the Bitcoin economy gambling, exchanges, and mining with their larger representatives SatoshiDICE, Mt.Gox, and Deepbit, respectively, there is no significant correlation or even a negative correlation. Hence, the development of a business category over time is not representative for particular services related to this category.
For the complete picture the composite of business categories over time in terms of the transacted value in BTC is shown in Figure 11. The first thing that can easily be recognized in comparison to the previous statistic is the development of the donation business. In the early stage of the Bitcoin economy the transacted value in the network can be mainly attributed to early adopters such as Bitcoin Talk users, media news and miscellaneous services. To attract more users in the early stage, Bitcoins were donated to potential interest parties; thus, the donation business makes up around 60% of transaction volume in the time from June to September 2010. Then the attributed value decreases in comparison to other emerging businesses such as IT, media news, exchanges, and vendors. The start (April 2011) of the Silkroad vendor, which mainly drives the vendor business according to the transacted value in this statistic, incorporates large portions of the transacted Bitcoins. The tremendous increase of transacted value in the case of the Silkroad vendor is mainly explained by transactions related to the address “1DkyBEKt…”, which is believed to be associated with Silk Road. In the active time of this address (January–September 2012) it received large volumes of Bitcoins until August 2012; subsequently, Bitcoins were aggregated and withdrawn from this address. One can see that the suspicious address associated to the vendor Silkroad dominates the business category vendors within the network. Meiklejohn, et al. [8] analyzed this particular situation more thoroughly and came to a similar conclusion, although they incorporate different businesses in their vendor category. During the speculation phase, exchange platforms transact huge volumes of Bitcoins and were attributable for around 80% to 95% of transacted value. There is also a plunge of transacted value in the gambling business, while at the same time the exchange business surged. An explanation might be that users shift Bitcoins from the gambling businesses to exchange platforms in anticipation of higher rewards due to trading activities against fiat currencies.

6.1.3. Geography of the Bitcoin Economy

Aggregations on the country and regional level are applied to get insight into the geographic distribution of the Bitcoin economy. The geo-location information is related to the IP address that can be linked to an executed transaction in the Bitcoin network. The extracted IP addresses from Blockchain.info result in 40,329 distinct geo-locations. Transactions that are executed via the Blockchain.info node are tagged with 127.0.0.1 (i.e., the non-unique localhost address), around 10.7% of all transactions. There are also transactions that could not be related to an IP address and are tagged with 0.0.0.0, around 16.6% of all transactions. The following statistics are based on the 72.4% of transactions that could be linked to an IP address. Furthermore, one has to exclude IP addresses that are associated to anonymous services such as Tor, proxy, and VPN servers. With the scraped IPs from anonymous services, around 1.6% of transactions could be linked to this kind of services.
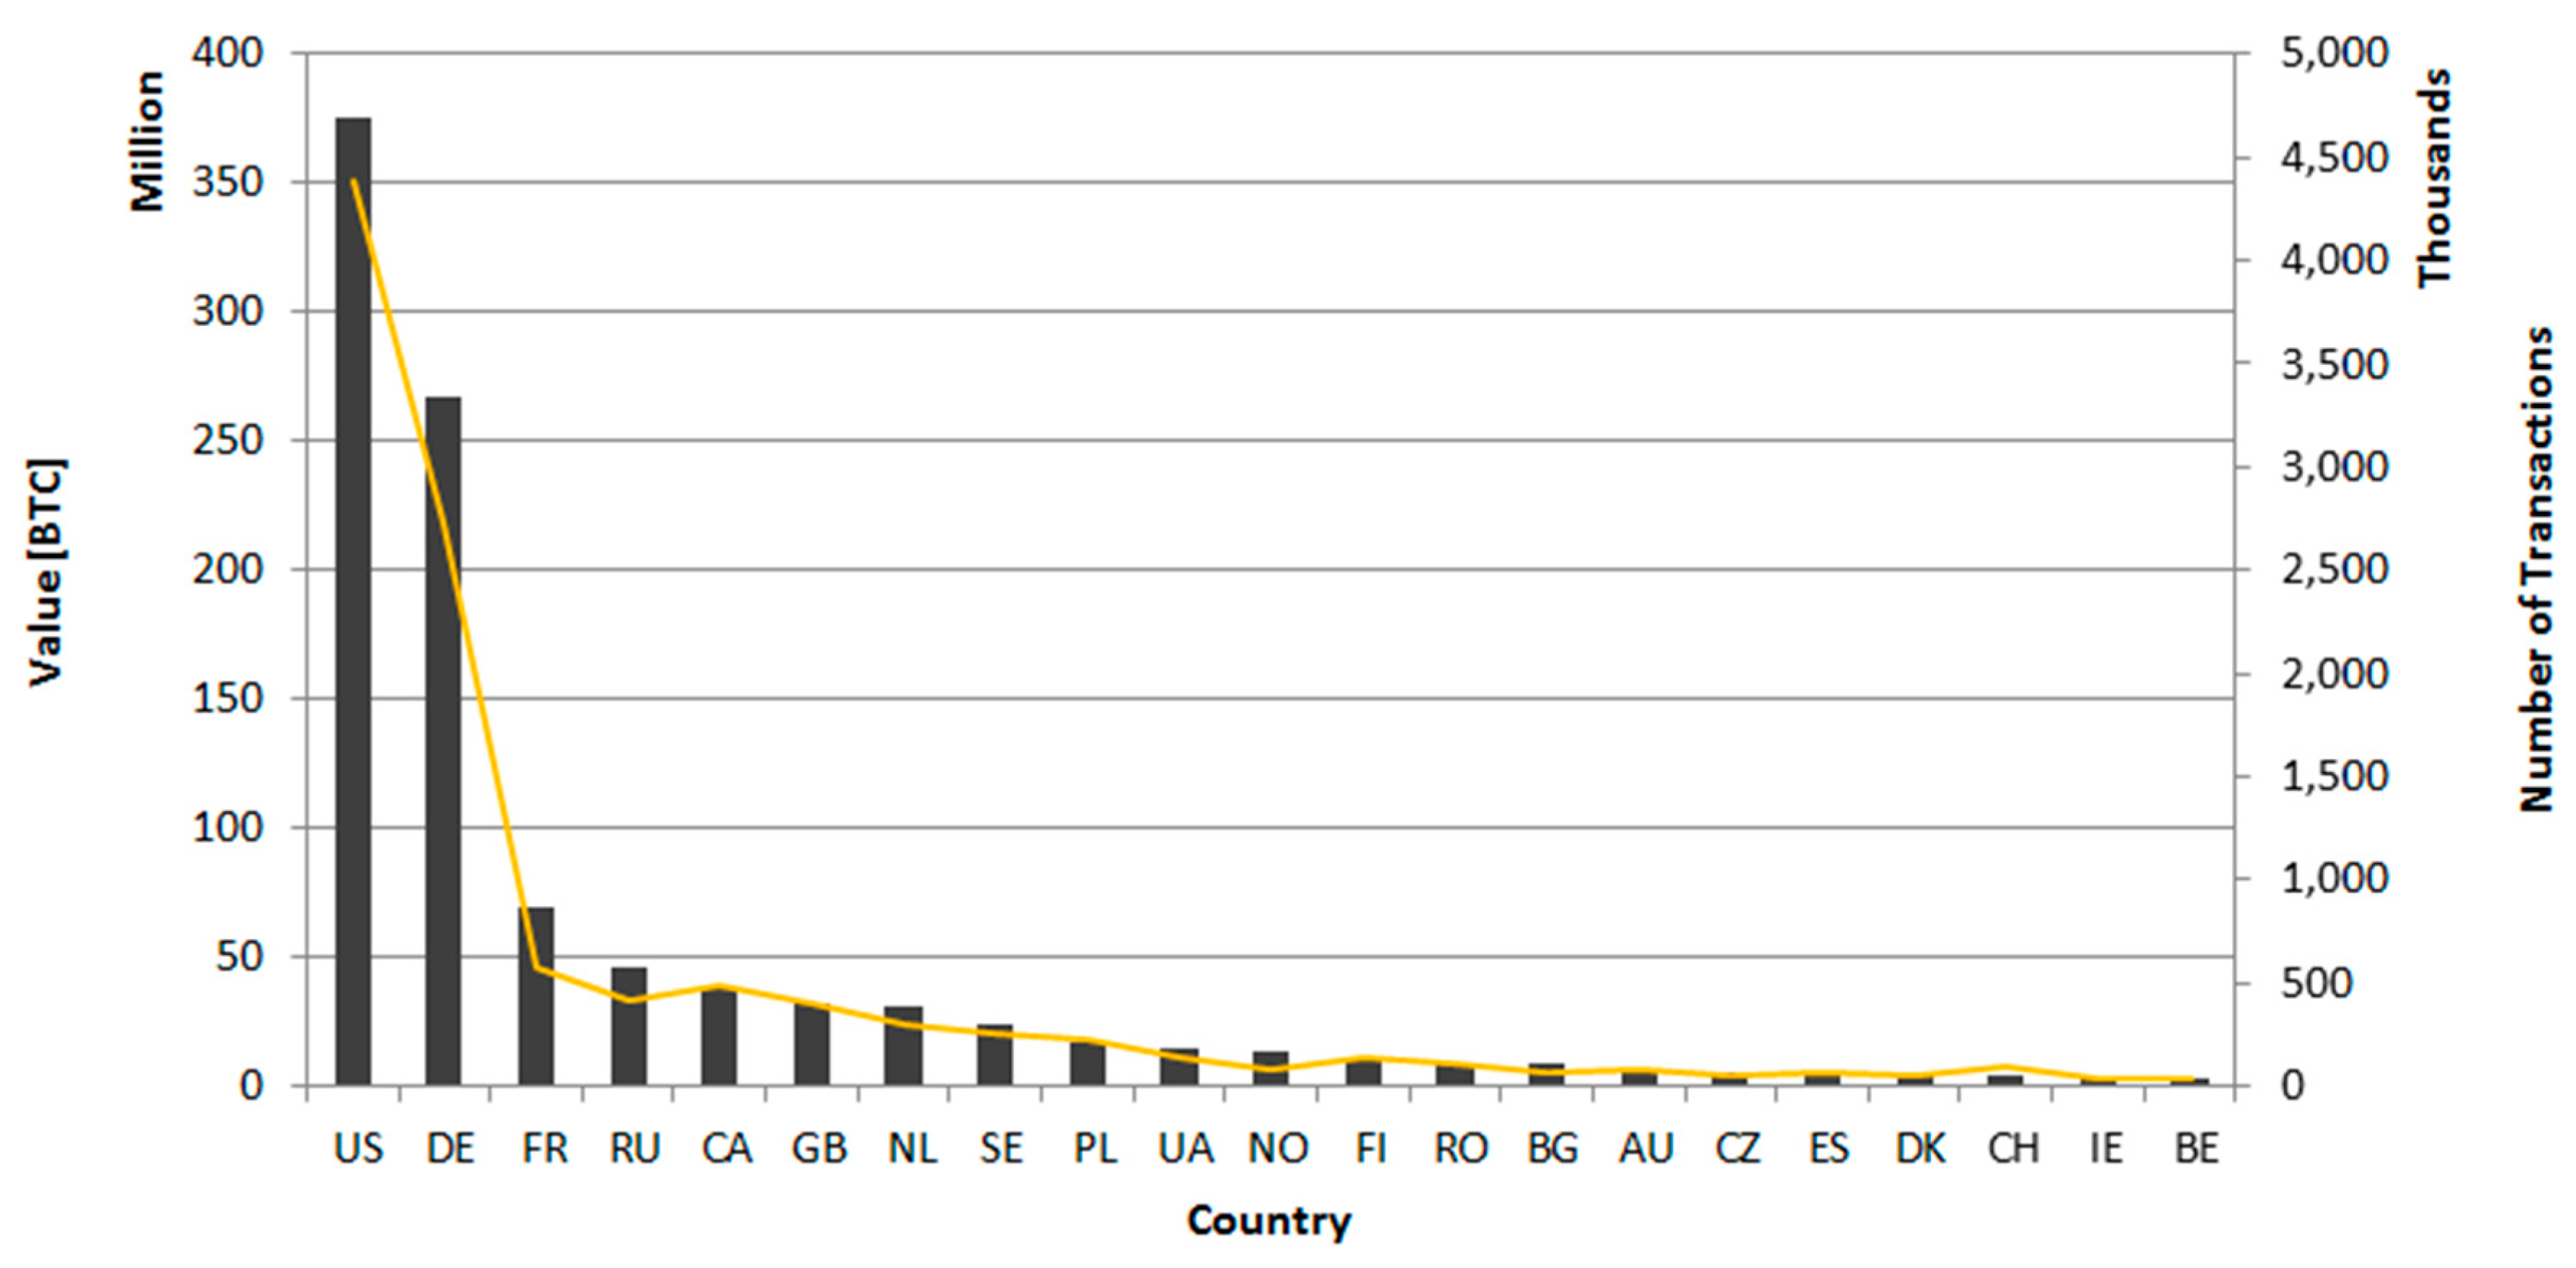
Figure 12 shows the number of transactions and the associated value in BTC per country. One can clearly recognize that the U.S. and German market are by far the most active, followed by France, Russia, and Canada etc. The U.S. market alone incorporates around 38.4% of transactions and carrying around 36.7% of the Bitcoin volume in the economy.
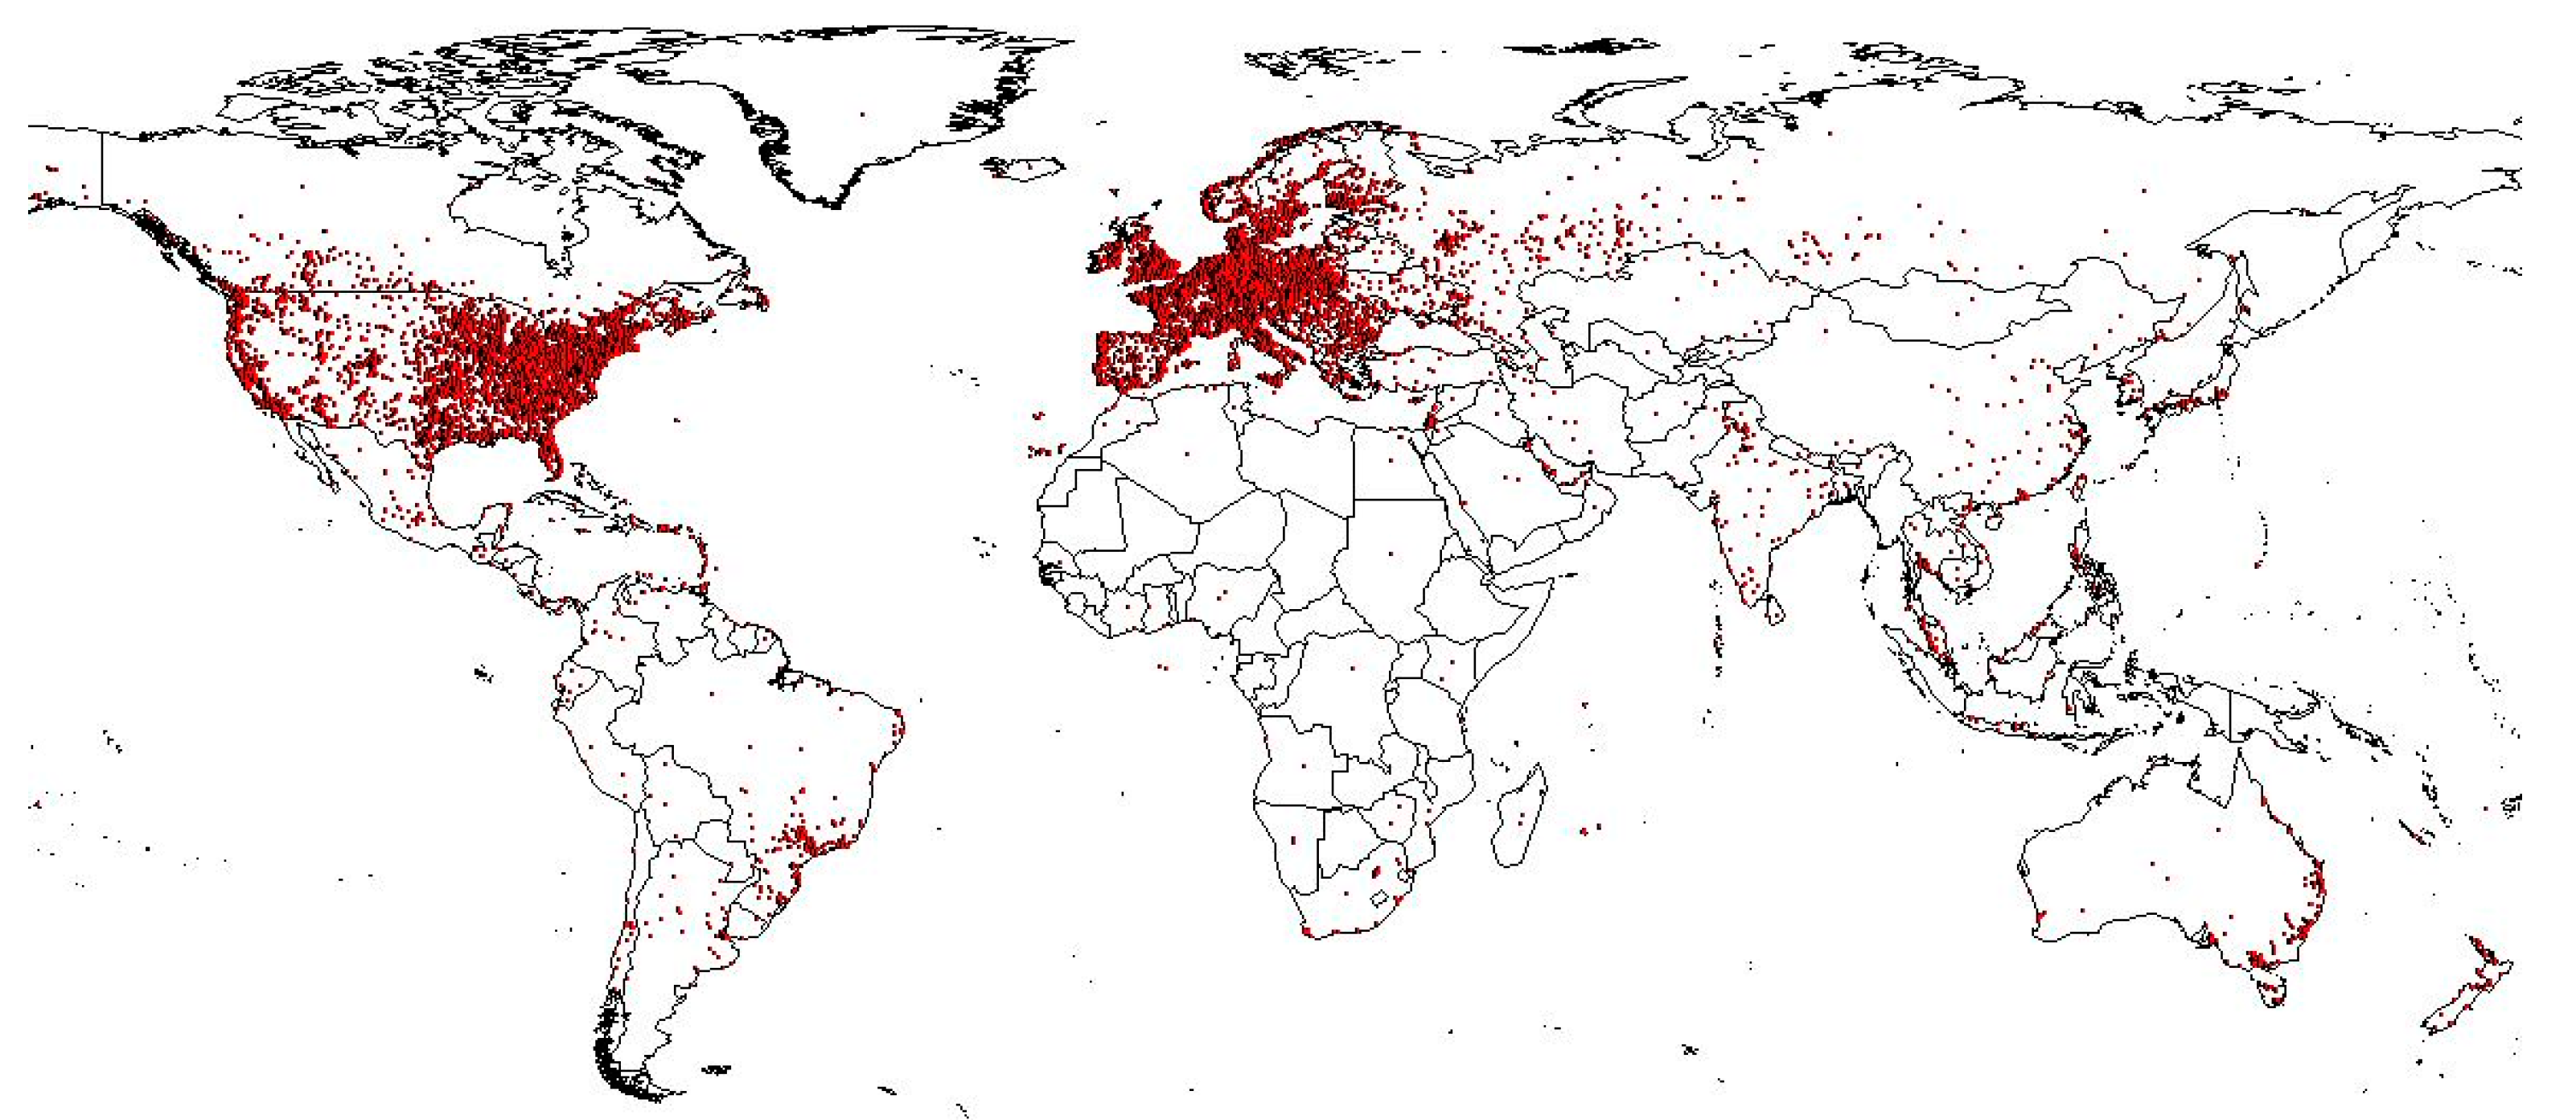
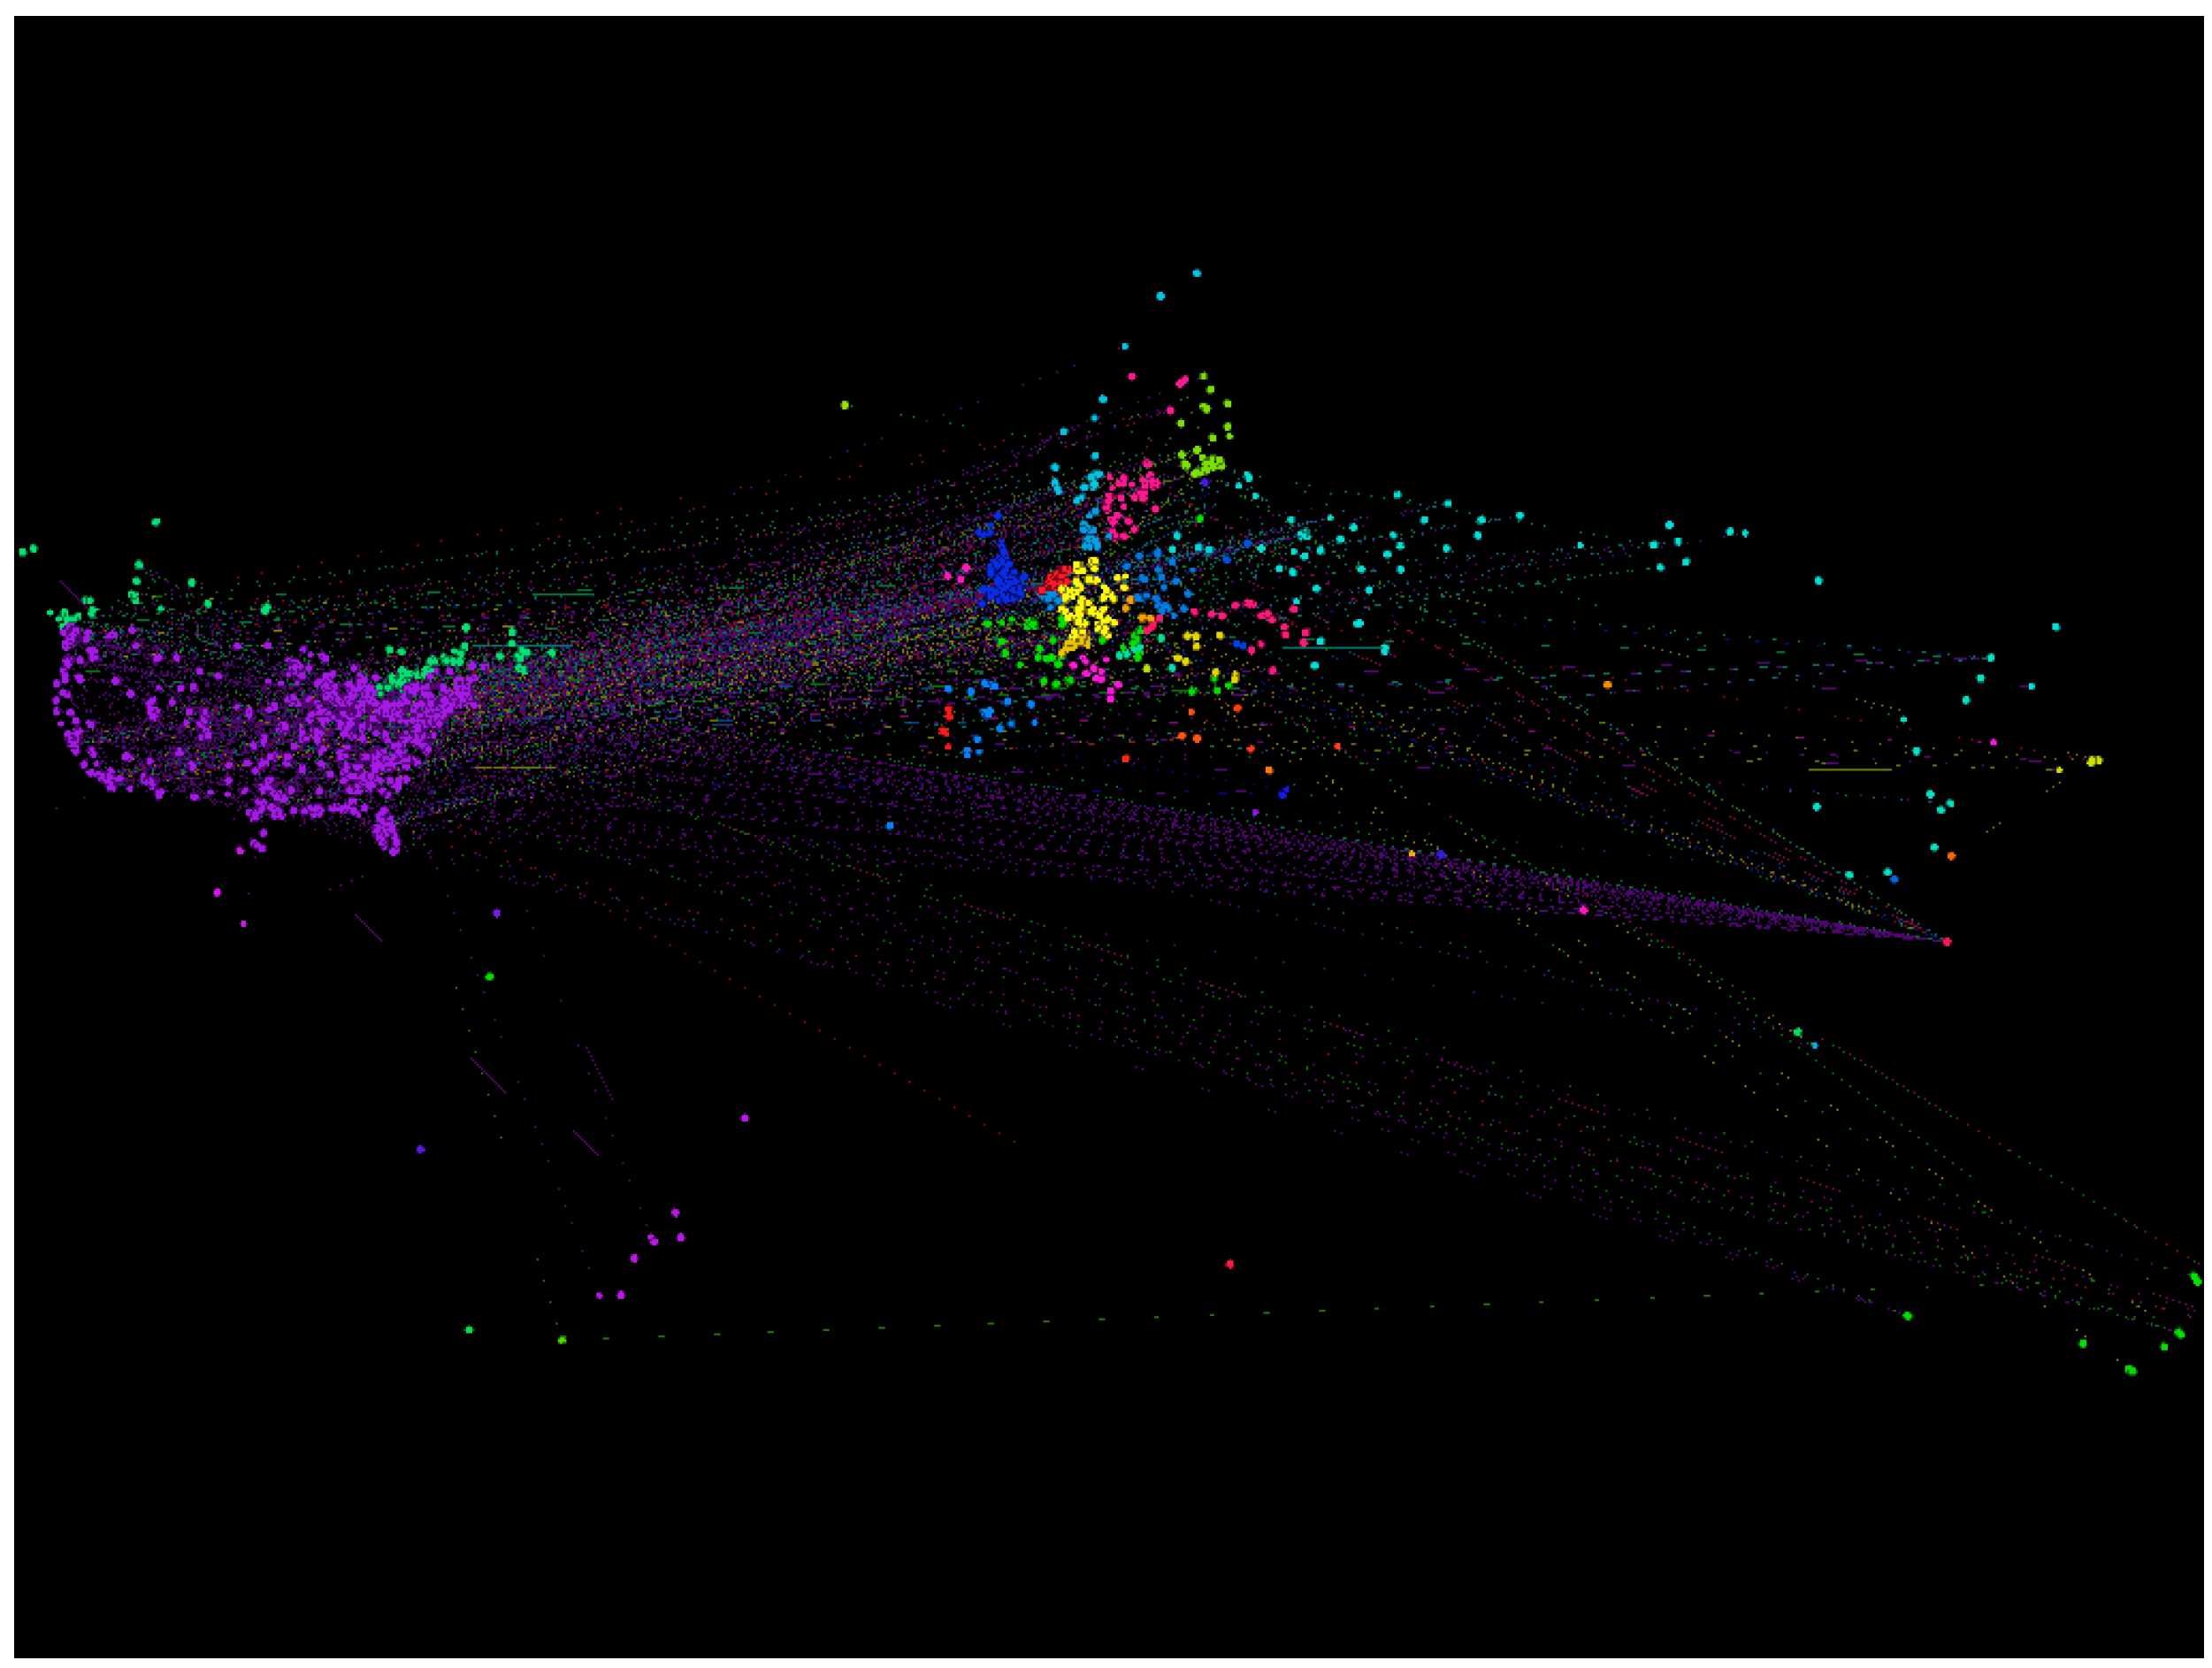
Since there is a high correlation of 0.996 between the number of transactions and the value in BTC on the country level aggregation, the focus is on the value in BTC for measuring the activity of Bitcoin users among different countries. The first global representation of the Bitcoin network in Figure 13 shows the geo-located IP nodes that were used to execute transactions until the 10th April 2013. There is a high amount of IP nodes in Europe and the U.S. When considering areas with a higher concentration such as the east coast of China, Australia, Brazil, the southern area of Canada and Scandinavia, or western Russia, there might be a positive relationship between well-developed countries with a good infrastructure and the usage of Bitcoins.
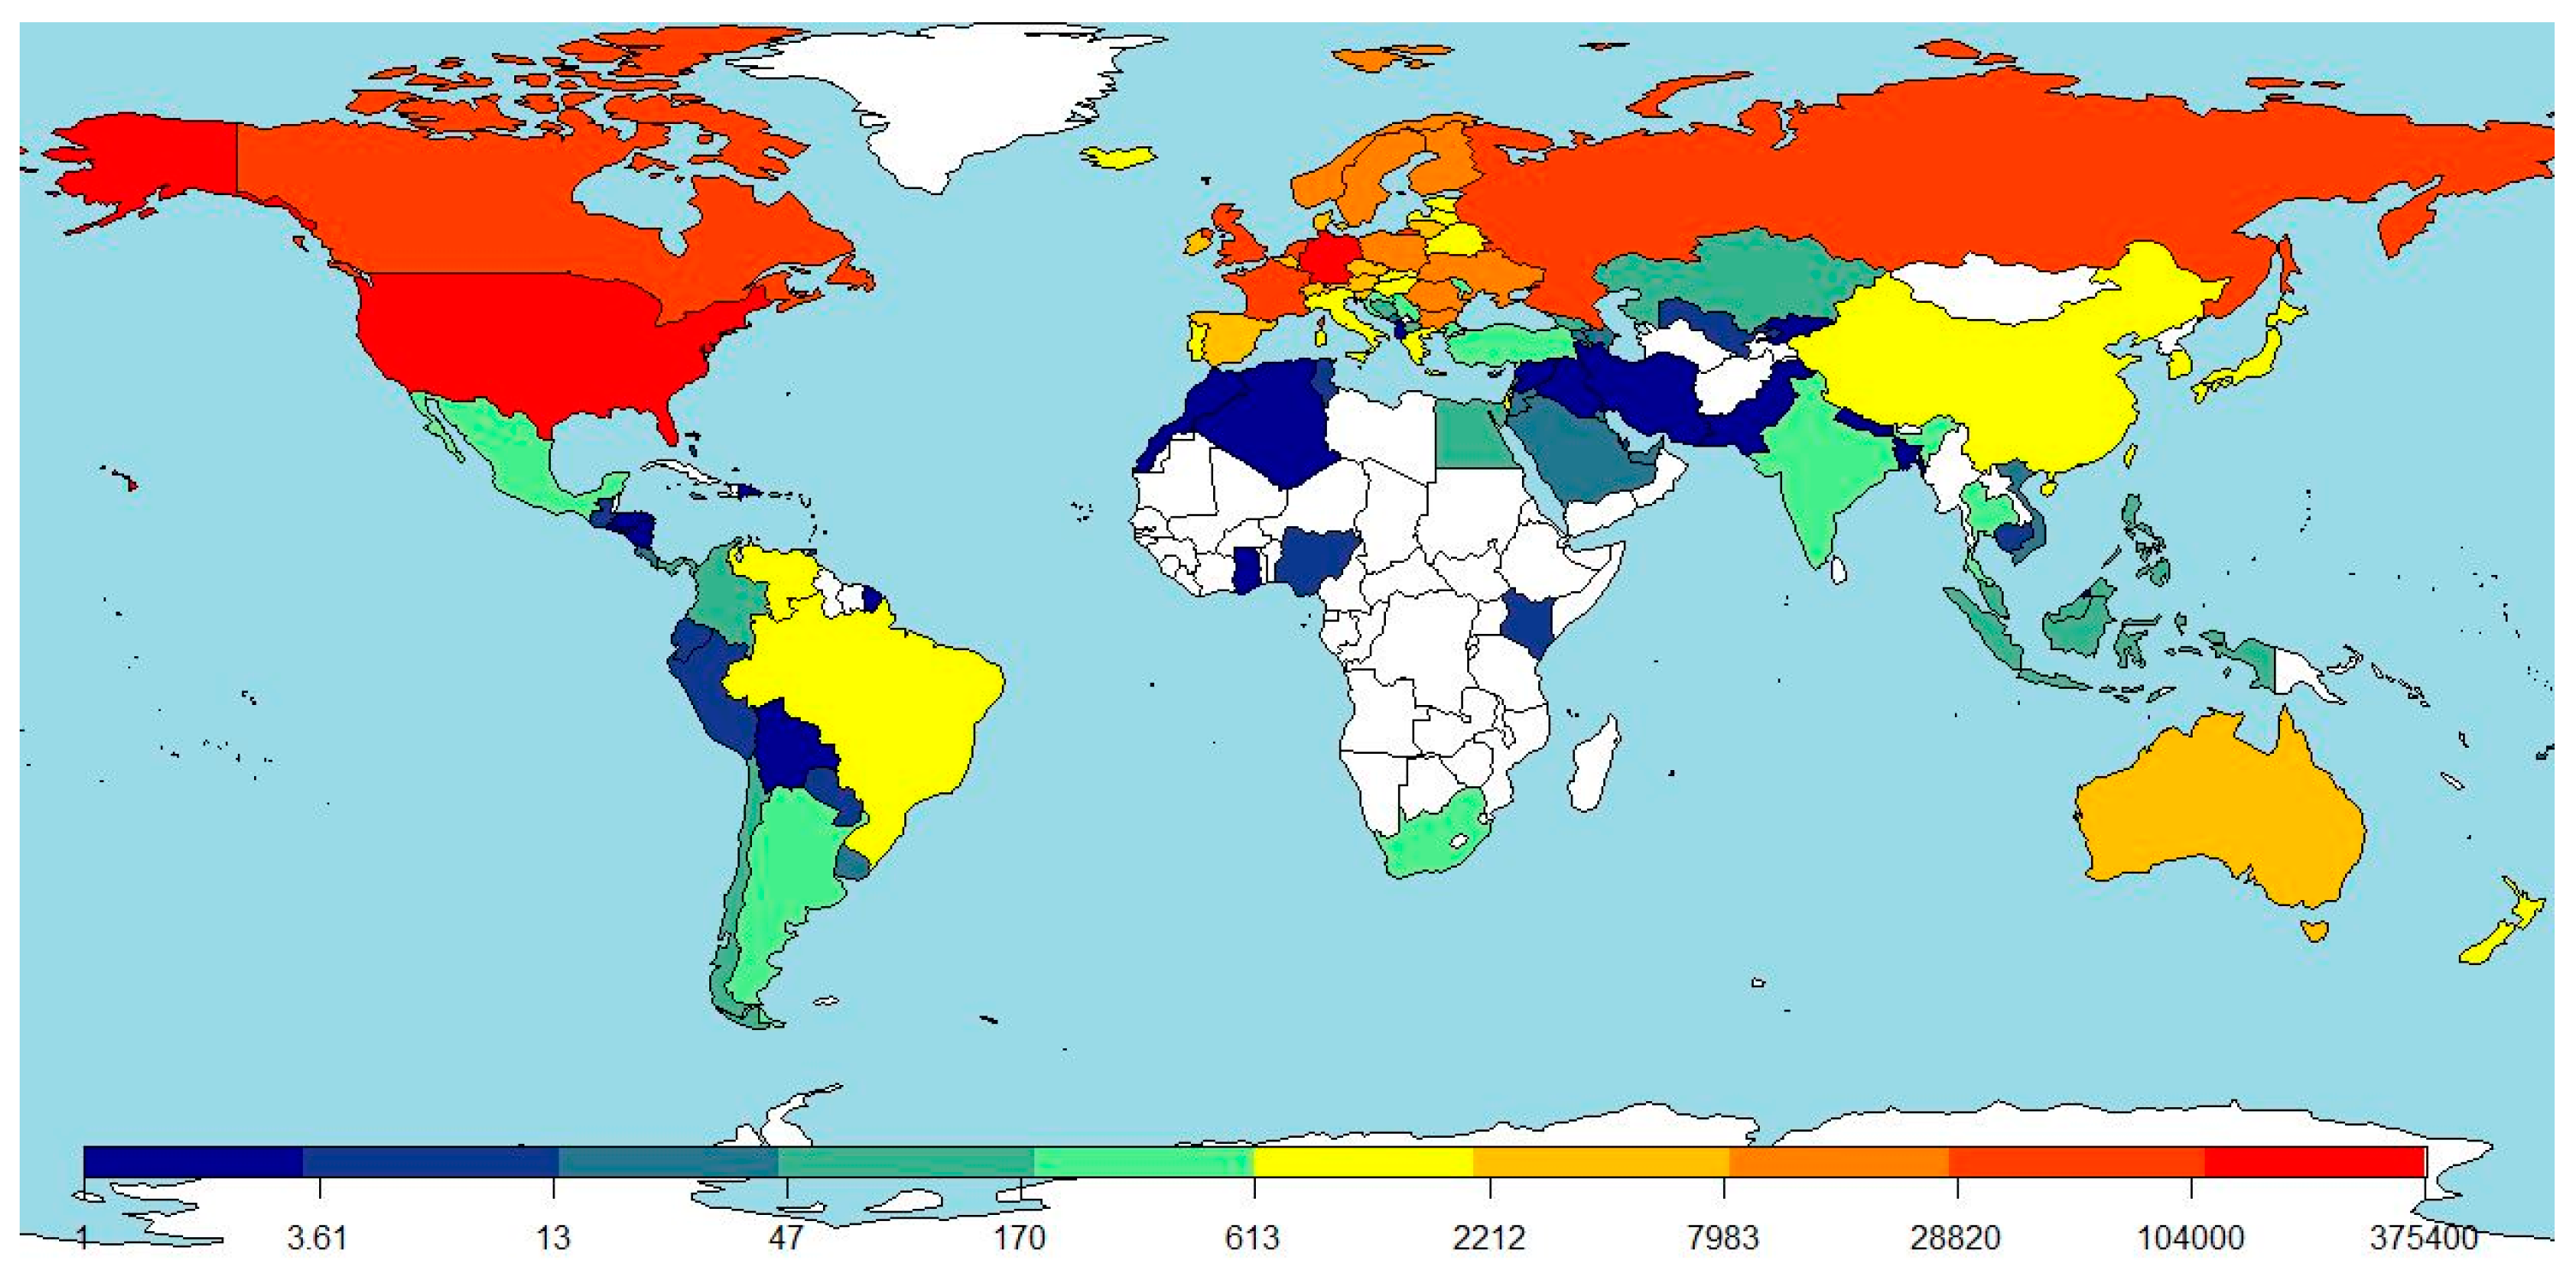
Figure 14 shows the transaction volume in BTC per country on a global scale with a range from 1000 BTC to around 375 million BTC. As indicated above, well-developed countries with a good Internet infrastructure are dominant in the Bitcoin economy. Germany and the U.S. are the major markets with trading volumes of around 266 million BTC and 375 million BTC, respectively. One can also see that the emerging markets such as Russia, Brazil, or China becoming quite active in the economy.
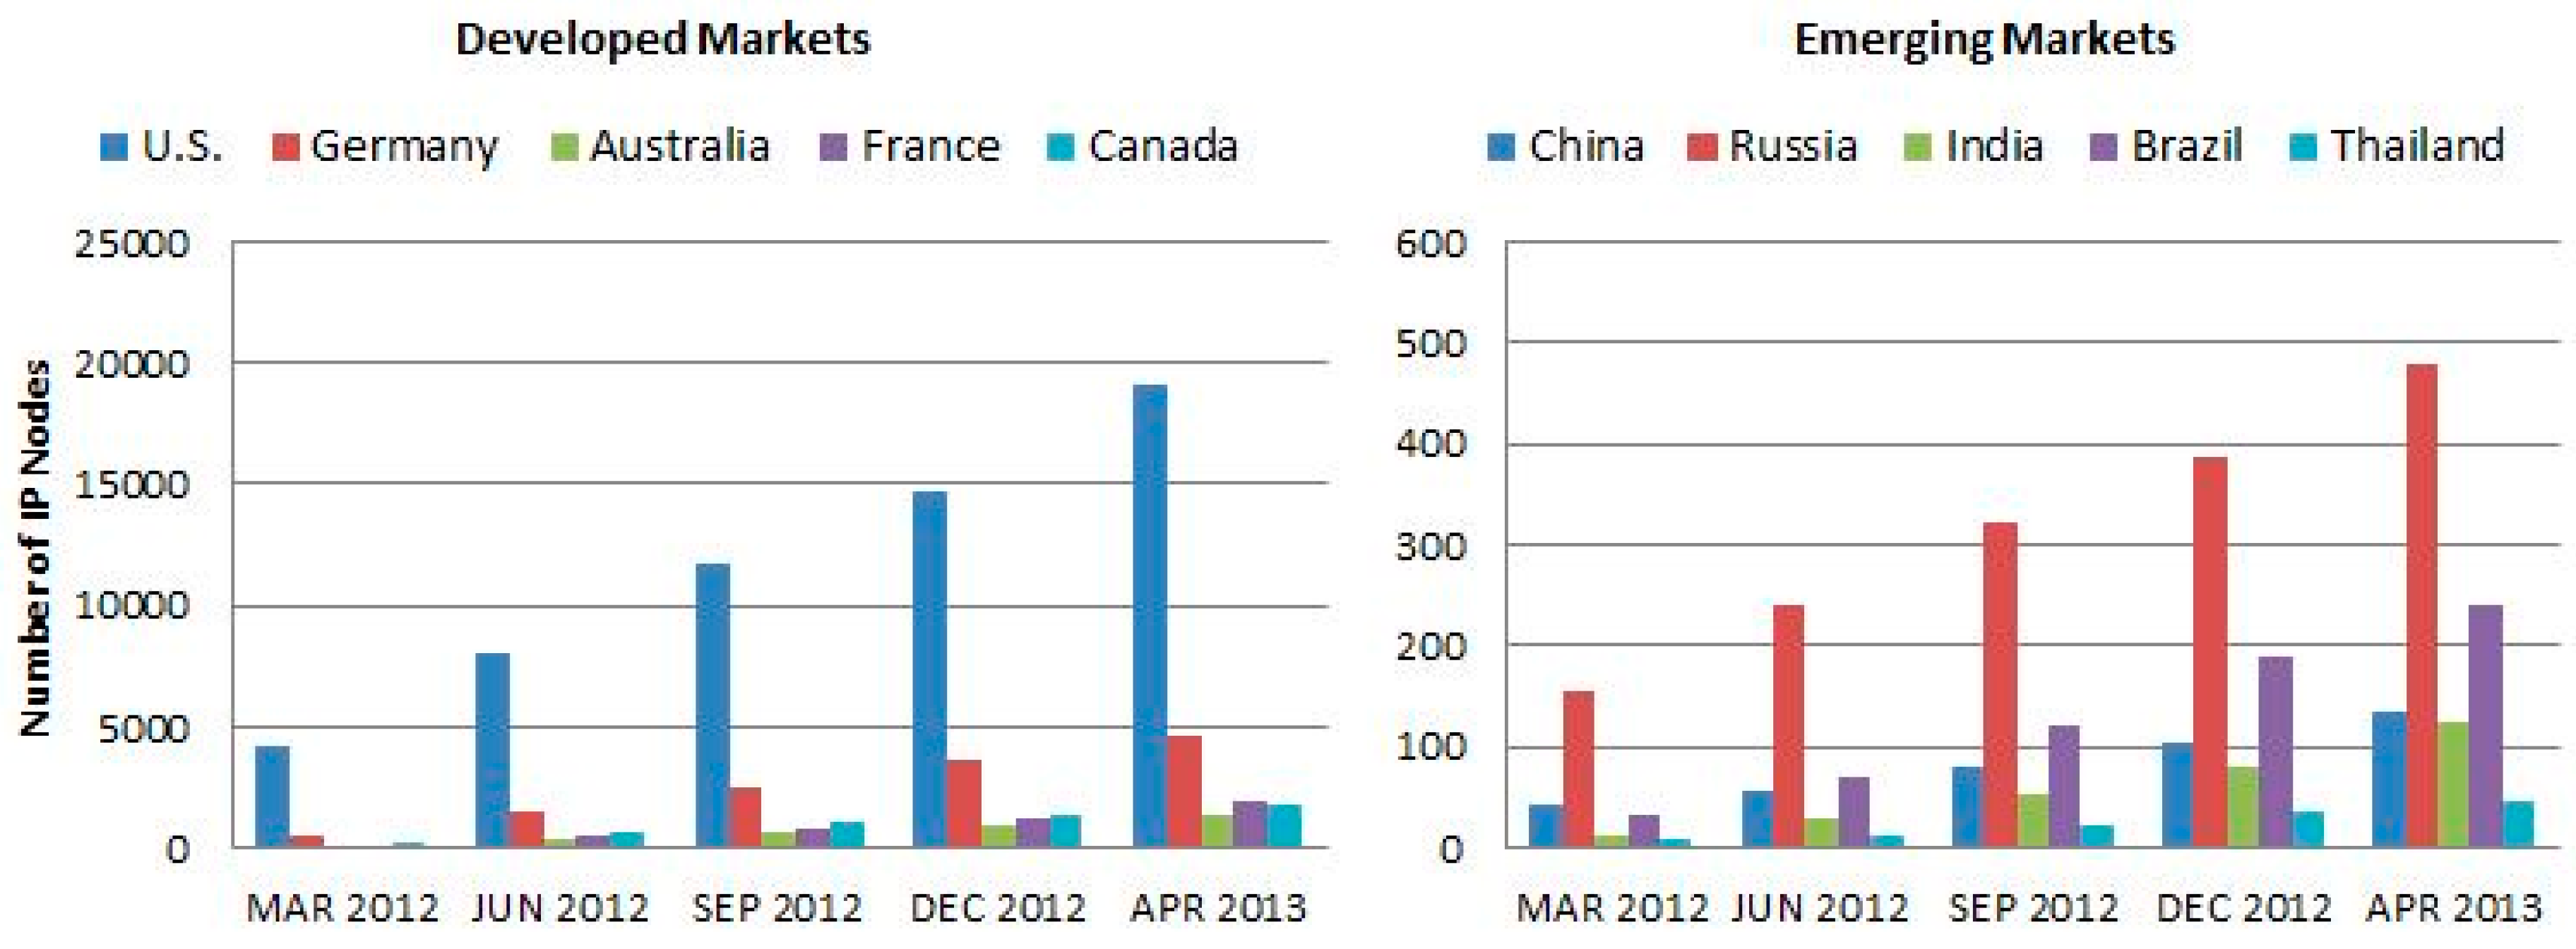
The growth of particular countries is shown in Figure 15 as examples of network emergence in five developed markets (U.S., Germany, Australia, France, and Canada) and five growth markets (China, Russia, India, Brazil, and Thailand). There is an almost linear growth in the number of used IP nodes within the network. Interesting is the rather small number of IP nodes in countries such as Russia (480 nodes) and the respective Bitcoin volume of around 45.7 million BTC in comparison to countries such as Canada (1722 nodes) with a transacted volume of 37.5 million BTC.
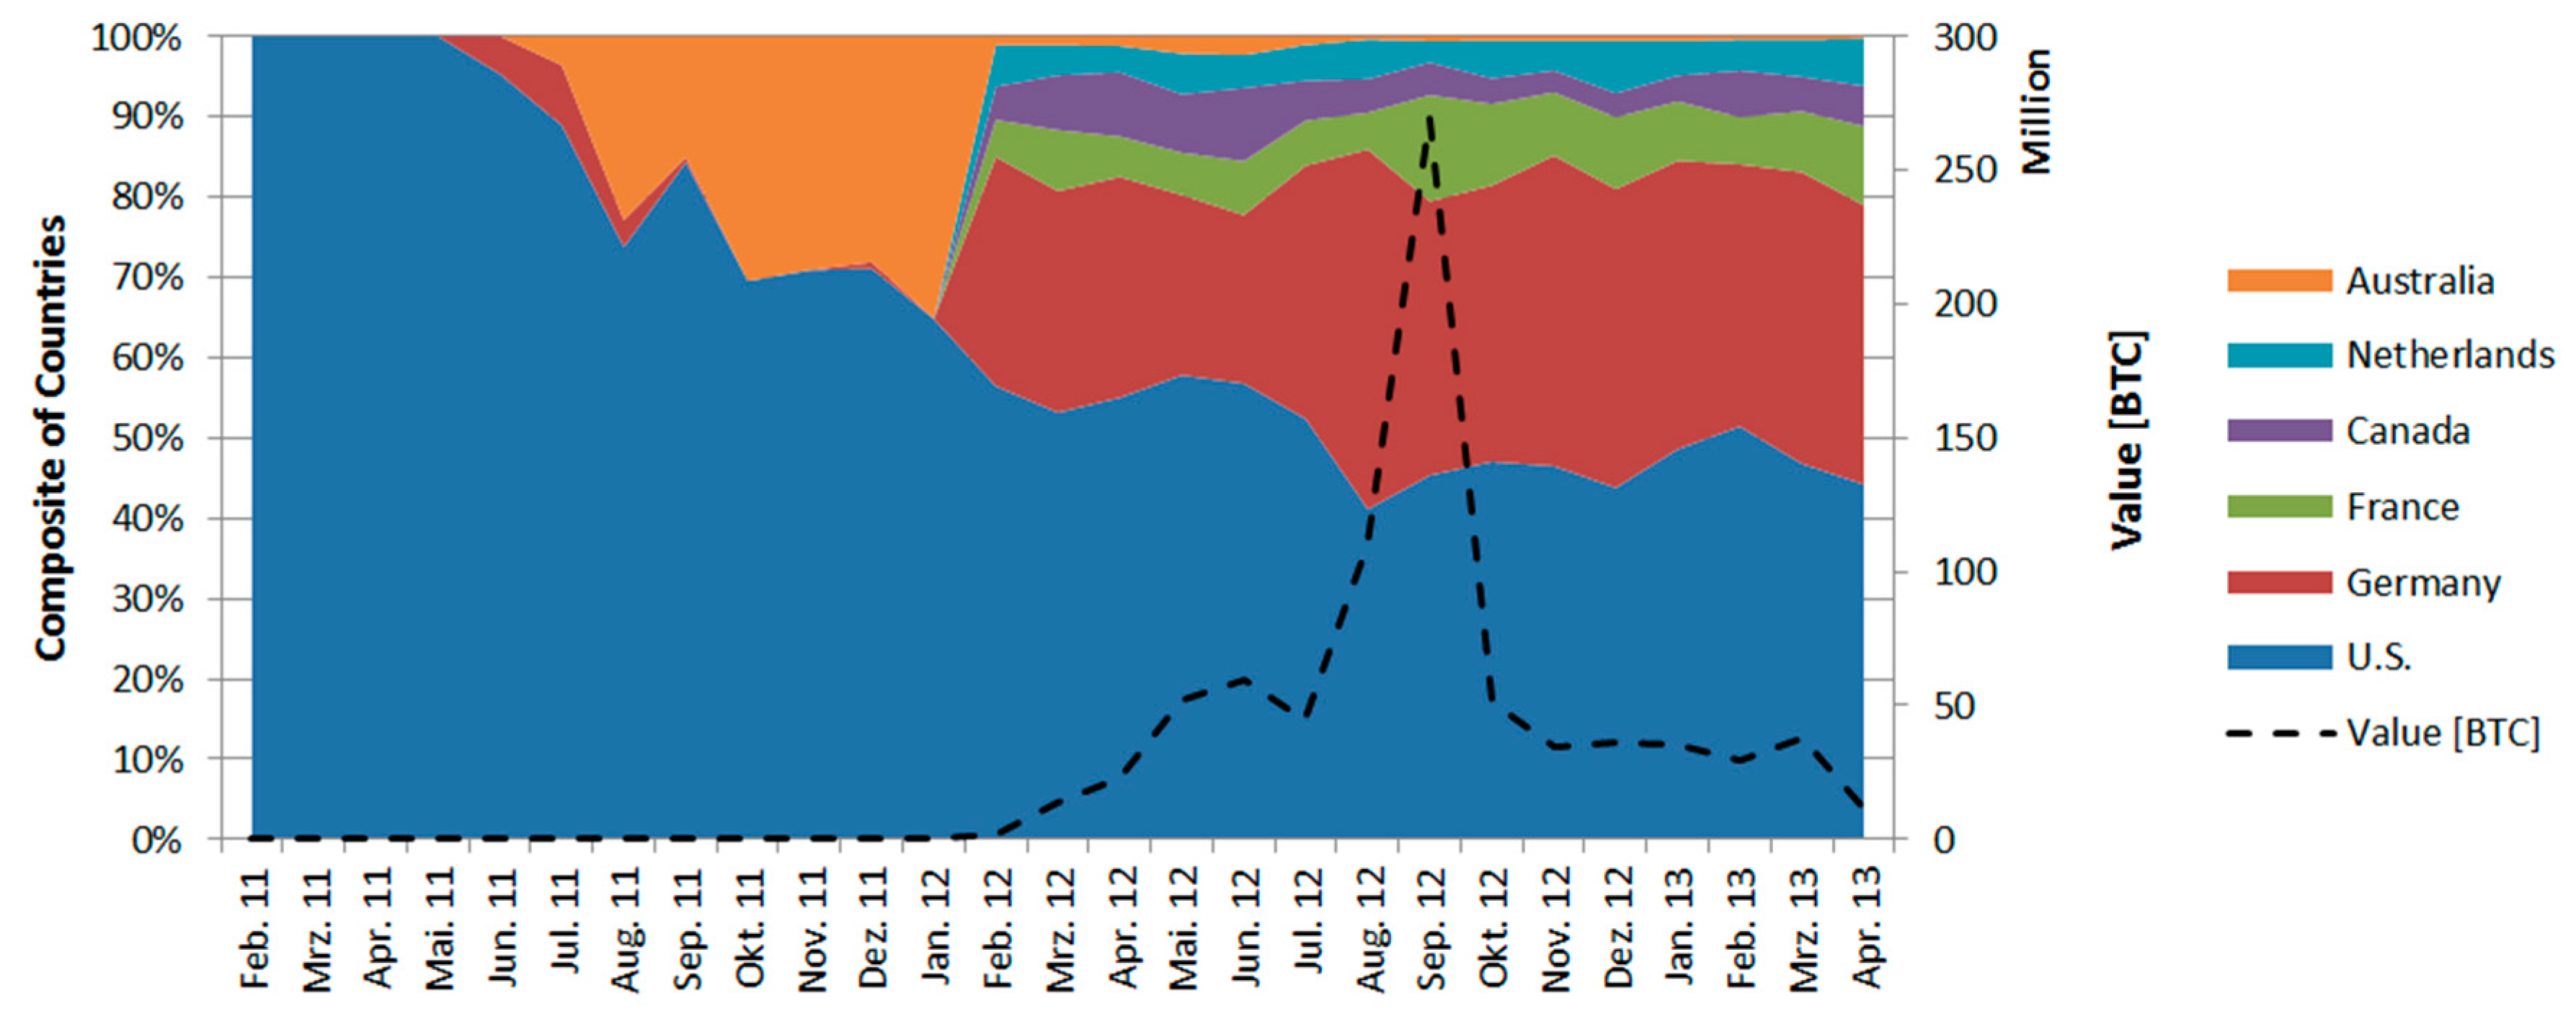
The composite of particular developed countries in the Bitcoin network is measured by the transaction volume over time and depicted in Figure 16. One can see that the U.S. was the first country with transactions that could be linked to IP nodes in the network. In this early stage of the Bitcoin economy Germany and especially Australia became more active, although the overall transaction volume stays at lower levels. Since more developed countries such as Canada, France, and the Netherlands could be related to transactions in the network, the geographic contribution of these countries seems to be stable over time (February 2012–April 2013). Even the tremendous increase in transaction volume with a peak of around 270 million BTC in September 2012 had no influence on the composite of countries in that time frame. This indicates that these countries and their respective users behave in the same way in the Bitcoin economy (i.e., all countries increased their transacted volume and lowered it within that particular time frame).
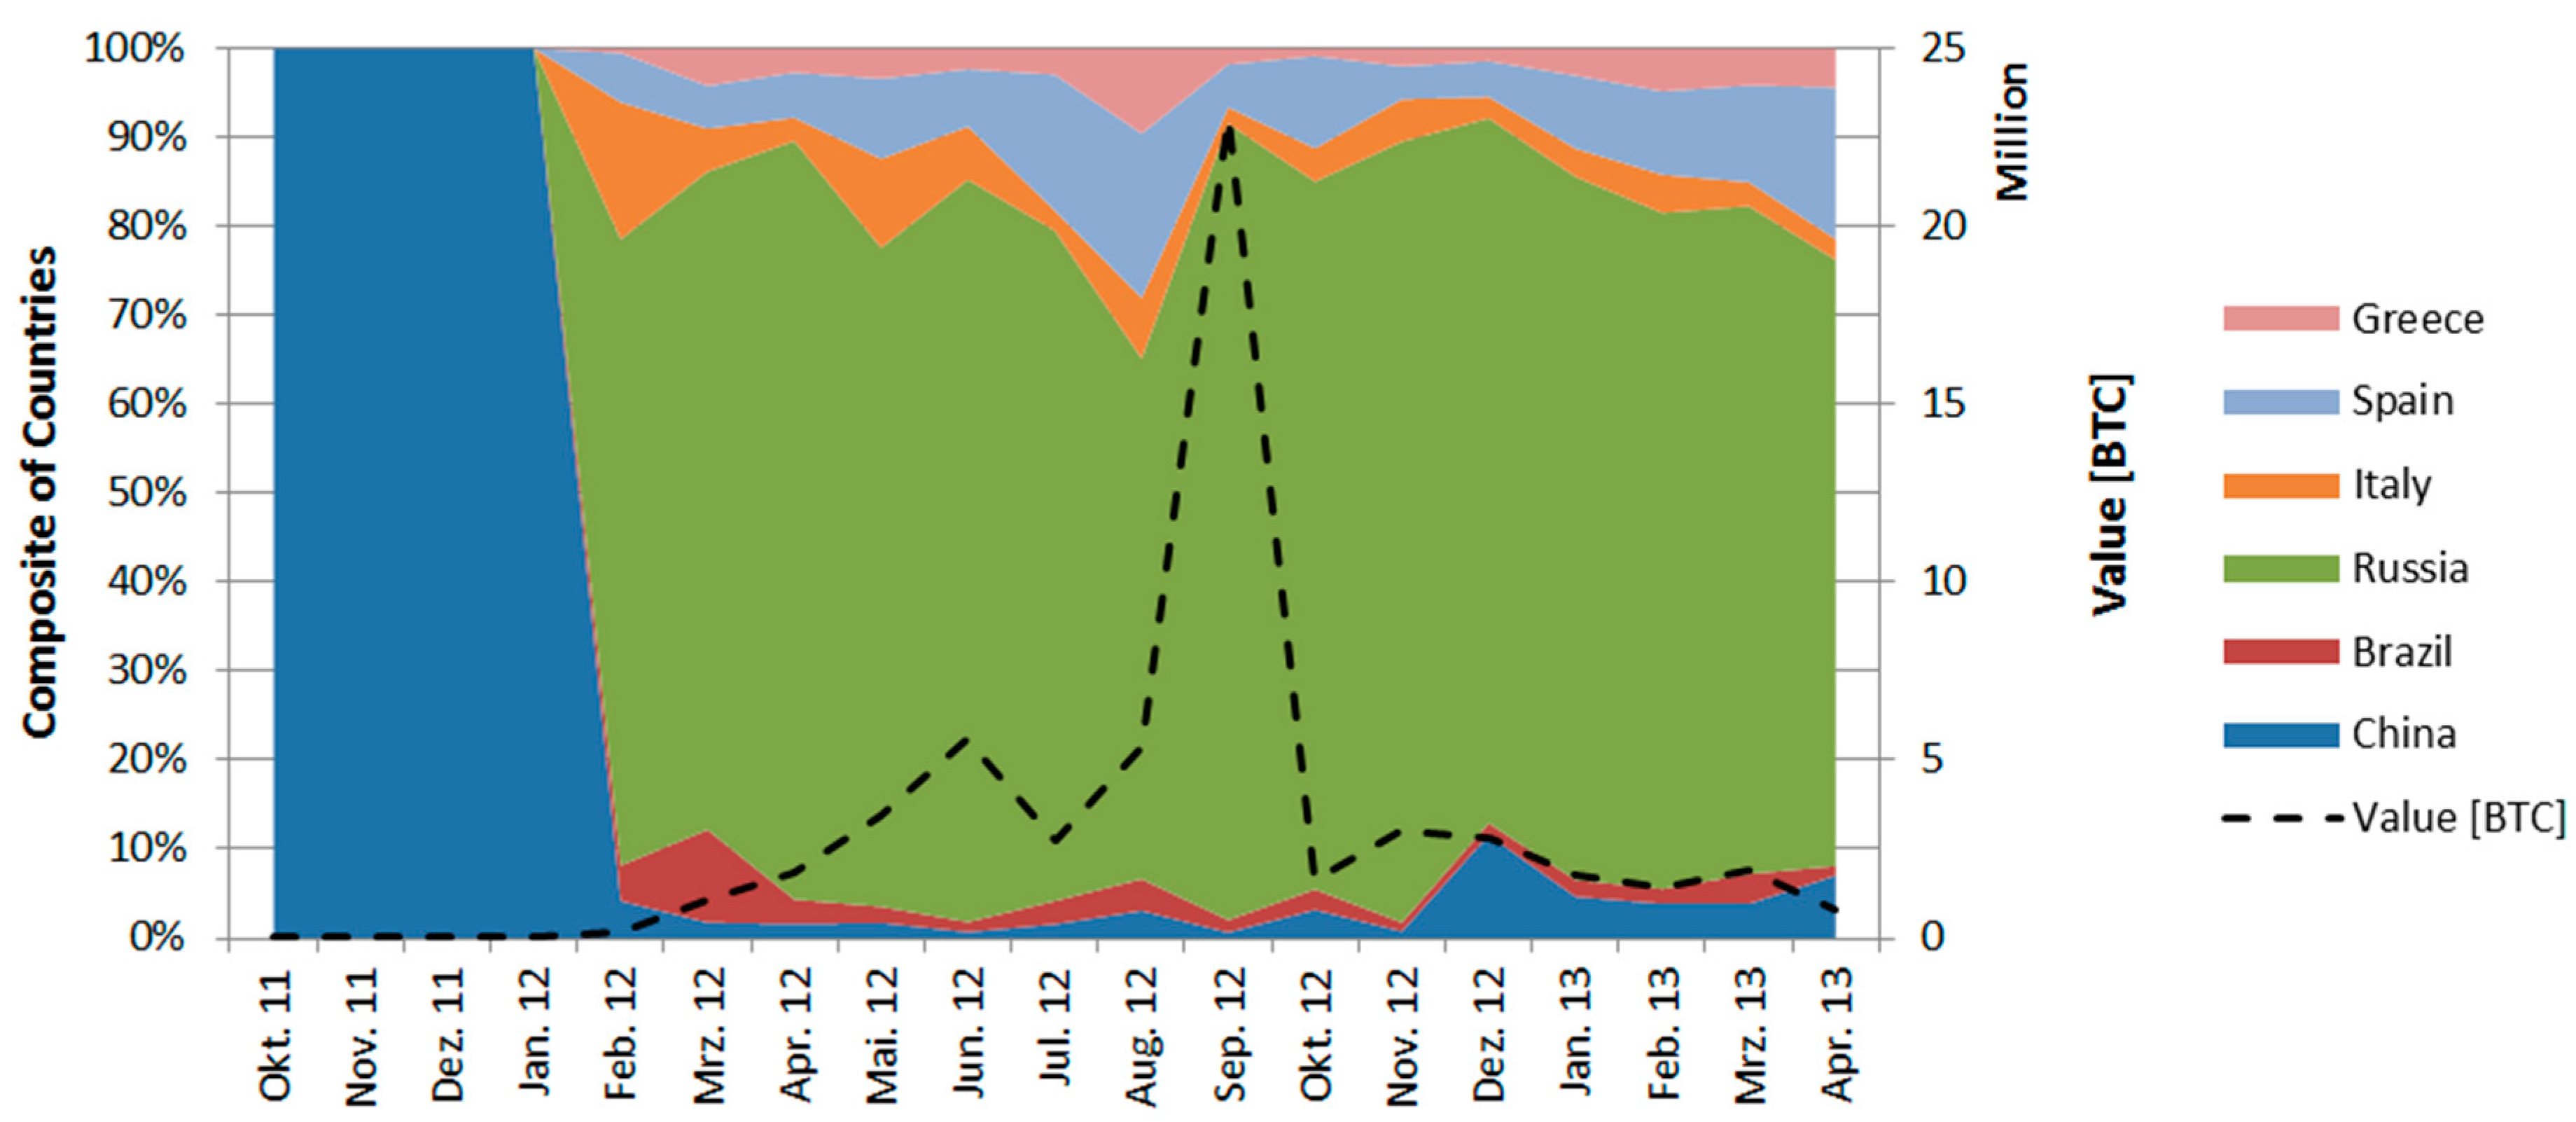
Figure 17 shows the same statistics for three emerging markets and three countries that were hit by the European financial crisis. China is the first of the emerging countries that could be linked to transactions in the network.
With the linkage of transactions executed in Russia starting in January 2012, Russia becomes the major actor among emerging markets. As one could see in the previous statistics for the developed countries, the fluctuations in contribution to the Bitcoin economy are quite stable and not influenced by the transacted volume. The huge impact of the Russian market and the rather low influence from China when considering the transacted volume can be explained by the business distribution of these countries that are shown in the following statistics.
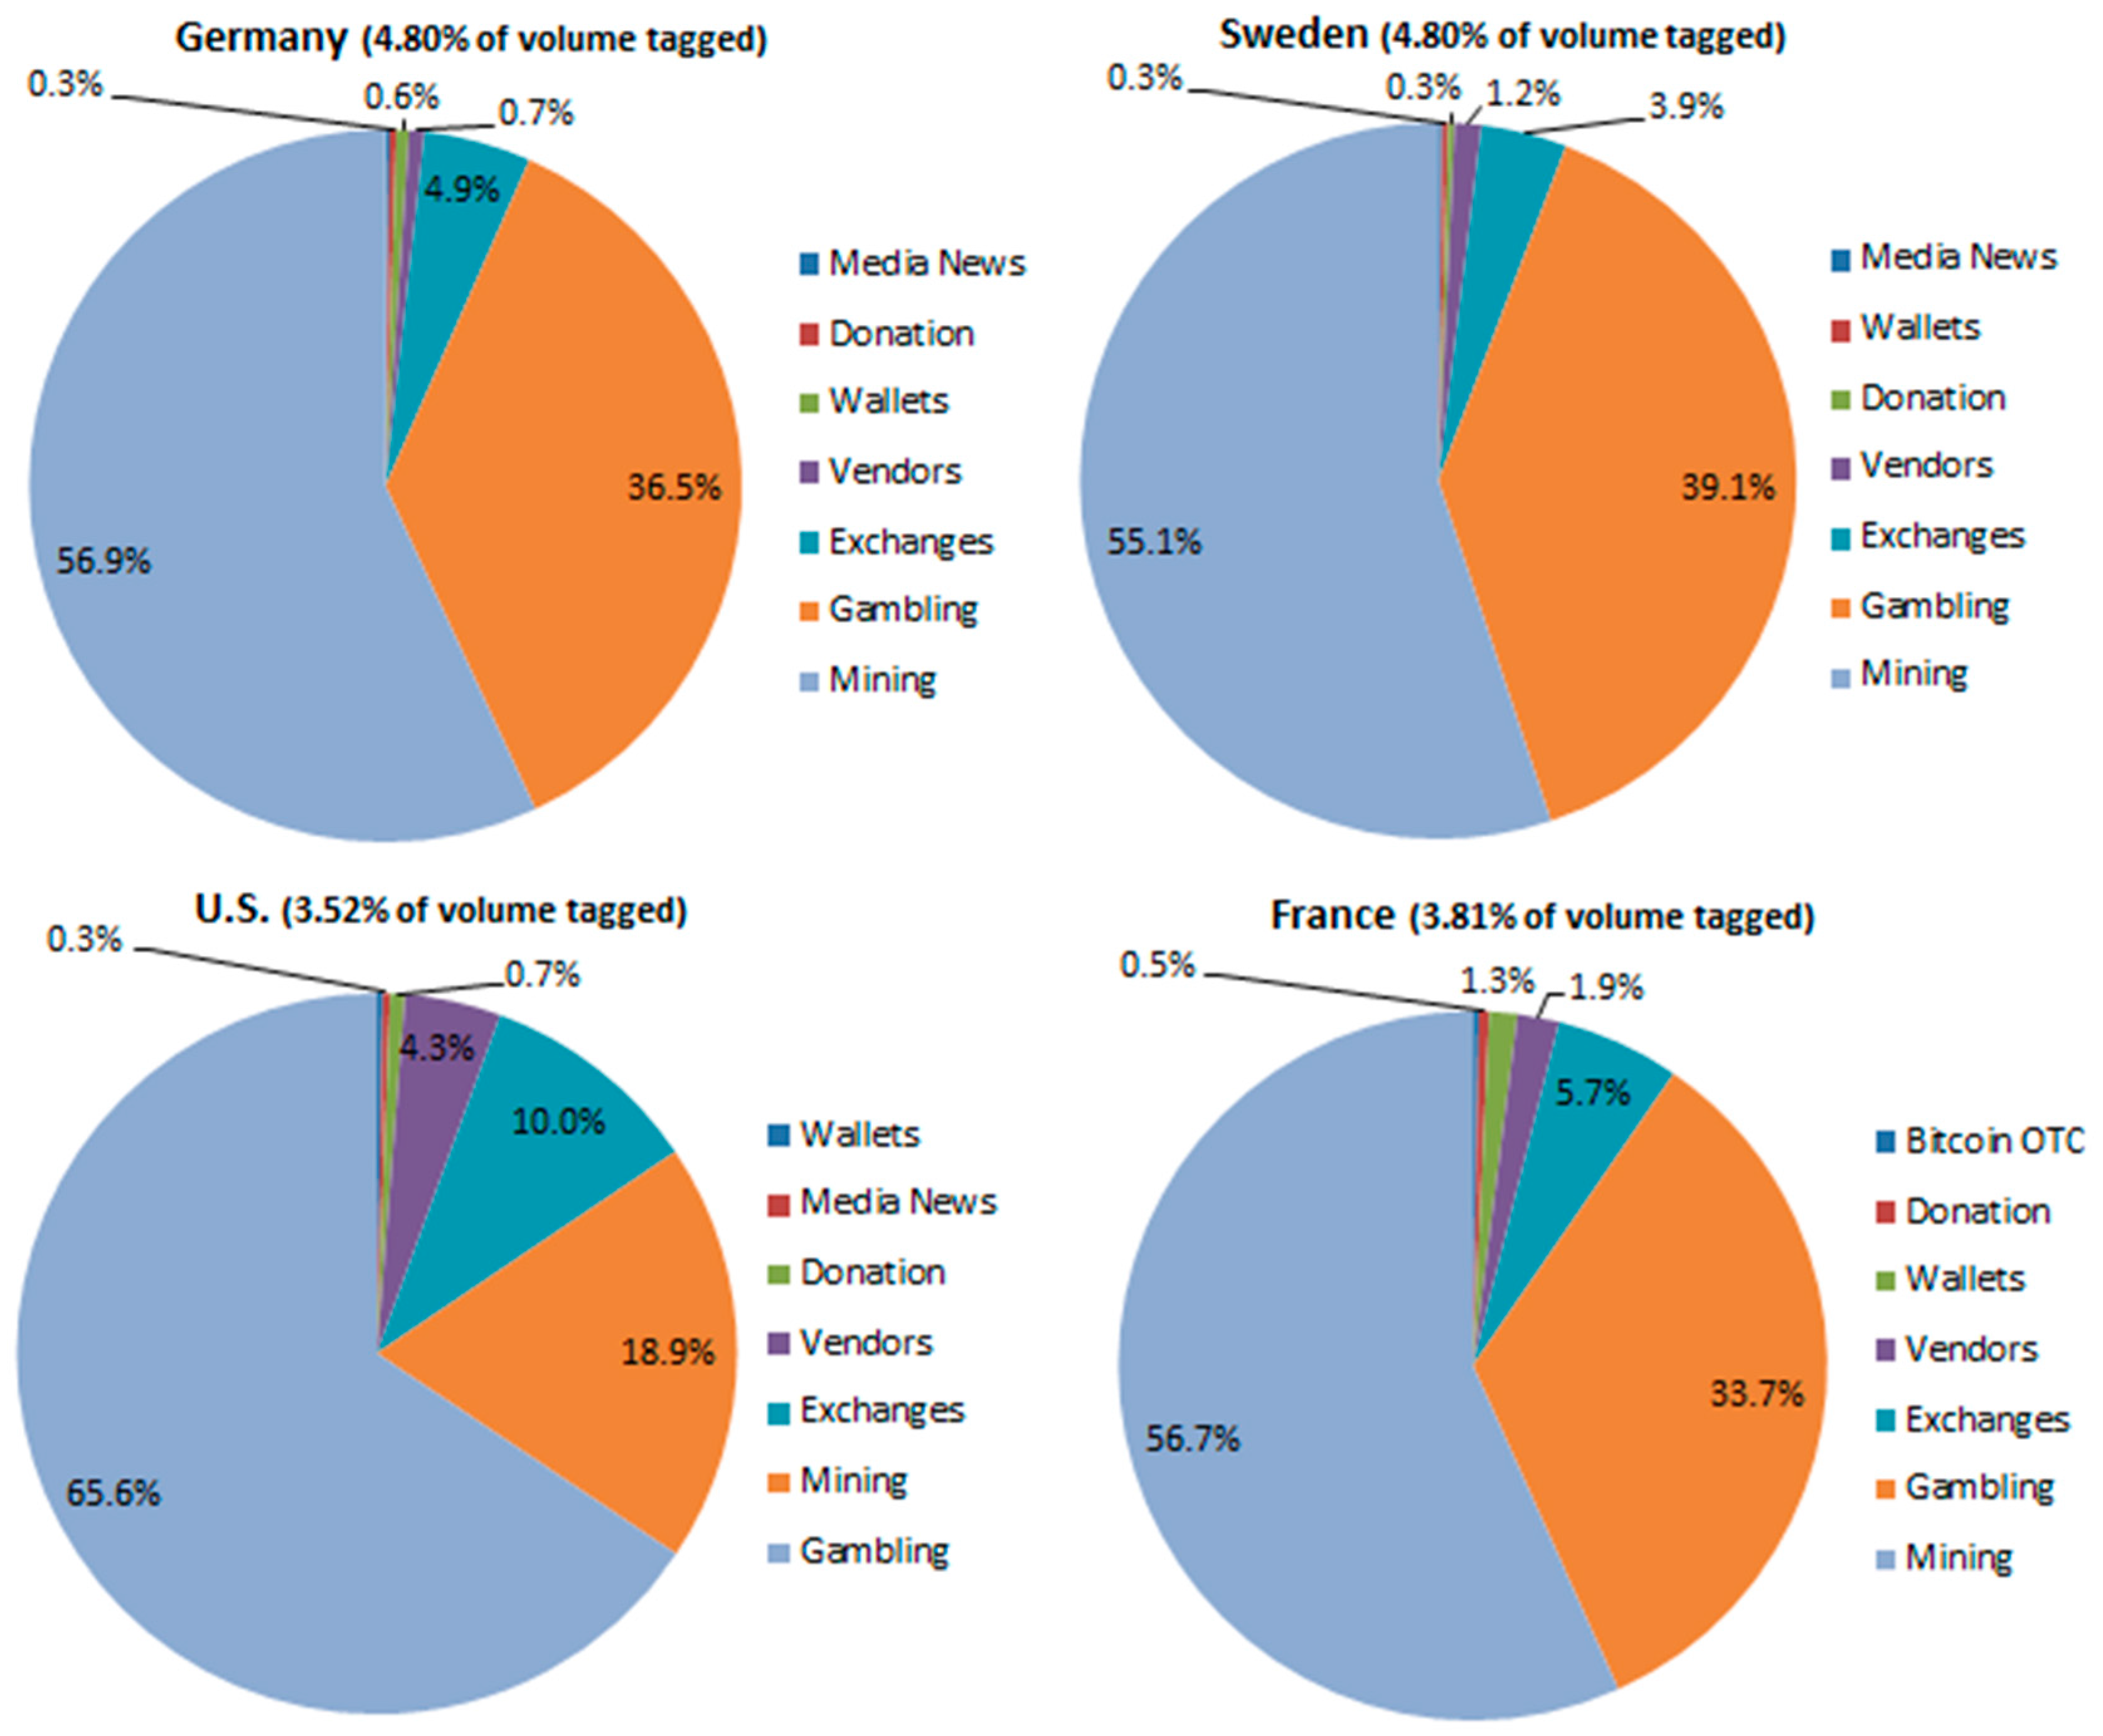
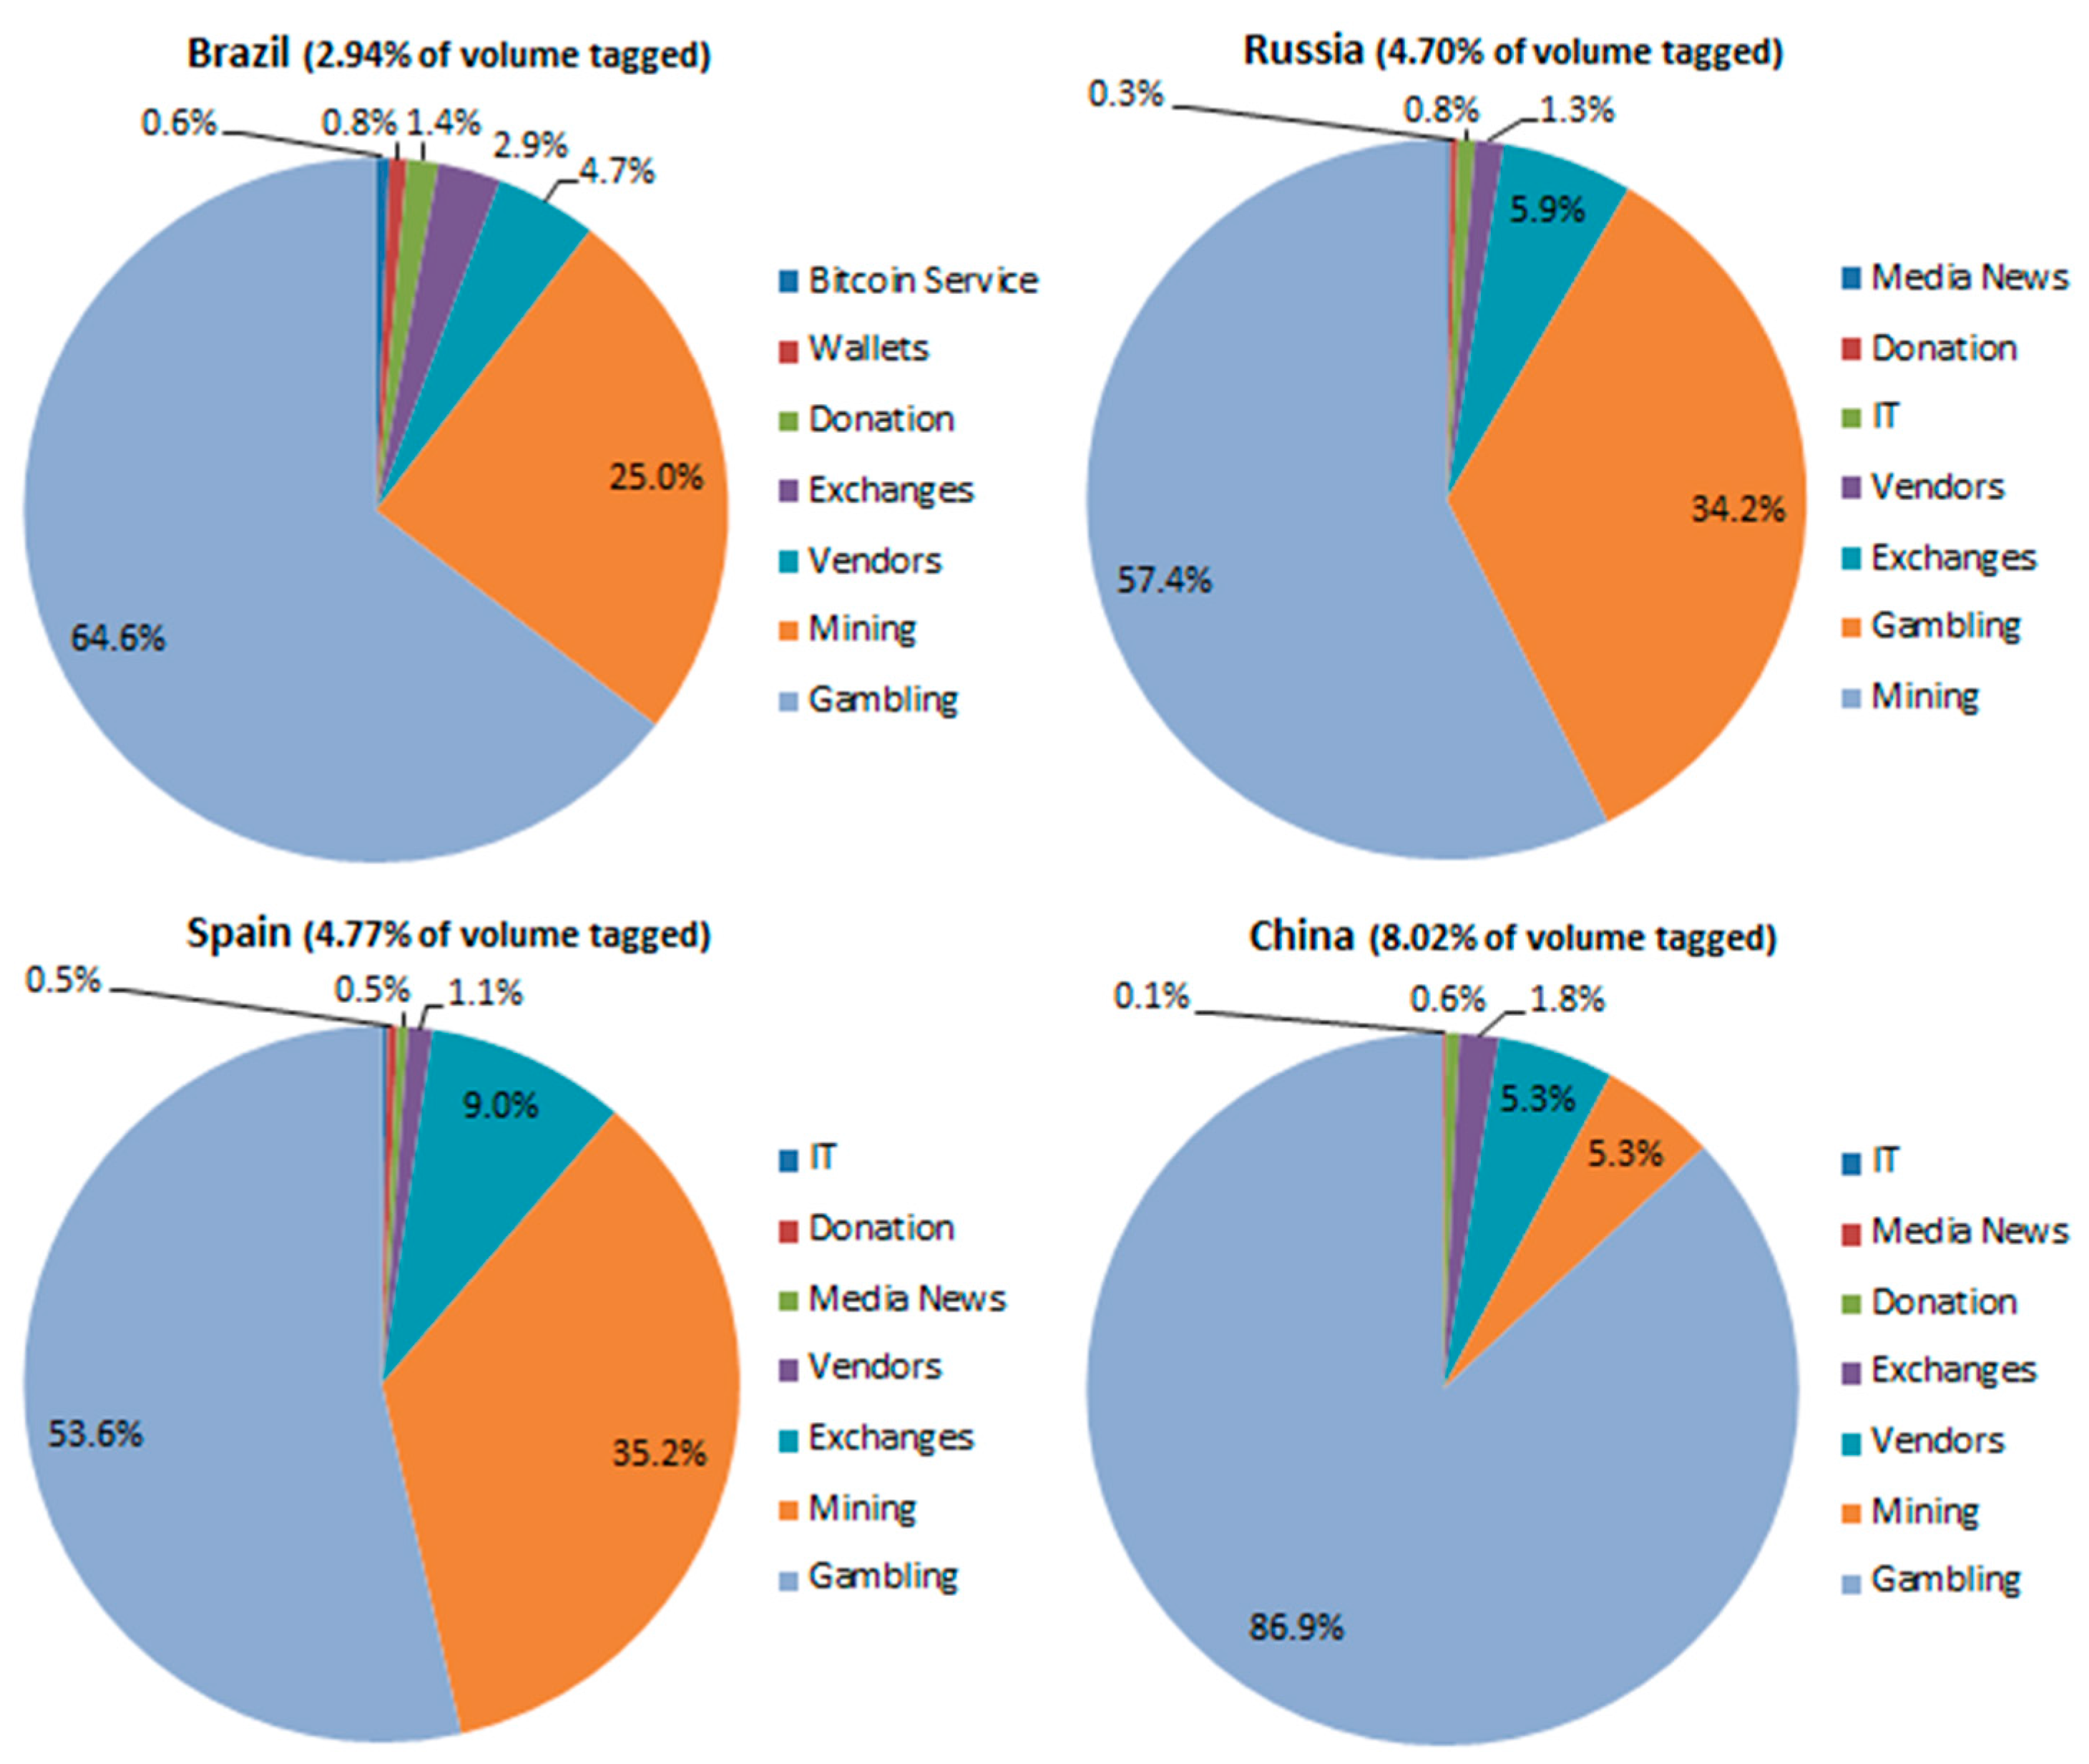
Although just a small fraction of the volume could be linked to business categories, the statistics give a good insight in the Bitcoin economy of particular countries. When looking at the European countries Germany, Sweden, and France (Figure 18), one can see that the distribution of businesses is almost the same in these countries with a focus on the mining business with around 56%. The U.S. Bitcoin economy is different from the European since the largest transaction volume is linked to the gambling business with around 66% and just 19% can be associated to mining activities. Furthermore, the trading activities on exchanges and with vendors are higher than in developed European countries. There is a sign that the business distribution differs between continents and not just between certain countries. When considering the North America region with the U.S. and Canada, where both have a common business distribution as it can be seen for the northern European countries.
The same statistics for the emerging markets (Figure 19) show much different business distributions among the countries. Russia has almost the same distribution like the northern European countries, with a focus on mining businesses with around 57%, followed by the gambling and exchanges business with around 34% and 6%, respectively. A complete different business distribution can be seen for the Chinese market with a strong focus on the gambling sector with around 87% and just a small fraction is attributed to the mining, vendors, and exchanges business. This is not uncommon since it is well known that China is one of the biggest gambling markets globally. The small contribution of transaction volume to the emerging markets volume over time shown in Figure 17 can be explained by this distribution, because gambling businesses transact very low volumes of Bitcoins compared to the mining and exchange businesses. In contrast to northern European countries, Spain has a higher share in the exchanges business with 9%. This fact can be attributed to the economic crisis in Europe and the higher interest in alternative investments as safe haven. Further investigation on the relationship between economic distressed countries and the evolvement of the Bitcoin economy in this particular countries is an interesting research topic but out of scope in this work.
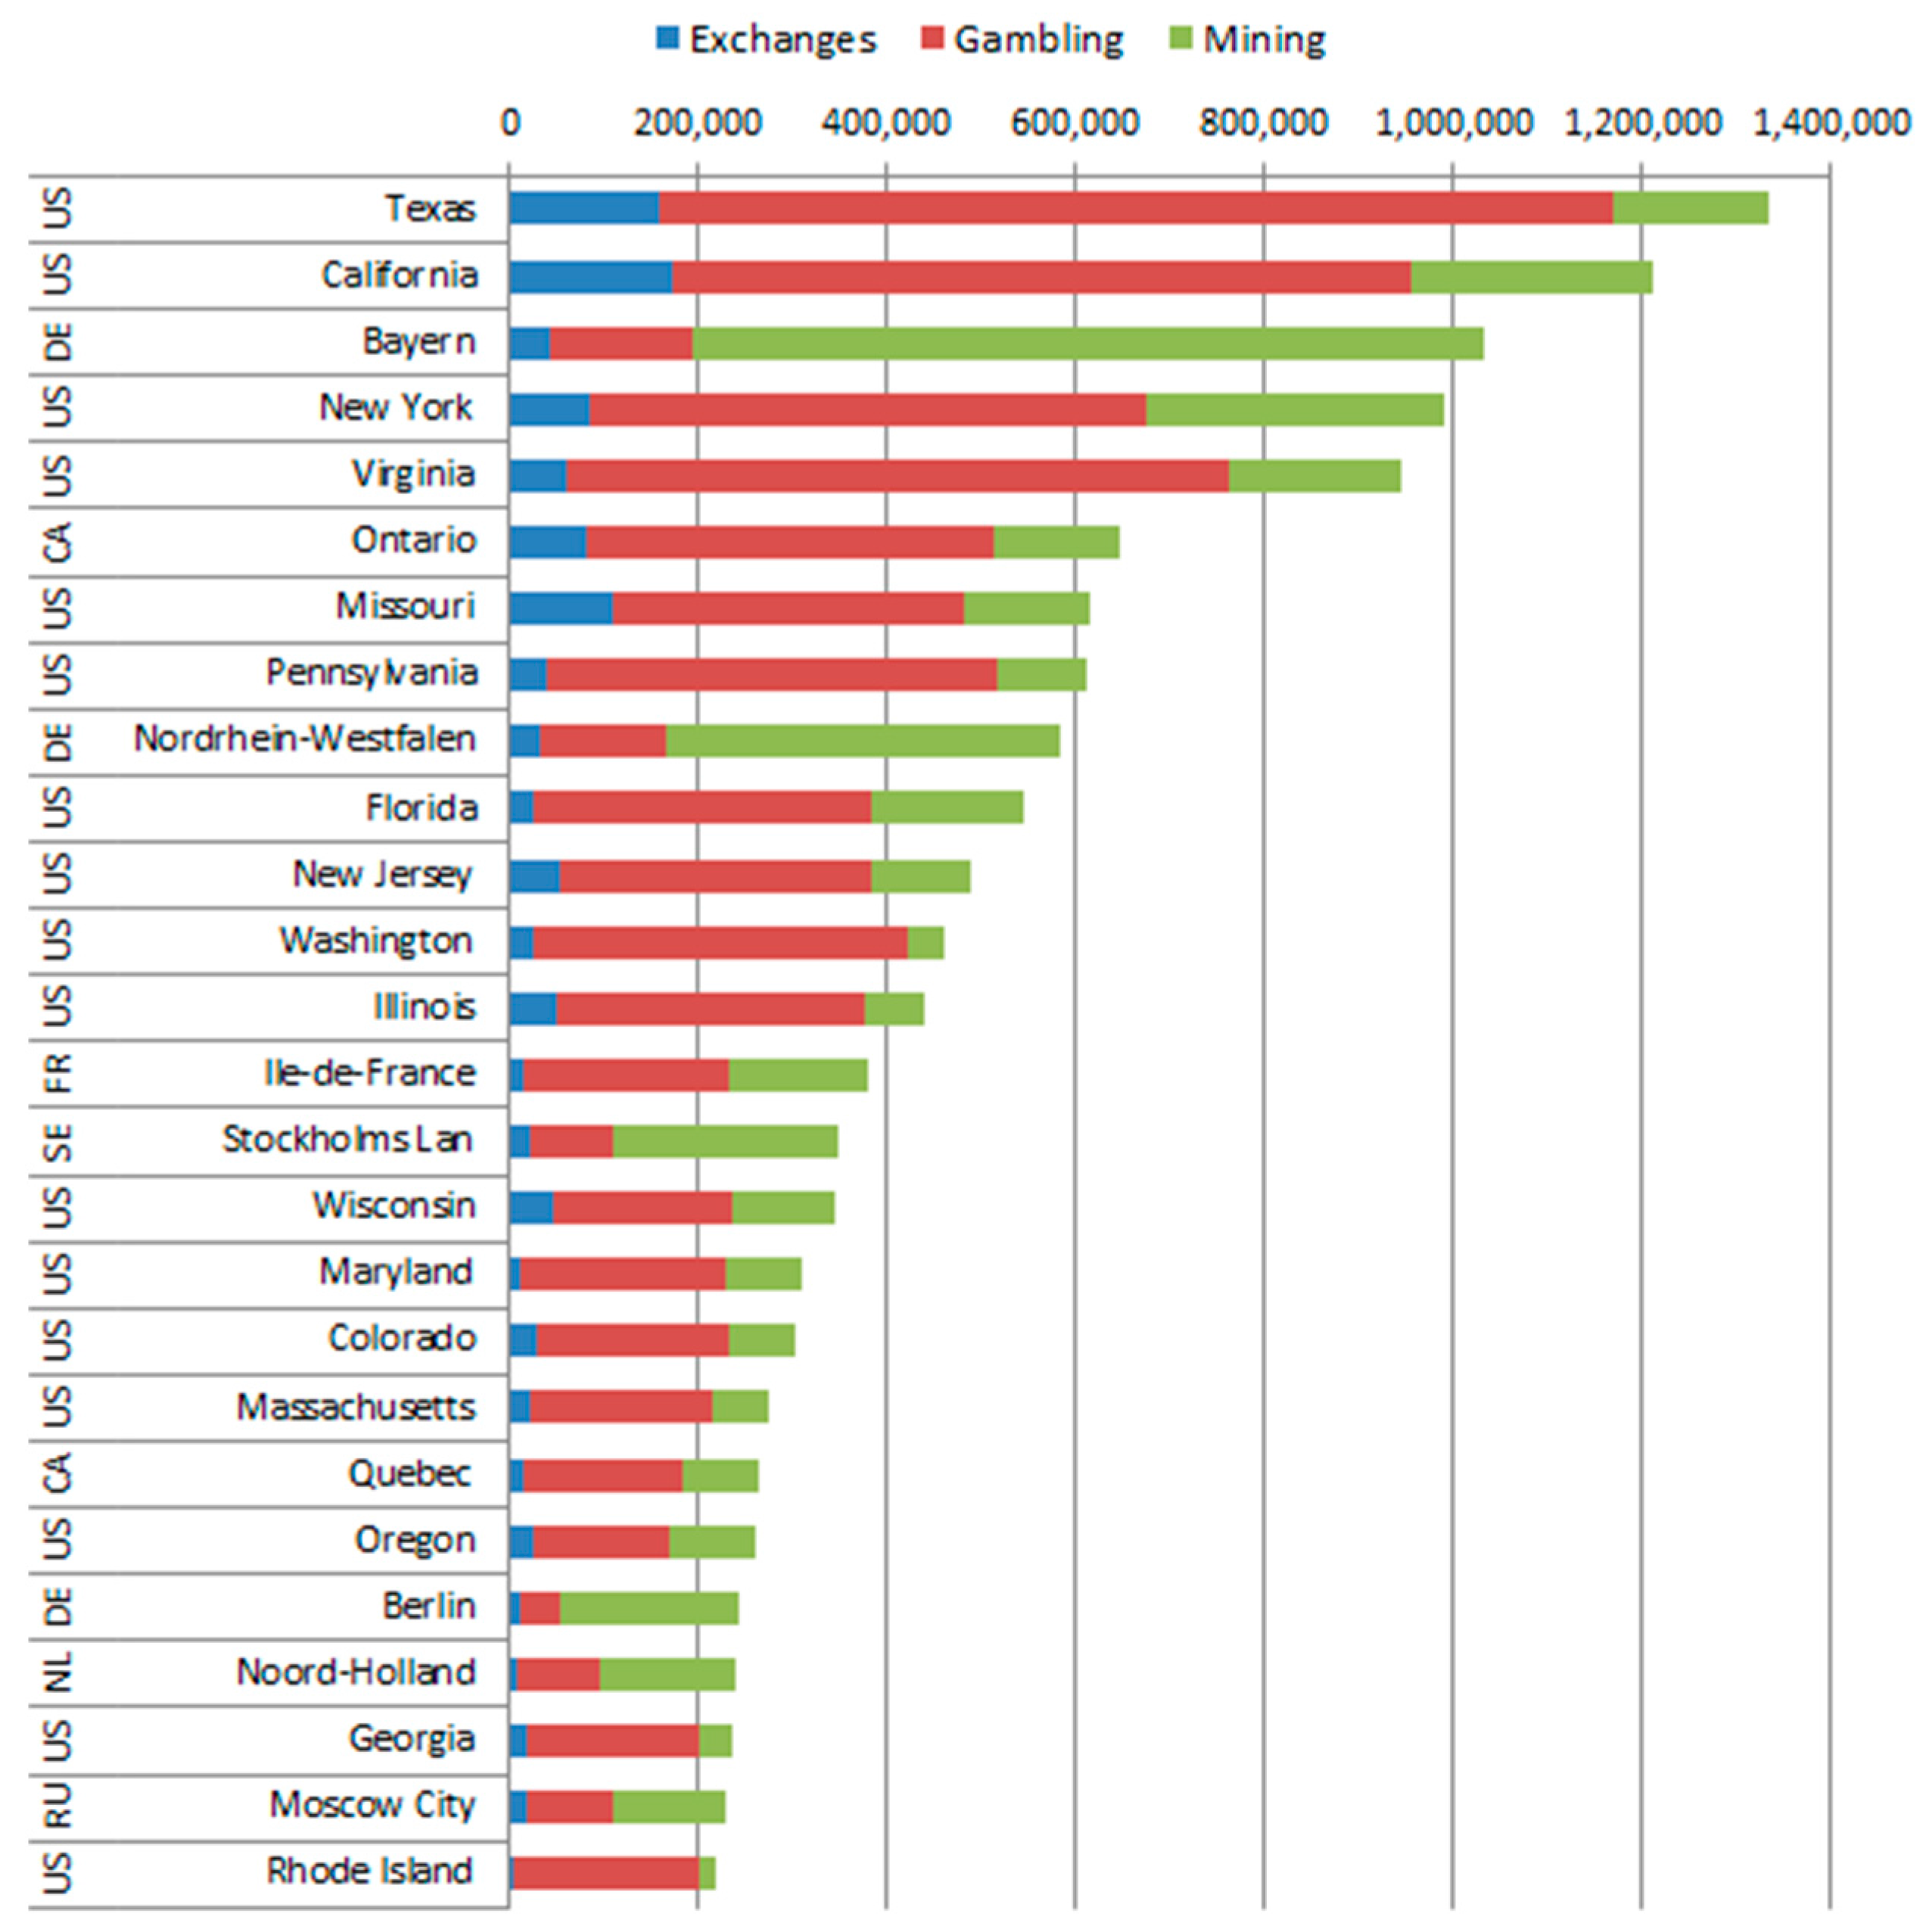
The statistic in Figure 20 shows the Top 30 regions according to the transaction volume and the distribution of the three major businesses in the Bitcoin economy in this region. One can see that U.S. regions such as Texas, California, Virginia, and New York dominate the statistic. The business in the U.S. regions is mainly gambling with slight differences in the distribution for the mining and exchanges business; for example, California has a larger portion of mining businesses (21%) than Texas (13%) and less than the New York region (32%). As indicated by the statistics on country level, Germany incorporates a large portion of the mining business, especially in Bayern (81%) and Berlin (78%). Similar results can be seen for the regions in Sweden, Netherlands, and Russia that show the same characteristic in the business distribution as on the country level. Hence, even on a smaller aggregation level the overall business distribution is stable for the three major businesses.

6.2. Network Analysis

In the following section, network metrics will be applied for several aggregations of time, business, and country. The main objective is to investigate the structure of the Bitcoin network, identify major hubs, brokers, clusters, and find evidence for the small world phenomenon.

6.2.1. Degree Distribution and Power Law of the Bitcoin Network

The degree distribution captures the structure of the network in terms of the individual connectivity and is expected to follow a power law distribution since the Bitcoin network is considered as real world network such as the World Wide Web or social networks. To conduct the analysis within NetworkX the package “powerlaw” is required to calculate the slope coefficient a , and plot the probability density function (PDF) and complementary cumulative distribution function (CCDF) [46]. With this analysis one can examine how the power law evolves over time, differs between particular businesses or countries. A power law distribution ( P ( k )   ~   k a   ) with a slope coefficient of 2 a 3 indicates a scale-free network, which is often found in real world networks.
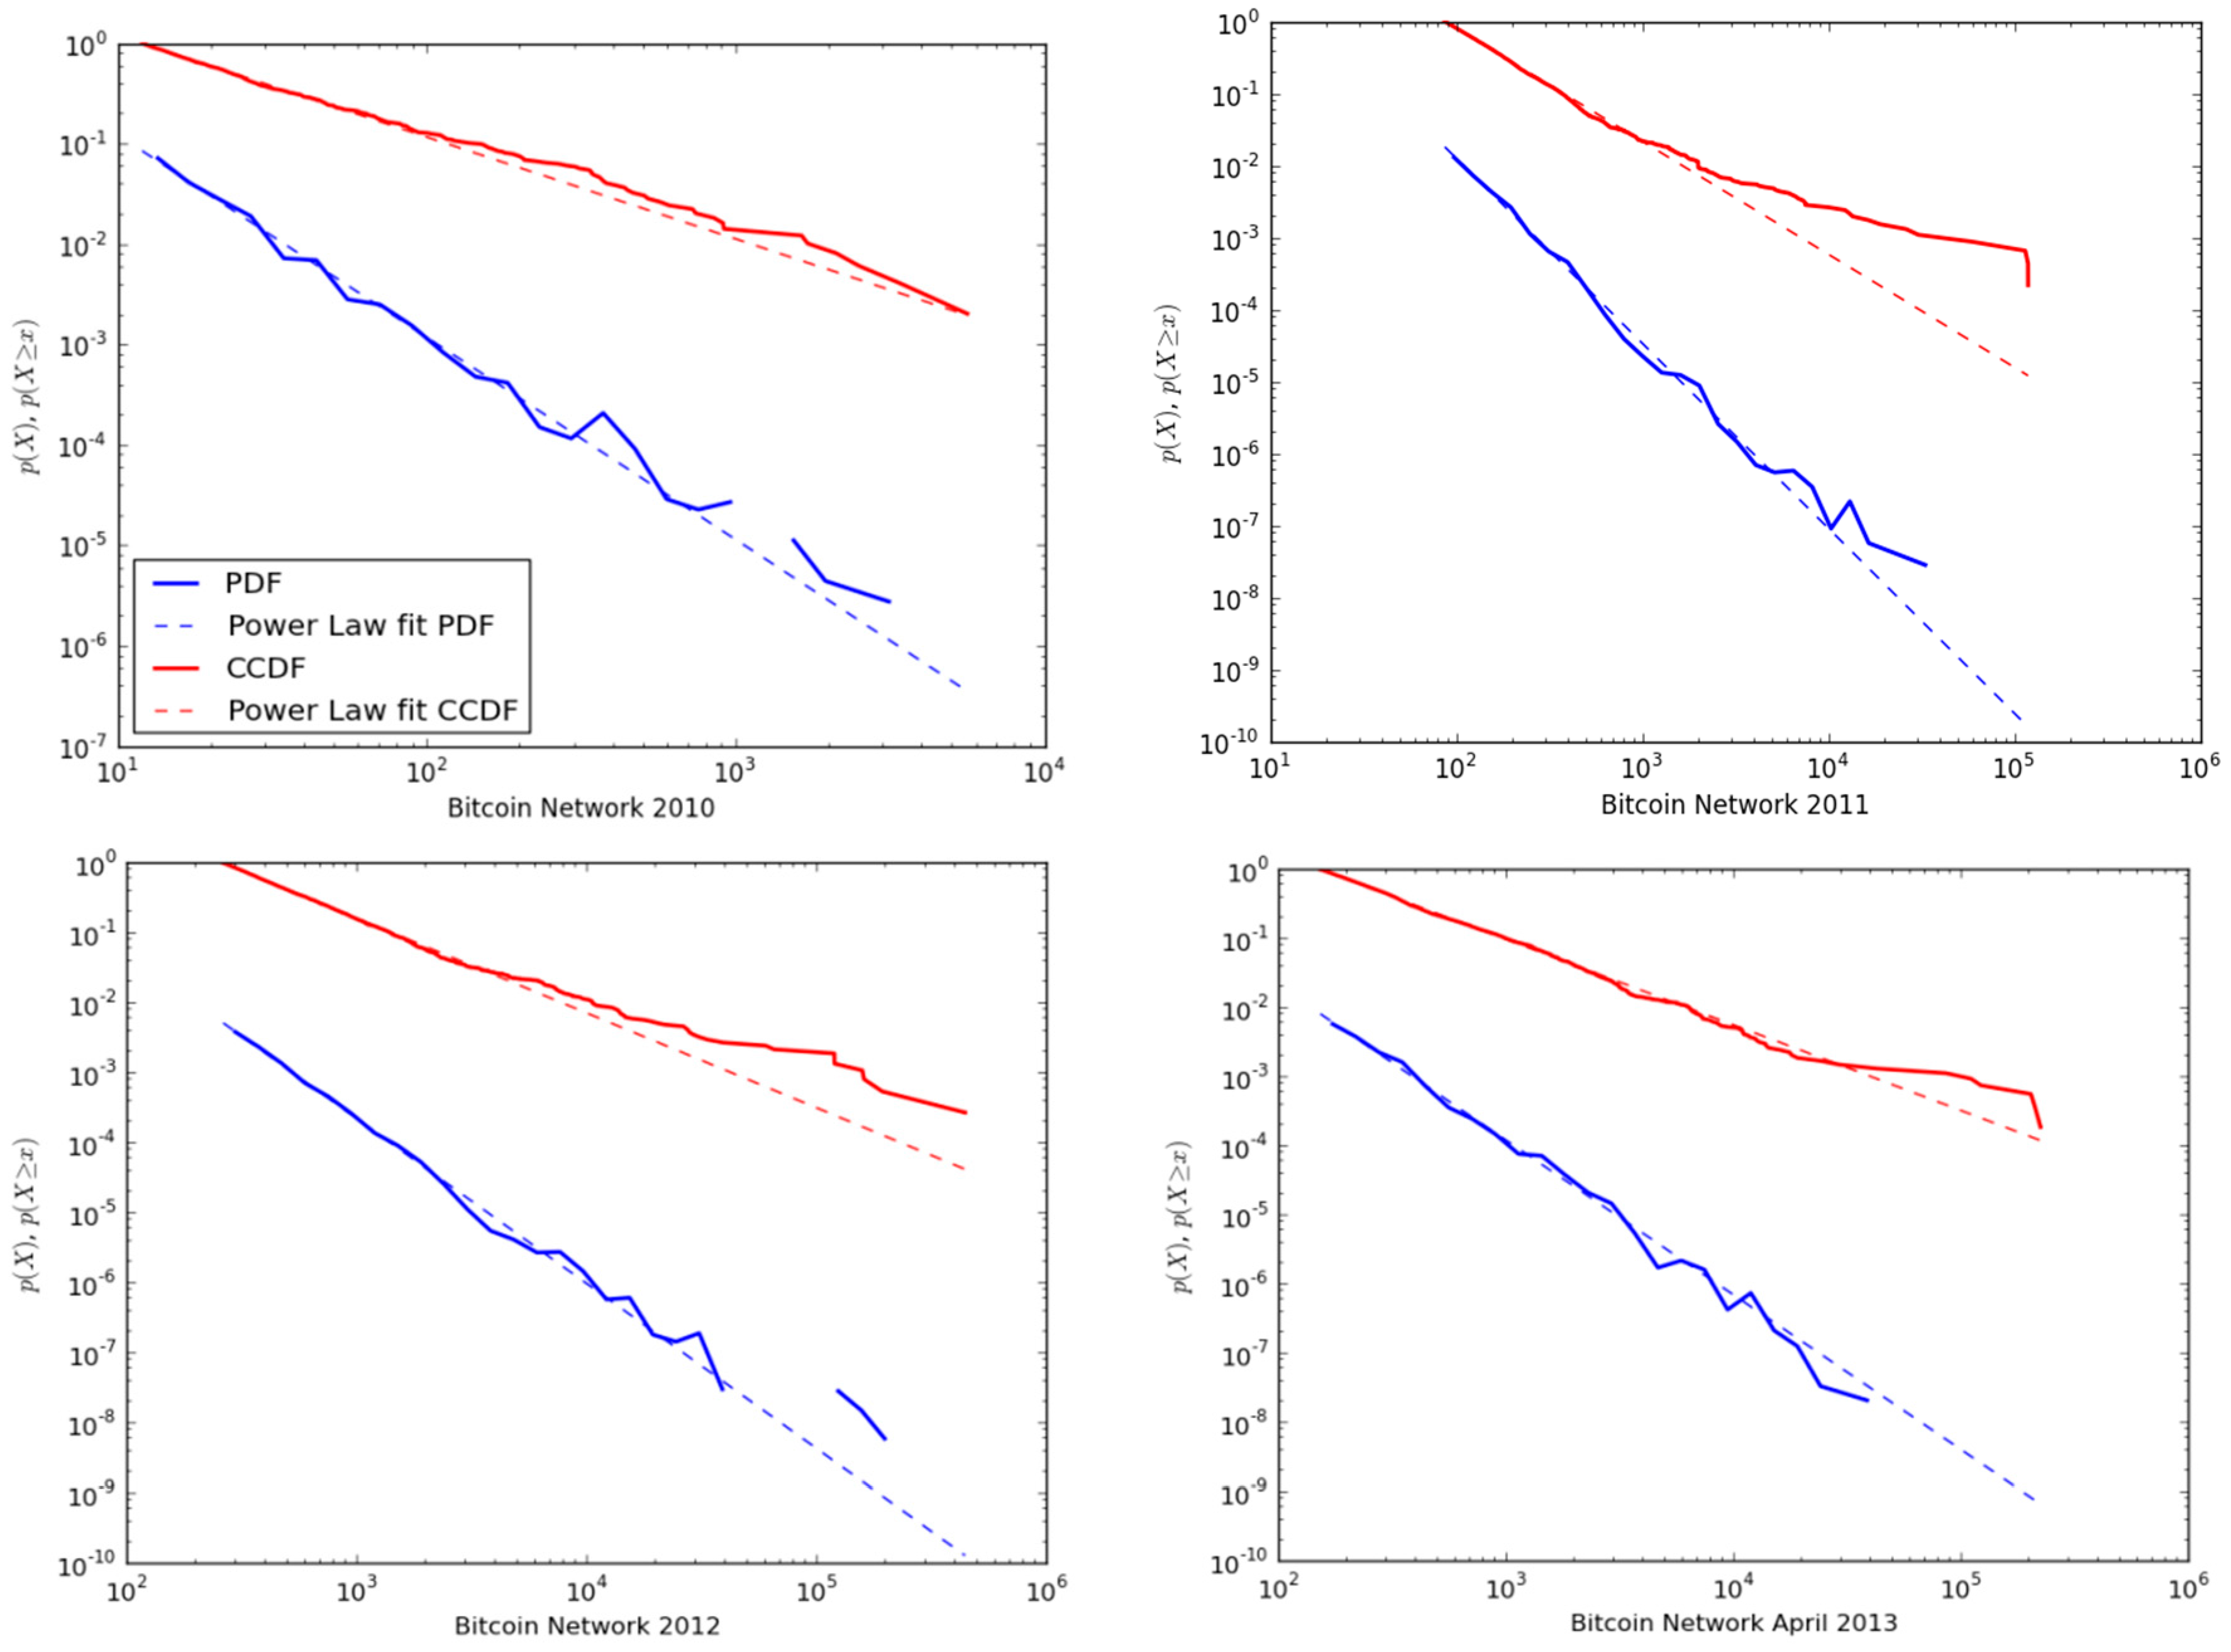
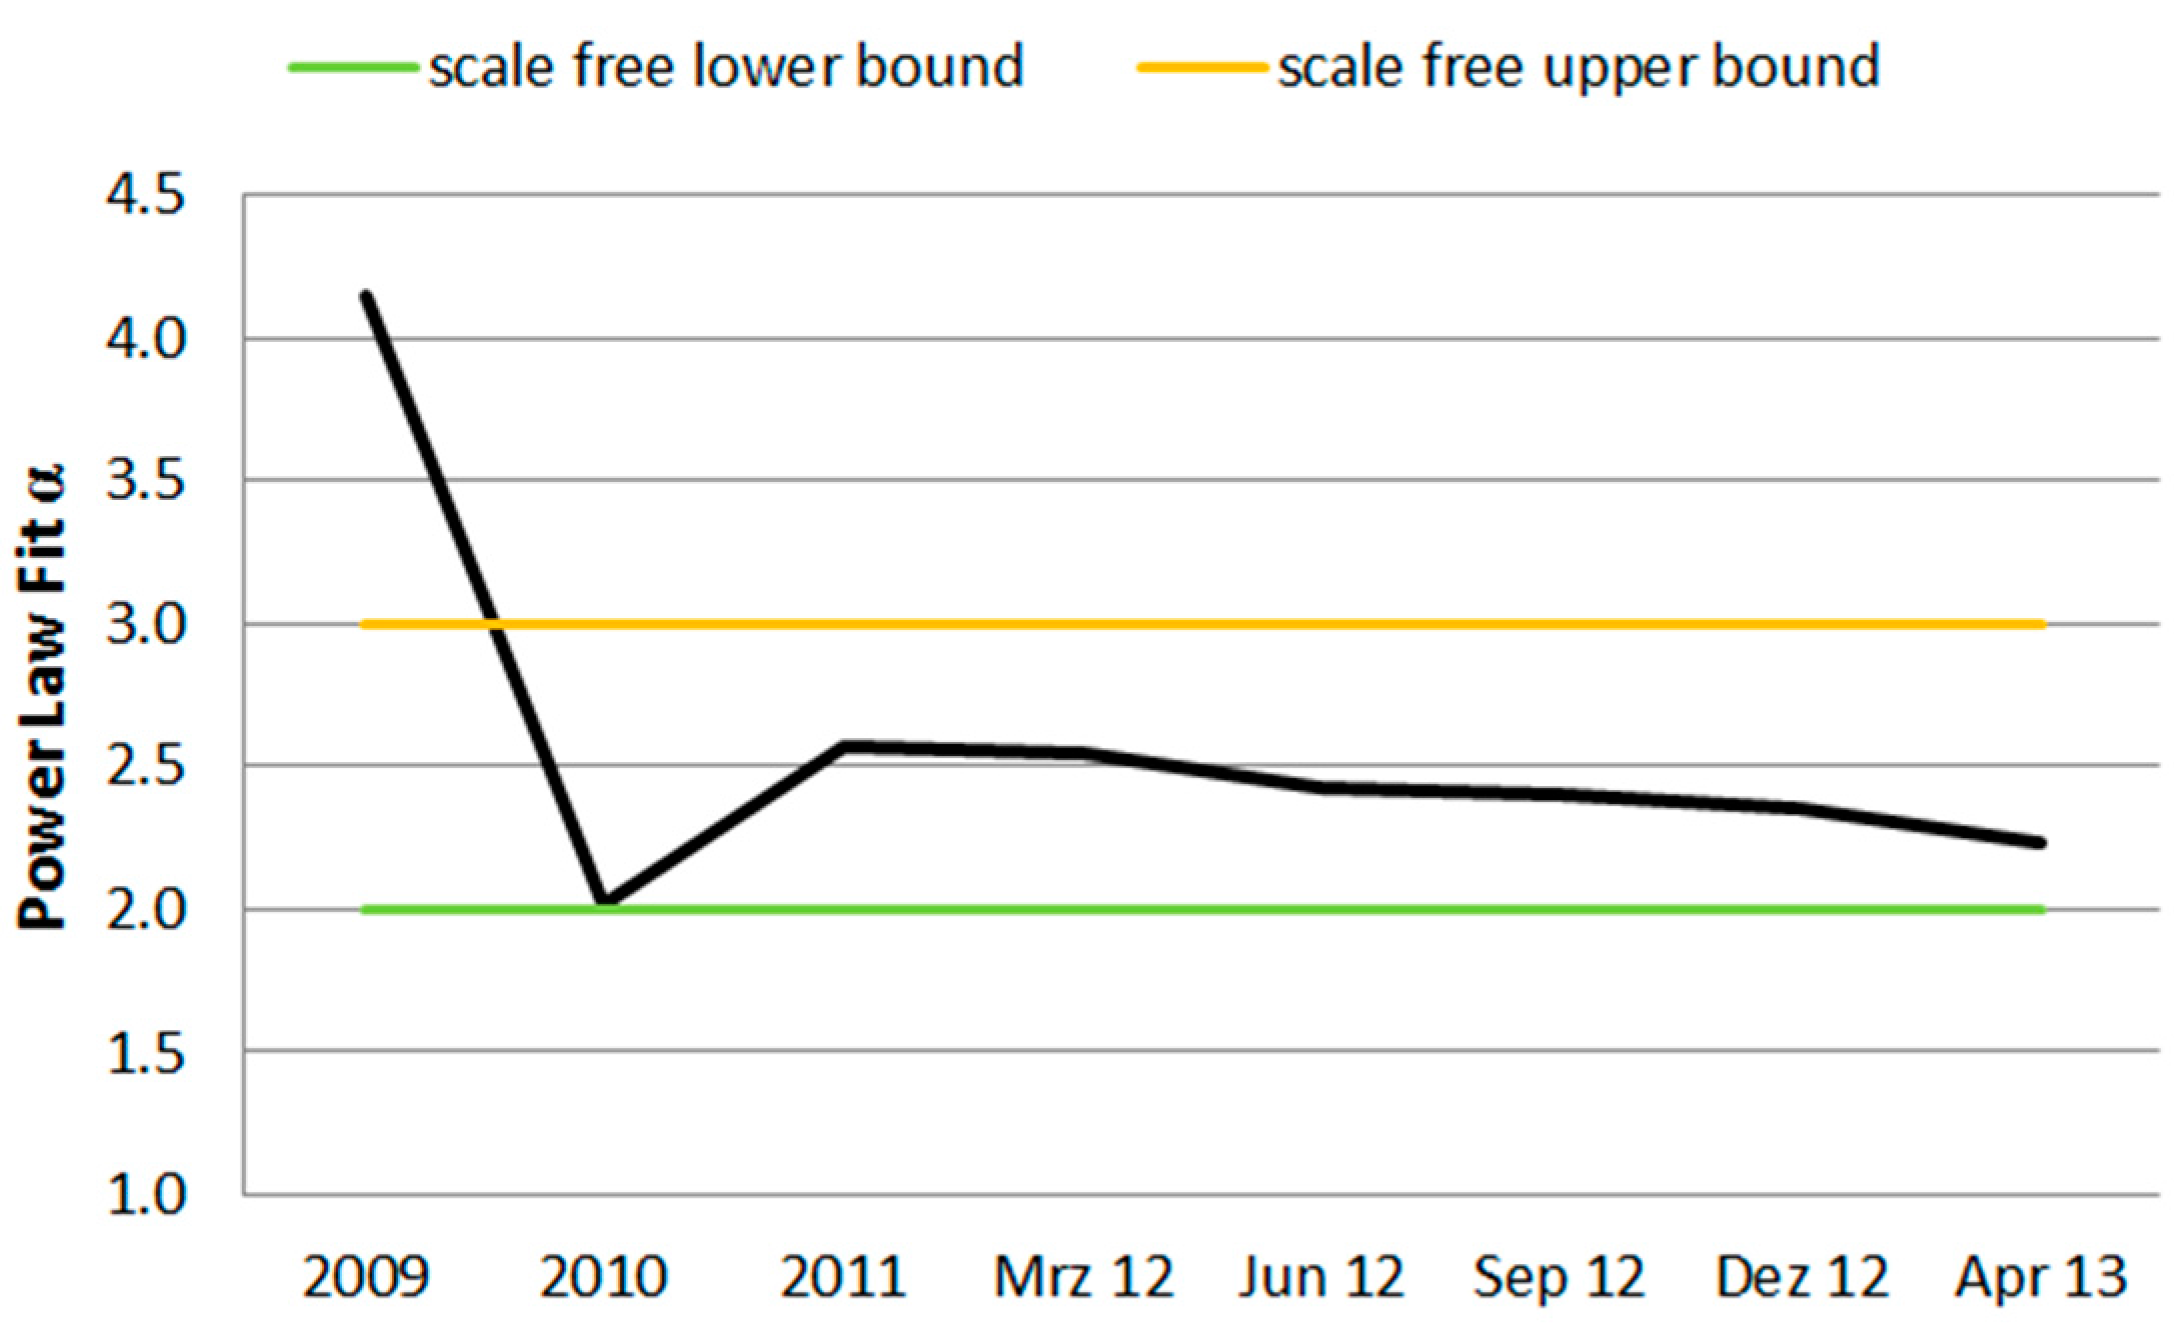
Figure 21 shows the development of the PDF and CCDF distribution and the associated power law fit over time. The PDF requires logarithmic binning (default in “powerlaw” package) to account for the heavy tail in the distribution and a smooth visualization. The CCDF distribution does not use binning; thus, all information of the distribution is included [46]. The plot from the Bitcoin network in 2010 shows a good fit by the power law to the PDF as well as the CCDF distribution. With increasing activity in the network in 2011 the slope α converges to a theoretically almost ideal value of 2.569, although the power law does not show a good fit for the CCDF distribution. This effect reduces over time with more user activity in the network and trade or exchange patterns. The development of the slope coefficient α for several snapshots over time is depicted in Figure 22.
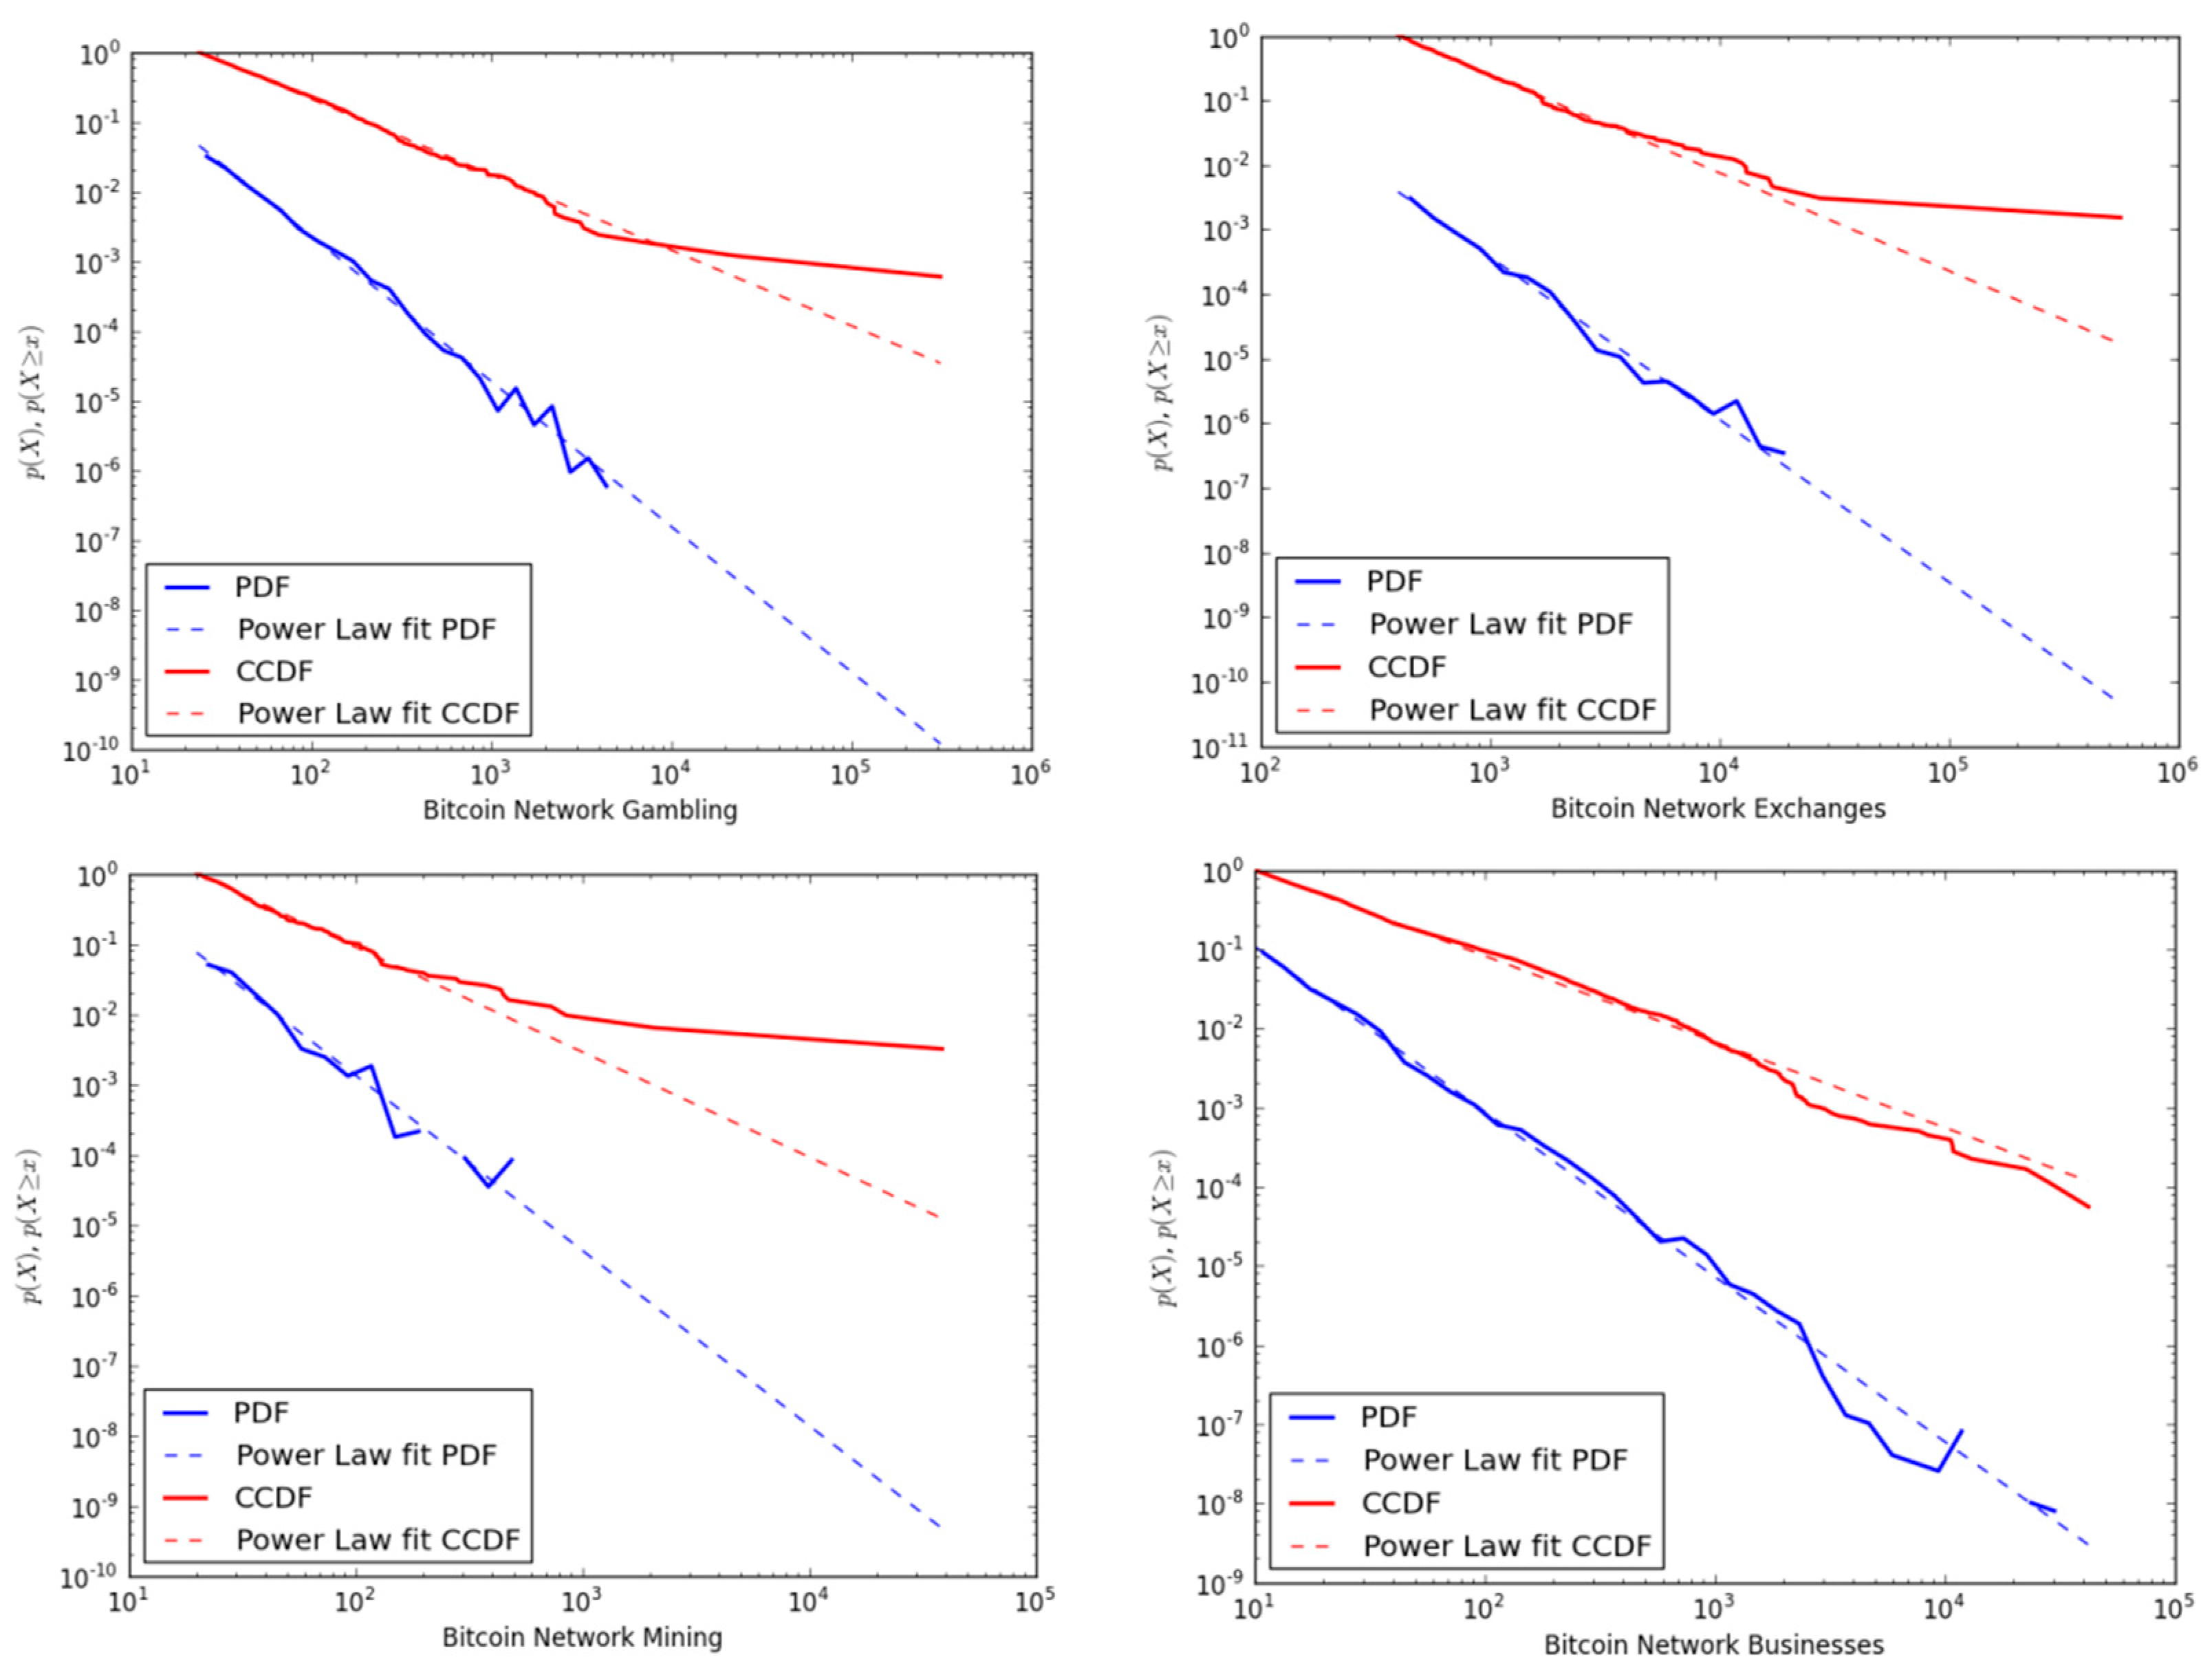
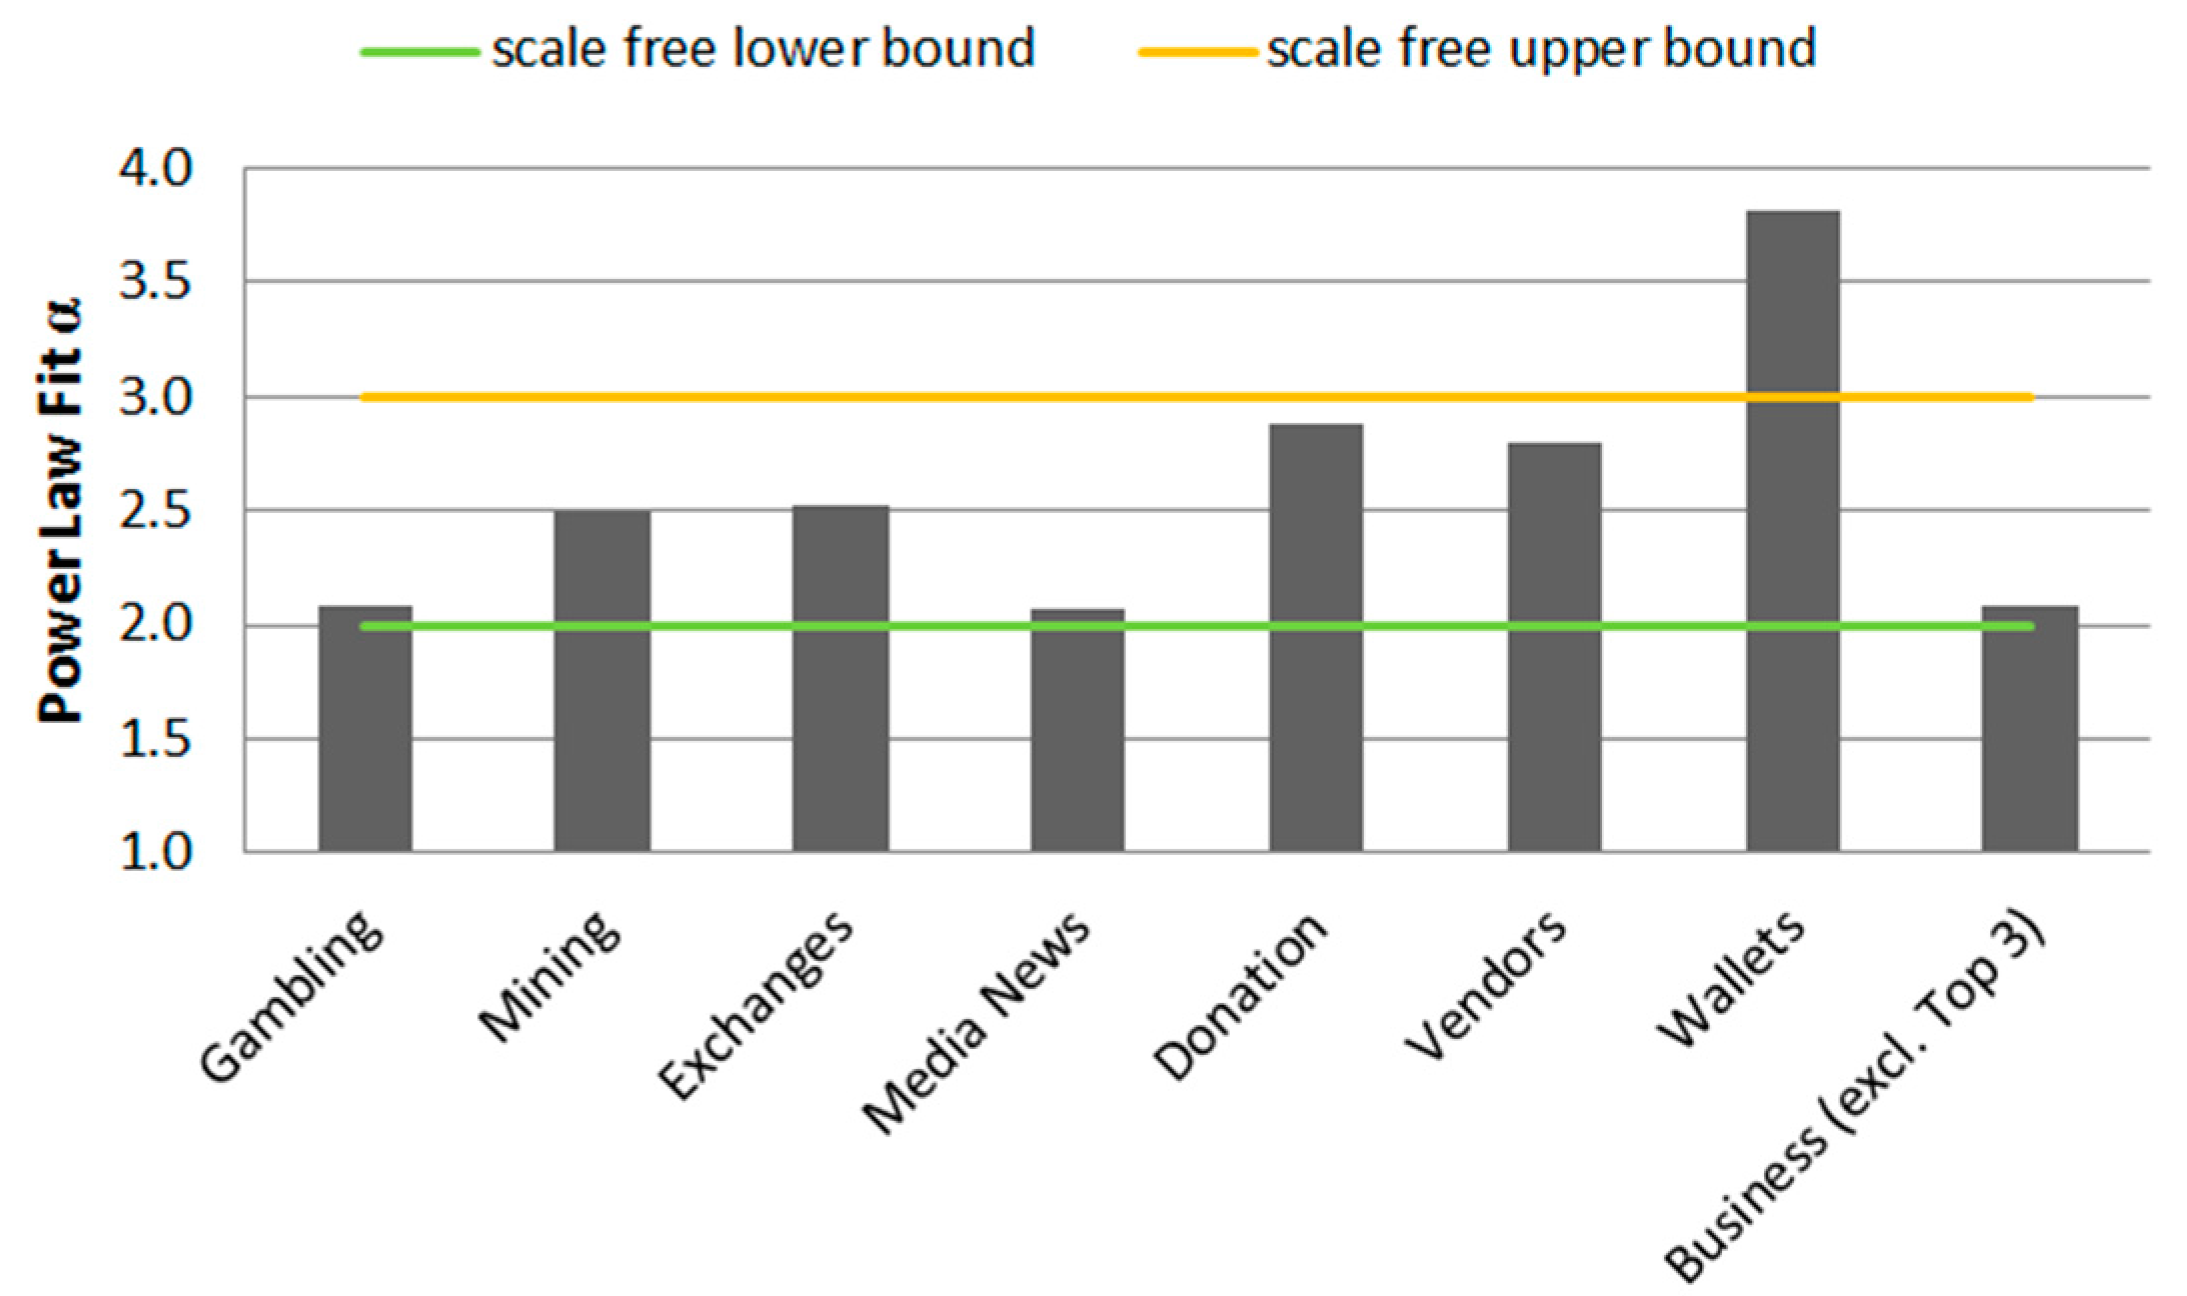
The same statistic for the business categories: gambling, exchanges, and mining indicate strong heavy tails when considering only particular business categories. As mentioned earlier, the categories are mainly driven by SatoshiDice (gambling), Mt.Gox (exchanges), and Deepbit (mining). These nodes have abnormal high degrees and lead therefore to the strong heavy tails. When looking at the plot (Businesses) in Figure 23 for the Bitcoin economy excluding the three major businesses one can see a good power law fit to the PDF and CCDF distribution. This might be explained by characteristics that are close to a real world economy or other social networks with various types of businesses and common behaviors by the participants. However, the slope coefficient α for different business categories in Figure 24 indicates the existence of a scale-free network for all business categories except the wallets business. Despite the strong heavy tails, the businesses exchanges and mining have a very good slope coefficient α with 2.495 and 2.517, respectively.
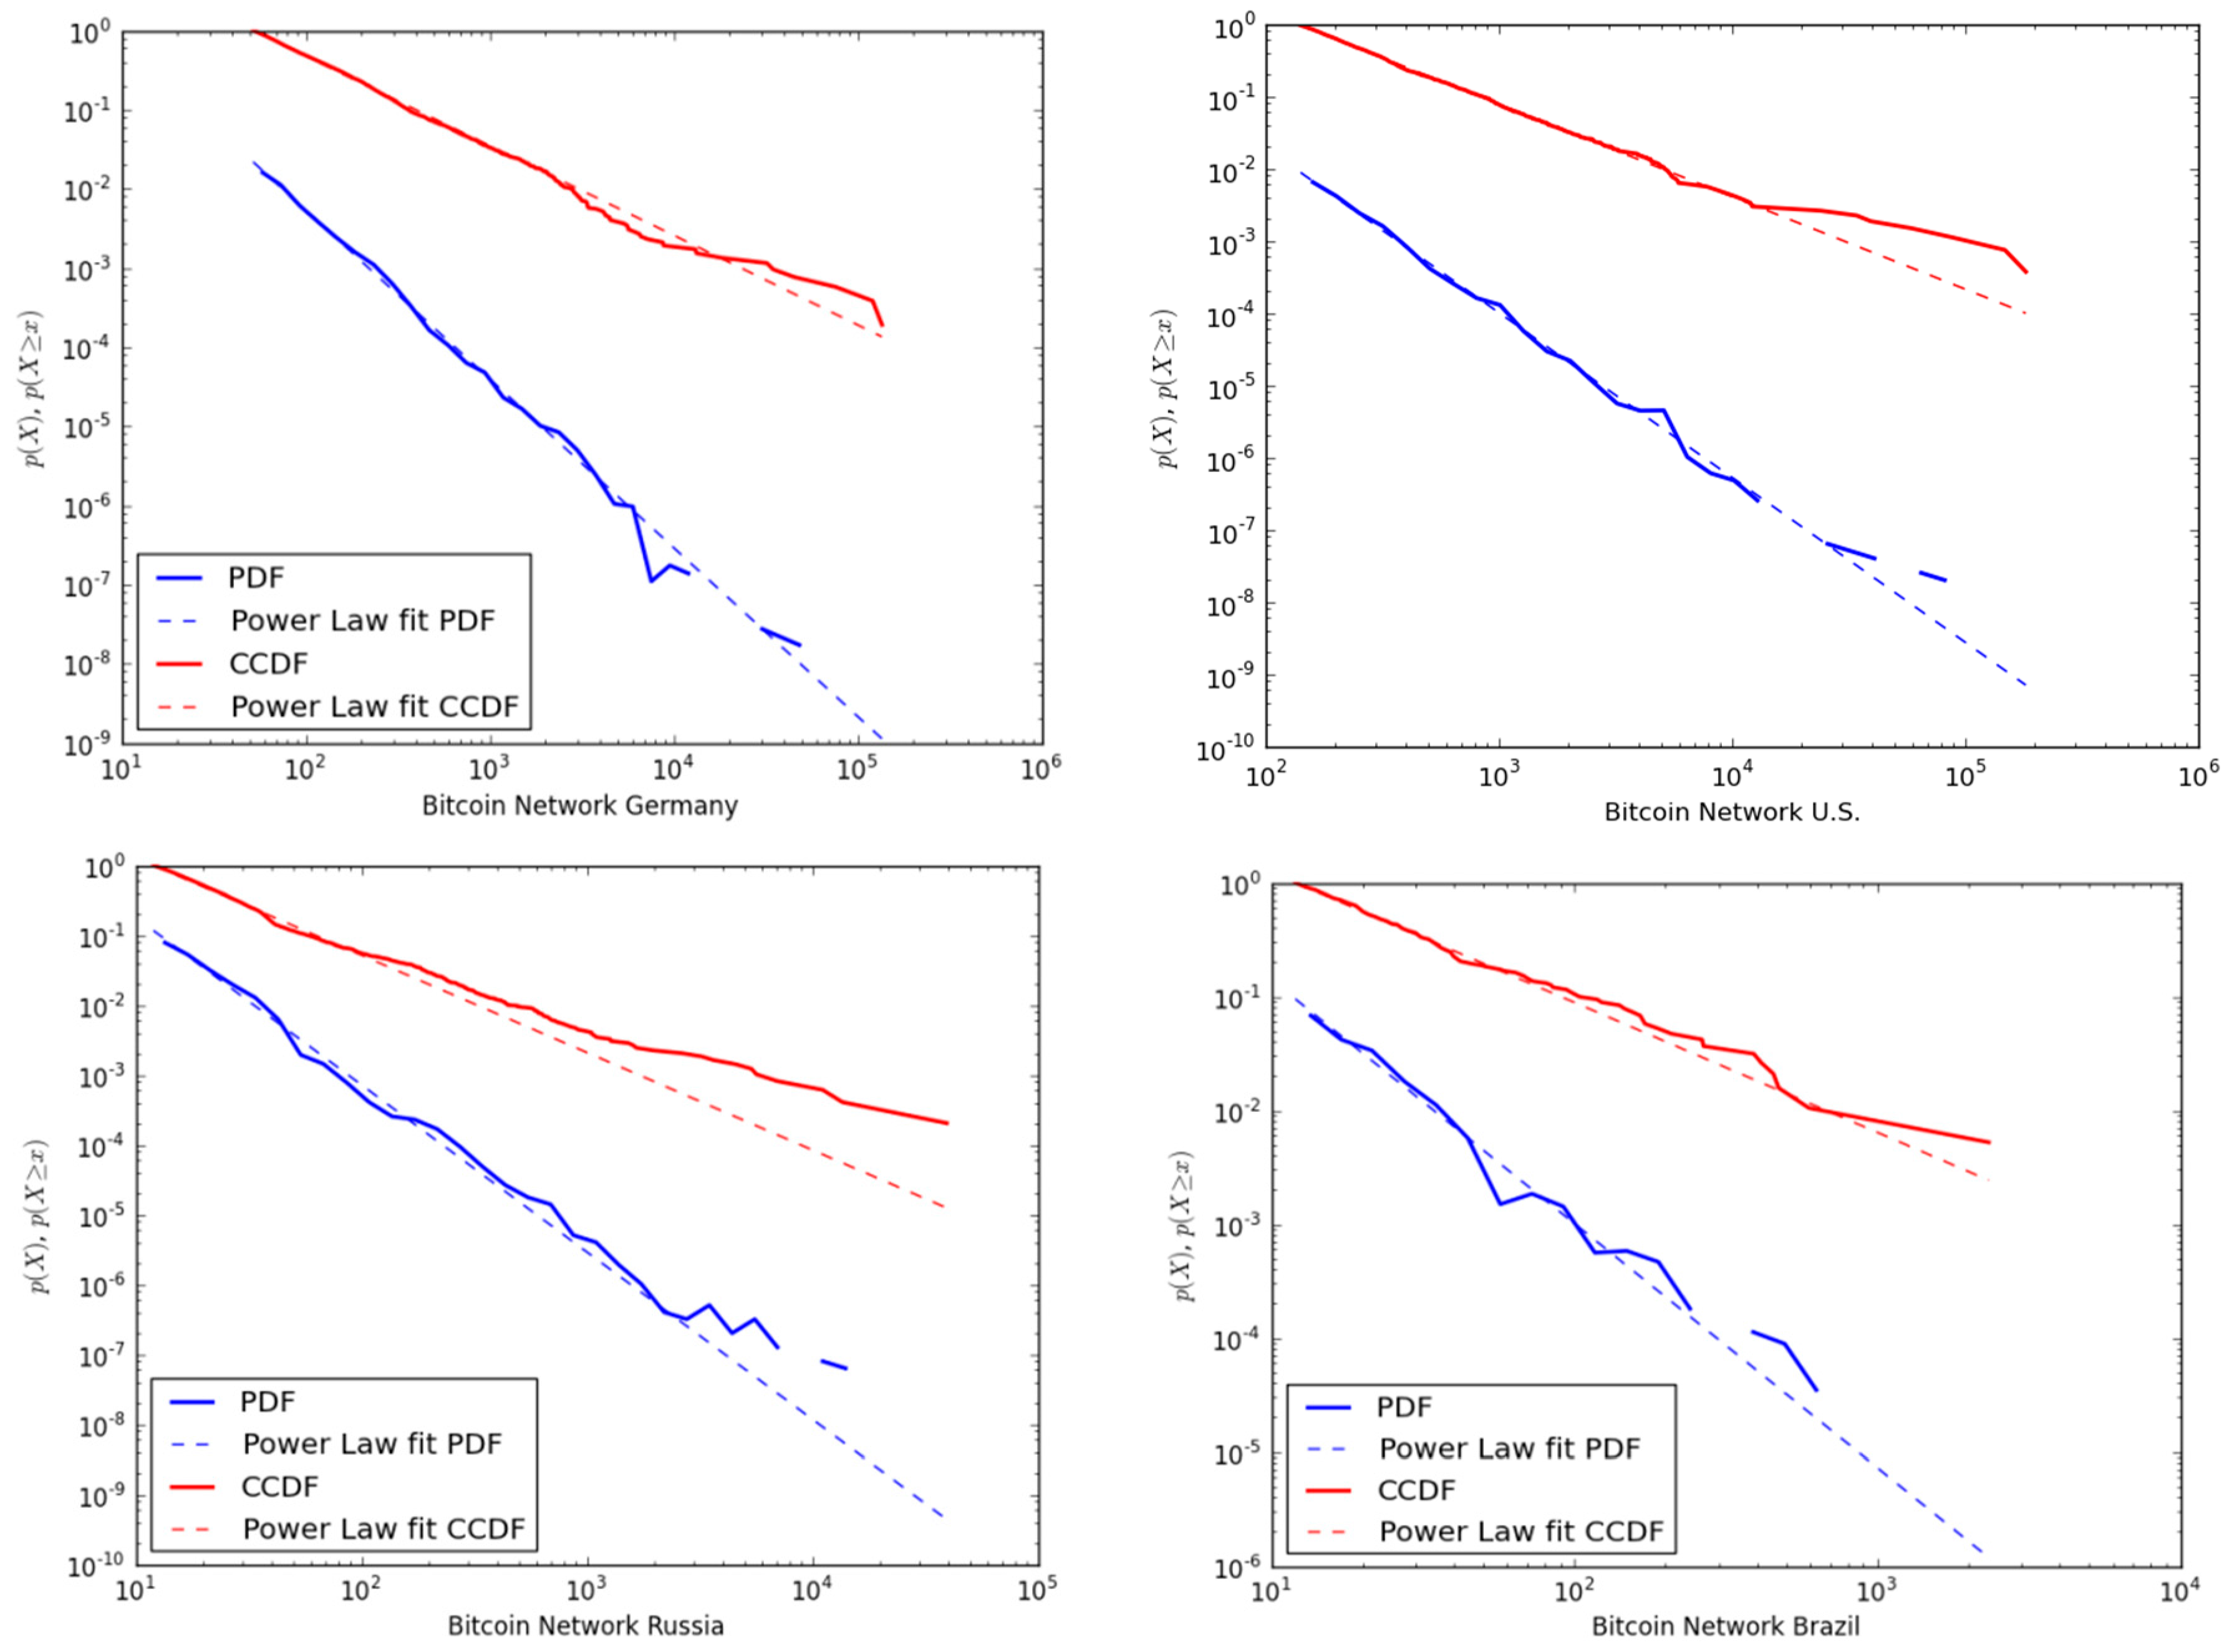
The degree distribution on country level aggregations reveals again the existence of a scale-free network (Figure 25). The major Bitcoin markets Germany and the U.S. show a good power law fit with a slope coefficient α of 2.132 and 2.281, respectively. The plots for Russia and Brazil, the representatives for emerging markets, illustrate that the power law does not fit the PDF and CCDF distribution as good as in the case for the developed countries. This cannot be seen as a general case, since Sweden has a similar power law fit to the degree distributions like Russia. In both countries the business distribution is dominated by the mining sector. Hence, the relationship between the degree distribution (CCDF) for the mining business and for countries such as Russia or Sweden, indicating that a dominant business category such as mining in Russia have influence on the distribution on country level. This is different from the observations that were made when considering the transaction value in different countries. In fact, the degree distribution is derived from the number of in-going and out-going transactions per node regardless of the value that is transacted.
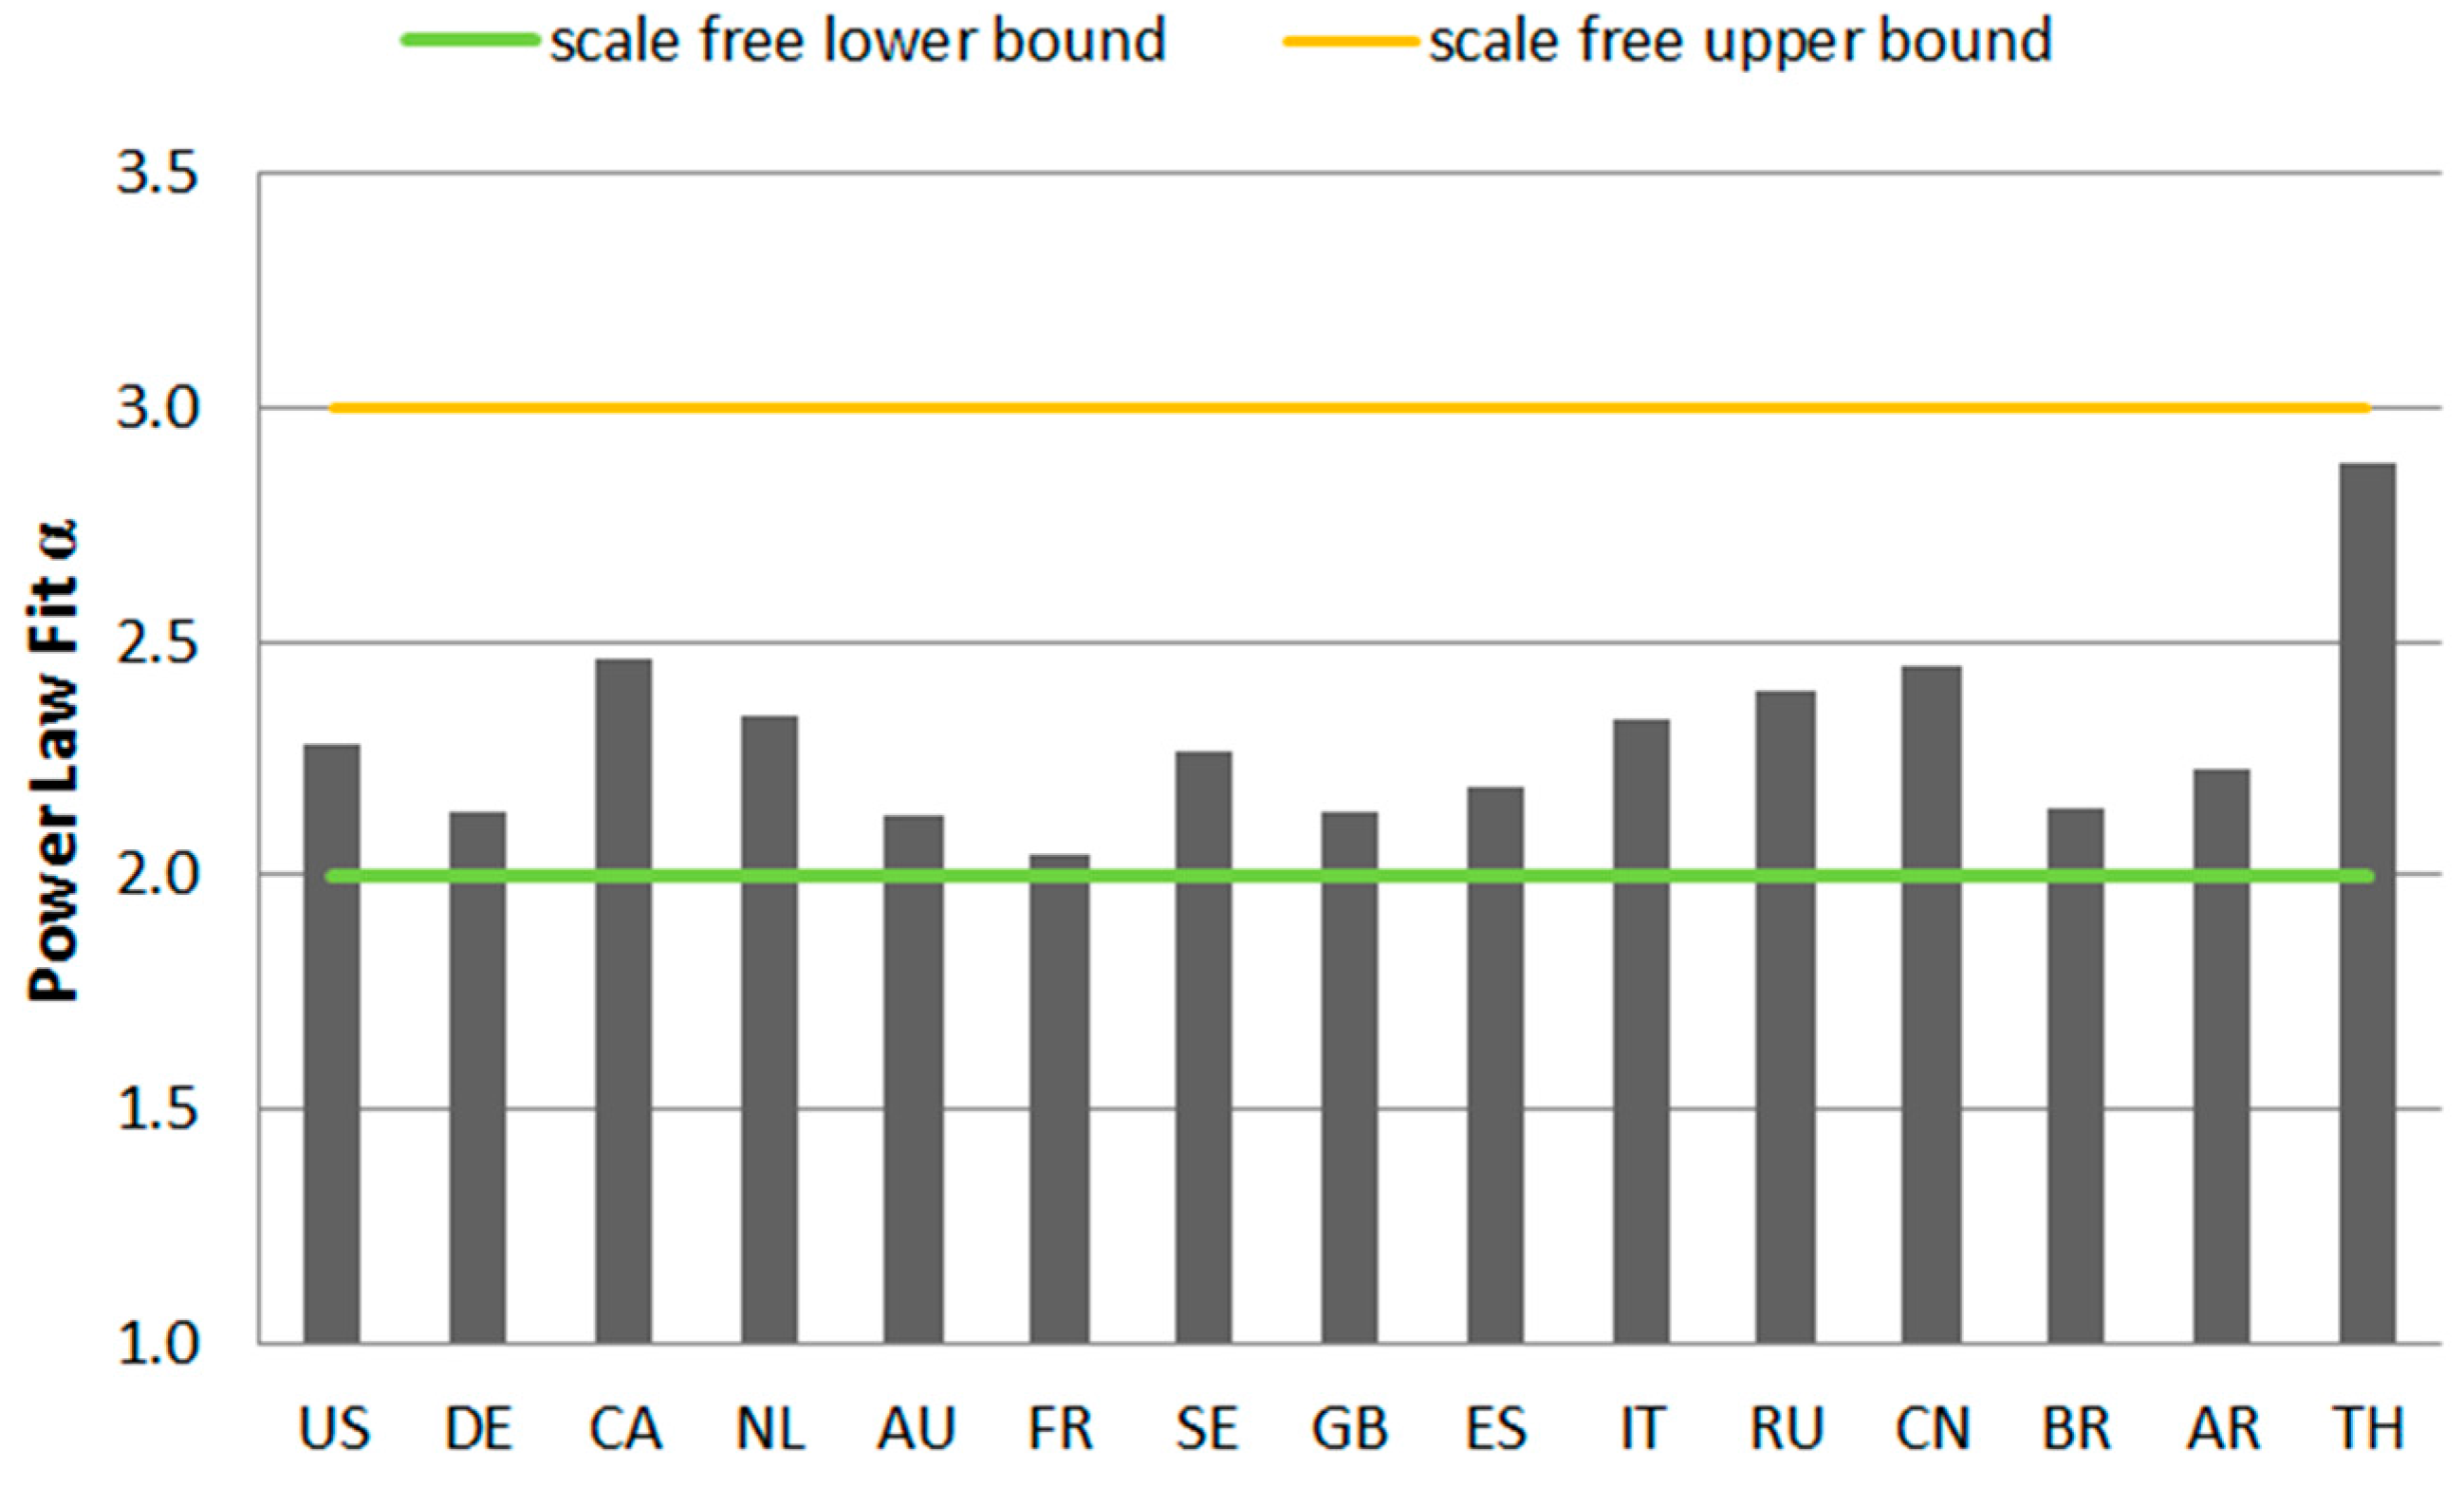
Figure 26 shows the power law fit for different countries. The slope coefficient α for all investigated countries is in the range that determines the existence of a scale-free network, regardless of the number of executed transactions.
Analyzing the degree distribution (PDF and CCDF) of several aggregations on the time, businesses, and country level, reveal that the Bitcoin network follows a power law distribution, although not over the entire value range. With increasing activity (executed transactions) in the network the power law fit to the degree distribution improves. In some cases the plots show deviations between the CCDF distribution with strong heavy tails and the power law fit. The “powerlaw” package performs the calculation steps for fitting the power law automatically; hence, one cannot draw direct relationships between the power law fit to the CCDF distribution and the actual calculated power law fit α. Newman [31] states that just few real world networks follow a power law distribution over their entire range, and in particular not for smaller values of the variable being measured. In reality, therefore, the distribution must deviate from the power law form below some minimum value x-min [31]. In this analysis the calculated best minimal value for power law fit (x-min) and the standard deviation (sigma) is not published. For a more thorough investigation on power laws in the Bitcoin network, the statistics can be easily calculated with the “powerlaw” package in NetworkX.

6.2.2. Centrality in the Bitcoin Network

In the following analysis the network measure degree centrality will be applied to identify major hubs in the Bitcoin economy. The calculation of degree centrality is executed on the main connected component of the subgraphs for several aggregations to discover differences between certain businesses and countries.
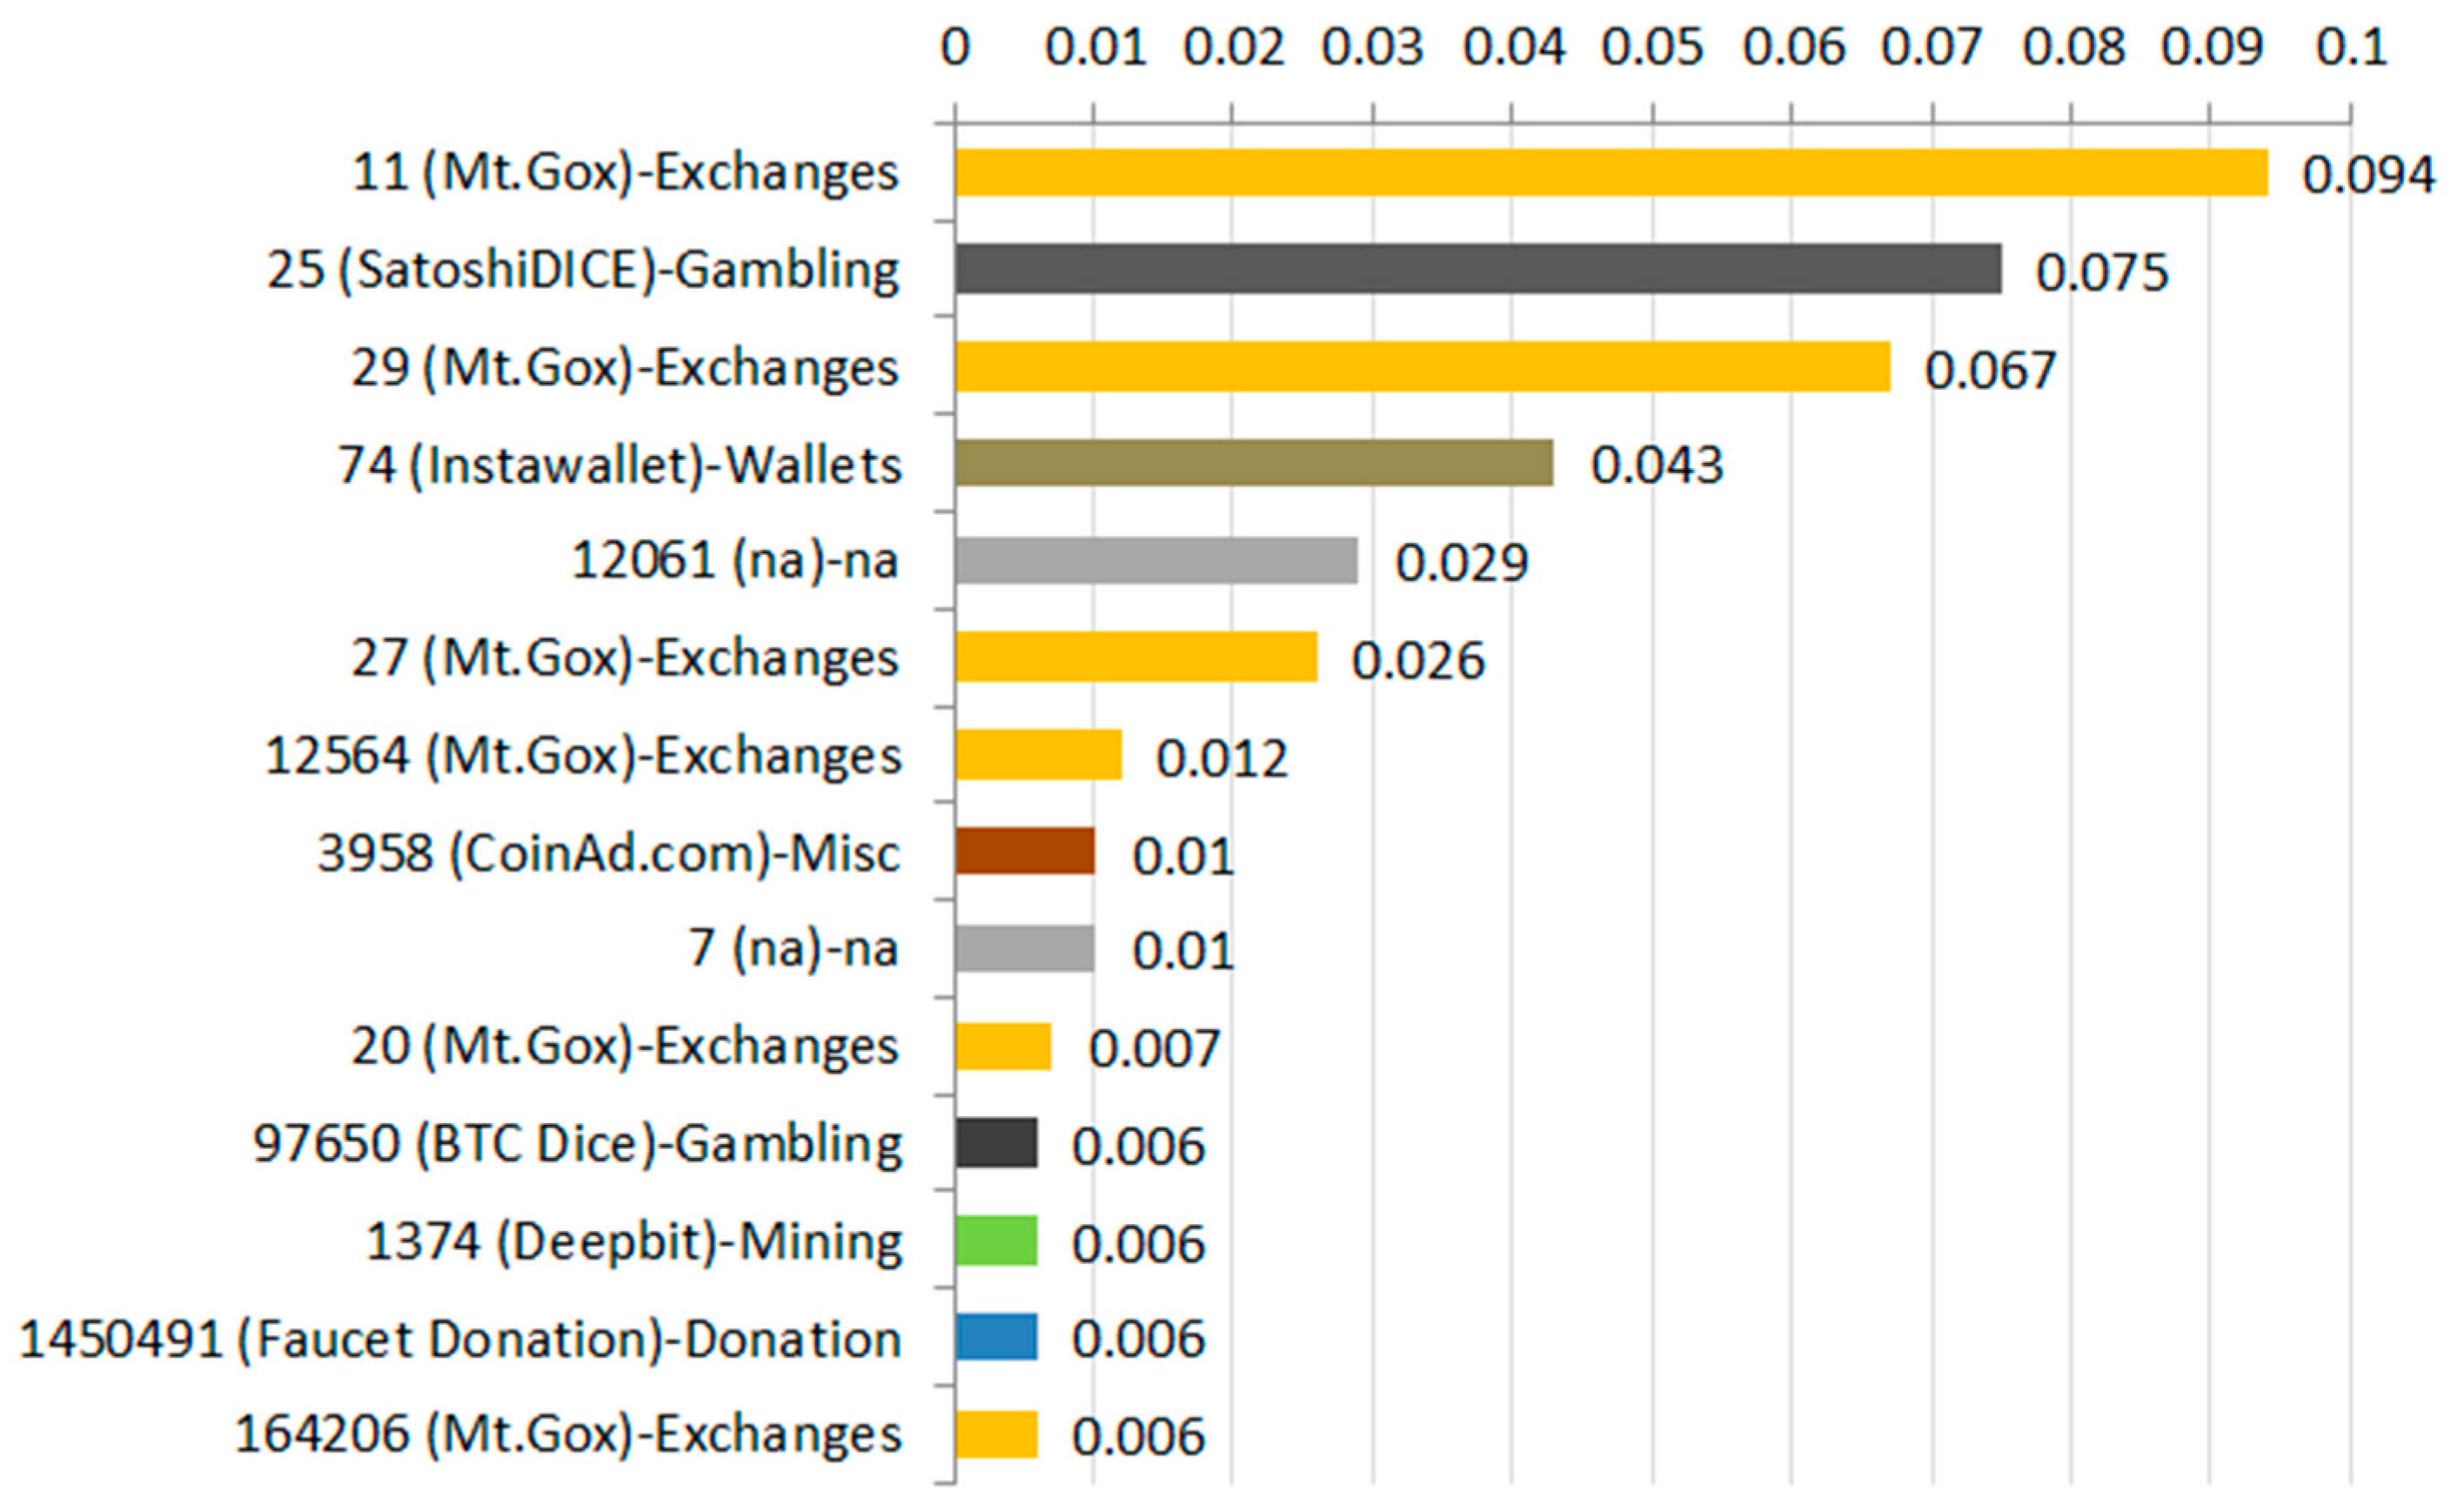
The degree centrality measure for the entire Bitcoin network in the most active time from September 2012 until April 2013 is depicted in Figure 27. When considering the entire Bitcoin economy, the node 11 (Mt.Gox) can be seen as the major hub with a degree centrality of 0.094. Mt.Gox was the largest exchange platform at this time and the trading activity surged due to heavy speculations on the BTC/USD exchange rate. Furthermore, exchanges serve as entry and exit point between the real economy and the Bitcoin economy. The second major hub in the economy is the gambling business SatoshiDICE with a degree centrality of 0.075. Although it incorporates by far the most transactions in the network (~46.9%), it is not the largest hub. The node 29 is also associated to the Mt.Gox platform and has the third highest degree centrality with 0.067. Mt.Gox occurs more often because the node is not directly marked with the business tag, but the related transaction that a node has executed in the network. An increasing number of transactions marked with a business tag that was executed by a certain node indicate the control of this node by the business. Instawallet, one of the largest web wallet services, is the fourth major hub with a degree centrality of 0.043. Web wallets bundle deposits from many users and are used to store Bitcoins centrally in the web. Therefore, Instawallet become a central node from where many users execute their transactions within the Bitcoin economy.
The miscellaneous service CoinAd.com that spends Bitcoins for viewing or clicking certain ads is related to 674 transactions, which incorporate over 142 thousand relationships to other users. Thus, despite the low number of transactions the service is among the most central nodes within the network. Another important service, the mining pool Deepbit, has a rather low degree centrality with 0.006, although it incorporates the second highest number of transactions (~684,000) in the network. A reason might be that a majority of related transactions are not part of the main connected component graph.
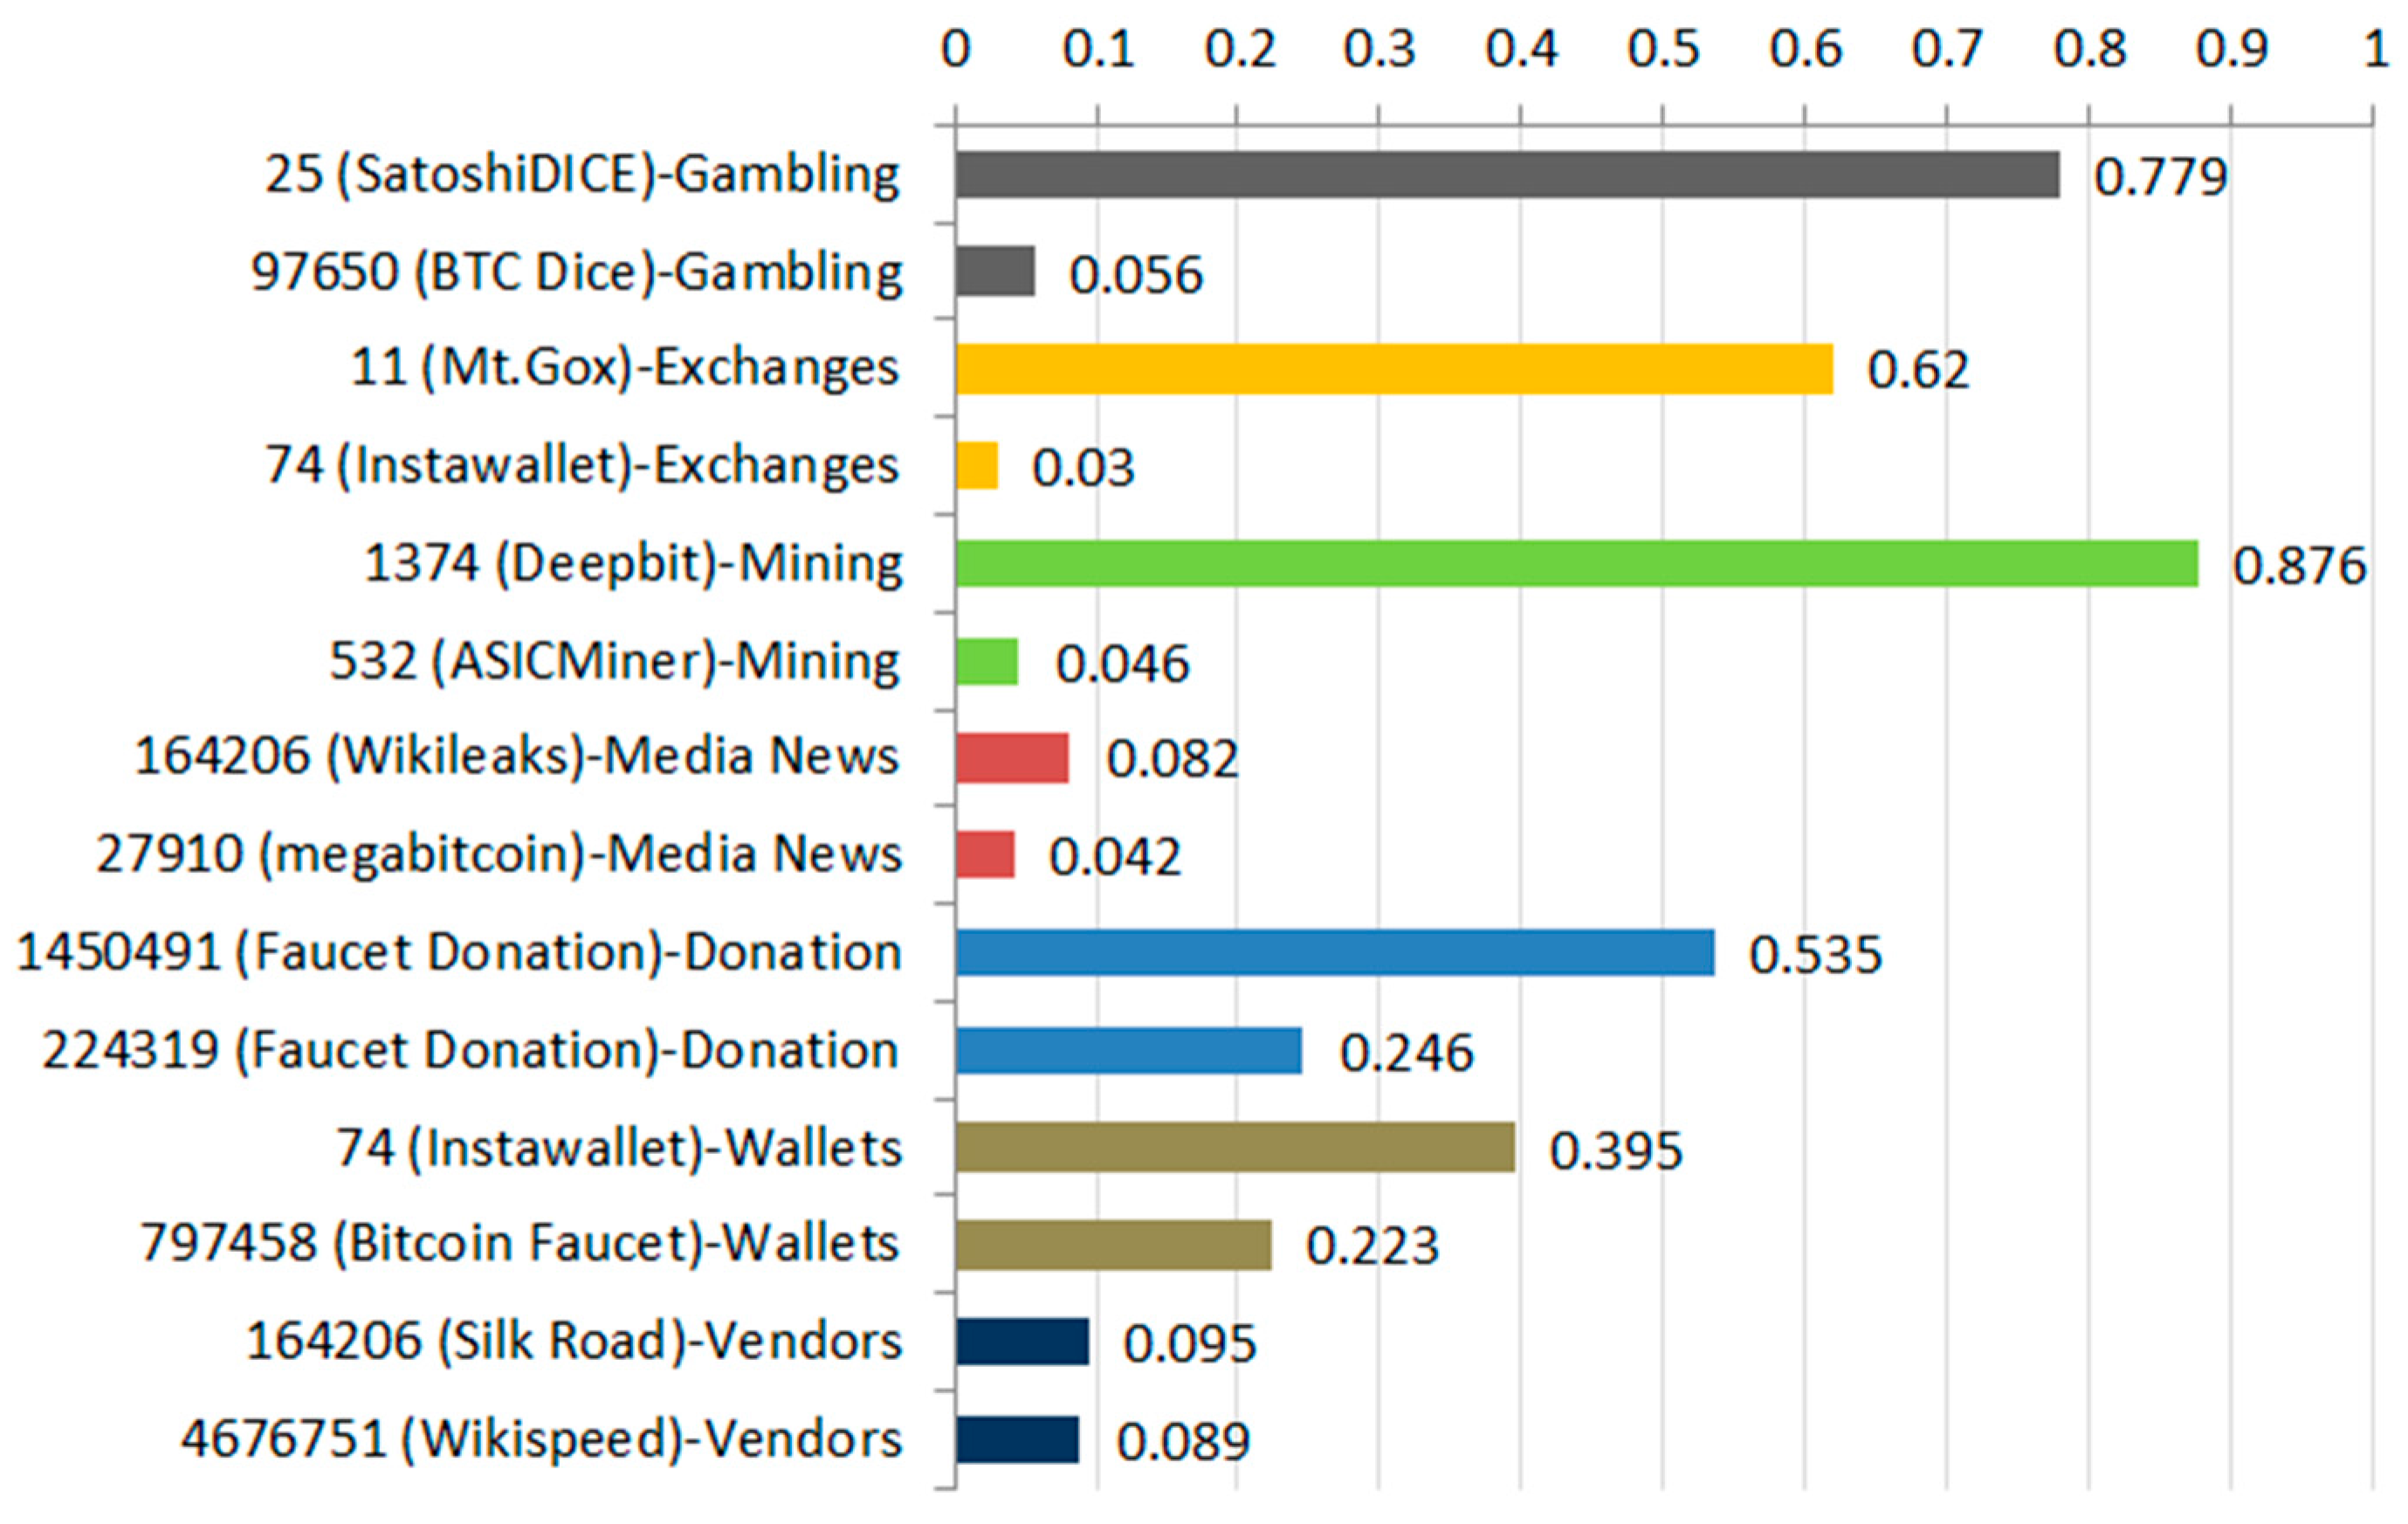
The statistics in Figure 28 reveal that particular businesses make up the most central hubs within certain business categories such as gambling, exchanges, and mining. SatoshiDICE is the largest dice game operator within the Bitcoin network and has a degree centrality of 0.779. A degree centrality with the highest possible value of 1.0 would state that a business is connected to all nodes in the network. The largest exchange platform Mt.Gox is the major hub in the exchange subgraph with a degree centrality of 0.62. Compared to other business categories, the second highest degree centrality belongs to the web wallet service Instawallet with a value of 0.03. This could be explained by the fact that many Bitcoin users transact via their web wallet instead of using local clients. The major hub in the mining business is Deepbit, the largest mining pool in the network, with a degree centrality of 0.876. In case of the donation business, the first and second major hub is controlled by the Faucet Donation. Instawallet and Bitcoin Faucet are the major hubs in the wallet subgraph with a degree centrality of 0.395 and 0.223, respectively. The media and vendor business do not show dominant hubs within their respective business category.
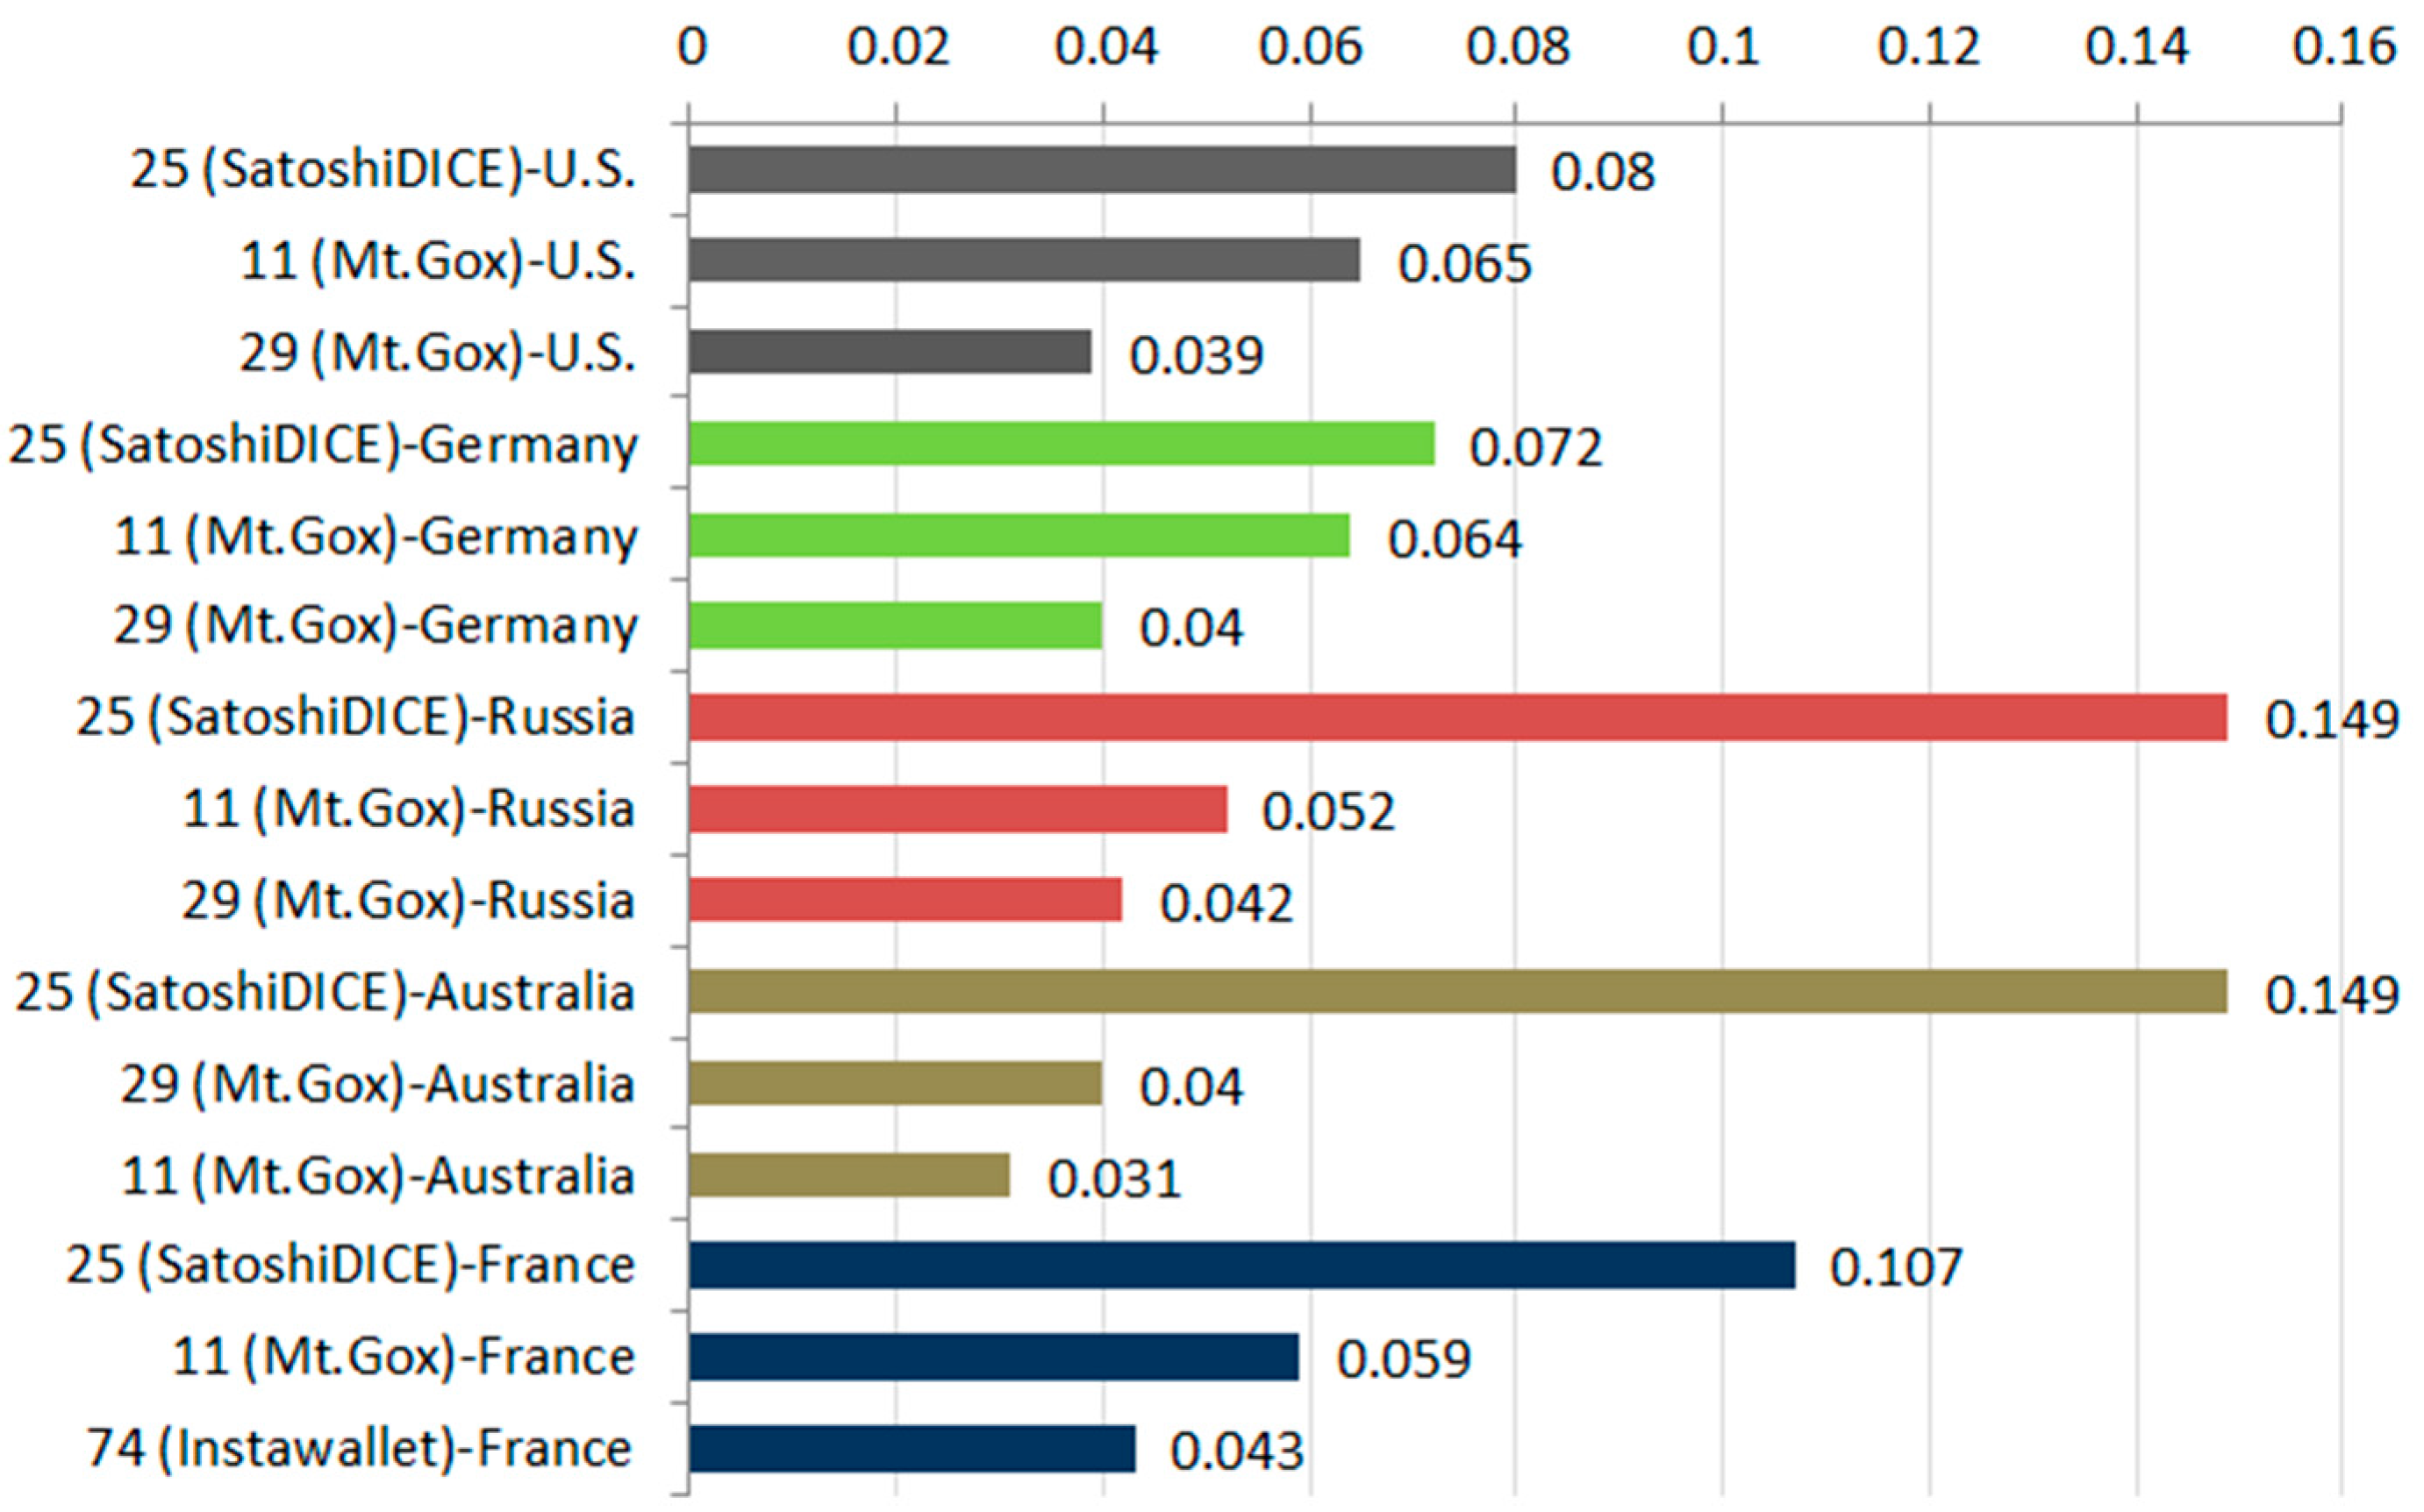
When looking at the top three major hubs in the network for different countries, one can see that the primary Bitcoin markets (U.S. and Germany) have almost the same distribution of degree centrality (Figure 29). Common facts among all considered countries are the businesses that make up the major hubs such as SatoshiDICE and Mt.Gox. The gambling business SatoshiDICE plays a very dominant role, especially in Russia and Australia, with a degree centrality of 0.149. France deviates slightly, because Instawallet is the third largest hub that indicates a higher usage of web wallet services in that country.
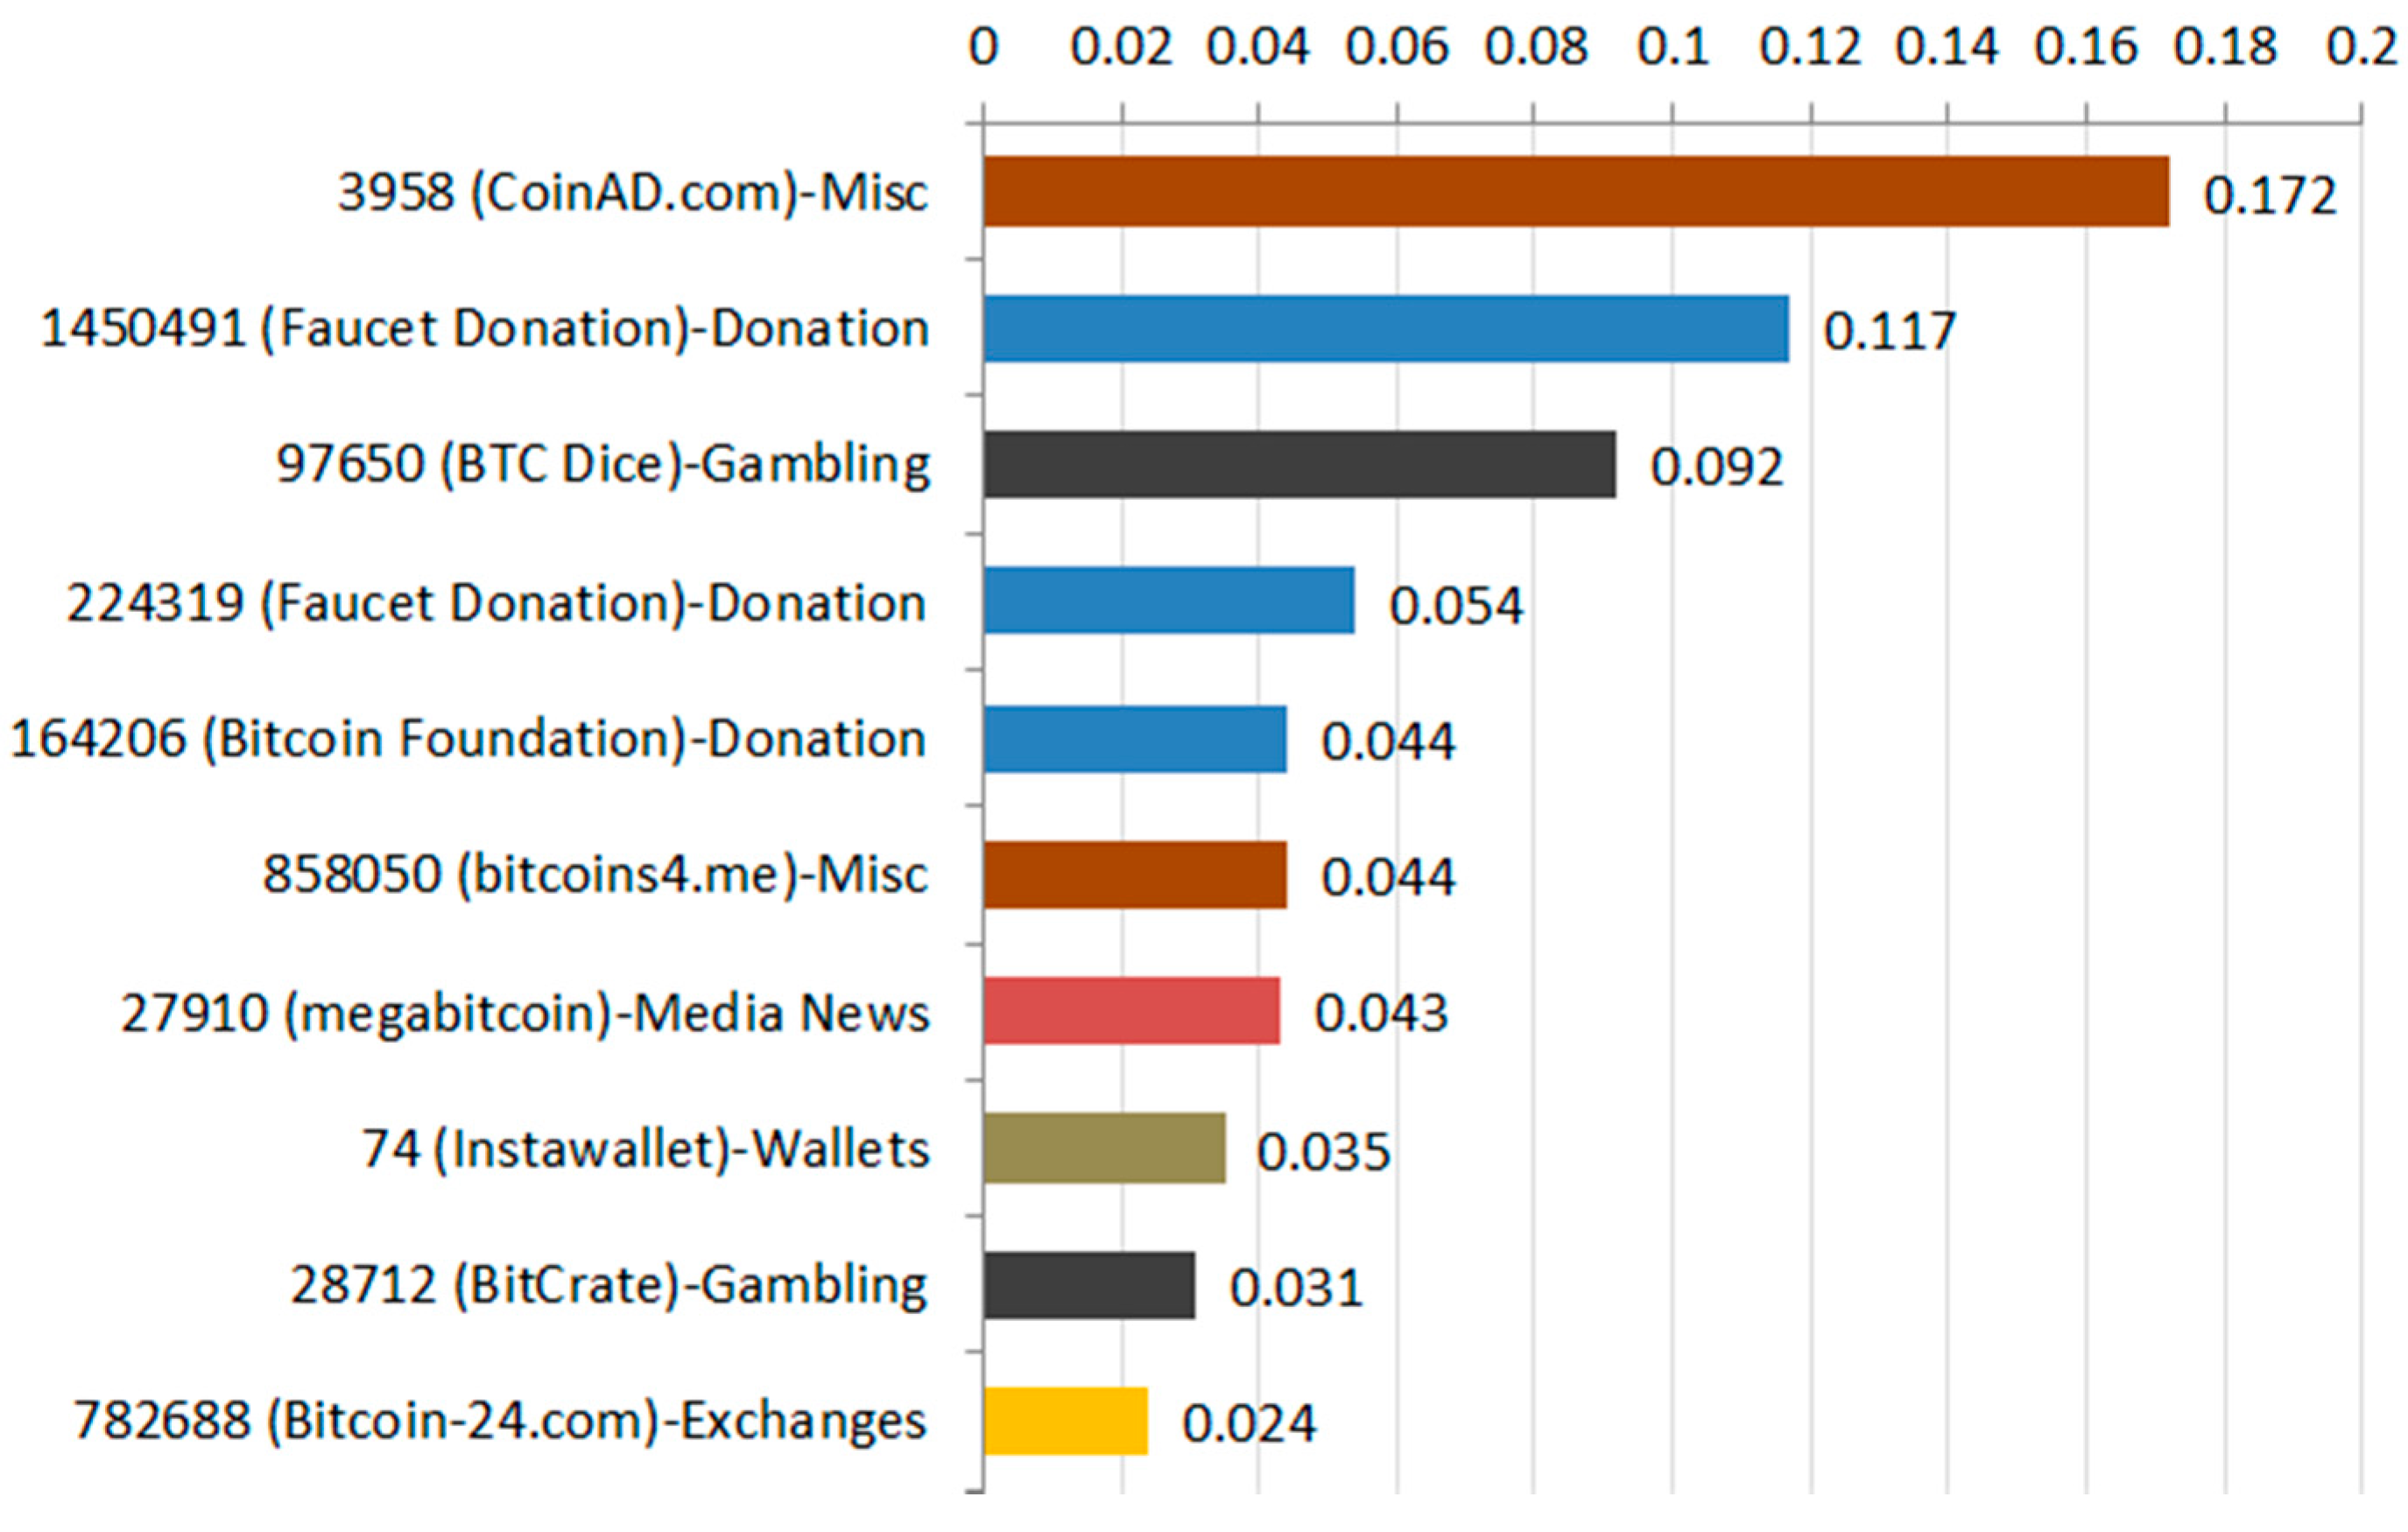
One can see that the three major businesses in the Bitcoin economy are also dominant on several country aggregations and within their respective business category. Hence, the economy is analyzed without these businesses to get more insight on other participants in the network (Figure 30).
The business with the highest degree centrality (0.172) in this subgraph is CoinAd.com. As mentioned above CoinAd.com is only related to 674 transactions but incorporate over 142 thousand relationships in the network. An interesting finding is that the donation services such as Faucet Donation and Bitcoin Foundation are very dominant in comparison to the gambling business sector. Furthermore, the second largest exchange platform Bitcoin-24.com has a low degree centrality of 0.024. Although businesses such as BTC Dice, Instawallet, or Bitcoin-24.com are related to more transactions, the actual number of relations to other nodes (measure for degree centrality) is rather low in comparison to services like CoinAd.com or Bitcoin Foundation.
More complex centrality measures such as betweenness and closeness centrality require high computation power and are therefore applied only on small subgraphs. The betweenness centrality measure is applied to identify brokers or connectors between groups of nodes within the network. With closeness centrality one can identify the most central points from where transacted Bitcoins flow most efficiently through the network.
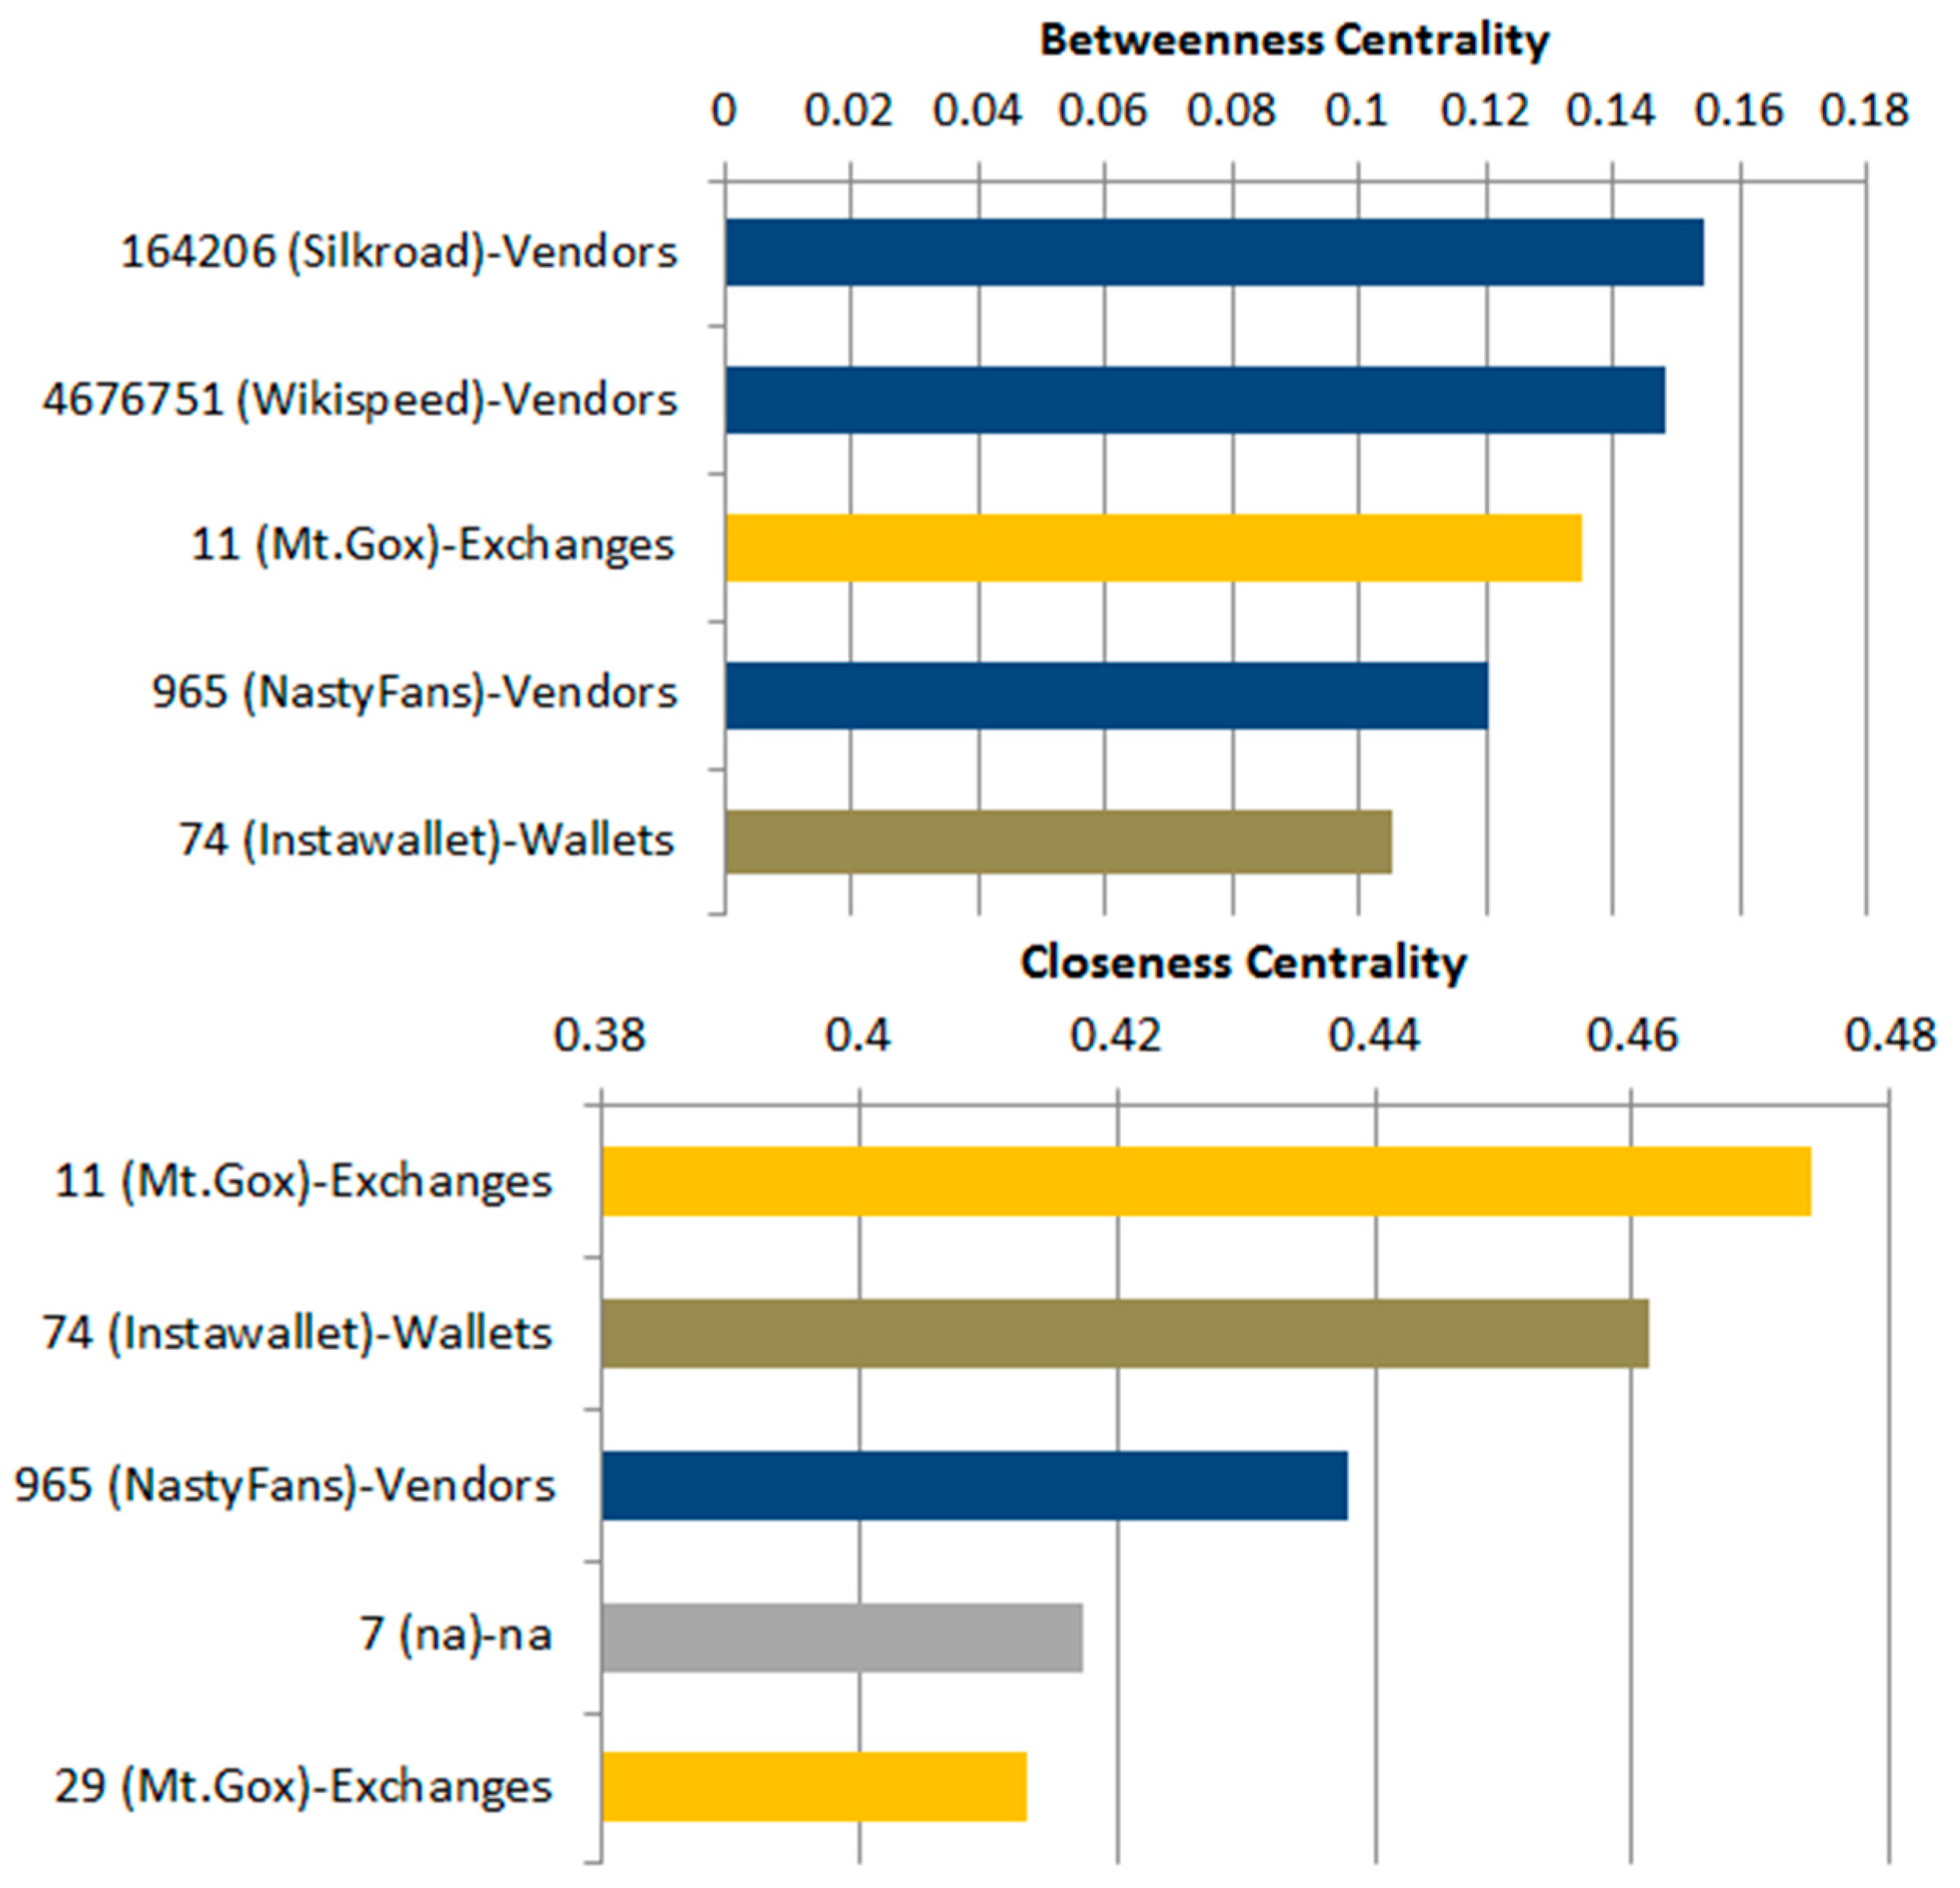
For this particular analysis the subgraphs vendor business and wallet business were chosen. Figure 31 shows the betweenness and closeness centrality for the vendor business category. The betweenness centrality measure indicates that Silkroad and Wikispeed are the major brokers in the vendor economy. Beside the vendor businesses, the exchange platform Mt.Gox and the web wallet service Instawallet are among the major brokers in the network. Exchange platforms serve as gateways to the real economy where vendors can trade their earnings to fiat currencies and vice versa. On web wallets users can store their Bitcoins online and trade them against goods; thus serving as connection between users and the vendor businesses. The closeness centrality measure shows that these two businesses are also the most central ones in the network.
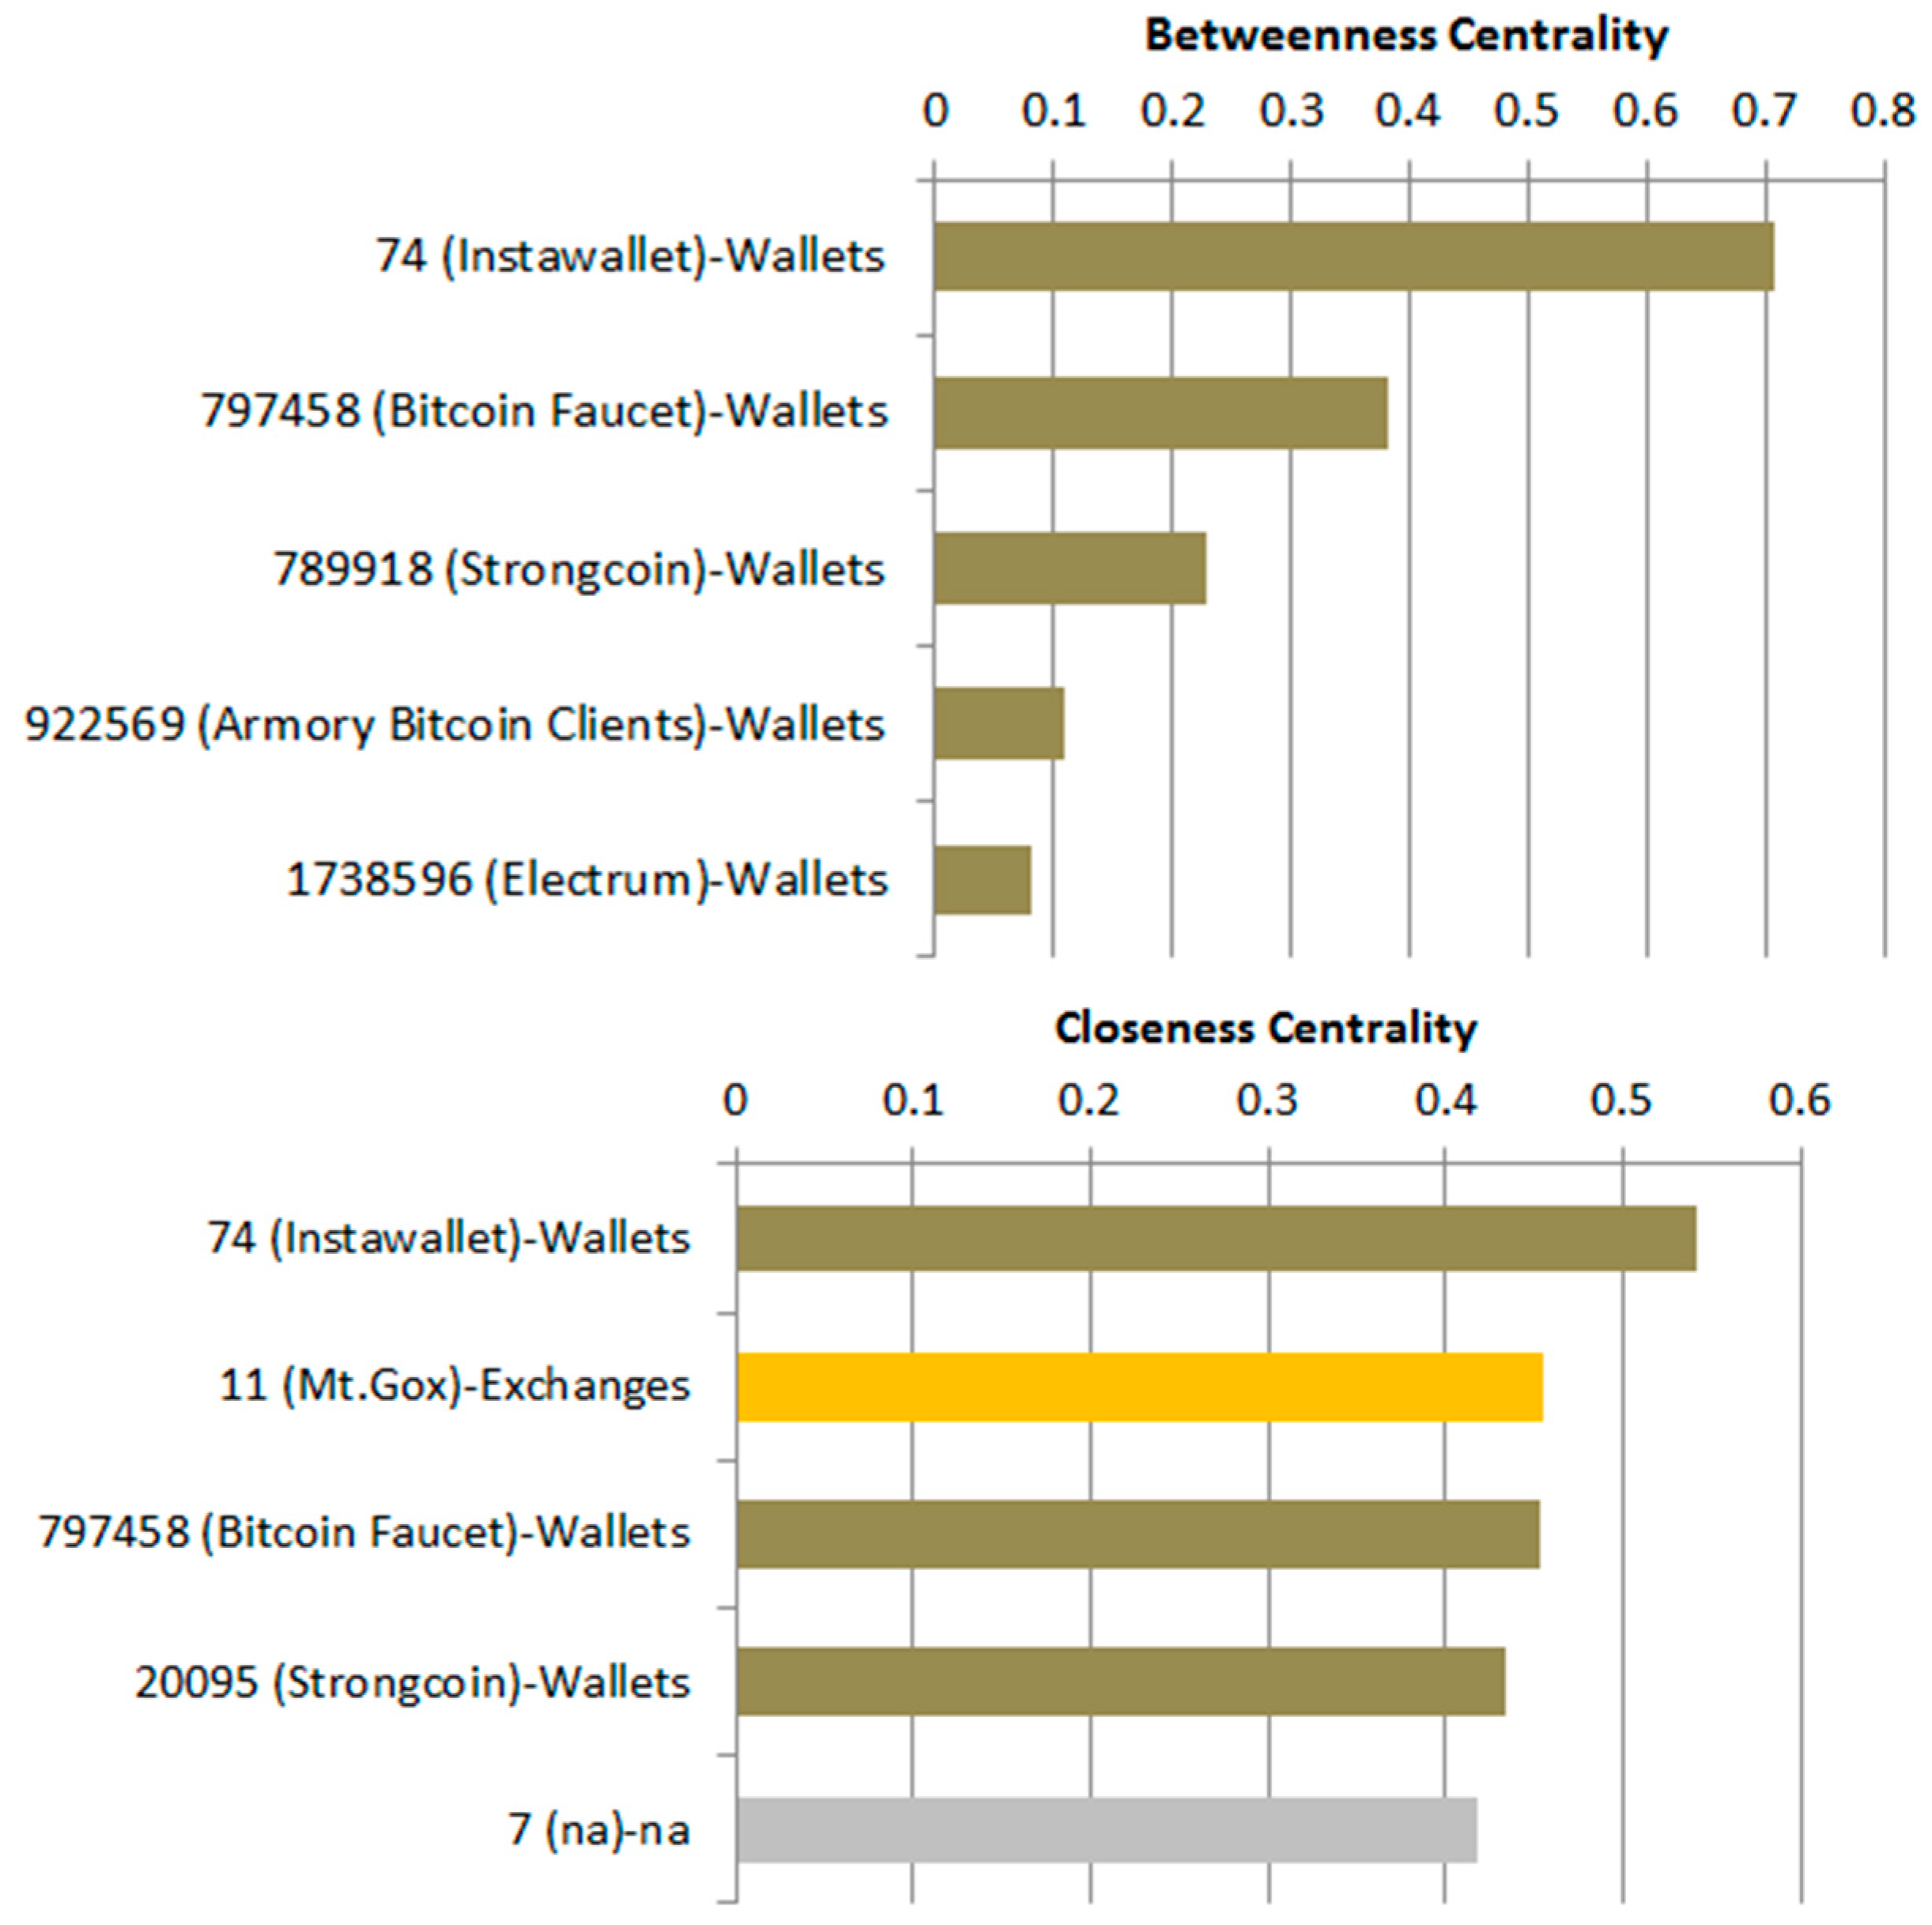
In terms of the wallet business (Figure 32), the major hubs Instawallet and Bitcoin Faucet are also the main brokers in the network. Interestingly, the top five betweenness centrality values belong all to wallet businesses indicating that web wallets serve as connectors between other businesses. When considering the closeness centrality, Instawallet is again the most central node in the network followed by the exchange platform Mt.Gox. Exchange platforms like Mt.Gox are very centrally positioned in the network and play an important role within the Bitcoin economy.

6.2.3. Clustering in the Bitcoin Network

In this section, the network measure average clustering coefficient is going to be applied on the time, business, and country level to investigate the global cliquishness in the graph. Furthermore, it serves as a first indicator of the small world phenomenon within the Bitcoin network. Analyzing the existence of small world networks requires high computation power and is therefore conducted on minor subgraphs on the country and business level.
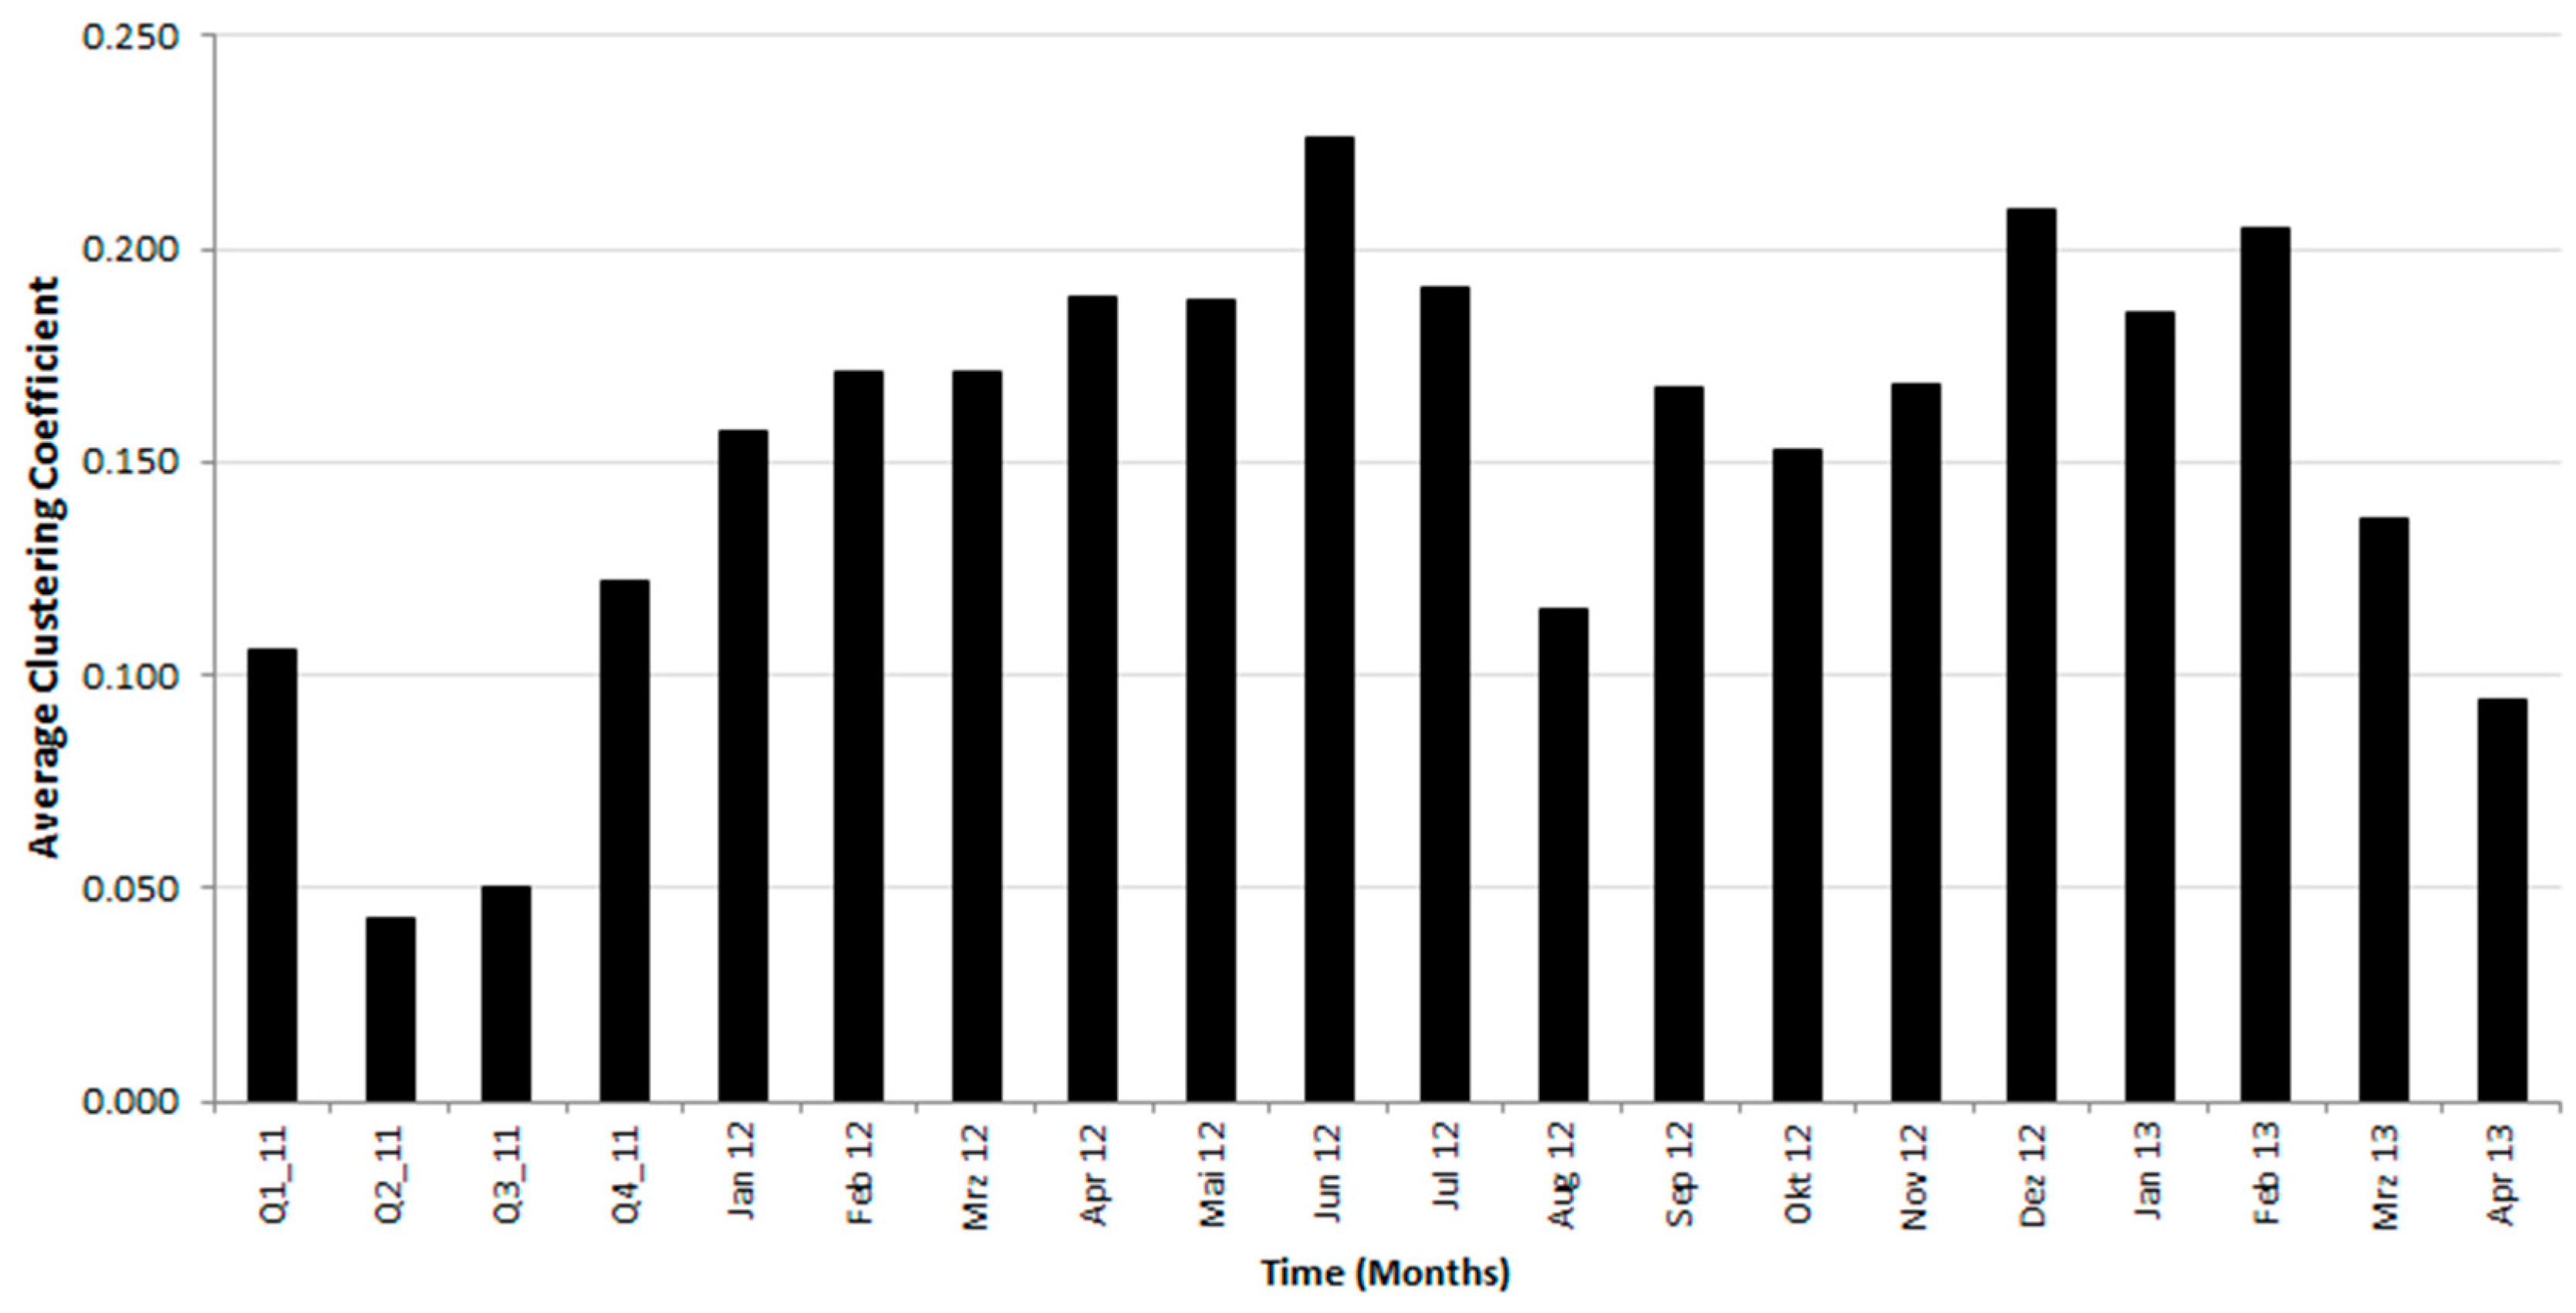
When considering the average clustering measure over time in Figure 33, one can see rather high coefficients in comparison to random networks, indicating a small world network. The measure was computed on a monthly basis for the years 2012 and 2013. For the year 2011 the calculation was done quarterly. The years 2009 and 2010 were omitted from the analysis due to very low activity in the network and lots of transactions between same entities.
The average clustering coefficient decreases with increasing activity in the network. In quarter two and three of 2011 the lowest coefficients were computed, while the user activity surged in that time period. The same effect can be noted for August 2012 and March 2013. Hence, more user activity in the network reduces the global cliquishness in the Bitcoin economy.
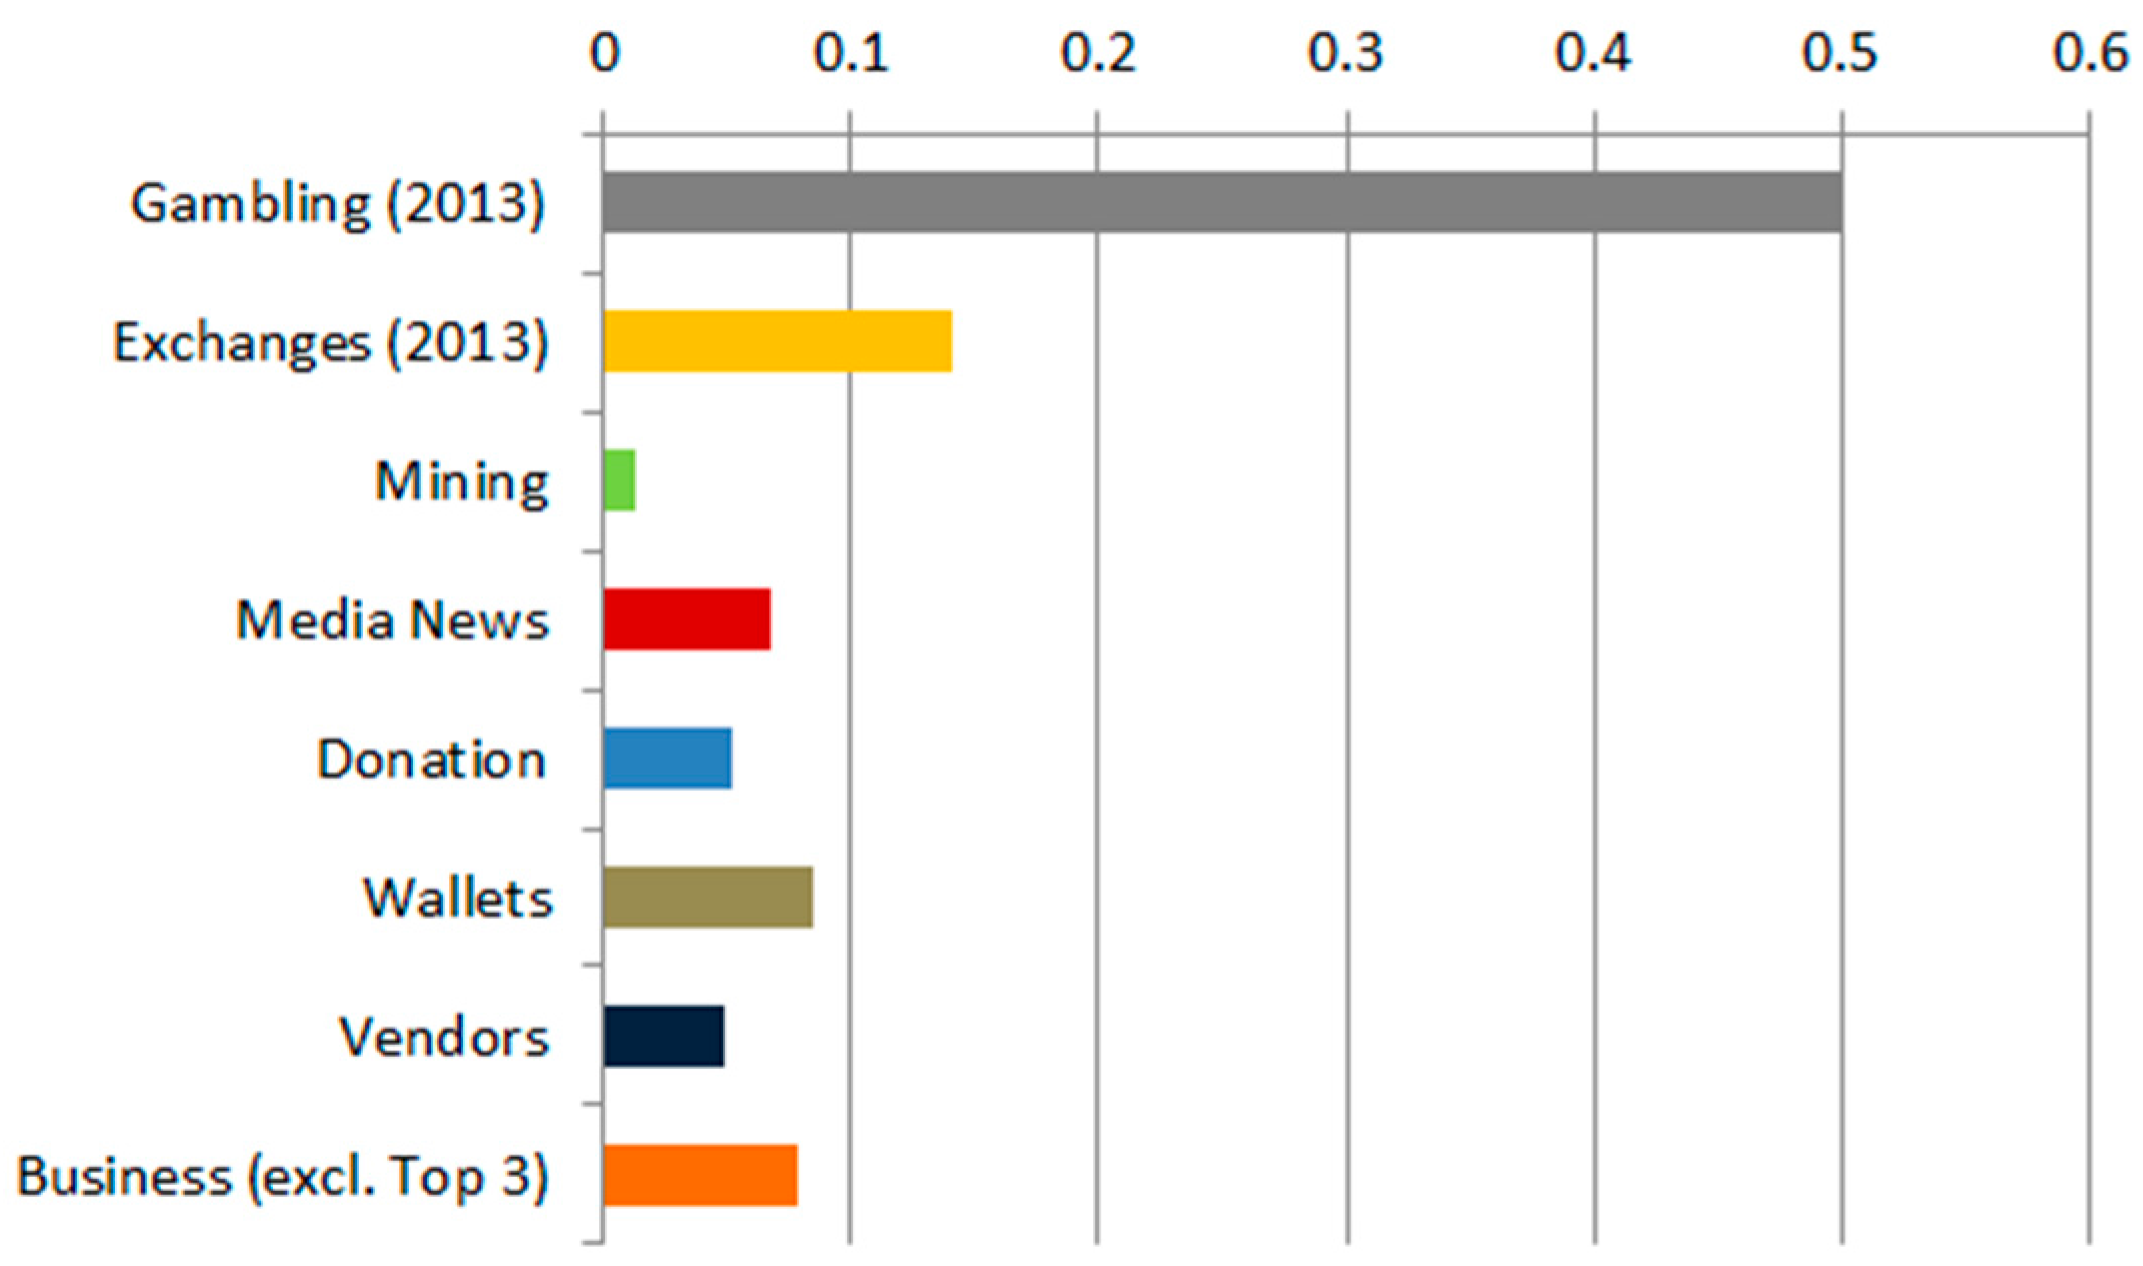
The average clustering coefficients for different business categories are depicted in Figure 34. Because of limited computation power, the coefficients for the gambling and exchange business were calculated on subgraphs (January–April 2013). The gambling business has the highest average clustering coefficient with around 0.5. This indicates that the gambling business is tightly connected and has a high density of nodes. In contrast, the computed coefficients for other businesses are rather low but indicate the existence of the small world phenomenon. The mining business has a low average clustering coefficient with 0.012, indicating a rather separated engagement of the miners in the network.
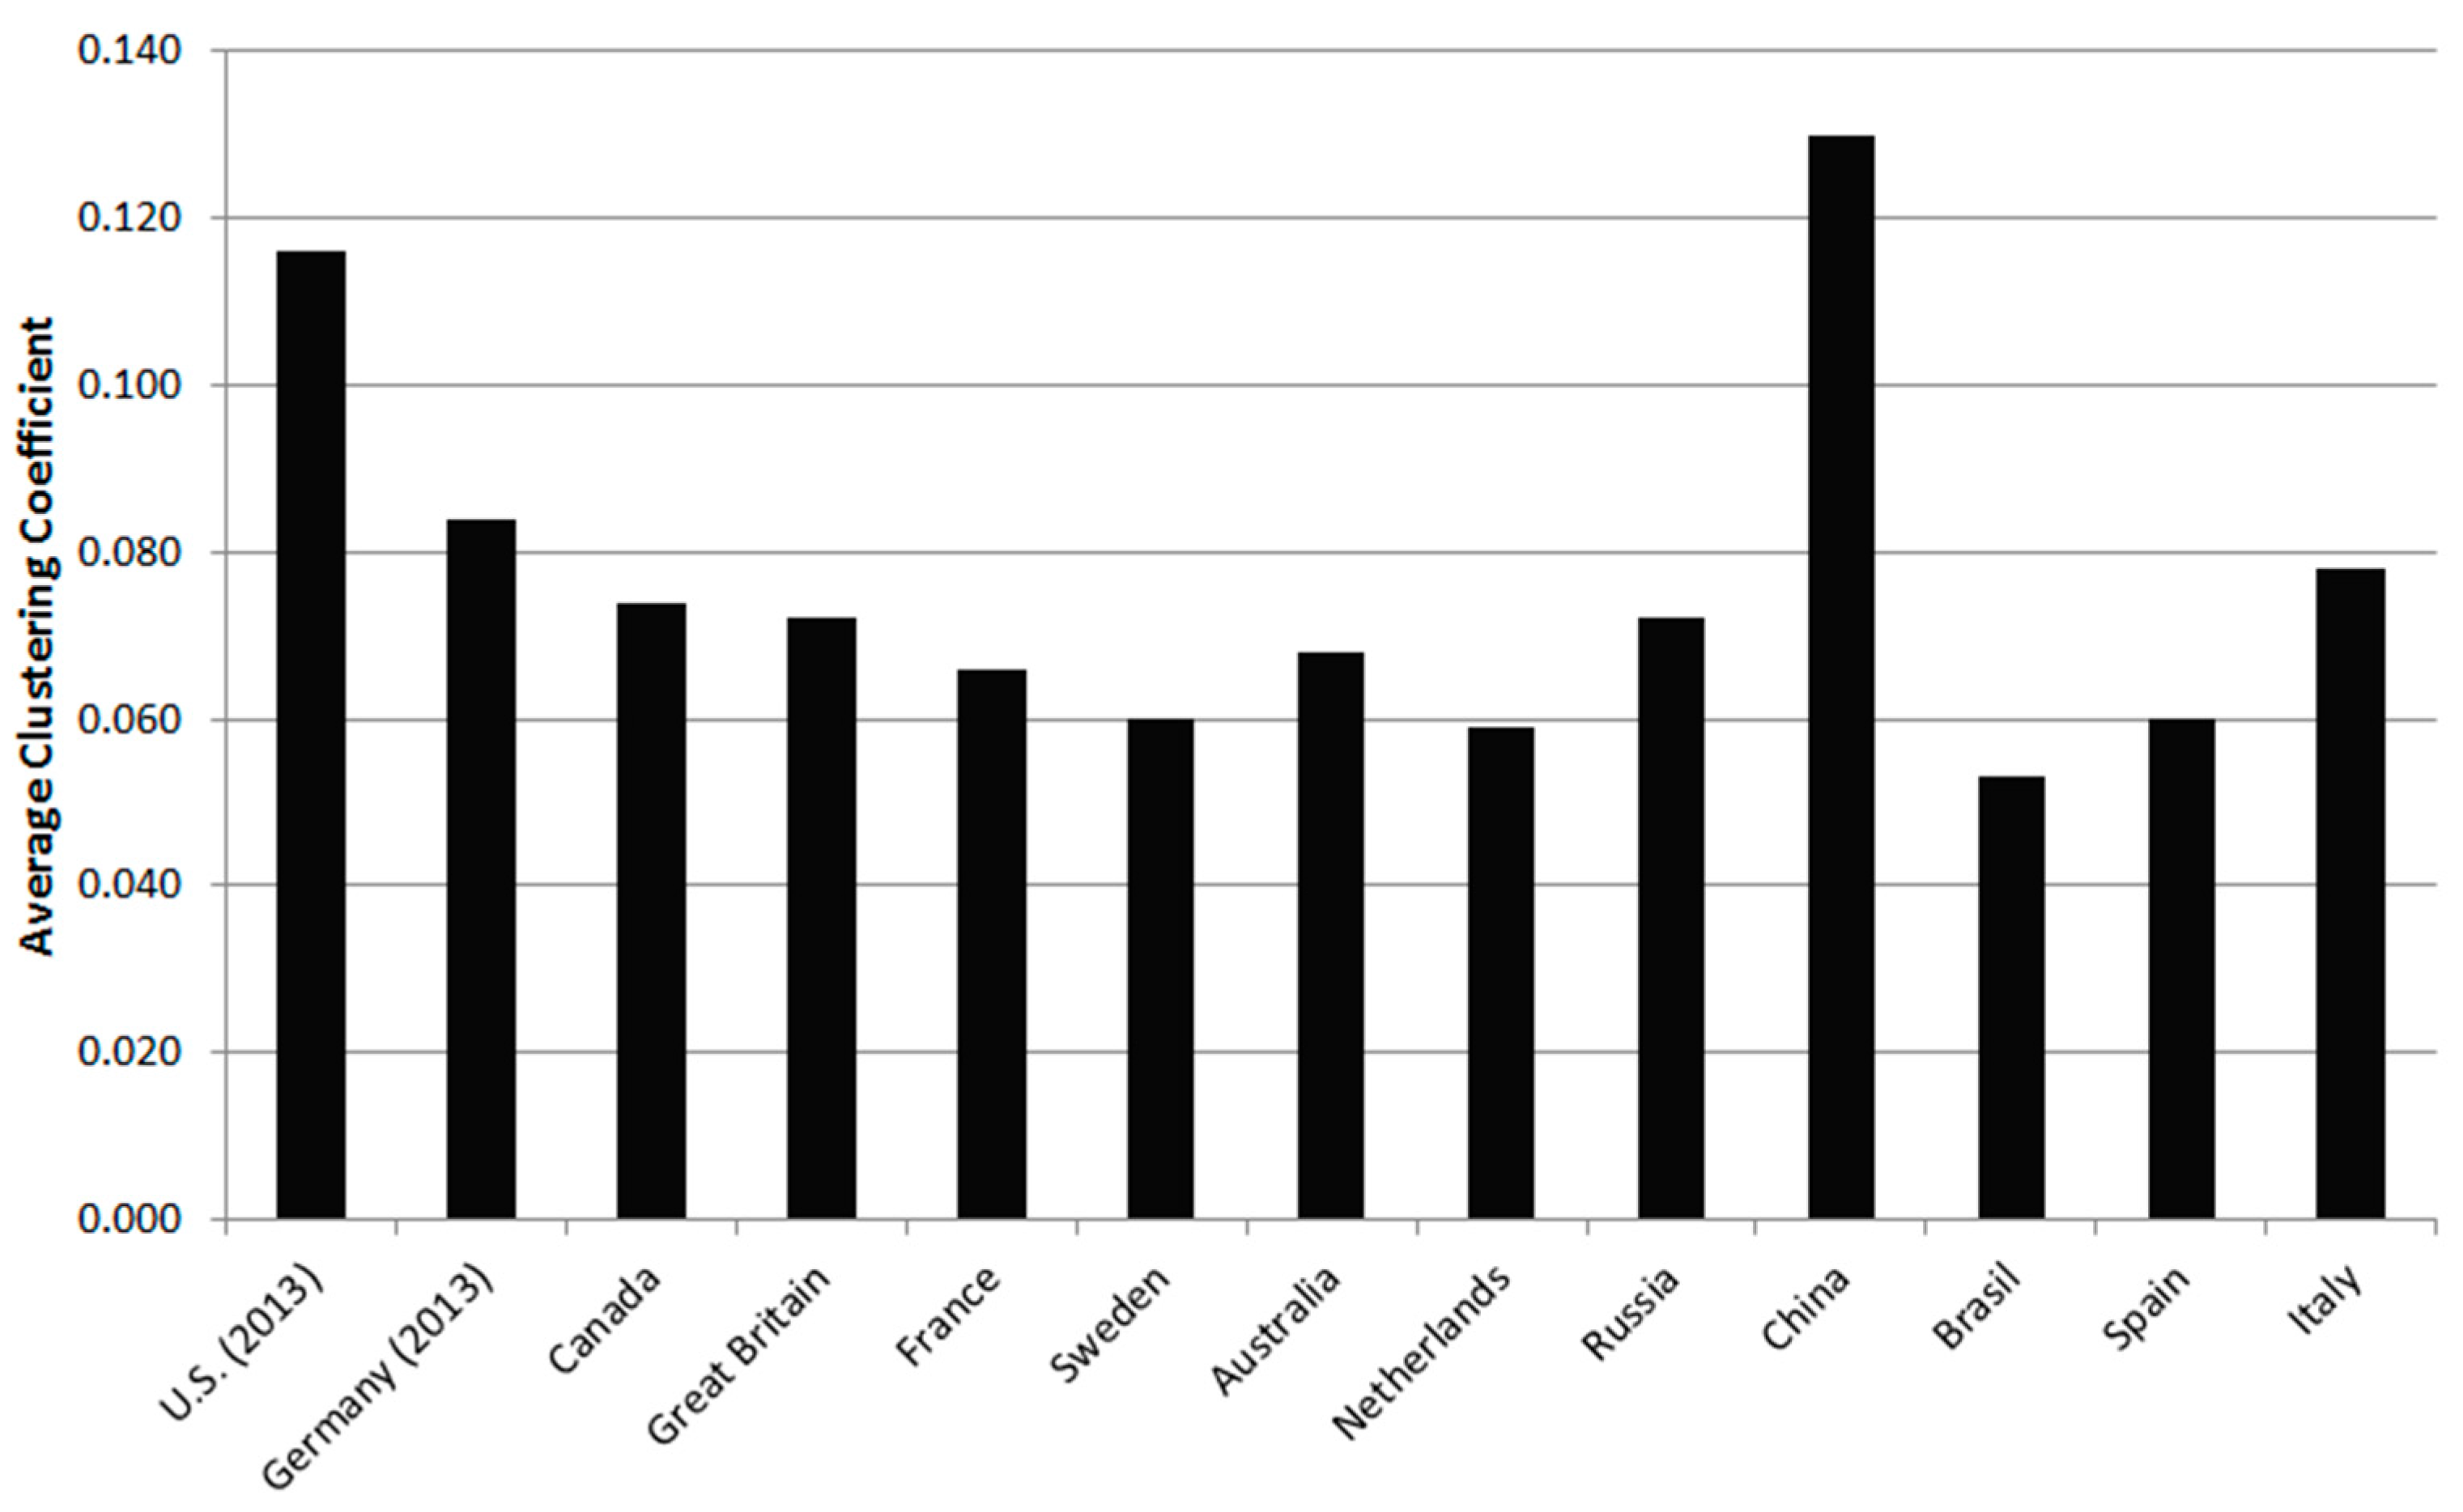
Figure 35 shows the average clustering coefficient for selected countries. The coefficients for the major markets U.S. and Germany were calculated on subgraphs (January–April 2013). China and the U.S. have the highest avg. clustering coefficient with 0.116 and 0.130, respectively. These are also Bitcoin markets that are mainly driven by the gambling business, which has a very high average clustering coefficient. The coefficients for the other Bitcoin markets are in the range from around 0.05 to 0.08, indicating the existence of the small world phenomenon when considering the average clustering coefficient for random networks.
In the following, the hypothesis of the small world character will be tested on two business categories and four countries as representatives for these aggregation levels. To determine the existence of a small world graph one has to calculate the average clustering coefficient and the average shortest path length of the graph in question. In addition, a random graph with the same number of nodes and edges needs to be generated. When comparing the computed network measures the average clustering coefficient of the Bitcoin network has to be significantly higher than the one of the random network ( C ¯ B i t c o i n C ¯ R a n d o m ) while the average shortest path length has to be rather low and is approximately the same ( A S P L B i t c o i n     A S P L R a n d o m ). The calculation of the average shortest path length requires high computation power for large-scale graphs and subgraphs as it is the case with the Bitcoin network. Hence, testing for the small world phenomenon is done on minor subgraphs on the country and business level.
Table 5 shows the results of the small world analysis. On the country level the existence of the small world phenomenon could be approved for all considered countries. One can see that the avg. clustering coefficient is significantly higher in comparison to the random graph of the same size and that the avg. shortest path is in the same range. In case of the considered business categories, the small world phenomenon could only be approved for the wallets business while the vendors business missed the criteria mentioned above. This shows that a rather high average. high clustering coefficient alone cannot be used to determine the existence of the small world phenomenon. It serves just as a first indicator that requires further analysis on the graph and the comparison of the network measures with a random graph of the same size.

6.2.4. Visual Analysis of the Bitcoin Network

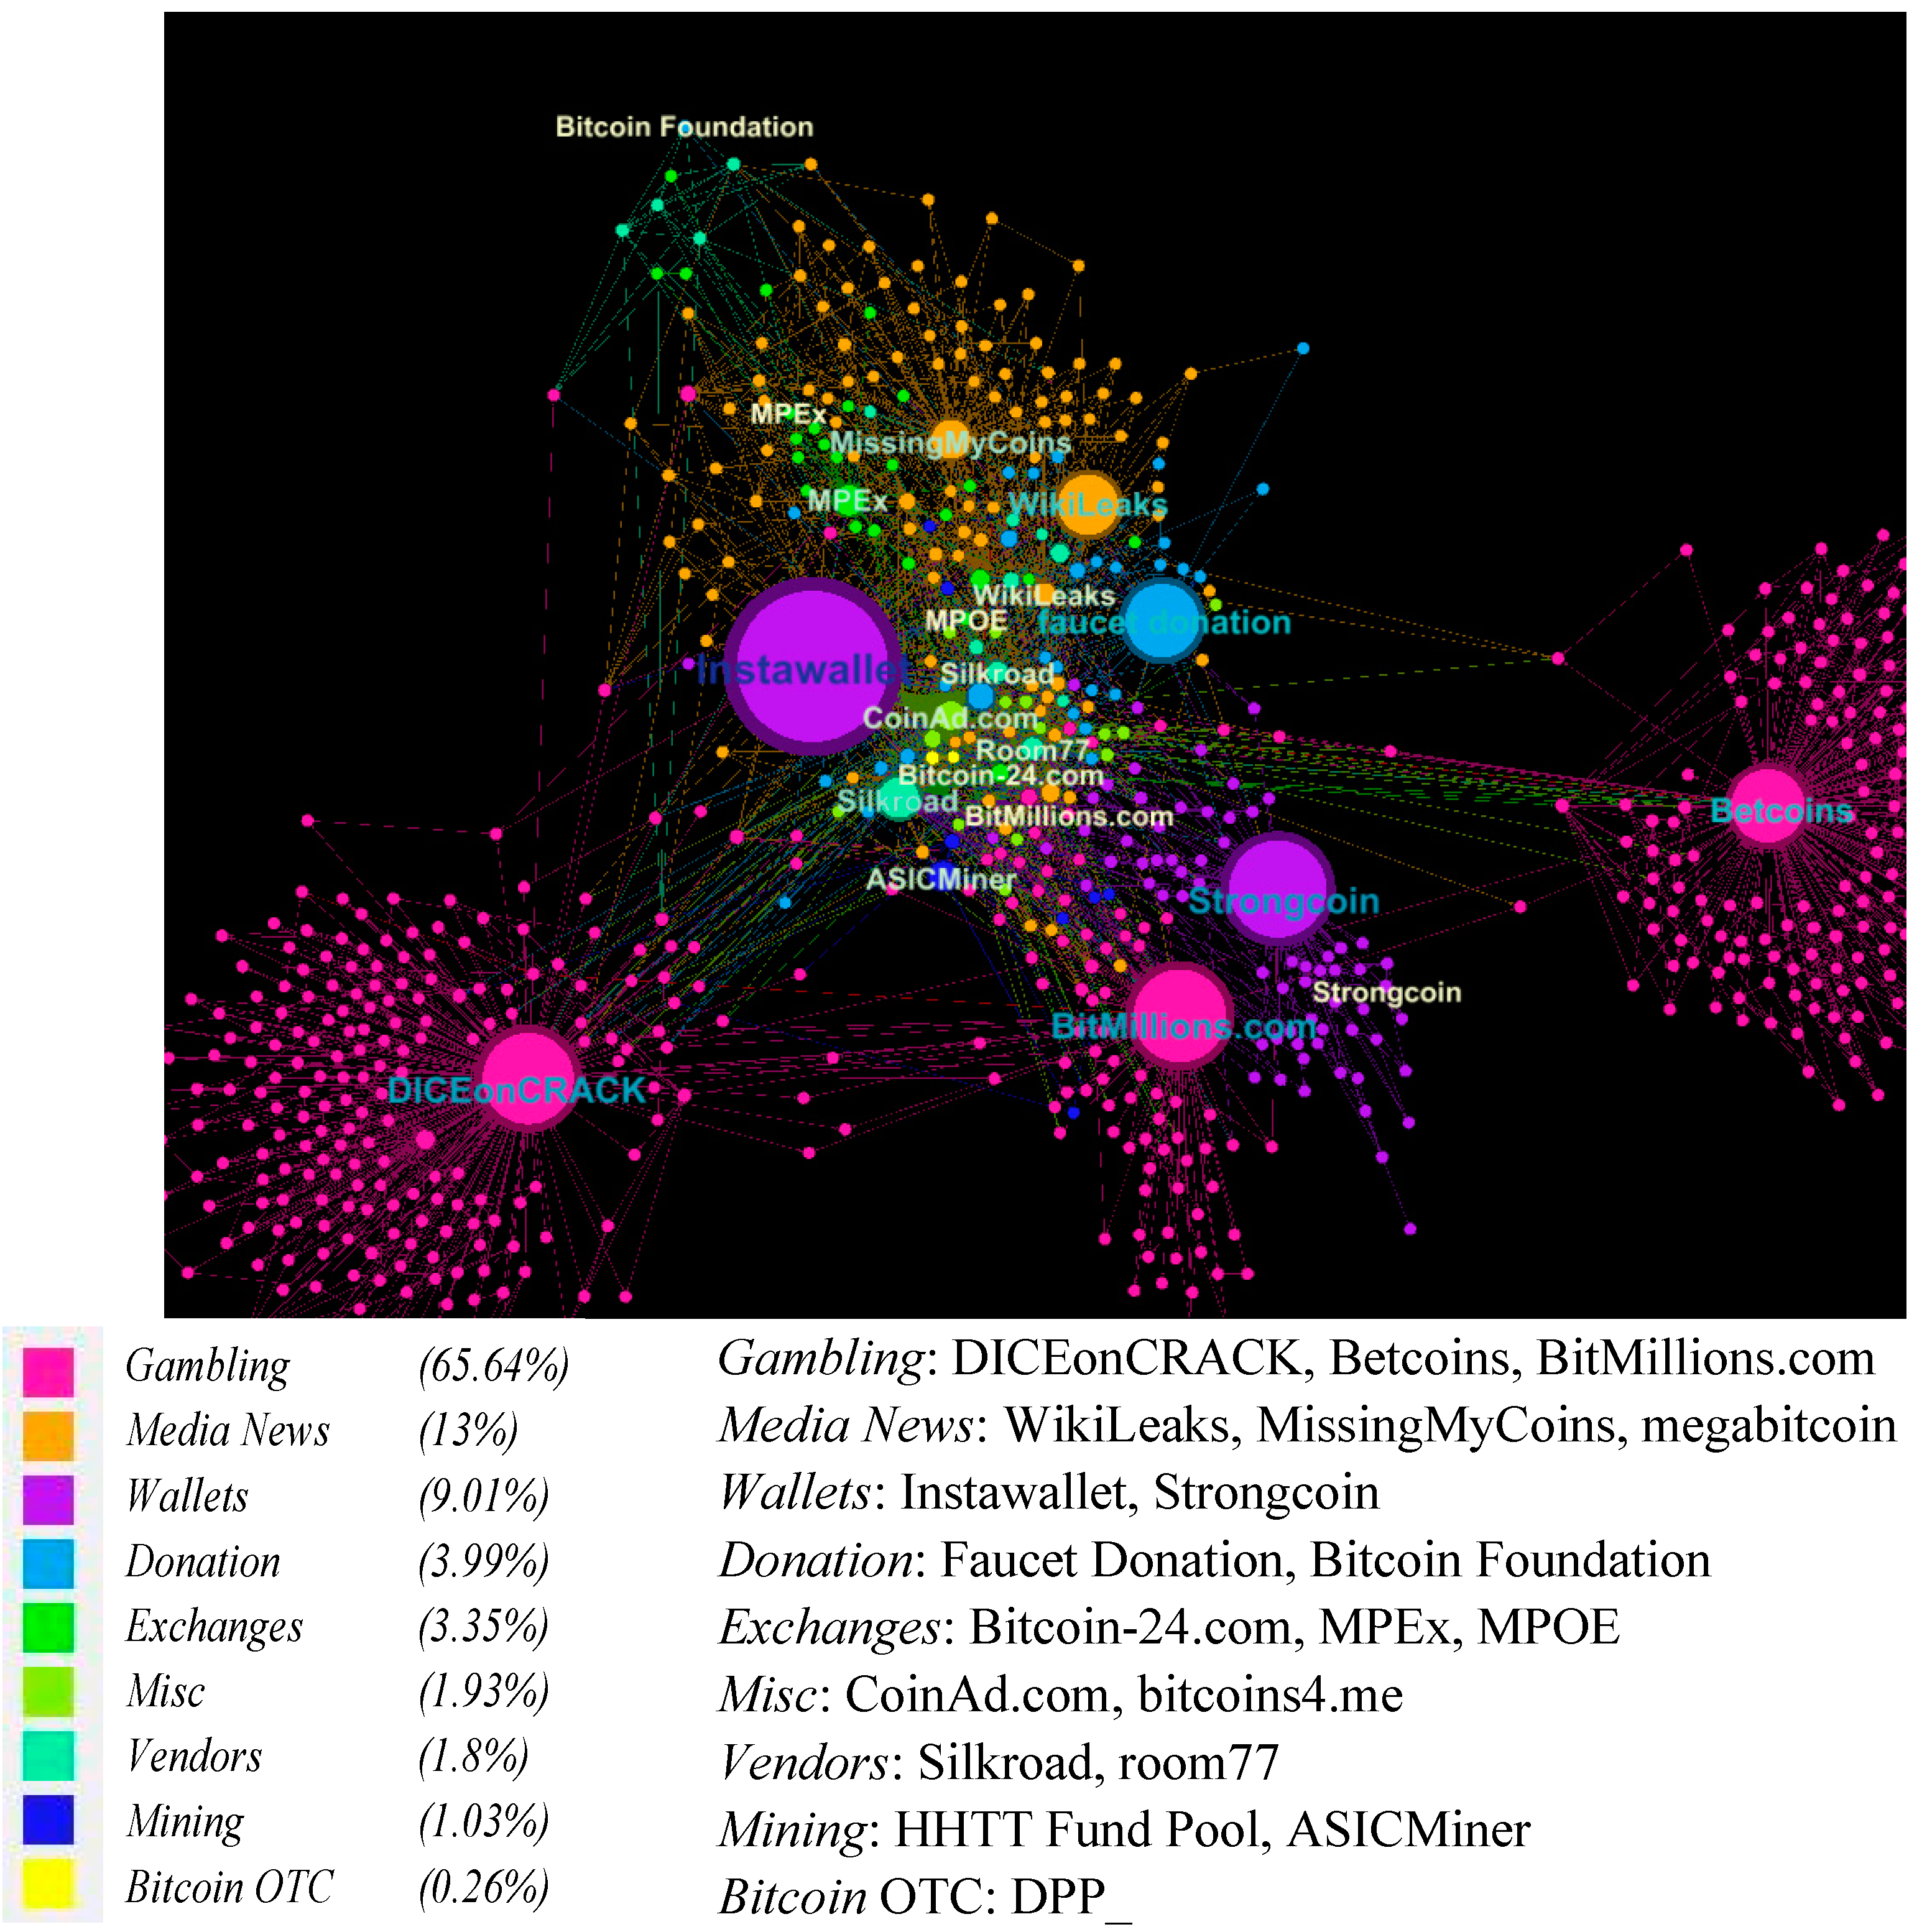
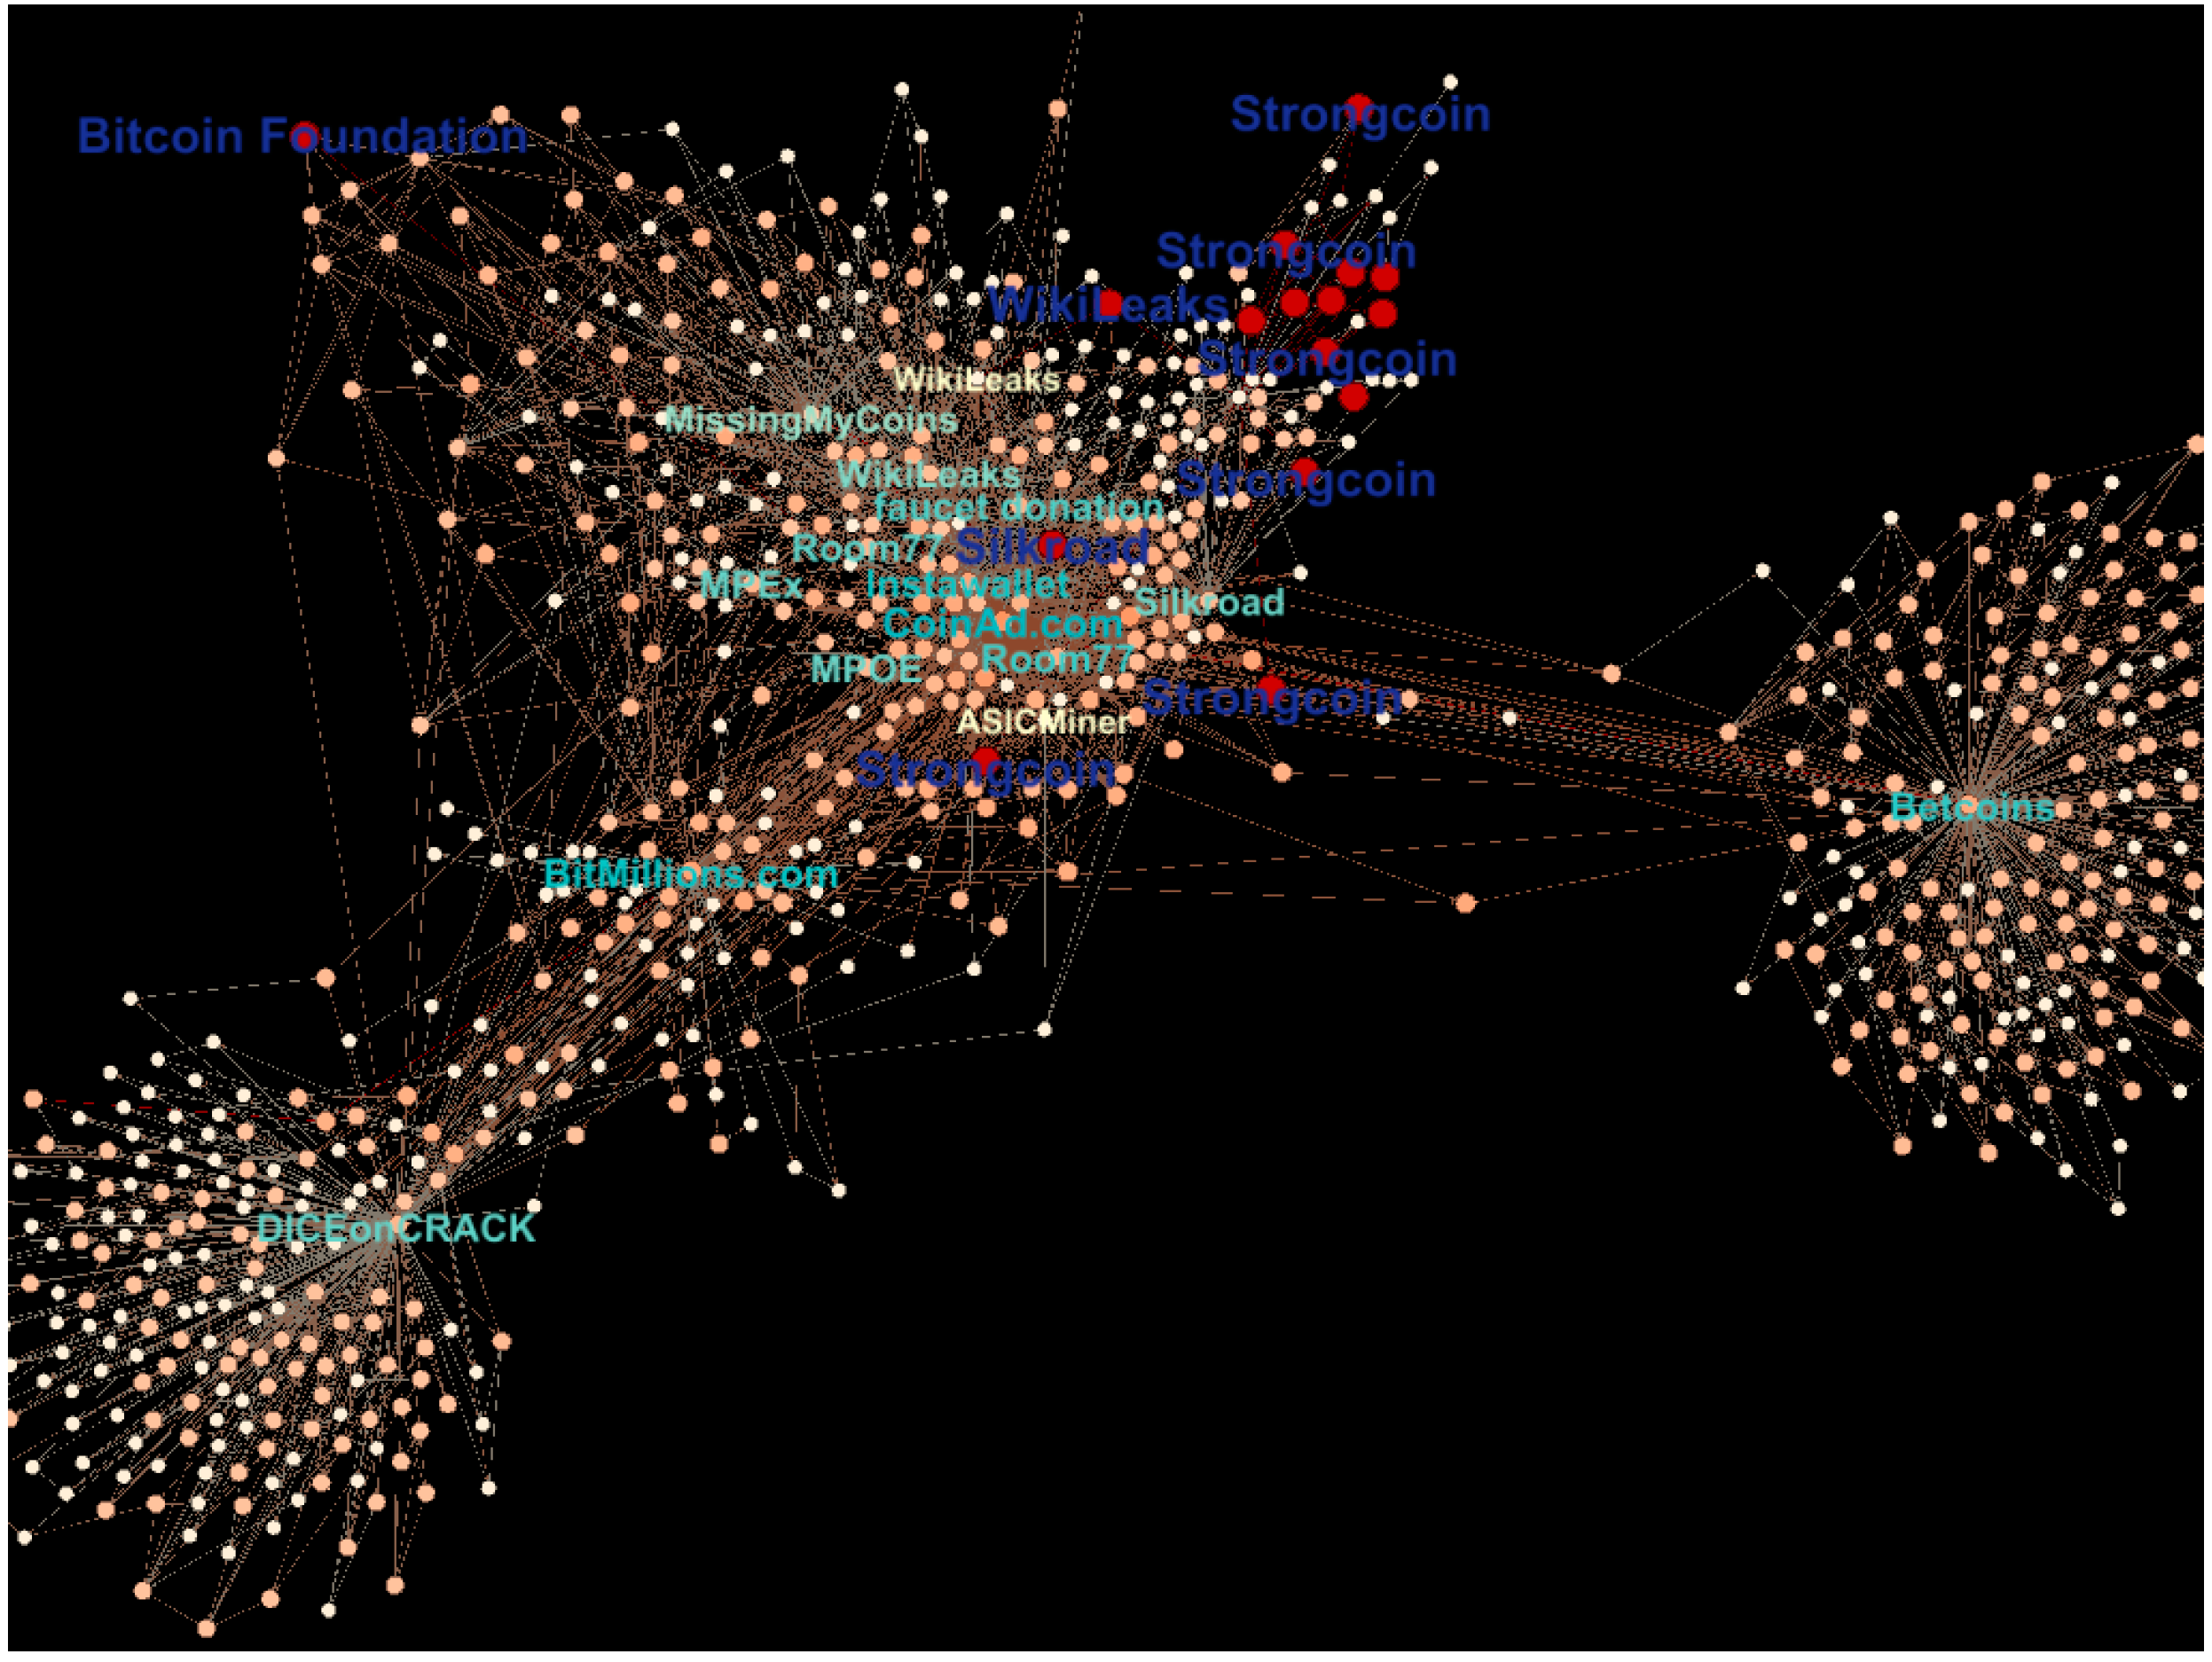
In the final part of the network analysis, the tool Gephi is applied to conduct a visual analysis of the Bitcoin network. The subgraph that is used is based on the tagged businesses excluding the top three businesses (SatoshiDICE, Mt.Gox, and Deepbit). Furthermore, only a certain amount of businesses were chosen that play an important role according to their number of transactions or the transaction value due to limits in computation power. The first visualization (Figure 36) shows the degree centrality per node given by the size of the node. In addition, the label tags are colored and sized by the degree centrality (large and dark blue labels are associated to a high degree and vice versa for the small degree). The nodes are colored according to their category.
When looking at the nodes in the network, one can see that they form groups of clusters for certain businesses, especially in case of the gambling business (DICEonCRACK, Betcoins, and BitMillion.com). This confirms the high coefficient from the previous clustering analysis. The highest degree centrality in this subgraph can be related to the web wallet business (Instawallet and Strongcoin), the gambling businesses, and the donation business (Faucet Donation).
Figure 37 shows the visualization of the clustering coefficients per node in the Bitcoin network. Interestingly, the nodes with a high degree centrality have a very small clustering coefficient, but the nodes around show rather high values, especially in case of the gambling businesses. The highest clustering coefficients can be seen for the exchange platform MPEx and for the nodes around the gambling businesses. In contrast, the values for the mining business (dark blue nodes) are among the lowest in the network. This again confirms the previous analysis on clustering in the Bitcoin economy, even on a much smaller scale.
Figure 38 shows the aggregated transaction volume per node. Two nodes that are associated to the vendor Silkroad have the highest value in this particular subgraph. Other nodes that transact higher volumes of Bitcoins belong to the exchange business (Bitcoin-24.com, MPEx) and the wallet business (Instawallet). In contrast, the gambling, donation, and media/news business transact rather low values of Bitcoins in the network. This confirms previous descriptive statistics on the business aggregates.
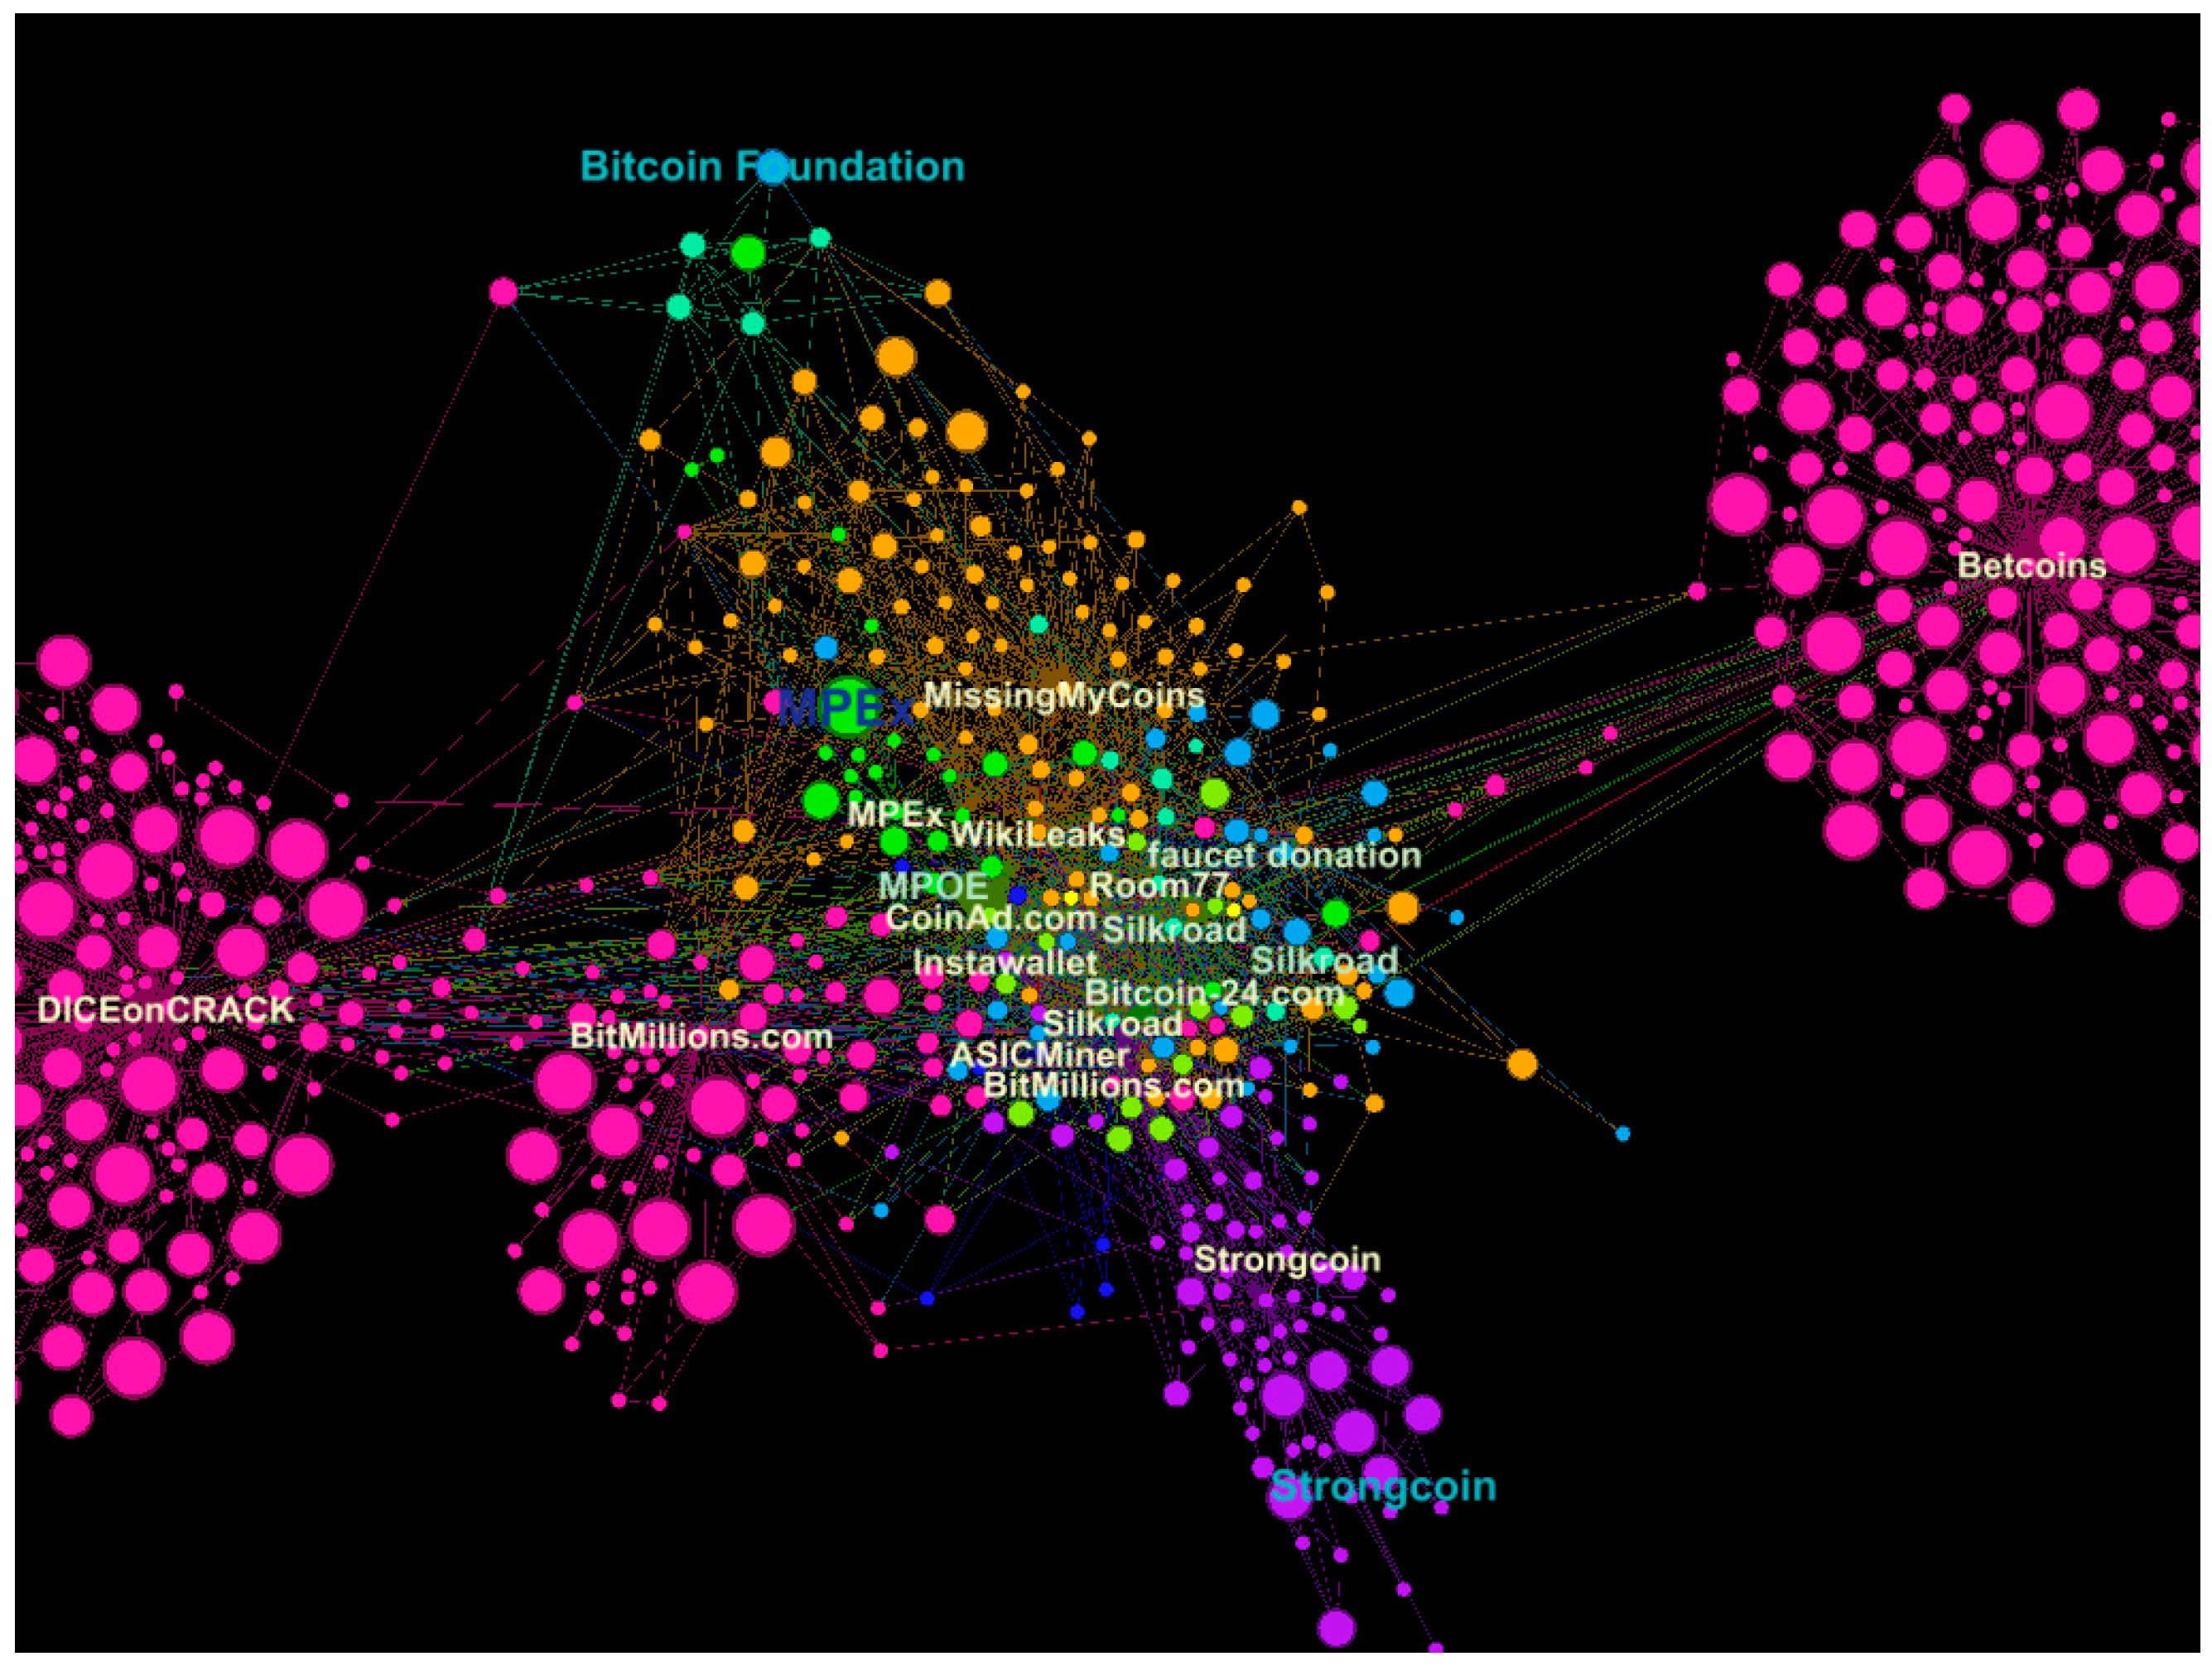
Another interesting node attribute, the node size, is visualized in Figure 39. The node size is determined by the number of public keys that belong to a user or economic entity and can be seen as clusters of public keys. The vendor Silkroad incorporates nearly 210 thousand public keys, while the web wallet service Instawallet and the gambling business BitMillions.com have around 110 thousand associated public keys. Goods traded on Silkroad are often related to prohibited items such as weapons or drugs; hence, anonymity is essential for the participants. The execution of transactions via several thousand public keys and the usage of newly generated public keys for every new transaction might increase anonymity. In case of Instawallet, one can assume that most of the public keys belong to different users, which use the convenient way of storing and using Bitcoins via web wallets in the network. Thus, a large amount of public keys can be interpreted in different ways, depending on the business or service offered.
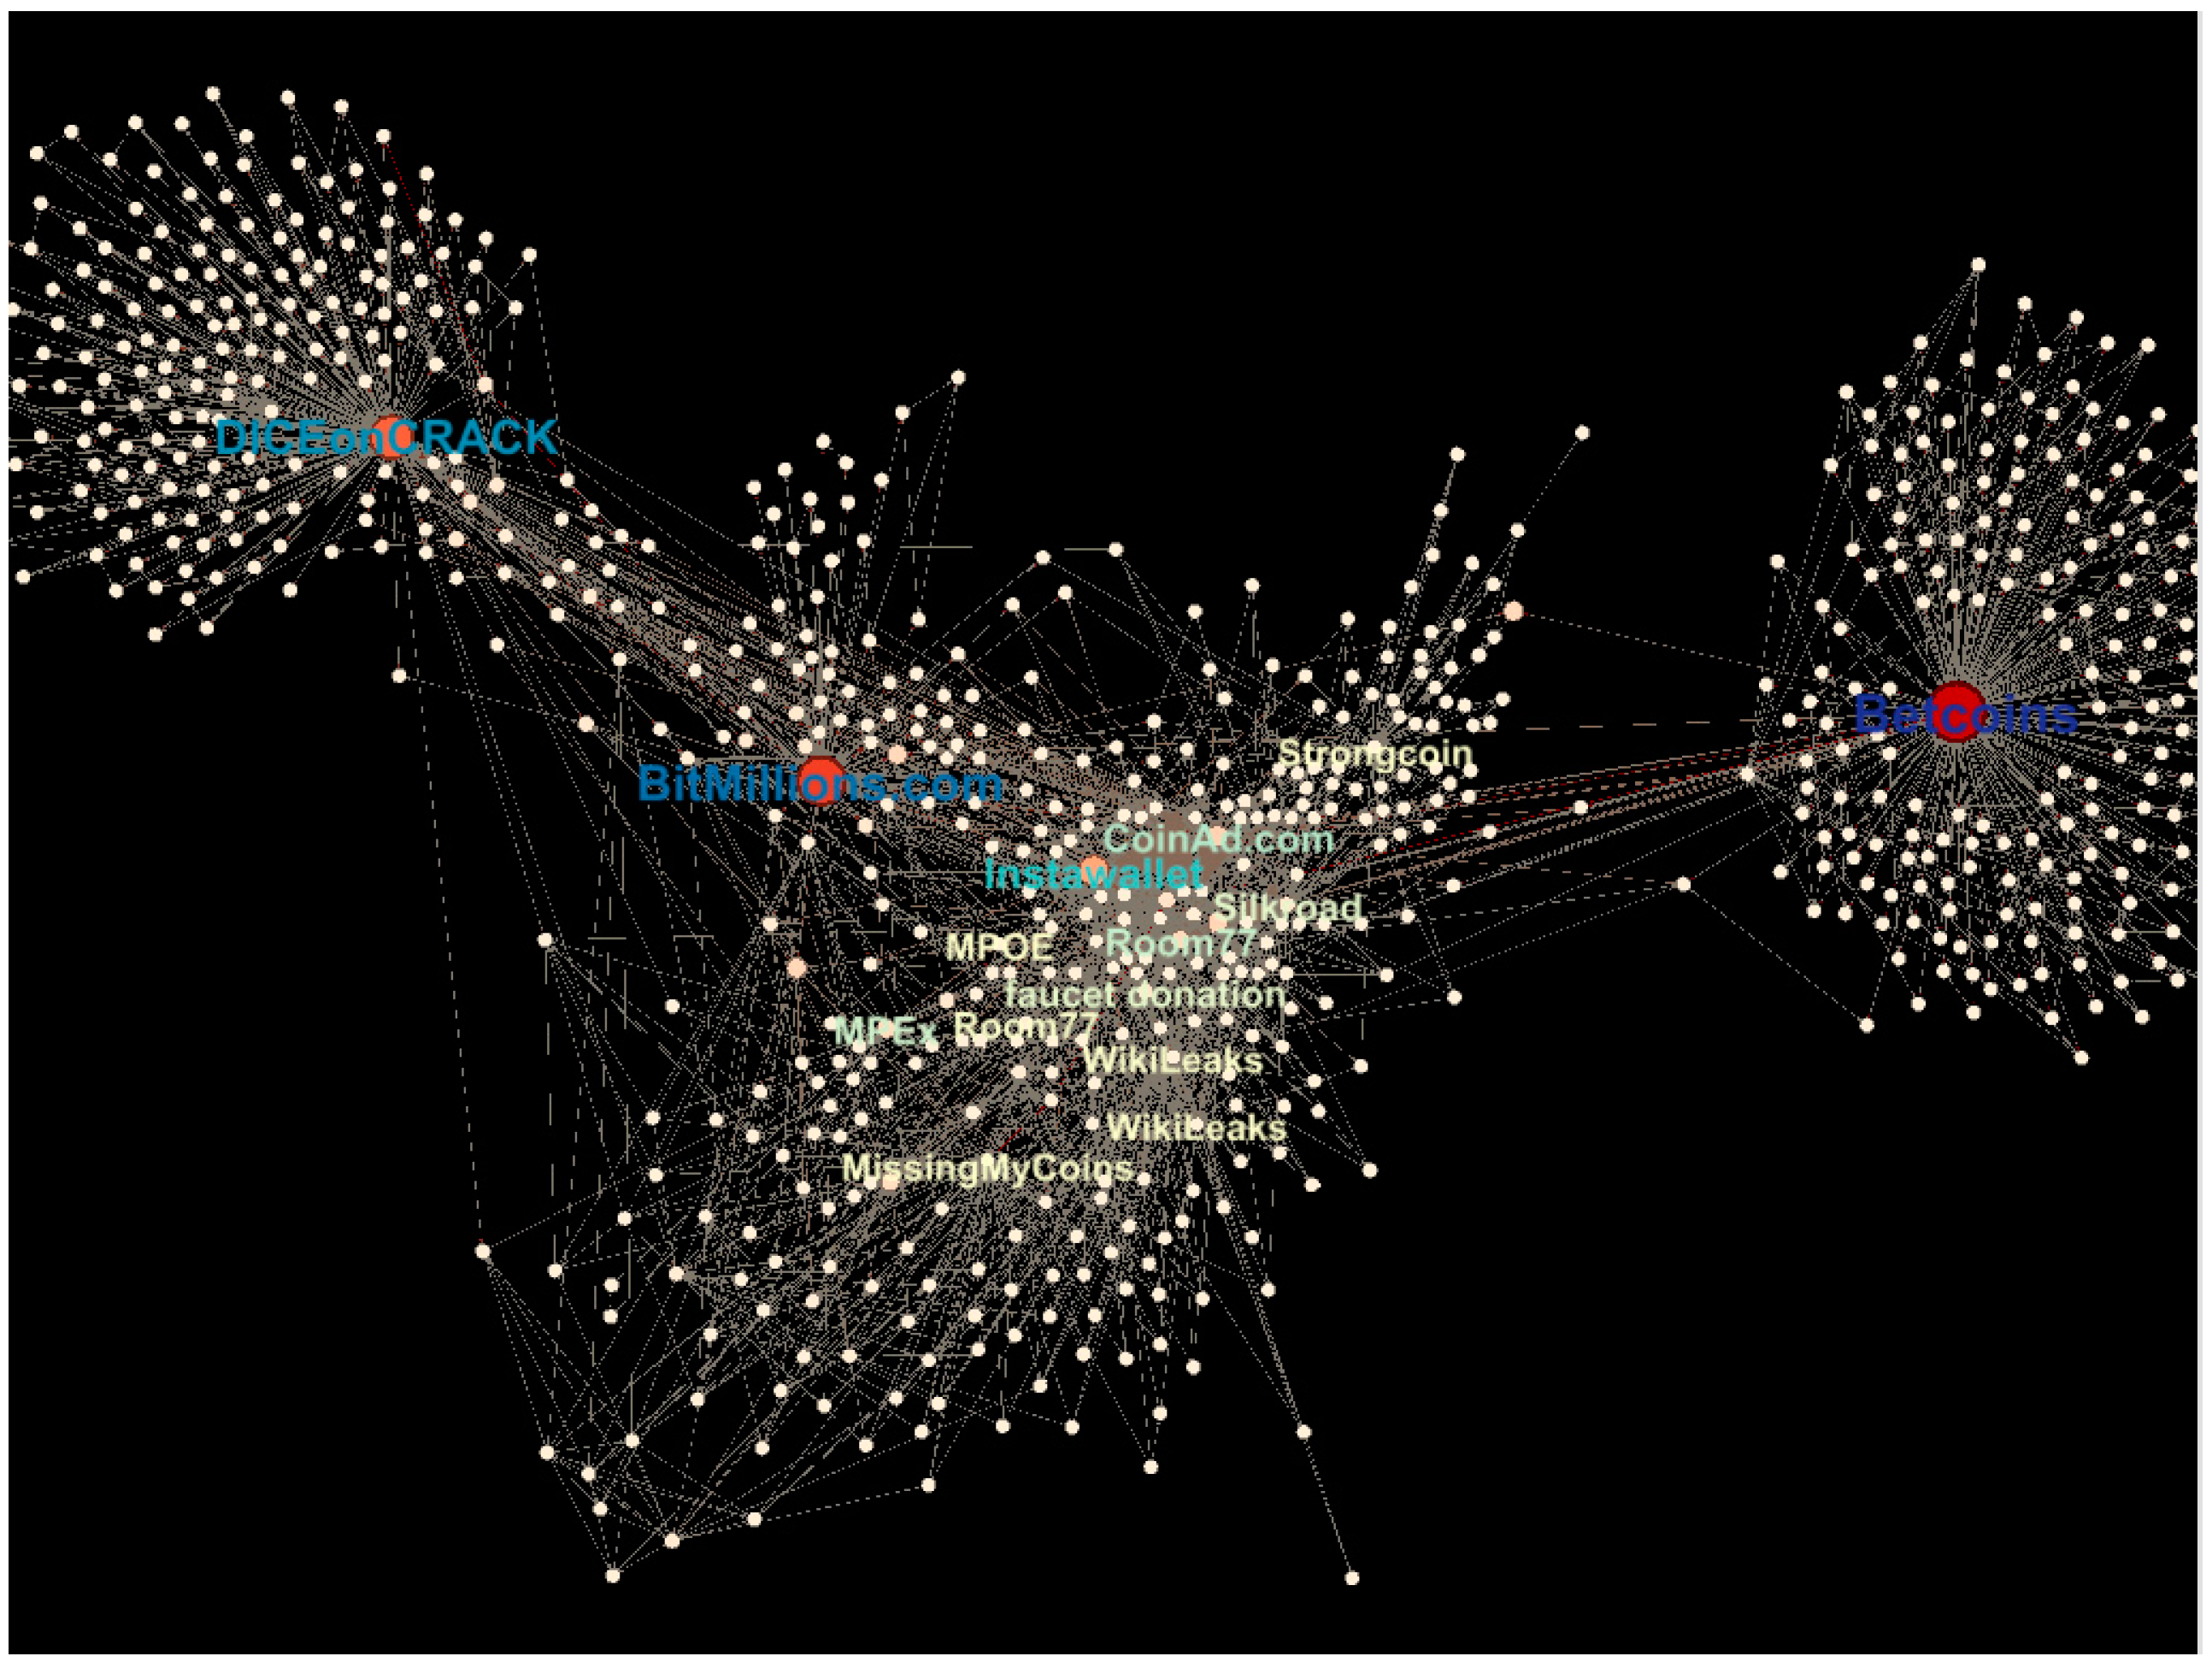
Figure 40 shows visualizations of the betweenness per node in the Bitcoin network. The betweenness centrality highlights the brokers in this subgraph. The gambling service Betcoins has the highest betweenness centrality (0.439) in the network and can be seen as the main broker. Other important nodes that serve as central connection hubs can be related to the gambling services DICEonCRACK (0.301) and BitMillions.com (0.339) and the web wallet service Instawallet (0.163).
The visualization of closeness centrality (Figure 41) shows the most central nodes in the subgraph from where Bitcoins are transacted efficiently. One can see that a large portion of the nodes related to the wallet business Strongcoin have the highest closeness centrality. The well-known media/news site WikiLeaks, the vendor Silkroad, and the donation service Bitcoin Foundation are also very central in the network.
The final visualization in Figure 42 shows the Bitcoin network with geo-located nodes. Nodes are colored by country (and edges by the source node). For this analysis, only nodes that transact via one IP address can be considered; thus, this subgraph (tagged as Business, excluding SatoshiDICE, Mt.Gox, and Deepbit) of the Bitcoin network is smaller than in the previous analyses. Through the usage of web wallets and other central services a node might have several IP addresses and subsequently different geo-locations. In contrast, many different nodes can transact Bitcoins via one IP address, because of regional concentrations of Bitcoin users.

7. Conclusion, Limitations and Outlook

This explorative research examined the Bitcoin economy and network by introducing an enriched data. The data model incorporates the Bitcoin user network introduced by Reid and Harrigan [2] and scraped information from several websites to construct new aggregates on the business and geographical level. This information contains business tags, IP addresses, and geo-locations that could also be associated to Bitcoin users. Furthermore, trade data on the BTC/USD exchange rate and data on anonymous services such as Tor were extracted.
To conduct analysis on the business aggregation level the tags related to a transaction were categorized into 13 categories. Over 54% of all transactions could be classified. The first analysis on business categories reveals that around 48% of all transactions are related to gambling services and almost 46% are associated to the dice game SatoshiDICE. The second and third largest business according to the number of transactions is the mining pool Deepbit with 4.3% and the exchange platform Mt.Gox with 1.7%, respectively. When analyzing the number of transactions and the transaction volume for particular businesses, a different transaction pattern was found among the categories. Businesses such as exchanges, vendors, or wallets transact rather large amounts of Bitcoins, while businesses such as gambling or donation transact very small amounts of Bitcoins in the network. This was expressed by the T/V ratio (transaction to value ratio). For instance, the T/V ratio for gambling is 25 and that of the vendor business is 0.1. Further analysis on the transaction value distribution reveals that 63% of all transactions are in the range from 0.00000001 until 1.0 BTC and the gambling businesses incorporate most of them but with a decreasing trend in higher value regions. In the ranges above 100 BTC, most transactions are related to the exchange business. The development of the business categories over time shows that Bitcoin Talk users and the donation services were among the most active participants because of their importance during the startup phase of Bitcoin. Later on, web wallets, media and news, and exchange platforms enter the Bitcoin economy. With the introduction of gambling services the number of transactions gets inflated, especially by the most popular SatoshiDICE game. The differences between the number of transactions and the transaction volume for particular categories could be also observed over time.
The analysis on the geographic aggregation level was not done before on this scale and requires the exclusion of IP addresses that could be associated to Tor, Proxy or VPN services (~1.6% of transactions). When analyzing the Bitcoin economy geographically, one can see that the major markets are in the U.S. and Germany. The geographic distribution of the transaction volume reveals that Bitcoins are mainly used in countries with a good infrastructure during the analyzed time interval.
With the linkage of geo-locations to transactions with business tags, an innovative analysis of the distributions of businesses per country could be conducted. Northern European countries like Germany, Sweden, Russia, or France have a similar business distribution with a strong focus on mining with around 56%. In contrast, the U.S., Canada, and Brazil, which share a common business distribution with a focus on the gambling business with around 65%. A special case could be seen for the Chinese Bitcoin market, where 87% of transaction volume is linked to the gambling business. Another finding is that countries such as Spain, U.S., Canada, and Argentina were more engaged in the exchange business with around 10%, indicating a higher speculative behavior. In the cases of Spain and Argentina this could be related to economic and financial distress, and the searching for new save havens, while in the U.S. and Canada users are more market oriented and seeking for high abnormal returns through speculation on the Bitcoin exchange rate.
Investigation of the degree distribution and power law over time reveals that the Bitcoin network follows a power law distribution over large parts of the value range. Since 2010, the Bitcoin network can be considered as a scale-free network with a power law slope coefficient α in the range between 2.0 and 2.6 in the time horizon from 2010 to 2013. The degree distributions for particular businesses show strong heavy tails for the gambling, mining, and exchange business. These business categories are mainly driven by one business with an abnormal high degree. The power law slope coefficient α for all business categories (except the wallets business) is in the range between two and three, indicating a scale-free network. On the country level, the degree distributions show a similar result. All considered countries have a power law slope coefficient α between two and three, indicating the existence of a scale-free network. The analysis reveals that the majority of the investigated subgraphs of the Bitcoin network are scale-free networks.
To identify major hubs in the Bitcoin network, the degree centrality was analyzed. The results on the entire Bitcoin network in the most active time from September 2012 to April 2013 reveal that the major hub nodes are controlled by the exchange platform Mt.Gox, the gambling service SatoshiDICE, and the web wallet service Instawallet. Next, the degree centrality was analyzed on the business aggregates. The results show that the dominant services in a business category are also the major hubs in the network. This is especially the case for SatoshiDICE in the gambling business, Mt.Gox in the exchange business, Deepbit in the mining business, and Instawallet in the wallet business category.
The analysis of the average clustering coefficient indicates the existence of the small world phenomenon in the Bitcoin network over time as well as on the country and business aggregation level. This kind of analysis needs high computation power and was therefore tested on minor subgraphs on the business and country aggregation level. The existence of the small world phenomenon could be demonstrated for the country aggregations China, Brazil, Italy, and Argentina. For the business aggregations, the wallet and vendor businesses were investigated. Only the wallet business could be considered as small world network. The vendor business missed the requirements. This shows that a rather high clustering coefficient is just a first indicator and needs further investigation.
Further network statistics could be applied on a representative subgraph of the Bitcoin economy to identify clusters, hubs, brokers, and most central nodes in the network. Furthermore, particular Bitcoin nodes and their interaction in the network could be identified and a geographic visualization of the subgraph was realized. This gives new insights on the Bitcoin economy in a visual way.
Several interesting aspects of the Bitcoin economy could be covered in this work, but there are some limitations that could be addressed in future research. Extensions of this work should contain most recent data of the Bitcoin network to get insight on new developments in the economy, such as the attack on Mt.Gox with the subsequent closing of the exchange platform, or the closing of the vendor Silkroad. Furthermore, the intense fluctuations of the BTC/USD exchange rate in late 2013, resulting in a record high over $1,200 per Bitcoin, could be investigated. Another method would be time series analysis on economic distressed countries such as Spain, Cyprus, or Argentina and investigations on how the Bitcoin economy evolved during this time. One could also analyze the economic development in certain countries with appropriate economic measures and regress it against Bitcoin variables. Although events that explain the movements have been presented in this work, one could link these to network analysis and also visually investigate the Bitcoin transaction flows.
Even though 54% of all transactions could be related to a business tag and category, only 1.5% of them are not associated to the major businesses SatoshiDICE, Mt.Gox, or Deepbit. Re-identification techniques introduced by Meiklejohn et al. [8] could be applied in addition to the Blockchain.info web scraper to link further businesses to transactions, especially for high volume transactions. With their approach and modified clustering algorithms Meiklejohn et al. could tag around 2200 out of 3.38 million user nodes in the network. The more conservative and reliable clustering algorithm applied in this study is based on the research by Reid and Harrigan [2] and resulted in around 6.3 million user nodes.
With sufficient computation power, future research could have a stronger focus on the network analysis of the Bitcoin economy. Then, complex network measures such as betweenness and closeness centrality, the average shortest path length, average clustering, and simulation of random networks can be applied on a much larger scale. Hence, the small world phenomenon could be investigated on large subgraphs or even on the entire Bitcoin network. Furthermore, the visualization of the Bitcoin economy could be extended on time, country, and business aggregation levels. Overall, our methods and data provide a starting point into a variety of fields for further research on Bitcoin.

Acknowledgments

The authors would like to thank Annika Baumann for helpful discussions during early stages of this research.

Author Contributions

Matthias Lischke and Benjamin Fabian jointly designed the research concept. Matthias Lischke gathered the data and conducted the analyses. Both authors jointly wrote the paper.

Conflicts of Interest

The authors declare no conflict of interest.

References

  1. Nakamoto, S. Bitcoin: A Peer-to-Peer Electronic Cash System. 2008. Available online: http://bitcoin.org/bitcoin.pdf (accessed on 1 March 2016).
  2. Reid, F.; Harrigan, M. An Analysis of Anonymity in the Bitcoin System. In Security and Privacy in Social Networks; Springer: New York, NY, USA, 2012; pp. 197–223. [Google Scholar]
  3. The Economist: Bitcoins. Available online: http://www.economist.com/topics/bitcoins (accessed on 1 March 2016).
  4. Baumann, A.; Fabian, B.; Lischke, M. Exploring the Bitcoin Network. In Proceedings of the 10th International Conference on Web Information Systems and Technologies (WEBIST); WEBIST: Barcelona, Spain, 2014. [Google Scholar]
  5. Drainville, D. An Analysis of the Bitcoin Electronic Cash System. 2012. Available online: http://cryptolibrary.org/handle/21/601 (accessed on 1 March 2016).
  6. Ober, M.; Katzenbeisser, S.; Hamacher, K. Structure and Anonymity of the Bitcoin Transaction Graph. Future Internet 2013, 5, 237–250. [Google Scholar] [CrossRef]
  7. Bitcoinmining: Bitcoin Mining Pools. Available online: https://www.bitcoinmining.com/bitcoin-mining-pools/ (accessed on 1 March 2016).
  8. Meiklejohn, S.; Pomarole, M.; Jordan, G.; Levchenko, K.; McCoy, D.; Voelker, G.M.; Savage, S. A Fistful of Bitcoins: Characterizing Payments Among Men with No Names. In Proceedings of the 2013 Internet Measurement Conference; ACM: New York, NY, USA, 2013; pp. 127–140. [Google Scholar]
  9. Spagnuolo, M. BitIodine: Extracting Intelligence from the Bitcoin Network. Thesis, Politecnico di Milano, 2013. Available online: http://miki.it/pdf/thesis.pdf (accessed on 1 March 2016). [Google Scholar]
  10. Androulaki, E.; Karame, G.O.; Roeschlin, M.; Scherer, T.; Capkun, S. Evaluating User Privacy in Bitcoin. In Financial Cryptography and Data Security; Lecture Notes in Computer Science; Springer: Berlin, Geramny; Heidelberg Germany, 2013; Volume 7859, pp. 34–51. [Google Scholar]
  11. Kaminsky, D. Black Ops of TCP/IP, Presentation, Black Hat & Chaos Communication Camp 2011. Available online: http://de.slideshare.net/dakami/black-ops-of-tcpip-2011-black-hat-usa-2011 (accessed on 1 March 2016).
  12. Ortega, M. The Bitcoin Transaction Graph Anonymity. Master Thesis, Universitat Oberta de Catalunya, 2013. Available online: http://openaccess.uoc.edu/webapps/o2/bitstream/10609/23562/9/msantamariaoTFM0613memoria.pdf (accessed on 1 March 2016). [Google Scholar]
  13. Python. Available online: http://www.python.org/ (accessed on 1 March 2016).
  14. BTC-Network Data Scraper. Available online: https://github.com/ivan-brugere/Bitcoin-Transaction-Network-Extraction (accessed on 1 March 2016).
  15. Bitcoin Client v0.5.3.1. Available online: https://bitcoin.org/en/release/v0.5.3.1 (accessed on 1 March 2016).
  16. Brugere, I. Bitcoin Transaction Network Dataset. Data Set 2013. Available online: http://compbio.cs.uic.edu/data/bitcoin/ (accessed on 1 March 2016).
  17. Eclipse SDK Workbench. Available online: http://www.eclipse.org/downloads/ (accessed on 1 March 2016).
  18. NetworkX. Available online: http://networkx.github.io/ (accessed on 1 March 2016).
  19. MatPlotLib. Available online: http://matplotlib.org/ (accessed on 1 March 2016).
  20. PyGraphviz. Available online: http://networkx.lanl.gov/pygraphviz/index.html (accessed on 1 March 2016).
  21. Gephi. Available online: https://gephi.org/ (accessed on 1 March 2016).
  22. Cran-R. Available online: http://www.r-project.org/ (accessed on 1 March 2016).
  23. Cran-R Spatial Data Package. Available online: http://cran.r-project.org/web/packages/sp/index.html (accessed on 1 March 2016).
  24. Cran-R Maptools Package. Available online: http://cran.r-project.org/web/packages/maptools/index.html (accessed on 1 March 2016).
  25. Cran-R RColorBrewer Package. Available online: http://cran.r-project.org/web/packages/RColorBrewer/index.html (accessed on 1 March 2016).
  26. Gross, J.; Yellen, J. Handbook of Graph Theory; CRC Press LLC: Boca Raton, FL, USA, 2004. [Google Scholar]
  27. Nykamp, D.Q. The Degree Distribution of a Network. 2013. Available online: http://mathinsight.org/degree_distribution (accessed on 1 March 2016).
  28. Albert, R.; Barabasi, A.-L. Statistical Mechanics of Complex Networks. Rev. Mod. Phys. 2002, 74, 47. [Google Scholar] [CrossRef]
  29. Clegg, R. Power Laws in Networks, Lecture, University of York, 2006. Available online: http://www.richardclegg.org/networks2/SpecialLecture_06.pdf (accessed on 1 March 2016).
  30. Newman, M.E.J. The Structure and Function of Complex Networks. SIAM Rev. 2006, 45, 167–256. [Google Scholar] [CrossRef]
  31. Newman, M.E.J. Power Laws, Pareto Distributions, Zipf’s Law. Contemp. Phys. 2005, 46, 323–351. [Google Scholar] [CrossRef]
  32. Barabasi, A.-L.; Albert, R.; Jeong, H. Scale-free Characteristics of Random Networks: The Topology of the World-Wide Web. Phys. A 2000, 281, 2069–2077. [Google Scholar]
  33. Inaoka, H.; Ninomiya, T.; Taniguchi, K.; Shimizu, T.; Takayasu, H. Fractal Network Derived from Banking Transaction—An Analysis of Network Structures Formed by Financial Institutions. 2004. Available online: https://www.boj.or.jp/en/research/wps_rev/wps_2004/data/wp04e04.pdf (accessed on 1 March 2016).
  34. Saramäki, J.; Kivela, M.; Onnela, J.-P.; Kaski, K.; Kertesz, J. Generalizations of the Clustering Coefficient to Weighted Complex Networks. Phys. Rev. E 2007, 75, 027105. [Google Scholar] [CrossRef] [PubMed]
  35. Watts, D.; Strogatz, S. Collective Dynamics of Small-World Networks. Nature 1998, 393, 440–442. [Google Scholar] [CrossRef] [PubMed]
  36. Mao, G.; Zhang, N. Analysis of Average Shortest-Path Length of Scale-Free Network. J. Appl. Math. 2013. [Google Scholar] [CrossRef]
  37. Freeman, L. Centrality in Social Networks Conceptual Clarification. Soc. Netw. 1979, 1, 215–239. Available online: http://leonidzhukov.ru/hse/2013/socialnetworks/papers/freeman79-centrality.pdf (accessed on 1 March 2016). [Google Scholar] [CrossRef]
  38. Bonacich, P. Power and Centrality: A Family of Measures. Am. J. Sociol. 1987, 92, 1170–1182. [Google Scholar] [CrossRef]
  39. Borgatti, S. Centrality and Network Flow. Soc. Netw. 2005, 27, 55–71. [Google Scholar] [CrossRef]
  40. Yan, E.; Ding, Y. Applying Centrality Measures to Impact Analysis: A Coauthorship Network Analysis. 2010. Available online: http://arxiv.org/pdf/1012.4862.pdf (accessed on 1 March 2016).
  41. Newman, M.E.J. A measure of betweenness centrality based on random walks. Soc. Netw. 2005, 27, 39–54. Available online: http://arxiv.org/pdf/cond-mat/0309045.pdf (accessed on 1 March 2016). [Google Scholar] [CrossRef]
  42. Brugere, I. Bitcoin tools. Available online: https://github.com/ivan-brugere/Bitcoin-Transaction-Network-Extraction (accessed on 1 March 2016).
  43. Blockchain.info. Blockchain Data API. Available online: https://blockchain.info/de/api/blockchain_api (accessed on 1 March 2016).
  44. Bitcoin Charts. Historical Trade Data. Available online: http://bitcoincharts.com/charts/mtgoxUSD#igDailyzczsg2010-07-17zeg2013-12-23ztgSzm1g10zm2g25zv (accessed on 1 March 2016).
  45. Bitcoin Talk Forum. Available online: https://bitcointalk.org/ (accessed on 1 March 2016).
  46. Alstott, J. Powerlaw: A Python Package for Analysis of Heavy-Tailed Distributions. 2014. Available online: http://arxiv.org/pdf/1305.0215v3.pdf (accessed on 1 March 2016).
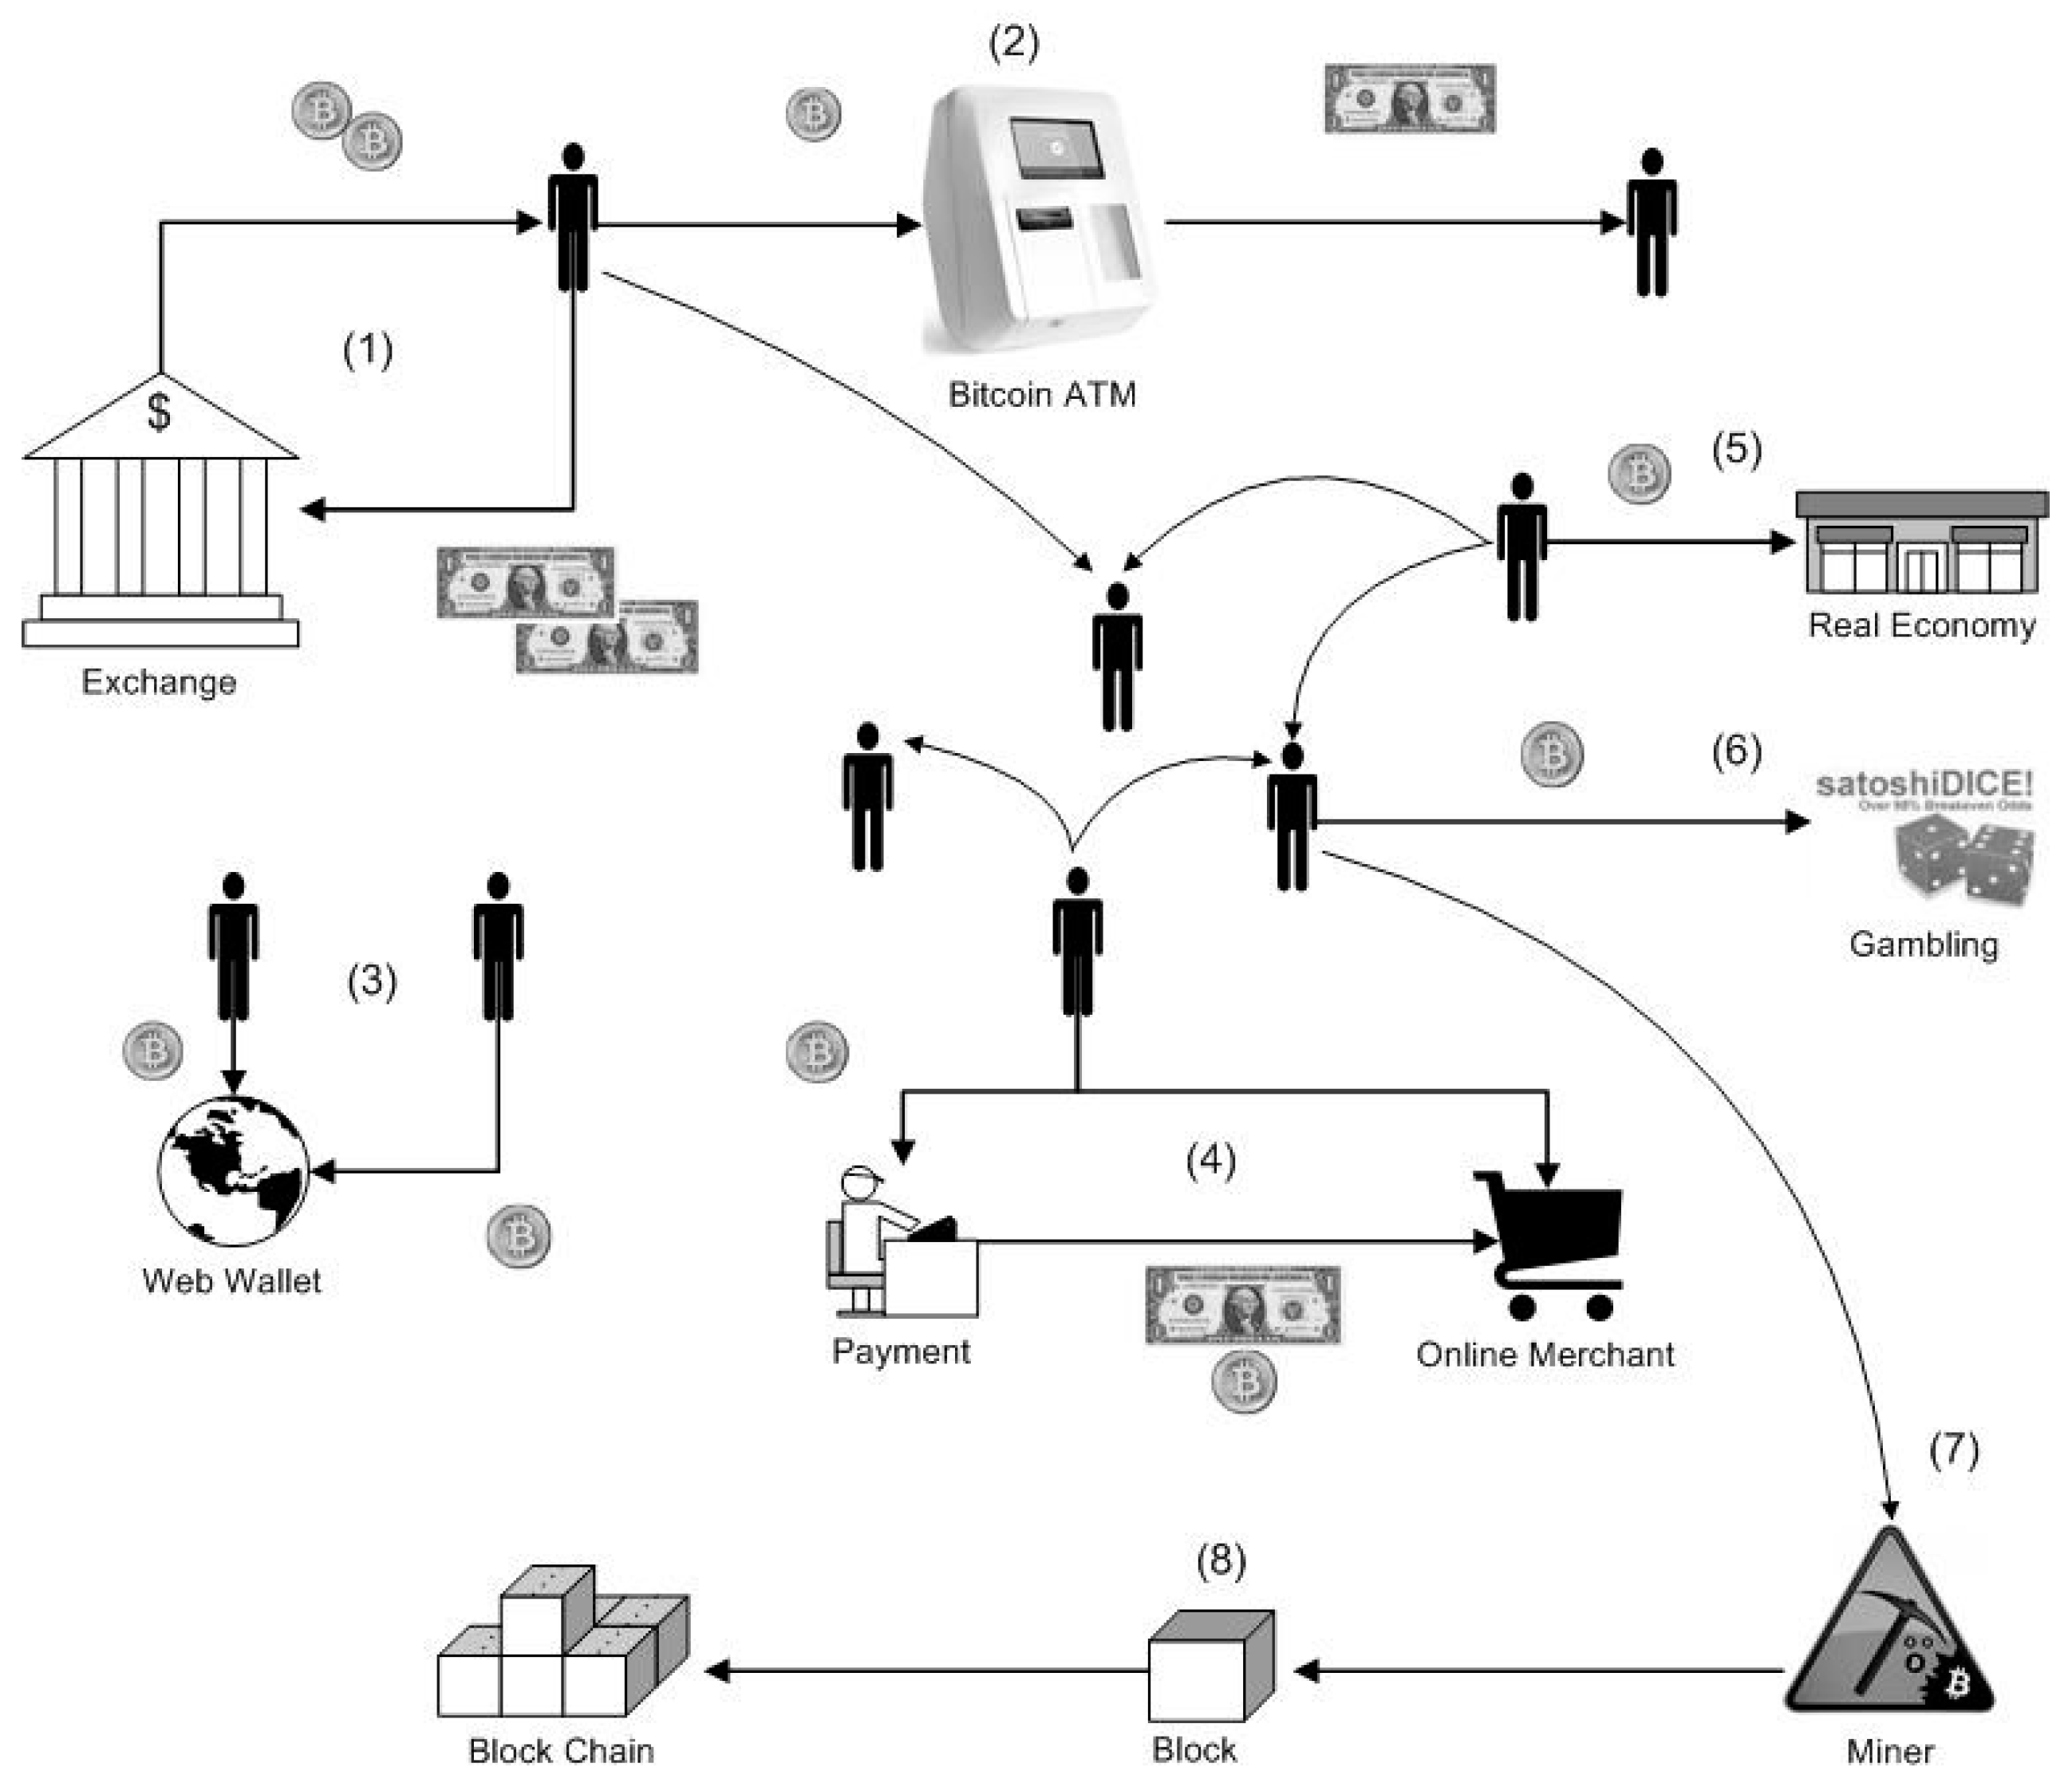
Figure 1. The Bitcoin Economy.
Futureinternet 08 00007 g001
Figure 2. Data Flow Process.
Futureinternet 08 00007 g002
Figure 3. Forming the User Network.
Futureinternet 08 00007 g003
Figure 4. Bitcoin Entity Network.
Futureinternet 08 00007 g004
Figure 5. Final Data Model.
Futureinternet 08 00007 g005
Figure 6. User Activity and Trade behavior.
Futureinternet 08 00007 g006
Figure 7. Top 25 Businesses (# Transactions).
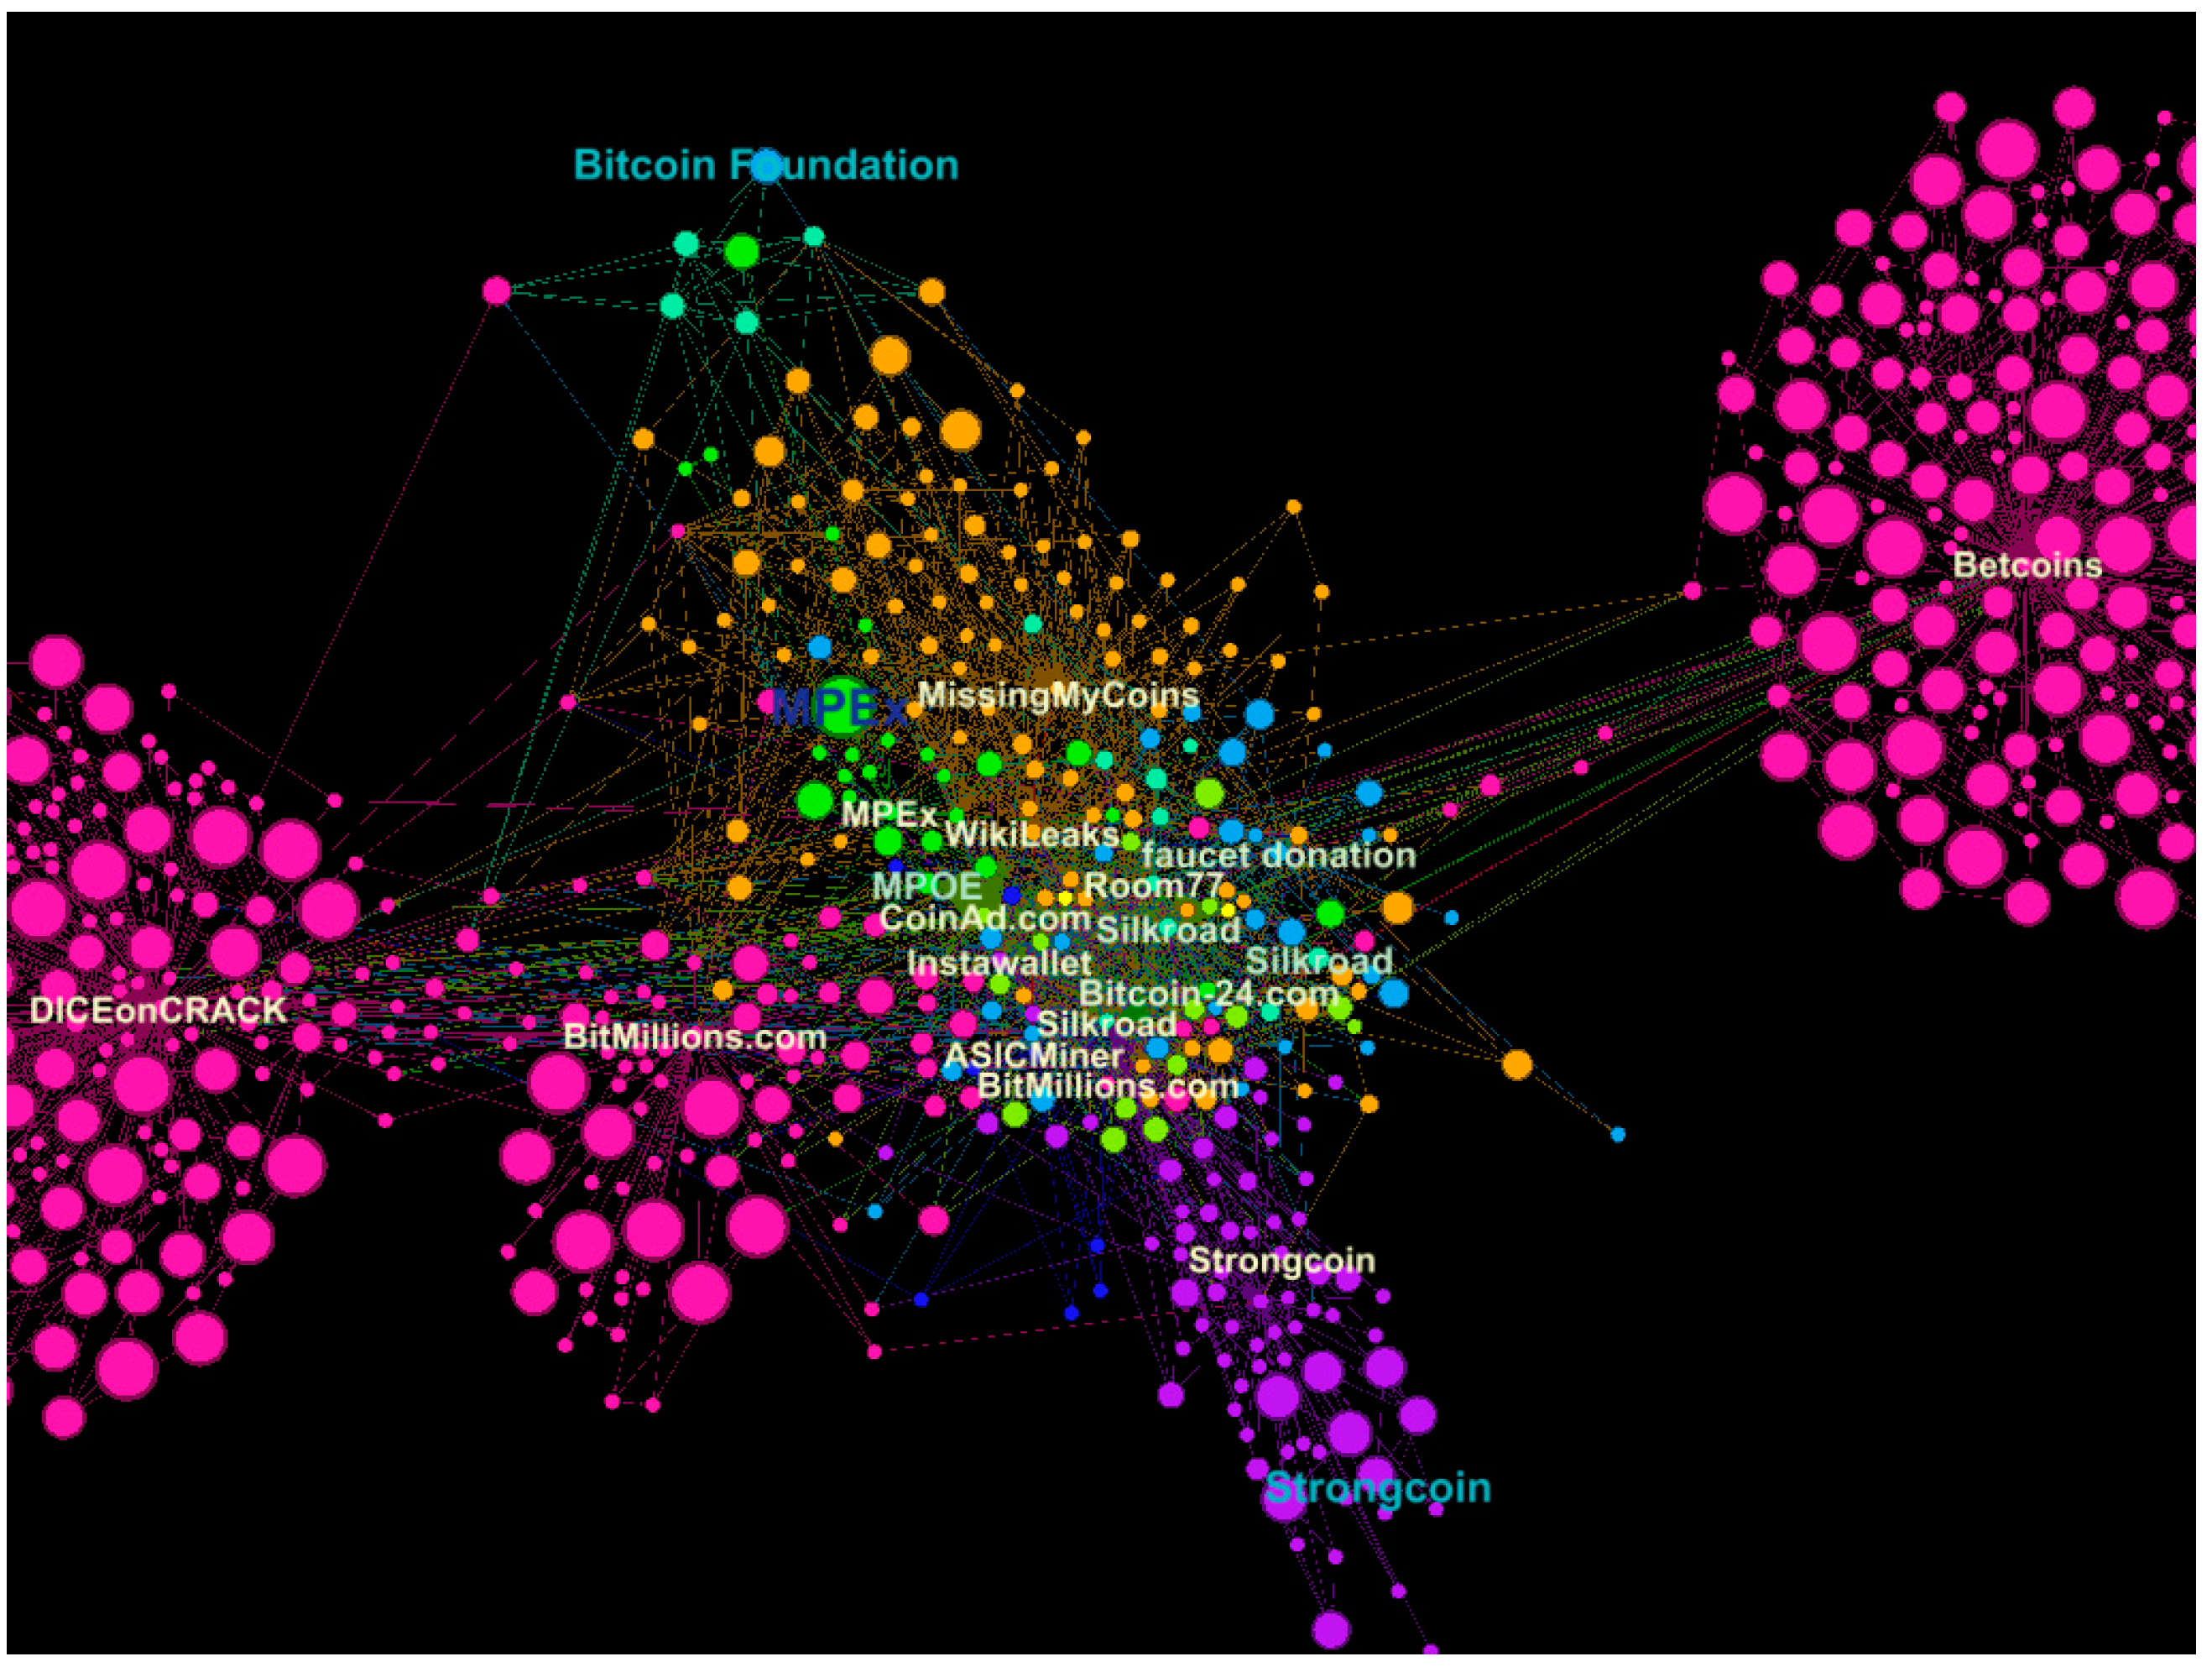
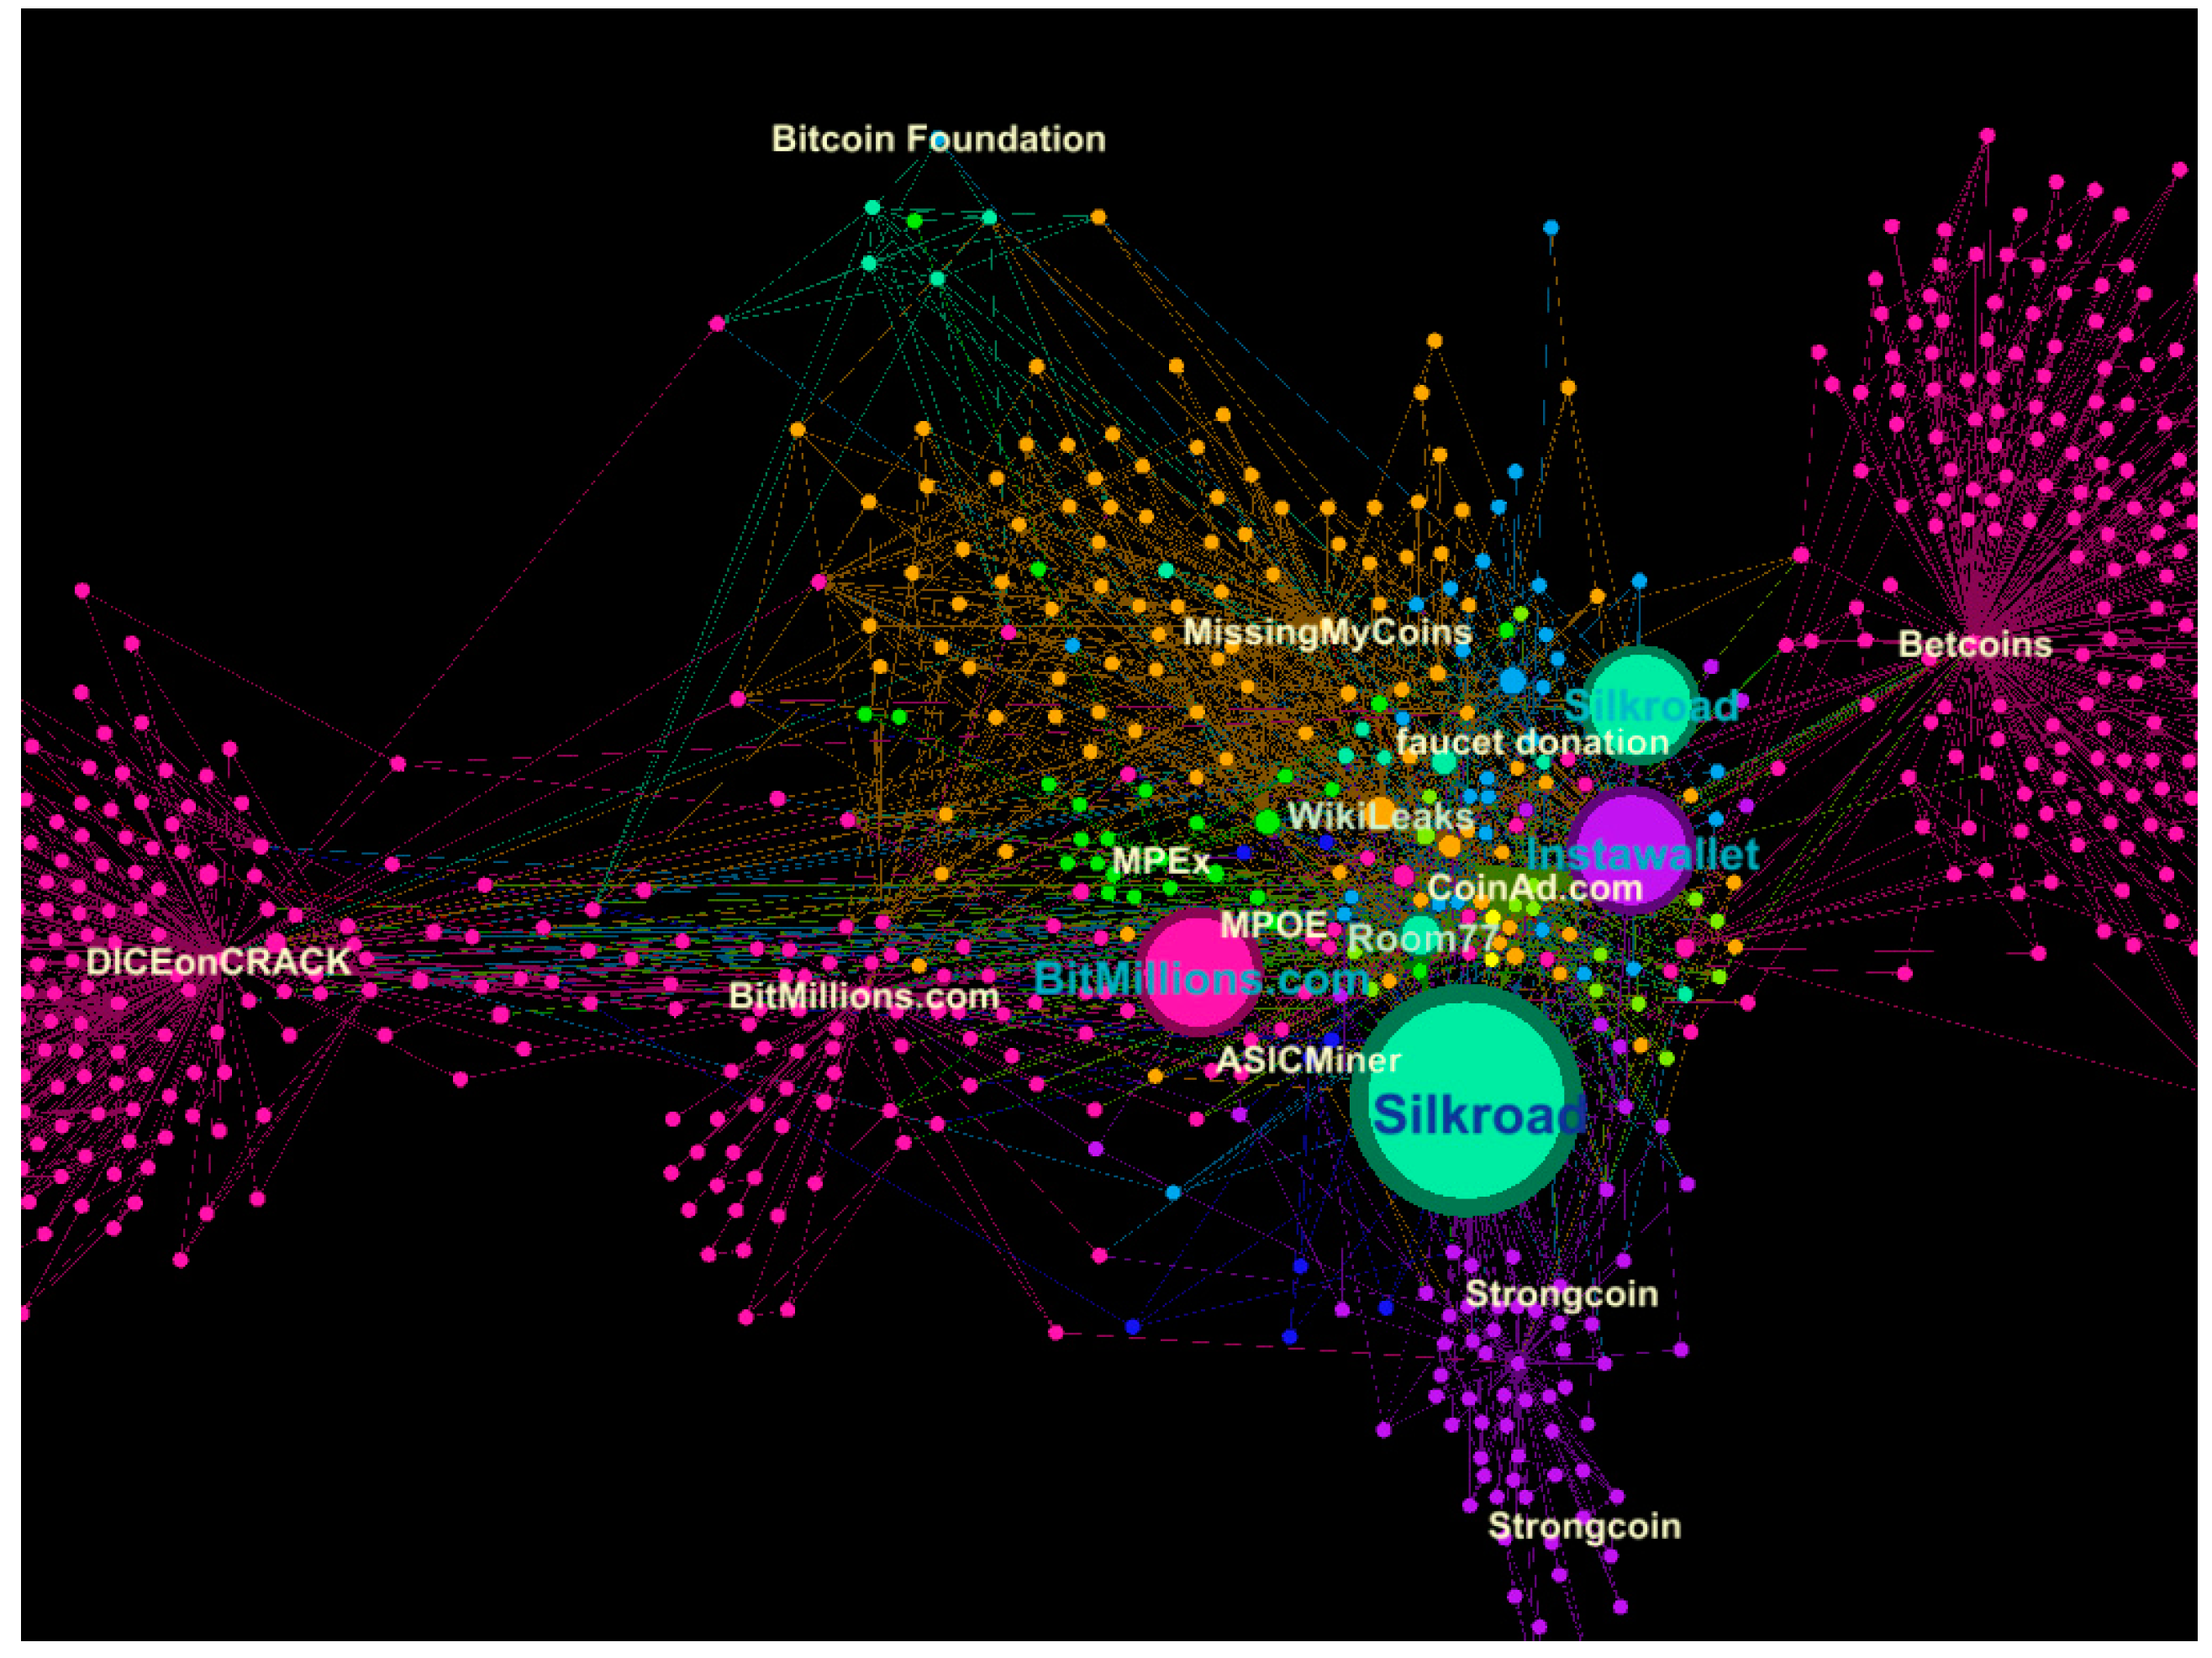
Futureinternet 08 00007 g007
Figure 8. Top 25 Businesses (Value in BTC).
Futureinternet 08 00007 g008
Figure 9. Transaction/Value Ratio.
Futureinternet 08 00007 g009
Figure 10. Composite of Businesses over Time (in Terms of Number of Transactions, #TXs).
Futureinternet 08 00007 g010
Figure 11. Composite of Businesses over Time (Value in BTC).
Futureinternet 08 00007 g011
Figure 12. Number of Transactions and Value in BTC per Country.
Futureinternet 08 00007 g012
Figure 13. Global Distribution of Geo-located Internet Protocol (IP) Nodes.
Futureinternet 08 00007 g013
Figure 14. Transaction Volume in BTC (in Thousands) per Country.
Futureinternet 08 00007 g014
Figure 15. Geographic Network Emergence over Time for Particular Countries.
Futureinternet 08 00007 g015
Figure 16. Composite of Developed Countries over Time (Value in BTC).
Futureinternet 08 00007 g016
Figure 17. Composite of Emerging Countries over Time (Value in BTC).
Futureinternet 08 00007 g017
Figure 18. Transaction Volume in BTC per Business Category in Developed Countries.
Futureinternet 08 00007 g018
Figure 19. Transaction Volume in BTC per Business Category in Emerging Countries.
Futureinternet 08 00007 g019
Figure 20. Transaction Volume in BTC and Business Distribution for Top 30 Regions.
Futureinternet 08 00007 g020
Figure 21. Degree Distribution (probability density function (PDF), complementary cumulative distribution function (CCDF)) over Time.
Futureinternet 08 00007 g021
Figure 22. Development of Power Law Fit α over Time.
Futureinternet 08 00007 g022
Figure 23. Degree Distribution (PDF, CCDF) for different Business Categories.
Futureinternet 08 00007 g023
Figure 24. Power Law Fit α for Business Categories.
Futureinternet 08 00007 g024
Figure 25. Degree Distribution (PDF, CCDF) for different Countries.
Futureinternet 08 00007 g025
Figure 26. Power Law Fit α for Countries.
Futureinternet 08 00007 g026
Figure 27. Degree Centrality in the Bitcoin Network (September 2012–April 2013).
Futureinternet 08 00007 g027
Figure 28. Degree Centrality per Business Category.
Futureinternet 08 00007 g028
Figure 29. Degree Centrality per Country.
Futureinternet 08 00007 g029
Figure 30. Degree Centrality for Business (Excluding the Top 3).
Futureinternet 08 00007 g030
Figure 31. Betweenness and Closeness Centrality for the Vendors Business.
Futureinternet 08 00007 g031
Figure 32. Betweenness and Closeness Centrality for the Wallets Business.
Futureinternet 08 00007 g032
Figure 33. Average Clustering Coefficient over Time.
Futureinternet 08 00007 g033
Figure 34. Average Clustering Coefficient for Business Categories.
Futureinternet 08 00007 g034
Figure 35. Average Clustering Coefficient per Country.
Futureinternet 08 00007 g035
Figure 36. Visualization of Degree Centrality for Important Subgraph.
Futureinternet 08 00007 g036
Figure 37. Visualization of the Clustering Coefficient in the Bitcoin Network.
Futureinternet 08 00007 g037
Figure 38. Visualization of the Transaction Value in the Bitcoin Network.
Futureinternet 08 00007 g038
Figure 39. Visualization of Node Size (Number of Public Keys) in the Bitcoin Network.
Futureinternet 08 00007 g039
Figure 40. Betweenness Centrality in the Bitcoin Network.
Futureinternet 08 00007 g040
Figure 41. Closeness Centrality in the Bitcoin Network.
Futureinternet 08 00007 g041
Figure 42. Bitcoin Network and Earth Geography
Futureinternet 08 00007 g042
Table 1. Descriptive Statistics of the Bitcoin Network (on daily bases).
MedianMeanSdSkewMinMaxCorrel [EXRate]
Transaction Value [BTC]173,457910,0532,231,64775029,958,7140.199
Number of Users1637404952432136,1200.730
Number of Transactions367824,08438,30321189,2840.680
Dataset: 03.01.2009–10.04.2013; Transactions (Relations): 37,450,461; Economic Entities (Nodes): 6,336,769.
Table 2. Correlation Matrix (User Activity and Trade Behavior).
Trade MeasureUser Activity (Rolling Windows)
1 Day10 Days30 Days100 Days
BTC/USD0.7180.6870.6390.604
Volume0.2920.2670.2520.241
Table 3. Business Tags.
Category ContentExamples# Transactionsin %
GamblingDice & Casino GamesSatoshiDice, Betcoins7,615,05147.90%
MiningMining Pools & ServicesDeepbit, ASICMiner689,2314.34%
ExchangesExchange PlatformsMt.Gox, Bitcoin-24293,9691.85%
WalletsWeb Wallets and ClientsInstawallet, Strongcoin17,7480.11%
ITProgramming & Hardware ServicesFree Software Foundation45150.03%
Media NewsBlogs, Media Channels, NewsWikileaks, Archive.org75630.05%
VendorsSelling GoodsRoom77, Silk Road22330.01%
DonationCharity & other DonationsFaucet Donation30,6120.19%
Bitcoin ServicesSites offering Information & ServicesBlockexplorer, Bitcoinmonitor14200.01%
Bitcoin OTCOver the Counter (OTC) TraderDPP_, Eleuthria50540.03%
Bitcoin TalkBitcoin Forum UsersQuip, Nikkos35340.02%
Misc.Free BTC Sites & AdvertisingCoinAd, Hashluck41230.03%
UnknownNot Classified Transactionsn.a.7,223,57245.44%
Total--15,898,625100%
Table 4. Transaction Value Distribution.
Transaction Value [BTC]#TXs%Top 3 Business Categories
LowHigh1st2nd3rdn.a.
0.000000010.000012,546,6576.8Gambling60.0%Media News3.3%Misc.3.2%33.5%
0.000010.00503,547,9949.5Gambling43.5%Misc.5.7%Media News2.9%47.9%
0.00500.01001,056,9992.8Gambling77.4%Exchanges0.7%Misc.0.3%21.6%
0.01000.01102,187,1155.8Gambling57.0%Mining4.0%Exchanges1.2%37.8%
0.01100.01991,928,6545.1Gambling62.2%Mining0.8%Donation0.6%36.5%
0.01990.05053,133,7788.4Gambling62.5%Mining3.4%Exchanges0.8%33.3%
0.05050.10012,387,5486.4Gambling59.2%Mining3.8%Exchanges0.8%36.2%
0.10011.00007,160,73719.1Gambling55.7%Mining4.4%Exchanges1.4%38.5%
1.00002.00082,645,8397.1Gambling34.7%Mining5.9%Exchanges1.6%57.9%
2.000810.0003,632,0139.7Gambling30.4%Mining5.1%Exchanges2.3%62.2%
10.0050.5903,759,22310.0Gambling12.7%Mining9.8%Exchanges2.8%74.6%
50.59100.09703,9601.9Mining11.2%Gambling6.1%Exchanges5.6%77.1%
100.09499.06622,3391.7Exchanges7.0%Gambling5.3%Mining4.7%83.0%
499.061,000.0197,2540.5Exchanges2.8%Gambling1.3%Mining0.3%95.6%
1,000.010,009134,7830.4Exchanges1.2%Gambling0.5%Vendors0.1%98.1%
10,009100,00020,3530.1Exchanges0.3%Vendors0.05%Wallets0.04%99.7%
100,000500,0002060.001Exchanges36.4%Vendors1.9%--61.7%
Table 5. Results of Investigating the Small World Phenomenon on Subgraphs.
AggregatesBitcoin GraphRandom Graph
AVG ClusteringAVG Shortest PathAVG ClusteringAVG Shortest Path
Country
China0.1305.150.000714.45
Brasil0.0534.740.001154.45
Italy0.0784.390.000914.23
Argentina0.0784.780.001904.25
Business
Wallets0.0853.900.004023.10
Vendors0.0483.320.0621.95