Article

Enhanced Local Fisher Discriminant Analysis for Indoor Positioning in Wireless Local Area Network

School of Information Science and Technology, Dalian Maritime University, Dalian 116026, China
*
Author to whom correspondence should be addressed.
Future Internet 2016, 8(2), 8; https://doi.org/10.3390/fi8020008
Submission received: 24 December 2015 / Revised: 19 February 2016 / Accepted: 14 March 2016 / Published: 25 March 2016
(This article belongs to the Special Issue Future Mobile Computing)

Abstract

:
Feature extraction methods have been used to extract location features for indoor positioning in wireless local area networks. However, existing methods, such as linear discriminant analysis and principal component analysis, all suffer from the multimodal property of signal distribution. This paper proposes a novel method, based on enhanced local fisher discriminant analysis (LFDA). First, LFDA is proposed to extract discriminative location features. It maximizes between-class separability while preserving within-class local structure of signal space, thereby guaranteeing maximal discriminative information involved in positioning. Then, the generalization ability of LFDA is further enhanced using signal perturbation, which generates more number of representative training samples. Experimental results in realistic indoor environment show that, compared with previous feature extraction methods, the proposed method reduces the mean and standard deviation of positing error by 23.9% and 33.0%, respectively.

1. Introduction

Due to the pervasively availabilities of wireless local area network (WLAN) infrastructures and mobile devices, the WLAN indoor positioning technique has been attracting extensive attention from both academics and industries. WLAN positioning [1] relies on the distinct received signal strength (RSS) patterns among different physical locations. Since RSS values from multiple access points (AP) can be collected by wireless cards available on most mobile devices, no additional hardware is required, except for existing WLAN infrastructures. The accurate indoor location estimation enables substantial location-based services (LBS), including object navigation and finding, public security, and event detection [2,3]. Currently, fingerprinting is the most popular WLAN positioning approach [4,5,6,7]. This approach collects RSS values at reference points to generate a database called radiomap in the offline phase. Then, in the online phase, it compares real-time collected RSS values with the radiomap by pattern matching algorithms, such as weighted K-nearest neighbor (WKNN) [8,9], maximum likelihood estimation (MLE) [10], and artificial neural network (ANN) [11].
To preserve the user’s privacy, though more device resources, such as device battery, are consumed, most users tend to implement the location estimation on their devices, rather than on a server. Moreover, due to various wireless indoor propagation factors [12,13], such as multipath effect, interference, and none-line-of-sight propagation, RSS signals show highly uncertainty and multimodality. Thus, it is a difficult task to achieve high positioning accuracy while reduce the computation cost on resource limited devices. A direct and efficient way to improve positioning accuracy is to deploy as many APs as possible, because each AP may provide a different view to distinguish different physical locations. In many public indoor environments, such as shopping mall, museum and hospital, there may be a lot of APs available. Though a large number of APs introduced is beneficial to positioning accuracy, directly taking RSS vectors as input features may incur “curse of dimensionality” problem. Particularly, substantial redundancy among APs with correlated location information may incur the overfitting problem, and increases the computation cost greatly. In addition, significant signal noise contained in some APs may be introduced as well and they decreases the accuracy.
To solve the “curse of dimensionality” problem, existing methods can be generally categorized into two classes: AP selection [14] and feature extraction [15]. In the former, several criterions, including Fisher criterion [16] and mutual information gain criterion [17], have been proposed to select the most important APs. In the latter, rather than discard some APs, some feature extraction methods have been proposed to project the original RSS signals into a feature space based on different criterions. Considering the substantial redundancy among correlated APs, principal component analysis (PCA) [18,19] is firstly deployed to obtain more compact location features in a decorrelated space. Then, in order to extract more discriminative features for indoor positioning, linear discriminant analysis (LDA) [20,21] is proposed to extract the separate location features. Recently, kernel canonical correlation analysis (KCCA) [22] and kernel direct discriminant analysis (KDDA) [23] have been proposed to extract the location features in a kernel induced feature space. Though adapting the nonlinearity of RSS signals, KCCA and KDDA are both kernel-based methods and incur high computation cost. More importantly, existing methods all ignore the multimodality [24,25] of RSS distributions, and thus the degraded positioning accuracy is obtained.
This paper proposes a novel positioning method based on enhanced local fisher discriminant analysis (E-LFDA). First, LFDA [26], a localized variant of the LDA method, is proposed to maximally extract discriminative location information. In contrast to LDA, LFDA further preserves the within-class local structure of signal space and thus obtaining more separate location features. Second, a perturbation method is proposed to further enhance the performance of LFDA. Generally, the number of training samples is always limited, since RSS samples collection is a time-consuming work. Through perturbation method, more number of representative samples is generated and thus improving the generalization ability of LFDA. Our experiments in realistic indoor environment demonstrate that, the proposed E-LFDA method achieves significant accuracy improvement than classical feature extraction methods including LDA and PCA.

2. Proposed E-LFDA Method for WLAN Indoor Positioning

2.1. Motivation

Fingerprinting positioning can be considered as a multiclass classification problem. Each reference point can be labeled as one class by related RSS samples. The whole process of location estimation can be regarded as classifying the real-time RSS samples into the right classes. Therefore, compared with PCA, LDA performs better, since more discriminative features can be extracted. LDA maximizes the between-class distance while constraining the within-class distance into a certain extent. When RSS distributions are Gaussian or semi-Gaussian, LDA performs well [27]. However, in a realistic wireless propagation environment, non-Gaussian and multimodal distributions can be always observed. For example, due to the antenna diversity [28] or multipath effect, RSS distribution from one AP at a fixed location may show more than one peak or cluster, as seen in Figure 1. For multimodal RSS samples at some reference point, LDA may merge the multimodal data into a single cluster by constraining the within-class distance into a small value. This rigorous constraint may decrease the degree of freedom left for increasing feature separability, and, thus, degrade the classification ability of location features extracted by LDA. Compared with LDA, LFDA gives a less restrictive constraint, because faraway pairs of within-class samples are not imposed to be close. Thus, a larger degree of freedom is left for LFDA to maximize the between-class scatter and more discriminative features than LDA are extracted.
Furthermore, due to the highly uncertainty and multimodality properties of RSS signal, a large number of RSS samples are required at reference points to characterize these properties [29,30]. It is well known that the generalization ability is mainly determined by the ratio of training sample size to feature dimensions in machine learning and pattern recognition. For the deployed LFDA method, it is prone to data sampling density as well [26], especially when the dimension of input signal space is high. Therefore, in order to improve the performance of LFDA, it is necessary to increase the number of training RSS samples. To address this issue, an intuitive way is to increase the number of samples collected during offline phase. However, samples collection is a time-consuming work, especially for a large-scale target environment. Therefore, we propose a signal perturbation method to increase the number of training samples without adding offline data collection effort.

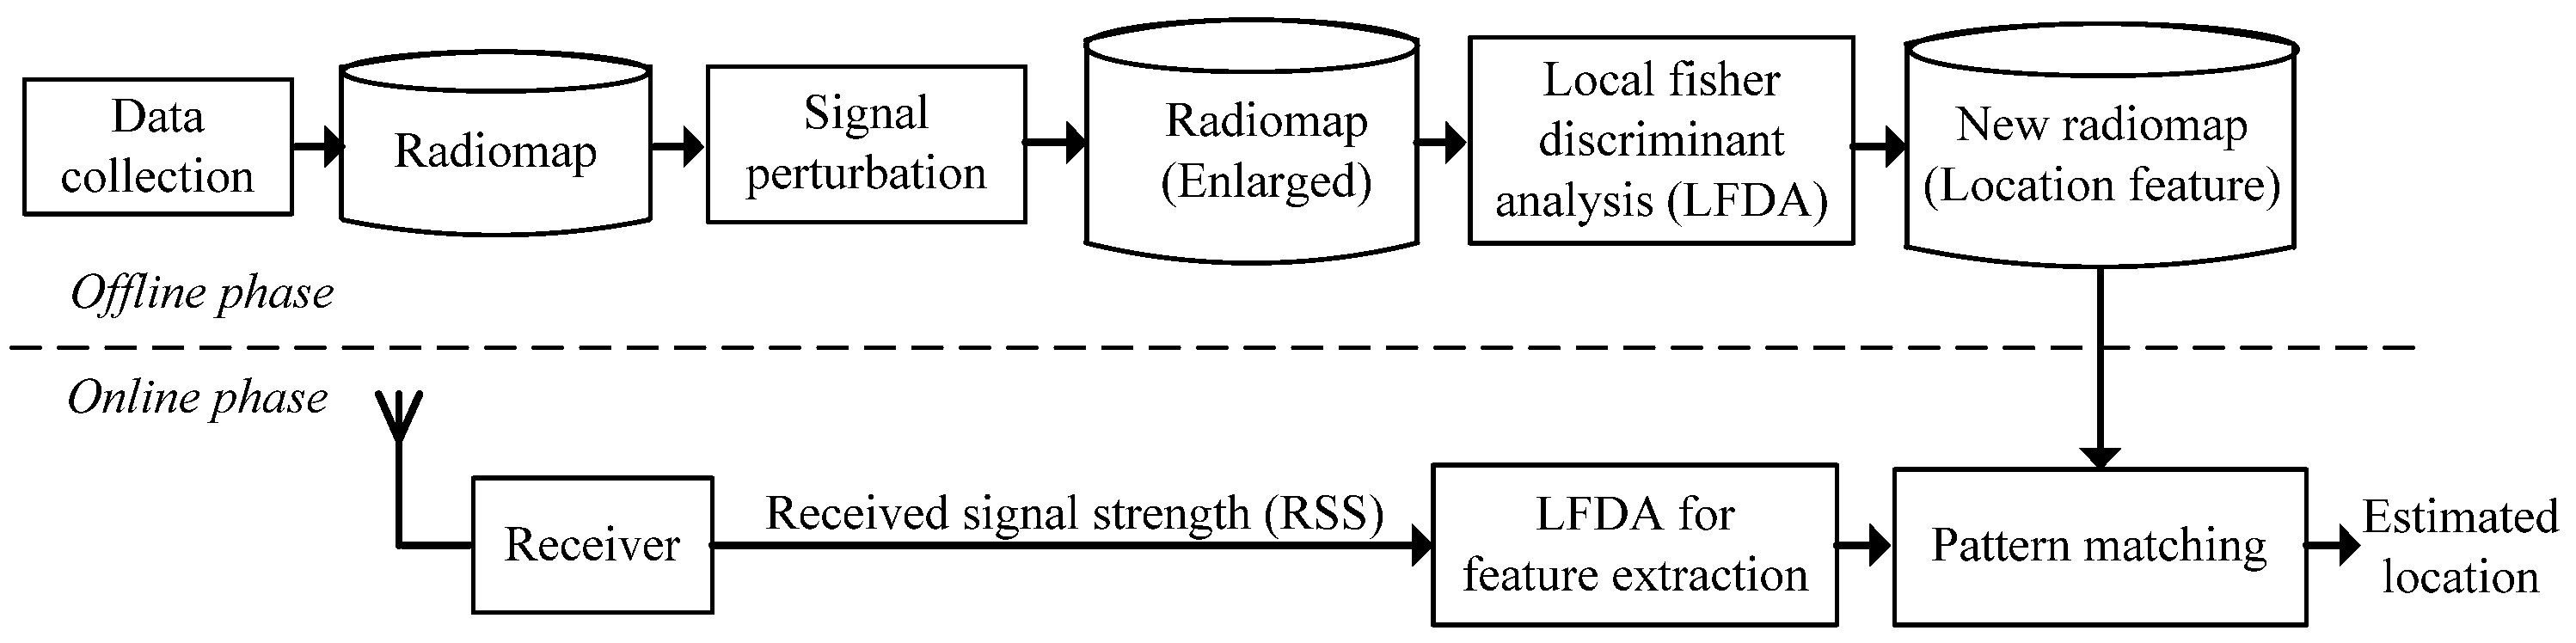
2.2. Overview of the Proposed E-LFDA Method

The proposed E-LFDA method deploys the most popular fingerprinting approach [4,5,6,7]. It consists of two phases: offline phase and online phase. Figure 2 shows the overview of the proposed E-LFDA method.
During the offline phase, more numbers of representative training samples are generated by signal perturbation and LFDA based transformation matrix is obtained. Firstly, RSS samples at different reference points are collected and stored to create the radiomap. Secondly, the number of training samples is increased by signal perturbation at each reference point. Thirdly, based on enlarged radiomap, transformation matrix A (size m × d ) is obtained by LFDA. Finally, the new radiomap comprising extracted location features are constructed. For the m -dimensional RSS sample x i in radiomap, d -dimensional location feature vector is given: y i = A T x i .
During the online phase, real-time RSS sample is collected by client device and the location is estimated based on pre-stored radiomap. Firstly, based on real-time RSS sample x , the real-time location feature y = A T x is obtained. Secondly, compute the Euclidean distance between real-time location feature y and pre-stored mean location feature of the i th reference point:
d i = y y ¯ i 2 , 1 i n
where n is the number of reference points, and y ¯ i is the related mean location feature vector. Finally, the ultimate coordinate vector z is estimated by weighting the K nearest reference points:
z = i = 1 K z i / d ˜ i
where d ˜ i is the normalized Euclidean distance, and z i is the coordinate vector of the related K nearest reference point.

2.3. LFDA for Location Feature Extraction

Assume that x i R m ( i = 1 , , N ) is m -dimensional RSS sample collected at related reference points l i { 1 , 2 , , n } , N l is the number of RSS samples at reference point l , and n is the total number of reference points, respectively. LFDA finds the transformation matrix A = [ a 1 , a 2 , , a d ] as follows:
A = arg m   a x A ^ R m × d    tr ( A ^ T S ( l b ) A ^ ) subject to  A ^ T S ( l w ) A ^ = I
where S ( l w ) and S ( l b ) are the local within-class and between-class scatter matrices, respectively:
S ( l w ) = 1 2 i , j = 1 N W ¯ i , j ( l w ) ( x i x j ) ( x i x j ) T
S ( l b ) = 1 2 i , j = 1 N W ¯ i , j ( l b ) ( x i x j ) ( x i x j ) T
W ¯ i , j ( l w ) = { W i , j / N l 0     if   l i = l j = l if   l i l j
W ¯ i , j ( l b ) = { W i , j ( 1 / N 1 / N l ) 1 / N     if   l i = l j = l if   l i l j
where N is the total number of RSS samples, W i , j measures the similarity between x i and x j . If x i and x j are “close”, i.e., x i is one of the k nearest neighbors of x j or vice versa, then:
W i , j = exp ( x i x j 2 / σ )
otherwise W i , j = 0 . The optimization problem in Equation (3) can be solved as a generalized eigenvalue problem:
S ( l b ) a i = λ i S ( l w ) a i
According to Equation (3), LFDA maximizes the between-class distance while keeping local within-class variance to a certain level. Compared with LDA constraining the within-class data into a single cluster, LFDA gives a less restrictive constraint, because only the neighbor samples are imposed to be close, and the faraway pairs of within-class samples are neglected. Therefore, a larger degree of freedom is left for LFDA to enhance the discrimination power of the extracted location features.
Additionally, for LFDA, it is important to choose an appropriate feature dimension, the value of d . As seen in Equation (9), the transformation vector a i of each feature dimension corresponds to an eigenvalue λ i . Furthermore, Equation (9) can be transformed into:
a i T S ( l b ) a i / a i T S ( l w ) a i = λ i
where the numerator and denominator measure the between-class separability and the local within-class variance, respectively. Therefore, under a certain local within-class variance, the discriminative information quantity contained in each feature dimension may be measured by the associated eigenvalue. The larger the eigenvalue, the stronger discrimination power feature dimension has. We determine the value of d by the cumulative percentage of obtained eigenvalues:
i = 1 d λ i / j = 1 m λ j α *
where α * is a cutoff threshold, which represents the percentage of total discriminative information that selected dimensions exceed. During offline training phase, an appropriate value of α * can be found and used to find feature dimension, which is set as the smallest value that satisfying Equation (11).

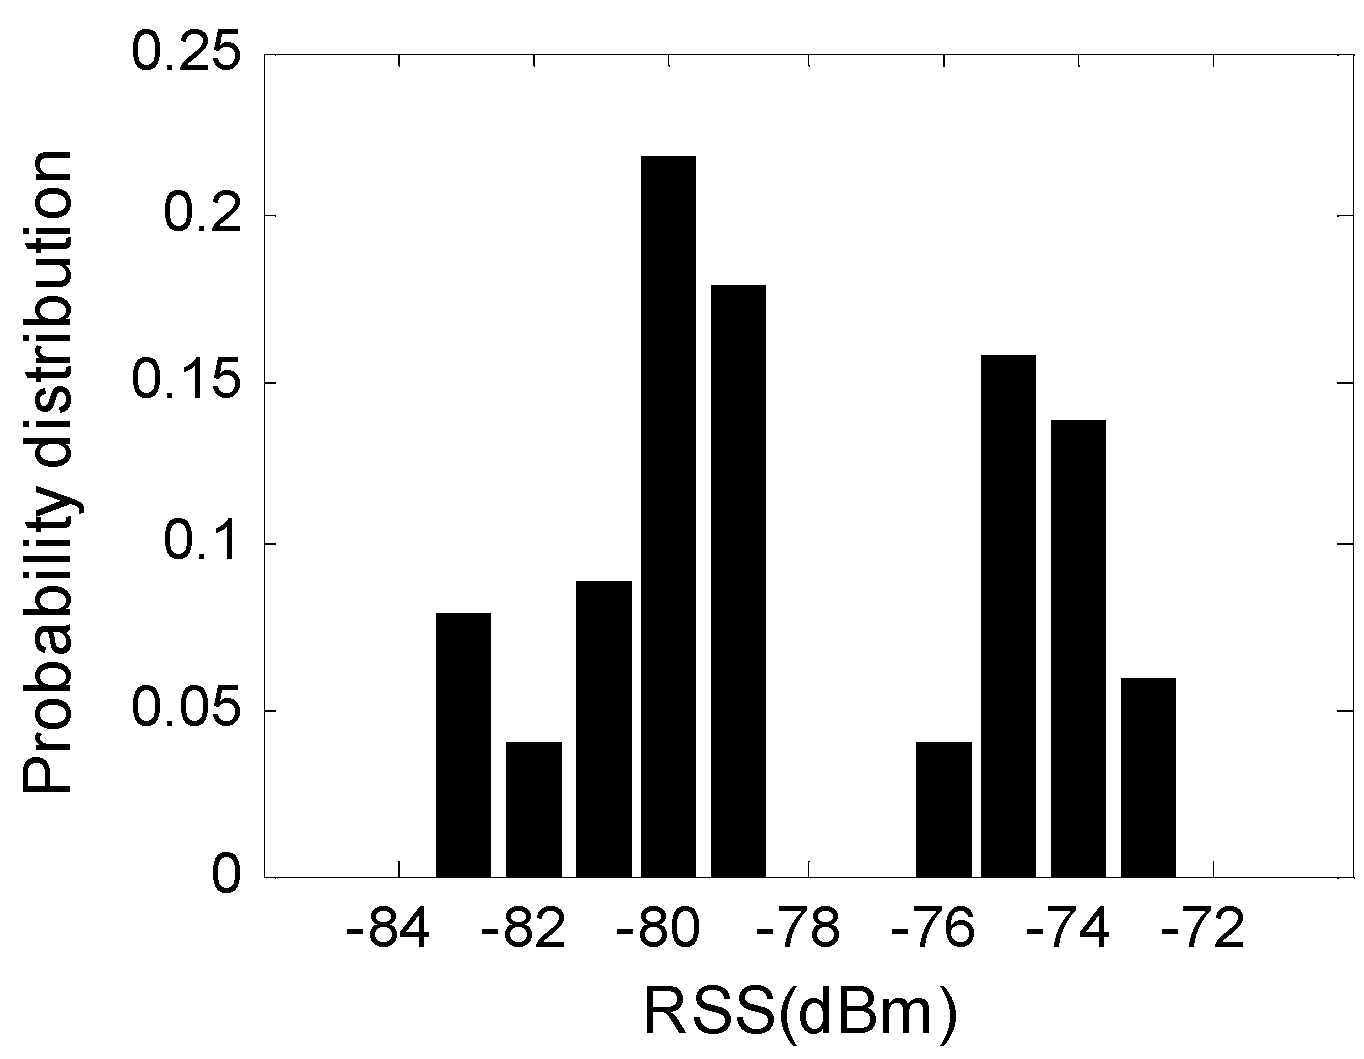
2.4. Signal Perturbation for LFDA

The proposed signal perturbation method aims to generate more number of useful training samples for LFDA. We discover that, due to the high-dimensionality and uncertainty of RSS signals, the number of RSS training samples is not sufficient to include all useful samples, even for the most representative samples consisting of the most likely received RSS value from all APs. Denote all the N S RSS samples collected at the reference point as a set C = { x 1 , x 2 , , x N S } , where x i = [ x i 1 , x i 2 , , x i m ] T is the sample vector with RSS values collected from m APs. RSS values from the j th AP comprise the set C j = { x 1 j , x 2 j , , x N S j } . Assuming that the probability of the most likely received RSS value from j th AP is P max j , the probability of the most representative RSS sample occurs in set C can be given as:
P max = 1 ( 1 j = 1 m P max j ) N S
Assuming that there are 10 APs ( m = 10 ) available in target environment, the probability of the most likely received RSS values for all APs equals to 0.4 ( P max j = 0.4 , j = 1 , , 10 ), and the number of RSS samples is 100 ( N S = 100 ), the probability for the most representative training sample is only about 0.01 ( P max = 0.01 ). Thus, we propose a signal perturbation method to generate more number of representative RSS samples, which may be absent in original RSS sample set.
The proposed signal perturbation method is founded on the following two assumptions:
  • For a realistic RSS vector sample, the probability of all the samples in the set C j is identical;
  • The existing probability of RSS values from any two APs is independent to each other.
The process of the proposed signal perturbation method can be given as follows: Firstly, we randomly select a RSS value from the set C j , repeat this process over all the m sets of the related m APs, and then a new RSS training sample is generated by comprising the m randomly selected RSS values. Secondly, repeat the above process and generate more training samples for each reference point. Finally, by combining the new generated samples with the original ones, an enlarged radio map is produced and can be deployed to enhance the performance of LFDA. Note that all the computations of signal perturbation are achieved during offline phase, no additional computation cost is required during online phase on mobile devices.

3. Evaluation

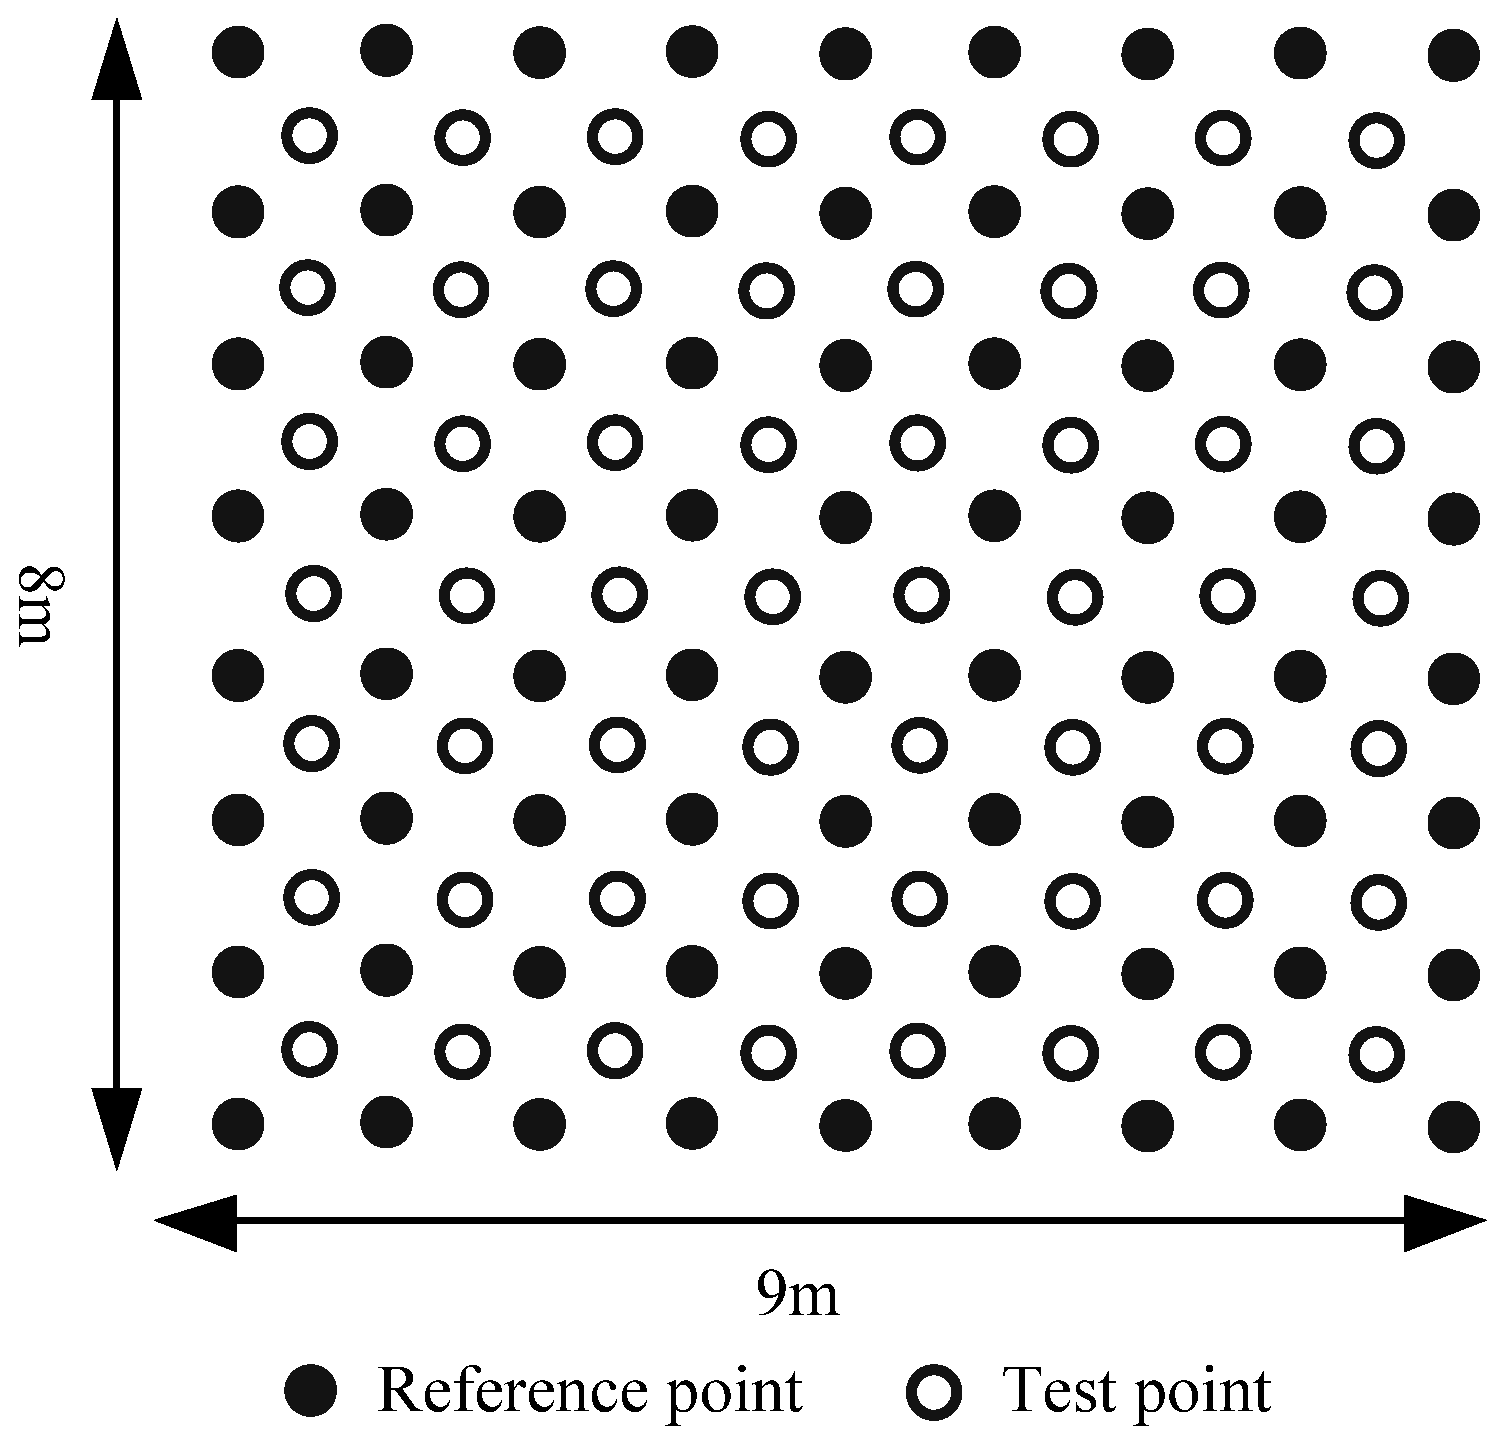
3.1. Experimental Setup

We performed our experiments in a classical WLAN indoor environment, an open office room with 9  m × 8  m × 3  m ( length × width × height ), as shown in Figure 3. There were a total of eleven APs available with one AP in the room and the other APs from adjacent area of the same floor with none-line-of-sight signal propagation. We collected 100 RSS samples at each reference point with a total of 72 reference points. Each reference point was separated by about one meter. A total of 56 test points with related 5600 testing samples were collected at different locations to test the positioning accuracy. All reference and test points were collected on the two dimensional horizontal floor. We deploy the error distance as the performance metric, which is Euclidean distance between the true coordinate and the estimated one. The cumulative probability distribution of error distance was defined as positioning accuracy. To determine tunable parameters of the proposed E-LFDA method, five-fold cross validation was used during offline training phase. We also carried and compared WKNN, ANN, MLE, PCA, LDA and LFDA (proposed E-LFDA without signal perturbation) method. The number of training RSS samples per reference point was added from 100 to 1000 by the proposed signal perturbation method. In our future work, we will test our approach in some more complicated and larger-scale indoor environments, and also in some public testbeds and datasets, such as UJIIndoorLoc [31].

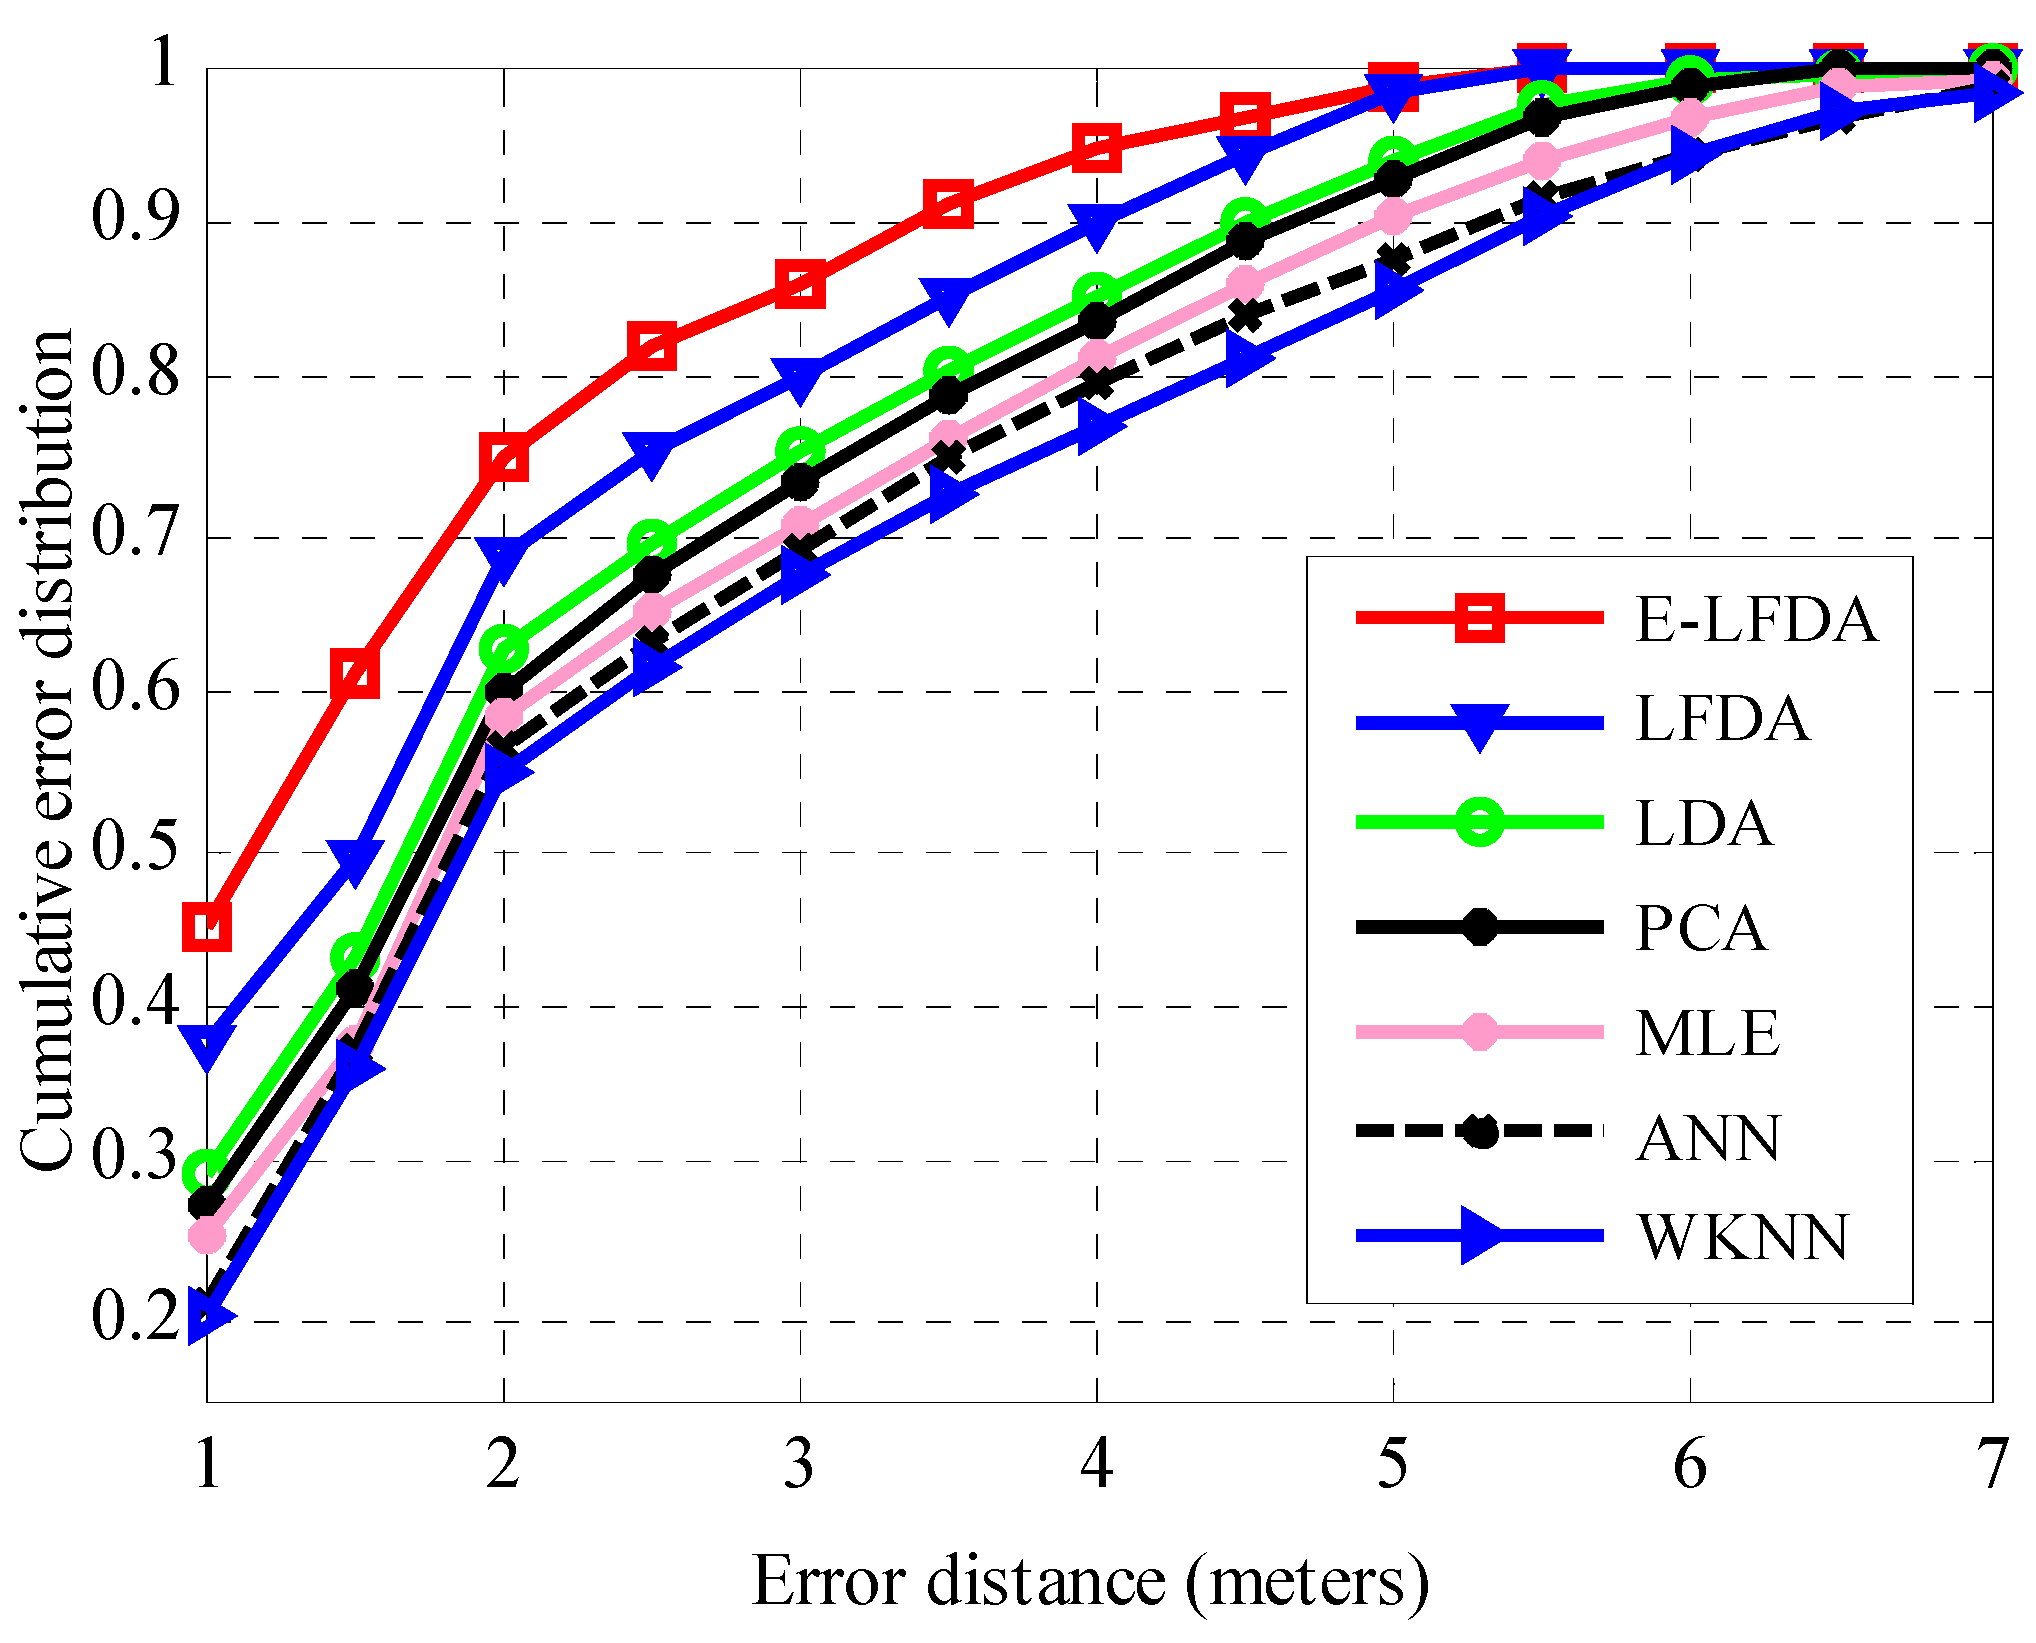
3.2. Positioning Accuracy Comparison

This section compares the performance of E-LFDA with the widely used WKNN, MLE, and ANN method. LFDA without signal perturbation is also compared. As seen in Table 1, for E-LFDA, the accuracy within 2 m is 75.2%, while those of LFDA, LDA, PCA, MLE, WKNN and ANN are 68.8%, 62.7%, 60.1%, 58.3%, 54.8% and 56.4%, respectively. The accuracy within 3 m of E-LFDA is 86.1%, while those of LFDA, LDA, PCA, MLE, WKNN and ANN are 80.2%, 75.3%, 73.6%, 70.7%, 67.4% and 69.2%, respectively. Figure 4 shows the positioning accuracy of compared methods more clearly. MLE obtains higher positioning accuracy than WKNN and ANN, since the RSS signal probability distribution information at each reference point is sufficiently explored. Unlike MLE method deploying original RSS signals, LDA and PCA improve accuracy by extracting useful location features and discarding redundancy. Particularly, LDA performs slightly better than PCA by further exploring the discrimination information in RSS signal space. The proposed E-LFDA method achieves significant performance improvement than LDA. Only the mean positioning errors of the proposed LFDA and E-LFDA are within 2 m. That is because LFDA adapts the multimodality of RSS signals better than LDA. LFDA preserves the within-class local structure of RSS signal while maximizes the between-class separability. In our experiments, signal perturbation is used to increase the number of RSS training samples from 100 to 1000. By generating new useful RSS training samples, the generalization ability of LFDA is further enhanced. The best performance is achieved by E-LFDA method. Compared with LDA and PCA, E-LFDA reduces the mean and standard deviation of positioning error by 23.9% and 33.0%, respectively.

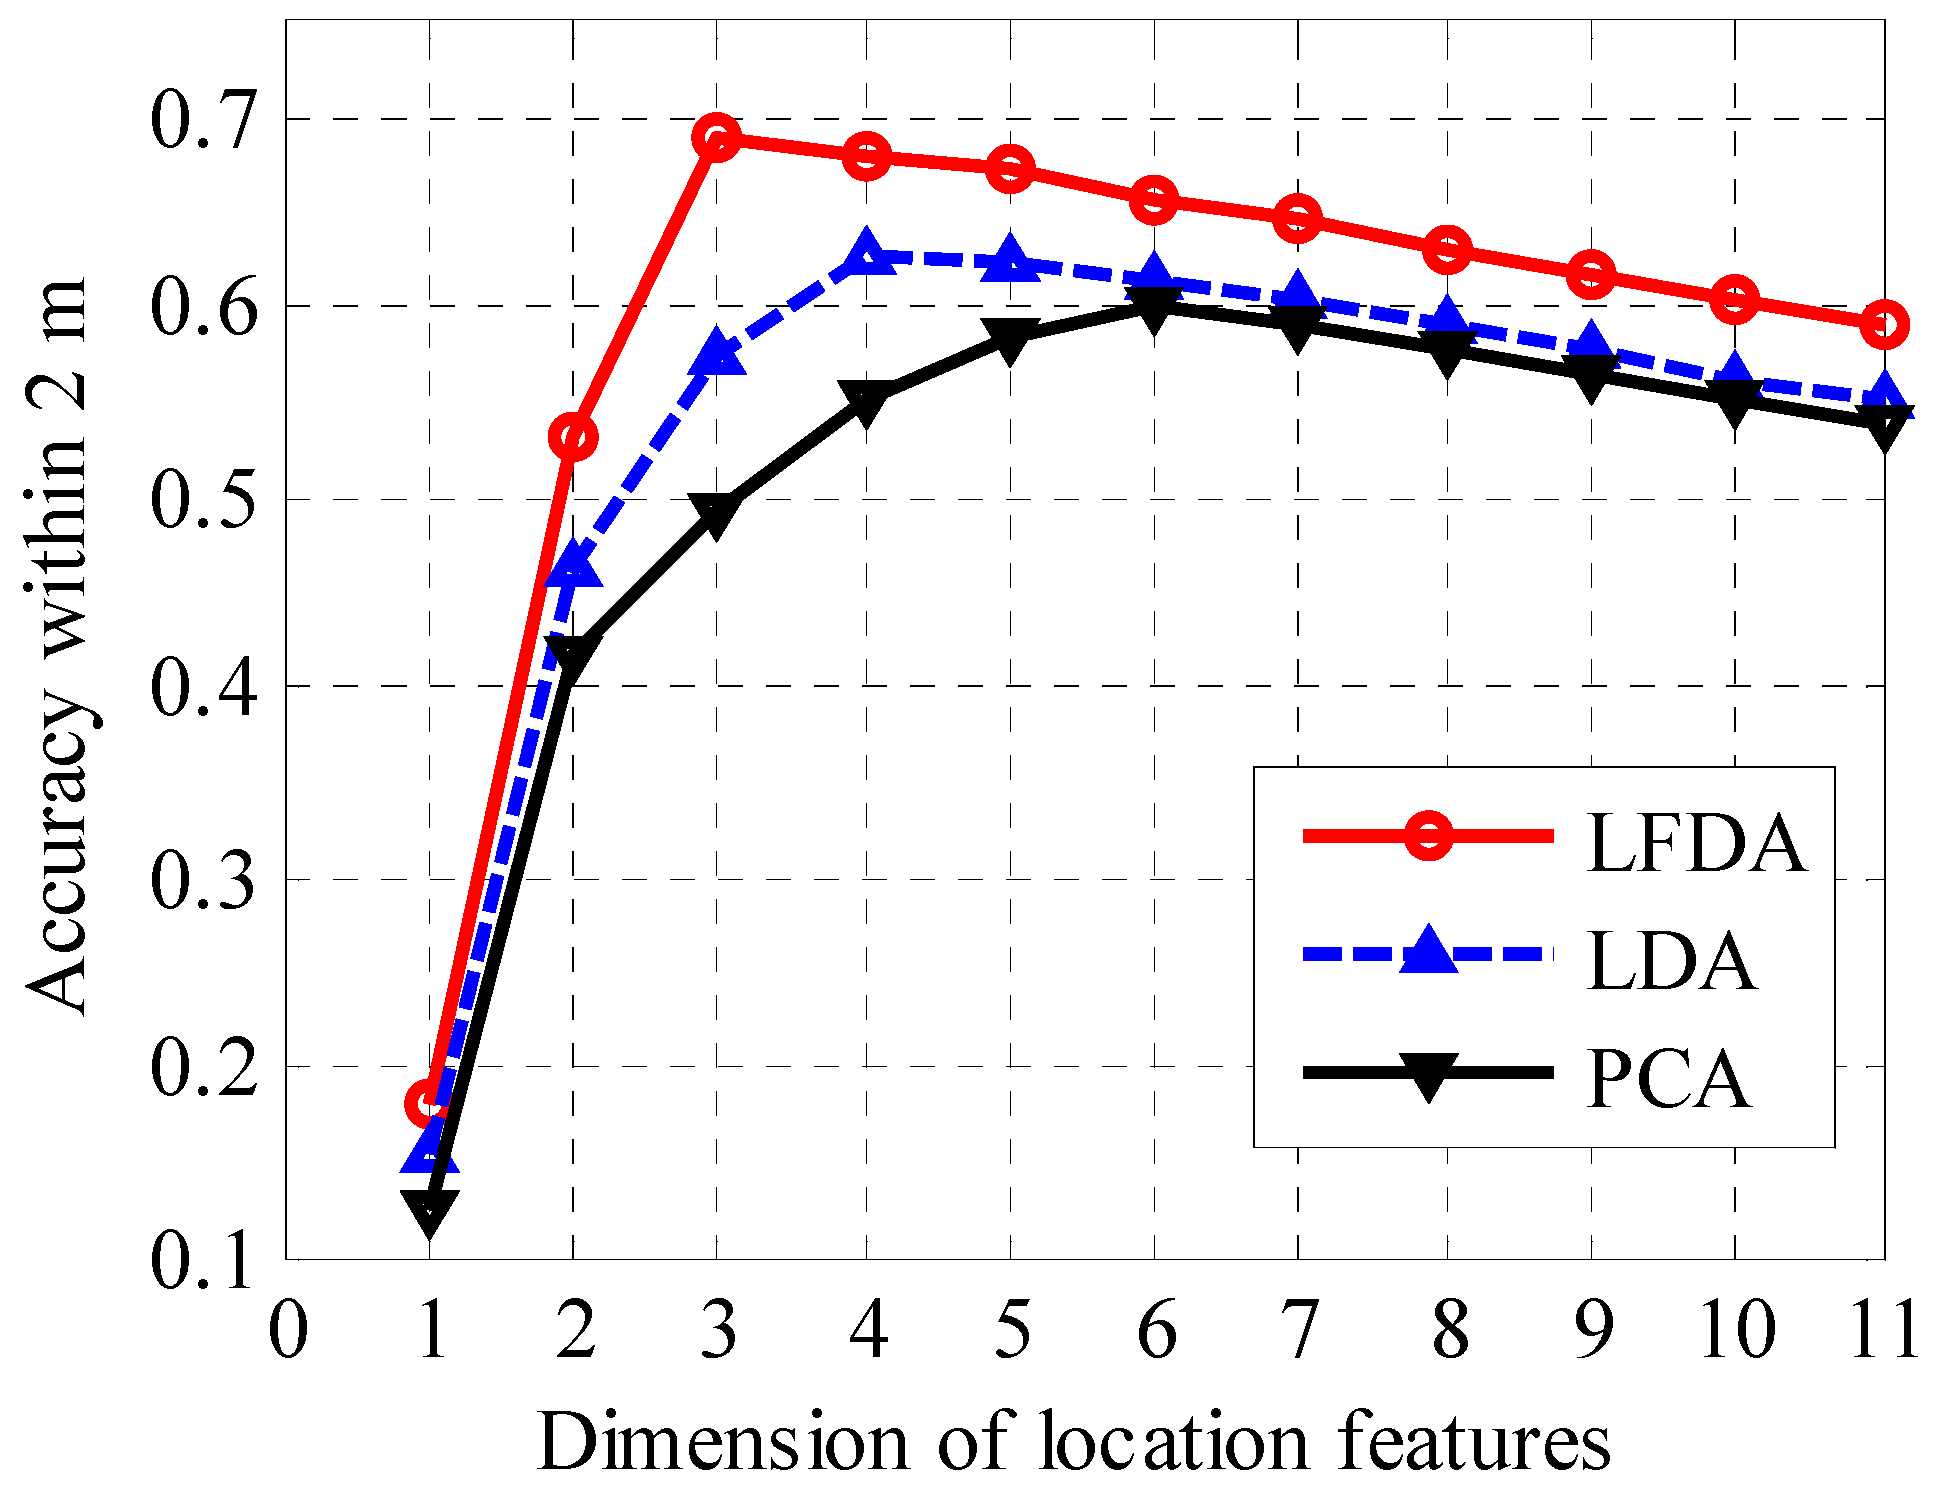
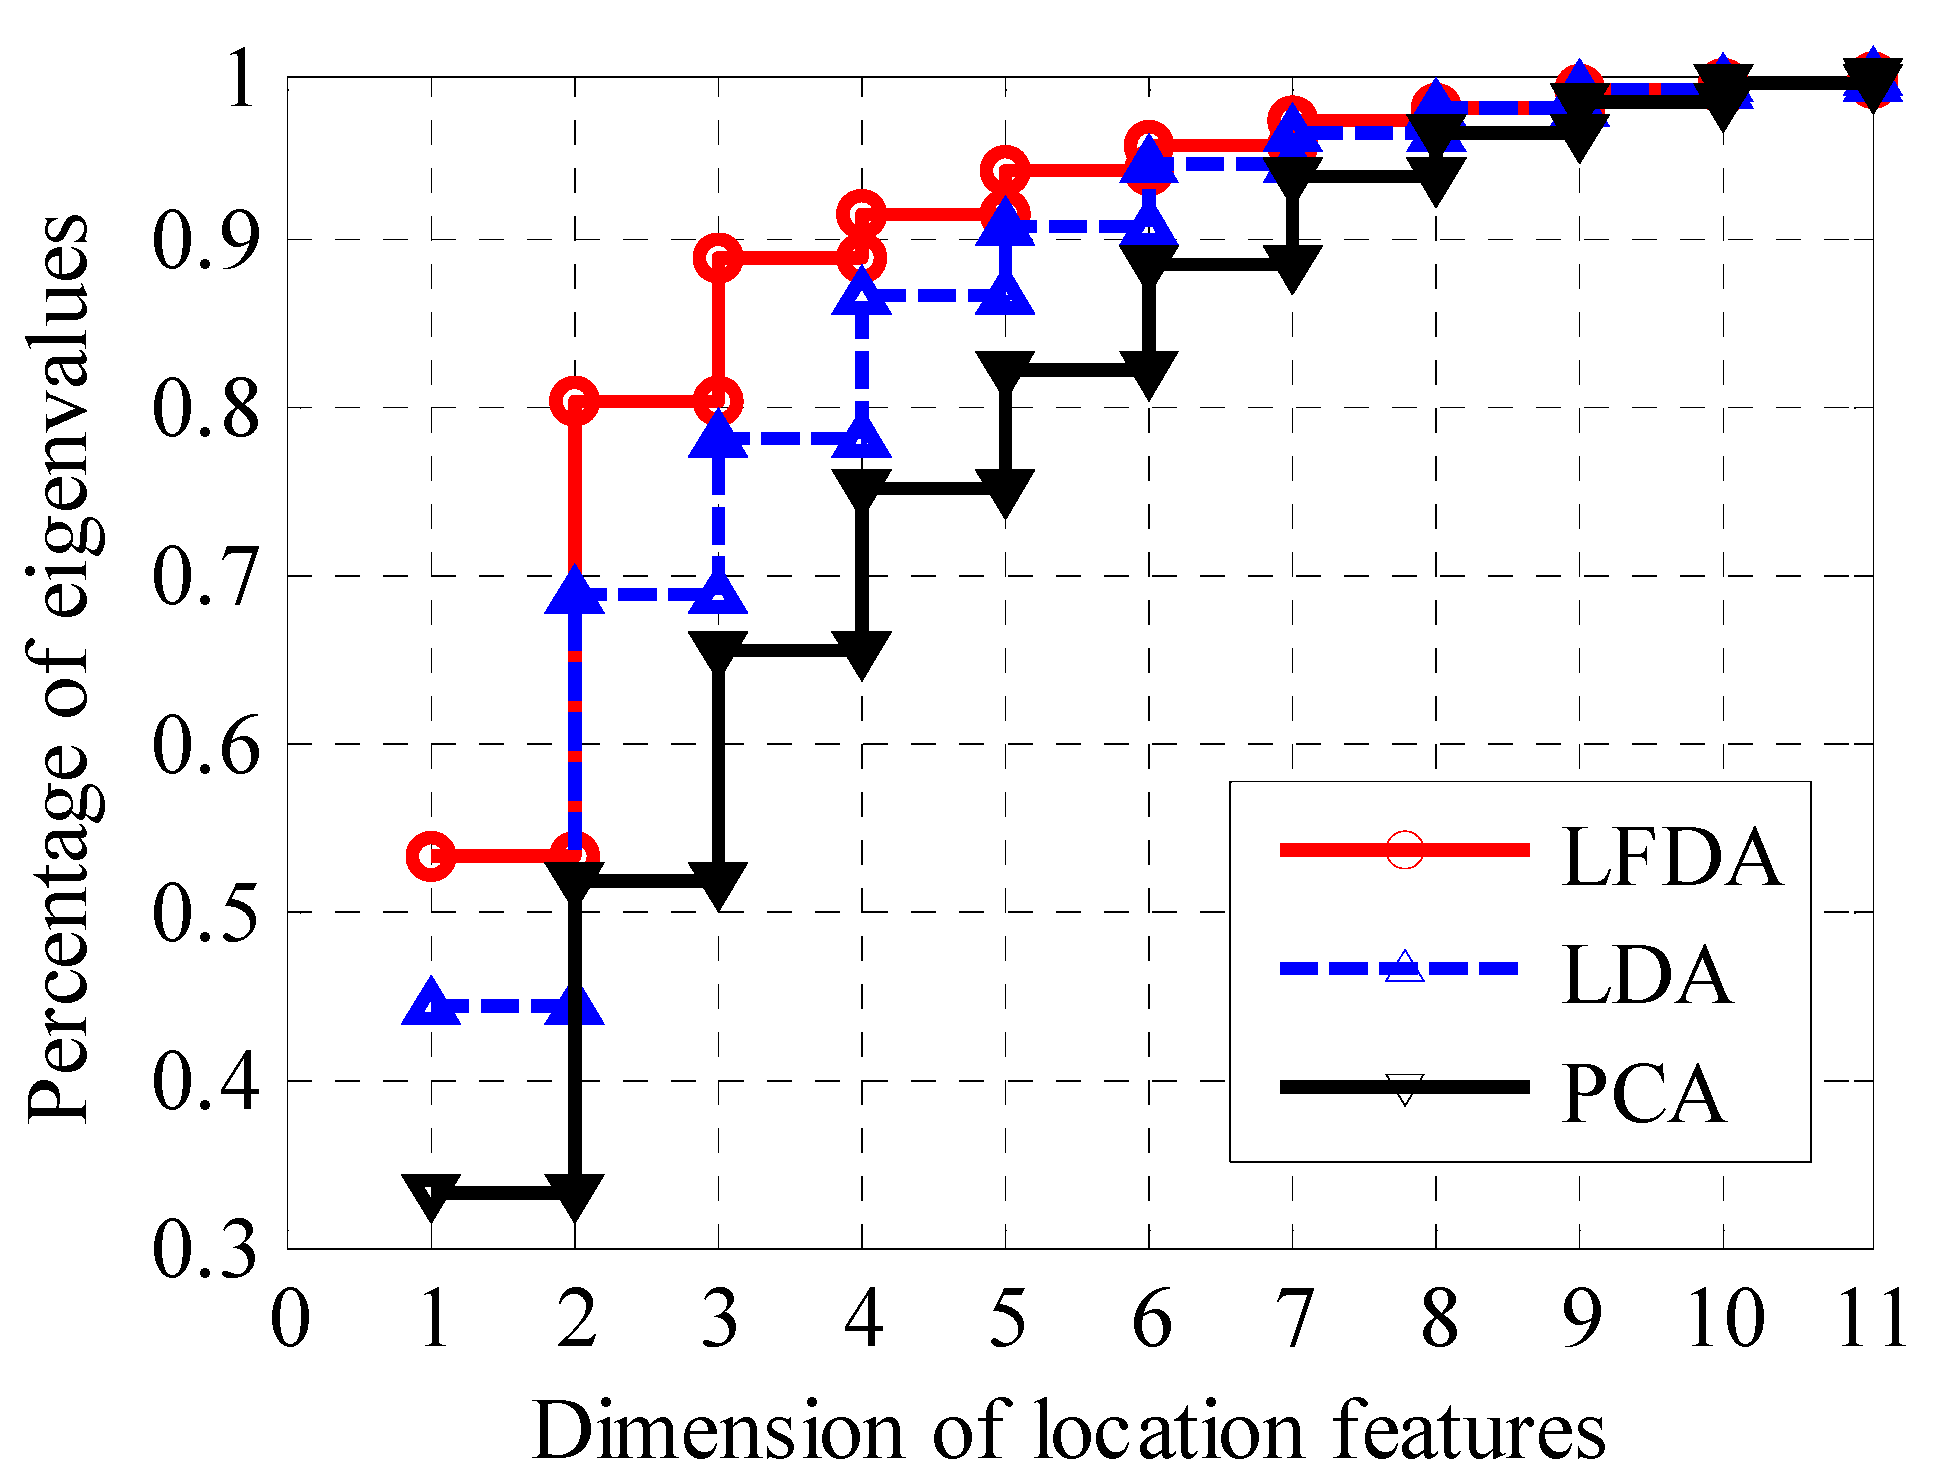
3.3. Effect of Feature Dimensions on Positioning Accuracy

This section reports the effect of feature dimensions on positioning accuracy. For each feature extraction method, the location information is reorganized in terms of feature dimensions. LFDA and LDA aim to extract the location features maximizing the separability between different classes, whereas PCA extracts the location features of large variance. Figure 5 compares accuracy within 2 m versus feature dimensions between different feature extraction methods, including LFDA, LDA, and PCA. The best accuracy within 2 m of LFDA, LDA and PCA are 68.8%, 62.7% and 60.1%, with related optimal dimensions being 3, 4, and 6, respectively. As seen in Figure 5, accuracy of LFDA first rapidly reaches the best performance and then gradually decreases. That is because, the latter added feature dimensions contain less discriminative information while more signal noise is introduced.
As stated in Section 2.3 and Equation (10), the cumulative percentage of eigenvalues directly indicates the quantity of discrimination power or feature variance. Figure 6 shows cumulative percentage of eigenvalues versus feature dimensions. As seen in Figure 6, the first three dimensions in LFDA already contributes 88.9% cumulative percentage of eigenvalues, higher than those of LDA and PCA with the first four and six dimensions, respectively. This also supports that the feature separability of LFDA is stronger than those of LDA and PCA. Additionally, during offline parameter tuning in experiments, setting cutoff threshold of the cumulative percentage of eigenvalues α * somewhere between 85% and 95% is feasible, since most of the discriminative information is preserved while discarding noise information. In addition, compared with using original RSS signals, LFDA reduces the feature dimension from 11 to 3, and, thus, reduces the computation cost greatly.

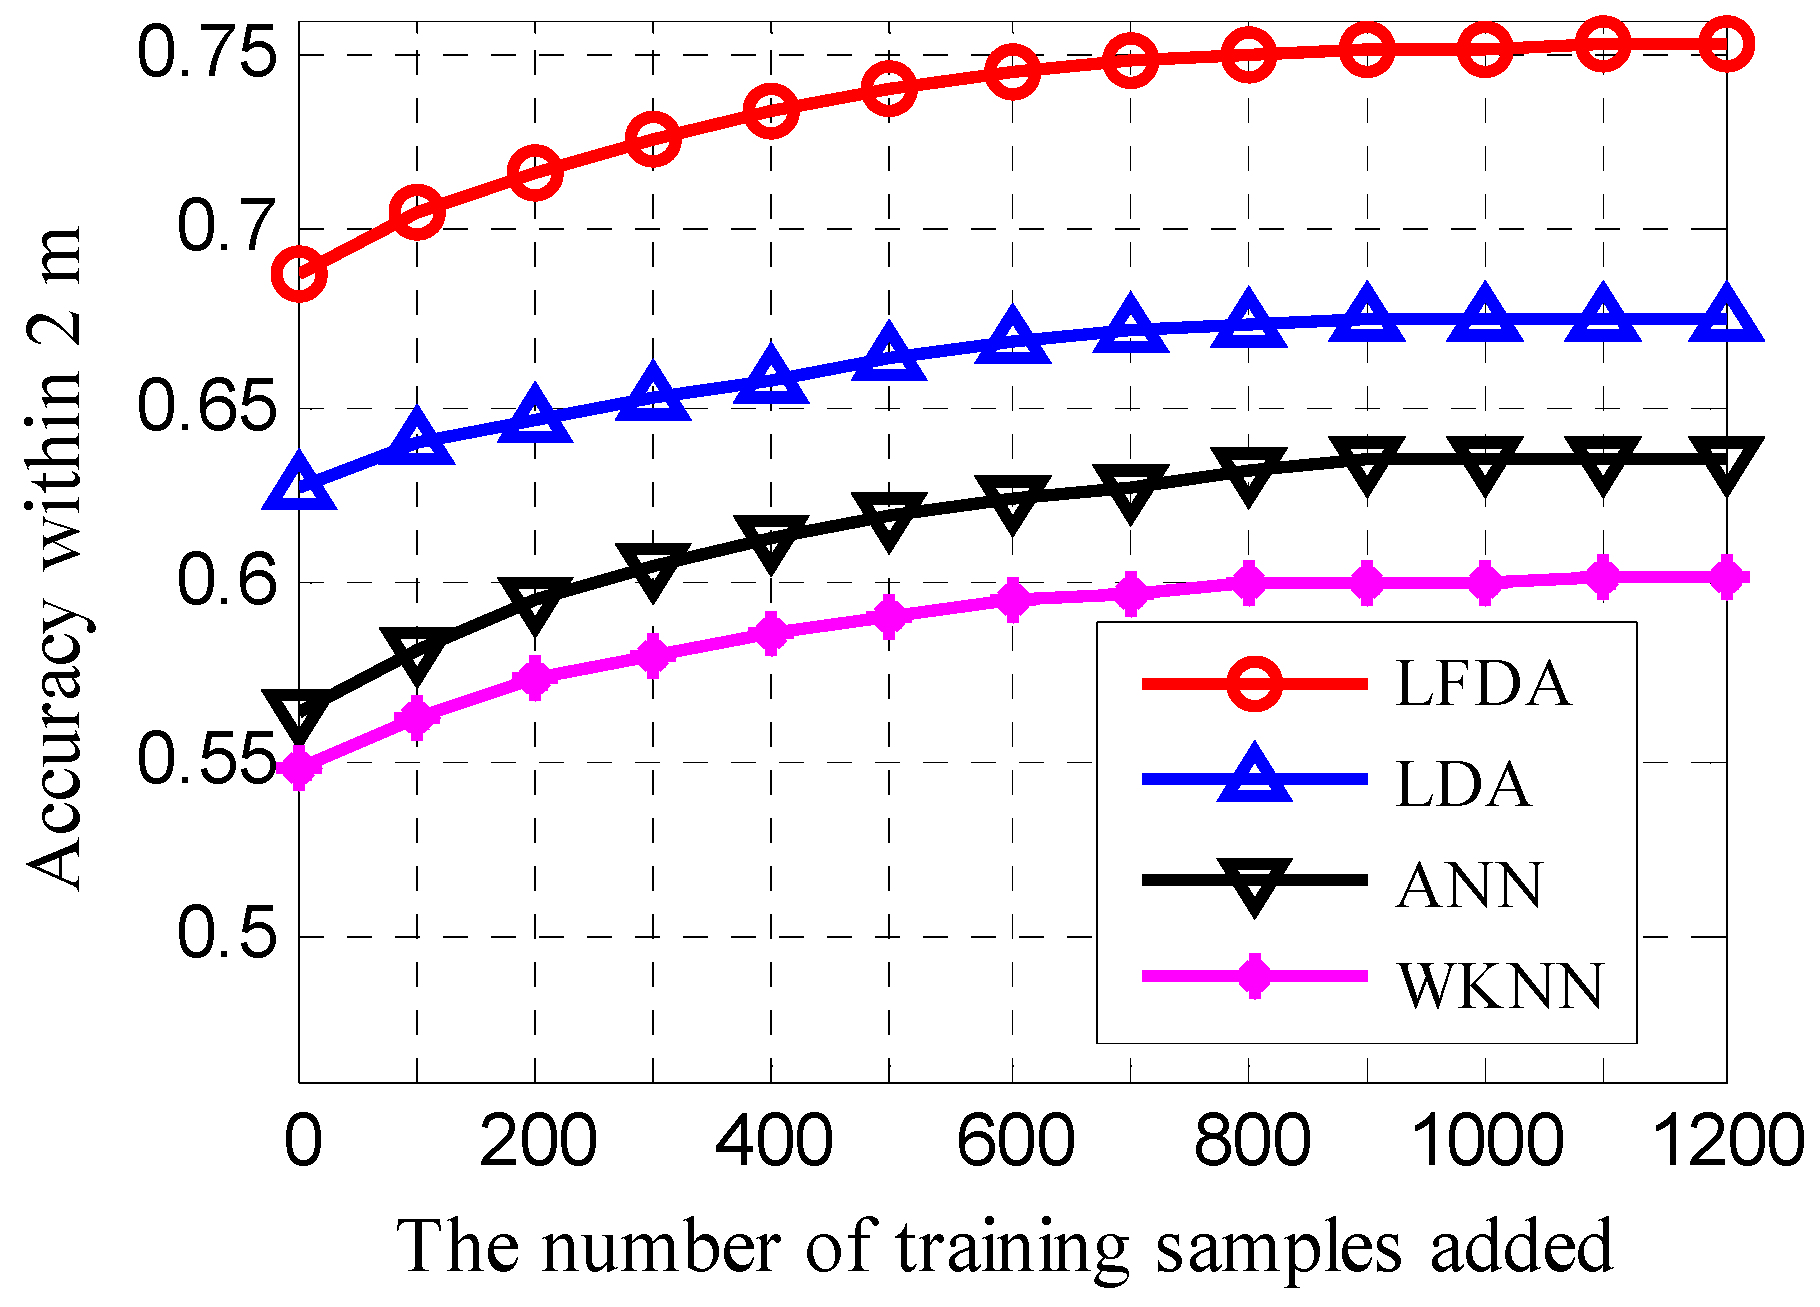
3.4. Effect of Signal Perturbation on Positioning Accuracy

Figure 7 shows the accuracy within 2 m versus the number of training samples added per reference point by signal perturbation. As in many works [11,32], we collect 100 original RSS training samples per reference point. For simplicity, we only evaluate the effect of signal perturbation on accuracy of LFDA, LDA, WKNN and ANN method. As seen in Figure 7, the proposed signal perturbation method improves all the compared positioning methods. Through signal perturbation, RSS samples, which are very likely to appear at each reference point, are added into training samples set. The ratio of training size to feature dimensions increases and enhances the generalization ability of these machine learning or pattern matching methods. For LFDA, it is more prone to data sampling density than LDA for its locality preserving property. Thus, through signal perturbation, the performance improvement is higher than that of LDA. In comparison, ANN also gets higher accuracy improvement than WKNN. That is because the overfitting problem of ANN is greatly alleviated by adding much more useful training samples. As seen in Figure 7, when the number of training samples added is bigger than 900, the accuracy improvement is little. Therefore, during offline phase, we just increase the number of training samples per reference point by signal perturbation from 100 to 1000.

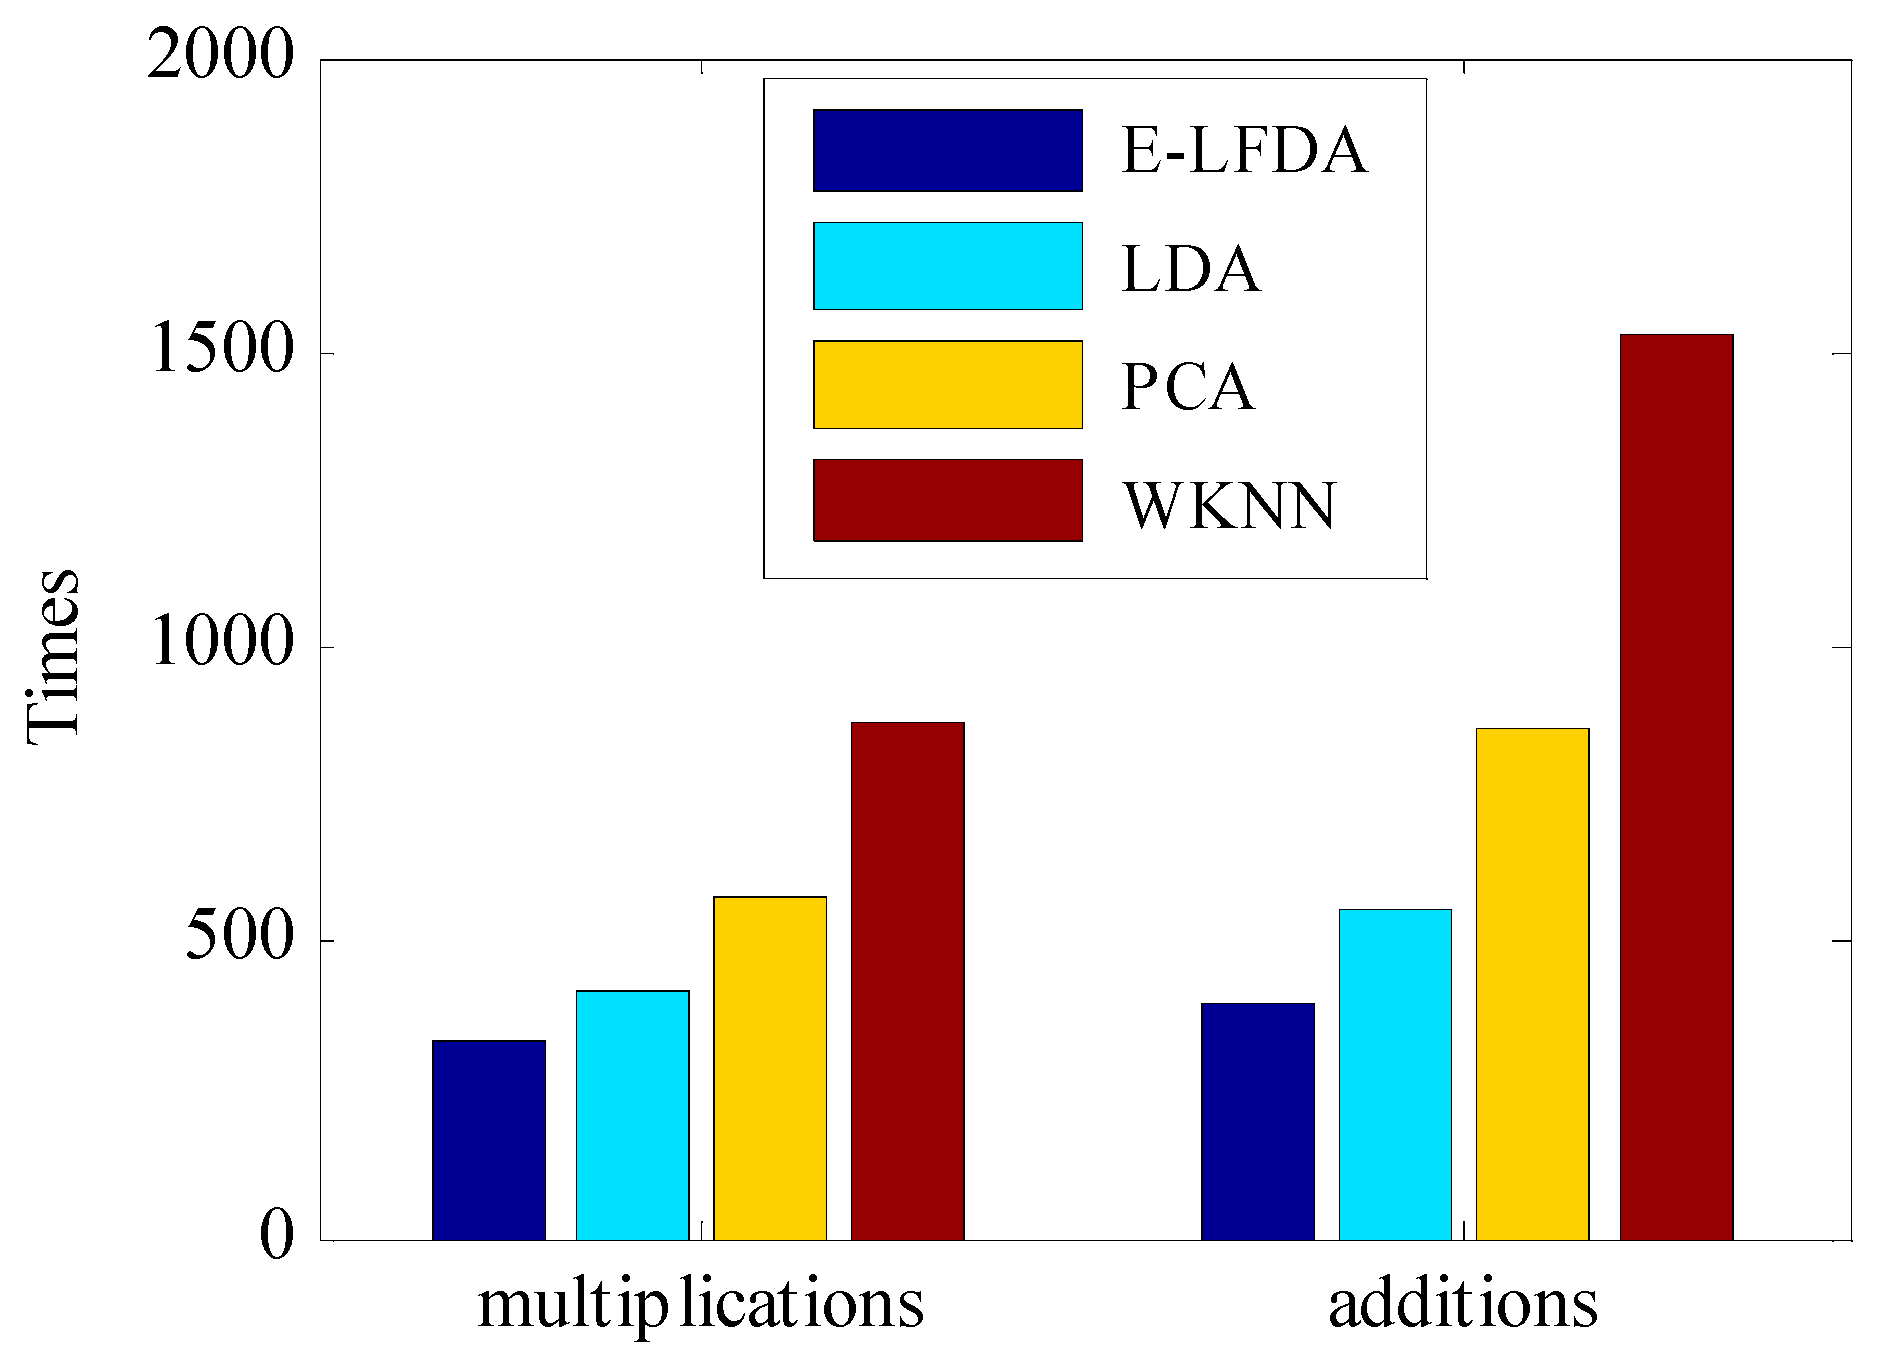
3.5. Online Computation Cost Comparison

We compare the online computation cost of the proposed method with the widely used WKNN method, which has a relatively small computation cost. Since the computations of signal perturbation and transformation matrix can be carried during offline phase, online computation cost required by E-LFDA is the feature extraction and pattern matching processes. Denote the number of APs used, total number of reference points, and the related optimal feature dimension as m , n and d . The number of the matched nearest reference points K is set to five. For E-LFDA, LDA, and PCA, the number of multiplications and additions required are ( m + n ) d + n + 2 K + 2 and ( m + 2 n 1 ) d + 3 K n 3 , respectively. For WKNN, the number of multiplications and additions required are ( m + 1 ) n + 2 K + 2 and ( 2 m 1 ) * n + 3 K 3 , respectively. As shown in Figure 8, the proposed E-LFDA method reduces the number of multiplications than those of LDA, PCA and WKNN by 20.0%, 42.8%, and 62.0%, respectively. This is because the feature dimension involved in E-LFDA method is only three, much less than those of LDA, PCA with four and six and WKNN using all eleven APs.

4. Conclusions

This paper proposes a novel approach based on enhanced LFDA to improve WLAN indoor positioning accuracy. Like other feature extraction methods such as LDA, LFDA is used to extract useful location information from high-dimensional RSS signal space. However, LFDA adapts the multimodal property of RSS signal better than previous methods, because the within-class local structure is preserved and thus giving more freedom to maximize between-class separability. Furthermore, a signal perturbation method is proposed and combined to enhance the performance of LFDA. The signal perturbation method generates more number of representative and useful training samples for LFDA and hence enhancing its generalization ability. LDA, PCA, WKNN, MLE and ANN methods are carried and compared with the proposed E-LFDA in realistic WLAN indoor environment. Experimental results show that, compared with previous feature extraction methods, the proposed method increases the accuracy within 2 m from 62.7% to 75.2% and reduces the mean and standard deviation of positing error by 23.9% and 33.0%, respectively.

Acknowledgments

This research is supported by National Natural Science Foundation of China (Granted Nos. 61301132, 61300188, and 61301131), the Fundamental Research Funds for the Central Universities (Granted No. 3132014211) and “Doctor Startup Foundation of Liaoning Province” of China (Granted No. 20131006).

Author Contributions

Zhi-An Deng proposed the original idea and wrote the paper; Di Wu analyzed the data and gave some valuable suggestions; Yiran Zhou performed the research and revised the paper; Zhenyu Na designed the experiments and revised the paper.

Conflicts of Interest

The authors declare no conflict of interest.

References

  1. Wirola, L.; Laine, T.A.; Syrjarinne, J. Mass-Market Requirements for Indoor Positioning and Indoor Navigation. In Proceedings of the International Conference on Indoor Positioning and Indoor Navigation, Zurich, Switzerland, 15–17 September 2010; pp. 1–7.
  2. Petrova, K.; Wang, B. Location-based Services Deployment and Demand: A Roadmap Model. Electron. Commer. Res. 2011, 11, 5–29. [Google Scholar] [CrossRef]
  3. Cheng, X.-Z.; Zhu, D.-R.; Zhang, S.; He, P. Tracking Positioning Algorithm for Direction of Arrival Based on Direction Lock Loop. Future Internet 2015, 7, 214–224. [Google Scholar] [CrossRef]
  4. Ma, L.; Xu, Y. Received Signal Strength Recovery in Green WLAN Indoor Positioning System Using Singular Value Thresholding. Sensors 2015, 15, 1292–1311. [Google Scholar] [CrossRef] [PubMed]
  5. Zhou, M.; Zhang, Q.; Xu, K.; Tian, Z.; Wang, Y.; He, W. PRIMAL: Page Rank-Based Indoor Mapping and Localization Using Gene-Sequenced Unlabeled WLAN Received Signal Strength. Sensors 2015, 15, 24791–24817. [Google Scholar] [CrossRef] [PubMed]
  6. Park, J.G.; Charrow, B.; Curtis, D.; Battat, J.; Minkov, E.; Hicks, J.; Teller, S.; Ledlie, J. Growing an Organic Indoor Location System. In Proceedings of the 8th International Conference on Mobile Systems, Applications, and Services, San Francisco, CA, USA, 15–18 June 2010; pp. 271–284.
  7. Jiang, Y.; Pan, X.; Li, K.; Lv, Q.; Dick, R.; Hannigan, M.; Shang, L. ARIEL: Automatic Wi-Fi Based Room Fingerprinting for Indoor Localization. In Proceedings of the ACM Conference on Ubiquitous Computing, Pittsburgh, PA, USA, 5–8 September 2012; pp. 441–450.
  8. Zhou, M.; Xu, Y.B.; Ma, L.; Tian, S. On the Statistical Errors of RADAR Location Sensor Networks with Built-In Wi-Fi Gaussian Linear Fingerprints. Sensors 2012, 12, 3605–3626. [Google Scholar] [CrossRef] [PubMed]
  9. Bahl, P.; Padmanabhan, V.N. RADAR: An In-Building RF-Based User Location and Tracking System. In Proceedings of the 19th IEEE Computer and Communications Societies Conference, Tel Aviv, Israel, 26–30 March 2000; pp. 775–784.
  10. Youssef, M.; Agrawala, A.; Shankar, U. WLAN Location Determination via Clustering and Probability Distributions. In Proceedings of the First IEEE International Conference on Pervasive Computing and Communications, Fort Worth, TX, USA, 23–26 March 2003.
  11. Zhou, M.; Xu, Y.B.; Tang, L. Multilayer ANN Indoor Location System with Area Division in WLAN Environment. J. Syst. Eng. Electron. 2010, 21, 914–926. [Google Scholar] [CrossRef]
  12. Du, Y.; Yang, D.; Xiu, C. Novel Method for Constructing a WIFI Positioning System with Efficient Manpower. Sensors 2015, 15, 8358–8381. [Google Scholar] [CrossRef] [PubMed]
  13. Feng, C.; Au, W.S.A.; Valaee, S.; Tan, Z. Received-Signal-Strength-Based Indoor Positioning Using Compressive Sensing. IEEE Trans. Mob. Comput. 2012, 11, 1983–1985. [Google Scholar] [CrossRef]
  14. Chen, K.Y.; Yang, Q.; Yin, J.; Chai, X.Y. Power-Efficient Access-Point Selection for Indoor location estimation. IEEE Trans. Knowl. Data Eng. 2006, 18, 877–888. [Google Scholar] [CrossRef]
  15. Mo, Y.; Zhang, Z.; Meng, W.; Ma, L.; Wang, Y. A Spatial Division Clustering Method and Low Dimensional Feature Extraction Technique Based Indoor Positioning System. Sensors 2014, 14, 1850–1876. [Google Scholar] [CrossRef] [PubMed]
  16. Kushki, A.; Plataniotis, K.N.; Venetsanopoulos, A.N. Kernel-based Positioning in Wireless Local Area Networks. IEEE Trans. Mob. Comput. 2007, 6, 689–705. [Google Scholar] [CrossRef]
  17. Deng, Z.A.; Xu, Y.B.; Ma, L. Joint AP Selection and Local Discriminant Embedding for Energy Efficient and Accurate Wi-Fi Positioning. KSII Trans. Internet Inf. Syst. 2012, 6, 794–814. [Google Scholar]
  18. Fang, S.H.; Lin, T.N. Principal Component Localization in Indoor WLAN Environments. IEEE Trans. Mob. Comput. 2012, 11, 100–110. [Google Scholar] [CrossRef]
  19. Fang, S.H.; Wang, C.H. A Dynamic Hybrid Projection Approach for Improved Wi-Fi Location Fingerprinting. IEEE Trans. Veh. Technol. 2011, 60, 1037–1044. [Google Scholar] [CrossRef]
  20. Fang, S.H.; Lin, T.N. Indoor location system based on discriminant-adaptive neural network in IEEE 802.11 environments. IEEE Trans. Neural Netw. 2008, 19, 1973–1978. [Google Scholar] [CrossRef] [PubMed]
  21. Zhu, M.L.; Aleix, M.A. Pruning Noisy Bases in Discriminant Analysis. IEEE Trans. Neural Netw. 2008, 19, 148–157. [Google Scholar] [PubMed]
  22. Pan, J.J.; Kwok, J.T.; Yang, Q.; Chen, Y. Multidimensional Vector Regression for Accurate and Low-Cost Location Estimation in Pervasive Computing. IEEE Tran. Knowl. Data Eng. 2006, 18, 1181–1193. [Google Scholar] [CrossRef]
  23. Deng, Z.A.; Xu, Y.B.; Ma, L. Indoor Positioning via Nonlinear Discriminative Feature Extraction in Wireless Local Area Network. Comput. Commun. 2012, 35, 738–747. [Google Scholar] [CrossRef]
  24. Kaemarungsi, K.; Krishnamurthy, P. Properties of Indoor Received Signal Strength for WLAN Location Fingerprinting. In Proceedings of the IEEE First Annual International Conference on Mobile and Ubiquitous Systems: Networking and Services, Boston, MA, USA, 22–26 August 2004; pp. 14–23.
  25. Kaemarungsi, K. Distribution of WLAN Received Signal Strength Indication for Indoor Location Determination. In Proceedings of the 1st International Symposium on Wireless Pervasive Computing, Phuket, Thailand, 16–18 January 2006.
  26. Sugiyama, M. Dimensionality Reduction of Multimodal Labeled Data by Local Fisher Discriminant Analysis. J. Mach. Learn. Res. 2007, 8, 1027–1061. [Google Scholar]
  27. Theodoridis, S.; Koutroumbas, K. Pattern Recognition, 3rd ed.; Academic Press: London, UK, 2005. [Google Scholar]
  28. Sheng, Y.; Tan, K.; Chen, G.; Kotz, D.; Campbell, A. Detecting 802.11 MAC Layer Spoofing Using Received Signal Strength. In Proceedings of the 27th Conference on Computer Communications, Phoenix, AZ, USA, 13–18 April 2008; pp. 2441–2449.
  29. Ficco, M.; Esposito, C.; Napolitano, A. Calibrating Indoor Positioning Systems with Low Efforts. IEEE Trans. Mob. Comput. 2014, 13, 737–751. [Google Scholar] [CrossRef]
  30. Chai, X.; Yang, Q. Reducing the Calibration Effort for Probabilistic Indoor Location Estimation. IEEE Trans. Mob. Comput. 2007, 6, 649–662. [Google Scholar] [CrossRef]
  31. Torres-Sospedra, J.; Montoliu, R.; Martinez-Uso, A.; Avariento, J.P. UJIIndoorLoc: A new Multi-building and Multi-floor Database for WLAN Fingerprint-based Indoor Localization Problems. In Proceedings of the International Conference on Indoor Positioning and Indoor Navigation (IPIN), Busan, Korea, 27–30 October 2014; pp. 261–270.
  32. Deng, Z.-A.; Hu, Y.; Yu, J.; Na, Z. Extended Kalman Filter for Real Time Indoor Localization by Fusing WiFi and Smartphone Inertial Sensors. Micromachines 2015, 6, 523–543. [Google Scholar] [CrossRef]
Figure 1. Multimodal distribution of RSS values at a fixed physical location.
Futureinternet 08 00008 g001
Figure 2. Overview of the proposed E-LFDA positioning method.
Futureinternet 08 00008 g002
Figure 3. Layout of reference and test points in realistic indoor environment.
Futureinternet 08 00008 g003
Figure 4. Positioning accuracy comparisons.
Futureinternet 08 00008 g004
Figure 5. Accuracy within 2 m versus feature dimensions.
Futureinternet 08 00008 g005
Figure 6. Cumulative percentage of eigenvalues versus feature dimensions.
Futureinternet 08 00008 g006
Figure 7. Accuracy within 2 m versus the number of training samples added per reference point by signal perturbation.
Futureinternet 08 00008 g007
Figure 8. Online computation cost comparisons (Calculation times of multiplications and additions).
Futureinternet 08 00008 g008
Table 1. Accuracy and Error Distance (m) comparisons.
MethodAccuracy within 2 mAccuracy within 3 mMean ErrorStandard DeviationMedian ErrorMaximum ErrorMinimum Error
E-LFDA75.2%86.1%1.561.321.395.130.03
LFDA68.8%80.2%1.821.731.575.380.05
LDA62.7%75.3%2.051.971.686.590.12
PCA60.1%73.6%2.192.011.726.440.09
WKNN54.8%67.4%2.542.641.917.580.24
MLE58.3%70.7%2.312.271.787.340.15
ANN56.4%69.2%2.432.521.878.250.07

