Article

AI-Enabled IoT-Based Hydroponic Farming with Embedded Automation and Nutrient Prediction

1
Department of Computer Engineering, COMSATS University Islamabad, Lahore Campus, Lahore 54000, Pakistan
2
Department of Electrical Engineering, COMSATS University Islamabad, Lahore Campus, Lahore 54000, Pakistan
3
Electronics Engineering Department, Universiti Kuala Lumpur British Malaysian Institute, Kuala Lumpur 53100, Malaysia
4
Department of Electrical and Computer Engineering, College of Engineering, Dhofar University, Salalah 211, Oman
5
Department of Mechatronics Engineering, College of Engineering, University Technology Bahrain, Salmabad 18041, Bahrain
*
Authors to whom correspondence should be addressed.
Future Internet 2026, 18(9), 446; https://doi.org/10.3390/fi18090446
Submission received: 29 July 2026 / Revised: 19 August 2026 / Accepted: 21 August 2026 / Published: 24 August 2026
(This article belongs to the Special Issue IoT Architecture Supported by Digital Twin: Challenges and Solutions)

Abstract

Environmental conditions have become more unstable; therefore, innovative and eco-friendly methods of food production are urgently required. Most existing hydroponic systems lack the capacity for real-time responses and decision-making based on integrated data, similar to contemporary farms. This document outlines the creation of an advanced hydroponic farming system that utilizes Internet of Things (IoT) sensors and a digital twin (DT) simulator to address these challenges. A completely monitored and continuously assessed hydroponic farming simulator operating on a Raspberry Pi, employing various sensors, data management and processing, and automated environmental regulation. The development of this intelligent hydroponic farming system employs a dual-model machine learning pipeline: one that identifies plant diseases through image analysis, and another that assesses plant nutrient levels based on sensor data. The data from the two models are combined using a cloud-based DT, enabling remote access to the DT and offering closed-loop control for irrigation, nutrient dosing, and management of all environmental factors related to crop growth in a hydroponic setting. This research showcases the capability to develop scalable, data-focused precision agriculture solutions that can adapt to the demands of today’s agricultural environment by combining all elements of IoT sensing, machine learning, and DT simulations into one functional hyperphysical system.

1. Introduction and Background

Controlled-environment agriculture is moving quickly toward distributed sensing, edge computing, and cloud analytics to reduce manual supervision. However, in practice, many hydroponic platforms treat sensing, vision-based plant health screening, cloud monitoring, and actuator control as separate modules that happen to sit next to each other rather than work together. This separation leaves a gap between collecting real-time data and actually closing the loop on decisions. This work addresses this gap by integrating multi-sensor hydroponic monitoring, RGB image-based disease screening, nutrient-status prediction, actuator control, and Digital Twin visualization within a single operational platform.
Meeting the nutritional needs of a growing global population is hardly easy, and the challenges are not helped by climate change, dwindling freshwater resources, or the gradual loss of arable land [1,2]. In urban areas, where space is limited and supply chains are extended, traditional farming has difficulty meeting demand. The solution that has emerged as more and more viable is controlled-environment agriculture (CEA): growers can control temperature, humidity, light, and nutrients, and thus grow food reliably and efficiently, irrespective of the outside climate [3,4]. Hydroponics sits at the center of CEA. Growing plants without soil reduces water consumption significantly and often yields better per square meter than conventional planting. But the problem is that most hydroponic systems continue using manual monitoring and static control rules, causing the systems to be slow to change when problems start [5,6]. With advancements in recent developments in the fields of IoT, AI, and cloud computing, it is now possible to develop systems that monitor themselves, predict issues, and intervene without human supervision [7,8,9].
Sensors for pH, electrical conductivity (EC), total dissolved solids (TDS), ultrasonic sensors, temperature, and humidity are already commercially available. Their data can be used to feed into machine learning models, enabling early detection of nutrient imbalances, optimization of fertigation timings, and identification of environmental anomalies [10,11]. On the vision side, deep learning has enabled rapid and accurate automatic disease diagnosis of leaf images [12,13,14]. The Digital Twin adds to this by keeping a current virtual model of the physical system. The real environment is simulated, and operators can run trials on a virtual plant prior to implementation on their own crop [15,16,17]. All these developments at the individual level, however, do not make a system that integrates sensing, prediction, visualization, and actuation under a single roof commonplace [4,18]. This paper introduces Hydro Grow, a hydroponic farming system, which combines two different types of AI models, IoT sensors, and an Azure-supported Digital Twin in a functional cyber-physical system. The details of the specific contribution are given below.
  • A dual-stream AI pipeline with computer vision and inference extracted from the sensors.
  • MobileNetV2 for plant disease classification and a decision tree for nutrient deficiency prediction.
  • Cloud-synchronized digital twin with Microsoft Azure Digital Twins for real-time monitoring.
  • Closed-loop actuator control (pumps, dozers, ventilation) with all control based on sensor data.
  • An inbuilt AI chatbot for handling client queries was integrated with a web-based monitoring dashboard.
Most early hydroponic systems were manually operated. Nutrient and pH levels had to be manually analyzed and adjusted, and early automated systems used mechanical timers and simple pumps. These instruments made the work easier but did not add any intelligence to the process, as they operated on a timetable regardless of the conditions in the reservoir. Microcontroller-based systems allow for simple feedback, irrigation, and nutrient timing. They are less reliable than timers but still fundamentally reactive; they might be able to obtain a signal when a threshold is crossed, but they would not be able to predict when a crossing is likely to occur or why it is occurring. This resulted in their being sufficient only for small, stable systems and unsuitable for more complex systems [19]. IoT has transformed the landscape by making it possible and affordable to continuously monitor multiple parameters [1,20]. Today, grain growers have far greater real-time access to information about what is happening with their distributed sensor networks. Thus, there is another big space—intelligent interpretation of that data, and that is where the technology lies. Most deployed systems are still rule-based (hard-coded) and have not yet learned models, which means that they cannot adapt to unknown environments or optimize their behavior over time [21,22].
The remainder of this paper is organized as follows: Section 2 reviews the relevant prior work. Section 3 covers system modeling and simulation. Section 4 discusses the implementation of hardware and software. Section 5 presents the evaluation of the model’s performance. Section 6 provides a comparison of Hydro Grow with other systems. Section 7 represents the results and discussion, the conclusion is provided in Section 8.

2. Related Work

IoT-based monitoring has become standard in commercial and research hydroponic systems, and monitoring using the Internet of Things (IoT) is becoming commonplace. Platforms based on ESP32 microcontroller electronics have been shown to provide well-defined advantages for nutrient management and decrease manual nutrient monitoring [9,23,24,25]. These systems have great functionality within their design specifications but come to a halt when the conditions change outside of the designer’s expectations [6,21]. Machine learning has been used in hydroponics primarily for predictive operations such as predicting water demand, nutrient uptake, and alerting if the operations fall out of the range [10,22,26]. Structured sensor data have been used to demonstrate a high level of accuracy using decision trees and other hybrid supervised methods [10,11]. The problem, however, is that most of these models are trained separately and then applied. They are not updated as the crop and environment change and do not provide feedback to actuation systems [27]. Plant health assessment using computer vision has come a long way. CNN architectures are well-suited to reliably classify diseases from leaf images, for example, MobileNet variants, ResNet, and other lightweight architectures, and transfer learning from ImageNet weights significantly reduces the amount of data required [14,28,29,30,31]. However, there are complications when using the vision system in the real world; lighting, leaf overlap, and other background clutter can all reduce accuracy in field conditions, which is why the use of sensor-based confirmation makes a good design choice. Table 1 summarizes the gaps identified in each of these research threads.
The literature has considered digital twin applications in hydroponic and aquaponic systems, with some platforms moving towards complete robot integration, such as DigiHortiRobot [16,17,32,33]. It is still a challenge to achieve real-time synchronization between physical and virtual environments, and the communication overhead can be substantial. Nevertheless, the idea is intriguing: having a well-maintained twin system that allows the operator to test interventions in a virtual environment before deploying them in the actual system.

2.1. Smart and Automated Hydroponic Systems

Transitioning from manual scheduling to sensor-based control has been a gradual process. Most early systems used presets without feedback, and later started to implement feedback based on sensor data using ESP32 microcontrollers [19,24]. Despite this, many implementations rely on hard-coded thresholds and fall short in regions where the environmental conditions fall outside the threshold ranges for which they are calibrated [21,25]. Awal et al. [23] created a house-type hydroponic system for Bangladesh that measures various parameters in real-time without making any prediction, nor do they integrate it with a cloud.

2.2. AI and Machine Learning for Hydroponics

Nutrient concentration prediction and finding optimum growth conditions have been predicted with reasonable success using random forest, linear regression, and hybrid AI methods [11,26]. Rahman et al. [26] developed an IoT system that integrates crop recommendation and nutrient monitoring, demonstrating the potential of IoT systems when using real sensor data as input for ML. The models adopted in the vision part are MobileNet-family models and VGG variants, which have been proven to be well suited for edge deployment due to their small size and efficiency [14,28,30]. Labeled hydroponic datasets are small, and transfer learning from ImageNet can be used in these cases [29,31]. The common challenge in all this work is how to link these models to the actuation layer. Most systems produce a prediction and then call it a day and leave it up to the human to decide on the next action to take [22,27]. Recent agricultural vision research is moving beyond image-level classification toward fine-grained segmentation and multimodal reasoning; Yang et al. proposed PestScope, an exclusion-aware large multimodal model for fine-grained agricultural pest segmentation, showing that agricultural diagnosis benefits from models that can localize visually similar stress or pest patterns [34]. The present work instead adopts MobileNetV2 for lightweight image-level disease screening on the Raspberry Pi 4B, prioritizing edge deployability over pixel-level segmentation. Feature-fusion strategies have also shown value in other sensor-driven automation tasks: Wang et al. improved seam extraction for teachless welding robots using a multichannel feature-fusion network, demonstrating that combining complementary visual features can improve perception reliability under challenging imaging conditions [35]. This supports the design choice of combining visual plant-health screening with sensor-based nutrient inference rather than relying on a single sensing stream.
Taken together, the shortfall in the literature is not a lack of sensors or models. Recent hydroponic systems increasingly combine IoT monitoring with cloud dashboards; however, most still rely on threshold-based actuation or evaluate machine learning models separately from the control layer. What is missing is an experimental validation of a unified architecture in which sensing, edge inference, cloud synchronization, visualization, and actuator response are tested together as one closed-loop system, rather than as components verified in isolation. Hybrid CNN-Transformer architectures have also been applied to high-resolution agricultural remote-sensing tasks; for example, Xie et al. used a boundary-guided CNN-Transformer network for cropland parcel mapping, reflecting the wider movement toward hybrid visual architectures in agricultural image interpretation [36]. However, such models are computationally heavier than MobileNetV2 and less suitable for the Raspberry Pi-based edge deployment targeted in this work.

3. Materials and Methods

3.1. Conceptual Framework

In this system, the physical growing system employed is deep water culture (DWC), in which the root system hangs in the solution, and the solution is supplied with oxygen and nutrients [1,5]. Water moves and is oxygenated by an air pump, and stagnant water results in anaerobic conditions that adversely affect the roots and yield. DWC is a suitable application for an automated system because of the relatively low changes in the system chemistry, allowing the sensor to settle before the actuator reacts to the change in the water quality. It consists of five layers: real-time IoT monitoring, edge AI inference, cloud-based analytics, digital twin synchronization, and a human-supervised web interface [7,15,17]. These layers are loosely coupled, such that a drop to the cloud does not eliminate the use of local sensing or edge inference. Five sensors were used to measure the important environmental variables. The pH sensor determines the acidity of the nutrient solution, which directly influences mineral absorption [10,25]. The total dissolved mineral concentration was measured using an EC/TDS sensor. The DHT22 is a sensor that measures the temperature and air humidity around the plant canopy of a tree. The water level of the reservoir was monitored using an ultrasonic sensor. Images of the leaves were captured using a Raspberry Pi Camera Module V2 for visual disease screening [12,14].

3.2. Four-Layer System Architecture

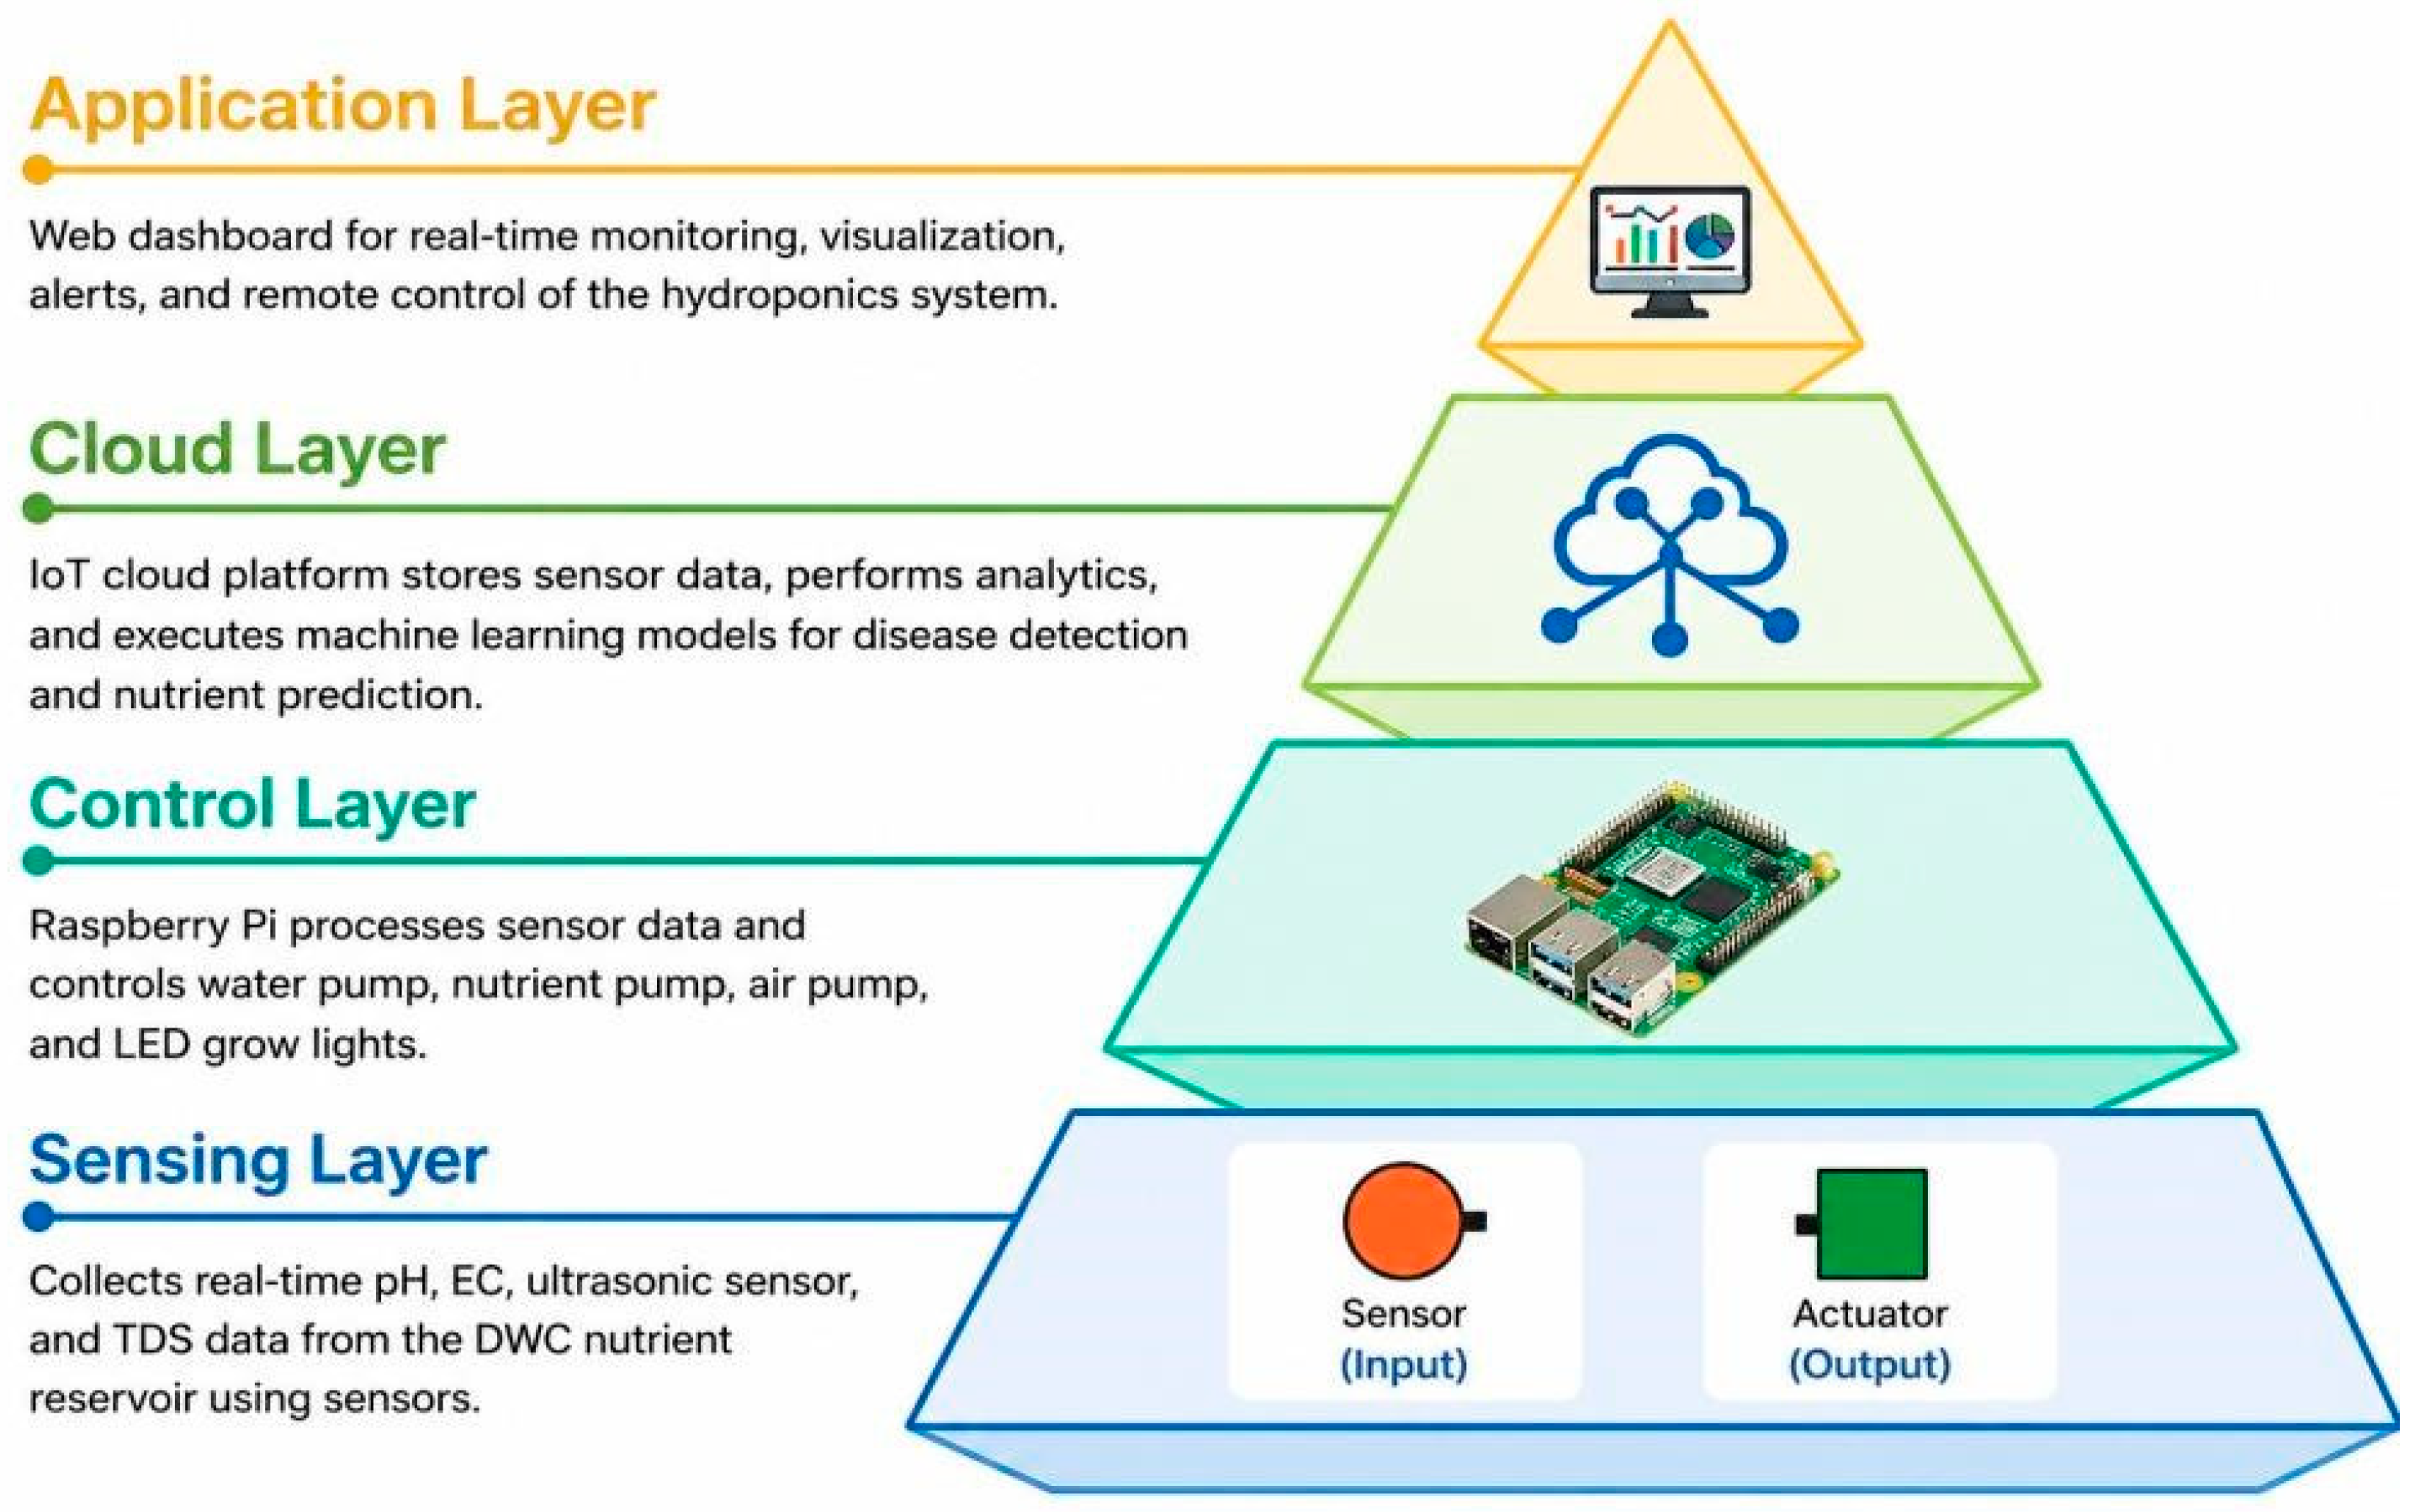
The main architecture is a four-layer pyramid to separate sensing, edge control, cloud services, and user-facing applications, as presented in Figure 1. These concerns should be kept separate to allow the system to be debugged, updated, and scaled without redesign [7,8]. The sensing layer is a data-collection layer. Analog sensors are connected to the ADC circuits on the Raspberry Pi 4B, and digital sensors are connected through I2C or GPIO. No analysis is performed here.
The control layer is installed on the Raspberry Pi 4B. It receives sensor data, checks against target ranges, and activates the relay-controlled actuators, which include the water pump, nutrient dispensers, and LED grow lights when deviations appear. The system includes the sensing layer (pH, EC, and ultrasonic imaging), control layer (logical controller, microcontroller, supervisory control, and AI controller), processing layer (cloud server, AI services, AI services control, and artificial intelligence unit), and user layer (mobile application). Microsoft Azure is used in the cloud layer. Azure IoT Hub receives telemetry via MQTT and can store it, infer it using AI, and update it with the Digital Twin.
Azure maintains a live virtual representation of the hydroponic system, which can be used to simulate and test scenarios without direct interaction with the physical system [15,17,32]. Everything is exposed to users via a React web dashboard in the application layer. A Unity 3D module offers a spatial view and interaction with the digital twin, and an AI chatbot answers plain-language queries on the system status and crop health [16,27]. Table 2 lists the operating specifications and target ranges for each sensor.

3.3. System Operational Flow

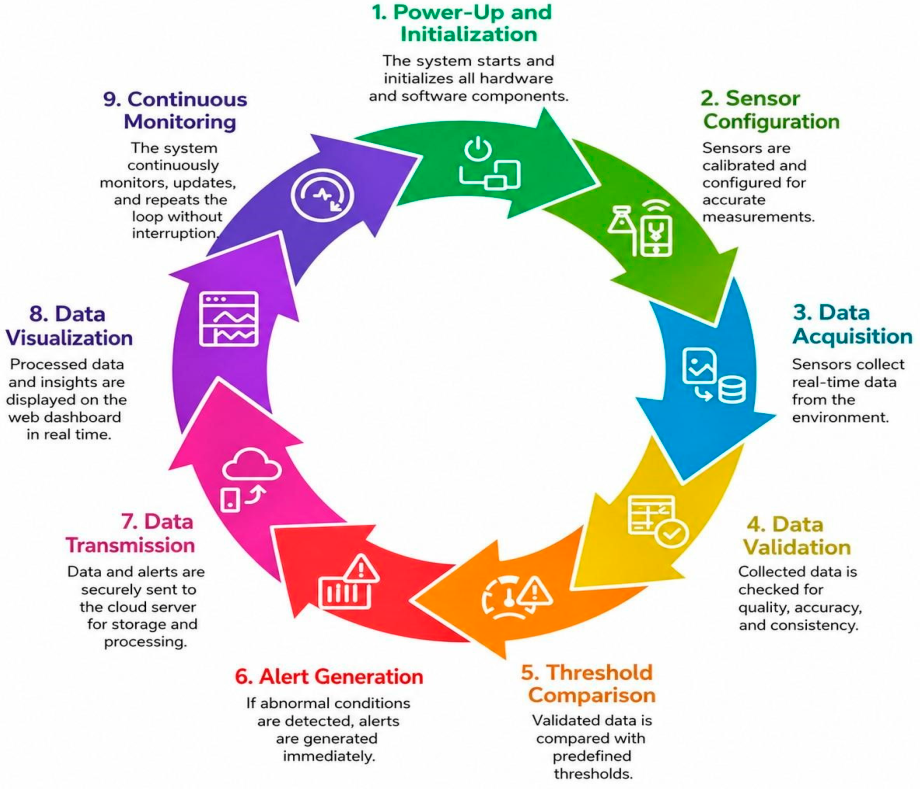
The end-to-end workflow is a continuous eight-stage loop, as shown in Figure 2. The system autonomously initiates the next cycle as soon as the current one ends [6,20].
The system includes initialization, sensor configuration, data acquisition, data validation, threshold comparison, alert generation, data transmission, data visualization, and a continuous monitoring (feedback) loop that restarts the cycle for autonomous operation. All components start in turn, and at start-up, a self-test is performed to ensure that all sensors and relay outputs are working. The sensor configuration calibrates the pH sensor with buffers at pH 4.0, 7.0, and 10.0. EC and DHT22 calibrations follow. Data Acquisition reads all the sensor streams concurrently at their respective sample rates. The circular operational workflow of the proposed system comprises eight sequential stages: power-up and initialization, sensor configuration, data acquisition, data validation, threshold comparison, alert generation, data transmission, and data visualization, with a continuous monitoring feedback loop that restarts the cycle for uninterrupted autonomous operation. Each reading then goes through data validation to ensure that it falls within the acceptable limits and is not passed downstream to affect logic until it has been verified as being within the acceptable range. Threshold comparison validates data regarding agronomic targets. Violation(s) propagates to Alert Generation, which determines the severity and sends a notification to operators. The data transmission formats sensor data, inference results, and actuator states into the JSON telemetry message and pushes it to Azure IoT Hub via TLS 1.2 over MQTT. Data visualization updates the dashboard, and continuous monitoring restarts the loop.

4. Proposed System Architecture and Implementation

4.1. Subsystem Design Overview

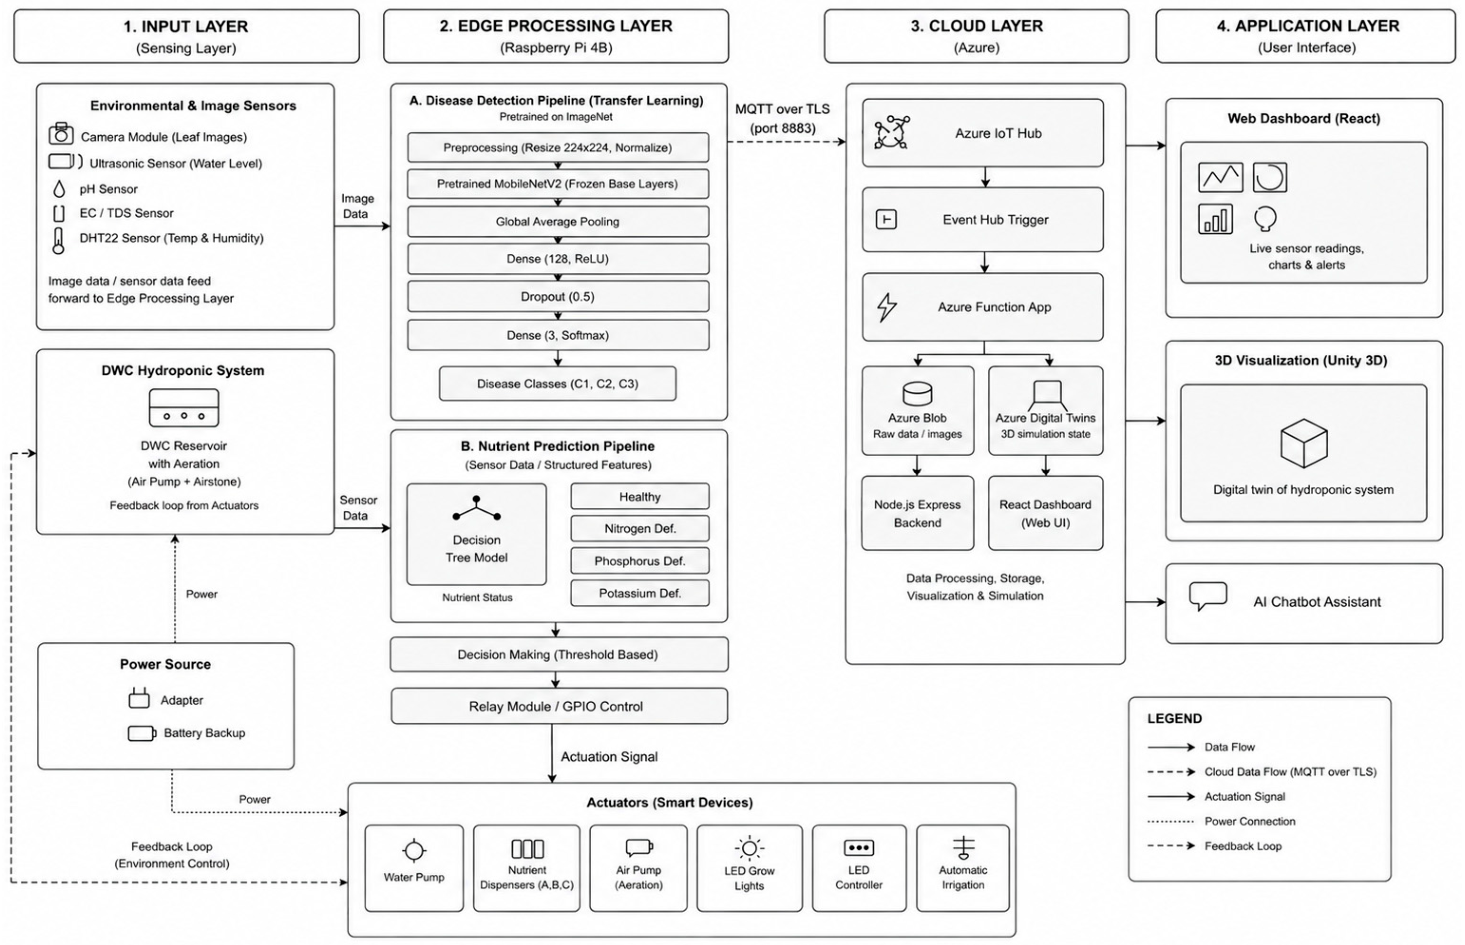
The implementation is divided into five different subsystems. Functional separation allows each component to be developed, tested, or replaced without affecting the other components of the system [8,19]. The complete interconnection is illustrated in Figure 3.
Layer 1 (Input/Sensing): Cameras, ultrasonic sensors, and other image sensors, pH sensors, EC/TDS sensors, and DHT22 sensors are installed on the DWC reservoir. Layer 2 (Edge Processing—Raspberry Pi 4B), MobileNetV2 disease detection and decision tree nutrient classification with threshold-based relay actuation. Layer 3 (Cloud—Azure), MQTT over TLS to Azure IoT Hub, Event Hub, Blob Storage, and Digital Twins. Layer 4 (Application): React dashboard, Unity 3D simulation, and AI chatbot for monitoring and control. Arrows represent the data flow, actuation signals, and closed-loop feedback.

4.2. DWC Hydroponic Subsystem

The 10 L opaque reservoir has four net pots evenly spaced throughout. The cylindrical air stone produced fine-bubble aeration to maintain sufficient dissolved oxygen (DO) levels (above 5 mg/L) for good root respiration [1,5]. The nutrient mix consisted of three parts: nutrient A (nitrogen, potassium, and calcium), nutrient B (phosphorus, magnesium, and trace elements), and a CalMag supplement. To achieve maximum nutrient availability, the solution was maintained at a pH range of 5.5–6.5 and an EC of 1.2–2.4 mS/cm. The container should be opaque to light to prevent algae growth, which will compete with the roots for dissolved nutrients and oxygen [6,10].

4.3. Sensor Subsystem

The pH sensor is based on a glass electrode and a signal-conditioning amplifier and produces an analog voltage that is proportional to the activity of the hydrogen ions, with an accuracy of ±0.1 pH. AC-excited two-electrode conductivity measurement with built-in temperature compensation is used in the EC/TDS sensor. The DHT22 is a single-wire, serial, calibrated digital temperature and humidity sensor. The depth of the reservoir is measured without contact with the water surface by an ultrasonic sensor that operates at 40 kHz and is accurate to the millimeter. The 8-megapixel JPEG images captured by the Camera Module V2 have automatic exposure and white balancing, so the images provide consistent inputs to the disease detection pipeline [12,14,30].

4.4. Circuit and Hardware Interface

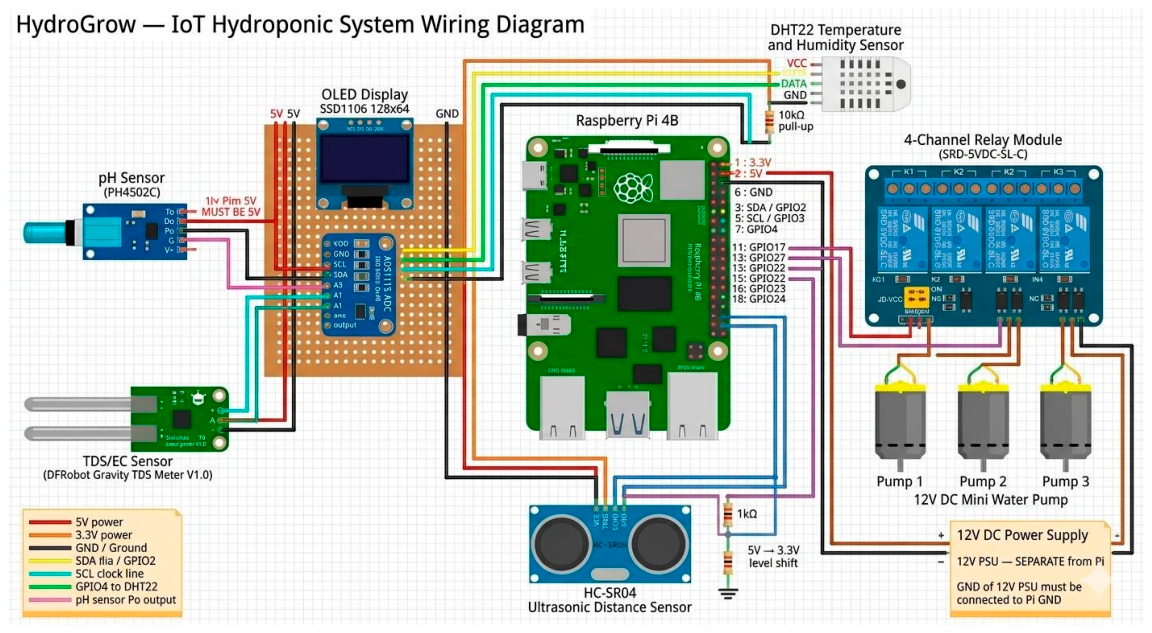
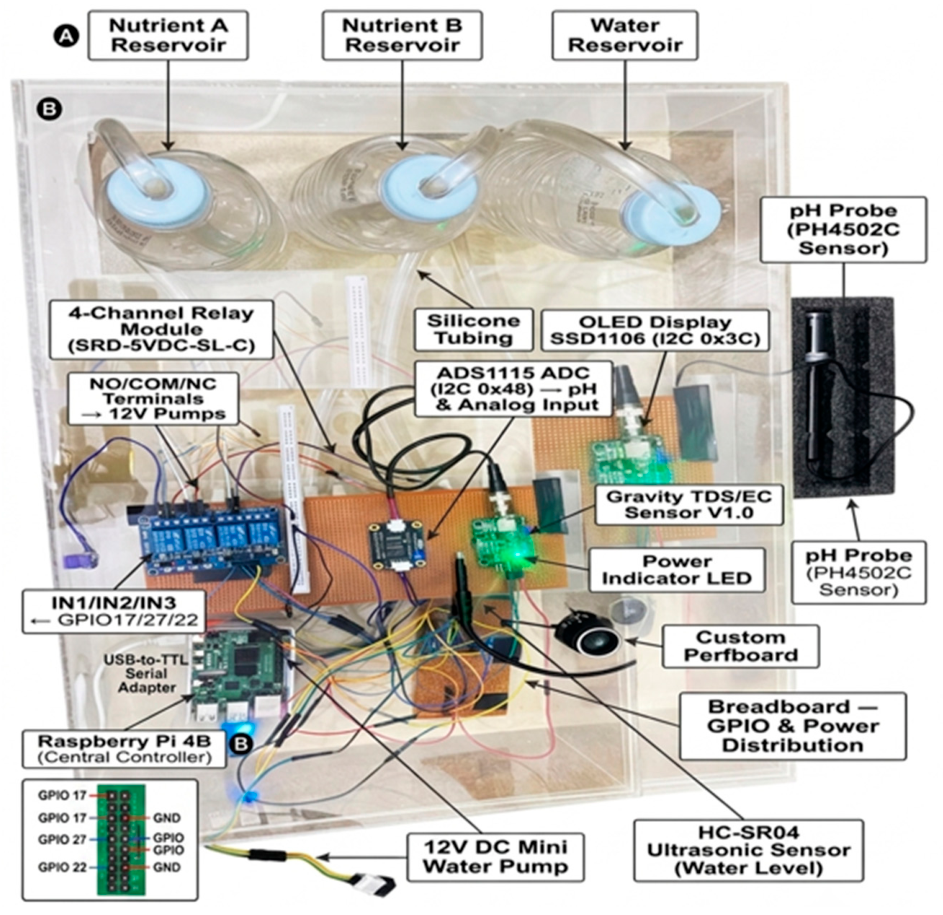
The hardware wiring is shown in Figure 4, and an assembled unit is shown in Figure 5.
Figure 4 illustrates the hardware connections of the proposed hydroponic monitoring and control system. The Raspberry Pi 4B was used as the central processing unit, which communicated with the pH (PH4502C), EC/TDS (DFRobot), DHT22 temperature and humidity sensors, and the HC-SR04 ultrasonic water level sensor. Analog sensors, such as pH and EC/TDS, were connected to the I2C bus through the analog-to-digital converter (ADC ADS1115), and the DHT22 and HC-SR04 sensors were connected to the GPIO pins of the Raspberry Pi. A four-channel active-LOW relay module was used to control three peristaltic pumps (Nutrient A, Nutrient B, and water) and was powered by a separate 12 V DC power supply with a common ground connected to the Raspberry Pi. Real-time monitoring of the system parameters was performed using an SSD1106 OLED display via I2C.
The prototype assembly was made of a Raspberry Pi 4B microcontroller, a bunch of sensors and actuators on a custom perfboard and breadboard for GPIO and power connections. The Raspberry Pi controls three 12 V DC mini water pumps, one for each of the inverted reservoirs for nutrients A and B and water, respectively.

4.5. Processing and Inference Subsystem

The MobileNetV2 disease classification model was fine-tuned on a hydroponic leaf image dataset with a few labels [14,29,31] using ImageNet-pretrained weights. It has competitive accuracy using a fraction of the compute of a deeper network because of its inverted residual blocks and linear bottlenecks, which are critical when performing inference on a Raspberry Pi 4B. Each leaf image was classified as either healthy, bacterial blight, or septoria blight disease. The decision tree nutrient prediction model is an ensemble of 200 decision trees trained on a feature matrix that includes pH, EC, solution temperature, ambient humidity, water level, and treatment level, as well as first-order temporal derivatives calculated over a sliding window of time. Decision trees were selected because of their good generalization ability in tabular sensor data, the fact that they do not require special treatment if the data includes correlated features, and their ability to provide feedback on feature importance that provides interpretable diagnostic information [10,22]. Both models start up and execute in separate threads without blocking each other.

4.6. Nutrient Solution and Composition

A commercial nutrient solution of Nutrient A, Nutrient B, and CalMag is being utilized via the hydroponic system. The formulation contains nutrients, which, based on the data provided by the suppliers, are the main nutrients needed for plant growth in hydroponics, namely nitrogen (N), phosphorus (P), potassium (K), calcium (Ca), magnesium (Mg), and trace elements. Nutrient A is the main macronutrient source, and Nutrient B is the source of complementary nutrients and micronutrients, and calcium and magnesium are supplemented in the form of CalMag. The selected formulation has been supplied by the manufacturer(s) providing the information, but the manufacturer(s) do not indicate the specific chemical compounds or the concentration of each of the nutrients.

4.7. Cloud Communication Subsystem

The Raspberry Pi 4B uses the Azure IoT SDK over MQTT, TLS 1.2, port 8883, and device certificate authentication to connect to Azure IoT Hub. These telemetry packets are JSON objects that include sensor readings, actuator states, and AI inferences that are sent at a regular interval. On the cloud, the incoming stream is directed to an Event Hub Trigger that is responsible for triggering an Azure Function App. The Function App places the raw logs and image data in Azure Blob Storage for long-term storage and pushes state updates to Azure Digital Twins to keep the virtual model up to date [16,32,37].

4.8. Digital Twin Modeling and State Synchronization

The proposed hydroponic system uses Microsoft Azure Digital Twins to ensure that the physical hydroponic environment is represented in the cloud.
The data from the sensors on the Raspberry Pi are sent to Azure IoT Hub via MQTT communication. The telemetry received from Azure IoT Hub and relevant AI prediction results are then used to update the properties of the digital twin. The virtual representation is updated with each telemetry update received, thus providing a representation of the current operating state of the physical hydroponic system. This cloud-based sync allows for the real-time monitoring of important system parameters and the visualization and analysis of the representation of the physical system in the virtual environment. In the current implementation, the communication pathway is from the physical system to the cloud. The Digital Twin Definition Language (DTDL) [15,32], a JSON-LD compatible modeling language, is used to define the semantic structure of the digital twin for the description of system entities, their properties, and relationships. Key elements in the hydroponic system, such as the water tank, plant units, and environmental elements, are defined. These entities are associated together in terms of semantic relationships, allowing them to correctly describe the structural organization and operational behavior of the system. The feed relationship describes an entity-to-entity association in which the nutrient solution is passed from the water tank to plant entities, whereas LocatedIn defines the spatial hierarchy of the entities in the system. These relationships are all part of the model graph, the hydroponic system ontology within Azure Digital Twins.
Digital twin instances representing physical assets, such as WaterTank1 and individual plant twins, are created as the runtime implementation of the semantics of the model. Twin functions with continuous operation synchronization properties, including water level, pH, and electrical conductivity (EC), which are updated whenever new telemetry from the physical system is received.
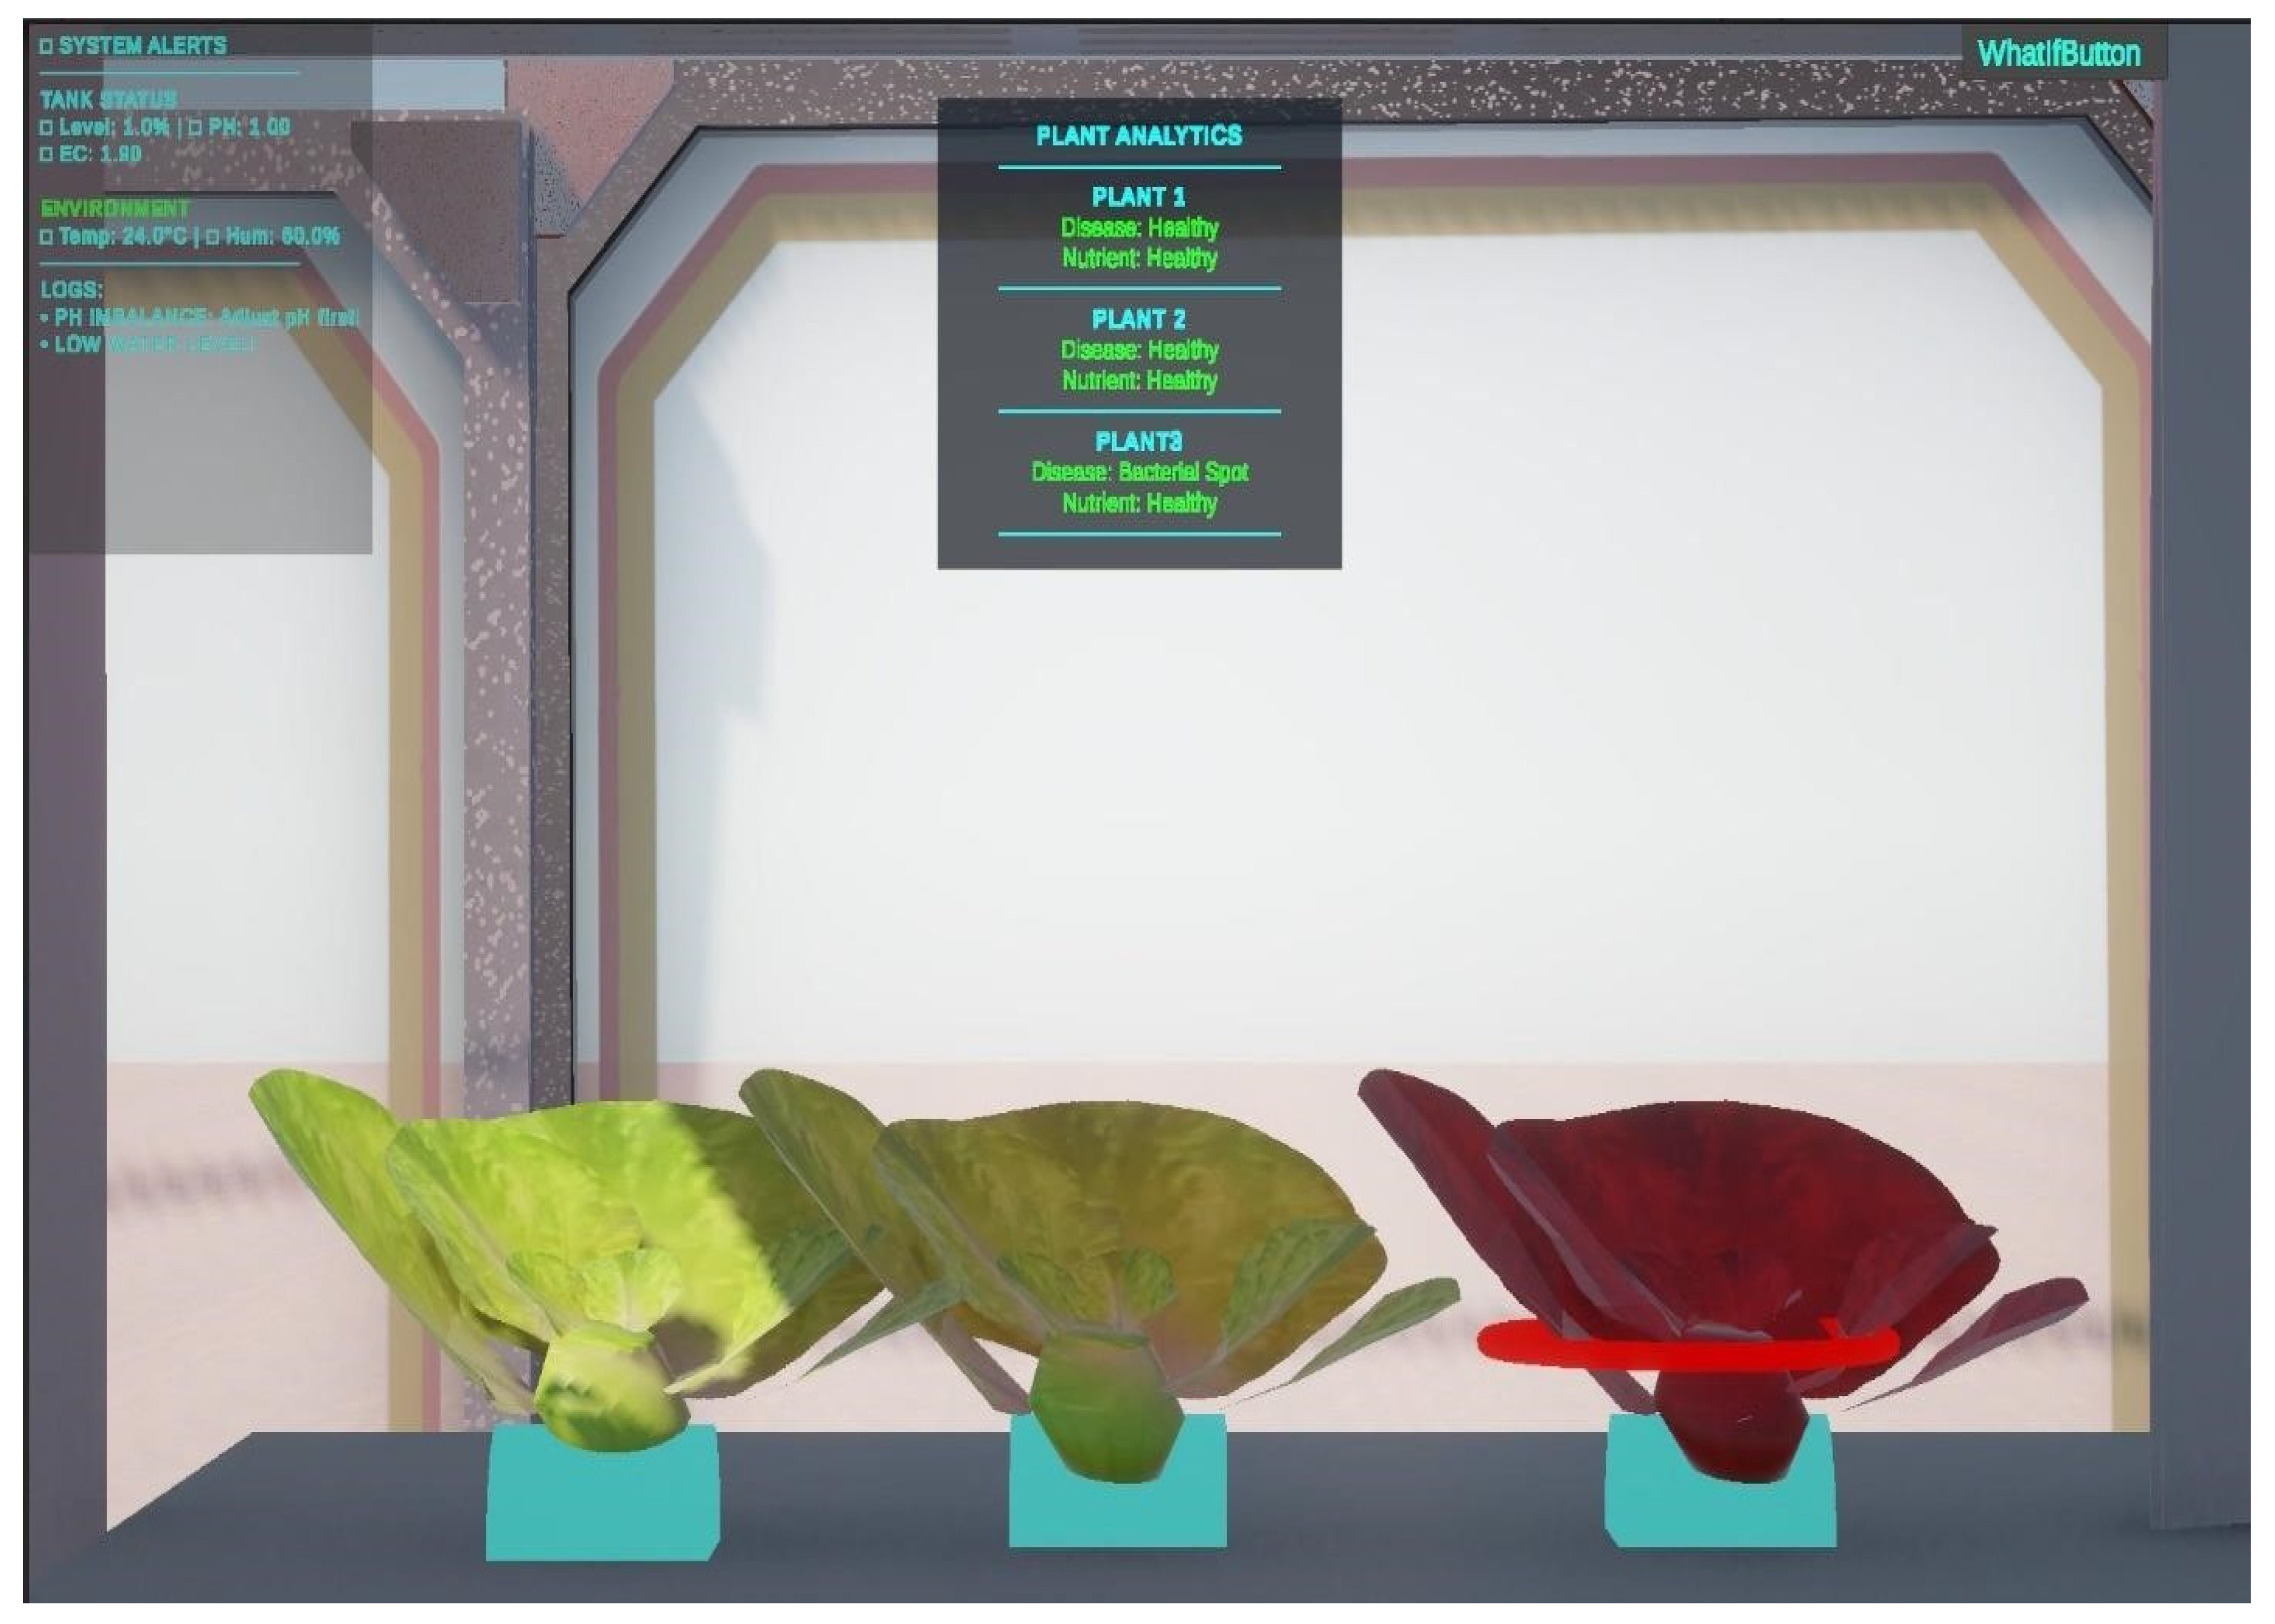
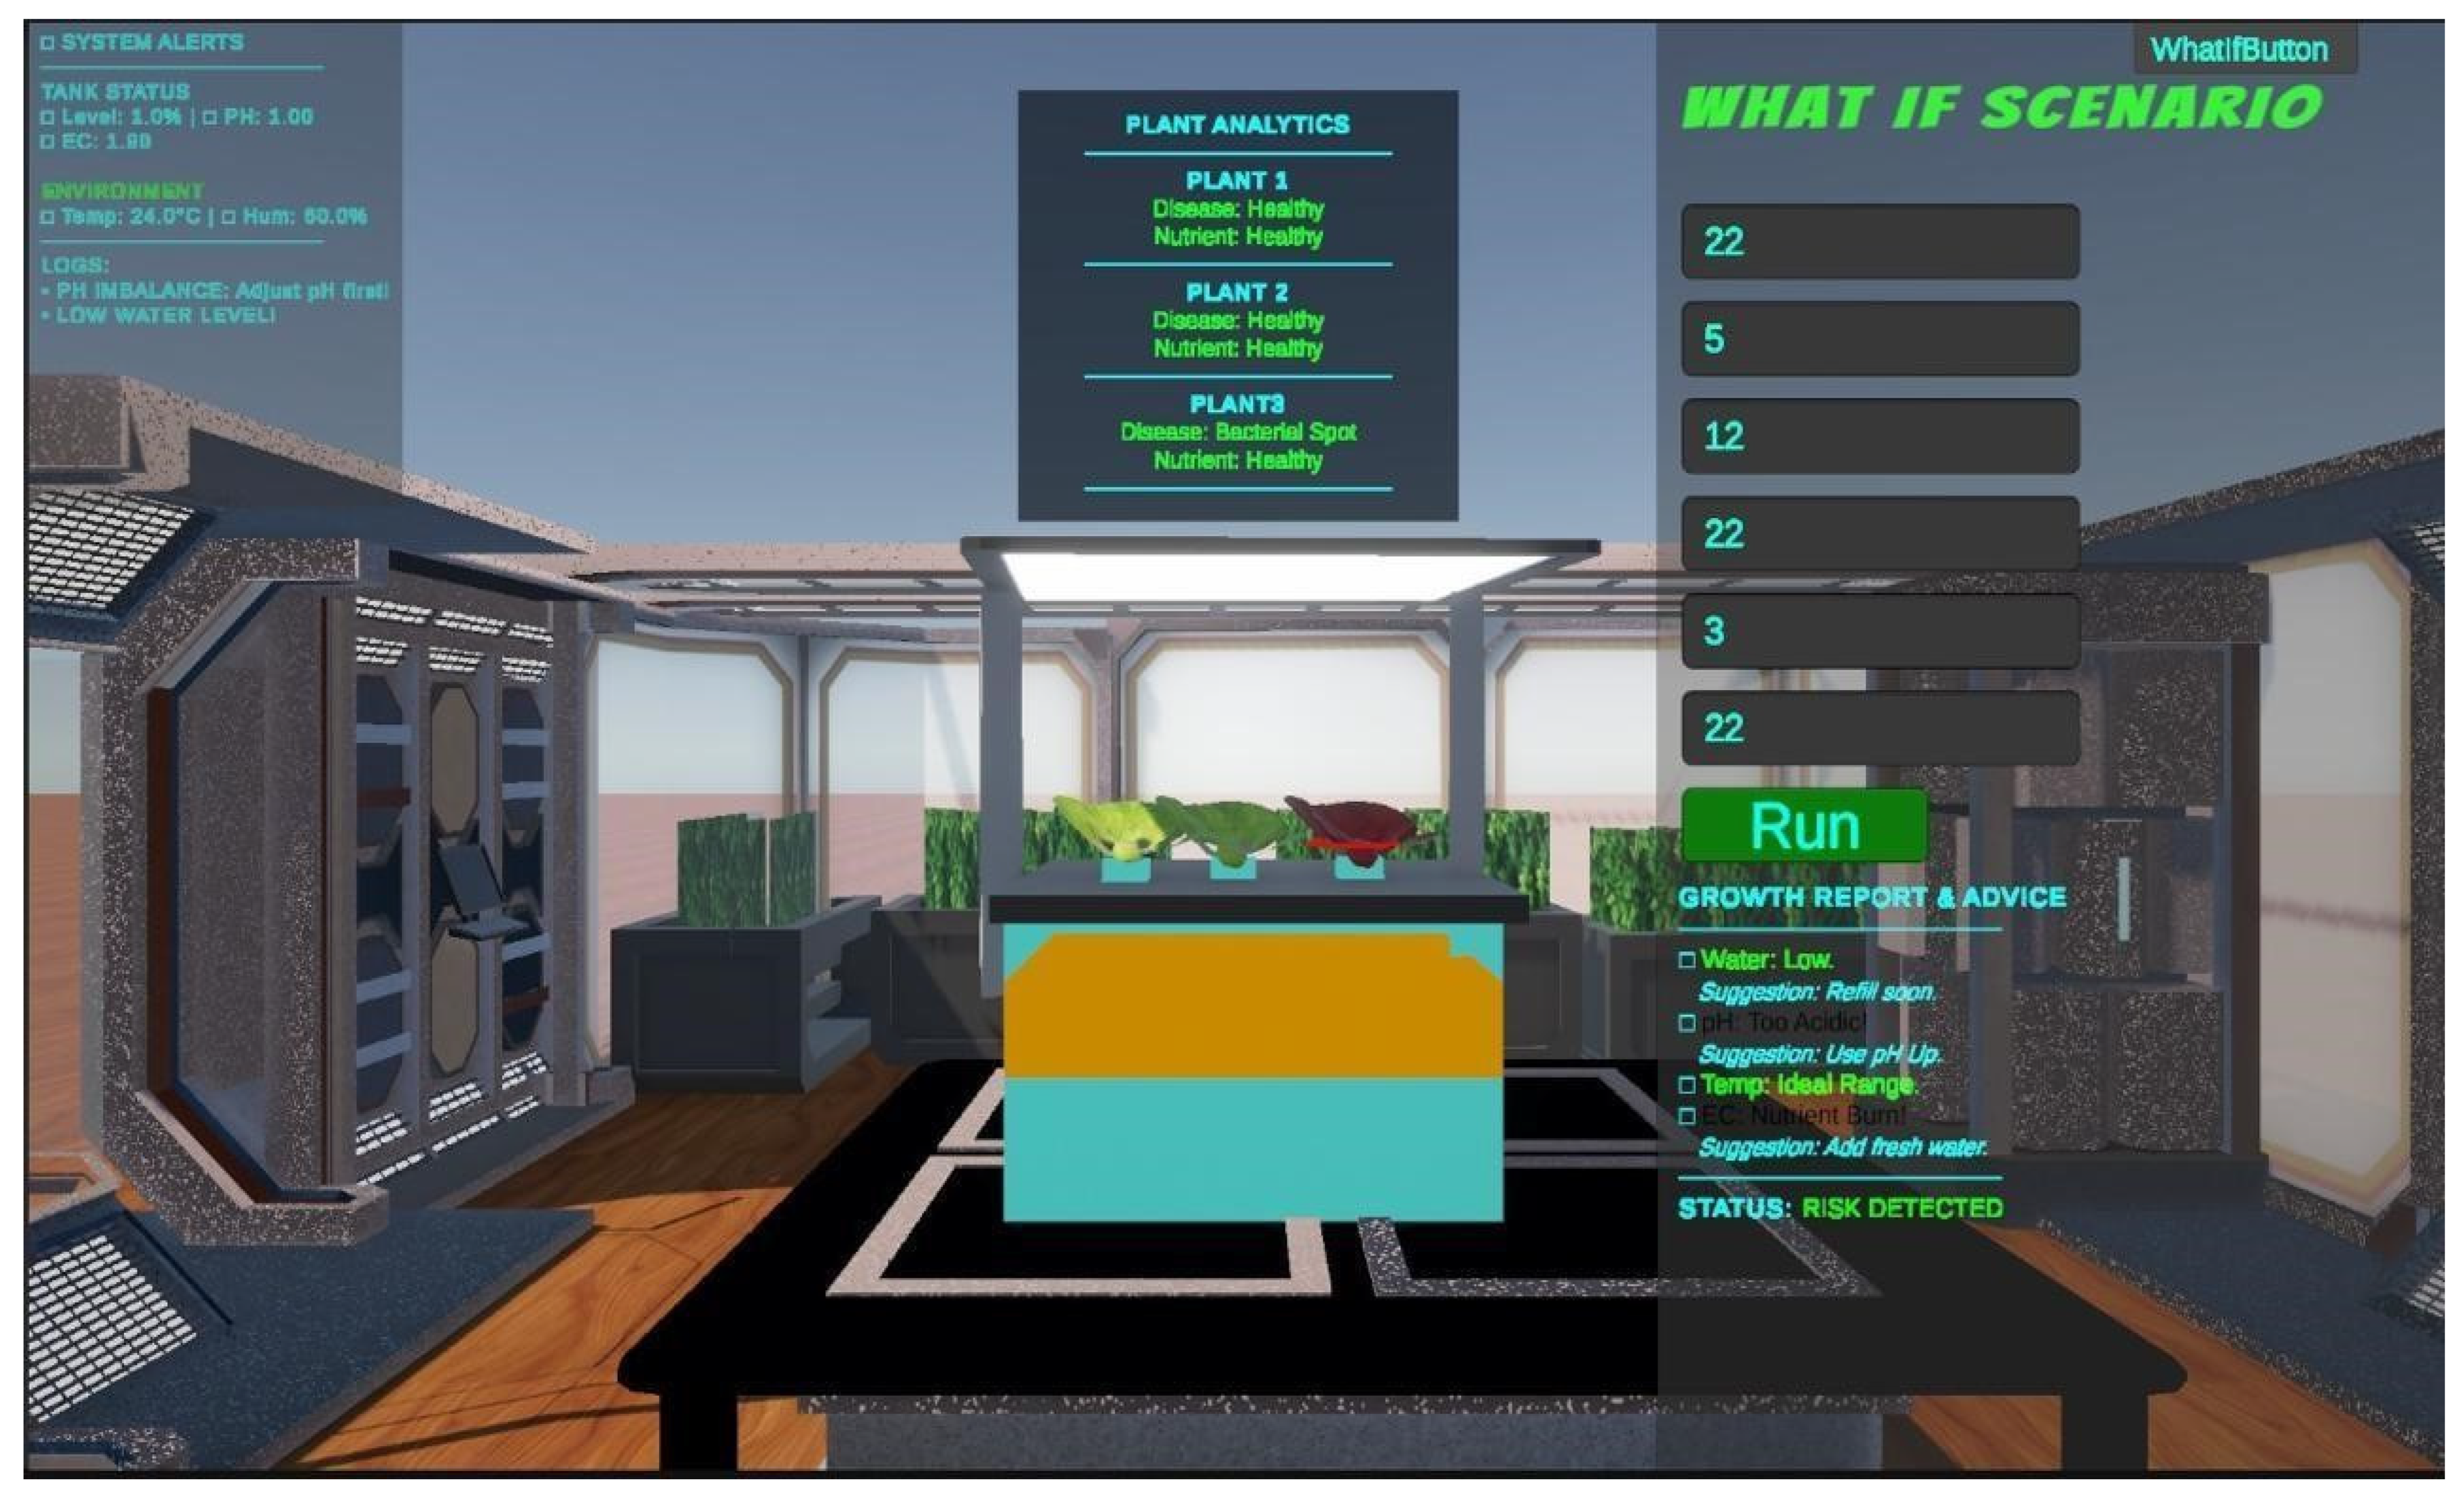
This synchronization allows synchronization between the physical and digital worlds by providing a representative runtime model of the hydroponic system. This means that the digital twin is the basis for the entire real-time monitoring, visualization of the system’s state, and intelligent decision-making during system operation. The twin state is polled by REST from a Unity 3D interface, which displays the state as color-coded health indicators (Figure 6). A “What-If Scenario panel is provided, which allows operators to set arbitrary sensor values and simulate a growth analysis without impacting the actual system (Figure 7) [15,33]. The real-time plant analytics for three plants: healthy plants (Plant 1 and Plant 2), and a diseased plant (Bacterial Spot) (Plant 3). The left panel displays system alerts, such as pH imbalance warnings and low water level alerts. The green color indicates healthy plants, and the deep red color indicates diseased plants. The “What-If Scenario” interface in Unity 3D digital twin. The panel on the right is used to input parameters (temperature, humidity, EC, pH, and water level) into the system, and after pressing the Run button, a simulated growth analysis is performed. Finally, the Growth Report provides a diagnosis and recommendations for each parameter, including low water level, acidic pH, and high EC, which indicates an overall risk detection. As models of the plants are updated based on health status, the 3D models are also updated to the appropriate color, with Plant 3 being rendered in red to represent the presence of bacterial spot disease, and system alerts on the left-hand panel log the alerts in real-time as they arise.

4.9. Application and Visualization Subsystem

The web dashboard was created using React coupled with an Express server that communicates with Azure services.
It shows real-time sensor data, disease classification results, nutrient status, actuator states, and manual override capabilities [12,38]. Trend plots and performance summaries were populated with historical data retrieved from Azure Blob Storage. Unity 3D produces a replica that appears similar to the real thing in real time. An AI chatbot enables the user to pose natural language questions and receive context-aware responses that are retrieved from the back end. Table 3 summarizes the hardware choices and the reasoning behind each.

4.10. Simulation and Validation

Prior to full-scale deployment, each failure mode was individually tested by forcing sensor readings over their entire range of operation [19,21]. If EC fell below 1.2 mS/cm, the nutrient dosing pump turned on in the next sampling cycle and restored the EC in 2 min.
Base dosing has been induced by lowering the pH to 4.8, and the solution is returned to pH 5.8 in less than 90 s. Ventilation is triggered, and a dashboard alert has been displayed when simulated temperatures exceeded 30 °C. The ultrasonic sensor was found to be reliable for detecting critical depths and activating the necessary safeguards in low-level reservoir testing. On a held-out dataset of images, MobileNetV2 achieved good accuracy, with a full evaluation of all images reported in Section 5. Azure Digital Twin state updates were always propagated within 5 s, establishing viability for real-time supervision [17,35]. Table 4 summarizes the outcomes.

5. Models and Performance Evaluation

Hydro Grow’s AI is a combination of two complementary models that are run concurrently. One is a process that takes leaf images, and the other is a process that takes numerical sensor readings. Both are intentional: diseases may result in visible symptoms on leaves before chemical changes, and early nutrient imbalance conditions may be easily identified from chemical data but not from visual symptoms [11,12,14].

5.1. Digital Twin Integration and System Functionality

The Azure Digital Twin receives updates from the sensors and from the actuators, along with predictions generated by the model, to maintain a synchronized representation of the physical hydroponic system. It builds an interface for Unity 3D, which spatially visualizes the states of the pumps, the plant, and the environment, allowing real-time monitoring of the physical system due to the virtual image of the plant [15,17,32,33,34,35]. This integration provides an interconnected digital model of the Hydro Grow system, where physical system data is connected to the virtual system environment [15,33,37].

5.2. Plant Disease Detection

5.2.1. Dataset

There are three classes related to the disease: healthy, bacterial infection, and septoria blight. Photos were obtained from public plant disease repositories and from photos taken in the field, and were labeled manually. All images were resized, normalized, rotated, flipped, and zoomed before training. The dataset was split in the ratio of 80:20, 80% of which was used to train the model, and 20% was held back to assess the performance and generalizability of the model.

5.2.2. Model Implementation

MobileNetV2 was chosen because of its good performance per compute, which enables it to be used for real-time edge inference on the Raspberry Pi 4B [14,29,31]. The pre-trained weights from the ImageNet dataset were selected as the initial weights and fine-tuned using the hydroponic leaf dataset. A trained model was stored in the HDF5 (h5) format and loaded at boot time for on-device inference.

5.2.3. Performance Evaluation

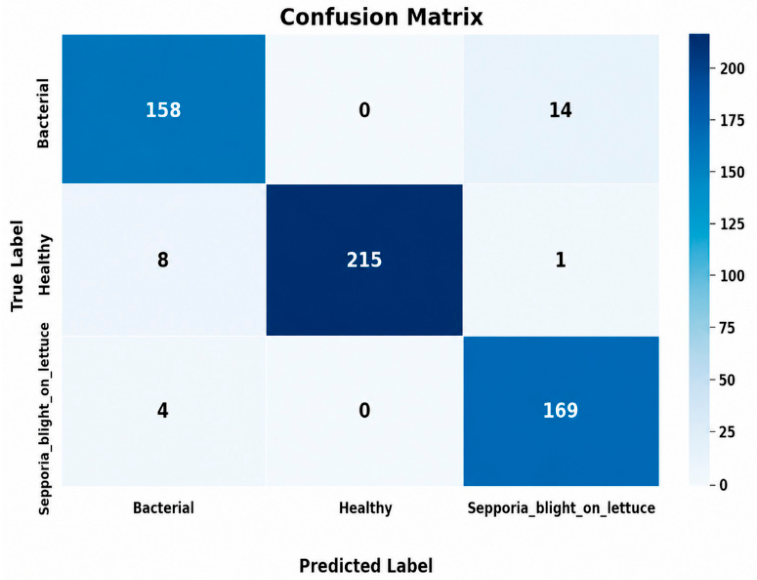
Table 5 shows the overall results, and a class-wise breakdown is presented in Table 6. Healthy class achieved perfect precision but not perfect recall, indicating that all samples predicted as Healthy are correct, while a small number of true Healthy samples were assigned to disease classes. Early lesions of bacterial infection and septoria blight are sometimes confused, which is not surprising because these two infections are quite similar.

5.2.4. Confusion Matrix Analysis

The confusion matrix (Figure 8) reveals a high diagonal, indicating high classification rates, with only a few misclassifications between bacterial infection and septoria blight, the two diseases having similar early symptoms [14,29]. The model is overall well-generalized and sufficiently fast to run in real time.
The confusion matrix with three classes—bacterial infection, healthy, and septoria blight—is shown in Figure 8. The high diagonal values confirm high accuracy, and the small off-diagonal values between Bacterial Infection and septoria blight indicate that the symptoms in the early stages of the disease are visually similar. The MobileNetV2 model was evaluated using an 80:20 training-testing split, where 80% of the dataset was used for model training, and the remaining 20% was reserved for testing. The model achieved an accuracy of 95.25%, with 95.00% precision, 95.00% recall, and 95.01% F1-score on the test set. For edge deployment, the model achieved an inference time of less than 300 ms per image on the Raspberry Pi 4B, with a model size of approximately 14 MB (.h5). These results demonstrate the effectiveness of MobileNetV2 for plant disease classification while maintaining suitability for resource-constrained edge deployment.

5.3. Nutrient Prediction Model

5.3.1. Dataset of the Model

This nutrient dataset has been created from a USDA Agricultural Data Commons study on Bibb lettuce. When grown under controlled nitrogen-, phosphorus-, and potassium-limited conditions (Lactuca sativa) [39]. This dataset recorded the elemental and physiological values for the entire plant life cycle under four different nutritional conditions: healthy, nitrogen-deficient, phosphorus-deficient, and potassium-deficient. This dataset is composed of the same four categories and was obtained from four lettuce plants that were continuously monitored over the course of 60 days of growth, which represents five growth phases: germination, seedling, vegetative, mature, and harvest-ready. Five sensor readings were recorded for each sample: pH, EC (mS/cm), temperature, ambient humidity, and water level. All the growth stages of healthy plants had a pH range from 5.5 to 6.5 and EC values from 0.4 to 2.4 mS/cm. The nitrogen-deficient samples had higher pH (6.5–7.9), and the phosphorus-deficient samples had lower pH (5.0–5.7). The EC of samples that were low in potassium was significantly lower (0.5–1.4 mS/cm). There was a fairly large range of temperatures from 14.6 to 29.7 °C and humidity from 49% to 68% for all conditions. The entire dataset used for this analysis consisted of 240 samples, of which 132 (55.0%) were labeled as healthy, 30 (12.5%) as nitrogen-deficient, 39 (16.25%) as phosphorus-deficient, and 39 (16.25%) as potassium-deficient. A higher percentage of healthy samples was due to normal cultivation dynamics.

5.3.2. Implementation of Model

The decision tree was chosen to model nutrient-condition classification because it has the capability of modeling non-linear relationships between the sensor features and has an interpretable decision-making structure. A decision tree differs from ensemble models. The decisions are represented by a series of splits based on features, and the correlation between the measurements of the sensors and the conditions of the nutrients is more easily understood and explained [10,11]. The model classifies each of the samples as one of four classes: healthy, nitrogen-deficient, phosphorus-deficient, and potassium-deficient.

5.3.3. Performance Evaluation of the Model

Table 7 and Table 8 present the performance of the model on the held-out test set, which was generally very good. The classification of healthy and phosphorus-deficient samples was 100% accurate. The reduction in the nitrogen recall (83%) was due to the challenges of differentiating between early nitrogen deficiency and healthy growth, as the sensor signatures can be similar up until the occurrence of clear symptoms [11,26].

5.3.4. Confusion Matrix Analysis

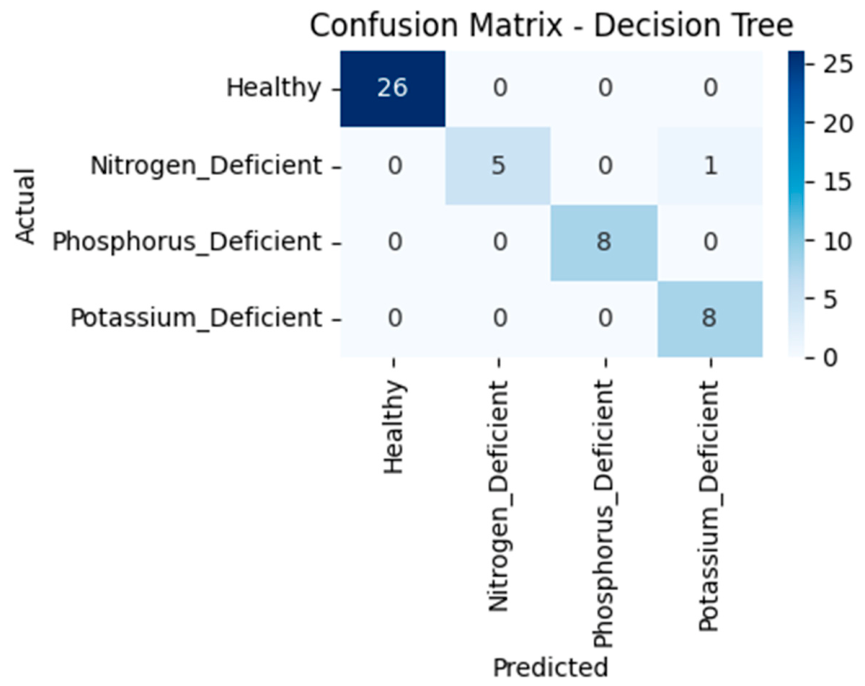
Near-perfect diagonal values in the confusion matrix in Figure 9 indicate a good fit. The one misclassification of a nitrogen-deficient sample predicted as potassium-deficient is aptly agronomical, as both conditions can give similar EC signatures at similar total nutrient concentrations. The total accuracy for these 48 samples was 47/48.
The decision tree algorithm was used for four classes: nitrogen-deficient, phosphorus-deficient, potassium-deficient, and healthy. The model had an overall accuracy of 97.92%, with nearly perfect values on the diagonal, indicating that the model could discriminate between the different classes very well, as only one sample was wrongly classified (nitrogen-deficient predicted as potassium-deficient).
The decision tree model was tested using an 80 to 20 split, where 80 percent of the data was used for training, and 20 percent was used for testing. The model uses nutrient-related input features. Classifies the plant nutrient condition into four classes: healthy, nitrogen-deficient, phosphorus-deficient, and potassium-deficient. The model’s performance was checked using accuracy, precision, recall, and the weighted F1-score to see how well it can classify the nutrient conditions. The results show that the model can tell the difference between the four nutrient-status classes and prove that it can be used in the automated nutrient-management system.

5.3.5. Comparative Evaluation with Baseline Methods

A comparative analysis was carried out to assess the performance of the proposed decision Tree (DT) model for the classification of nutrient status, with the pH + EC rule-based threshold method, K-Nearest Neighbors (KNN), Random Forest (RF), Support Vector Machine (SVM), and Gradient Boosting. All machine-learning models were tested on the same split of the data and the same input features. All the methods evaluated are compared, and the results are given in Table 9. The comparison shows that better nutrient-status classification is achieved by machine-learning methods than by conventional methods based on nutrient thresholds. The classifiers evaluated were compared, and among them, the decision tree achieved the highest overall accuracy and was finally considered to be used as the classification model for the proposed system. The results also demonstrate that simple fixed thresholds of pH, EC, and nutrient status are not sufficient to describe the relationship between the three. Thus, the proposed hydroponic system is a suitable case for using the data-driven method, decision tree, as a classification of nutrient status.

5.3.6. Predictive Control Model for Nutrient Control and Actuation

The proposed system is a combination of nutrient status prediction and automatic nutrient control. Nutrient condition is determined by the available inputs from the sensor and plant, and the model. The expected nutrient status is then passed to the control layer, where it is added to the nutrient-management strategy, which was pre-designed. This separation allows the machine-learning model to recognize the nutrient status, and the control layer to translate the prediction into a suitable corrective action.
The pH and EC were continuously monitored for operational and safety conditions for actuator control. If any of the following conditions are true, then the dosing schematic will start to dose Nutrient A (Pump A): EC is less than 1.2 mS/cm, OR decision tree predicts N deficiency, OR decision tree predicts P deficiency, OR decision tree predicts K deficiency, AND model confidence is at least 70%. When the nutrient concentration is high enough, a cut-off EC of 1.8 mS/cm will not allow nutrient dosing. Nutrient B with CalMag (Pump B) works independently based on a 24 h nutrient schedule and is not dependent on the nutrient prediction. Water management is achieved using a water pump (Pump C). The result of the decision tree is the nutrient-status prediction, which is the basis for the nutrient dosing for Nutrient A in the model-driven nutrient dosing and can be used as an indication for the model confidence and can be monitored during system operation.

5.3.7. Nutrient Prediction and Automated Control

The proposed system is a combination of nutrient status prediction and automatic nutrient control. Nutrient condition is determined by the available inputs from the sensor and plant, and the model is called the “Decision Tree” model. The expected nutrient status is then passed to the control layer, where it is added to the nutrient-management strategy, which was pre-designed. This separation allows the machine-learning model to recognize the nutrient status, and the control layer to translate the prediction into a suitable corrective action. The pH and EC were continuously monitored for operational and safety conditions for actuator control. If any of the following conditions are true, then the Dosing schematic will start to dose Nutrient A (Pump A): EC is less than 1.2 mS/cm, OR decision tree predicts N deficiency, OR decision tree predicts P deficiency, OR decision tree predicts K deficiency, AND model confidence is at least 70%. When the nutrient concentration is high enough, a cut-off EC of 1.8 mS/cm will not allow nutrient dosing. Nutrient B with CalMag (Pump B) works independently based on a 24 h nutrient schedule and is not dependent on the nutrient prediction. Water management is achieved using a water pump (Pump C). The result of the decision tree is the nutrient-status prediction, which is the basis for the nutrient-dosing for Nutrient A in the model-driven nutrient-dosing and can be used as an indication for model confidence, and is monitored during system operation.

5.4. System Performance and Observations

The use of automated control allowed for a more stable growing environment than the manual control [8,12] that was used to begin with. The pH remained in the desired range, and there were fewer fluctuations in EC/TDS under automated nutrient regulation. The disease detection model identified the early symptoms associated with stress, which allowed for prevention. Anomalies in all test sessions were reacted to by actuators within a few seconds. The two models are compared in Table 9.

5.5. Discussion and Comparative Analysis

MobileNetV2 combined with a decision tree provides the system with two windows into the health of plants. One watches the leaves, and the other watches the chemistry.
This is important because no single modality can detect all the facts, particularly during the early stages of a problem, when symptoms are unclear [11,12]. It runs on the edge and is not cloud-dependent; therefore, the latency is low in both models.
The overall architecture (IoT sensing, on-device inference, cloud storage, and digital twin simulation) is consistent with that presented in Table 9: Comparative summary of AI models employed. Table 10 compares the HydroGrow features feature by feature against two representative systems from the recent literature.

6. Comparison of Hydro Grow with Existing Hydroponic Systems

A comparison is made between Hydro Grow and previously reported hydroponic systems in Table 11 to show the differences in AI-based disease detection, nutrient prediction, sensing, edge inference, cloud integration, digital twin, dashboard functions and power back up. This comparison illustrates the complete integration of the proposed system using AI, IoT, cloud, and digital twin technologies.

7. Results and Discussion

Overall, the performance of MobileNetV2 was strong on all evaluation metrics, with an accuracy of 95.25%. This result proves the accuracy of the model in differentiating healthy leaves from diseased ones and can be applied for the automatic detection of diseases in the proposed hydroponic system. The nutrient prediction model achieved a high accuracy of 97.92% and 100% accuracy for the “Healthy” and “Phosphorus-Deficient” classes. The only noticeable decrease in performance was seen in the recall of the “Nitrogen-Deficient” class (83%), which is because the signatures of early N deficiency and healthy plants look somewhat similar in the sensor data, making it a typical occurrence in nutrient classification tasks [11,26]. On the system side, the sensor data is always updated to the web dashboard with a 2 s delay. Under all tested conditions [17,37], the Azure Digital Twin virtual model was synchronized with less than 5 s of latency. The automated control system had an estimated reduction of 78% in nutrient-range deviations from the manual baseline, which resulted in a significant practical improvement and supported the effectiveness of the Threshold-based automatic control with diagnostic prediction using an ML nutrient control system over the reactive threshold-based nutrient control system [8,12,21]. Both a pre-trained vision model and a powerful ensemble classifier are effective for the limitations of edge deployment, being fast enough to process real-time data on the Raspberry Pi 4B and general enough to perform well on the available data, complementing each other by addressing monitoring gaps not detectable by single-modality systems [14,22,27,30].
The limitations of the present assessment are that the chosen MobileNetV2 and decision tree models were not tested with a wider variety of other models on the same datasets. The decision tree was compared to several standard machine-learning classifiers, including Random Forest, SVM, Gradient Boosting, and KNN, but there are other deep-learning models, such as ResNet and VGG variants for disease classification and other advanced machine-learning models, which can be considered as part of the broader benchmarking. Both MobileNetV2 and decision trees were chosen based on their ability to offer good predictive accuracy and their suitability for deployment on the Raspberry Pi 4B. Furthermore, the existing Digital Twin application is dedicated to the physical hydroponic system, being synchronized in the cloud, visualized, and monitored from the cloud. Future investigations could include more advanced Digital Twin functions, such as fully simulated predictive modeling and enhanced cloud-based interaction.
A lab-scale hydroponic system was used for the evaluation of the proposed system. The experimental results show that the proposed approach is feasible, but more experiments with larger hydroponic systems, longer growth periods, and larger data sets are needed to test the robustness and generalizability of the system in different operational conditions.

8. Conclusions

The presented paper introduces Hydro Grow, an IoT sensing and embedded automation system integrated with Azure cloud services and Digital Twin visualization in a single working system. The MobileNetV2 model achieved an accuracy of 95.25% for plant disease classification from leaf images on three classes, and the decision tree model achieved 97.92% accuracy in plant nutrient deficiency prediction under four conditions. Both models operate on devices and provide low-latency operations without requiring cloud failure to halt operations. Azure Digital Twin provides a real-time Unity 3D-rendered virtual representation of the physical environment for monitoring and what-if scenario testing. MobileNetV2 generalized well on the image test set, achieving perfect precision (though not perfect recall) for the healthy leaves class. The errors were from bacterial infection to septoria blight (where early-stage lesion morphology appears to be very similar). The decision tree model correctly classified 47 of 48 samples held out of the test set; the single error—a nitrogen-deficient sample wrongly classified as potassium-deficient—is reasonable in view of the potential for the two states to produce overlapping EC signatures. Hydro Grow integrates IoT sensing, dual-model AI inference, cloud synchronization, and Digital Twin visualization within a single working platform, whereas prior systems in the literature typically address only one or a few of these dimensions in isolation.
The current prototype was validated at the laboratory scale using a limited number of sensor conditions and small machine-learning datasets. The nutrient prediction model was trained on a small dataset and requires validation using plant-wise or time-blocked splits to reduce the leakage risk. Future work should include longer hydroponic growth trials, larger crop-specific datasets, additional sensing for dissolved oxygen, light intensity, and CO2, and external validation across crop species and growth environments.

Author Contributions

Conceptualization, F.A. and J.A.; methodology, F.A. and J.A.; software, A.B. and M.C.; validation, F.A., R.S.S. and P.V.; formal analysis, F.A. and J.A.; investigation, F.A. and J.A.; resources, F.A. and I.A.; data curation, F.A. and J.A.; writing—original draft preparation, F.A., J.A. and A.B.; writing—review and editing, M.K.J., F.A. and H.M.A.; visualization, F.A. and J.A.; supervision, F.A., I.A. and H.M.A.; project administration, F.A., I.A. and M.K.J.; funding acquisition, I.A. and H.M.A. All authors have read and agreed to the published version of the manuscript.

Funding

This research received no external funding.

Data Availability Statement

The nutrient deficiency sensor dataset and lettuce leaf disease image dataset in this study can be made available by the corresponding author upon reasonable request.

Acknowledgments

The authors gratefully acknowledge the support provided by Universiti Kuala Lumpur, including access to the Intelligent Embedded Research Lab (IERL) research cluster and facilities used in this study.

Conflicts of Interest

The authors declare no conflicts of interest.

References

  1. Chatterjee, A.; Ghosh, P.; Winkler, B.; Vijayaragavan, V.; Debnath, S.; Cichocki, J.; Trenkner, M.; Vanicela, B.; Riethmueller, C.; Walz, M.; et al. Demystifying the Integration of Hydroponics Cultivation System Reinforcing Bioeconomy and Sustainable Agricultural Growth. Sci. Hortic. 2025, 341, 113973. [Google Scholar] [CrossRef] [Scilit]
  2. Lakhiar, I.A.; Yan, H.; Syed, T.N.; Zhang, C.; Shaikh, S.A.; Rakibuzzaman, M.; Vistro, R.B. Soilless Agricultural Systems: Opportunities, Challenges, and Applications for Enhancing Horticultural Resilience to Climate Change and Urbanization. Horticulturae 2025, 11, 568. [Google Scholar] [CrossRef] [Scilit]
  3. Gómez, C.; Currey, C.J.; Dickson, R.W.; Kim, H.; Hernández, R.; Sabeh, N.C.; Raudales, R.E.; Brumfield, R.G.; Laury-Shaw, A.; Wilke, A.K.; et al. Controlled Environment Food Production for Urban Agriculture. HortScience 2019, 54, 1448–1458. [Google Scholar] [CrossRef] [Scilit]
  4. Ragaveena, S.; Edward, A.S.; Umashankar, U. Smart Controlled Environment Agriculture Methods: A Holistic Review. Rev. Environ. Sci. Biotechnol. 2021, 20, 887–913. [Google Scholar] [CrossRef] [Scilit]
  5. Kaur, G.; Upadhyaya, P.; Chawla, P. Comparative Analysis of IoT-Based Controlled Environment and Uncontrolled Environment Plant Growth Monitoring System. Environ. Res. 2023, 222, 115313. [Google Scholar] [CrossRef] [Scilit] [PubMed]
  6. Niswar, M. Design and Implementation of an Automated Indoor Hydroponic Farming System Based on the IoT. Int. J. Comput. Digit. Syst. 2024, 15, 337–346. [Google Scholar] [CrossRef] [Scilit] [PubMed]
  7. Dutta, M.; Gupta, D.; Tharewal, S.; Goyal, D.; Sandhu, J.K.; Kaur, M.; Alzubi, A.A.; Alanazi, J.M. Internet of Things-Based Smart Precision Farming in Soilless Agriculture. IEEE Access 2025, 13, 34238–34268. [Google Scholar] [CrossRef] [Scilit]
  8. Raju, S.V.S.R.; Dappuri, B.; Varma, P.R.K.; Yachamaneni, M.; Verghese, D.M.G.; Mishra, M.K. Design and Implementation of Smart Hydroponics Farming Using IoTbased AI Controller with Mobile Application System. J. Nanomater. 2022, 2022, 4435591. [Google Scholar] [CrossRef] [Scilit]
  9. Amirrudin, N.B.; Muslim, N.I.S.B.; Ahmad, N.I.B.; Amirrudin, F.A.B.; Yusof, K.H.B. Performance Analysis of an IoT Hydroponic System under Non-Optimal PH and Nutrient Conditions. In Proceedings of the 2025 IEEE 16th Control and System Graduate Research Colloquium (ICSGRC), Shah Alam, Malaysia, 2 August 2025; pp. 99–104. [Google Scholar]
  10. Dhal, S.B.; Mahanta, S.; Gumero, J.; O’Sullivan, N.; Soetan, M.; Louis, J.; Gadepally, K.C.; Mahanta, S.; Lusher, J.; Kalafatis, S. An IoT-Based Data-Driven Real-Time Monitoring System for Control of Heavy Metals to Ensure Optimal Lettuce Growth in Hydroponic Set-Ups. Sensors 2023, 23, 451. [Google Scholar] [CrossRef] [Scilit] [PubMed]
  11. Dhal, S.; Mahanta, S.; Moore, J.; Kalafatis, S. Machine Learning-Based Analysis of Nutrient and Water Uptake in Hydroponically Grown Soybeans. Sci. Rep. 2024, 14, 24337. [Google Scholar] [CrossRef] [Scilit] [PubMed]
  12. Priya, G.L.; Baskar, C.; Deshmane, S.S.; Adithya, C.; Das, S. Revolutionizing Holy-Basil Cultivation with AI-Enabled Hydroponics System. IEEE Access 2023, 11, 82624–82639. [Google Scholar] [CrossRef] [Scilit]
  13. Rofiansyah, W.; Zalianty, F.; La Ito, F.; Wijayanto, I.; Ryanu, H.H.; Irawati, I.D. IoT-Based Control and Monitoring System for Hydroponic Plant Growth Using Image Processing and Mobile Applications. PeerJ Comput. Sci. 2025, 11, e2763. [Google Scholar] [CrossRef] [Scilit] [PubMed]
  14. Ashwinkumar, S.; Rajagopal, S.; Manimaran, V.; Jegajothi, B. Automated Plant Leaf Disease Detection and Classification Using Optimal MobileNet Based Convolutional Neural Networks. Mater. Today Proc. 2021, 51, 480–487. [Google Scholar] [CrossRef] [Scilit]
  15. Jans-Singh, M.; Leeming, K.; Choudhary, R.; Girolami, M. Digital Twin of an Urban-Integrated Hydroponic Farm. Data-Centric Eng. 2020, 1, e20. [Google Scholar] [CrossRef] [Scilit]
  16. Yanes, A.; Abbasi, R.; Martinez, P.; Ahmad, R. Digital Twinning of Hydroponic Grow Beds in Intelligent Aquaponic Systems. Sensors 2022, 22, 7393. [Google Scholar] [CrossRef] [Scilit]
  17. Alves, R.; Maia, R.; Lima, F. Development of a Digital Twin for Smart Farming: Irrigation Management System for Water Saving. J. Clean. Prod. 2023, 388, 135920. [Google Scholar] [CrossRef] [Scilit]
  18. Verma, S.; Kumar, A.; Kumari, M.; Kumar S, N.; Hansda, S.; Saurabh, A.; Poonia, S.; Rathore, S.D. A Review on Hydroponics and Vertical Farming for Vegetable Cultivation: Innovations and Challenges. J. Exp. Agric. Int. 2024, 46, 801–821. [Google Scholar] [CrossRef] [Scilit]
  19. Kurniasari, A.A.; Dewi Puspitasari, P.S.; Perdanasari, L.; Mei Yuana, D.B.; Jumiatun. Enhancing Hydroponic Systems with ESP32: An IoT Approach to Real-Time Monitoring and Automation. Proc. IOP Conf. Ser. Earth Environ. Sci. 2025, 1446, 012010. [Google Scholar] [CrossRef] [Scilit]
  20. Shin, K.K.Y.; Ping, T.P.; Ling, M.G.B.; Jiun, C.C.; Bolhassan, N.A.B. SMART GROW—Low-Cost Automated Hydroponic System for Urban Farming. HardwareX 2023, 17, e00498. [Google Scholar] [CrossRef] [Scilit] [PubMed]
  21. Febriana R., K.; Thakur, R.; Roy, S. Enhancing Hydroponic Farming Productivity through IoT-Based Multi-Sensor Monitoring System. In Proceedings of the 9th International Conference on Internet of Things, Big Data and Security—IoTBDS; SciTePress: Setúbal, Portugal, 2024; pp. 351–357. [Google Scholar] [CrossRef] [Scilit]
  22. Suresh, C.; Subramanian, S. Enhancing Hydroponic Farming Using IoT Integration and Machine Learning Techniques. In Proceedings of the 2025 International Conference on Multi-Agent Systems for Collaborative Intelligence (ICMSCI), Erode, India, 20–22 January 2025; pp. 439–444. [Google Scholar]
  23. Awal, A.; Pio, A.S.; Mim, M.J.; Partha, P.K.P.; Al Kafi, A.; Farha, S. A Smart IoT Based Hydroponics System for Small-Scale Households in Bangladesh. Smart Agric. Technol. 2025, 12, 101163. [Google Scholar] [CrossRef] [Scilit]
  24. Anjini, R.; Jenifer, J.; Blessy, M. IoT Based Automated Hydroponics Greenhouse Monitoring. Int. J. Adv. Res. Sci. Commun. Technol. 2021, 4, 671–681. [Google Scholar] [CrossRef] [Scilit]
  25. Bhargava, Y.V.; Chittoor, P.K.; Bharatiraja, C.; Verma, R.; Sathiyasekar, K. Sensor Fusion Based Intelligent Hydroponic Farming and Nursing System. IEEE Sens. J. 2022, 22, 14584–14591. [Google Scholar] [CrossRef] [Scilit]
  26. Rahman, A.; Chakraborty, N.R.; Sufiun, A.; Banshal, S.K.; Tajnin, F.R. An AIoT-Based Hydroponic System for Crop Recommendation and Nutrient Parameter Monitorization. Smart Agric. Technol. 2024, 8, 100472. [Google Scholar] [CrossRef] [Scilit]
  27. Diaz-Delgado, D.; Rodriguez, C.; Bernuy-Alva, A.; Navarro, C.; Inga-Alva, A. Optimization of Vegetable Production in Hydroculture Environments Using Artificial Intelligence: A Literature Review. Sustainability 2025, 17, 3103. [Google Scholar] [CrossRef] [Scilit]
  28. Hukkeri, G.; Soundarya, B.; Gururaj, H.; Ravi, V. Classification of Various Plant Leaf Diseases Using Pretrained Convolutional Neural Network on ImageNet. Open Agric. J. 2024, 18, e18743315305194. [Google Scholar] [CrossRef] [Scilit]
  29. Imanulloh, S.; Muslikh, A.; Setiadi, D. Plant Diseases Classification Based Leaves Image Using Convolutional Neural Network. J. Comput. Theor. Appl. 2023, 1, 1–10. [Google Scholar] [CrossRef] [Scilit]
  30. Kc, K.; Yin, Z.; Wu, M.; Wu, Z. Depthwise Separable Convolution Architectures for Plant Disease Classification. Comput. Electron. Agric. 2019, 165, 104948. [Google Scholar] [CrossRef] [Scilit]
  31. Singla, P.; Kalavakonda, V.; Senthil, R. Detection of Plant Leaf Diseases Using Deep Convolutional Neural Network Models. Multimed. Tools Appl. 2024, 83, 64533–64549. [Google Scholar] [CrossRef] [Scilit]
  32. Ahsen, R.; Di Bitonto, P.; Novielli, P.; Magarelli, M.; Romano, D.; Diacono, D.; Monaco, A.; Amoroso, N.; Bellotti, R.; Tangaro, S. Harnessing Digital Twins for Sustainable Agricultural Water Management: A Systematic Review. Appl. Sci. 2025, 15, 4228. [Google Scholar] [CrossRef] [Scilit]
  33. Fernández, R.; Navas, E.; Rodríguez-Nieto, D.; Rodríguez-González, A.A.; Emmi, L. DigiHortiRobot: An AI-Driven Digital Twin Architecture for Hydroponic Greenhouse Horticulture with Dual-Arm Robotic Automation. Future Internet 2025, 17, 347. [Google Scholar] [CrossRef] [Scilit]
  34. Yang, Z.; Xia, J.; Li, S.; Zheng, L.; Zhang, S.; Liu, L.; Fu, Y.; Liu, Y. Band-Kernel Stochastic Learning for Unsupervised Blind Hyperspectral Image Super-Resolution. IEEE Trans. Pattern Anal. Mach. Intell. 2026, 48, 9895–9913. [Google Scholar] [CrossRef] [Scilit] [PubMed]
  35. Wang, Q.; Guo, H.; Yang, C.; He, Y.; Chen, X.; Xu, B. A Study on the Enhancement Method for Seam Extraction in Teachless Welding Robots Based on a Multichannel Feature Fusion Network. Int. J. Adv. Manuf. Technol. 2025, 141, 647–660. [Google Scholar] [CrossRef] [Scilit]
  36. Xie, J.; Wu, H.; Wu, W.; Hong, L.; He, L.; Yu, Q.; Liu, L.; Lin, A.; Som-ard, J. A CNN-Transformer Hybrid Network with Boundary Guidance for Mapping Cropland Field Parcels from High-Resolution Remote Sensing Imagery. IEEE Trans. Geosci. Remote Sens. 2026, 64, 1–22. [Google Scholar] [CrossRef] [Scilit]
  37. Stiri, S.; Palattella, M.R. Digital Twins for Hydroponic Farms Management: Communication Needs and Challenges. In Proceedings of the 2025 IEEE International Conference on Communications Workshops (ICC Workshops), Montreal, QC, Canada, 8–12 June 2025; pp. 781–787. [Google Scholar]
  38. Pandi, S.S.; Reshmy, A.K.; Elangovan, D.; Vellingiri, J. AI-Driven Environmental Monitoring for Hydroponic Agriculture: ExCNNLFCP Approach. Earth Sci. Inform. 2024, 18, 73. [Google Scholar] [CrossRef] [Scilit]
  39. USDA Agricultural Research Service Hydroponic Cultivation of Bibb Lettuce in Nitrogen Phosphorus Potassium (NPK)-Limited Conditions 2025. Available online: https://doi.org/10.15482/USDA.ADC/28801286.v2 (accessed on 20 August 2026). [CrossRef]
Figure 1. Four-layered architecture of the proposed AI-enhanced intelligent hydroponic farming.
Futureinternet 18 00446 g001
Figure 2. Proposed operational workflow 8 stages with continuous monitoring feedback loop.
Futureinternet 18 00446 g002
Figure 3. The proposed AI-supported IoT hydroponic farming platform consists of a four-layer architecture.
Futureinternet 18 00446 g003
Figure 4. Hardware interface diagram of the proposed Raspberry Pi 4B-based hydroponic monitoring and control system.
Futureinternet 18 00446 g004
Figure 5. AI-controlled IoT hydroponic system prototype, HydroGrow.
Futureinternet 18 00446 g005
Figure 6. 3D digital twin visualization of the hydroponic plant monitoring system in Unity 3D.
Futureinternet 18 00446 g006
Figure 7. What-If Scenario: 3D digital twin visualization details of plants and relevant data.
Futureinternet 18 00446 g007
Figure 8. MobileNetV2 plant disease detection model confusion matrix.
Futureinternet 18 00446 g008
Figure 9. Confusion matrix of the nutrient deficiency model.
Futureinternet 18 00446 g009
Table 1. Research gaps identified in the related literature.
DomainState-of-the-ArtIdentified Gap
IoT SensingMulti-sensor ESP32
systems [9,23]
No ML integration for predictive control
Machine Learning RF and regression models [11,26]Isolated ipelines, no real-time feedback
Computer VisionMobileNet, ResNet
classification [14,30]
No coupling with IoT actuation systems
Digital TwinAzure and aquaponic twins [16,17]High complexity, limited edge deployment
Unified SystemsFragmented solutions [4,18]No single framework
integrating all layers
Table 2. Sensor operating specifications and target ranges.
Sensor AccuracyProtocolTarget Range
pH Sensor±0.1 pHAnalog/ADC5.5–6.5
EC/TDS Sensor±2%Analog/ADC1.2–2.4 mS/cm
DHT22 (Temp)±0.5 °CSingle-wire18–26 °C
DHT22 (Humidity)±2% RHSingle-wire50–70% RH
Ultrasonic±1 mmGPIO>5 cm depth
Camera V28 MPCSIN/A (imaging)
Table 3. System Hardware components and functional justification.
ComponentFunctionJustification
Raspberry Pi 4BCentral AI + IoT controllerSupports sensor acquisition, ML inference, relay control, and MQTT communication
pH SensorNutrient solution acidity monitoringMonitors pH for suitable nutrient availability
EC SensorNutrient strength monitoringSupports monitoring of nutrient concentrations
DHT22Temperature and humidity monitoringEnvironmental conditions for plant monitoring
Ultrasonic SensorReservoir water-level monitoringDetects low water levels to protect the pump
Camera Module V2Leaf image acquisitionCaptures plant images for disease classification
Relay ModuleActuator switchingControls connected pumps through a Raspberry Pi
Air Pump + Air StoneSolution oxygenationProvides aeration to the nutrient solution
LED Grow LightsPhotosynthesis supportProvides controlled lighting for plant growth
Nutrient DispensersAutomated nutrient dosingEnables automated dosing of Nutrient A and Nutrient B
Table 4. Simulation scenario outcomes and system response.
ScenarioTrigger ConditionActuator ResponseRecovery/Response Time
EC depletionEC < 1.2 mS/cmNutrient A (Pump A) activates when decision tree deficiency prediction and confidence conditions are satisfied<2 min
Low pHpH < 5.5Dashboard alertImmediate
High pHpH > 6.5Dashboard alertImmediate
Thermal stressTemperature
>30 °C
Dashboard alertImmediate
Low water levelDepth < 5 cmWater pump (Pump C) protection and alertsImmediate
Disease detectedMobileNetV2 classification flagDashboard alert and notificationImmediate
Digital Twin synchronizationTelemetry update eventDigital Twin/dashboard update<5 s
Table 5. Performance evaluation of the MobileNetV2 disease detection model.
MetricValue
Accuracy95.25%
Precision95.00%
Recall95.00%
F1-Score95.01%
Inference Time (RPi 4B)<300 ms/image
Model Size14 MB (.h5)
Test Samples569
Table 6. Class-wise evaluation of the MobileNetV2 disease detection model.
ClassPrec.RecallF1Support
Bacterial Infection0.930.920.92172
Healthy1.000.960.98224
Septoria Blight0.920.980.95173
Macro Avg0.950.950.95569
Table 7. Performance evaluation of the decision tree nutrient prediction model.
MetricValue
Accuracy97.92%
F1-Score (Weighted)0.9788
Max DepthUnrestricted
Test Samples48
Table 8. Class-wise evaluation of the decision tree nutrient prediction model.
ClassPrec.RecallF1Support
Healthy1.001.001.0026
Nitrogen Def.1.000.830.916
Phosphorus Def.1.001.001.008
Potassium Def.0.891.000.948
Macro Avg0.970.960.9648
Wtd. Avg0.980.980.9848
Table 9. Comparison of the baseline model.
ModelAccuracyPrecisionRecallWeighted F1
Rule-Based (pH + EC)85.42%84.00%85.42%82.74%
KNN81.25%80.60%81.25%79.78%
Random Forest95.83%95.91%95.83%95.76%
SVM95.83%96.06%95.83%95.80%
Gradient Boosting95.83%95.91%95.83%95.76%
Decision Tree97.92%98.15%97.92%97.88%
Table 10. Comparative analysis of MobileNetV2 and decision trees.
Property MobileNetV2Decision Tree
TaskLeaf disease classificationNutrient deficiency prediction
InputRGB leaf imagesMulti-sensor telemetry
Accuracy95.25%97.92%
ArchitectureDepth-wise-separable CNN200-tree ensemble
Inference DeviceRaspberry Pi 4B edgeRaspberry Pi 4B edge
Training DataAnnotated leaf imagesHydroponic sensor logs
OutputDisease class + confidenceNPK deficiency class
Deployment FormatHDF5 (.h5)Pickle (pkl)
Table 11. Comparison of HydroGrow with prior hydroponic systems.
FeatureControllerDisease DetectionNutrient PredictionDigital TwinCloud PlatformSensorsEdge InferenceDashboardIntegration LevelPower Backup
Raju 2022 [8]Arduino/ESP32Custom CNNThreshold basedAbsentFirebase/local3 sensorsCloud-dependentMobile appIoT onlyAbsent
Rofiansyah 2025 [13]RPi 3BAbsentAbsentStatic viz onlyCustom server2 sensorsAbsentBasic webDT onlyAbsent
This WorkRPi 4BMobileNetV2 (95.25%)Decision tree (97.92%)Azure DT + Unity 3DAzure IoT Hub + Blob4 sensors (pH, EC, DHT22, ultrasonic)On-device HDF5 on
RPi 4B
Web + AI chatbotIoT + AI + Cloud + DTAdapter + battery backup
Disclaimer/Publisher’s Note: The statements, opinions and data contained in all publications are solely those of the individual author(s) and contributor(s) and not of MDPI and/or the editor(s). MDPI and/or the editor(s) disclaim responsibility for any injury to people or property resulting from any ideas, methods, instructions or products referred to in the content.