1. Introduction
The increasing digitization of urban environments has created a strong demand for reliable large-scale 3D scene understanding systems. In this context, Mobile Laser Scanning (MLS) has become a key technology for street-level mapping, enabling the continuous acquisition of dense and georeferenced point clouds along road corridors [
1]. Such data support a wide range of applications, including urban mapping, geographic information system updates, autonomous driving, and infrastructure inspection. In all these applications, semantic segmentation is a fundamental step for identifying road surfaces, buildings, vegetation, vehicles, and infrastructure elements.
The progress of point-cloud semantic segmentation has been strongly supported by public benchmarks such as Semantic3D [
2], SemanticKITTI [
3], and Paris-Lille-3D [
4]. These datasets differ in sensing geometry, acquisition context, and class ontology. Semantic3D is based on static terrestrial laser scanning, while SemanticKITTI focuses on automotive LiDAR sequences for autonomous driving. Paris-Lille-3D is closer to our target setting, but its label taxonomy and scale do not specifically address the requirements of telecom and utility infrastructure analysis, where overhead cables and utility poles are critical classes.
At the same time, segmentation methods for large-scale outdoor point clouds have evolved across projection-based [
5,
6], point-based [
7,
8], and sparse voxel-based approaches [
9,
10]. Although these methods have achieved strong results on established benchmarks, the reliable segmentation of thin and under-represented infrastructure elements remains challenging in MLS scenes, especially under strong class imbalance, occlusions, and varying acquisition conditions.
The dedicated cable class is motivated by practical asset-management and field-operation needs in telecommunication and utility networks. In particular, mobile laser scanning can support the inventory and monitoring of externally visible aerial infrastructure, including overhead telecommunication cables, cable bundles, service drops, and their spatial relationship with utility poles, buildings, trees, and road corridors. Such information is valuable in several operational scenarios: (i) updating georeferenced inventories of aerial network assets; (ii) identifying vegetation encroachment and potential clearance issues along cable corridors; (iii) supporting maintenance planning after storms or other events that may cause cable sagging, obstruction, or pole damage; (iv) preparing field interventions by locating cables and associated poles before site visits; and (v) assessing potential conflicts between telecom infrastructure and roadworks, construction activities, or urban redevelopment projects.
MLS does not replace dedicated network surveys or provide visibility of buried or heavily occluded assets. However, it offers a scalable means of documenting visible overhead infrastructure at street level, especially when combined with existing geographic information system (GIS) records and field verification. Reliable point-wise cable segmentation is therefore a relevant enabling capability for automated infrastructure inventory and condition-assessment workflows.
To address these limitations, this paper introduces RICO-3D (Roadway Infrastructure in Context), a new large-scale MLS dataset for semantic segmentation of French urban roadways. RICO-3D was acquired with a Leica Pegasus TRK300 mobile mapping system [
11] across Marseille, Rennes, and Opoul-Périllos, and provides per-point geometry, RGB, intensity, GPS time, scan angle rank, and semantic labels for six classes: vegetation, road, pole, building, cable, and vehicle. With 780,981,961 labeled points, the dataset captures realistic MLS challenges, including severe class imbalance, sparse thin structures, occlusions, and varying seasonal and weather conditions.
In addition, we propose GA-Attention, a geometry-aware attention U-Net [
12] designed for MLS point-cloud semantic segmentation. The architecture combines enriched geometric descriptors, attentive local aggregation, saliency-guided downsampling, attention-gated skip fusion, and curriculum-based training within a point-based encoder–decoder framework. The design is specifically intended to improve the segmentation of sparse and thin infrastructure classes such as poles and cables.
The main contributions of this paper are as follows:
We introduce RICO-3D, a new large-scale MLS dataset for French urban roadway semantic segmentation, with 780,981,961 labeled points and a class ontology including a dedicated cable category.
We propose GA-Attention, a geometry-aware attention U-Net that integrates geometric descriptors, attentive local aggregation, saliency-guided hierarchical downsampling, attention-gated skip fusion, and curriculum-based training.
We commit to releasing the RICO-3D dataset, codebase, pretrained checkpoints, and standardized train/val/test splits to foster reproducibility and fair comparison.
The remainder of this paper is organized as follows.
Section 2 reviews related datasets and segmentation methods.
Section 3 presents the RICO-3D dataset.
Section 4 describes the proposed GA-Attention architecture.
Section 5 reports the experimental results.
Section 6 concludes the paper and outlines future work.
2. Related Work
Existing benchmarks and segmentation methods have enabled substantial progress in outdoor point-cloud understanding. However, their suitability for roadway infrastructure analysis is not uniform. In particular, many benchmarks are optimized for autonomous-driving perception rather than survey-grade MLS, and many segmentation methods are evaluated primarily on dominant classes such as road, building, or vegetation. This leaves open the problem of reliably segmenting thin and highly imbalanced overhead infrastructure, notably utility poles and cables, under the irregular density, occlusions, and acquisition variability of MLS data. The following review therefore examines not only existing datasets and methods, but also their limitations with respect to this specific problem.
2.1. Public Benchmarks for Outdoor Roadway Segmentation
Public datasets are critical for the objective evaluation and comparison of segmentation methods. Outdoor benchmarks can be broadly categorized by their acquisition platform and environment.
2.1.1. Automotive LiDAR Datasets
Automotive LiDAR datasets, including SemanticKITTI [
3], nuScenes [
13], and Waymo Open Dataset [
14], have been instrumental in advancing semantic segmentation for autonomous driving. Their main objective, however, is dynamic scene understanding around a vehicle, with emphasis on road users, drivable areas, and traffic-related objects. Compared with survey-grade MLS, these datasets differ in sensor geometry, point density, trajectory coverage, and annotation priorities. In particular, overhead cables are generally absent, merged into broad categories, or too sparsely represented to support dedicated infrastructure studies. Consequently, models developed for automotive benchmarks may not directly transfer to MLS-based telecom or utility inventory tasks.
2.1.2. Mobile Laser Scanning (MLS) Datasets
MLS datasets are more closely related to the present application because they are acquired from street-level mapping platforms and support urban inventory tasks. Paris-Lille-3D [
4] offers detailed annotations and high geometric quality, but its broad fine-grained taxonomy does not provide a dedicated cable category aligned with overhead telecom infrastructure analysis. Toronto-3D [
15] includes a utility-line class and is therefore particularly relevant; however, it covers approximately 1 km of roadway and reflects a different geographic and urban context. Moreover, its pole definition includes several types of street furniture, whereas RICO-3D restricts the pole class to utility poles. These ontology differences are important because they complicate direct cross-dataset comparison and generalization. RICO-3D complements these datasets by providing a larger infrastructure-oriented French MLS benchmark with a dedicated cable class, diverse acquisition conditions, and rich per-point attributes.
2.1.3. Other Large-Scale Datasets
Other relevant benchmarks include datasets from different acquisition modalities. Semantic3D [
2] consists of extremely dense point clouds from static Terrestrial Laser Scanners (TLS), offering unparalleled detail but from a static viewpoint, which creates different occlusion patterns compared to MLS. At an even larger scale, datasets from aerial platforms like DALES [
16] (Airborne Laser Scanning) and SensatUrban [
17] (photogrammetry) cover entire city districts, but their top-down perspective makes them more suitable for large-scale urban analysis rather than street-level scene understanding.
2.1.4. Positioning of RICO-3D
Although existing datasets have significantly advanced outdoor point-cloud segmentation, they present limitations for infrastructure-oriented MLS applications. Automotive datasets such as SemanticKITTI, nuScenes, and Waymo are designed primarily for driving perception; their sensor configurations, sampling density, viewpoint, and class definitions do not fully reflect survey-grade MLS acquisitions or asset-management requirements. In particular, overhead cables are either absent, merged into broader categories, or represented by relatively few points.
Paris-Lille-3D provides high-quality French MLS data and a detailed taxonomy, but its class ontology was not designed around a dedicated overhead-cable category for telecom or utility asset analysis. Toronto-3D includes a utility-line class, but covers a comparatively limited spatial extent and a different North American urban context. In addition, variations in class definitions—for example, the broader definition of poles in Toronto-3D—make direct transfer and comparison non-trivial.
RICO-3D is intended to complement, rather than replace, these benchmarks. It provides a large-scale French MLS dataset with a compact infrastructure-oriented taxonomy, including a dedicated cable class and a restrictive utility-pole definition. The dataset also includes RGB, intensity, GPS time, and scan-angle rank, enabling future research on multimodal segmentation and acquisition-aware modeling. Its geographic, seasonal, and weather diversity further makes it suitable for studying robustness in realistic street-level infrastructure-mapping conditions.
2.2. Algorithms for Point Cloud Semantic Segmentation
Methodologies for 3D semantic segmentation have evolved from hand-crafted pipelines to end-to-end deep learning architectures. Existing methods can be broadly grouped into three main families.
2.2.1. Projection-Based Methods
These methods transform the 3D point cloud into a 2D representation, such as a spherical range image, and apply 2D convolutional neural networks (CNNs). Early works like SqueezeSeg [
5] and its successor SqueezeSegV2 [
18] demonstrated real-time performance on automotive LiDAR data. Later methods such as RangeNet++ [
19] and SalsaNext [
6] improved accuracy with stronger backbones and learned post-processing. While computationally efficient, the projection step introduces information loss, which is particularly detrimental for the sparse and thin structures common in MLS data.
2.2.2. Point-Based Methods
To avoid projection artifacts, this family of methods operates directly on unstructured point sets. PointNet [
20] and PointNet++ [
21] were foundational, introducing architectures capable of processing unordered points and learning hierarchical features. To address their limited scalability, RandLA-Net [
7] introduced a highly efficient architecture based on random sampling. For achieving high accuracy, KPConv [
8] proposed deformable kernel points that operate like convolutions but directly on point clouds, showing excellent performance on fine geometric details. Other works, such as EyeNet [
22], have explored multi-view inspired approaches to enhance feature representation directly on points. These methods are highly relevant to our work due to their ability to preserve geometric fidelity.
2.2.3. Voxel-Based Methods
These methods discretize the 3D space into a regular grid and apply 3D CNNs. The high cost of dense 3D convolutions was overcome by submanifold sparse convolutions, notably within the Minkowski Engine [
9]. This breakthrough enabled efficient 3D CNNs on sparse data by performing convolutions only on occupied voxels, leading to state-of-the-art models like MinkowskiUNet [
9] and SPVCNN [
10]. More specialized architectures like Cylinder3D [
23] use a cylindrical voxel partitioning tailored to rotating LiDARs. Recent trends also include hybrid architectures like 3D-UMamba [
24], which integrates Mamba-based state-space models into a U-Net structure for enhanced context modeling in LiDAR segmentation.
2.2.4. Methodological Positioning and Architectural Rationale
The specific characteristics of MLS data, with its mix of large planar surfaces and fine-grained, thin structures (poles, cables), require a model that balances efficiency and geometric precision. Existing approaches for large-scale point-cloud semantic segmentation provide strong performance on frequent urban classes, but the preservation of rare, thin, and often occluded infrastructure elements remains challenging throughout hierarchical processing. This limitation is particularly relevant to RICO-3D, which includes dedicated Pole and Cable classes under a severe long-tail distribution. We introduce GA-Attention, a geometry-aware attention U-Net designed to effectively capture multi-scale context while preserving the geometric fidelity of sparse elements. GA-Attention is designed as a targeted response to this setting, with the objective of preserving and recovering informative representations of sparse roadway infrastructure during encoding and decoding. The proposed architecture follows a point-based paradigm. This choice is task-oriented and does not imply that point-based methods are universally superior to projection-based, voxel-based, hybrid, or transformer-based approaches. Projection-based methods can be computationally efficient, but converting an irregular 3D point cloud into a range image or another two-dimensional representation may introduce discretization, occlusion, and many-to-one projection effects. These effects can be particularly challenging for sparse and thin roadway elements, such as utility poles and overhead cables. Voxel-based and point–voxel hybrid architectures provide effective spatial-context aggregation and can achieve strong semantic segmentation performance. However, their accuracy and computational cost depend on the chosen voxel resolution. Fine voxel sizes may be necessary to preserve the geometric support of thin structures, but they can increase memory consumption and processing time. Conversely, coarse voxelization may merge or remove the limited number of points representing poles and cables. Hybrid point–voxel methods can mitigate some of these limitations by combining point-wise and voxel-wise representations, but they still require an appropriate balance between spatial resolution, memory consumption, and runtime. Transformer-based point-cloud architectures constitute another relevant alternative. Through self-attention, they can model long-range dependencies and interactions between distant regions of a scene, which may be beneficial in complex urban environments. However, direct global attention over dense point blocks is computationally expensive. Practical transformer architectures therefore commonly rely on windowed attention, tokenization, hierarchical processing, or aggressive downsampling. While effective, these strategies introduce additional architectural choices and may remain computationally demanding for large MLS blocks. We therefore adopt a point-based U-Net architecture that operates directly on the native, irregular MLS point distribution, without projection or voxel quantization. The model uses enriched geometric descriptors to encode radial, angular, and relative-height information; geometry-aware attentive neighborhood aggregation to adaptively weight local context; saliency-guided hierarchical downsampling to retain locally informative point representations; and KNN interpolation with attention-gated skip fusion to recover fine-resolution features during decoding. These components are intended to reduce the progressive loss of geometric support affecting sparse and thin classes during hierarchical encoding.
Transformer-based and hybrid point–voxel architectures remain relevant alternatives for this task. A controlled comparison with recent efficient transformer and hybrid models, under identical input sizes, data splits, and runtime conditions, is left for future work.
3. RICO-3D: Roadway Infrastructure in Context New Dataset
In this section, we describe the main characteristics of the proposed dataset, including acquisition context, data model, and annotation strategy. To position our contribution,
Table 1 compares representative large-scale datasets used for 3D semantic segmentation.
3.1. Data Acquisition
The RICO-3D dataset was acquired using a survey-grade Leica Pegasus TRK300 mobile mapping system [
11]. This integrated platform is equipped with a dual-scanner LiDAR configuration, a high-precision Global Navigation Satellite System (GNSS) receiver coupled with an Inertial Measurement Unit (IMU) for robust and accurate georeferencing, and a set of panoramic cameras. This setup enables the simultaneous capture of dense 3D point clouds and corresponding high-resolution color imagery. For each point, the system records a rich set of attributes essential for advanced algorithmic development: 3D coordinates (x, y, z), RGB color values derived from the cameras, laser return intensity, a precise GPS timestamp, and the scan angle rank.
The data collection campaign was strategically conducted across three distinct French urban and peri-urban environments: Marseille, Rennes, and Opoul-Périllos. The three selected cities represent distinct French urban and peri-urban contexts: Marseille exemplifies a large Mediterranean coastal metropolis with dense infrastructure; Rennes represents a mid-sized Atlantic city with moderate urban density; and Opoul-Périllos captures peri-urban and rural roadway environments. This selection ensures diversity in urban morphology, building density, vegetation patterns, and infrastructure configurations. While geographically limited to France, the dataset’s temporal diversity—spanning multiple seasons and weather conditions—provides a complementary dimension of robustness testing. To further enhance the dataset’s diversity and challenge the robustness of learning algorithms, data acquisition was performed at different times of the year. This ensures a variety of seasonal conditions, including different foliage states for vegetation and varying sun angles, which significantly impact lighting, shadows, and overall scene appearance. Crucially, the campaign included sessions under diverse weather conditions, ranging from clear, sunny days to overcast skies and periods of light rainfall. The inclusion of data captured during rain is a significant feature of RICO-3D, as it introduces sensor noise, wet surfaces with altered reflectance properties, and other artifacts, providing a valuable and realistic test case for model robustness in adverse operating conditions.
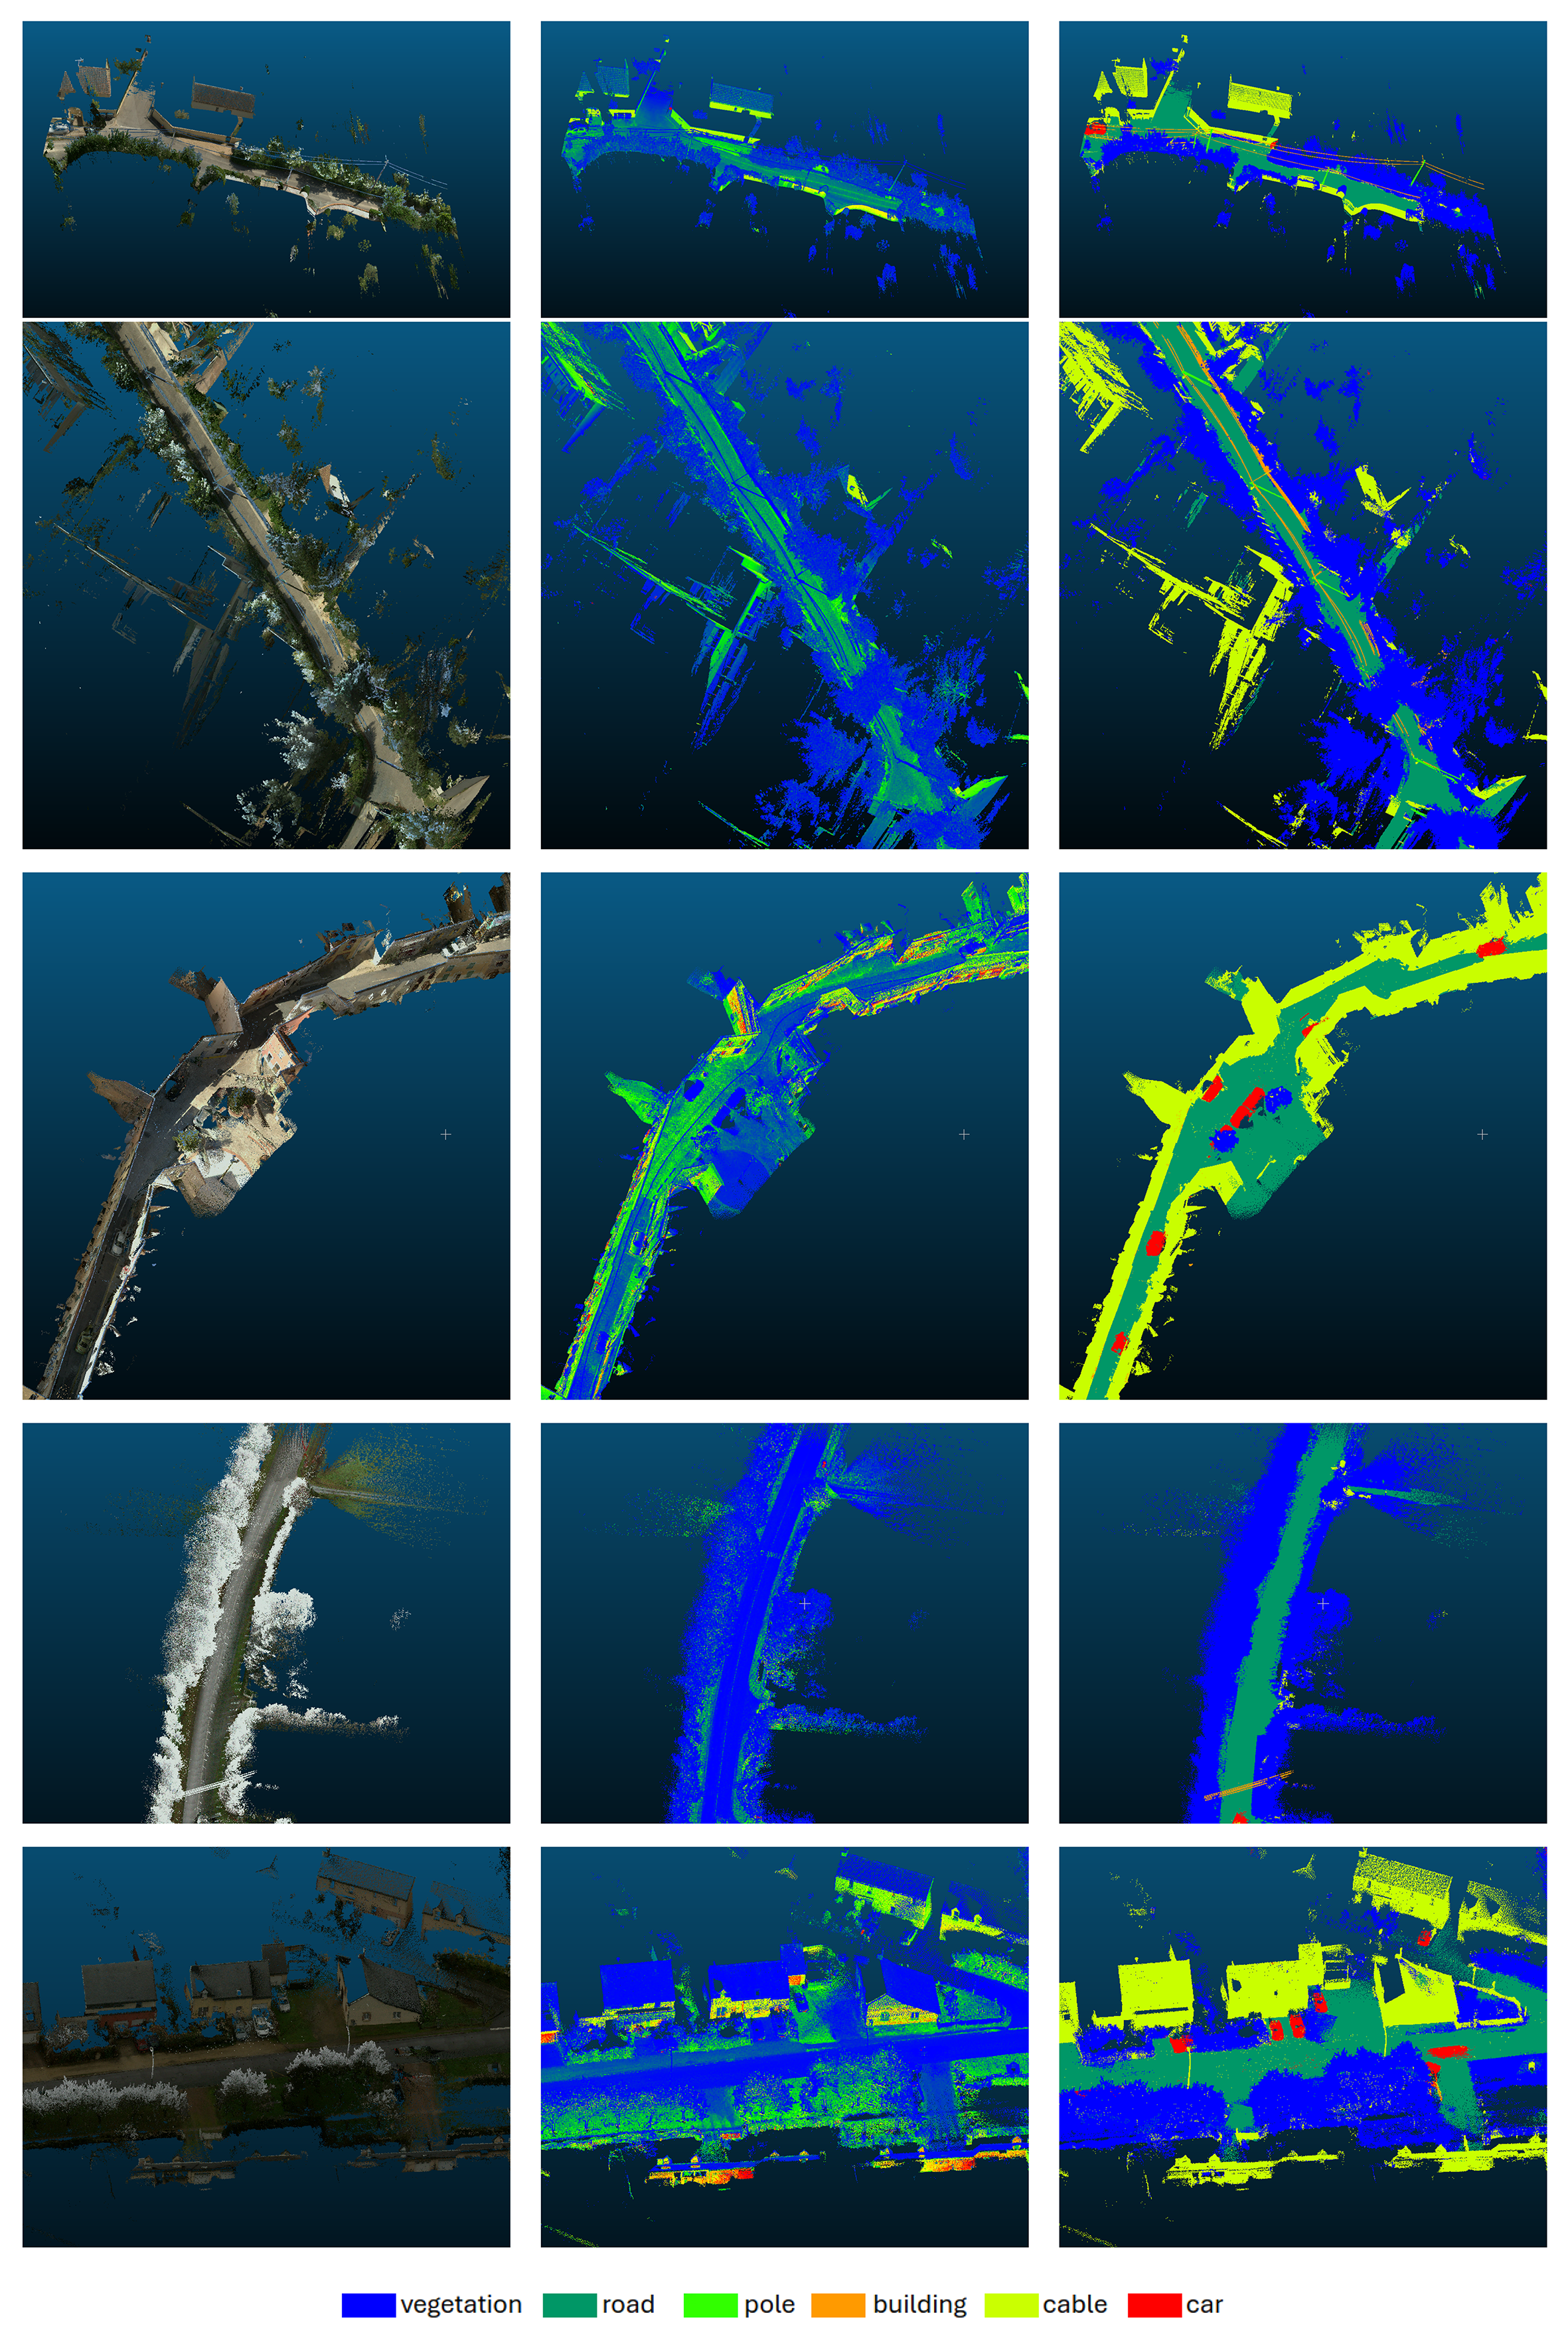
The resulting dataset is organized into 17 distinct tracks amounting to a total of approximately 30 GB of point cloud data. By combining data from diverse geographic locations, seasons, and weather patterns, RICO-3D provides a rich and challenging resource designed to foster the development of next-generation vision algorithms that are robust, scalable, and generalizable across real-world European urban environments. A sample from RICO-3D dataset is shown in
Figure 1. Each row corresponds to the same region of the point cloud.
3.2. Data Annotation
The annotation process for RICO-3D was designed to achieve high-quality, consistent per-point semantic labels across all 17 tracks while managing the considerable scale of the dataset (approximately 30 GB of point cloud data). We adopted a multi-stage annotation strategy that combined initial automated labeling, manual refinement, and active learning to ensure both efficiency and accuracy.
3.2.1. Initial Automated Labeling
For a subset of the tracks, we leveraged preliminary annotations provided by Leica Cyclone3DR [
25] as a starting point. Their automated labels served primarily as a rough initialization rather than a reliable ground truth, and substantial manual correction was required.
3.2.2. Manual Annotation with CloudCompare [26]
To establish high-quality ground truth annotations, we performed extensive manual labeling using CloudCompare, an open-source point cloud processing software widely adopted for its intuitive 3D visualization and segmentation tools. Following best practices from Paris-Lille-3D and other large-scale outdoor datasets, annotators were provided with detailed labeling guidelines and instructional materials to ensure consistency across different urban scenes and weather conditions. The annotation process involved 3 trained annotators following detailed labeling guidelines. To assess inter-annotator agreement, we computed Cohen’s Kappa on a representative subset of 50M points independently labeled by at least two annotators. The resulting Kappa value was 0.88, indicating an excellent agreement. The average annotation effort was approximately 10 h per 10M points, with significant variation across tracks due to scene complexity, weather conditions, and class distribution. Tracks with high vegetation density and rain-affected scans required longer annotation times due to increased occlusion and sensor noise.
The manual annotation workflow proceeded as follows:
Viewpoint-based segmentation: Annotators navigated the 3D point cloud, selecting optimal viewpoints to clearly distinguish object boundaries. For each object or surface, a closed polygon was drawn in the 2D projection, and all points inside the polygon were assigned the corresponding class label.
Iterative refinement: To handle occlusions and overlapping structures, annotators iteratively filtered already-labeled points (e.g., hiding all “road” points) to expose underlying or occluded objects. This iterative filtering strategy proved essential for accurately labeling complex urban scenes with multiple overlapping objects.
Class ontology: We defined a compact, roadway-centric class ontology consisting of six core semantic categories: vegetation, road, pole, building, cable, and vehicle. This ontology was specifically designed to address the needs of infrastructure management and telecom applications, with the cable class representing a novel contribution absent from most existing outdoor benchmarks. In this work, the cable category refers to externally visible overhead linear infrastructure captured by the MLS system, including telecommunication cables and power lines when present in the surveyed scenes. This category is operationally relevant because these assets share common geometric properties—thinness, elevation, linearity, and frequent occlusion by vegetation—while requiring automated mapping and monitoring workflows. The dataset is not intended to represent buried networks or cables that are not visible from the road-level acquisition viewpoint.
3.2.3. Active Learning with U-Next [27] and Visual Verification
Given the scale of the dataset and the labor-intensive nature of manual annotation, we adopted an active learning strategy to accelerate the labeling process while maintaining high annotation quality. After manually annotating a representative subset of the data, we trained an initial U-Next-based semantic segmentation model on these labeled samples. This model was then used to generate pseudo-labels for unlabeled portions of the dataset.
The active learning loop proceeded as follows:
Initial model training: A U-Next architecture [
27] was trained on a representative manually labeled subset of 3 tracks, learning to predict the six semantic classes from point cloud geometry, color, and intensity features.
Pseudo-labeling: The trained model was applied to unlabeled tracks to generate initial predictions.
Visual verification and manual correction: Rather than relying solely on automated metrics, annotators visually inspected the model predictions in CloudCompare. Regions where predictions appeared visually inconsistent with the point cloud appearance were flagged for manual review and correction. This visual inspection process naturally identified regions of high prediction uncertainty (e.g., ambiguous boundaries, thin structures with low visual confidence). Particular attention was paid to:
- -
Thin structures (poles, cables) that are often under-represented in training data.
- -
Boundary regions between classes (e.g., road–vegetation transitions).
- -
Occluded or ambiguous regions where the model confidence was visually apparent to be low.
Iterative refinement: Corrected labels were added to the training set, and the model was retrained, progressively improving its accuracy and reducing the manual annotation burden.
This pragmatic approach leverages both automated model predictions and human visual expertise, allowing annotators to focus their effort on the most problematic regions rather than reviewing all predictions uniformly. This strategy proved particularly effective for sparse and geometrically thin classes such as poles and cables, where visual inspection by trained annotators is more reliable than automated confidence thresholds alone.
3.2.4. Dataset Statistics and Class Distribution
The final RICO-3D dataset comprises 780,981,961 labeled points distributed across 17 tracks captured in Marseille, Rennes, and Opoul-Périllos.
Table 2 presents the detailed point distribution per track and per semantic class. The dataset exhibits a realistic class imbalance characteristic of urban roadway environments. The dominant classes are vegetation (35.62%, 278.2M points) and road (44.5%, 347.8M points), which together account for nearly 80% of all labeled points. Building facades represent 18.24% (142.4M points), reflecting the dense urban fabric of the surveyed cities. The infrastructure-specific classes—pole (0.16%, 1.25M points), cable (0.23%, 1.8M points), and vehicle (1.20%, 9.4M points)—are significantly under-represented, posing a challenging long-tail distribution problem for learning algorithms. Notably, the cable class, which is absent from most existing benchmarks, accounts for over 1.8 million labeled points, providing a unique resource for research on thin overhead infrastructure detection.
It is important to note that our pole class definition differs from other datasets such as Toronto-3D. In RICO-3D, poles exclusively refer to utility poles (electrical and telecommunication infrastructure), and do not include street lamps, traffic signs, or bollards. This more restrictive definition reflects the specific needs of infrastructure management and telecom applications, where distinguishing utility poles from other vertical street furniture is critical for network planning and maintenance operations. In contrast, Toronto-3D adopts a broader pole definition that encompasses lamp posts and traffic sign poles alongside utility poles, making direct cross-dataset comparison challenging for this class. Our restrictive definition, while more aligned with real-world infrastructure management requirements, also contributes to the class’s extreme under-representation (0.16% of total points) and increases the difficulty of detection, as utility poles must be distinguished from visually similar but functionally different vertical structures. While Toronto-3D does include a “utility line” class analogous to our cable class, the scale and representation differ significantly. Toronto-3D’s utility line class represents only 0.5% of the dataset (approximately 390K points over 78M total), whereas RICO-3D provides over 1.8M cable points across a much larger dataset (780M points). This increased scale and the diversity of cable configurations across French urban environments (overhead power lines, telecom cables, tramway catenaries) make RICO-3D particularly valuable for developing robust overhead infrastructure detection algorithms that must generalize across different cable types, heights, and urban contexts.
3.2.5. Per-Track Variability
The distribution of classes varies significantly across tracks, reflecting the diversity of urban typologies and acquisition conditions. This variability ensures that models trained on RICO-3D must generalize across diverse scene compositions, seasonal variations, and weather conditions (including rain-affected scans), as shown in
Table 3. By combining manual annotation, active learning, and rigorous quality control, we achieved a high-fidelity labeled dataset that captures the complexity and diversity of French urban roadways under varying seasonal and weather conditions. This annotation strategy balances scalability with accuracy, providing a valuable resource for advancing research in MLS-based semantic segmentation.
3.2.6. Train/Validation/Test Split Strategy
To ensure the validity and reproducibility of the experimental evaluation, we adopted a track-level split strategy rather than random point-wise sampling. This approach preserves geographic coherence, prevents data leakage from spatially adjacent points, and ensures that the model generalizes across distinct urban scenes. Not all 17 tracks were used for model training. We selected a representative subset of 8 tracks that collectively ensure:
Diverse urban typologies (dense urban, mid-size city, peri-urban).
Adequate representation of minority classes (pole and cable).
Balanced seasonal and weather conditions.
Specifically, the training subset was selected to provide sufficient examples of the minority classes in aggregate and to ensure that the model is exposed to meaningful examples of all six semantic classes during optimization; however, the presence of Pole or Cable points in every individual training track was not required. The validation and test sets were constructed from held-out tracks, ensuring geographic and seasonal diversity while maintaining the class distribution characteristics of the full dataset. The detailed track assignment for each subset is provided in
Table 4. This track-level separation ensures that validation and test performance reflect the model’s ability to generalize to unseen urban scenes rather than to unseen points within the same scene.
3.3. Challenges for Learning Algorithms
The statistics reveal several key challenges:
Severe class imbalance: The ratio between the most frequent class (road, 44.54%) and the rarest (pole, 0.16%) exceeds 230:1, requiring careful loss weighting or sampling strategies.
Thin structure detection: Poles and cables are geometrically sparse and often occluded, demanding models with fine spatial resolution and strong context aggregation.
Domain shift across tracks: The high variability in class distributions across tracks (e.g., 0–67% vegetation, 0–53% building) tests model robustness to scene composition changes.
Weather robustness: Rain-affected scans introduce noise, reflectance changes, and artifacts, challenging models trained primarily on clear-weather data.
These characteristics make RICO-3D a rigorous testbed for next-generation vision systems that must operate reliably in real-world infrastructure monitoring and autonomous navigation applications.
4. Proposed Optimized Architecture: Geometry-Aware Attention U-Net
This section presents our proposed GA-Attention (Geometry-Aware Attention U-Net), a point-based encoder–decoder architecture for semantic segmentation of large-scale MLS point clouds. The model is specifically designed for roadway environments, where semantic prediction is challenged by strong class imbalance, irregular point density, and the presence of sparse thin structures such as utility poles and overhead cables. In such scenes, standard local aggregation and hierarchical sampling strategies often favor dominant classes, while minority structures progressively lose their geometric support during encoding and become harder to recover during decoding.
The proposed method does not rely on a single entirely new operator. Instead, its contribution lies in the task-oriented integration of several complementary components within a unified segmentation framework. More precisely, the model combines (1) an enriched geometric input representation, (2) geometry-aware attentive local feature aggregation, (3) saliency-guided hierarchical downsampling, (4) attention-gated skip fusion in the decoder, and (5) a curriculum-based training strategy that progressively expands the spatial context seen during optimization. This combination was designed to better preserve and recover sparse infrastructure classes in MLS roadway scenes.
4.1. Input Representation
Each training sample is represented as a local point block comprising point coordinates, point-wise features, and semantic labels. In the implementation, each point block is described by local coordinates of size
and a 7-dimensional feature vector of size
. The input feature representation is constructed by concatenating the base point attributes with three additional normalized geometric descriptors: normalized radial distance
, normalized azimuthal angle
, and normalized relative height
. For each point
i within a block:
where the centered coordinates are defined as:
with
representing the block size, and
denoting the spatial extent of the block in the horizontal plane.
Justification of Normalization Constants
The normalization constants in Equations (1)–(3) are selected to ensure that all geometric descriptors are bounded and scale-invariant, facilitating stable learning across diverse urban scenes.
Radial distance (0.707 factor): For a square block of size , the maximum radial distance from the center to a corner is . Dividing by this factor ensures that for all points within the block, making the representation scale-invariant and independent of block size. This is a principled geometric normalization derived from the Euclidean distance in a square domain.
Relative height (20.0 divisor): The constant 20.0 m represents the typical maximum height of structures in urban roadway environments, including buildings (15–20 m), tall trees (10–15 m), and utility poles (5–8 m). This empirical value was selected based on the characteristics of RICO-3D and ensures that for typical urban scenes. This normalization makes the height feature comparable across different acquisition conditions and geographic locations.
For other application domains (e.g., forest canopies with heights up to 40 m, tall buildings exceeding 50 m, or bridge inspection), this parameter should be adjusted to match the characteristic height range of the target environment. The principle remains identical: normalize by the maximum expected height in the domain of interest.
The resulting feature vector for each point is expressed as:
where
denotes the base feature channels (RGB color and intensity), and the three additional terms provide normalized geometric information derived from the point’s spatial location.
This enriched feature representation constitutes a key design choice of the proposed framework. Rather than relying solely on raw Cartesian coordinates and appearance attributes, the model incorporates compact geometric descriptors that are directly relevant to MLS roadway scene analysis. In practice, these additional geometric cues prove particularly effective for distinguishing between classes that exhibit similar local appearance but distinct spatial configurations, such as vertical structures (poles) and elevated linear features (cables).
4.2. Overall Network Architecture
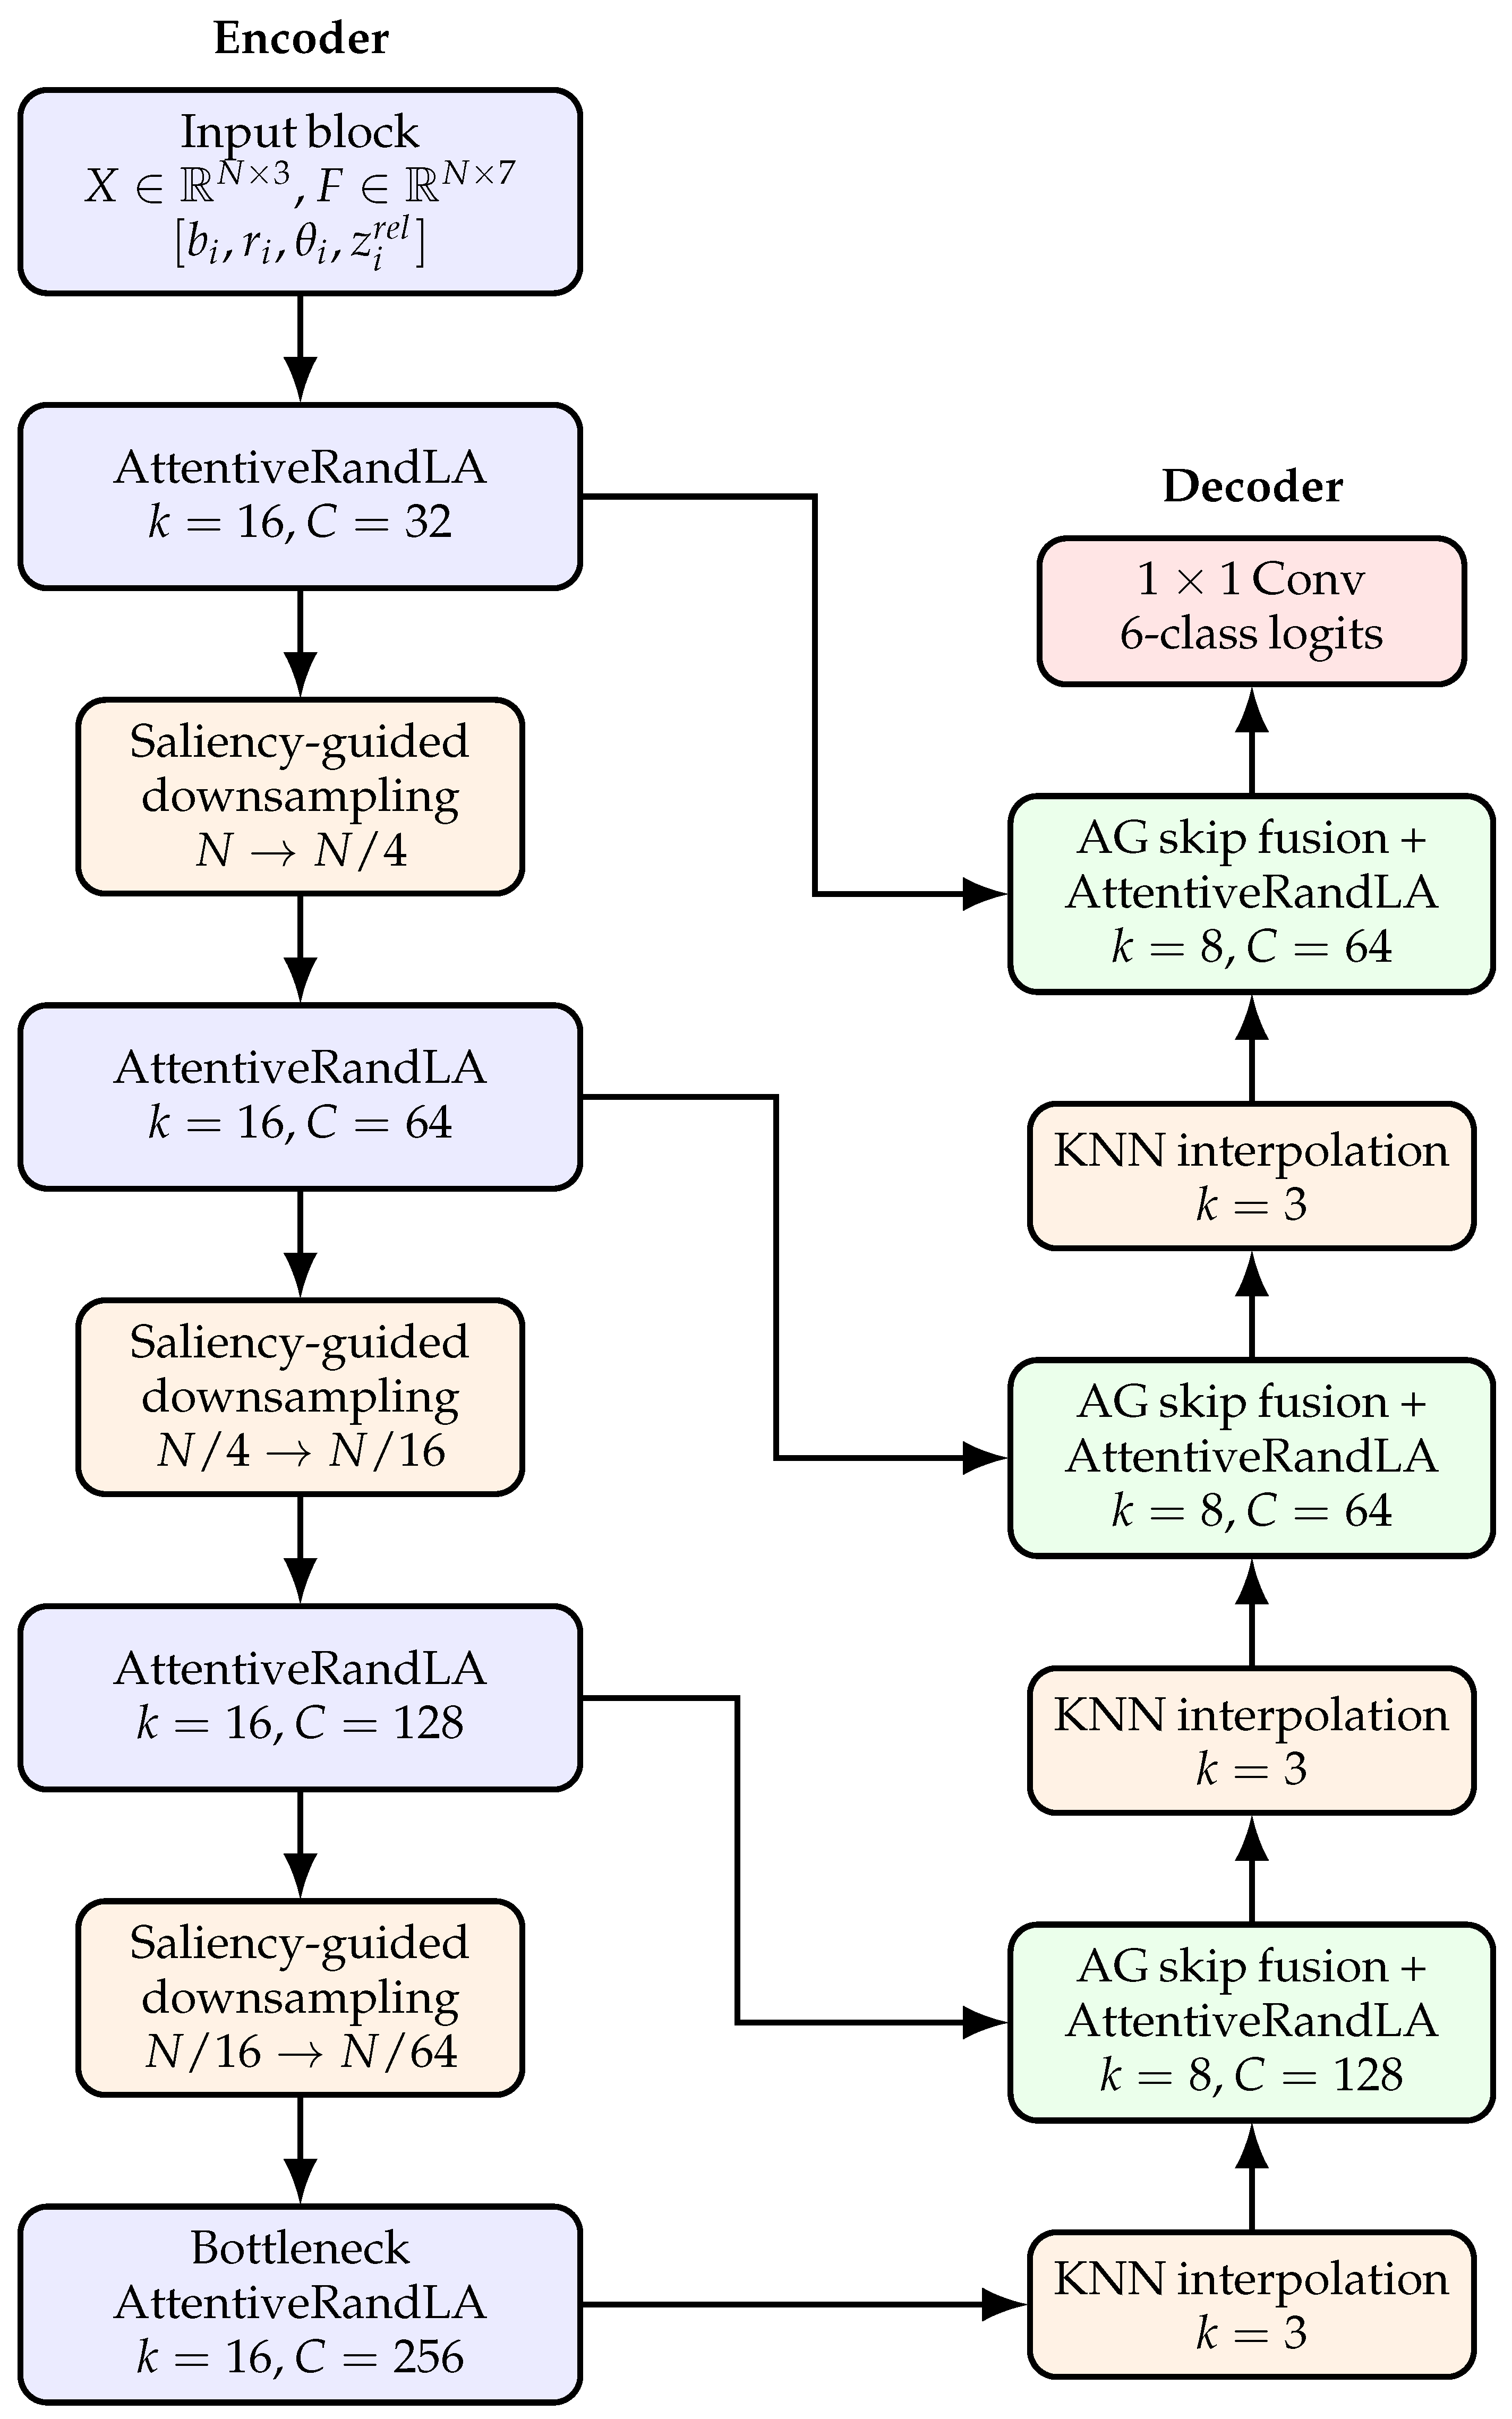
The network follows a U-Net-like point-based encoder–decoder architecture, as shown in
Figure 2. Coordinates and point features are processed separately at the input and then converted into channel-first format for convolutional operations. The encoder consists of three hierarchical stages followed by a bottleneck block, while the decoder contains three successive upsampling and refinement stages. A final
convolution maps the decoder output to the six semantic classes of the dataset.
The encoder feature dimensions are 32, 64, 128, and 256 channels. The first three encoder stages are followed by hierarchical sampling, reducing the number of points from N to , then to , and finally to before the bottleneck. The decoder progressively reconstructs denser feature representations through interpolation and skip-based fusion, with refinement blocks producing 128, 64, and 64 output channels, respectively.
The architecture was designed to preserve a favorable trade-off between representational power and computational efficiency. It remains fully point-based and avoids voxelization or projection, which is advantageous for MLS scenes containing irregular, anisotropic, and geometrically thin structures.
4.3. Geometry-Aware Attentive Local Aggregation
The basic feature extraction unit of the network is the AttentiveRandLA block. This block performs local feature aggregation over a K-nearest-neighbor graph while explicitly encoding the geometry of each local neighborhood. In the encoder and bottleneck stages, the neighborhood size is set to , whereas in the decoder refinement blocks it is reduced to .
For each point, the local neighborhood is first computed from the 3D coordinates, using the squared-distance function. The nearest neighbors are then selected from the resulting distance matrix, with dynamic adjustment of the effective neighborhood size when the available number of points is smaller than the target value of k.
Once the neighborhood has been identified, the block constructs an explicit local spatial encoding by concatenating the center coordinates, the neighbor coordinates, the relative displacement, and the Euclidean norm of the displacement. This produces a 10-channel geometric descriptor for each center–neighbor pair. These descriptors are transformed through a shared point-wise multilayer perceptron implemented with a convolution, batch normalization, and LeakyReLU activation. In parallel, the neighboring point features are gathered and concatenated with the encoded spatial descriptors.
Instead of using a fixed symmetric operator such as max-pooling, the block estimates attention scores over the neighborhood and applies softmax normalization along the neighbor dimension. The final local representation is obtained through weighted aggregation followed by a point-wise output projection. This design allows the network to adaptively modulate the contribution of neighboring points according to both learned features and local geometry, which is particularly useful when minority classes are embedded in dominant surrounding structures. The attentive local aggregation is related to the principles introduced in RandLA-Net, but here it is integrated into a dedicated encoder–decoder pipeline together with saliency-guided sampling and attention-gated decoding.
4.4. Saliency-Guided Hierarchical Downsampling
Hierarchical downsampling is required to control the computational cost of large-scale point-cloud segmentation. However, random or geometry-only sampling may discard informative points belonging to sparse classes, such as poles, cables, and vehicles. We therefore use a learned score-guided local competitive sampling mechanism at each encoder transition. Let
denote the feature vector associated with point
i at encoder level
l. A scalar score is computed independently for each point using a point-wise scoring branch:
where
and
are implemented using
convolutions. The scalar
is an unnormalized point score. At each transition, the points are partitioned into disjoint local groups
of four points using their retained Euclidean coordinates. The grouping procedure is deterministic. The first unassigned point is used as a reference, its three nearest unassigned points are added to the same group, and all four points are then removed from the candidate set. Distance ties are resolved using the original point index. For each group, the hard forward selection is defined as
To preserve this hard one-point-per-group behavior while allowing the final segmentation loss to optimize the scoring branch, we use a straight-through relaxation. First, a soft group-wise selection distribution is computed as
where
is a temperature parameter. The effective selection mask is
Thus, the forward pass uses the hard one-hot selection mask, while the backward pass uses the soft relaxation. The selected feature is computed as
Consequently, the final segmentation loss provides a gradient path to the point scores and to the parameters of the scoring branch. No explicit point-level saliency annotation or auxiliary saliency loss is used. Since each group contains four points and the groups are disjoint, the procedure produces exactly
unique points whenever
N is divisible by four. Applying the procedure at the three encoder transitions gives:
Unlike random sampling, this local competitive selection prioritizes, within each spatial neighborhood, the point with the highest task-related score. The objective is not to predict a semantic class at the sampling stage, but to retain the point representation that is most informative for the final segmentation task. This mechanism is intended to preserve distinctive geometric and semantic representations during encoding, particularly for thin and under-represented roadway infrastructure.
4.5. Decoder with Attention-Gated Skip Fusion
At the coarsest resolution, the bottleneck block produces the deepest feature representation of the point cloud. The decoder reconstructs finer-resolution features through repeated interpolation and selective fusion with encoder outputs. Feature propagation is implemented using K-nearest-neighbor interpolation. For each fine-resolution point, the decoder retrieves the three nearest coarse neighbors and reconstructs the fine feature by inverse-distance weighted interpolation.
To improve feature fusion across scales, the decoder uses attention-gated skip connections. At each decoder level, the interpolated decoder features and the corresponding encoder features are first projected through convolutions followed by batch normalization. The two transformed tensors are then summed, activated with ReLU, and converted into a sigmoid attention mask. This mask modulates the encoder features before they are concatenated with the decoder representation.
Three attention gates are used, with intermediate dimensions of 64, 32, and 16 channels, respectively. This design allows the decoder to selectively recover useful encoder information while suppressing irrelevant low-level responses. Such selective fusion is beneficial in roadway MLS scenes, where early encoder layers often contain strong responses from large background structures, whereas the target classes of interest may correspond to sparse and thin objects. The use of attention gates is related to Attention U-Net, but here it is adapted to point-wise decoder fusion in a point-cloud segmentation framework.
4.6. Training Strategy
The network is trained under strong class imbalance. The main optimization objective combines weighted cross-entropy [
28], focal loss [
29], and Lovász-Softmax [
30]. The final loss is written as a weighted sum of these three terms, with coefficients controlled during training. This combined approach [
31] provides a more comprehensive training objective, tackling the segmentation challenge from three complementary perspectives: pixel-level class representation (weighted cross-entropy), classification difficulty (focal loss), and segment-level spatial coherence (Lovász-Softmax). In addition, the training process includes an explicit curriculum learning strategy [
32]. At the beginning of training, the crop size is restricted to
, corresponding to highly local spatial blocks. At epoch 40, the crop size is increased to
, and the Lovász and focal components are activated with nonzero weights. At epoch 60, the crop size is increased to
, corresponding to the full local context used in the final training phase, and the number of sampled points. This progressive schedule allows the model to first focus on local geometric patterns and then gradually incorporate broader spatial context. Such a curriculum design is consistent with prior work showing that progressive training from simpler to more complex spatial contexts can improve convergence behavior in computer vision tasks, especially under unbalanced data distributions.
4.7. Method Positioning and Contribution
The proposed framework is a geometry-aware integrated architecture. Its originality lies in the joint use of enriched geometric input descriptors, attentive local aggregation, saliency-guided hierarchical sampling, attention-gated skip fusion, and curriculum-based training within a single point-based U-Net for MLS roadway semantic segmentation. GA-Attention is not claimed to introduce a completely new primitive operator. Instead, it is a task-oriented integration of complementary architectural and training components within a unified point-based U-Net framework for MLS roadway semantic segmentation. The proposed design combines enriched geometric descriptors, geometry-aware attentive local aggregation, saliency-guided hierarchical downsampling, attention-gated skip fusion, and curriculum-based training. The motivation for this integration is specific to RICO-3D and similar MLS roadway datasets, where dominant classes coexist with sparse, thin, and frequently occluded infrastructure elements such as utility poles and overhead cables. In particular, the design aims to preserve informative minority-class points during hierarchical encoding and to recover fine-scale spatial details during decoding. The contribution of the proposed framework therefore lies in the coordinated use and adaptation of these components for infrastructure-oriented MLS segmentation, rather than in claiming novelty for each component individually. Compared with existing point-based and benchmark implementations, the proposed model remains lightweight and practical while explicitly targeting the preservation of minority geometric structures throughout the encoding and decoding process. As shown in the experimental section, this design leads to a favorable compromise between segmentation accuracy and inference efficiency on RICO-3D. In particular, the gains observed on road and cable segmentation support the relevance of the proposed integration for infrastructure-oriented MLS analysis.
5. Results and Discussion
This section reports the quantitative performance of the proposed GA-Attention model on RICO-3D and discusses its behavior with respect to recent baseline methods. Table 6 summarizes the overall accuracy, mean Intersection-over-Union (mIoU), per-class IoU, and inference time for all compared approaches. The evaluation includes two U-Next variants, 3D-UMamba, EyeNet, RandLA-Net (Open3D-ML), and our proposed method.
5.1. GA-Attention Training Details and Hyperparameter Configuration
GA-Attention was trained using the AdamW optimizer with an initial learning rate of
and a weight decay of
. A cosine-annealing learning rate schedule was applied over a maximum of 750 epochs. Training used a batch size of 16. Early stopping was applied based on the validation loss, with a patience of 100 epochs. The checkpoint achieving the lowest validation loss was retained for final evaluation. The training objective was defined as:
where
denotes weighted cross-entropy, which assigns larger penalties to errors on under-represented classes;
denotes focal loss with focusing parameter
, which down-weights well-classified examples and emphasizes difficult or misclassified points; and
denotes Lovász-Softmax loss, a differentiable surrogate designed to directly optimize the Intersection over Union (IoU) metric. Training followed a three-stage curriculum strategy. During the first stage (epochs 0–39), the model was trained on local crops of
m using only the weighted cross-entropy term (
,
). At epoch 40, the crop size was increased to
m and the loss weights were set to
,
, and
. At epoch 60, the crop size was increased to
m and the number of sampled points per block was set to 12,288.
The validation set was used for early stopping, checkpoint selection, and hyperparameter selection. The test set was not used during model selection and was reserved for final performance reporting. No additional geometric or photometric data augmentation was applied.
5.2. Experimental Setup
All experiments were conducted on a workstation running Ubuntu 22.04.5 LTS, equipped with a single NVIDIA RTX A6000 GPU with 49 GB memory. The models were implemented in Python 3.10.12 using PyTorch 2.10.0 with CUDA 12.8 and cuDNN 9.10. Baseline implementations and experimental settings are shown in
Table 5. All training and inference experiments were performed under the same hardware and software environment. The inference times reported in
Table 6 were measured on a single RICO-3D track covering approximately 3.6 km.
5.3. Quantitative Comparison on RICO-3D
As shown in
Table 6, the proposed method achieves the highest overall accuracy with 83.36%, outperforming all competing methods. In particular, it improves accuracy by +0.80 points over the strongest U-Next variant (82.56%) and by +2.59 points over RandLA-Net (Open3D-ML) (80.77%). These results indicate that the proposed architecture provides a strong global classification performance on RICO-3D despite the severe class imbalance of the dataset. In terms of mean IoU, RandLA-Net (Open3D-ML) achieves the best result with 61.56%, whereas our method reaches 60.66%, representing a marginal gap of only 0.90 points. However, it is important to recall that RICO-3D is a dataset specifically designed for telecom infrastructure inspection, where the most critical semantic categories are Cable and Pole. Therefore, we also report the Infrastructure mIoU, defined as the mean IoU over the Pole and Cable classes:
GA-Attention achieves the best Infrastructure mIoU of 53.00%, compared with 47.93% for RandLA-Net (Open3D-ML). More specifically, GA-Attention obtains the highest IoU for Pole (49.91%) and Cable (56.08%), improving over RandLA-Net (Open3D-ML) by 5.27 and 4.87 percentage points, respectively. It also achieves the highest Road IoU (91.35%). These results indicate a trade-off between global class-balanced performance and infrastructure-specific performance. RandLA-Net (Open3D-ML) provides the best global mIoU, whereas GA-Attention is more effective for the sparse and thin Pole and Cable classes targeted by the proposed benchmark. The lower scores of GA-Attention on classes such as Vegetation, Building, and Vehicle explain why its overall mIoU remains slightly below that of RandLA-Net (Open3D-ML). In this context, global mIoU remains an essential class-balanced metric, while Infrastructure mIoU is reported as a complementary task-specific metric.
A more detailed inspection of the per-class IoU values reveals the main strengths of the proposed method. Our model achieves the best Road IoU with 91.35%, substantially higher than RandLA-Net (Open3D-ML) (85.32%), EyeNet (72.15%), and 3D-UMamba (61.74%). More importantly for the inspection context, it obtains the best Cable IoU with 56.08%, surpassing RandLA-Net (Open3D-ML) (51.21%) and largely outperforming 3D-UMamba (17.20%) and EyeNet (22.58%). In addition, the proposed method reaches the best Pole IoU with 49.91%, above RandLA-Net (Open3D-ML) (44.64%) and clearly above all other baselines. These results are particularly significant because poles and cables correspond to the sparsest and geometrically thinnest classes in the dataset, and they represent the most critical categories for large-scale MLS-based telecom infrastructure inspection.
By contrast, the proposed method does not achieve the best score on all classes. The highest Vegetation IoU is obtained by 3D-UMamba (86.77%), while the best Building IoU is also reached by 3D-UMamba (72.18%). Similarly, the best vehicle IoU is achieved by U-Next (XYZ+RGB+I) with 64.05%, whereas our method obtains 32.63%. These differences suggest that the proposed architecture is particularly advantageous for roadway surfaces and thin infrastructure elements, which are the primary targets of the RICO-3D benchmark, but less dominant on larger or more compact object classes such as vegetation, buildings, and vehicles. 3D-UMamba, on which the 3D-UMamba implementation is based, was proposed as a U-Net framework integrating Mamba for LiDAR semantic segmentation across multiple datasets, including Toronto-3D. EyeNet was proposed as a human vision-inspired network for large-scale outdoor point-cloud semantic segmentation.
From a runtime perspective, the proposed method also provides a favorable compromise between accuracy and efficiency. Its inference time is 8.17 s, which is significantly lower than that of 3D-UMamba (20.32 s), EyeNet (15.9 s), and RandLA-Net (Open3D-ML) (11.27 s). Although it is slower than the two U-Next variants (5.99 s and 6.65 s), it delivers substantially better Pole, Road, and Cable IoU than both U-Next configurations. Therefore, the proposed model offers a competitive accuracy–efficiency trade-off for RICO-3D, especially when the segmentation of sparse roadway infrastructure is a priority.
Overall, the results indicate that the proposed architecture is not the strongest model in terms of average class-wise balance, but it is highly effective on the classes that are the most challenging and operationally relevant for our dataset. In particular, its strong performance on Road, Pole, and Cable suggests that the combination of enriched geometric descriptors, attentive local aggregation, saliency-guided downsampling, and attention-gated decoding is beneficial for preserving thin and sparse structures throughout the segmentation pipeline.
5.4. Qualitative Error Analysis
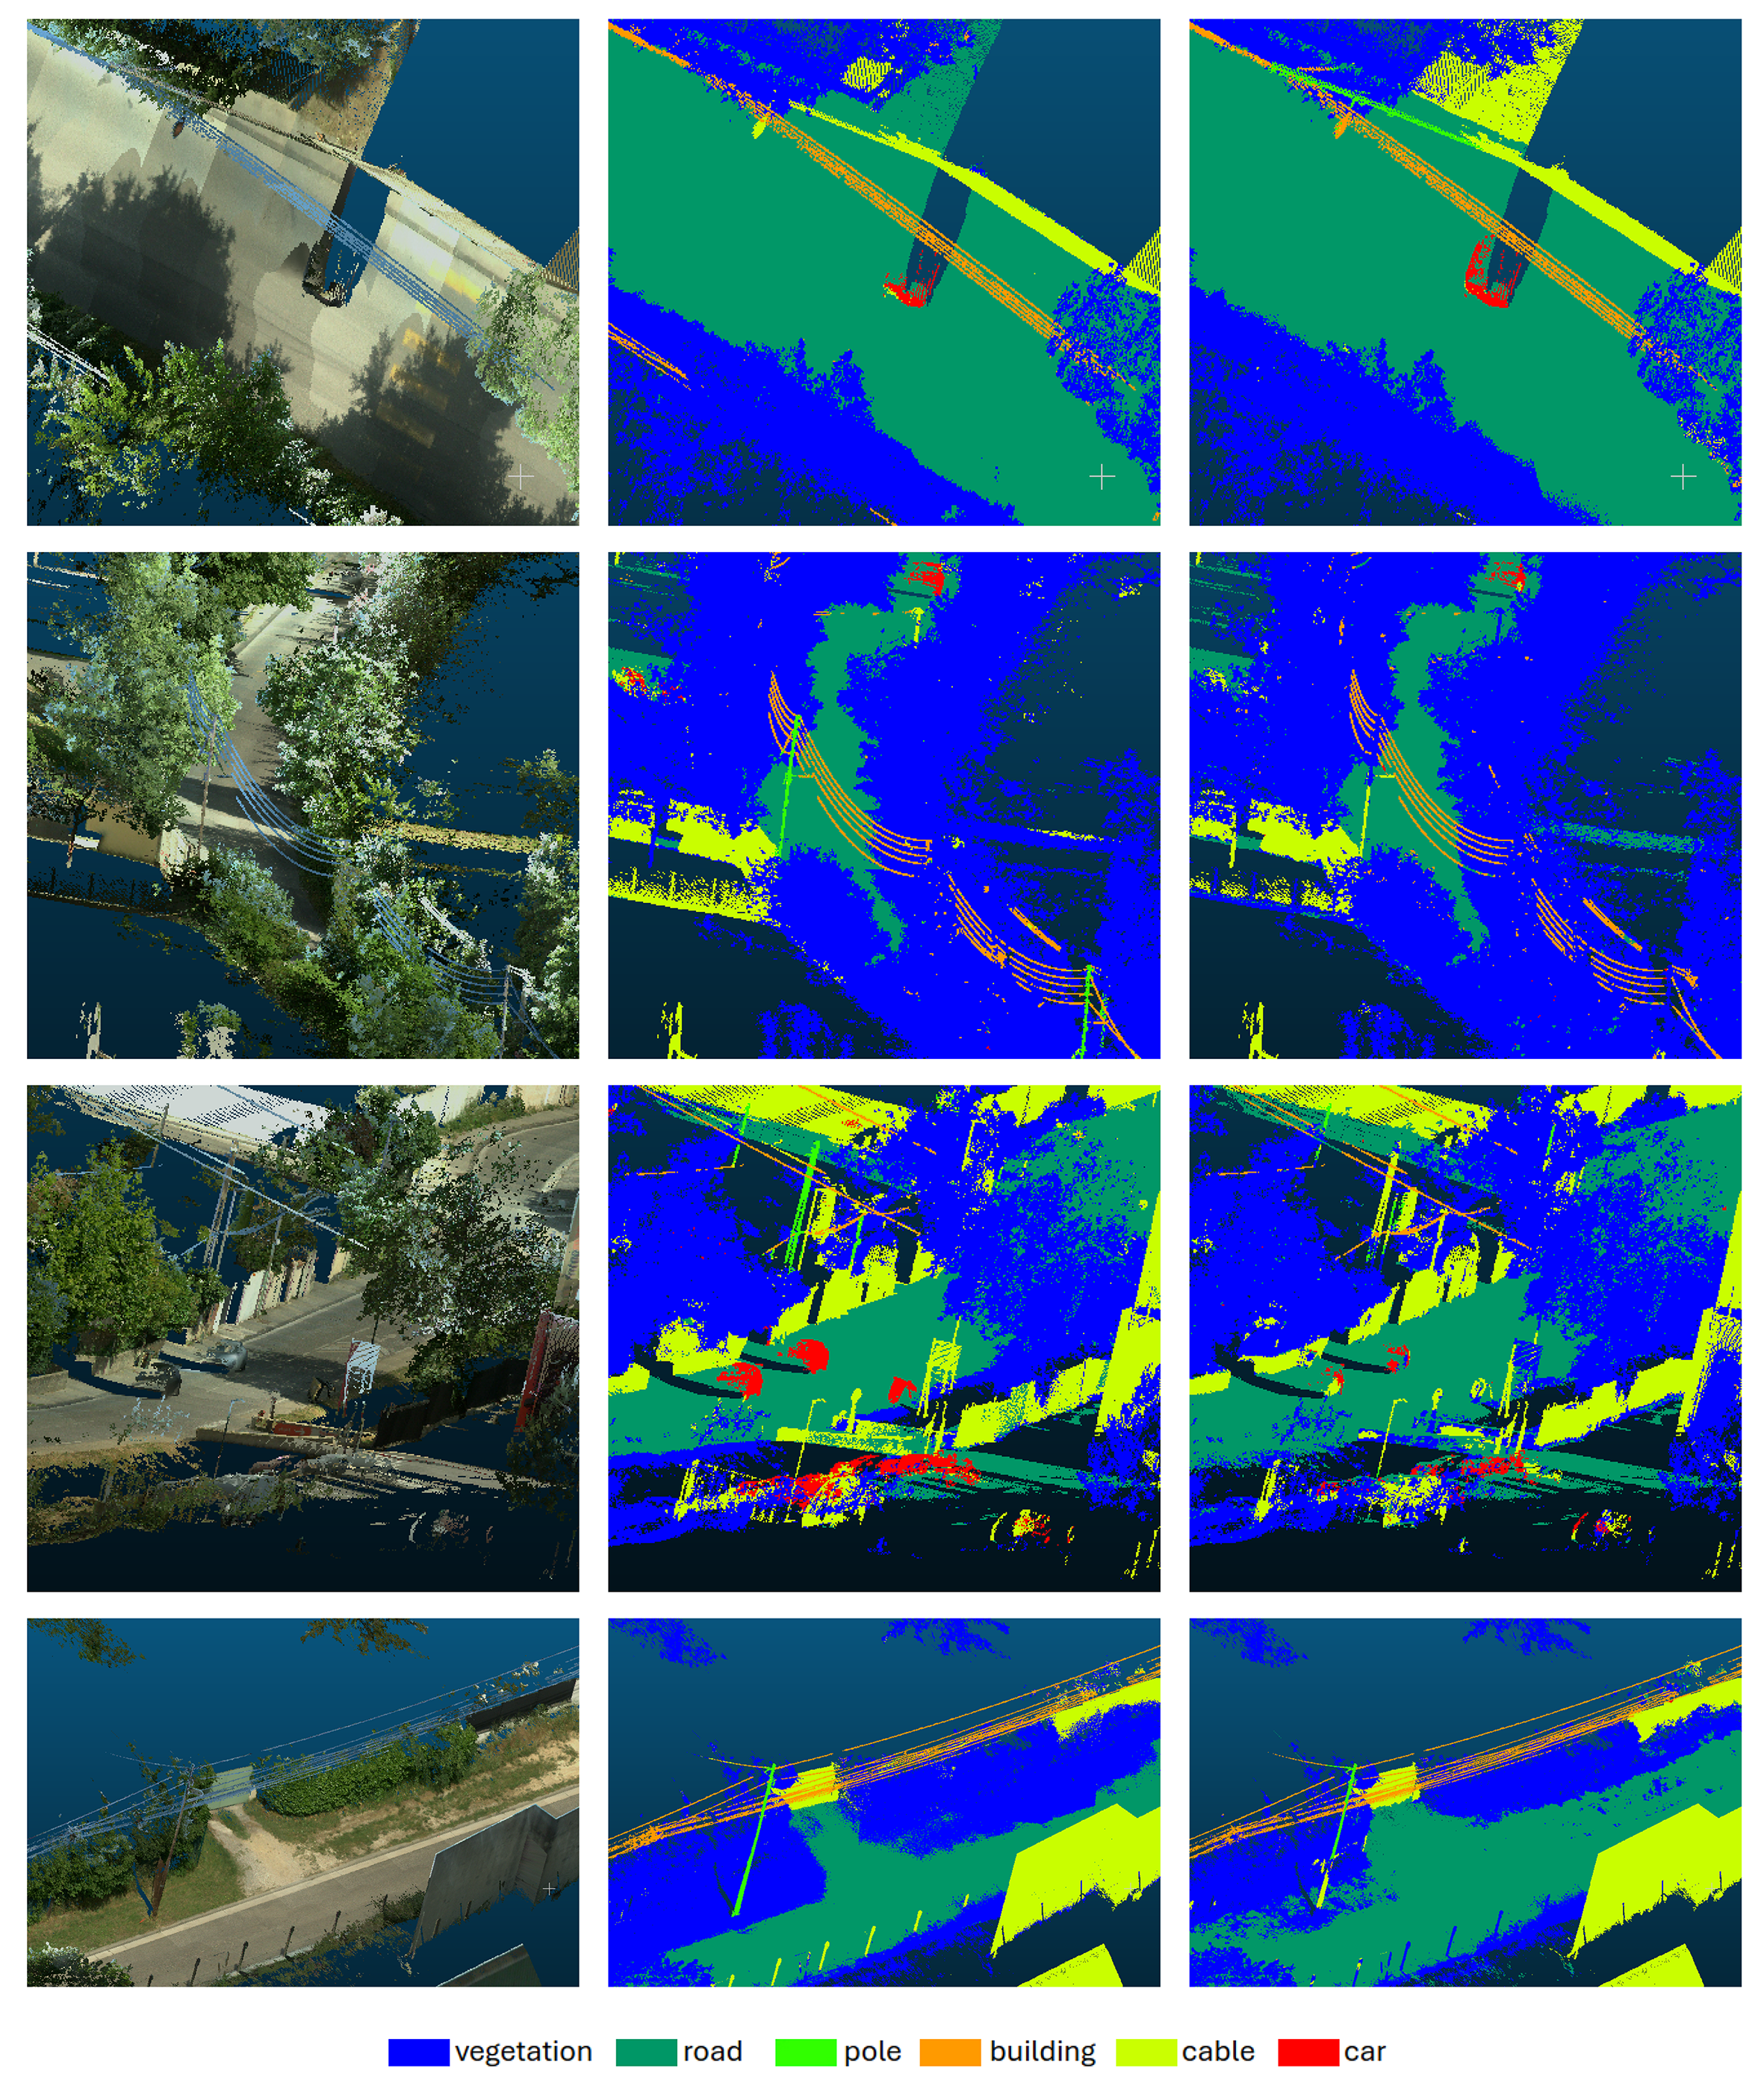
To complement the quantitative evaluation,
Figure 3 presents four representative examples from held-out RICO-3D tracks. For each scene, the RGB point cloud is compared with the ground-truth semantic annotation and the predictions. The selected examples focus on challenging configurations containing vegetation, buildings, roads, utility poles, vehicles, and overhead cables. The first example shows a largely correct segmentation of the main road surface, the vehicle, and the overhead cable structure. In particular, the predicted cable segments remain spatially coherent despite their small geometric support relative to the surrounding road and vegetation points. The second example illustrates a more challenging configuration in which several cable segments pass through dense vegetation. GA-Attention recovers the main elevated cable trajectories, although local discrepancies remain in cluttered areas where cables overlap visually and geometrically with vegetation. The third and fourth examples further illustrate the difficulty of urban scenes with multiple adjacent semantic structures. In these cases, the model correctly identifies substantial portions of the road, building, pole, and cable classes. However, errors remain near class boundaries, particularly in regions containing dense vegetation, building facades, partially visible poles, and cable–vegetation intersections. Some cable and pole points are missed or locally assigned to neighbouring classes, while some vegetation and building boundaries are not fully preserved. Overall, these examples are consistent with the quantitative results reported in
Table 6: GA-Attention can recover meaningful portions of thin overhead infrastructure in complex MLS scenes.
5.5. Evaluation on Toronto-3D
To further assess the behavior of the proposed model on an external MLS benchmark, we also evaluated it on Toronto-3D, as shown in
Table 7. We trained the model from scratch on the official Toronto-3D training split and evaluated it on the corresponding held-out test split. No pretraining on RICO-3D, fine-tuning from RICO-3D, or zero-shot transfer was used. On this dataset, the model achieves an overall accuracy of 82.18% and an mIoU of 56.50%. These results confirm that the proposed architecture remains effective beyond RICO-3D and can be applied to a second roadway LiDAR dataset with a different class ontology.
Several observations can be drawn from these results. First, the model performs particularly well on Roadmarking and Building, indicating that it can effectively recover both structured surface patterns and large urban objects. Second, the performance on Utility line and Pole remains relatively consistent with the behavior observed on RICO-3D, which is encouraging since these two classes correspond to sparse and thin infrastructure categories. Hence, the results indicate that the proposed model remains robust on a second MLS dataset and preserves competitive performance on thin infrastructure classes, which is one of the central motivations of this work.
5.6. Discussion
Overall, the results demonstrate that GA-Attention provides a strong compromise between infrastructure-oriented segmentation performance and inference efficiency. On RICO-3D, the method achieves the best overall accuracy (83.36%) and the highest IoU for Road (91.35%), Pole (49.91%), and Cable (56.08%). In particular, the strong performance on Pole and Cable is relevant to the intended infrastructure inspection setting, since these classes are sparse, thin, frequently occluded, and represent only 0.16% and 0.23% of the labeled points, respectively. However, the results also reveal an important limitation. GA-Attention obtains a Vehicle IoU of 32.63%, which is substantially lower than the 64.05% obtained by U-Next (XYZ+RGB+I). This difference cannot be explained by class frequency alone: Vehicle accounts for 1.20% of the points in RICO-3D, which is considerably more than Pole and Cable. The result therefore suggests that the proposed design is more aligned with the geometric characteristics of thin infrastructure than with those of vehicles. GA-Attention was designed to preserve locally informative point representations during hierarchical encoding and to recover fine geometric details during decoding. Its geometry-aware local aggregation, score-guided downsampling, and attention-gated skip fusion are primarily motivated by the need to preserve sparse and thin structures embedded in dominant surrounding classes. The dynamic nature of roadway scenes may also contribute to the difficulty of the Vehicle class. Depending on their motion during MLS acquisition, vehicles can be partially observed or affected by motion-related geometric distortions.
Nevertheless, the present experiments do not include a component-level ablation study or a dedicated vehicle error analysis. Consequently, the lower Vehicle IoU cannot be causally attributed to a specific architectural component. A more detailed investigation of vehicle errors, including the effects of object distance, occlusion, partial observations, class confusion, and local point density, would be required to establish the precise origin of this behavior. The evaluation on Toronto-3D further indicates that the proposed model remains applicable to a second MLS benchmark with a different class ontology. Overall, the main strength of GA-Attention lies in the segmentation of roadway surfaces and thin, under-represented infrastructure classes. Improving performance on vehicles and other compact object categories remains an important direction for future work.
Occlusions, viewpoint variations, and possible image-motion effects in RGB-derived attributes may further increase the variability of vehicle observations. However, the present experiments do not include an error analysis that separates static and moving vehicles, nor do they quantify these acquisition effects. These factors should therefore be considered possible explanations rather than established causes of the lower Vehicle IoU. More generally, the present evaluation does not include component-level ablations or a dedicated vehicle error analysis. Consequently, the observed Vehicle IoU cannot be causally attributed to a specific architectural component. Future work should analyze vehicle errors according to motion state, point density, distance, occlusion level, and confusion with other classes, and investigate whether object-level, temporal, or sequence-aware contextual information can improve vehicle segmentation.
The evaluation on Toronto-3D further confirms the relevance of the proposed design on a second MLS benchmark. Although the dataset differs from RICO-3D in class ontology and scene composition, the model preserves solid performance on Utility line and Pole, suggesting that the learned representation generalizes reasonably well to other roadway LiDAR environments. Taken together, these results show that the main strength of GA-Attention lies in the segmentation of thin and under-represented infrastructure classes, which are the primary targets of this work.
6. Conclusions
This paper introduced RICO-3D (Roadway Infrastructure in Context), a new large-scale MLS dataset for semantic segmentation of French urban roadways, and presented GA-Attention, a geometry-aware attention U-Net tailored to this task. RICO-3D provides rich per-point attributes, including geometry, RGB, intensity, GPS time, and scan angle rank, together with semantic annotations for six roadway-oriented classes: vegetation, road, pole, building, cable, and vehicle. With 780,981,961 labeled points, the dataset captures several real-world challenges of MLS data, including strong class imbalance, sparse thin structures, occlusions, and variations across urban environments, seasons, and weather conditions.
The experimental results show that GA-Attention provides a favorable infrastructure-oriented accuracy–efficiency trade-off. Although RandLA-Net (Open3D-ML) achieves the highest global mIoU on RICO-3D, GA-Attention obtains the strongest results on the Pole and Cable classes, which are the sparse thin infrastructure categories targeted by this benchmark. On RICO-3D, the proposed model achieves the best overall accuracy of 83.36% and the highest IoU for the most operationally relevant classes, namely road (91.35%), pole (49.91%), and cable (56.08%). It also maintains a competitive inference time of 8.17 s. The additional evaluation on Toronto-3D further shows that the proposed architecture remains effective on a second MLS benchmark, reaching 82.18% overall accuracy and 56.50% mIoU. These results confirm the relevance of the proposed dataset and support the effectiveness of the proposed architecture for the segmentation of thin and under-represented infrastructure elements. As part of this work, the dataset and implementation resources are intended for future public release, subject to the completion of internal legal, contractual, and data-governance validation.
As future work, several directions can be explored. First, the lower performance observed on some classes, particularly vehicle, indicates that further improvements in feature representation and training under class imbalance remain important. Second, the cross-dataset evaluation with Toronto-3D highlights the interest of studying generalization more systematically across MLS datasets with different class definitions and scene compositions. Third, the rich metadata available in RICO-3D, especially GPS time and scan angle rank, could be further exploited in future sequence-level or context-aware models. Finally, extending the dataset with additional scenes and infrastructure configurations would further strengthen its usefulness for large-scale urban mapping, telecom infrastructure analysis, and beyond.
A component-level ablation study would further clarify the individual contribution of each architectural element of GA-Attention, particularly the saliency-guided hierarchical downsampling module, and is left for future investigation. Future work will also include a dedicated analysis of Vehicle-class errors, including the potential effects of dynamic-object acquisition artifacts, partial observations, occlusions, and RGB-related motion effects, as well as the investigation of object-level or sequence-aware models for vehicle segmentation.
7. Patents
A patent application related to the methods and architectures presented in this manuscript has been filed with the French National Institute of Industrial Property (Institut National de la Propriété Industrielle, INPI) and is currently under examination.
Author Contributions
Conceptualization, W.H., O.H., F.R. and D.E.; methodology, W.H.; software, W.H.; validation, W.H. and O.H.; formal analysis, W.H.; investigation, W.H. and O.H.; resources, W.H.; data curation, W.H.; writing—original draft preparation, W.H.; writing—review and editing, W.H., O.H., F.R. and D.E.; visualization, W.H., O.H., F.R. and D.E.; supervision, F.R. and D.E.; project administration, F.R. and D.E.; funding acquisition, F.R. and D.E. All authors have read and agreed to the published version of the manuscript.
Funding
This research received no external funding.
Institutional Review Board Statement
Ethical review and approval were waived for this study because the dataset consists solely of anonymized, non-identifiable distance measurements (no images, audio, or biometrics) and thus does not constitute human subjects research under our institutional policy. The study complied with GDPR and local regulations.
Informed Consent Statement
Not applicable.
Data Availability Statement
At the time of submission, the RICO-3D dataset, source code, trained models, and evaluation scripts are not publicly available and cannot currently be provided through a reviewer-accessible repository. Their release is subject to completion of internal legal, contractual, and data-governance validation procedures. No definite release date can responsibly be provided at this stage. The manuscript therefore reports the dataset design, annotation protocol, data split, training configuration, and evaluation procedure in detail, but the reported experiments cannot yet be independently reproduced using the complete dataset and implementation. The authors will seek to release the resources after the required clearances have been obtained.
Conflicts of Interest
All the authors were employed by the company Orange, France. All the authors declare that the research was conducted in the absence of any commercial or financial relationships that could be construed as a potential conflict of interest.
References
- Kukko, A.; Kaartinen, H. Mobile laser scanning. In Laser Scanning; Wiley: Hoboken, NJ, USA, 2020. [Google Scholar]
- Hackel, T.; Savinov, N.; Ladický, L.; Wegner, J.D.; Schindler, K.; Pollefeys, M. Semantic3D.net: A new large-scale point cloud classification benchmark. ISPRS Ann. Photogramm. Remote Sens. Spat. Inf. Sci. 2017, IV-1/W1, 91–98. [Google Scholar] [CrossRef] [Scilit]
- Behley, J.; Garbade, M.; Milioto, A.; Quenzel, J.; Behnke, S.; Stachniss, C.; Gall, J. SemanticKITTI: A dataset for semantic scene understanding of LiDAR sequences. In Proceedings of the 2019 IEEE/CVF International Conference on Computer Vision (ICCV), Seoul, Republic of Korea, 27 October–2 November 2019. [Google Scholar]
- Roynard, X.; Deschaud, J.E.; Goulette, F. Paris-Lille-3D: A large and high-quality ground-truth urban point cloud dataset for automatic segmentation and classification. Int. J. Robot. Res. 2018, 37, 739–753. [Google Scholar] [CrossRef] [Scilit]
- Wu, B.; Wan, A.; Yue, X.; Keutzer, K. SqueezeSeg: Convolutional neural nets with recurrent CRF for real-time road-object segmentation from 3D LiDAR point cloud. In Proceedings of the 2018 IEEE International Conference on Robotics and Automation (ICRA), Brisbane, Australia, 21–25 May 2018. [Google Scholar]
- Cortinhal, T.; Tzelepis, G.S.; Aksoy, E.E. SalsaNext: Fast, uncertainty-aware semantic segmentation of LiDAR point clouds. In Proceedings of the 15th International Symposium on Visual Computing (ISVC 2020), San Diego, CA, USA, 5–7 October 2020. [Google Scholar]
- Hu, Q.; Yang, B.; Xie, L.; Rosa, S.; Guo, Y.; Wang, Z.; Trigoni, N.; Markham, A. RandLA-Net: Efficient semantic segmentation of large-scale point clouds. In Proceedings of the 2020 IEEE/CVF Conference on Computer Vision and Pattern Recognition (CVPR), Virtual, 14–19 June 2020. [Google Scholar]
- Thomas, H.; Qi, C.R.; Deschaud, J.E.; Marcotegui, B.; Goulette, F.; Guibas, L.J. KPConv: Flexible and deformable convolution for point clouds. In Proceedings of the 2019 IEEE/CVF International Conference on Computer Vision (ICCV), Seoul, Republic of Korea, 27 October–2 November 2019. [Google Scholar]
- Choy, C.; Gwak, J.Y.; Savarese, S. 4D spatio-temporal ConvNets: Minkowski convolutional neural networks. In Proceedings of the 2019 IEEE/CVF Conference on Computer Vision and Pattern Recognition (CVPR), Long Beach, CA, USA, 15–20 June 2019. [Google Scholar]
- Tang, H.; Liu, Z.; Zhao, S.; Lin, Y.; Lin, J.; Wang, H.; Han, S. Searching efficient 3D architectures with sparse point-voxel convolution. In Proceedings of the Computer Vision—ECCV 2020, 16th European Conference on Computer Vision, Glasgow, UK, 23–28 August 2020. [Google Scholar]
- Leica Pegasus TRK300. Available online: https://leica-geosystems.com/en-us/products/mobile-mapping-systems/hardware/leica-pegasus-trk300 (accessed on 3 April 2026).
- Ronneberger, O.; Fischer, P.; Brox, T. U-Net: Convolutional Networks for Biomedical Image Segmentation. In Proceedings of the Medical Image Computing and Computer-Assisted Intervention—MICCAI 2015, Munich, Germany, 5–9 October 2015; Springer: Cham, Switzerland, 2015. [Google Scholar]
- Caesar, H.; Bankiti, V.; Lang, A.H.; Vora, S.; Liong, V.E.; Xu, Q.; Krishnan, A.; Pan, Y.; Baldan, G.; Beijbom, O. nuScenes: A multimodal dataset for autonomous driving. In Proceedings of the 2020 IEEE/CVF Conference on Computer Vision and Pattern Recognition (CVPR), Virtual, 14–19 June 2020. [Google Scholar]
- Sun, P.; Kretzschmar, H.; Dotiwalla, X.; Chouard, A.; Patnaik, V.; Tsui, P.; Guo, J.; Zhou, Y.; Chai, Y.; Caine, B.; et al. Scalability in perception for autonomous driving: Waymo open dataset. In Proceedings of the 2020 IEEE/CVF Conference on Computer Vision and Pattern Recognition (CVPR), Virtual, 14–19 June 2020. [Google Scholar]
- Tan, W.; Qin, N.; Ma, L.; Li, Y.; Du, J.; Cai, G.; Yang, K.; Li, J. Toronto-3D: A large-scale mobile LiDAR dataset for semantic segmentation of urban roadways. In Proceedings of the 2020 IEEE/CVF Conference on Computer Vision and Pattern Recognition Workshops (CVPRW), Virtual, 14–19 June 2020. [Google Scholar]
- Varney, N.; Asari, V.K.; Graehling, Q. DALES: A large-scale aerial LiDAR data set for semantic segmentation. In Proceedings of the 2020 IEEE/CVF Conference on Computer Vision and Pattern Recognition Workshops (CVPRW), Virtual, 14–19 June 2020. [Google Scholar]
- Hu, Q.; Yang, B.; Khalid, S.; Xiao, W.; Trigoni, N.; Markham, A. SensatUrban: A large-scale urban point cloud dataset with 2 billion+ points and 13 semantic classes. In Proceedings of the 2021 IEEE/CVF Conference on Computer Vision and Pattern Recognition (CVPR), Virtual, 19–25 June 2021. [Google Scholar]
- Wu, B.; Zhou, X.; Zhao, S.; Yue, X.; Keutzer, K. SqueezeSegV2: Improved model structure and unsupervised domain adaptation for road-object segmentation from a LiDAR point cloud. In Proceedings of the 2019 IEEE International Conference on Robotics and Automation (ICRA), Montreal, QC, Canada, 20–24 May 2019. [Google Scholar]
- Milioto, A.; Vizzo, I.; Behley, J.; Stachniss, C. RangeNet++: Fast and accurate LiDAR semantic segmentation. In Proceedings of the 2019 IEEE/RSJ International Conference on Intelligent Robots and Systems (IROS), Macau, China, 4–8 November 2019. [Google Scholar]
- Qi, C.R.; Su, H.; Mo, K.; Guibas, L.J. PointNet: Deep learning on point sets for 3D classification and segmentation. In Proceedings of the 2017 IEEE Conference on Computer Vision and Pattern Recognition (CVPR), Honolulu, HI, USA, 21–26 July 2017. [Google Scholar]
- Qi, C.R.; Yi, L.; Su, H.; Guibas, L.J. PointNet++: Deep hierarchical feature learning on point sets in a metric space. In Proceedings of the 31st International Conference on Neural Information Processing Systems (NeurIPS), Long Beach, CA, USA, 4–9 December 2017. [Google Scholar]
- Yoo, S.; Jeong, Y.; Jameela, M.; Sohn, G. Human Vision Based 3D Point Cloud Semantic Segmentation of Large-Scale Outdoor Scenes. In Proceedings of the IEEE/CVF Conference on Computer Vision and Pattern Recognition (CVPR) Workshops, Vancouver, BC, Canada, 17–24 June 2023. [Google Scholar]
- Zhu, X.; Zhou, Y.; Wang, T.; Hong, J.; Li, W.; Ma, Y. Cylinder3D: An effective 3D framework for driving-scene LiDAR semantic segmentation. In Proceedings of the 2021 IEEE/CVF Conference on Computer Vision and Pattern Recognition (CVPR), Virtual, 19–25 June 2021. [Google Scholar]
- Lu, D.; Xu, L.; Zhou, J.; Gao, K.; Gong, Z.; Zhang, D. 3D-UMamba: 3D U-Net with state space model for semantic segmentation of multi-source LiDAR point clouds. Int. J. Appl. Earth Obs. Geoinf. 2025, 136, 104401. [Google Scholar] [CrossRef] [Scilit]
- Leica Cyclone 3DR-All-in-One Deliverable Solution. Available online: https://leica-geosystems.com/fr-fr/products/laser-scanners/software/leica-cyclone/leica-cyclone-3dr (accessed on 23 April 2026).
- CloudCompare. Available online: https://www.cloudcompare.org/ (accessed on 3 April 2026).
- Zeng, Z.; Hu, Q.; Xie, Z.; Li, B.; Zhou, J.; Xu, Y. Small but mighty: Enhancing 3D point clouds semantic segmentation with U-Next framework. Int. J. Appl. Earth Obs. Geoinf. 2025, 136, 104309. [Google Scholar] [CrossRef] [Scilit]
- CrossEntropyLoss. Available online: https://docs.pytorch.org/docs/2.13/generated/torch.nn.CrossEntropyLoss.html (accessed on 7 August 2026).
- Lin, T.Y.; Goyal, P.; Girshick, R.; He, K.; Dollár, P. Focal Loss for Dense Object Detection. In Proceedings of the IEEE International Conference on Computer Vision (ICCV), Venice, Italy, 22–29 October 2017. [Google Scholar]
- Berman, M.; Rannen Triki, A.; Blaschko, M.B. The Lovász-Softmax loss: A tractable surrogate for the optimization of the intersection-over-union measure in neural networks. In Proceedings of the IEEE Conference on Computer Vision and Pattern Recognition (CVPR), Salt Lake City, UT, USA, 18–23 June 2018. [Google Scholar]
- Taghanaki, S.A.; Zheng, Y.; Zhou, S.K.; Georgescu, B.; Sharma, P.; Xu, D.; Comaniciu, D.; Hamarneh, G. Combo Loss: Handling Input and Output Imbalance in Multi-Organ Segmentation. Comput. Med. Imaging Graph. 2019, 75, 24–33. [Google Scholar] [CrossRef] [Scilit] [PubMed]
- Soviany, P.; Ionescu, R.T.; Rota, P.; Sebe, N. Curriculum self-paced learning for cross-domain object detection. Comput. Vis. Image Underst. 2021, 204, 103166. [Google Scholar] [CrossRef] [Scilit]
| Disclaimer/Publisher’s Note: The statements, opinions and data contained in all publications are solely those of the individual author(s) and contributor(s) and not of MDPI and/or the editor(s). MDPI and/or the editor(s) disclaim responsibility for any injury to people or property resulting from any ideas, methods, instructions or products referred to in the content. |