Design and Evaluation of a Research-Oriented Open-Source Platform for Smart Grid Metering: A Comprehensive Review and Experimental Intercomparison of Smart Meter Technologies
Abstract
1. Introduction
2. Materials and Methods
2.1. Smart Meters
2.1.1. Smart Meters Communication
Communication Between Smart Meters
Communication with the User
2.1.2. Advancements in Smart Metering
Energy Metering with G3-PLC for DLMS/COSEM
Colored Books Summary
- Blue Book: Details the interface model and the OBIS object identification system.
- Green Book: Describes the architectural framework and associated protocols.
- Yellow Book: Compiles all requisite tests for device conformity to the specifications outlined in the Blue Book.
- White Book: Contains the official glossary of terms.
Advantages
2.1.3. Challenges in Communication and Data Extraction
2.1.4. Accuracy Verification in Smart Meters
Classification According to Accuracy
2.1.5. Open-Source Solutions
Open-Source Methods to Verify the Accuracy
2.2. Methodology
- Accuracy Verification: To ascertain the measurement accuracy of the developed prototype by conducting comparative analyses against established reference smart meters, specifically the Texas Instruments EVM430-F67641 and the GAMA 300.
- Load Variation Testing: To critically evaluate the prototype’s performance across diverse load configurations, encompassing both single-phase and three-phase electrical systems.
- Statistical Validation: To apply rigorous statistical tools for the quantitative determination of the reliability and precision inherent in the collected measurements.
- Hardware and Software Development: This phase involved the conceptualization, design, and realization of both the hardware and software components of the proposed platform.
- Data Acquisition under Controlled Load Conditions: This phase focused on the systematic collection of experimental data while maintaining precise control over various electrical load parameters.
- Statistical Analysis and Performance Validation: This final phase involved the application of statistical methods to the collected data to rigorously analyze the prototype’s performance and validate its accuracy.
2.2.1. Experimental Design and Hardware Configuration
- Arduino UNO Microcontroller: Served as the primary processing unit, handling sensor signals and energy calculations. Its 16 MHz ATmega328P and serial communication capability suit real-time data collection [3,39]. The Arduino Uno was selected for this study due to its lower power requirements, simplified integration capabilities, and its widespread adoption in educational and prototyping environments. These characteristics make it ideal for developing accessible and reproducible open-source experimental platforms.
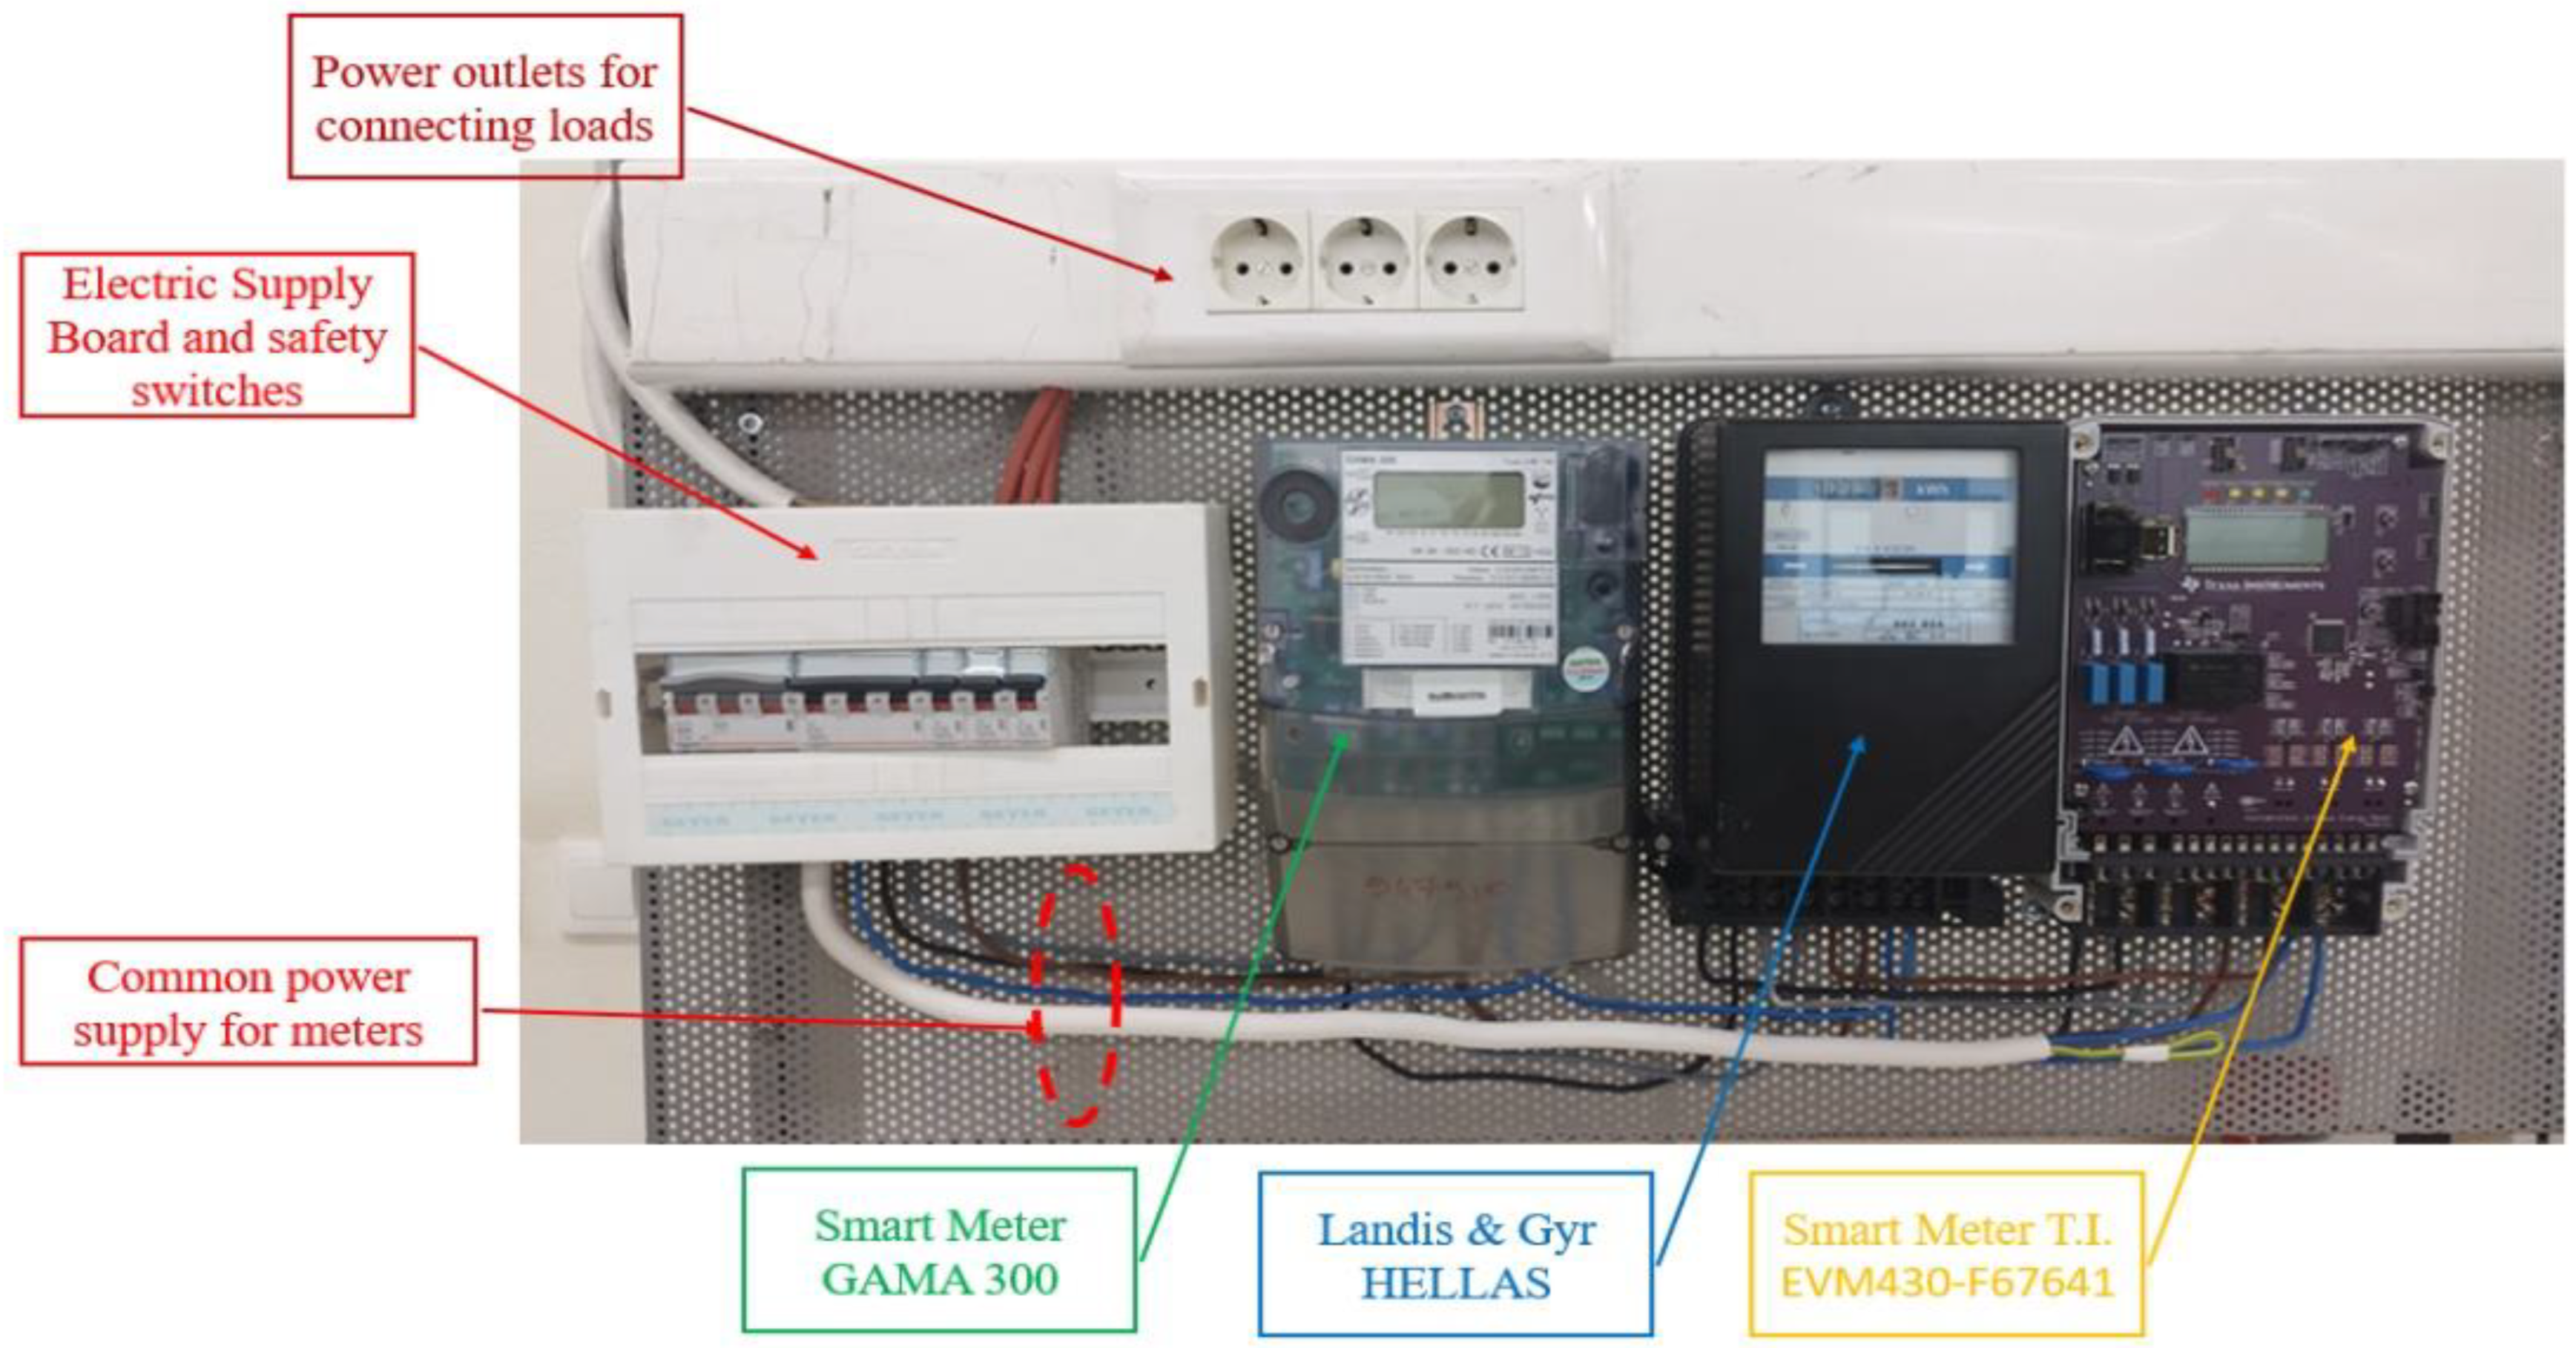
- Mounted Electric Panel: Hardware, including SMs, the Arduino prototype, and safety switches, was securely mounted on a custom panel as presented in Figure 8. This panel, with three-phase connections and a mechanical electric meter, provided an additional comparison layer.
Prototype Construction
Experimental Solution
Limitations of the Prototype
2.2.2. Software Implementation
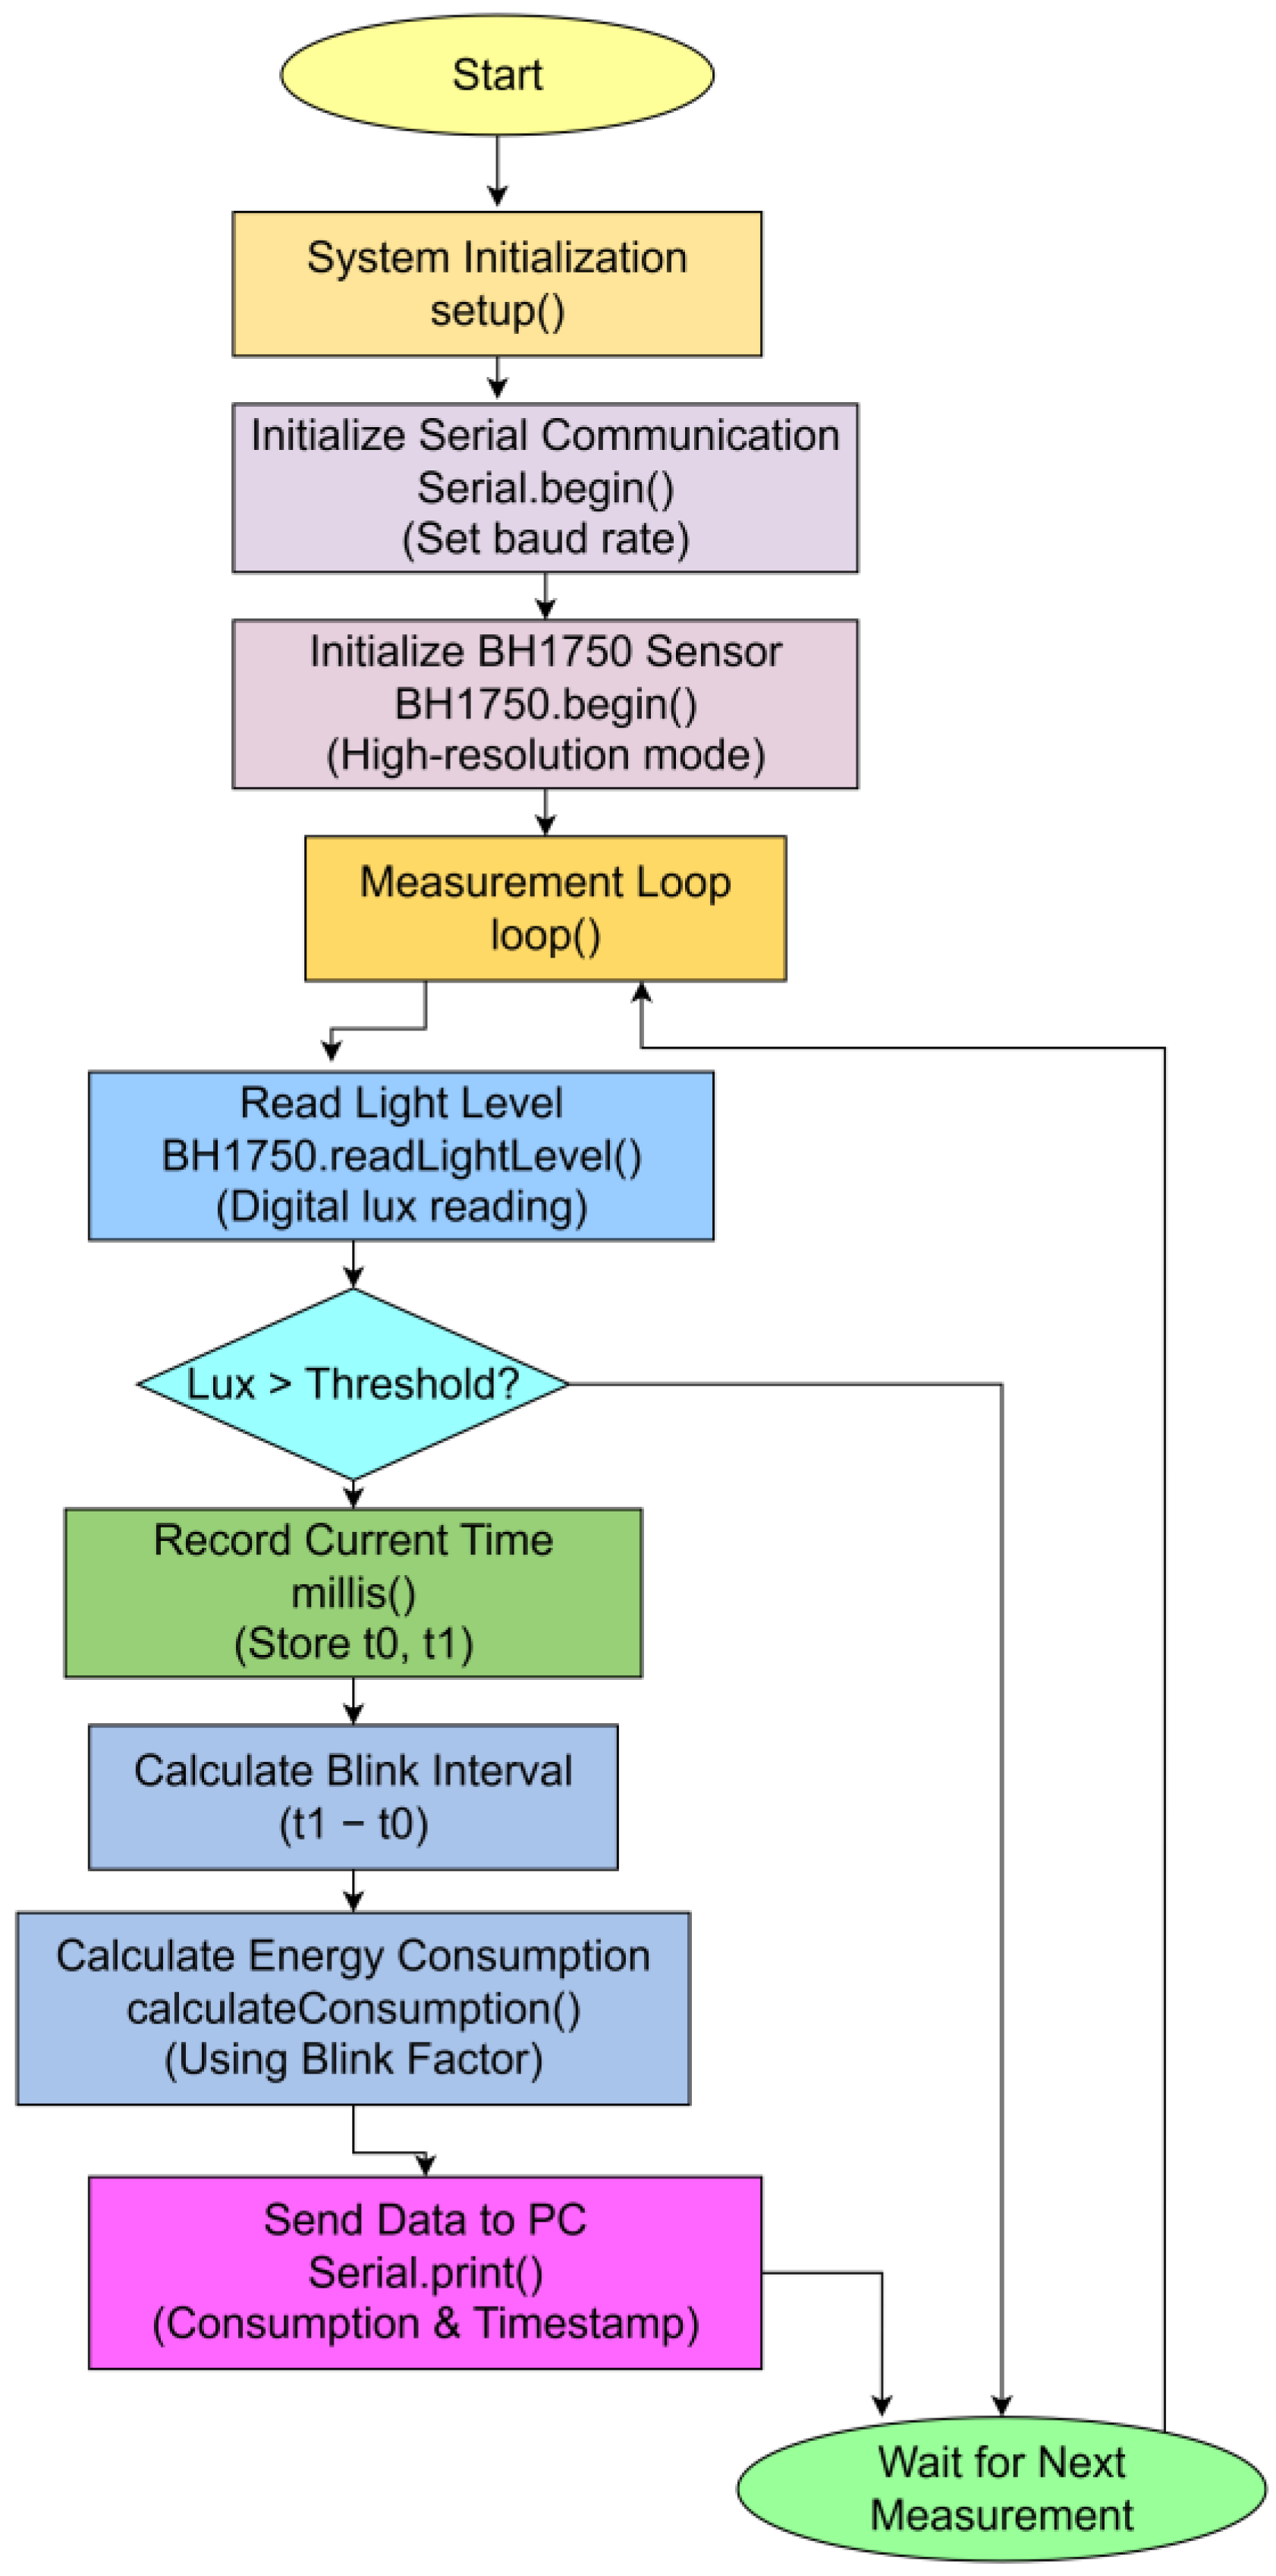
- Pulse Detection: The BH1750 sensor, utilizing a robust thresholding algorithm, accurately detects smart meter LED pulses, representing energy consumption units, even in varying ambient light.
- Energy Calculation: Based on pulse count and a predefined blinking factor (e.g., 1000 pulses/kWh), the Arduino system precisely calculates energy consumption per test interval.
- Data Transmission: Computed energy consumption values are transmitted via USB to a connected computer for storage and analysis.
Code Explanation
Software Limitations
2.2.3. Experimental Procedure
Experimental Design, Hardware Configuration, and Data Validation
- Variables and Experimental Setup
- Resistive Load: Varying resistive loads were applied using either single or multiple phases. The specific configurations were:
- ○
- A: 50 Ohms (single-phase).
- ○
- B: 25 Ohms (single-phase).
- ○
- C: 100 Ohms (50 Ohms per phase, two phases).
- ○
- D: 150 Ohms (50 Ohms per phase, three phases).
- Measurement Time: Each experimental test was standardized at 15 min.
- Data Validation and Tools
Experimental Procedure Steps
- Load Variation: Four distinct resistive load configurations were meticulously tested to simulate various operational conditions:
- ○
- 25 Ω (single-phase): This configuration simulated a low-load scenario.
- ○
- 50 Ω (single-phase): This represented a moderate-load condition.
- ○
- 100 Ω (two-phase): This configuration was utilized to assess performance under balanced two-phase conditions.
- ○
- 150 Ω (three-phase): This setup evaluated the system’s response under high-load, three-phase conditions.
- Data Collection: For each specified load configuration, data were consistently collected over 15 min intervals. To ensure the robustness and consistency of the measurements, each test was replicated four times, resulting in a total of 16 individual measurements for every load configuration.
- Comparison with Reference Meters: The measurements acquired from the Arduino-based prototype were systematically compared against readings obtained from two established reference meters: the Texas Instruments EVM430-F67641 and the GAMA 300. Additionally, a mechanical electric meter was incorporated into the comparison to provide further validation of the experimental results.
2.2.4. Data Collection
2.2.5. Statistical Analysis
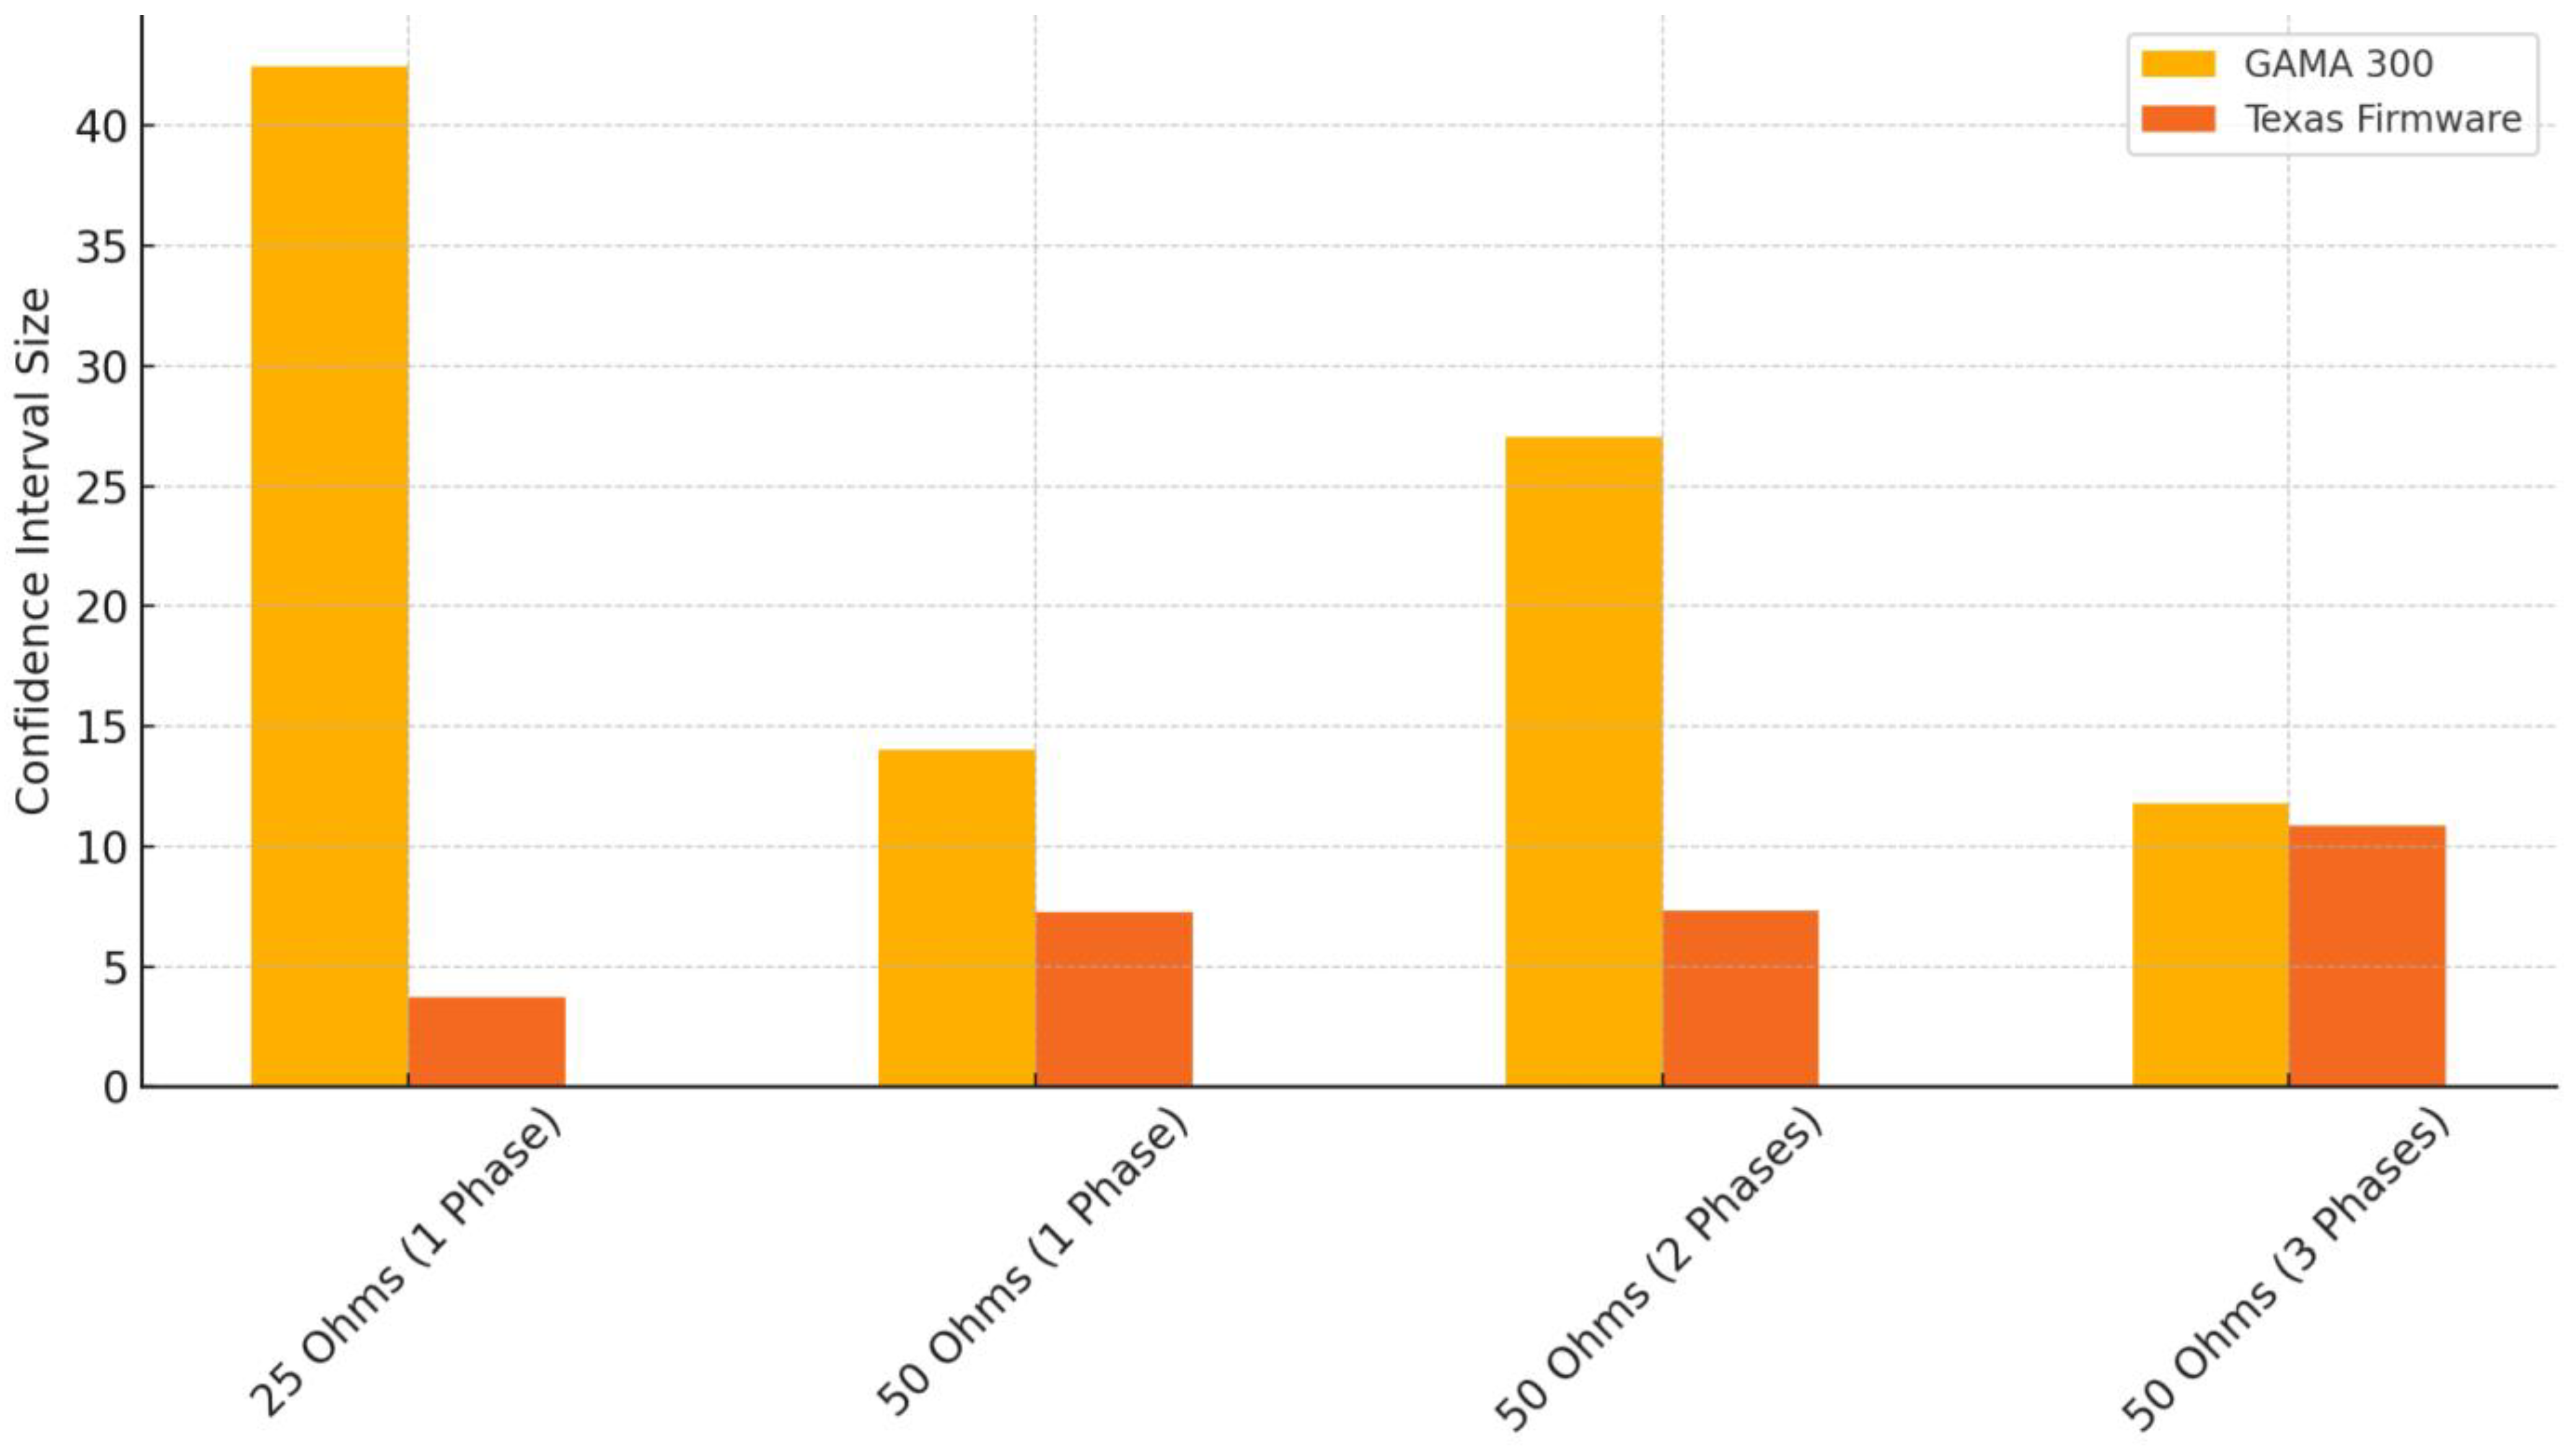
- Confidence Intervals: Confidence intervals were meticulously calculated for each distinct load configuration. This allowed for the estimation of the true range of energy consumption measurements at a 95% confidence level, providing a robust measure of the precision of the obtained data.
- ANOVA Tests: Analysis of Variance (ANOVA) was utilized to ascertain whether statistically significant differences existed among the measurements obtained from the prototype, the Texas Instruments reference meter, and the GAMA 300 m. This comparative analysis was crucial for assessing the prototype’s accuracy relative to established industry standards.
- Error Analysis: Standard deviations and Mean Absolute Percentage Errors (MAPEs) were computed to assess measurement precision quantitatively and to identify any potential systematic biases inherent in the prototype’s measurements.
3. Results
3.1. Results Data Summary
- 32 experiments conducted with the prototype:
- ○
- 16 measurements for each smart meter (SM).
- ○
- 4 different loads, as previously described.
- ○
- 4 measurements conducted for each load.
- Each experiment lasted 15 min, with one sample extracted per minute, resulting in a total of 480 samples for the prototype.
- 16 measurements conducted using the Texas Instruments firmware:
- ○
- Measurements were performed for 4 different loads.
- Total measurements and samples:
- ○
- A total of 48 distinct measurements were conducted across both methods.
- ○
- These measurements produced a total of 496 samples.
3.2. Summary of Energy Measurements
3.3. Statistical Calculations and Analysis
3.3.1. Basic Statistical Parameters
3.3.2. Confidence Intervals
3.3.3. ANOVA Test
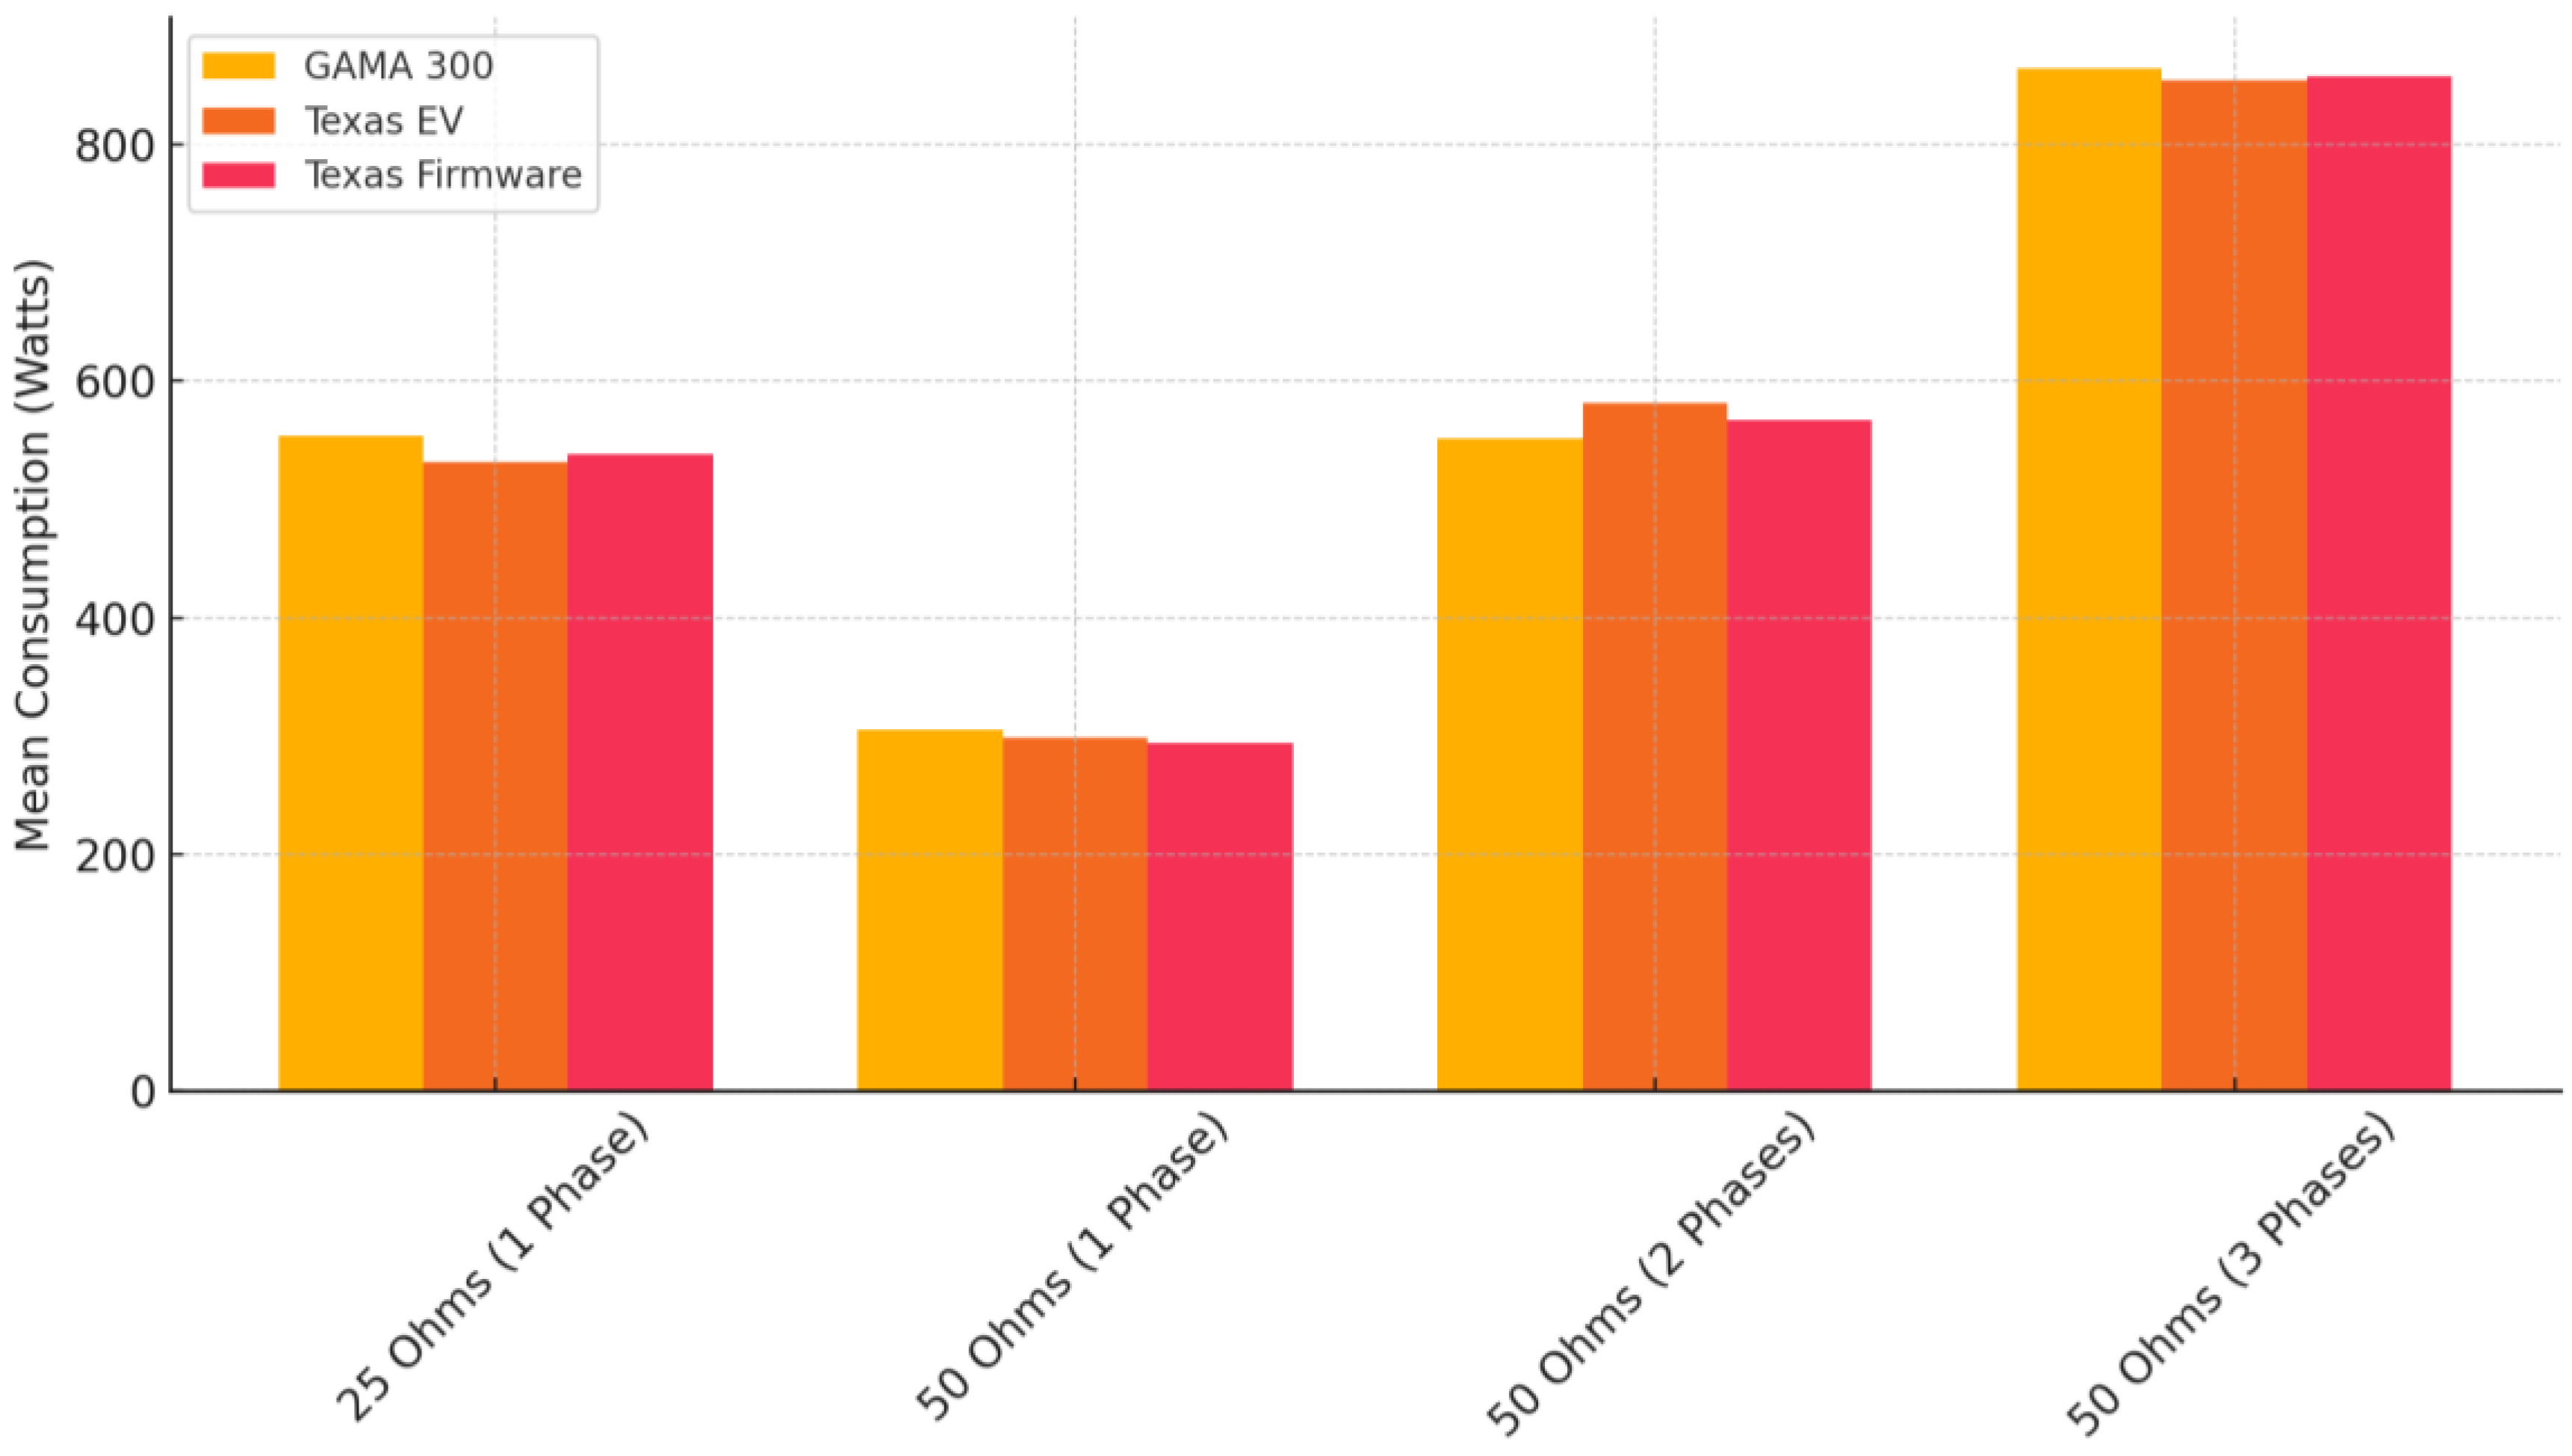
- For comparisons between the GAMA 300 and the Texas firmware, the p-values consistently exceeded 0.05 (p > 0.05). This outcome supports the null hypothesis, indicating no statistically significant differences between the respective measurement means.
- Additional ANOVA tests incorporating the Texas EV (Evaluation Module) similarly yielded p-values greater than 0.05 (p > 0.05), thereby reinforcing the acceptance of the null hypothesis across all tested configurations.
4. Discussion
- Accuracy and Precision: The Arduino-based prototype achieved high accuracy (error ≤±1.2%, MAPE of 0.43%), comparable to commercial smart meters like the Texas Instruments EVM430-F67641 and GAMA 300 [10,11]. This underscores the potential for open-source systems to replace costly proprietary solutions.
- Robustness Across Load Configurations: The prototype consistently performed reliably across diverse loads, from single-phase low-load to three-phase high-load systems, demonstrating its adaptability to real-world energy monitoring scenarios.
- Practical Implications: The low cost and accessibility of components (Arduino UNO, BH1750 sensor) make this system ideal for resource-constrained environments, democratizing access to advanced energy monitoring, especially in developing regions [3].
- Identified Limitations: While the prototype delivered promising results, certain limitations were identified:
- ➢
- Sensor Latency: The BH1750 sensor’s reaction time, up to 180 ms in high-resolution mode, may introduce a maximum sampling frequency limit of ~20,000 blinks per hour. This could restrict use in high-consumption industrial environments, although it is sufficient for residential use.
- ➢
- Ambient Light Sensitivity: The BH1750 sensor’s reliance on ambient light caused minor variations in pulse detection. While shielding tubes were used, ambient light fluctuations may still introduce noise. Using improved optical isolation or digital filters could mitigate this issue. Future work could explore hardware shielding or advanced signal processing.
- ➢
- Wired Communication: Current USB connectivity limits scalability. Integrating wireless technologies (e.g., Wi-Fi, ZigBee) would enhance utility and enable remote monitoring.
- ➢
- Serial Communication Constraints: The Arduino Uno communicates over USB via serial transmission at a maximum baud rate of 115,200 bps (~11.5 KB/s). This bandwidth restricts real-time throughput and increases latency in high-frequency applications. Furthermore, USB cable length must remain below ~15 m to avoid signal degradation.
- ➢
- Data Collection Platform: Although the project aims to leverage open-source tools, Microsoft Excel was used for data logging due to time constraints and its compatibility with the Data Streamer plugin. This limits full reproducibility in open-source environments. Future iterations will adopt open logging tools (e.g., Python with CSV, InfluxDB, or Jupyter-based dashboards).
- Comparison with Existing Systems: This open-source platform balances performance and cost-efficiency. While commercial meters offer high accuracy and robust features, their proprietary nature and cost can be prohibitive. This prototype bridges that gap, offering a customizable, accurate, and open-source alternative.
- ➢
- Experimental comparison of various commercial smart meter models.
- ➢
- Educational laboratories and academic demonstrations in energy systems and IoT.
- ➢
- Research into smart energy management and decentralized energy trading.
5. Conclusions
5.1. Key Outcomes
- High Accuracy: The prototype exhibited deviations below ±1.2% across all load configurations, validating its reliability against industry-standard meters.
- Adaptability: Its modular design and robust performance across varying loads make it suitable for diverse energy monitoring applications.
- Cost Efficiency: Leveraging open-source components significantly reduces evaluation costs, enhancing accessibility.
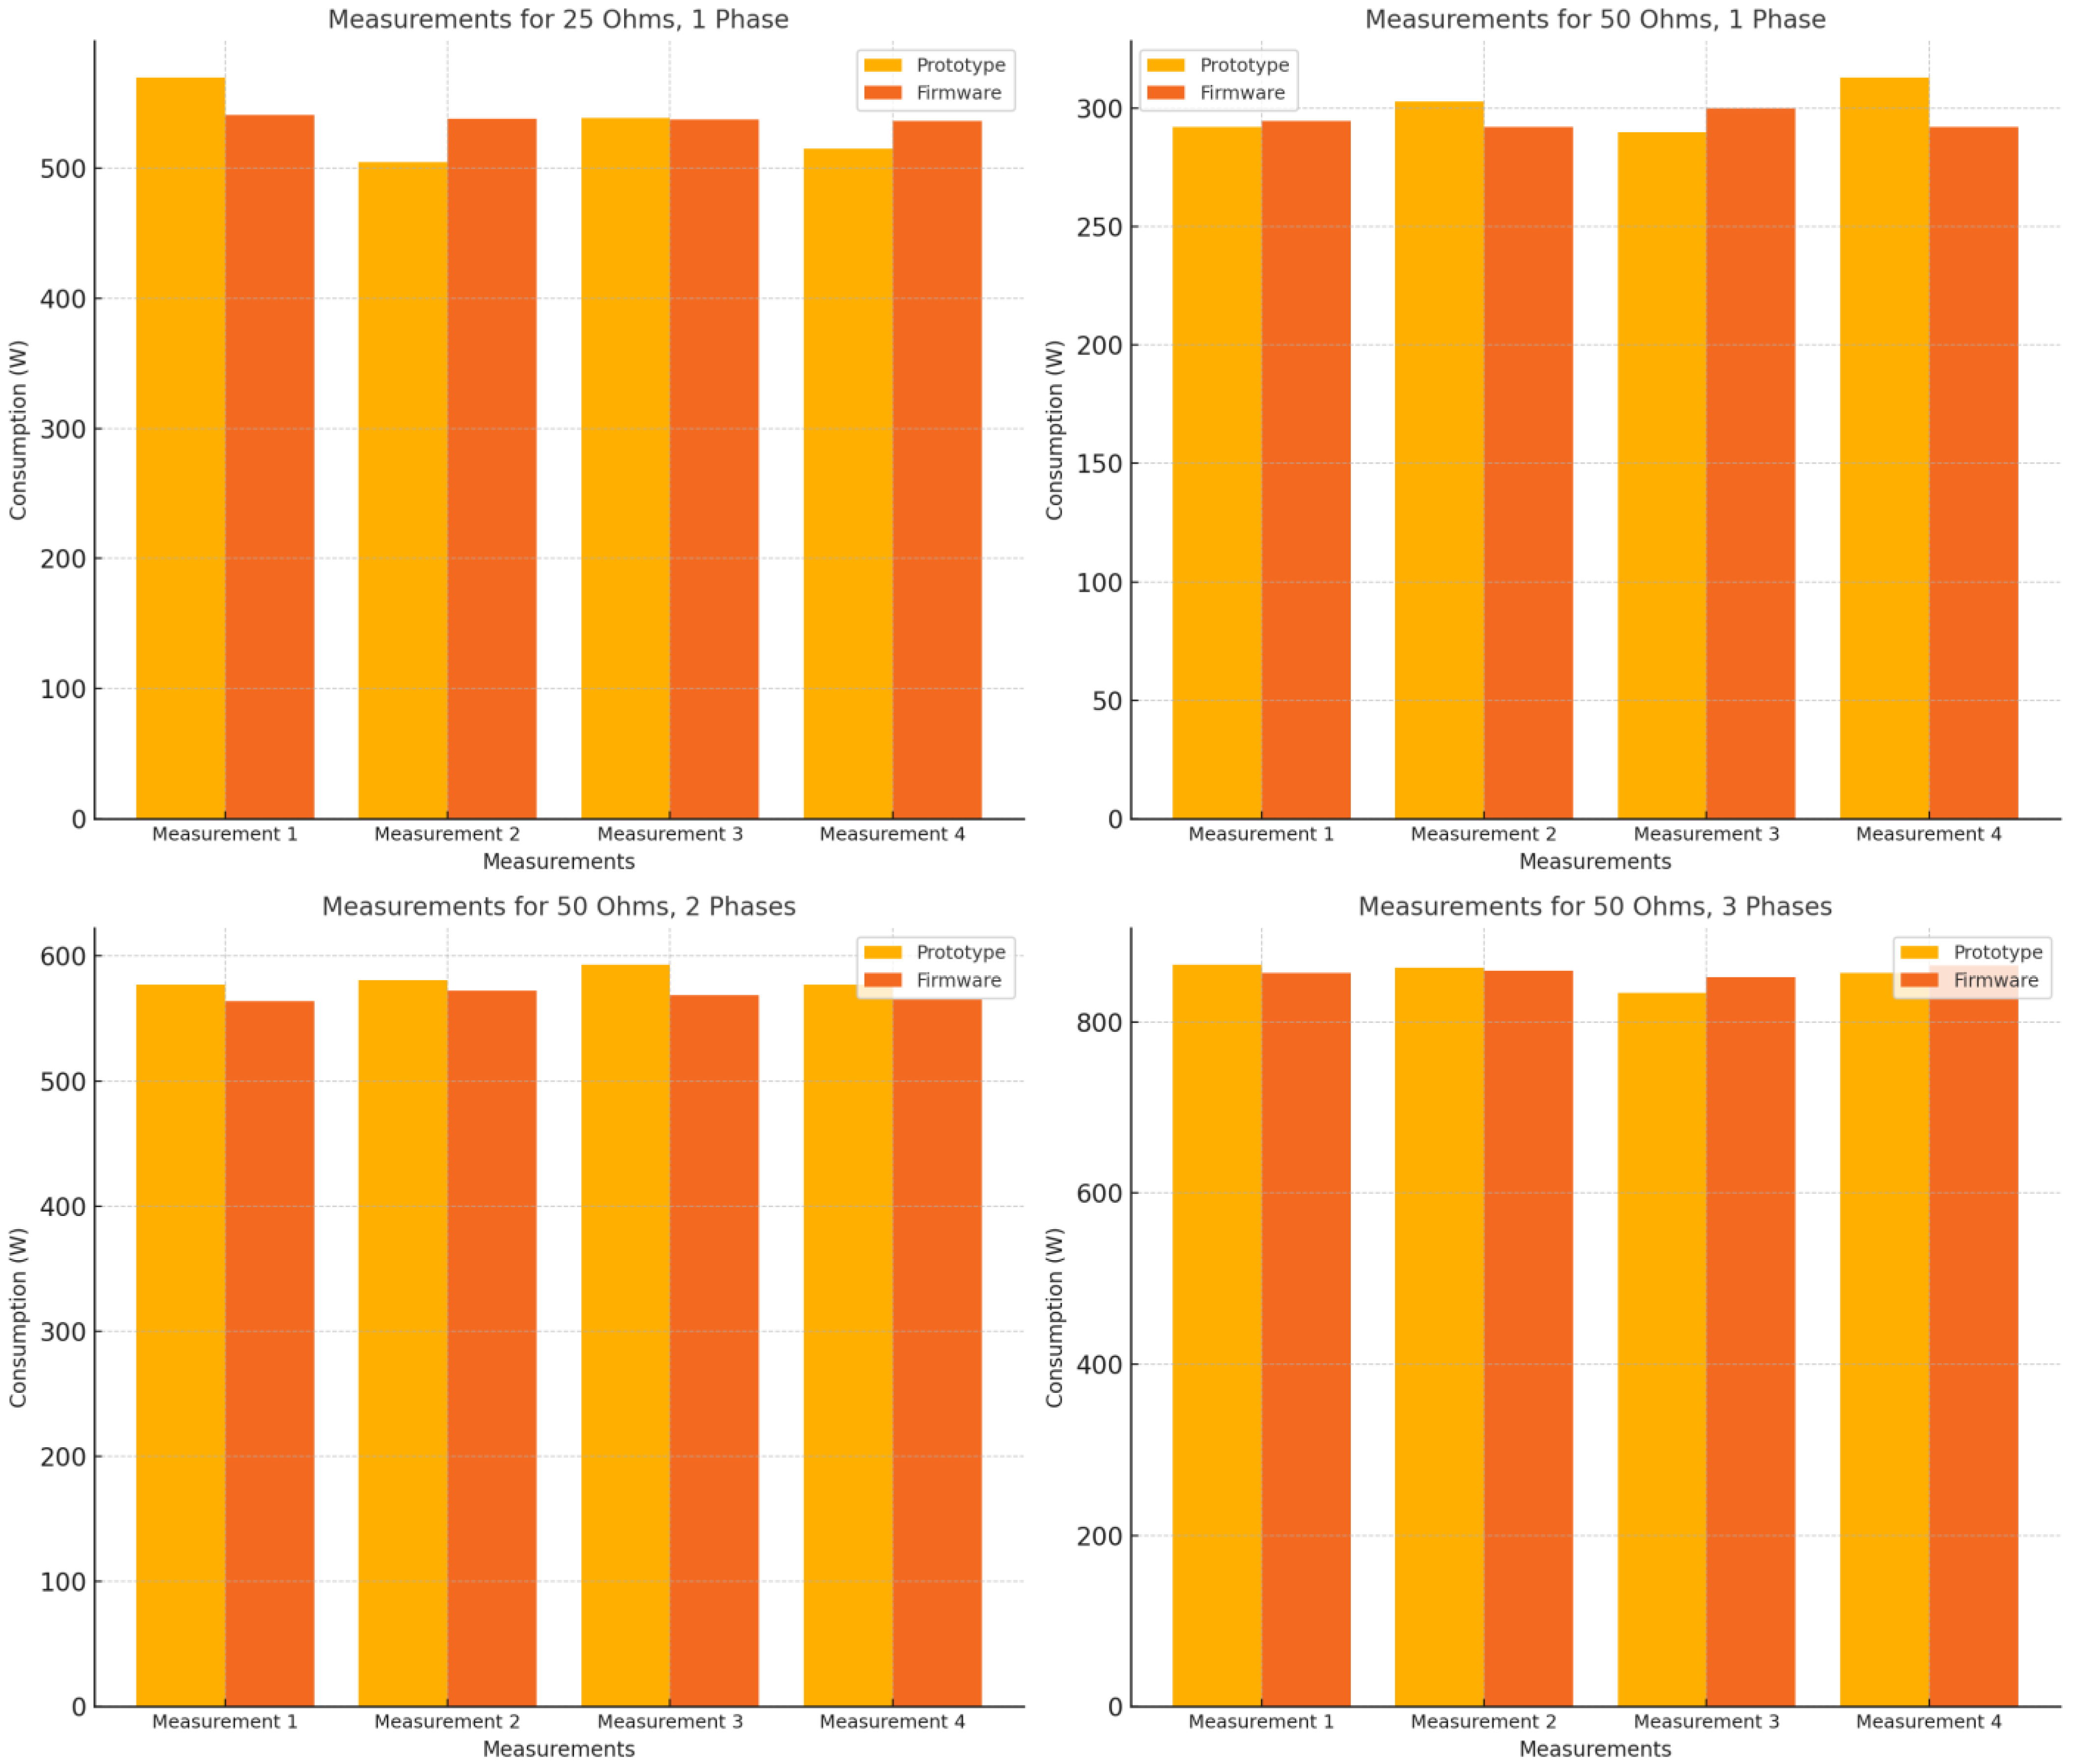
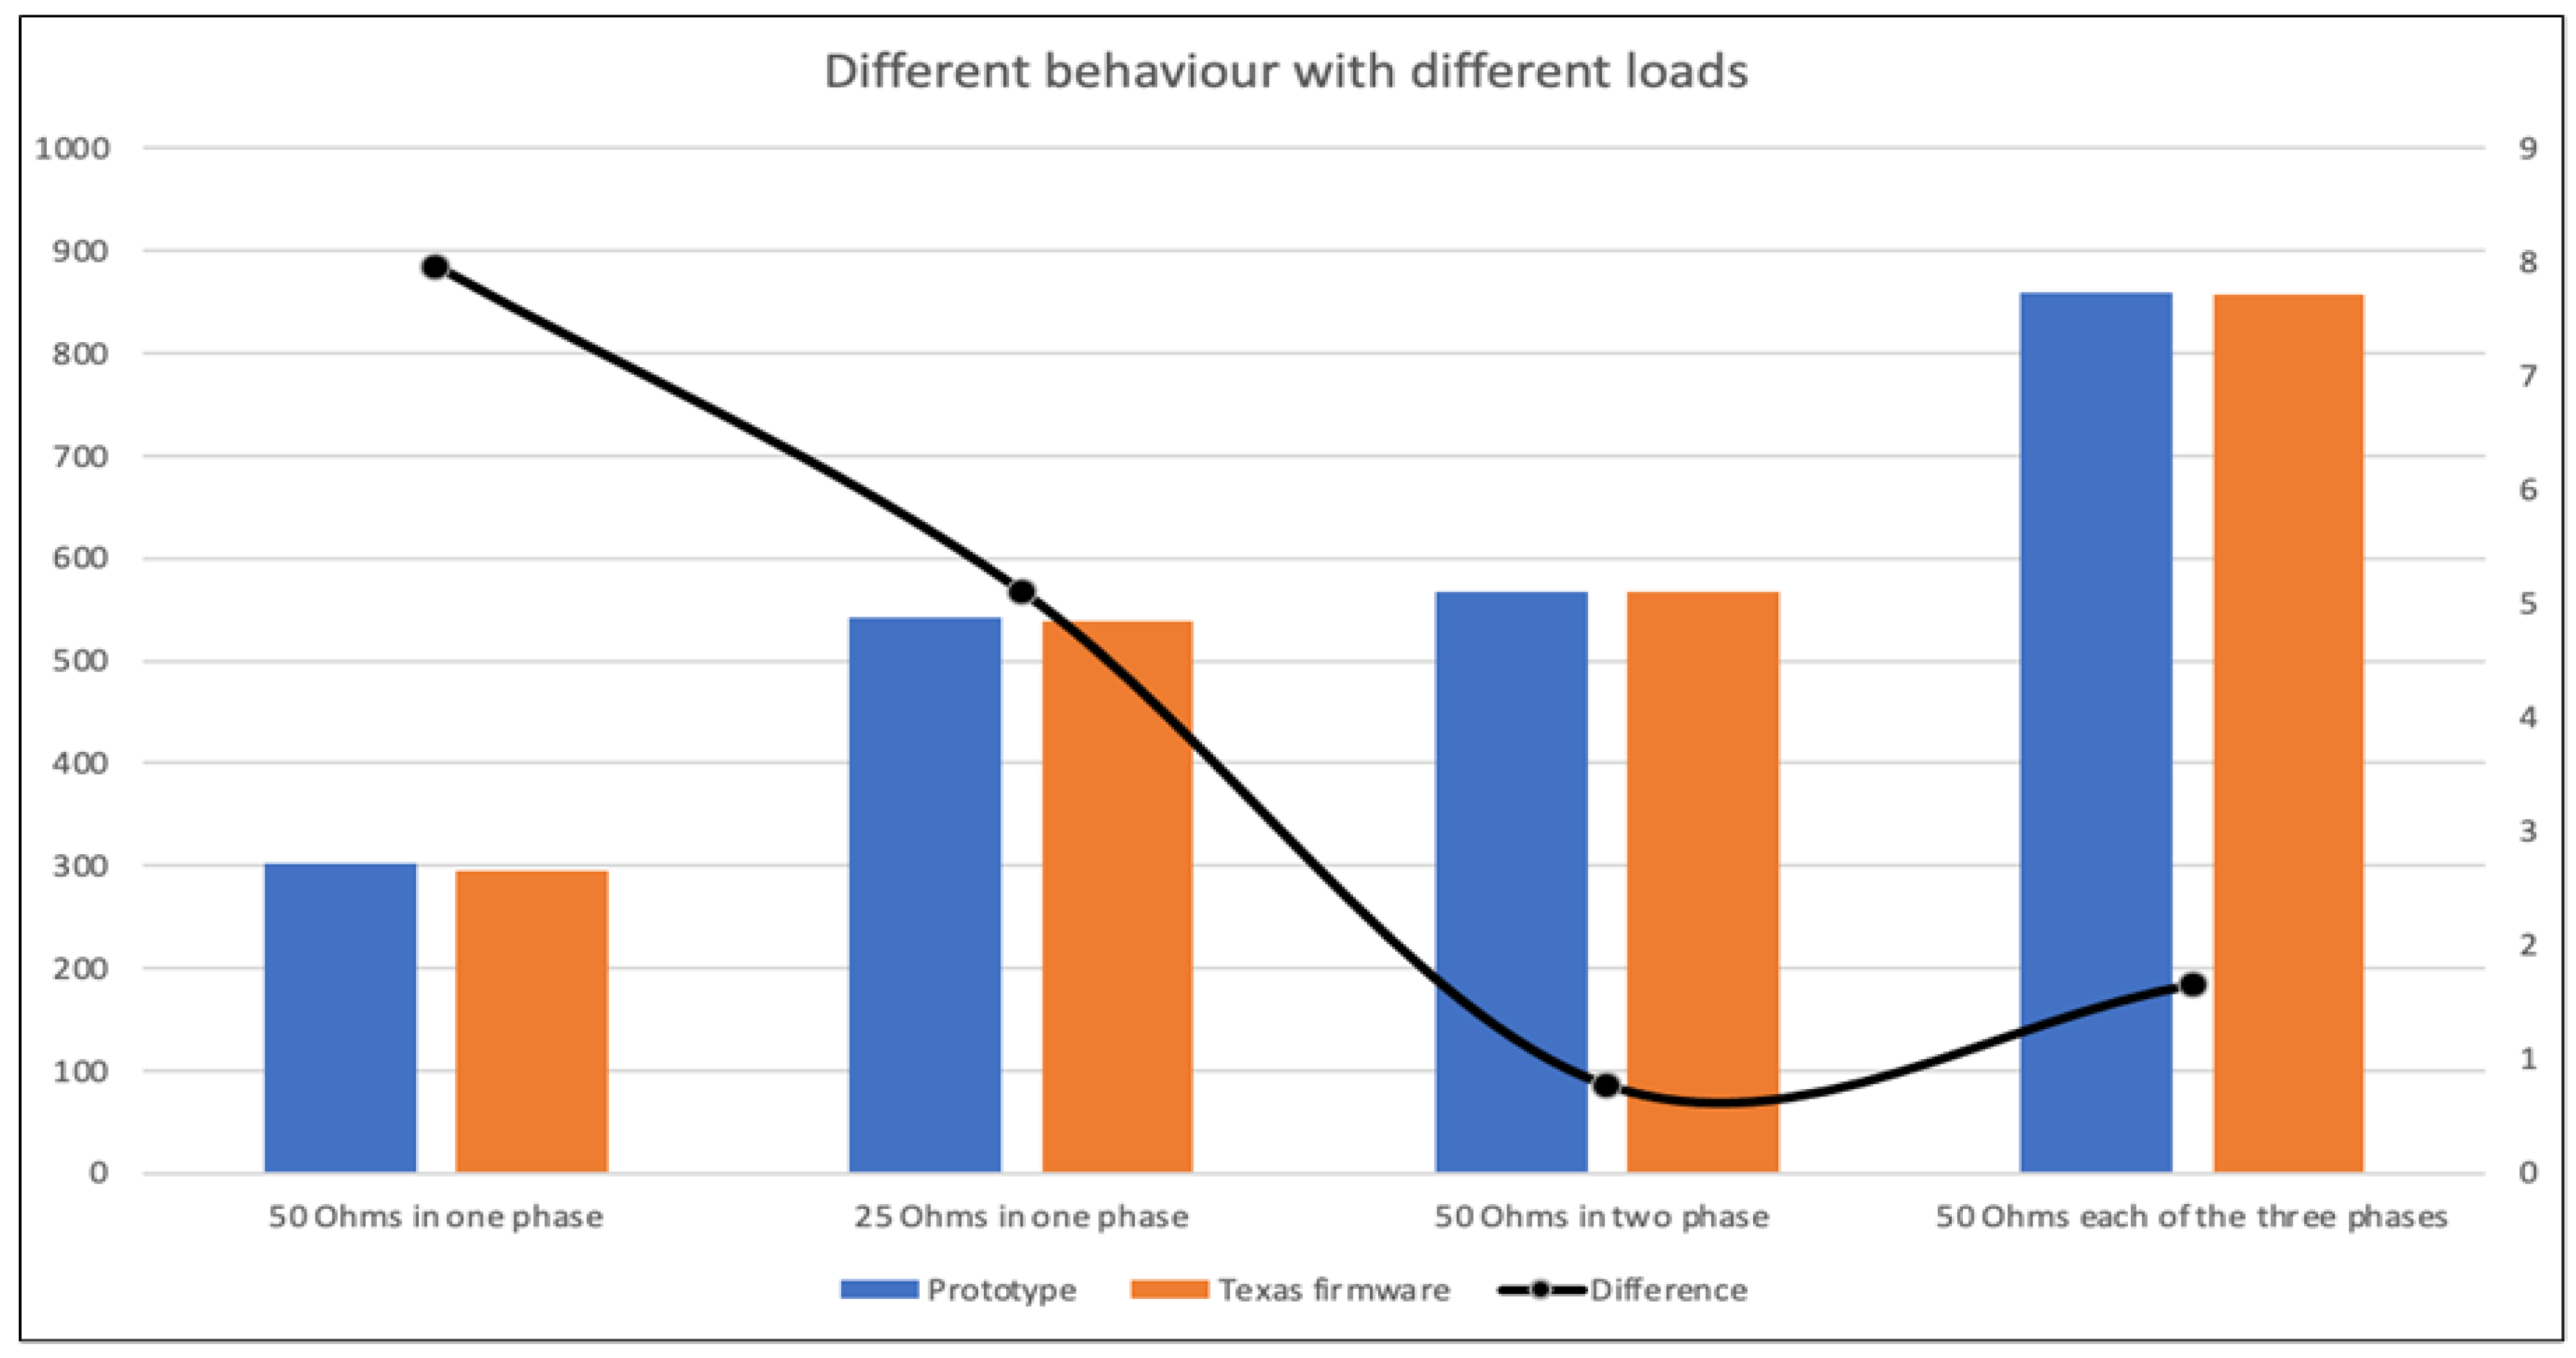
- Prototype Reliability: Consistent performance was observed across all resistive loads, closely matching Texas firmware results.
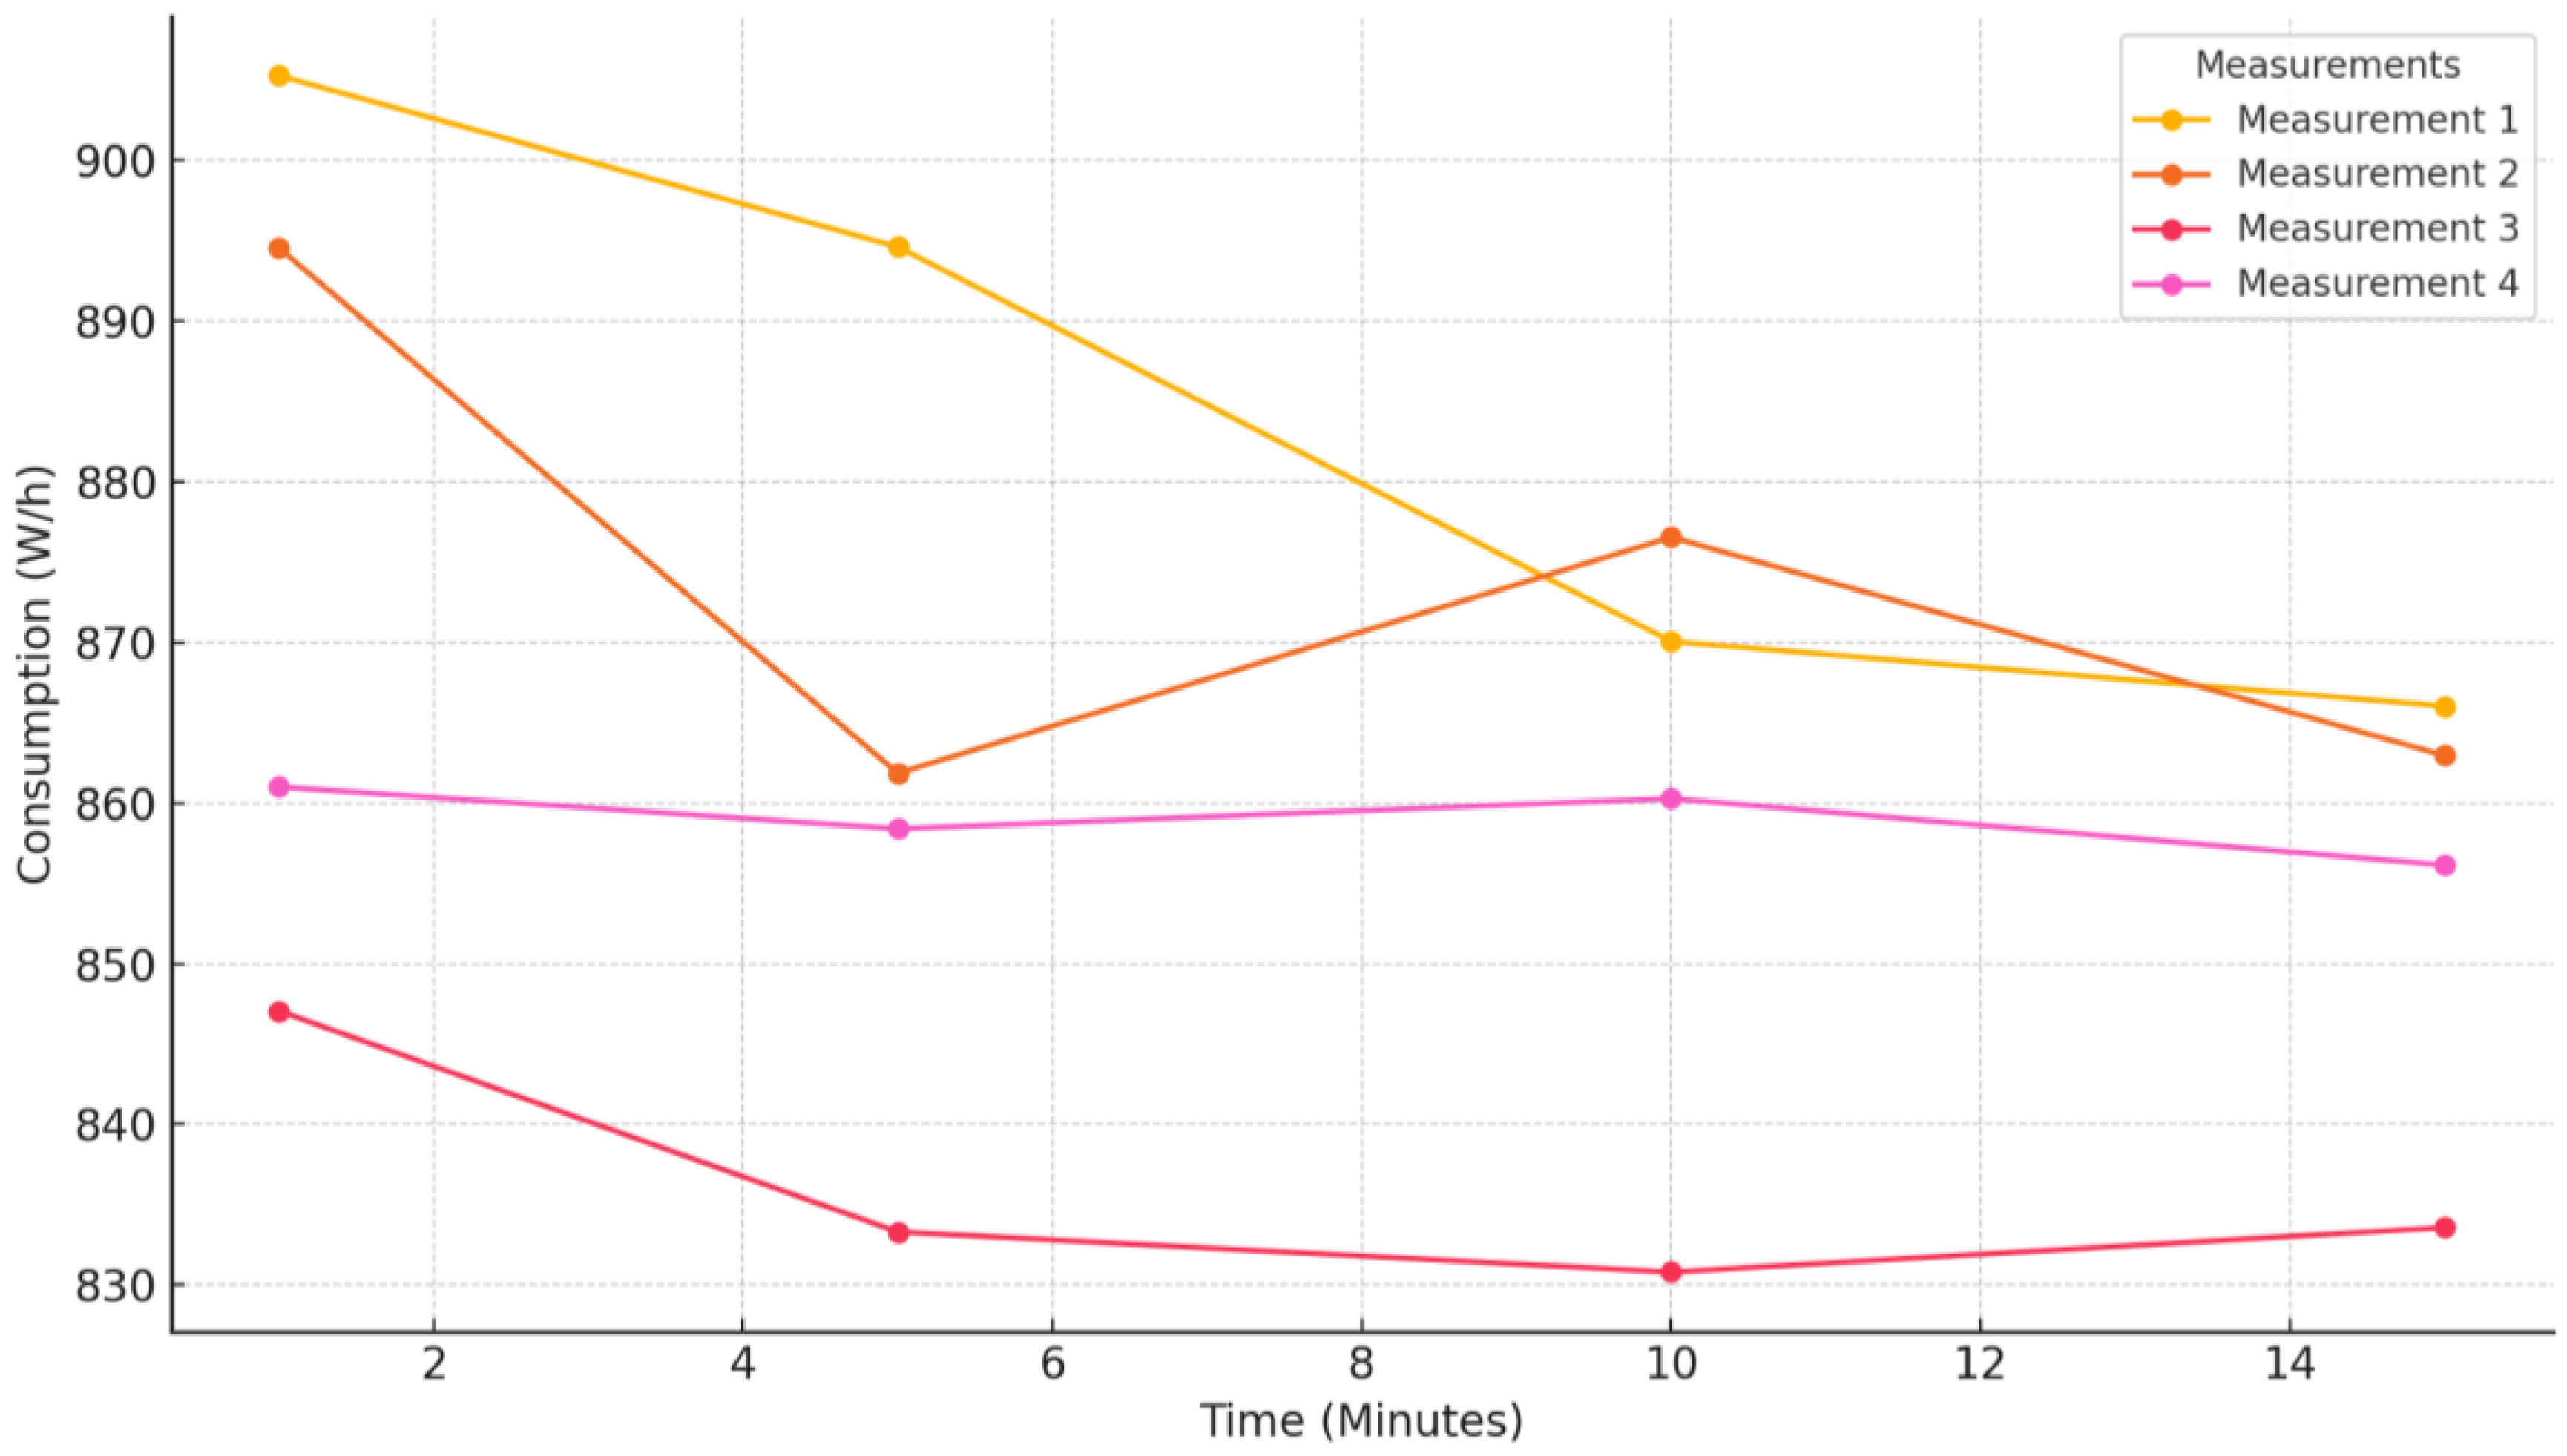
- Stabilization Over Time: Time-based experiments showed prototype measurements stabilized and aligned well with firmware after initial fluctuations.
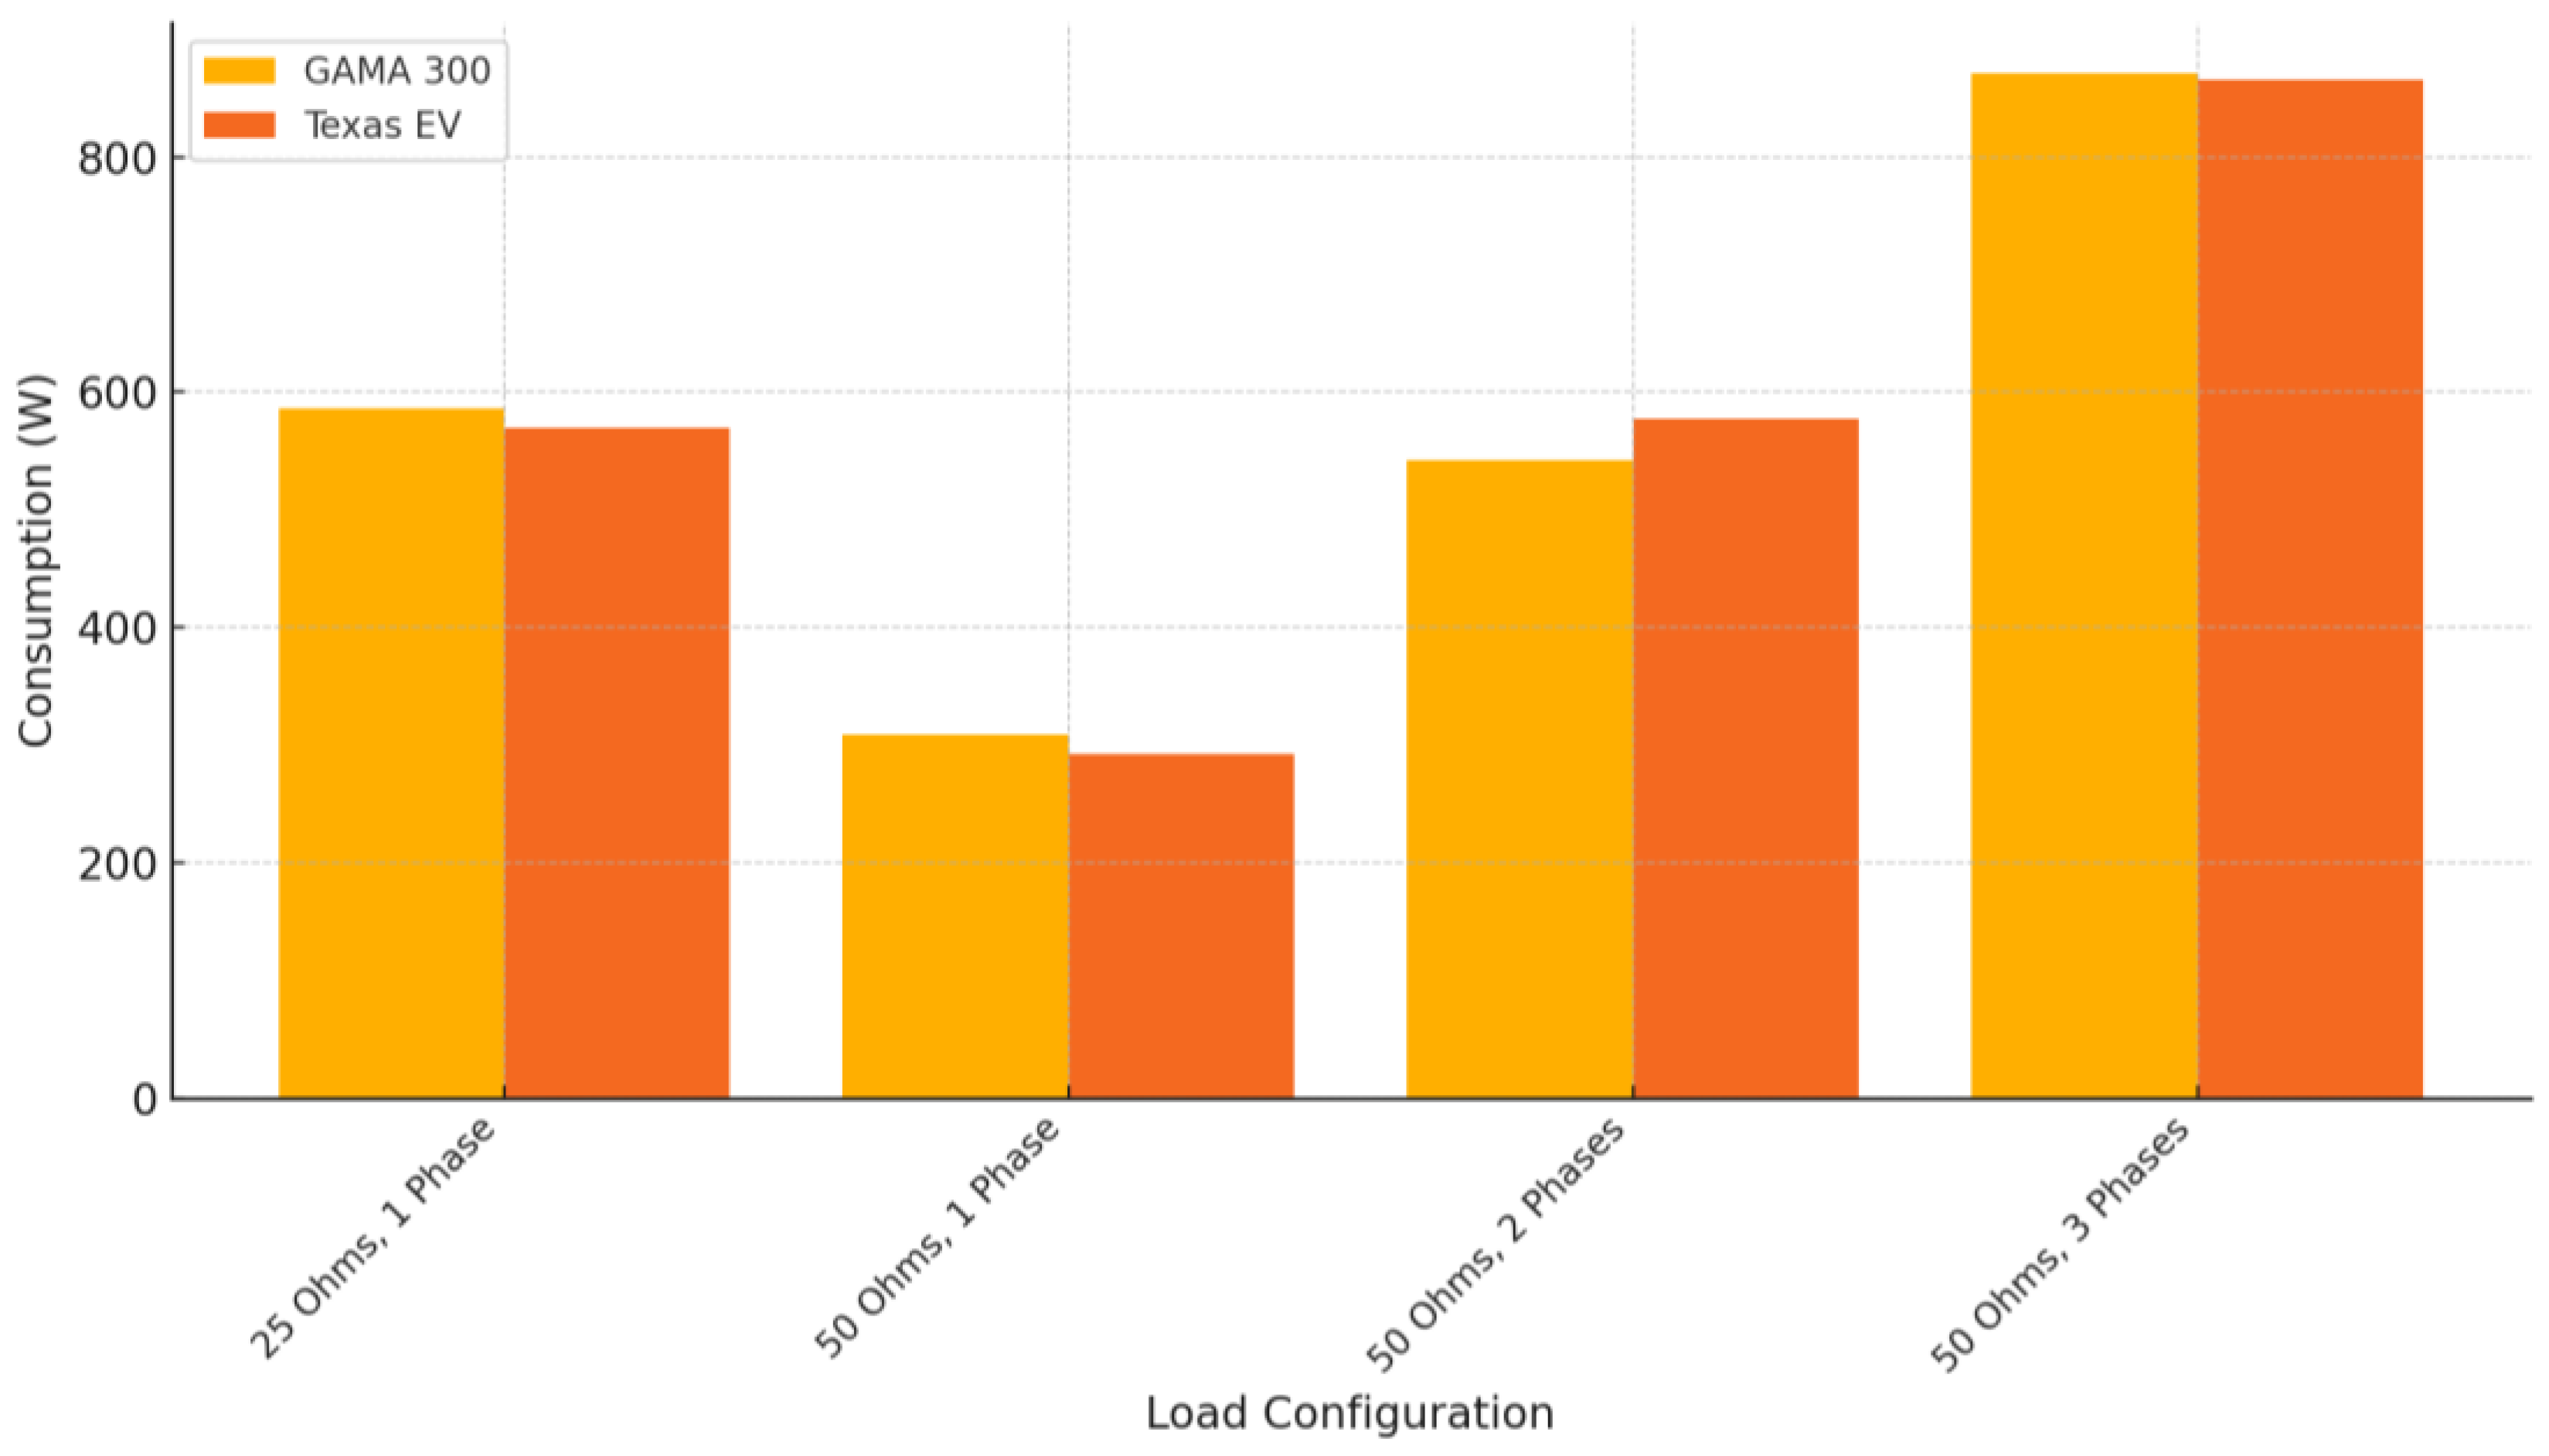
- Accuracy Across Meters: The GAMA 300 and Texas EV meters provided comparable results, with the highest similarity in the 50 Ohms, 3-phase configuration.
5.2. Future Research
- Wireless Communication: Incorporating wireless modules to enhance scalability and enable remote monitoring.
- Real-World Deployment: Extending the study to field testing under diverse environmental and operational conditions.
- Advanced Data Processing: Exploring machine learning techniques to improve system accuracy and adaptability.
Author Contributions
Funding
Data Availability Statement
Conflicts of Interest
Abbreviations
| PLC | Power Line Communication |
| SM | Smart Meter |
| SG | Smart Grid |
| DLMS | Device Language Message Specification |
| COSEM | Companion Specification for Energy Metering |
| CNC | Cellular Networks Communication |
| IEC | International Electrotechnical Commission |
| HAN | Home Area Networks |
| DTR | Data Transmission Rate |
| LCD | Liquid Crystal Diode |
| LED | Light Emitting Diode |
| OS | Open Source |
| OSGi | Open Service Gateway Initiative |
| OBIS | Object Identification System |
| OSPG | Open Smart Grid Platform |
| IoT | Internet of Things |
| IoE | Internet of Energy |
Appendix A
References
- Li, X.; Zhang, D.; Zhang, T.; Ji, Q.; Lucey, B. Awareness, energy consumption and pro-environmental choices of Chinese households. J. Clean. Prod. 2021, 279, 123734. [Google Scholar] [CrossRef]
- Li, X.; Liang, X.; Lu, R.; Shen, X.; Lin, X.; Zhu, H. Securing smart grid: Cyber attacks, countermeasures, and challenges. IEEE Commun. Mag. 2012, 50, 38–45. [Google Scholar] [CrossRef]
- Sun, Q.; Li, H.; Ma, Z.; Wang, C.; Campillo, J.; Zhang, Q.; Wallin, F.; Guo, J. A Comprehensive Review of Smart Energy Meters in Intelligent Energy Networks. IEEE Internet Things J. 2016, 3, 464–479. [Google Scholar] [CrossRef]
- Gavriel, S.D.; Gavriel, S.; Gonzalez, J.F.; Teeuw, W.B.; Philimis, P.; Gillani, G. Emerging Industrial Internet of Things Open-Source Platforms and Applications in Diverse Sectors. Telecom 2024, 5, 369–399. [Google Scholar] [CrossRef]
- Calderón, D.; Folgado, F.J.; González, I.; Calderón, A.J. Implementation and Experimental Application of Industrial IoT Architecture Using Automation and IoT Hardware/Software. Sensors 2024, 24, 8074. [Google Scholar] [CrossRef]
- Güngör, V.C.; Sahin, D.; Kocak, T.; Ergut, S.; Buccella, C.; Cecati, C.; Hancke, G.P. Smart grid technologies: Communication technologies and standards. IEEE Trans. Ind. Inform. 2011, 7, 529–539. [Google Scholar] [CrossRef]
- Alahakoon, D.; Yu, X. Smart Electricity Meter Data Intelligence for Future Energy Systems: A Survey. IEEE Trans. Ind. Inform. 2016, 12, 425–436. [Google Scholar] [CrossRef]
- Home|OpenEnergyMonitor. Available online: https://openenergymonitor.org/ (accessed on 4 January 2025).
- Smart Meters—CEN-CENELEC. Available online: https://www.cencenelec.eu/areas-of-work/cen-cenelec-topics/smart-grids-and-meters/smart-meters/ (accessed on 13 January 2025).
- Barai, G.R.; Krishnan, S.; Venkatesh, B. Smart metering and functionalities of smart meters in smart grid—A review. In Proceedings of the 2015 IEEE Electrical Power and Energy Conference (EPEC), London, ON, Canada, 26–28 October 2015; pp. 138–145. [Google Scholar] [CrossRef]
- Texas Instruments, Implementation of a Low-Cost Three-Phase Electronic Watt-Hour Meter Using the MSP430F67641, Application Report, August 2015.—Aναζήτηση Google. Available online: https://www.ti.com/lit/an/slaa621c/slaa621c.pdf (accessed on 4 January 2025).
- Zhang, K.; Mao, Y.; Leng, S.; Maharjan, S.; Zhang, Y.; Vinel, A.; Jonsson, M. Incentive-Driven Energy Trading in the Smart Grid. IEEE Access 2016, 4, 1243–1257. [Google Scholar] [CrossRef]
- Ghiasi, M.; Wang, Z.; Mehrandezh, M.; Jalilian, S.; Ghadimi, N. Evolution of smart grids towards the Internet of energy: Concept and essential components for deep decarbonisation. IET Smart Grid 2023, 6, 86–102. [Google Scholar] [CrossRef]
- Kanimozhi, N.; Saranya, S.S.; Devipriya, R. Transformation of smart grid to internet of energy. In Blockchain-Based Systems for the Modern Energy Grid; Elsevier: Amsterdam, The Netherlands, 2023; pp. 37–49. [Google Scholar] [CrossRef]
- Kabalci, E.; Kabalci, Y. From Smart Grid to Internet of Energy. In From Smart Grid to Internet of Energy; Elsevier: Amsterdam, The Netherlands, 2019; pp. 1–376. [Google Scholar] [CrossRef]
- Kabalci, Y.; Kabalci, E.; Padmanaban, S.; Holm-Nielsen, J.B.; Blaabjerg, F. Internet of things applications as energy internet in smart grids and smart environments. Electronics 2019, 8, 972. [Google Scholar] [CrossRef]
- Colak, I.; Kabalci, E.; Fulli, G.; Lazarou, S. A survey on the contributions of power electronics to smart grid systems. Renew. Sustain. Energy Rev. 2015, 47, 562–579. [Google Scholar] [CrossRef]
- Ruzbahani, A.M. Enhancing Smart Grids with Internet of Energy: Deep Reinforcement Learning and Convolutional Neural Network, May 2024. Available online: https://arxiv.org/abs/2405.13831v2 (accessed on 19 January 2025).
- The Role of IoT in Smart Grid Technology and Applications–IIoT World. Available online: https://www.iiot-world.com/industrial-iot/connected-industry/the-role-of-iot-in-smart-grid-technology-and-applications/ (accessed on 19 January 2025).
- Yeung: Improving Electric Reliability with Smart Meters—Μελετητής Google. Available online: https://scholar.google.com/scholar_lookup?title=Improving+electric+reliability+with+smart+meters&author=P.+Yeung&author=M.+Jung (accessed on 4 January 2025).
- Faisal, M.; Karim, T.F.; Pavel, A.R.; Hossen, M.S.; Lipu, M.S.H. Development of smart energy meter for energy cost analysis of conventional grid and solar energy. In Proceedings of the 1st International Conference on Robotics, Electrical and Signal Processing Techniques, ICREST, Dhaka, Bangladesh, 10–12 January 2019; pp. 91–95. [Google Scholar] [CrossRef]
- Colak, A.; Ayaz, M.S.; Ahmed, K. Long term benefits of advanced communication techniques in smart grids. In Proceedings of the 9th International Conference on Smart Grid, icSmartGrid, Setubal, Portugal, 29 June–1 July 2021; pp. 283–288. [Google Scholar] [CrossRef]
- Hossain, E.; Han, Z.; Poor, H.V. Smart Grid Communications and Networking; Cambridge University Press: Cambridge, UK, 2012; Volume 9781107014138, pp. 1–481. [Google Scholar] [CrossRef]
- GAMA 300. Available online: https://www.elgama.eu/products/g3b-en (accessed on 13 January 2025).
- DLMS COSEM (IEC 62056) Automatic Meter Reading—Projects/General Guidance—Arduino Forum. Available online: https://forum.arduino.cc/t/dlms-cosem-iec-62056-automatic-meter-reading/116767 (accessed on 13 January 2025).
- DLMS UA Knowledge Hub—White Papers—Videos. Available online: https://www.dlms.com/knowledge-hub/ (accessed on 13 January 2025).
- Ngcobo, T.J.; Ghayoor, F. An overview of DLMS/COSEM and g3-plc for smart metering applications. Int. J. Smart Sens. Intell. Syst. 2022, 15. [Google Scholar] [CrossRef]
- EVM430-F67641 Evaluation Board|TI.com. Available online: https://www.ti.com/tool/EVM430-F67641 (accessed on 12 January 2025).
- Modbus Protocol. Available online: https://www.modbustools.com/modbus.html (accessed on 15 September 2025).
- Modbus RTU: A Comprehensive Guide to Understanding and Implementing the Protocol. Available online: https://www.wevolver.com/article/modbus-rtu-a-comprehensive-guide-to-understanding-and-implementing-the-protocol (accessed on 15 September 2025).
- Overview of Modbus—EPICS Support for Modbus. Available online: https://epics-modbus.readthedocs.io/en/latest/overview.html (accessed on 15 September 2025).
- Modbus Protocol 2025: From Basics to IIoT Integration|EMQ. Available online: https://www.emqx.com/en/blog/modbus-protocol-the-grandfather-of-iot-communication (accessed on 15 September 2025).
- What is the Modbus Protocol and how does it Work? Available online: https://www.gridx.ai/knowledge/modbus-protocol (accessed on 15 September 2025).
- Technical Resources—Modbus Organization. Available online: https://www.modbus.org/technical-resources (accessed on 15 September 2025).
- Viciana, E.; Alcayde, A.; Montoya, F.G.; Baños, R.; Arrabal-Campos, F.M.; Zapata-Sierra, A.; Manzano-Agugliaro, F. OpenZmeter: An Efficient Low-Cost Energy Smart Meter and Power Quality Analyzer. Sustainability 2018, 10, 4038. [Google Scholar] [CrossRef]
- GitHub—Openeemeter/Eemeter: An Open Source Python Package for Implementing and Developing Standard Methods for Calculating Normalized Metered Energy Consumption and Avoided Energy Use. Available online: https://github.com/openeemeter/eemeter (accessed on 12 January 2025).
- EEmeter. Available online: https://opendsm.github.io/opendsm/ (accessed on 30 June 2025).
- EEmeter: Tools for Calculating Metered Energy Savings—Eemeter 3.1.1 Documentation. Available online: https://eemeter.readthedocs.io/index.html (accessed on 30 June 2025).
- UNO R3|Arduino Documentation. Available online: https://docs.arduino.cc/hardware/uno-rev3/ (accessed on 12 January 2025).
- Digital 16bit Serial Output Type Ambient Light Sensor ICs—Product Search Results|ROHM Semiconductor—ROHM Co., Ltd. Available online: https://www.rohm.com/products/sensors-mems/ambient-light-sensor-ics/digital-16bit-serial-output (accessed on 12 January 2025).
- MD 9240 TRMS Power Clamp Meter–Metrel South Africa. Available online: https://metrel.co.za/shop/clamp-meters/md-9240-power-clamp-meter/ (accessed on 12 January 2025).
- Download Microsoft Data Streamer from Official Microsoft Download Center. Available online: https://www.microsoft.com/en-us/download/details.aspx?id=56976 (accessed on 10 July 2025).
- Yen, J.H.; Leber, D.D.; Pibida, L.S. Comparing Instruments; National Institute of Standards and Technology: Gaithersburg, Maryland, 2020. [Google Scholar] [CrossRef]
- Kabalci, E.; Kabalci, Y. Introduction to smart grid and internet of energy systems. In From Smart Grid to Internet of Energy; Elsevier: Amsterdam, The Netherlands, 2019; pp. 1–62. [Google Scholar] [CrossRef]
- Kabalci, E.; Kabalci, Y. Smart metering and smart monitoring systems. In From Smart Grid to Internet of Energy; Elsevier: Amsterdam, The Netherlands, 2019; pp. 63–96. [Google Scholar] [CrossRef]
- Wireless SoCs, Software, Cloud and AIoT Solutions|Espressif Systems. Available online: https://www.espressif.com/ (accessed on 1 September 2025).
- Ikpehai, A.; Adebisi, B.; Rabie, K.M.; Anoh, K.; Ande, R.E.; Hammoudeh, M.; Gacanin, H.; Mbanaso, U.M. Low-power wide area network technologies for internet-of-things: A comparative review. IEEE Internet Things J. 2019, 6, 2225–2240. [Google Scholar] [CrossRef]
- Fréjus, M.; Martini, D. Why energy consumption feedback is not (Only) a display issue. In Lecture Notes in Computer Science (Including Subseries Lecture Notes in Artificial Intelligence and Lecture Notes in Bioinformatics); Springer: Cham, Switzerland, 2016; Volume 9747, pp. 461–471. [Google Scholar] [CrossRef]
- Herrmann, M.R.; Costanza, E.; Brumby, D.P.; Harries, T.; Brightwell, M.d.G.; Ramchurn, S.; Jennings, N.R. Exploring domestic energy consumption feedback through interactive annotation. Energy Effic. 2021, 14, 90. [Google Scholar] [CrossRef]
- Wood, G.; Newborough, M. Dynamic energy-consumption indicators for domestic appliances: Environment, behaviour and design. Energy Build. 2003, 35, 821–841. [Google Scholar] [CrossRef]
- Fischer, C. Feedback on household electricity consumption: A tool for saving energy? Energy Effic. 2008, 1, 79–104. Available online: https://link.springer.com/article/10.1007/s12053-008-9009-7 (accessed on 15 September 2025).
- Darby, S. The Effectiveness of Feedback on Energy Consumption A Review for DEFRA of the Literature on Metering, Billing and Direct Displays, Environmental Change Institute, University of Oxford, Oxford, 2006—References—Scientific Research Publishing. Available online: https://www.scirp.org/reference/referencespapers?referenceid=748760 (accessed on 15 September 2025).
- Grafana: The Open and Composable Observability Platform|Grafana Labs. Available online: https://grafana.com/ (accessed on 15 September 2025).
- Getting Started with Grafana Play—Examples—Dashboards-Grafana. Available online: https://play.grafana.org/d/bdnahipisghdsa/getting-started-with-grafana-play?orgId=1&from=now-1h&to=now&timezone=browser (accessed on 15 September 2025).
- Grafana Labs. Available online: https://github.com/grafana (accessed on 15 September 2025).
- Kumar, H.; Alvarez, O.A.; Kumar, S. Experimental Evaluation of Smart Electric Meters’ Resilience Under Cyber Security Attacks. IEEE Access 2023, 11, 55349–55360. [Google Scholar] [CrossRef]
- Melaragno, A.P.; Bandara, D.; Wijesekera, D.; Michael, J.B. Securing the ZigBee protocol in the smart grid. Computer 2012, 45, 92–94. [Google Scholar] [CrossRef]
- Mitra, S.; Chakraborty, B.; Mitra, P. Smart meter data analytics applications for secure, reliable and robust grid system: Survey and future directions. Energy 2024, 289, 129920. [Google Scholar] [CrossRef]
- Elsisi, M.; Mahmoud, K.; Lehtonen, M.; Darwish, M.M.F. Reliable industry 4.0 based on machine learning and IOT for analyzing, monitoring, and securing smart meters. Sensors 2021, 21, 487. [Google Scholar] [CrossRef]
- Marín-López, A.; Chica-Manjarrez, S.; Arroyo, D.; Almenares-Mendoza, F.; Díaz-Sánchez, D. Security information sharing in smart grids: Persisting security audits to the blockchain. Electronics 2020, 9, 1865. [Google Scholar] [CrossRef]
- Redondo, R.P.D.; Fernández-Vilas, A.; Reis, G.F.D. Security aspects in smart meters: Analysis and prevention. Sensors 2020, 20, 3977. [Google Scholar] [CrossRef]





| Technology | Advantages | Limitations |
|---|---|---|
| Power Line Communication (PLC) |
|
|
| Cellular Networks (CNC) |
|
|
| Wireless Mesh Networks |
|
|
| Short-Range Communication |
|
|
| Hybrid PLC/RF Solutions |
|
|
| ZigBee |
|
|
| Modbus (RTU/TCP) |
|
|
| Class | Use | Accuracy |
|---|---|---|
| 0.2S | Typically used for laboratory and testing applications. | ±0.2% for active and reactive energy |
| 0.5S | Typically used for high-accuracy applications such as energy management systems. | ±0.5% for active and reactive energy |
| 1 | billing purposes. Widely used in commercial applications. | ±1% for active and reactive energy |
| Load Configuration | Device | Measurement 1 | Measurement 2 | Measurement 3 | Measurement 4 |
|---|---|---|---|---|---|
| 25 Ohms, 1 Phase | Prototype | 569.4 | 504.44 | 538.64 | 514.95 |
| Firmware | 540.59 | 537.90 | 537.49 | 536.01 | |
| 50 Ohms, 1 Phase | Prototype | 291.92 | 302.68 | 289.80 | 312.75 |
| Firmware | 294.39 | 292.08 | 299.84 | 291.87 | |
| 50 Ohms, 2 Phases | Prototype | 576.99 | 581.00 | 592.73 | 577.38 |
| Firmware | 564.15 | 572.35 | 569.06 | 565.34 | |
| 50 Ohms, 3 Phases | Prototype | 866.03 | 862.95 | 833.58 | 856.13 |
| Firmware | 856.27 | 859.00 | 852.07 | 865.31 |
| Time (Minutes) | Measurement 1 | Measurement 2 | Measurement 3 | Measurement 4 |
|---|---|---|---|---|
| 1 | 905.27 | 894.54 | 847.06 | 861.00 |
| 5 | 894.61 | 861.86 | 833.31 | 858.40 |
| 10 | 870.06 | 876.54 | 830.81 | 860.28 |
| 15 | 866.03 | 862.95 | 833.58 | 856.13 |
| Load Configuration | Device | Measurement 1 | Measurement 2 | Measurement 3 | Measurement 4 |
|---|---|---|---|---|---|
| 25 Ohms, 1 Phase | GAMA 300 | 586.03 | 543.24 | 550.08 | 538.07 |
| Texas EV | 569.40 | 504.44 | 538.64 | 514.95 | |
| 50 Ohms, 1 Phase | GAMA 300 | 309.14 | 301.02 | 298.66 | 314.09 |
| Texas EV | 291.92 | 302.68 | 289.80 | 312.75 | |
| 50 Ohms, 2 Phases | GAMA 300 | 542.14 | 568.81 | 557.34 | 539.23 |
| Texas EV | 576.99 | 581.00 | 592.73 | 577.38 | |
| 50 Ohms, 3 Phases | GAMA 300 | 871.08 | 869.04 | 858.93 | 860.74 |
| Texas EV | 866.03 | 862.95 | 833.58 | 856.13 |
| Load Configuration | Prototype (kWh) | TI EVM430-F67641 (kWh) | GAMA 300 (kWh) | Error (%) |
|---|---|---|---|---|
| 25 Ω (Single Phase) | 0.250 | 0.253 | 0.251 | ±0.8 |
| 50 Ω (Single Phase) | 0.500 | 0.502 | 0.501 | ±0.6 |
| 100 Ω (Two Phases) | 1.001 | 1.003 | 1.002 | ±0.2 |
| 150 Ω (Three Phases) | 1.502 | 1.503 | 1.503 | ±0.1 |
| Resistance Configuration | GAMA 300 | Texas EV | Texas Firmware |
|---|---|---|---|
| 25 Ohms (single phase) | 554.355 | 531.8575 | 537.997 |
| 50 Ohms (single phase) | 305.7275 | 299.2875 | 294.546 |
| 50 Ohms (two phases) | 551.88 | 582.025 | 567.7245 |
| 50 Ohms (three phases) | 864.9475 | 854.6725 | 858.15975 |
| Resistance Configuration | GAMA 300 | Texas EV | Texas Firmware |
|---|---|---|---|
| 25 Ohms (single phase) | 21.682 | 28.827 | 1.909 |
| 50 Ohms (single phase) | 7.157 | 10.599 | 3.708 |
| 50 Ohms (two phases) | 13.800 | 7.361 | 3.730 |
| 50 Ohms (three phases) | 6.007 | 14.658 | 5.552 |
| Resistance Configuration | GAMA 300 Interval | Texas Firmware Interval |
|---|---|---|
| 25 Ohms (single phase) | [533.107, 575.603] | [536.126, 539.868] |
| 50 Ohms (single phase) | [298.713, 312.742] | [290.912, 298.18] |
| 50 Ohms (two phases) | [538.356, 565.404] | [564.069, 571.38] |
| 50 Ohms (three phases) | [859.06, 870.835] | [852.719, 863.601] |
| Configuration | Between Groups SS | Within Groups SS | Total SS | df Between | df Within | MS Between | MS Within | F-Statistic | p-Value | F Critical |
|---|---|---|---|---|---|---|---|---|---|---|
| Lower (2 Devices) | 1012.27501 | 3903.35017 | 4915.62519 | 1 | 6 | 1012.27501 | 650.558362 | 1.556 | 0.2587 | 5.987 |
| Higher (2 Devices) | 211.15125 | 752.79715 | 963.9484 | 1 | 6 | 211.15125 | 125.46619 | 1.682 | 0.2421 | 5.987 |
| Lower (3 Devices) | 251.975152 | 591.850892 | 783.826044 | 2 | 6 | 125.987576 | 98.641815 | 2.131 | 0.1767 | - |
| Higher (3 Devices) | 218.415452 | 506.477548 | 1063.8934 | 2 | 6 | 109.207726 | 84.412925 | 2.162 | 0.1752 | - |
| Configuration | Between Groups SS | Within Groups SS | Total SS | df Between | df Within | MS Between | MS Within | F-Statistic | p-Value | F Critical |
|---|---|---|---|---|---|---|---|---|---|---|
| Lower (2 Devices) | 1012.27501 | 3903.35017 | 4915.62519 | 1 | 6 | 1012.27501 | 650.558362 | 1.556 | 0.2587 | 5.987 |
| Higher (2 Devices) | 211.15125 | 752.79715 | 963.9484 | 1 | 6 | 211.15125 | 125.46619 | 1.682 | 0.2421 | 5.987 |
| Lower (3 Devices) | 251.975153 | 531.98502 | 783.960173 | 2 | 9 | 125.987576 | 59.1094467 | 2.131 | 0.1747 | 4.256 |
| Higher (3 Devices) | 218.41345 | 845.27995 | 1063.693401 | 2 | 9 | 109.206725 | 93.9199453 | 1.163 | 0.3555 | 4.256 |
Disclaimer/Publisher’s Note: The statements, opinions and data contained in all publications are solely those of the individual author(s) and contributor(s) and not of MDPI and/or the editor(s). MDPI and/or the editor(s) disclaim responsibility for any injury to people or property resulting from any ideas, methods, instructions or products referred to in the content. |
© 2025 by the authors. Licensee MDPI, Basel, Switzerland. This article is an open access article distributed under the terms and conditions of the Creative Commons Attribution (CC BY) license (https://creativecommons.org/licenses/by/4.0/).
Share and Cite
Korakianitis, N.S.; Papageorgas, P.; Vokas, G.A.; Piromalis, D.D.; Kaminaris, S.D.; Ioannidis, G.C.; Zuazola, A.O.d. Design and Evaluation of a Research-Oriented Open-Source Platform for Smart Grid Metering: A Comprehensive Review and Experimental Intercomparison of Smart Meter Technologies. Future Internet 2025, 17, 425. https://doi.org/10.3390/fi17090425
Korakianitis NS, Papageorgas P, Vokas GA, Piromalis DD, Kaminaris SD, Ioannidis GC, Zuazola AOd. Design and Evaluation of a Research-Oriented Open-Source Platform for Smart Grid Metering: A Comprehensive Review and Experimental Intercomparison of Smart Meter Technologies. Future Internet. 2025; 17(9):425. https://doi.org/10.3390/fi17090425
Chicago/Turabian StyleKorakianitis, Nikolaos S., Panagiotis Papageorgas, Georgios A. Vokas, Dimitrios D. Piromalis, Stavros D. Kaminaris, George Ch. Ioannidis, and Ander Ochoa de Zuazola. 2025. "Design and Evaluation of a Research-Oriented Open-Source Platform for Smart Grid Metering: A Comprehensive Review and Experimental Intercomparison of Smart Meter Technologies" Future Internet 17, no. 9: 425. https://doi.org/10.3390/fi17090425
APA StyleKorakianitis, N. S., Papageorgas, P., Vokas, G. A., Piromalis, D. D., Kaminaris, S. D., Ioannidis, G. C., & Zuazola, A. O. d. (2025). Design and Evaluation of a Research-Oriented Open-Source Platform for Smart Grid Metering: A Comprehensive Review and Experimental Intercomparison of Smart Meter Technologies. Future Internet, 17(9), 425. https://doi.org/10.3390/fi17090425


