Abstract
Real-time media streaming over publish–subscribe platforms is increasingly vital in scenarios that demand the scalability of event-driven architectures while ensuring timely media delivery. This is especially true in multi-modal and resource-constrained environments, such as IoT, Physical Activity Recognition and Measure (PARM), and Internet of Video Things (IoVT), where integrating sensor data with media streams often leads to complex hybrid setups that compromise consistency and maintainability. Publish–subscribe (pub/sub) platforms like Kafka and MQTT offer scalability and decoupled communication but fall short in supporting real-time video streaming due to platform-dependent design, rigid optimization, and poor sub-second media handling. This paper presents FrameMQ, a layered, platform-agnostic architecture designed to overcome these limitations by decoupling application logic from platform-specific configurations and enabling dynamic real-time optimization. FrameMQ exposes tunable parameters such as compression and segmentation, allowing integration with external optimizers. Using Particle Swarm Optimization (PSO) as an exemplary optimizer, FrameMQ reduces total latency from over 2300 ms to below 400ms under stable conditions (over an improvement) and maintains up to a reduction under adverse network conditions. These results demonstrate FrameMQ’s ability to meet the demands of latency-sensitive applications, such as real-time streaming, IoT, and surveillance, while offering portability, extensibility, and platform independence without modifying the core application logic.
1. Introduction
What if publish/subscribe (pub/sub) management and optimization could be treated as middleware, abstracted above the platform (i.e., at the broker level), and be directly responsive to application-level needs? The next question would be why? The answer lies in the reality that current optimization efforts are deeply platform- and broker-specific [1,2]. Whether it is Kafka, MQTT, or Redis Streams, each demands its own tuning strategies. This tight coupling makes it hard to develop adaptive behaviors that generalize, let alone scale, across deployments [2]. Recent approaches to platform independence, including cloud-based serverless pub/sub systems and cost-optimized solutions like MemQ [3], as well as WebAssembly-based frameworks like GALOIS [4], have improved portability. However, these solutions often trade one form of lock-in for another through cloud vendor dependencies and introduce additional overhead in execution and networking. Even more comprehensive middleware solutions like SINETStream [5], while better at platform abstraction, still lack robust capabilities for platform-agnostic, adaptive optimization that can be controlled externally from the core system.
With that in mind, the natural next question is what use case best exemplifies this need for a platform-agnostic optimization layer? Our answer is real-time video streaming. But why stream video over pub/sub at all, when traditional protocols like WebRTC or RTMP already exist? Because pub/sub platforms offer decoupling, scalability, and integration into broader event-based infrastructures. Yet, they lack inherent mechanisms for adapting to jitter, load spikes, or frame prioritization, making them a compelling testbed for externalized optimization. For instance, in hybrid systems like Physical Activity Recognition (sensor + video) or Internet of Video Things (IoVT), using pub/sub for sensor data while forcing media through non-pub/sub protocols (e.g., WebRTC) introduces synchronization overhead or negates efficiency gains [6,7].
Thus, in this paper, we introduce FrameMQ, a middleware architecture that sits atop any pub/sub platform and exposes tunable parameters to external optimization processes. To demonstrate this, we use Particle Swarm Optimization (PSO) as an exemplary optimization paradigm. PSO is fast, intuitive, and easy to plug in, and in our architecture, can be easily swapped in with reinforcement learning, other heuristics, or even a priority table based on domain logic. The selection of PSO is illustrative; the primary goal is to demonstrate the viability of broker-externalized optimization.
Our broader goal is to demonstrate that pub/sub platforms can be managed and optimized through an architectural control plane layered above the messaging substrate. This plane can host optimization, monitoring, security policies, QoS tuning, or even LLM-based decision making without needing to rewrite broker internals or switch platforms. Notably, this work lies at the intersection of multiple domains and the scope of this paper is intentionally limited. We are not attempting to benchmark pub/sub platforms against each other, nor are we proposing cross-broker interoperability or new optimization algorithms. Detailed exploration of security, reinforcement learning, and real-world deployments on constrained IoT hardware is intentionally scoped as future work, as these are meaningful extensions that would require their own standalone evaluations.
Rather, this paper aims to provide a foundational architecture and proof-of-concept evaluation to demonstrate architectural flexibility through a focused and demanding use case. Video streaming is difficult [7], it breaks easily under latency and exhibits immediate consequences when things go wrong. That makes it the perfect proving ground. The result is broker-agnostic optimization, where strategies evolve independently of the underlying platforms.
1.1. Identified Issues
- Platform-Dependent Design: Existing pub/sub applications tightly couple use-case logic with platform-specific configurations (e.g., Kafka’s partitioning, MQTT’s QoS settings), creating lock-in and fragmented design patterns that limit portability, code reuse, and architectural standardization [2,8].
- Platform-Constrained Optimization: Optimization in pub/sub platforms is typically embedded within platform-specific APIs and configurations (e.g., Kafka’s batching, MQTT’s QoS levels), reducing flexibility and complicating adaptation to diverse workloads or network conditions [1].
- Limited Real-Time Media Support: Traditional pub/sub platforms lack native support for dynamic real-time media adaptation and sub-second latency control, posing challenges for applications like video streaming in resource-constrained environments [6,7].
1.2. Proposed Solutions
- Platform-Independent Design (Addressing Platform-Dependent Design): FrameMQ decouples application logic from pub/sub platforms via an abstraction layer, enabling seamless migration (e.g., Kafka to MQTT) with simple configuration changes. This eliminates platform lock-in and promotes code reuse by supporting interchangeable components like codecs and optimizers [9,10].
- Flexible Optimization (Addressing Platform-Constrained Optimization): FrameMQ enables dynamic optimization by exposing process-level parameters (e.g., compression, chunk count) to external optimizers like PSO. This allows real-time adaptation to fluctuating network conditions, overcoming platform-specific constraints and supporting diverse workloads [11,12].
- Enhanced Real-Time Media Support (Addressing Limited Real-Time Media Support): FrameMQ achieves sub-second latency for video streaming by optimizing transmission paths and incorporating dynamic media adaptation. This ensures robust, low-latency performance and meets stringent QoS requirements, even in resource-constrained environments, as validated by experimental results [13].
Our work uses Particle Swarm Optimization (PSO), chosen for its rapid convergence and low overhead [12], to enable real-time tuning of parameters such as compression and segmentation. Compared to a baseline Kafka streaming setup with an average total latency of 2300 ms, FrameMQ achieves a latency reduction to below 400 ms under stable conditions (an improvement) and sustains a reduction (587.72 ms) even under degraded network scenarios. These results affirm FrameMQ’s viability as a robust, extensible, and platform-agnostic framework for real-time, latency-sensitive pub/sub applications across diverse deployment environments.
1.3. Paper Organization
The remainder of this paper is organized as follows: Section 2 reviews related work and identifies existing gaps in the literature. Section 3 describes the FrameMQ architecture. Section 4 elaborates on the dynamic optimization intuition. Section 5 details the experimental evaluation. Section 6 presents results, discussions, and limitations. Finally, we conclude with a summary and future research directions.
2. Related Work
The publish–subscribe (pub/sub) paradigm enables scalable, decoupled communication in distributed systems by separating publishers and subscribers in time, space, and synchronization [14]. Yet, real-world adoption for latency-sensitive media applications is limited by platform-specific designs and optimization constraints. This section reviews existing platform-agnostic approaches, platform-specific systems, video streaming efforts, and optimization strategies, before identifying gaps that motivate FrameMQ.
2.1. Platform-Agnostic Pub/Sub Approaches
Efforts toward platform independence fall into four categories:
- Cloud based: For instance, Nasirifard and Jacobsen [15] propose a serverless pub/sub platform on IBM Bluemix and AWS Lambda, while Pinterest’s MemQ [3] reduces costs compared to Kafka. Both approaches, however, incur vendor lock-in to cloud providers and potentially introduce network latency overheads, which are problematic for real-time streaming.
- WebAssembly: An example is GALOIS [4], which uses Wasm for hardware and platform independence, but its execution overhead and stream-processing focus limit suitability for real-time pub/sub messaging.
- Middleware: A major example here is SINETStream [5] which offers a unified API across platforms but acts as a thin wrapper, lacking dynamic parameter tuning or adaptive capabilities.
Overall, these approaches reveal recurring issues: vendor dependency remains, overhead latencies are introduced, and there is a lack of adaptive optimization.
2.2. Limits of Existing Pub/Sub for Real-Time Media and the Need for Middleware Optimization
Traditional pub/sub platforms expose different strengths yet share a common shortcoming for sub-second media delivery. MQTT is lightweight with QoS levels but struggles with latency and jitter for video [16]; Kafka achieves high throughput via a distributed log yet lacks native support for real-time, sub-second streaming [17,18]; RabbitMQ offers flexible routing [19]; and DDS provides rich QoS policies for mission-critical systems [20]. Critically, their optimization levers are platform-coupled, e.g., Kafka tuning centers on batching and compression [21], MQTT on QoS–latency trade-offs [22], and DDS on meticulous policy configuration [20], which creates lock-in and makes cross-platform migration costly and error-prone.
Video streaming over pub/sub underscores this limitation. Proofs-of-concept show feasibility but also reveal missing media-specific QoS and adaptation [7]. Deployments for analytics and surveillance require heavy, platform-specific tuning that undermines portability [23,24,25]. Meanwhile, application-layer ABR (e.g., MPEG-DASH/HLS) adapts bitrate client-side such as BOLA [26] and Pensieve [27], but cannot optimize middleware parameters such as compression, segmentation, or batching in the transport path, since they are not designed to work with pub/sub platforms.
Existing optimization efforts in pub/sub platforms are largely static and platform-bound, improving local objectives (e.g., priority management or multi-objective tuning [28,29]) but lacking a real-time, platform-agnostic control plane. In particular, fast, runtime optimization across brokers remains underexplored. This gap motivates a middleware layer that can dynamically tune transport parameters while preserving portability across heterogeneous pub/sub backends.
2.3. Research Gaps and FrameMQ’s Positioning
The review highlights four gaps: (1) lack of true platform independence without vendor lock-in, (2) absence of real-time handling for media workloads, (3) lack of platform-agnostic optimization capabilities for dynamic parameter tuning, and (4) performance trade-offs that sacrifice latency. FrameMQ addresses these by combining layered platform-agnostic abstractions with dynamic optimization using Particle Swarm Optimization (PSO) for real-time tuning of compression, segmentation, and batching, achieving sub-second streaming performance without sacrificing portability.
3. Proposed Architecture
Our architectural design is directly derived from the proposed solutions in Section 1 and the gaps summarized in Section 2. We distilled three explicit goals and used them to shape the architecture:
- Platform-agnostic layering: The architecture must decouple application logic from any specific broker. Each layer (transmission, encoding/decoding, application) offers a small set of generic processes (e.g., publish/subscribe, compress/decompress, capture/display) that can be composed to implement many use cases. A use case is therefore expressed as a pipeline of processes mapped onto these layers, independent of the underlying platform.
- Externally tunable parameters: The architecture must expose process parameters (e.g., batch size, linger time, chunk count, compression quality) at well-defined layer boundaries. Because inputs and outputs flow cleanly across layers, an optimizer can observe metrics at the consumer end, compute new parameter values, and update producer-side processes without modifying application code or broker internals.
- Real-time media support: The architecture must sustain sub-second latencies for video. We instantiate media-oriented processes (e.g., GStreamer capture at the application layer; JPEG compression and segmentation at the encoding layer) and structure them for multi-threaded execution, while allowing optimization (e.g., PSO) to adjust parameters online to maintain real-time performance under varying conditions.
Figure 1 offers a compact overview of this layered design. It highlights three separable layers—transmission (writer/reader) interfacing the broker, encoding/decoding (encoder/decoder) for payload transformation, and the application layer hosting end-user processes—emphasizing native integration within each layer and loose coupling across layers. The following subsections detail each layer and its role in the streaming pipeline.
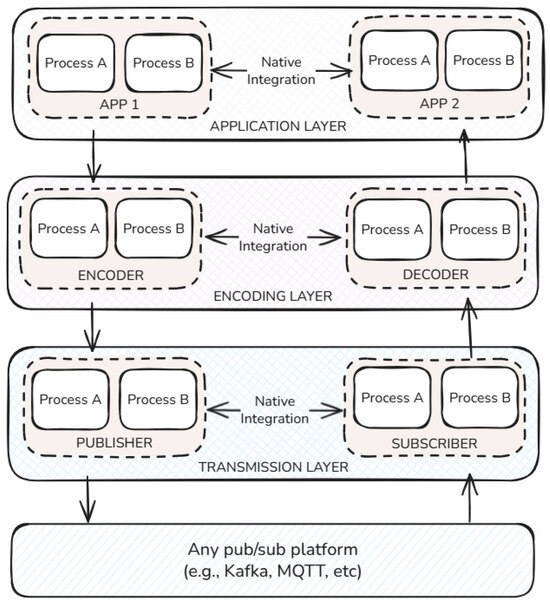
Figure 1.
Showing the proposed architecture divided into three layers. The use case processes are divided into these three layers, where sequential data handling occurs.
3.1. Transmission Layer
This foundational layer forms the base of the proposed architecture and interacts directly with the underlying pub/sub platform, such as Kafka or MQTT. It is responsible for managing all transmission-related processes that handle the movement of data between producers and consumers. These processes include tasks like data serialization and deserialization, configuring producer parameters such as flush interval, buffer size, batch size, and linger time, and managing consumer-side polling mechanisms and their associated settings.
Parameters at this layer align closely with system-level optimization metrics and play a critical role in shaping the system’s overall behavior. Adjustments made here influence transmission efficiency and affect the design and nature of supported use cases. For instance, when the batch size and linger time are configured for larger values, the system can handle periodic event logging where latency is less critical and throughput is prioritized. In contrast, scenarios requiring real-time responsiveness, such as live video streaming, demand smaller batch sizes and minimal or zero linger time to reduce delay and enhance timeliness.
These transmission-level configurations also interact with the logic of the upper layers. For example, a longer linger time and larger batch size allow the encoding or preprocessing modules in the upper layers more time to handle payloads before they are pushed to the messaging layer. This dynamic demonstrates how lower-layer decisions directly shape the responsiveness and adaptability of the architecture.
3.1.1. Core Video Streaming Processes
Serialization
This layer manages the integration of the pub/sub platform’s native transmission mechanisms to efficiently send video frames from source to destination. This includes configuring key producer and consumer properties such as message keying, maximum message size, metadata handling, and serialization logic. For demonstration, each video source which is typically represented by a single camera, is mapped to its own topic, with a configurable maximum message size, initially set to 10 MB, to define the upper bound of a single video frame message.
3.2. Encoding and Decoding Layer
The encoding and decoding layer serves as a critical intermediary, ensuring data from the foundational transmission layer meets the specific requirements of the application layer. Primarily responsible for data transformation, this layer includes various essential operations such as managing codecs, adjusting payload sizes, compressing and decompressing data, implementing encryption for security, and any additional transformations required by particular use cases. Although this layer may sometimes merge directly into the application layer if no significant transformation is necessary, in most cases, it remains distinct due to diverse and specialized use case requirements.
In real-time video streaming, the encoding process on the producer side consists of two key operations: image compression and segmentation. Initially, each captured video frame undergoes compression using an efficient image compression algorithm, typically a JPEG-based library such as LibTurboJPEG. Compression significantly reduces frame size, allowing quicker transmission and better network utilization.
Following compression, each frame is segmented into smaller, manageable chunks. Segmentation is necessary to comply with the pub/sub platform’s (such as Kafka) message size limitations and optimize the system’s capability to handle high-throughput data streams. By dividing large frames into smaller segments, the system mitigates transmission bottlenecks, reduces latency, and achieves a smoother real-time performance even under constrained network conditions.
On the consumer side, the decoding process reverses these steps. Incoming segmented chunks are first reassembled to reconstruct the complete compressed video frame. After reassembly, the frame undergoes decompression using the same JPEG compression library, converting the compressed data into a usable format, typically a NumPy array. This decompressed frame is directly available for further processing, visualization, or real-time analytics tasks within the application layer. This layered approach ensures robust and reliable streaming by separating and standardizing encoding and decoding functionalities. It allows efficient data compression and segmentation handling, facilitating faster and smoother frame transmission while ensuring accurate reconstruction at the receiving end.
The encoding and decoding layer is central to optimizing system performance, maintaining video quality, minimizing latency, and enhancing scalability. Its clearly defined functionalities make it indispensable for demanding applications like real-time video streaming, which require consistent performance and adaptability across varying network environments.
3.2.1. Core Video Streaming Processes
Compression
Lossy compression is employed for each captured video frame to significantly reduce the original frame size, making it more manageable for real-time streaming applications (e.g., reducing a 720p frame from 2.7 MB to approximately 600 KB.) This compression is crucial for maintaining low latency, as smaller frame sizes enable the system to transmit data quickly enough to meet the sub-second latency requirements essential for smooth real-time performance.
It should be noted that the compression applied in our system is external to Kafka’s built-in compression capabilities. Apache Kafka supports four compression algorithms: , , , and . Any of these built-in compression types is recommended for optimal performance, and in this work, we mainly utilize . This dual-layer compression strategy ensures efficient utilization of network resources while preserving the integrity and quality of the video streams.
In our implementation, we primarily use LibTurboJPEG for compressing frames after they are captured from the GStreamer pipeline. However, other JPEG compression libraries such as MozJPEG or OpenCV’s JPEG can also be utilized effectively. Compressing video frames at this level is necessary because, without it, the system would struggle to sustain the low latency, leading to delays and degraded streaming quality. By integrating efficient compression techniques, we enhance the system’s ability to deliver high-quality video streams reliably, even under limited bandwidth constraints and fluctuating network conditions. Most JPEG compression libraries offer a compression percentage parameter that can be adjusted. This parameter, defined at the producer’s encoding layer, determines the image quality retained after compression. For example, setting the image quality to means that an additional compression step is applied in addition to the initial compression that reduces the frame size from 2.7 MB to 600 KB. This further reduces the image quality of the already compressed frame to , resulting in a final message size of approximately 480 KB. The compression percentage ranges from to , where produces a wholly dark and indistinguishable image, and maintains the highest quality, closely resembling the original image.
While image quality satisfaction can be subjective, acceptable viewing quality typically starts at around and above. This work dynamically adjusts the compression percentage parameter to balance latency and image quality based on current network conditions. The system can optimize real-time video streaming performance by fine-tuning this parameter, ensuring that video remains smooth and responsive even when network conditions fluctuate.
Segmentation
After compression in the encoding/decoding layer, each video frame undergoes segmentation or chunking, divided into smaller, message-sized chunks to facilitate faster transmission. The number of chunks can be specified before transmission and varies based on network conditions. This variability allows the system to adapt to different bandwidth scenarios, optimizing the balance between transmission speed and processing efficiency.
However, this approach introduces a trade-off: while increasing the number of chunks can reduce transmission latency by enabling parallel data transfer, it simultaneously leads to higher processing latency at the consumer end. Specifically, the consumer must spend additional time recombining the split chunks into a single frame before decompression, which delays the time for the user to view the video. This increased processing time can affect the overall user experience, particularly in real-time streaming applications where low latency is critical. Therefore, it is essential to carefully balance the number of chunks to optimize transmission and processing latencies, ensuring that the system maintains sub-second latency without compromising the quality and responsiveness of the video stream.
3.3. Application Layer
The architecture culminates with the application layer, serving as the primary interactive interface between the system and external users or data sources. Users engage directly with the system at this level, providing input data or viewing processed results. Since data typically enter or leave the system in various formats, subsequent transformations and processing performed by the lower encoding/decoding and transmission layers are inherently required.
Processes within this application layer commonly include data ingestion, such as real-time frame capture, and visualization tasks, such as real-time video playback via GStreamer or sophisticated 3D rendering when dealing with point cloud (PCD) data streams. The main goal is to enable smooth user interactions, providing clear visualization and rapid data intake, depending on the use-case demands.
3.3.1. Core Video Streaming Processes
Video Capture and Display
The application layer leverages GStreamer pipelines combined with OpenCV libraries, creating a robust interface that seamlessly integrates video capture, transmission, and display functionalities. On the producer side, the application layer initiates a GStreamer pipeline designed to capture live video frames efficiently. These frames are retrieved using OpenCV’s VideoCapture method, allowing immediate extraction and preparation before compression and segmentation. Combining GStreamer and OpenCV ensures minimal latency during frame capture, preserving the continuity and fluidity of the real-time video stream.
On the consumer side, the application layer employs a complementary GStreamer pipeline dedicated exclusively to displaying video frames to the end user. This consumer-side pipeline runs concurrently on its thread, continuously receiving and processing frames as recombined and decompressed by the encoding/decoding layer. Utilizing a separate thread ensures uninterrupted video display without introducing latency or bottlenecks that could affect other layers’ concurrent decoding or transmission tasks. Consequently, frames are instantly delivered into the visualization pipeline, achieving seamless playback and a responsive user experience.
By clearly defining responsibilities within the application layer, this architecture ensures that users experience reliable, high-quality, and low-latency video streaming. The strategic use of technologies such as GStreamer and OpenCV across producer and consumer endpoints enables an efficient and scalable approach, ultimately supporting smooth interactions, enhanced user satisfaction, and adaptability to diverse use-case requirements.
Figure 2 summarizes the end-to-end data path on the producer and consumer sides. It maps frame capture, compression and segmentation, transport to and from the broker, de-segmentation and decoding, and final display, showing how responsibilities are partitioned across the three layers.
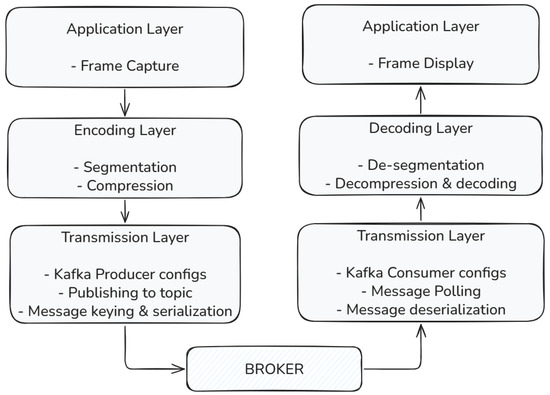
Figure 2.
Layered architecture of the real-time streaming platform.
4. Dynamic Optimization
The optimization method is interchangeable: the PSO-based controller and the scalarization adopted here are illustrative, and alternative optimizers (e.g., the Grey Wolf Optimizer or reinforcement learning) can be plugged in without architectural changes because parameters are exposed at clear layer boundaries. While the proposed layered architecture establishes a robust foundation for real-time video streaming across diverse pub/sub platforms, the static configuration alone cannot guarantee consistent performance under fluctuating conditions. Environmental changes—such as network congestion, bandwidth degradation, or evolving application demands like higher-resolution video—can significantly affect system latency and throughput. Without mechanisms for runtime adaptation, even a well-designed system risks deteriorating performance. Dynamic optimization is therefore essential: it enables the architecture to continuously monitor critical metrics and adapt transmission and processing parameters in real time, preserving low-latency performance and ensuring resilient, scalable operation across heterogeneous and unpredictable environments.
4.1. Setup
4.1.1. Positioning the Optimization Manager
The optimization manager operates alongside the consumer, leveraging metadata sent with each frame from the producer. This metadata enables the calculation of per-frame latency (e.g., producer timestamp minus consumer timestamp) and metrics like chunk size. In platforms with broker-level insights, additional data (e.g., parallelism metrics) may be retrieved via administrative interfaces, though this is optional. Figure 3 depicts this setup: the manager collects metrics from the consumer, computes adjustments, and notifies the producer via a dedicated notification channel. The producer, subscribed to this channel, updates parameters for subsequent frames, creating a feedback loop. The optimization manager’s key role is deciding when to adjust parameters or maintain the status quo, using any chosen optimization technique.
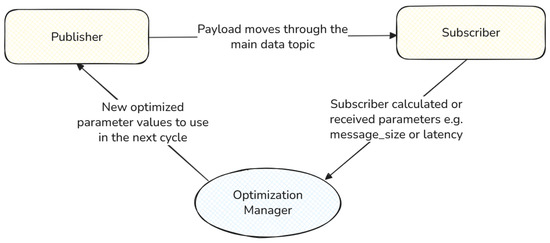
Figure 3.
Optimization setup: the manager gathers metrics from the consumer and signals parameter updates to the producer for the next frame.
Figure 3 visualizes this closed-loop control: payloads traverse the main topic between the producer and consumer, while the optimization manager receives consumer-measured metrics and sends updated parameters back to the producer on a side channel for the next cycle.
4.1.2. Optimization Parameters
The dynamic optimization framework operates by adjusting controllable parameters exposed by the architecture’s layered design. In this work, we focus specifically on parameters relevant to real-time video streaming, where minimizing transmission latency and maintaining acceptable video quality are critical. The chosen targets reflect the characteristics and constraints of video payloads transmitted over pub/sub platforms. However, it is essential to note that the architecture is not limited to these parameters. Other use cases—such as sensor data aggregation, event-driven control systems, or large-scale telemetry—may define different optimization targets appropriate to their performance priorities.
For the real-time video streaming scenario, the selected optimization parameters are as follows:
- Number of Chunks: Segmentation allows dynamic adjustment of chunk count per frame. In constrained scenarios, increasing chunks reduces per-chunk transmission latency by shrinking message sizes, enhancing responsiveness.
- Compression Quality Percentage: Defined during compression, this parameter trades image quality for frame size reduction. Lowering the percentage shrinks frames significantly, aiding latency under resource limits.
- Parallelism Units (Optional): In platforms supporting parallelism (e.g., partitions or channels), this parameter adjusts the number of concurrent streams. It can increase dynamically to boost throughput, though reductions may be restricted, requiring sparing use in optimization.
- Image Resolution: Adjusted at frame capture, resolution (e.g., 720p at 1280 × 720 vs. 360p at 640 × 360) alters frame size. Lowering resolution reduces payload under poor conditions, with the consumer upscaling to maintain display dimensions (e.g., 360p to 720p), accepting reduced quality as a trade-off.
Together, these parameters form this study’s real-time video streaming optimization scope. Future extensions or different application domains may incorporate alternative optimization targets, leveraging the architecture’s extensibility to adapt dynamically across diverse use case requirements.
4.2. Linear Optimization—Proof of Concept
We developed a basic linear optimization model as proof of concept and intuition. We begin by defining a target latency value. This value is the base to which the algorithm compares the parameters. A simple equation defines it:
where denotes the latency increase, L the current latency, and the target latency. We use this latency increase to calculate the equivalent increase or decrease in the other parameters, which we call the delta factors. We use weight values to define the sensitivity of each parameter against the latency increase. For instance, a smaller divisor like 1.2 implies heightened sensitivity, as the resulting quotient will be more considerable, leading to a more pronounced increase or decrease in the corresponding parameter. Then, these delta factors are defined as follows;
Here, , , , and represent quality increase, chunks increase, partition increase, and resolution level increase, respectively. The terms , , , and denote the parameter sensitivity weights.
Then, we use the delta factors to increase the values of the original parameters with an equivalent percentage, encapsulating the principle that the adjustment to the parameter should be proportional to the latency increase, moderated by the sensitivity weight. If latency increases by a certain percentage, we aim to improve the parameters by a similar rate, tempered by the sensitivity factor. Since the resolution level is a step value, we take the floor or ceiling of the value obtained in the range between 0 and 2, where zero is 360p, and 2 symbolizes 1080p. The equations are as follows:
Here, represents the updated quality (we subtract here because intuitively, we do not want the video quality to decrease and want to maintain high-quality streaming conditions; this depends on the use case), the updated number of chunks, the updated number of partitions, and the updated level (stepped value). The term denotes the range for level stepping (e.g., between 0 and 2). The latency-based parameter optimization algorithm operates as follows. First, it computes the latency difference using Equation (1). If , indicating that the current latency exceeds the target, the algorithm computes adjustment factors based on the excess latency using Equations (2) to (5). These adjustment factors are then applied to update the parameters as per Equations (6) to (9). Finally, the updated parameters , , , and are communicated to the producer, ensuring the system adapts dynamically to latency variations.
4.3. Particle Swarm Optimization (PSO)
While the linear optimization model offers simplicity, it often struggles with local minima and adapting to improving conditions, such as reduced latency. A more robust optimization technique is needed to balance trade-offs—e.g., low-quality, high-chunk streaming in resource-scarce scenarios versus high-quality, low-chunk streaming in abundant conditions. Such robustness ensures adaptability across dynamic environments, maintaining consistent performance. Particle Swarm Optimization (PSO) is an example of such a technique, demonstrating how advanced algorithms can enhance the framework’s flexibility. However, the framework remains open to any optimization method, with PSO providing intuition for adaptive streaming.
PSO, a population-based stochastic approach inspired by social behaviors like bird flocking or fish schooling [30], uses a swarm of particles to explore the solution space. Each particle represents a candidate parameter set, iteratively refined based on individual and collective experiences [31]. Its key components include the following:
- Fitness Function: A crucial component that evaluates how well each particle’s position solves the optimization problem. It assigns a numerical value representing the quality of the solution, guiding the entire optimization process.
- Particles: Individual candidate solutions that explore the search space. Each particle has a position representing a potential solution and a velocity determining its movement. The initial position and velocity values are randomly sampled from a uniform distribution between some reasonable bounds a and b.
- Swarm: The collective group of particles that interact and share information to guide the search for the optimal solution.
- Personal Best (): The best position that each particle has achieved based on its own experience, determined by comparing fitness values over time.
- Global Best (): The best position found by the entire swarm, representing the most optimal solution discovered so far, identified through fitness evaluation.
- Velocity and Position Update: Particles update their velocities and positions based on their and the swarm’s , balancing exploration of the search space and exploitation of known reasonable solutions [30].
- Iteration Process: The swarm iteratively updates particles’ velocities and positions, continuously evaluating fitness and adjusting based on and until a termination condition is met (e.g., maximum number of iterations or satisfactory fitness level).
During each iteration, particles adjust their velocities based on their current velocity, the distance from their personal best, and the global best. The fitness function plays a central role in this process by quantifying the quality of each solution, enabling meaningful comparisons between different positions, and guiding the swarm toward optimal solutions. This dynamic adjustment allows the swarm to explore the search space effectively, balancing exploration and exploitation. By leveraging the swarm’s collective intelligence and the fitness function’s guidance, PSO can efficiently navigate complex, multi-dimensional landscapes, avoiding local minima and adapting to changing conditions [32]. This makes PSO particularly suitable for balancing streaming quality and resource allocation in environments with fluctuating resource availability, ensuring robust and adaptive performance.
Optimization Design
In our experiment, the fitness function is designed to evaluate each particle’s position based on multiple key metrics, primarily focusing on minimizing latency while considering quality, partitions, chunks, and level. The fitness value is initialized to infinity to ensure that any feasible solution will be better than the initial state.
The fitness function is correlated to latency, meaning minimizing the fitness function means minimizing latency. Each component of the fitness function represents a weighted squared difference between the actual and target values for key metrics:
Here, L, Q, P, C, and V denote latency, quality, partitions, chunk number, and level, respectively. The terms , , , , and represent the sensitivity weight coefficients (each in ). The fitness function is formulated as follows:
Thus, lower fitness values indicate better solutions. We now state the optimization problem formally. Let the decision vector for a particle be with dimensionality , where Q is the compression quality (percent), C is the chunk count (integer), P is parallelism/partitions (integer), and V is the resolution level (discrete). Latency L is not part of the vector, because it is not directly controllable. Instead, L is the outcome measured when you apply to the streaming system. The mixed domain is . The objective is the scalarized multi-objective fitness
with components defined in Equations (7)–(12) using normalized ratios relative to targets , , , , and . For mixed variables, PSO updates positions in and then projects to by rounding C and P to the nearest integers, snapping V to the nearest element of , and clipping to bounds.
Weights encode use-case priorities. In latency-focused experiments we used ; this rewards latency reduction most, mildly preserves quality/resolution, and allows chunk/partition adjustments to shrink payload or increase parallelism when helpful. Increasing forces higher visual fidelity (larger frames), which PSO compensates for by raising C or P, yielding a higher latency floor—an expected trade-off. Different weights or even alternative scalarizations (or optimizers such as GWO) can be substituted without changing the architecture. For instance, if we want to extremely penalize latency at the cost of quality, we can set to a very large value, say 10, and reduce the weights for quality and resolution. This will force the optimizer to minimize latency at the expense of quality. Hence, in such a scenario, quality values would be consistently low. The design of the fitness function and the weights can be adapted to the use case of the practitioner. Our design is merely a proof of concept to demonstrate the feasibility of the framework.
As outlined in Algorithm 1 below, particles adjust their velocities each iteration based on their current velocity, distance from their personal best position, and global best position. This dynamic adjustment allows the swarm to explore the search space effectively, balancing exploration and exploitation. By leveraging the collective intelligence of the swarm, PSO can efficiently navigate complex, multi-dimensional landscapes, avoiding local minima and adapting to changing conditions. This makes PSO particularly suitable for balancing streaming quality and resource allocation in environments with fluctuating resource availability, ensuring robust and adaptive performance.
| Algorithm 1: Particle swarm optimization with defined fitness functions |
 |
5. Experimental Setup
This section details the experimental setup and data collection methods to validate the proposed real-time video streaming framework, ensuring reproducibility. While the architecture is platform-agnostic, we selected Apache Kafka as the pub/sub platform and Particle Swarm Optimization (PSO) as the optimization algorithm for this experiment to test and demonstrate the system’s capabilities. These choices enabled precise evaluation of latency, scalability, and adaptability, though the framework supports any pub/sub platform and optimization technique. The setup includes software, hardware, and system architecture configurations tailored for this validation.
5.1. Software Libraries
The implementation leverages a combination of software libraries to ensure efficient video capture, processing, transmission, and display. The primary libraries and tools utilized include the following:
- Python, version 3.9: The core programming language for developing the producer and consumer scripts, enabling seamless integration with various libraries and frameworks.
- kafka-python, version 2.0.2: A Python client for Apache Kafka, facilitating interaction with the Kafka broker for message publishing and consumption.
- OpenCV (cv2), version 4.6.0: Utilized for video capture and frame manipulation, with GStreamer support enabled to handle multimedia pipelines effectively.
- GStreamer, version 1.8.3: A versatile multimedia framework for constructing pipelines that manage video encoding, decoding, and streaming processes.
- LibTurboJPEG, version 1.7.2: A high-performance JPEG compression library used to compress video frames before transmission, ensuring reduced latency and optimized bandwidth usage.
- Multi-threading, version 3.0.0: Implemented to parallelize processing tasks, enhancing the system’s ability to handle real-time data streams efficiently.
5.2. Hardware Setup
The hardware configuration for the experiment is meticulously chosen to ensure consistent performance and accurate latency measurements. The setup comprises the following:
- Producer and Consumer Processes:
- –
- Specifications:
- *
- Producer/Consumer:
- ·
- Processor: Intel Core i7-7700T, 2.9 GHz, 4 Cores.
- ·
- Memory: 16.24 GB RAM.
- ·
- Operating System: Ubuntu 22.04 LTS.
- *
- Broker:
- ·
- Processor: Intel Xeon E5-2430, 2.2 GHz, 1 Core.
- ·
- Memory: 16.37 GB RAM.
- ·
- Operating System: Ubuntu 22.04 LTS.
- Cameras:
- –
- Camera 1: 30 FPS, 720p capable (Creative Live!).
- –
- Camera 2: 60 FPS, 1080p capable (Logitech).
The producer and consumer scripts are executed as separate processes on the same machine for experimental purposes. This configuration ensures synchronized timing for accurate latency and jitter measurements, eliminating potential discrepancies caused by network-induced delays.
5.3. System Architecture
Figure 4 outlines the producer-side flow: frames are captured via a GStreamer pipeline, compressed to JPEG, segmented into chunks with lightweight metadata, and published to the broker.
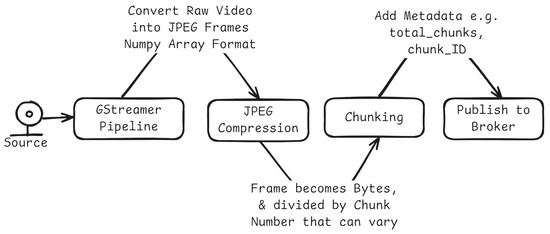
Figure 4.
System architecture from the producer’s perspective.
The setup also includes three dedicated threads for the producer and consumer, each responsible for distinct tasks to optimize performance and maintain low latency.
5.3.1. Producer Threads
- Frame Capture: Utilizes OpenCV’s VideoCapture method to capture frames from the GStreamer pipeline.
- Encoding: Applies JPEG compression using LibTurboJPEG and segments the compressed frames into smaller chunks for transmission.
- Frame Transmission: Publishes the segmented chunks to the designated Kafka topic.
5.3.2. Consumer Threads
- Frame Subscription: Subscribes to the Kafka topic and receives the segmented chunks.
- Decoding: Recombines the received chunks and decompresses the frames using the JPEG compression library to restore them to their original format.
- Frame Display: Feeds the decompressed frames into the GStreamer pipeline for real-time display.
Figure 5 shows the consumer-side path: the client subscribes and deserializes messages, recombines chunks in parallel, decodes JPEG frames, and feeds them into a GStreamer display pipeline with simple buffering for flow control.
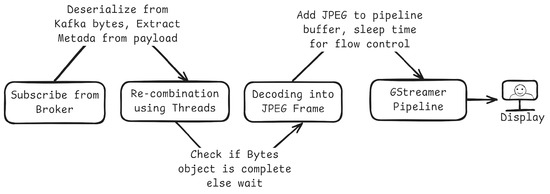
Figure 5.
System architecture from the consumer’s perspective.
5.3.3. Packet Flow and Multi-Threading Logic
The journey of a video frame through the system begins with the producer capturing the frame using the GStreamer pipeline. The captured frame is then compressed using LibTurboJPEG, reducing its size to optimize transmission. This compressed frame is subsequently segmented into smaller chunks to facilitate faster data transmission.
Each chunk is published on a topic that awaits consumption by the consumer. Upon receiving the chunks, the consumer leverages multiple threads to expedite recombination. Specifically, each chunk is decoded and added to its respective frame using separate threads, significantly reducing the time required to reconstruct the complete frame. This multi-threaded approach ensures that recombination does not become a bottleneck, thereby maintaining low processing latency.
Once the frame is fully recombined and decompressed, it is fed into the consumer’s GStreamer pipeline for display. This pipeline operates on a separate thread, continuously receiving and rendering frames as they become available. Dedicated threads for each stage—capture, encoding, transmission, subscription, decoding, and display—ensure that each process operates concurrently without hindering the overall system performance.
5.3.4. Metrics Collection and Calculation
To systematically evaluate the performance of our system, we implemented a comprehensive metrics collection framework by embedding metadata directly into the payload of each transmitted frame. This approach facilitated the seamless tracking and measurement of key performance indicators without introducing significant overhead.
Each payload contains essential metadata fields such as the following:
- Unique Identifiers: Fields like message_uuid ensure that each frame can be distinctly tracked throughout the transmission process.
- Quality Metrics: The quality parameter records the compression quality, allowing us to assess the data size and quality trade-off.
- Temporal Data: Timestamps such as produce_time and consume_time are crucial for calculating latencies.
- Network Conditions: Parameters like packet_loss and bandwidth capture the state of the network, enabling the simulation of various adverse conditions during experimentation.
- Message Details: Information including msg_size, chunk_num, and total_chunks provides insights into the data segmentation and transmission efficiency.
Embedded metadata (e.g., timestamps, chunk IDs) comprise ≤0.5% of the payload, rendering its overhead negligible. Experiments confirmed no observable impact on streaming performance, even under constrained bandwidth. This design choice was pivotal in enabling smooth experimentation, as it allowed for precise calculation and measurement of key performance metrics such as latency, throughput, and error rates.
The collected metrics were subsequently processed using defined formulas to derive meaningful performance indicators. For instance:
- Transmission Latency: Calculated as the difference between consume_time and produce_time, this metric quantifies the time taken for a frame to traverse from producer to consumer.
- Total Latency: Derived from the difference between show_time and produce_time, it represents the complete latency experienced from frame production to its display.
These calculations presented the system’s performance under various network conditions, including packet loss and bandwidth restrictions. The Section 6 presents a detailed analysis and interpretation of these metrics.
6. Results and Discussion
This section validates the three core claims of FrameMQ introduced in Section 1: (1) platform-independent design to address platform-dependent design issues, (2) flexible optimization to overcome platform-constrained optimization, and (3) enhanced real-time media support for latency-sensitive video streaming.
6.1. Platform-Independent Design Validation
To validate FrameMQ’s platform-independent design, we assessed its ability to decouple application logic from platform-specific configurations, enabling seamless migration across pub/sub platforms (e.g., Kafka, MQTT) and promoting code reuse. FrameMQ was tested on a local network, utilizing MQTT, then without modifying the core implementation, on Kafka. The layered design, illustrated in Figure 1, allowed configuration changes (e.g., switching Kafka’s partitioning to MQTT’s topic hierarchies) without altering use-case logic.
This was demonstrated by consistent performance across platforms, on a 60 FPS camera, with Kafka averaging 274 ms transmission latency and 380 ms total latency, while MQTT yielded comparably lower results by 100 ms. Figure 6 shows both platforms’ experiment runs side by side.
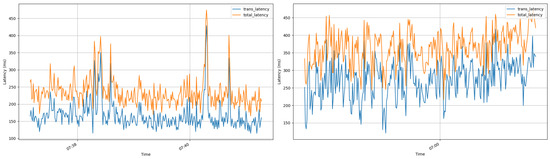
Figure 6.
Side-by-side time-series: FrameMQ with PSO on MQTT (left) and Kafka (right). Per-frame transmission (blue) and total (orange) latency over ~250 s; x-axis denotes wall-clock time.
Figure 6 presents per-frame transmission and total latency as time-series over approximately 250 s of continuous streaming. Time-series views complement averages by revealing (i) stability and jitter around target bounds (how tightly latency stays within expected ranges), (ii) transient spikes and burstiness and how quickly the system recovers, and (iii) any drift or steady-state degradation. This evolution is important for real-time systems because consistent behavior—not just low mean latency—determines QoS predictability and end-user experience.
FrameMQ operated consistently on both platforms without modifying application logic, confirming its platform-agnostic design. MQTT showed higher latency variance than Kafka, likely due to its lightweight design versus Kafka’s optimization for high-throughput streaming. Both maintained sub-second latencies, suitable for latency-sensitive applications. This experiment demonstrates FrameMQ’s ability to eliminate platform lock-in, addressing the platform-dependent design issues in Section 1.
6.2. Flexible Optimization Validation
FrameMQ’s flexible optimization was evaluated by testing its ability to dynamically tune parameters (e.g., compression size, frame segmentation) using Particle Swarm Optimization (PSO) in a second experiment performed under varying network conditions, to overcome platform-constrained optimization.
6.2.1. Raw Performance
Transmission latency remains below 100 ms (76.95 ms for 30 FPS, 97.77 ms for 60 FPS), suitable for real-time streaming. Total latency (214.01 ms and 259.74 ms) includes processing overhead, with higher FPS increasing latency due to larger frame sizes (118.14 kb vs. 92.28 kb). Jitter is low (2.07–3.58 ms), ensuring stable playback. Figure 7 shows consistent latency over a run of 500 s, confirming FrameMQ’s reliability. Occasional spikes (e.g., around 22:17 wall-clock time) are typical in real-time pipelines and can arise from short-lived scheduling or GC pauses, transient I/O contention, or bursty kernel/broker buffering; the important property is rapid recovery without sustained drift.
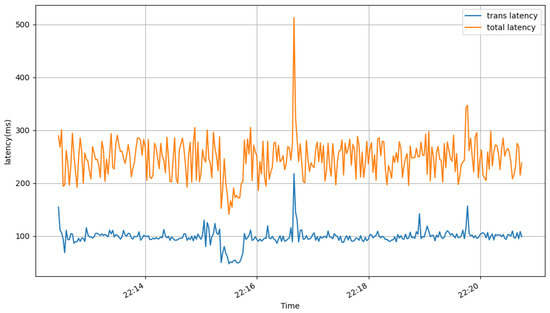
Figure 7.
Transmission and total latency for Camera 2 (60 FPS) over 500 s; x-axis is wall-clock time.
Table 1 summarizes the performance metrics across the 30 and 60 FPS conditions, including transmission and total latency, jitter, writer/reader FPS, and average frame size.

Table 1.
Performance metrics for different camera FPS settings. FPS: camera frames per second; Ltrans: average transmission latency; Ltotal: average total latency; FPS-W: writer FPS; FPS-R: reader FPS; Jitter: average jitter; Fsize: average frame size.
6.2.2. Impact of Optimization on System Performance
To evaluate the effectiveness of our Particle Swarm Optimization (PSO) framework, we conducted a comparative analysis across four distinct operational modes. These modes were designed to isolate the impact of the optimizer under both stable and adverse network conditions:
- Baseline (No PSO, No Network = noOpt-noNetem): The system operated over a stable network without any optimization, representing an ideal-case scenario.
- PSO Only (PSO, No Network = opt-noNetem): The optimizer was active in a stable network environment, allowing us to observe its behavior and overhead when network conditions are not a limiting factor.
- Network Only (No PSO, Network = noOpt-Netem): The system was subjected to adverse network conditions without optimization. This mode serves as our control case to quantify the negative impact of a degraded network.
- PSO + Network (PSO, Network = opt-Netem): The optimizer was employed to actively mitigate the effects of adverse network conditions, representing the primary test of our solution.
For the adverse network scenarios, we utilized Linux tc with netem to emulate a challenging environment with a 150 ms delay, 10 ms jitter, correlation, packet loss, and 10 Mbps bandwidth cap. The PSO optimizer was configured with a target latency of 60 ms and weights favoring latency reduction (, ).
Our analysis demonstrates that the PSO-based optimization yields substantial performance improvements, particularly in mitigating the high latency introduced by poor network quality. Figure 8 summarizes these effects across modes: boxes show IQRs with medians, whiskers capture dispersion, and outliers reflect transient spikes; the annotation reports the significance of the improvement under adverse networks.
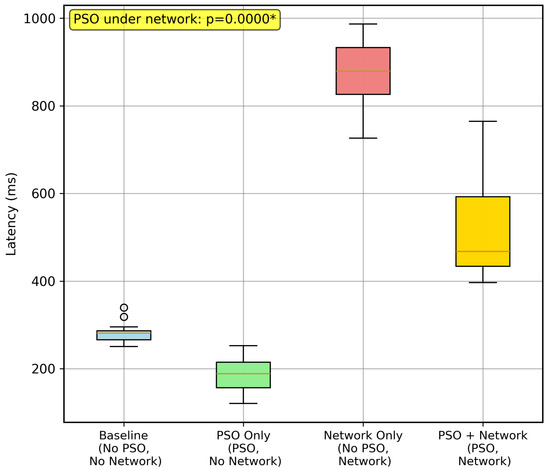
Figure 8.
Distribution of end-to-end (total) latency across the four experimental conditions. The “Network Only” condition shows significantly higher latency, which is effectively mitigated in the “PSO + Network” condition. The annotation highlights the statistically significant difference (p < 0.0001) between these two key modes. The asterisk (*) denotes statistical significance.
As illustrated in the boxplot, the “Network Only” condition resulted in a dramatic increase in latency, with a median value approaching 1000 ms. In contrast, when the optimizer was enabled in the “PSO + Network” mode, it successfully reduced the median latency to below 600 ms. This demonstrates the optimizer’s capability to effectively counteract network degradation. In stable environments (“Baseline” and “PSO Only”), latency remained low, confirming that the optimizer introduces minimal overhead.
To visualize the real-time dynamics of this improvement, Figure 9 compares the latency traces for the “Network Only” and “PSO + Network” conditions (x-axis: seconds since start). Time evolution matters because it reveals convergence, recovery after bursts, and any drift that averages alone hide. In “Network Only” (left), the average is higher at the beginning due to cold-start effects (connection setup, cache warm-up, topic subscription/rebalance) and remains elevated under periodic netem bursts; it rises again near the end as queuing pressure accumulates without adaptive relief. In contrast, with PSO (right), the average drops quickly as the optimizer converges from default parameters to smaller frame sizes and suitable chunk counts, and it maintains a lower trajectory despite the same bursts, evidencing faster recovery and reduced variance.
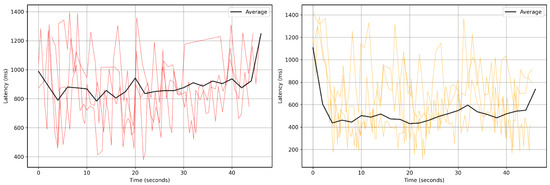
Figure 9.
A time-series comparison of latency with and without optimization under adverse network conditions (x-axis: seconds since start). (Left): The “Network Only” condition exhibits high and erratic latency, with individual frames frequently spiking above 1200 ms. (Right): The “PSO + Network” condition demonstrates a significantly lower and more stable average latency, showcasing the optimizer’s effectiveness in real time.
The quantitative results, summarized in Table 2, confirm these observations. The total latency in the “Network Only” mode exceeds latencies of above 1000 ms. The “PSO + Network” mode reduced this to just 521.1 ms, a improvement. This gain is primarily achieved by dynamically adjusting the video stream’s parameters to reduce the average frame size from 125.61 KB to 55.17 KB, allowing for faster transmission over the constrained network.
Table 2.
Performance metrics under different optimization and network emulation modes for Camera 2 (60 FPS). Mode: optimization and network emulation configuration; Ltrans: average transmission latency; Ltotal: average total latency; FPS-W: writer FPS; FPS-R: reader FPS; Jitter: average jitter; Fsize: average frame size.
A formal statistical analysis, detailed in Table 3, validates the significance of these improvements. When comparing the “Network Only” and “PSO + Network” conditions, the reduction in end-to-end latency was statistically significant (). The large Cohen’s d value of 3.73 indicates a very large effect size, confirming that the observed improvement is substantial and not due to random chance.
Table 3.
Statistical comparison of PSO optimization under network constraints. Values reflect improvements from non-optimized (noOpt-Netem) to optimized (Opt-Netem) conditions; I: improvement.
One notable trade-off is the increase in jitter observed in the optimized modes (e.g., 14.79 ms in “PSO + Network” vs. 1.12 ms in “Network Only”). This increased jitter is an expected consequence of the PSO’s iterative adjustments to system parameters as it adapts to changing conditions, a characteristic further explored in Section 7.
6.3. Scalability of FrameMQ
We evaluated the scalability of FrameMQ by measuring its performance as the number of consumers was systematically increased from one to ten. Our initial findings indicate that, without optimization, end-to-end latency rises significantly with the number of consumers. Figure 10 shows the transmission latency remaining relatively the same; however, Figure 11 illustrates the rising trend, where processing latency constantly increases, such that both the median latency and its variance grow as more consumers join the stream. In Figure 10, each boxplot encodes dispersion: the blue rectangle is the interquartile range (25th–75th percentile), the black line within the box marks the median, whiskers extend to 1.5 IQR, and dots are outliers. Increased outliers at low counts reflect sporadic bursts; higher medians at larger counts indicate load pressure.
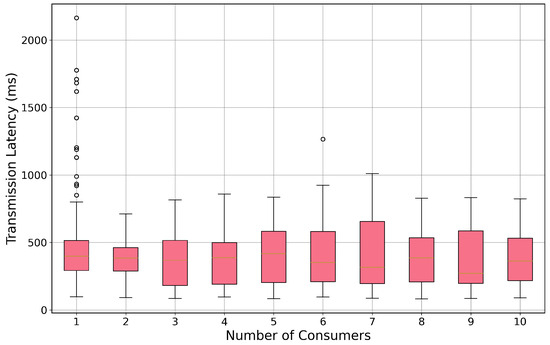
Figure 10.
Distribution of end-to-end latency as a function of the number of consumers. Pink rectangles show the interquartile range (25th–75th), the yellow line inside each box is the median, whiskers extend to 1.5 IQR, and black dots are outliers. As the consumer count increases, median latency and variability rise, indicating system strain.
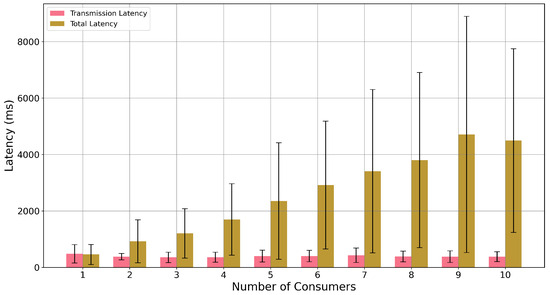
Figure 11.
Latency components versus number of consumers: pink bars denote mean transmission latency, yellow bars denote mean total (end-to-end) latency, and black lines indicate dispersion (±one standard deviation). The widening yellow–pink gap shows processing/display becoming the dominant contributor as consumers scale.
Figure 11 decomposes latency by component: pink bars denote mean transmission latency, yellow bars denote mean total latency, and black lines indicate dispersion (±one standard deviation). The widening gap between yellow and pink as consumers increase shows processing/display becoming the dominant contributor.
A Kruskal–Wallis test confirms that these differences across consumer counts are statistically significant (, ), and a strong positive correlation exists between consumer count and latency (Spearman’s ). While Kafka’s consumption latency remains low and stable, the display processing time grows substantially with load, indicating that consumer-side resource contention is the primary limiting factor for scalability.
Our PSO-based optimization framework is designed to intelligently manage these performance trade-offs. Figure 12 compares optimized (yellow) versus non-optimized (pink) modes: bars represent mean end-to-end latency, with black lines as dispersion (±one standard deviation). Optimization lowers both the mean and variability as consumers scale and mitigates frame-rate collapse by shrinking payloads (higher compression) and adjusting chunk counts.
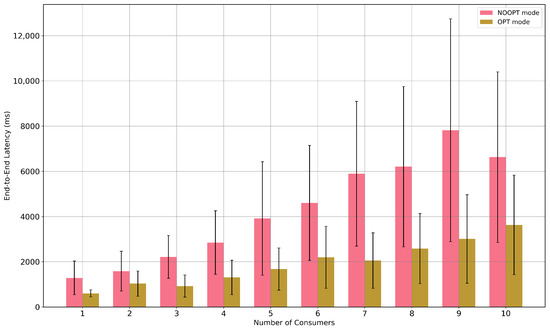
Figure 12.
Optimized (yellow) vs non-optimized (pink) end-to-end latency across consumer counts; bars are means and black lines are dispersion (±one standard deviation). Optimization reduces both mean latency and variability as consumers scale.
The impact of this optimization is statistically significant () across all consumer loads, as detailed in Figure 12. The benefit is most profound for 2–4 consumers, with latency reductions of 56–68%. While the relative improvement diminishes for 6–8 consumers, the effect remains significant. This demonstrates that our optimization framework substantially extends the operational limits of FrameMQ, thereby mitigating consumer-side bottlenecks and enabling lower latencies even with a higher number of concurrent users. Thus, we conclude that FrameMQ is currently best suited for 1 to 5 concurrent consumers, pending further optimization in design.
It is important to note that the scalability concerns observed above are most relevant to broadcast-like scenarios where many consumers subscribe to the same topic. In typical IoT deployments, however, producers (devices) often publish to unique topics, and a centralized admin server functions as the sole consumer. This architectural pattern avoids consumer-side contention altogether, as each producer–consumer stream remains isolated. Therefore, the latency degradation observed in multi-consumer experiments is not representative of the most common IoT use cases, and FrameMQ remains highly scalable in such settings since, in our case, each producer has its own topic, hence its own stream.
6.4. Real-Time Video Streaming Validation
6.4.1. Base Performance
To assess real-time video streaming, we compare FrameMQ’s performance against baseline Kafka streaming without the architecture, focusing on latency under stable conditions. Latency is prioritized because it directly determines end-to-end responsiveness in real-time settings. Figure 13 below depicts this performance.
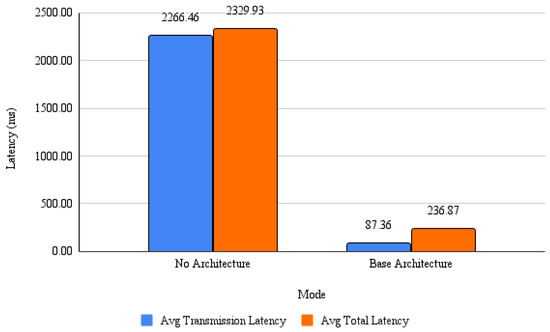
Figure 13.
Latency comparison using the same camera across three modes: no architecture, FrameMQ architecture, and FrameMQ with PSO. Lower bars indicate improved responsiveness.
FrameMQ reduces transmission latency from 2300 ms to below 400 ms, over an 80% improvement, demonstrating its robustness in optimizing data flow and enhancing the video streaming.
6.4.2. Video Quality
Video quality was assessed using subjective evaluations and objective metrics (PSNR, MS-SSIM, and 3SSIM) for Kafka with FrameMQ (no optimization) and FrameMQ with PSO. Table 4 summarizes the results for Camera 2 (60 FPS).
Table 4.
Video quality metrics for Camera 2 (60 FPS) under stable and normal conditions.
To assess the perceptual video quality of the streaming pipeline, we employed the MSU Video Quality Measurement Tool (VQMT), an open-source utility capable of computing human-vision-aligned metrics. Table 4 presents results from Camera 2 (60 FPS) under stable conditions, comparing the FrameMQ architecture with and without Particle Swarm Optimization (PSO). The metrics include MS-SSIM, which captures structural similarity across multiple scales, 3SSIM, which reflects chroma fidelity, and PSNR (U) for baseline color-channel quality.
The configuration without PSO achieved an MS-SSIM of , indicating excellent structural preservation, while the PSO-enhanced version showed a slightly lower value of , still within the good to excellent range. Meanwhile, 3SSIM scores remained consistently high across both setups (≥0.972), reflecting excellent color retention in the chroma (U) channel. PSNR (U) values of 41.20 dB and 39.21 dB further confirm that both outputs preserved color data well above acceptable quality thresholds (typically ≥ 35 dB).
Overall, the results confirm that both configurations deliver visually acceptable and watchable output, with the non-PSO variant slightly outperforming in structural detail while the PSO variant maintains comparable visual quality with potentially improved system-level performance.
We report jitter explicitly in Figure 14 to complement latency. In our setting, PSO can increase short-term jitter due to frequent parameter updates (e.g., compression quality or chunk count) as it adapts to network variation; this is a conscious trade-off because maintaining low median/mean latency preserves interactivity while jitter remains within tolerable bounds for smooth playback.
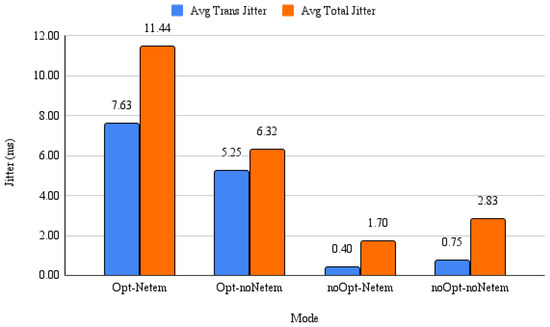
Figure 14.
Jitter comparison across modes. Blue bars show average transmission jitter; orange bars show average total jitter. PSO increases short-term jitter due to iterative updates, but values remain within acceptable ranges for stable video while substantially lowering latency.
6.4.3. Comparison with Other Video Streaming Platforms
Table 5 below shows a brief comparison of FrameMQ to other video streaming platforms, outlining the key differences in different features like latency and QOS support.
Table 5.
Comparison of FrameMQ with WebRTC and RTMP.
FrameMQ achieves 200–500 ms latency with PSO-driven tuning, outperforming RTMP’s 2–5 s delays [33] but trailing WebRTC’s 50–200 ms peer-to-peer performance [34]. FrameMQ’s runtime parameter tuning (e.g., compression, chunking) via external optimizers offers superior network adaptivity compared to WebRTC’s moderate traversal methods and RTMP’s static approach [35], with the latter constrained by fixed encoding settings without real-time feedback. Operating over pub/sub platforms such as Kafka and MQTT, FrameMQ ensures scalability, in contrast to WebRTC’s UDP/SRTP peer flows or RTMP’s TCP-based deliver [35].
FrameMQ’s abstraction layer enables seamless backend migration, surpassing WebRTC’s browser focus and RTMP’s legacy Flash reliance [33]. Extensibility is FrameMQ’s strength, supporting codecs and optimizers, while WebRTC and RTMP are less flexible. For QoS, FrameMQ’s dynamic tuning excels over WebRTC’s limited bitrate adaptation and RTMP’s static behavior [35]. FrameMQ thus suits configurable, scalable streaming in IoT, edge computing, and surveillance.
This comparison highlights FrameMQ’s unique position. It is not designed to replace highly specialized, low-latency protocols like WebRTC in their native peer-to-peer environments. Instead, FrameMQ is an enabling framework that extends general-purpose, scalable pub/sub platforms like Kafka and MQTT with the dynamic adaptivity required for real-time media streaming. It bridges the gap for use cases like large-scale IoT and surveillance, where the scalability of pub/sub is essential, but native support for dynamic media handling is lacking.
6.5. IoT Deployment and Resource Plausibility
To assess FrameMQ’s viability for IoT applications, we evaluated its performance under simulated resource constraints designed to mimic Raspberry Pi 4 devices. Using a monitoring framework, we limited the application’s CPU affinity and process priority to emulate a resource-constrained hardware environment. Our test simulated a common edge topology: one process acting as a video producer (camera) and another as a consumer (display). This setup assumes the broker is being run on a dedicated VM or server elsewhere. We then monitored CPU and memory usage against predefined constraints to determine deployment feasibility.
The producer role, capturing and streaming video, proved highly efficient, operating well within its simulated CPU ( avg) and memory (92.2 MB avg) limits. This suggests it is feasible for deployment on standard Pi hardware without modification (Figure 15).
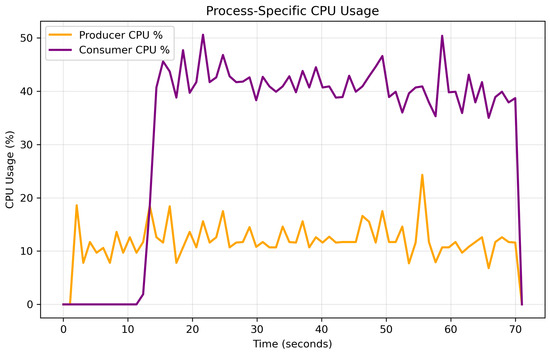
Figure 15.
The producer (camera) device resource usage is low and stable under simulated IoT constraints, while the consumer (display) device CPU usage frequently exceeds its limit () under simulation, highlighting a performance bottleneck.
In contrast, the consumer role, which handles video decoding and rendering, was CPU-intensive. It frequently violated its CPU limit, with usage averaging and peaking at (Figure 15). This identifies the consumer as the primary performance bottleneck and a key target for optimization.
Our deployment recommendations based on this simulation are:
- Producer (Camera): Feasible on a 4 GB Raspberry Pi 4.
- Consumer (Display): Requires optimization on a 4 GB Raspberry Pi 4. The high CPU load makes it a prime use case for our PSO framework.
7. Real-World Applicability
7.1. Suitable Applications
- Remote Telemedicine: Ideal for medical monitoring and teleconsultations in areas with constrained bandwidth, requiring low latency rather than HD quality.
- Surveillance and Security: Effective for remote security monitoring where timely alerts are prioritized over video quality, particularly in mobile or IoT setups.
- Disaster Response Systems: Useful when network conditions rapidly fluctuate, maintaining reliable streaming through adaptive parameter tuning.
- Drone-based Monitoring: Suitable for drones streaming video under bandwidth-limited conditions, balancing image quality and real-time responsiveness.
- Edge Computing Applications: Well-suited for environments where processing and transmission need optimization due to limited computational or network resources.
7.2. Limitations and Future Research
- Dynamic Coefficients: PSO weights in this study were static, prioritizing latency. Future work should explore real-time adjustments, possibly via machine learning, to adapt weights such as increasing under stable networks and during congestion.
- Jitter Reduction: PSO’s iterative tuning reduced latency but increased jitter (e.g., 14.79 ms in Opt-Netem). Future strategies could include longer update intervals or threshold-based changes (e.g., only if deviation ≥ 40%) to limit excessive adjustments.
- Quantifying Abstraction Overhead: We did not isolate the resource cost of FrameMQ’s abstraction. Future work should profile the CPU and memory usage of encoding, decoding, and transmission to better understand the feasibility of deployment.
- IoT Deployment: Testing FrameMQ on low-power devices (e.g., Raspberry Pi) will help evaluate power usage and scalability under real-world IoT conditions.
8. Conclusions
This paper introduced FrameMQ, a layered, platform-agnostic architecture designed to enable real-time video streaming over publish–subscribe (pub/sub) infrastructures. FrameMQ addresses the critical challenge of integrating media transport within scalable, event-driven systems, a common requirement in modern IoT and surveillance applications. Its core design principles eliminate platform lock-in, improve portability across different pub/sub backends, and facilitate dynamic performance optimization. Through extensive evaluation, FrameMQ demonstrated consistent adaptability, validating its effectiveness for delivering reliable, low-latency video streams in demanding environments.
FrameMQ reduced transmission latency from 2300 ms to under 400 ms (over an improvement) compared to baseline Kafka streaming, and achieved up to latency reduction under adverse conditions using Particle Swarm Optimization (PSO). Compared to platform-agnostic efforts like SINETStream’s unified API [5], serverless pub/sub abstractions [15], or Wasm-based portability layers [4], FrameMQ adds runtime, middleware-level optimization for media workloads without vendor lock-in. Whereas those approaches emphasize API unification or deployment portability, our results show sub-second, real-time performance with online tuning of compression and segmentation across brokers. The architecture preserves scalability via pub/sub compatibility and supports extensibility by allowing easy integration of codecs and optimization strategies. PSO further enhances adaptability by dynamically tuning parameters such as compression and chunk count.
Future work will explore machine learning for dynamic coefficient adjustment, jitter minimization strategies, and deployment on resource-constrained Internet of Things (IoT) platforms. Overall, FrameMQ advances platform-agnostic pub/sub by combining layered decoupling with real-time, externalized optimization—delivering sub-second media streaming while retaining portability—making it a practical foundation for IoT, surveillance, and edge streaming at scale.
Author Contributions
Conceptualization, A.T. and T.K.; methodology, A.T.; software, A.T.; validation, A.T., Y.D. and T.K.; formal analysis, A.T. and Y.D.; investigation, A.T.; resources, T.K.; data curation, A.T.; writing—original draft preparation, A.T.; writing—review and editing, A.T., Y.D. and T.K.; visualization, A.T.; supervision, T.K.; project administration, A.T. and T.K.; funding acquisition, T.K. All authors have read and agreed to the published version of the manuscript.
Funding
This research was funded by the Japan Society for the Promotion of Science (JSPS) KAKENHI, Grant Numbers 25K21201, 25K15098, and 21K11846, and by ROIS NII Open Collaborative Research 2024 (24S0206). The APC was funded by Hiroshima University.
Data Availability Statement
The original contributions presented in this study are included in the article. Further inquiries can be directed to the corresponding author.
Acknowledgments
The authors thank colleagues in the Informatics & Data Science community at Hiroshima University for helpful discussions and feedback that improved this manuscript.
Conflicts of Interest
The authors declare no conflicts of interest. The funders had no role in the design of the study; in the collection, analyses, or interpretation of data; in the writing of the manuscript; or in the decision to publish the results.
Correction Statement
This article has been republished with a minor change. The change does not affect the scientific content of the article and further details are available within the backmatter of the website version of this article.
References
- Khaled, A.E.; Helal, S. Interoperable communication framework for bridging RESTful and topic-based communication in IoT. Future Gener. Comput. Syst. 2019, 92, 628–643. [Google Scholar] [CrossRef]
- Kim, G.; Kang, S.; Park, J.; Chung, K. An MQTT-Based Context-Aware Autonomous System in oneM2M Architecture. IEEE Internet Things J. 2019, 6, 8519–8528. [Google Scholar] [CrossRef]
- Pinterest Engineering. MemQ: An Efficient, Scalable Cloud Native PubSub System. Pinterest Engineering Blog. 2023. Available online: https://medium.com/pinterest-engineering/memq-an-efficient-scalable-cloud-native-pubsub-system-4402695dd4e7 (accessed on 20 February 2025).
- Stolz, L.; Luthra, M.; Weisenburger, P.; Salvaneschi, M.; Koldehofe, B. GALOIS: A hybrid and platform-agnostic stream processing architecture. arXiv 2023, arXiv:2305.02063. [Google Scholar] [CrossRef]
- Takefusa, A.; Nakada, H.; Kudoh, T.; Tanaka, Y. SINETStream: Enabling research IoT applications with sensor data collection from distributed resources. In Proceedings of the IEEE International Conference on Cloud Computing Technology and Science (CloudCom), Bangkok, Thailand, 14–17 December 2020; pp. 1–8. [Google Scholar]
- Lee, S.J. Challenges of Real-time Processing with Embedded Vision for IoT Applications. In Proceedings of the 2022 International Conference on Electrical, Computer, Communications and Mechatronics Engineering (ICECCME), Male, Maldives, 16–18 November 2022; pp. 1–6. [Google Scholar] [CrossRef]
- Twabi, A.; Machizawa, M.G.; Haruhana, K.; Kondo, T. Real-Time Video Streaming on the Pub/Sub Architecture: Case of Apache Kafka. In Proceedings of the 2024 IEEE 6th Symposium on Computers & Informatics (ISCI), Kuala Lumpur, Malaysia, 10 August 2024; pp. 164–169. [Google Scholar]
- Junior, N.F.; Silva, A.A.A.; Guelfi, A.E.; Kofuji, S.T. Performance evaluation of publish-subscribe systems in IoT using energy-efficient and context-aware secure messages. J. Cloud Comput. 2022, 11, 6. [Google Scholar] [CrossRef] [PubMed]
- Dobbelaere, P.; Esmaili, K.S. Kafka versus RabbitMQ: A comparative study of two industry reference publish/subscribe implementations. In Proceedings of the 11th ACM International Conference on Distributed and Event-Based Systems (DEBS’17), Barcelona, Spain, 19–23 June 2017; pp. 227–238. [Google Scholar]
- Redondi, A.E.C.; Arcia-Moret, A.; Manzoni, P. Towards a scaled IoT pub/sub architecture for 5G networks: The case of multiaccess edge computing. In Proceedings of the 2019 IEEE 5th World Forum on Internet of Things (WF-IoT), New Orleans, LA, USA, 15–18 April 2019; pp. 436–441. [Google Scholar]
- Hoffert, J.; Schmidt, D.C.; Gokhale, A. Adapting and evaluating distributed real-time and embedded systems in dynamic environments. In Proceedings of the 1st International Workshop on Data Dissemination for Large Scale Complex Critical Infrastructures, Valencia, Spain, 27 April 2010; pp. 1–6. [Google Scholar]
- Yin, S.; Liu, L.; Ma, Y.; Zhang, Y. Reinforcement-learning-based parameter adaptation method for particle swarm optimization. Complex Intell. Syst. 2023, 9, 5585–5609. [Google Scholar] [CrossRef]
- Miller, K.; Al-Tamimi, A.-K.; Wolisz, A. QoE-based low-delay live streaming using throughput predictions. ACM Trans. Multimed. Comput. Commun. Appl. 2016, 13, 1–24. [Google Scholar] [CrossRef]
- Eugster, P.T.; Felber, P.A.; Guerraoui, R.; Kermarrec, A.-M. The many faces of publish/subscribe. ACM Comput. Surv. 2003, 35, 114–131. [Google Scholar] [CrossRef]
- Nasirifard, P.; Jacobsen, H.-A. A serverless publish/subscribe system. In Proceedings of the 16th ACM International Conference on Distributed and Event-based Systems (DEBS’ 22), New York, NY, USA, 27–30 June 2022; pp. 227–230. [Google Scholar]
- OASIS. MQTT, Version 3.1.1 Plus Errata 01; OASIS Standard: Boston, MA, USA, 2015. Available online: http://docs.oasis-open.org/mqtt/mqtt/v3.1.1/os/mqtt-v3.1.1-os.html (accessed on 10 February 2025).
- Apache Software Foundation. Apache Kafka Documentation. Available online: https://kafka.apache.org/documentation/ (accessed on 10 February 2025).
- Ichinose, A.; Takefusa, A.; Nakada, H.; Oguchi, M. A study of a video analysis framework using Kafka and spark streaming. In Proceedings of the 2017 IEEE International Conference on Big Data (Big Data), Boston, MA, USA, 11–14 December 2017; pp. 2396–2401. [Google Scholar]
- Pivotal Software. RabbitMQ Documentation. Available online: https://www.rabbitmq.com/documentation.html (accessed on 10 February 2025).
- Object Management Group (OMG). Data Distribution Service (DDS) Specification, Version 1.4. 2015. Available online: https://www.omg.org/spec/DDS/1.4/PDF (accessed on 7 June 2025).
- Toshniwal, A.; Taneja, S.; Shukla, A.; Ramasamy, K.; Patel, J.M.; Kulkarni, S.; Jackson, J.; Gade, K.; Fu, M.; Donham, J.; et al. Storm@twitter. In Proceedings of the 2014 ACM SIGMOD International Conference on Management of Data, New York, NY, USA, 22–27 June 2014; pp. 147–156. [Google Scholar] [CrossRef]
- Thangavel, D.; Ma, X.; Valera, A.; Tan, H.; Tan, C.K.Y. Performance evaluation of MQTT and CoAP via a common middleware. In Proceedings of the 2014 IEEE Ninth International Conference on Intelligent Sensors, Sensor Networks and Information Processing (ISSNIP), Singapore, 21–24 April 2014; pp. 1–6. [Google Scholar] [CrossRef]
- Takefusa, A.; Sun, J.; Fujiwara, I.; Nagaku, M.; Yoshida, H.; Masatani, Y.; Aida, K. Demonstration of an Online Video Processing Framework using the SINET Wide-area Data Collection Infrastructure. IPSJ Trans. Digit. Pract. 2020, 1, 45–57. (In Japanese) [Google Scholar]
- Zou, Y.; Cao, J.; Wu, H. TraffiCast: Real-time Pub/Sub based video surveillance system over interconnected WMNs and WSNs. In Proceedings of the 2010 6th IEEE International Conference on Distributed Computing in Sensor Systems Workshops (DCOSSW), Santa Barbara, CA, USA, 21–23 June 2010; pp. 1–6. [Google Scholar] [CrossRef]
- Sureshkumar, H.; Gharat, S.; Ambre, D.; Shetty, L.; Kadam, A.; Ansari, D.; Birajdar, G. Optimizing Computational Load and Energy Efficiency in UAV-Based Port Surveillance System. In Proceedings of the 2024 IEEE International Conference on Signal Processing, Communications and Computing (ICSPCC), Bali, Indonesia, 19–24 August 2024; pp. 1–6. [Google Scholar] [CrossRef]
- Spiteri, K.; Urgaonkar, R.; Sitaraman, R.K. BOLA: Near-optimal bitrate adaptation for online videos. In Proceedings of the ACM MMSys, Klagenfurt, Austria, 10–13 May 2016; pp. 1–14. [Google Scholar]
- Mao, H.; Netravali, R.; Alizadeh, M. Neural adaptive video streaming with Pensieve. In Proceedings of the ACM SIGCOMM, New York, NY, USA, 21–25 August 2017; pp. 197–210. [Google Scholar]
- İnce, S.; Baiat, Z.E.; Baydere, Ş. Real-time Video Data Traffic Management for Publish-Subscribe based Messaging System. In Proceedings of the 2022 International Conference on Smart Applications, Communications and Networking (SmartNets), Palapye, Botswana, 29 November–1 December 2022; pp. 1–6. [Google Scholar] [CrossRef]
- Zhang, F.; Yang, Y.; Yang, Y.; Jin, B. Optimizing the Quality of Service for a Publish/Subscribe System. In Proceedings of the 2015 IEEE 12th International Conference on Ubiquitous Intelligence and Computing and 2015 IEEE 12th International Conference on Autonomic and Trusted Computing and 2015 IEEE 15th International Conference on Scalable Computing and Communications and Its Associated Workshops (UIC-ATC-ScalCom), Beijing, China, 10–14 August 2015; pp. 424–431. [Google Scholar] [CrossRef]
- Zuyuan, H.; Guohong, Y.; Bangbang, L. Improving Particle Swarm Optimization of Its Convergence. In Proceedings of the 2020 5th International Conference on Control, Robotics and Cybernetics (CRC), Wuhan, China, 16–18 October 2020; pp. 45–50. [Google Scholar] [CrossRef]
- Zhang, Y.; Yang, R. Cloud computing task scheduling based on improved particle swarm optimization algorithm. In Proceedings of the IECON 2017—43rd Annual Conference of the IEEE Industrial Electronics Society, Beijing, China, 29 October 29–1 November 2017; pp. 8768–8772. [Google Scholar] [CrossRef]
- Thevenot, A. Particle Swarm Optimization Visually Explained. Medium. 14 April 2021. Available online: https://towardsdatascience.com/particle-swarm-optimization-visually-explained-46289eeb2e14 (accessed on 20 February 2025).
- Bentaleb, A.; Lim, M.; Akcay, M.N.; Begen, A.C.; Hammoudi, S.; Zimmermann, R. Toward one-second latency: Evolution of live media streaming. ACM Comput. Surv. 2023, 56, 1–33. [Google Scholar] [CrossRef]
- Nakagawa, K.; Tsukada, M.; Shima, K.; Esaki, H. WebRTC-based measurement tool for peer-to-peer applications and preliminary findings with real users. In Proceedings of the Asian Internet Engineering Conference (AINTEC), Virtual, 14–17 December 2021; pp. 1–8. [Google Scholar]
- Yamada, T. Low latency live streaming system with congestion control. J. Adv. Comput. Netw. 2021, 9, 1–11. [Google Scholar]
Disclaimer/Publisher’s Note: The statements, opinions and data contained in all publications are solely those of the individual author(s) and contributor(s) and not of MDPI and/or the editor(s). MDPI and/or the editor(s) disclaim responsibility for any injury to people or property resulting from any ideas, methods, instructions or products referred to in the content. |
© 2025 by the authors. Licensee MDPI, Basel, Switzerland. This article is an open access article distributed under the terms and conditions of the Creative Commons Attribution (CC BY) license (https://creativecommons.org/licenses/by/4.0/).