1. Introduction
In today’s interconnected world, IoT devices have become integral to daily life, enhancing convenience, efficiency, and automation. From smart controllers and meters to wearables and connected homes, they transform industries and drive smart city development. IoT platforms aggregate sensor data, analyze patterns, and support decision-making with AI advancements further evolving these devices into intelligent systems [
1,
2]. As IoT adoption grows, so does its impact on urban planning, healthcare, and energy management [
3,
4]. As IoT devices generate vast amounts of data at high frequencies to support control processes, data analysis becomes essential for proactive interventions and enhanced reliability in various applications across different domains [
2,
5,
6].
In this context, understanding data distributions is crucial for detecting anomalies, optimizing data compression, and improving machine learning accuracy. Histograms are valuable tools in this regard, as they provide summaries of large datasets as well as approximations of data distributions, making it easier and faster to analyze the underlying patterns and compute aggregate statistics [
7,
8,
9,
10]. At the same time, the large-scale integration of IoT data from heterogenous devices may increase the vulnerability to cyberattacks and device malfunctions. Integrating heterogeneous IoT data increases cybersecurity risks, making privacy protection essential to prevent infrastructure breaches and data leaks [
11]. However, traditional histogram-based methods often rely on raw data analysis, posing privacy concerns, especially for sensitive information [
8,
9].
Differential privacy (DP) is one of the leading methods for privately sharing histograms with untrusted parties in the state of the art. It is used on a wide variety of IoT data, ranging from smart homes to industrial sensors, particularly in tasks related to anomaly detection [
12,
13]. DP histograms can be constructed by adding noise to histograms created using various methods [
14,
15]. To deal with trade-offs between accuracy and privacy, some approaches focus on building DP sketches to generate approximate private histograms [
16,
17]. The authors build new differentially private constructs, such as Misra–Gries sketches or the Approximate-Estimate sketches in a streaming setting, introducing less noise than similar solutions. However, despite its advantages, differential privacy-based techniques add noise to histogram bins, which can reduce accuracy, and defining the right privacy budget is a non-trivial task requiring extensive fine-tuning. Multi-party computation (MPC) can be used to compute histograms collaboratively across multiple parties without revealing individual data and adding noise to the data or the result. In such approaches, differential privacy is applied to the final output for additional protection; however, the tradeoff lies in the communication overhead, as parties must exchange many messages during computation [
18,
19,
20]. The construction of histograms using lightweight masked encryption is explored in [
21]. The authors introduce a scheme for secure frequency histogram estimation, allowing a central server to utilize histograms without identifying which values originated from specific users. While such solutions can be computationally efficient, they require at least partial decryption or assume plaintext access before analysis.
In this context, homomorphic encryption (HE) schemes are promising solutions for building privacy-preserving histograms. They enable the processing and execution of operations directly on encrypted IoT data ensuring that the IoT data remains encrypted throughout the entire process [
22]. However, homomorphic encryption schemes have limitations which make them difficult to use in the context of histogram building processes. The supported operations are primarily restricted to addition and multiplication and pose constraints on the range and type of operands, which are typically limited to integer values [
23,
24,
25,
26,
27]. Additional challenges related to secure computations such as comparisons, divisions or exponentiation over the encrypted domain still need to be addressed [
28,
29]. Overall, encryption/decryption mechanisms and HE data processing generate very large computational overheads that may negatively influence the system’s responsiveness, making it difficult to address the trade-off between privacy and system operation [
30]. Finally, noise induced by the encryption scheme can affect the data analysis accuracy, especially when dealing with small deviations from the IoT device’s normal raw data values [
31,
32].
Therefore, in this paper we propose a solution for building histograms on homomorphic encrypted data generated by IoT devices without relying on partial or total decryption. To leverage the flexibility of the Fast Fully Homomorphic Encryption over the Torus (TFHE) scheme implemented in Concrete [
33,
34], we redesign the traditional histogram construction algorithm and address its limitations in handling nested loops and conditional statements. To assess the effectiveness of the private histogram, we implement an outlier detection use case, where outliers are identified using a thresholding rule applied to histogram counts, with all computations performed on encrypted data. The proposed privacy-preserving outlier detection mechanism has consistent results with the corresponding mechanism that operates on plain data, without needing to decrypt the results for decision-making. Moreover, the computational overheads are kept within reasonable limits.
The key contributions of this paper are as follows:
A privacy-preserving method for constructing histograms on homomorphically encrypted data, enabling outlier detection without requiring decryption.
Adaptation of traditional histogram construction and histogram-based outlier detection techniques for the Fast Fully Homomorphic Encryption over the Torus (TFHE) scheme in Concrete. We address challenges related to input size constraints and computational depth by vectorizing key operations, including addition, value placement in buckets, labeling abnormal buckets based on threshold frequency, and identifying outliers by their range and assigned bucket labels.
Performance evaluation and analysis of computational overhead trade-offs across different configuration setups, assessing their impact on the effectiveness of privacy-preserving histograms in IoT environments.
2. Equi-Width Histograms on Homomorphically Encrypted Data
Different types of histograms, such as equi-depth, equi-width, and dynamic-width, offer varying levels of effectiveness depending on the characteristics of the underlying data distribution [
35]. Equi-depth histograms are more effective for skewed data, whereas equi-width histograms perform better on uniformly distributed data. However, the adaptability of equi-depth histograms comes with increased complexity in both construction and maintenance. In this work, we chose to implement equi-width histograms because of their lower computational cost.
Equi-width histograms capture the overall data distribution by grouping data points into fixed-width buckets. In such histograms, buckets have the same size (range), but the number of values that fit in each of them is variable. Each bucket can be represented as a tuple:
where
and
give the range of values which fit in the bucket and count is the number of data points within the
range.
Next, we present the implementation of equi-width histogram computation on encrypted data and illustrate its effectiveness in detecting outliers in IoT data. The overview of our approach is depicted in
Figure 1. The proposed framework simulates a real-world setting where outlier detection is performed on encrypted IoT data using prior measurement distribution. To this end, we first preprocess the raw IoT data by scaling and converting it to integer values within the range
, as many homomorphic encryption frameworks do not support floating point operations. Next, we homomorphically encrypt the data and construct an encrypted equi-width histogram, which is then used for outlier detection across three different configuration scenarios described in the evaluation section.
For the implementation, we chose the TFHE scheme in Concrete [
33,
34] due to its superior flexibility in converting various operations into table lookups, outperforming other FHE schemes [
36,
37,
38,
39]. A key advantage is its support for function composition [
40], enabling secure multi-step computations without decryption. Additionally, Concrete allows limited floating point operations [
41], but its Compile tool only supports integer inputs and outputs, as computations rely on table lookups’ mapping integers to integer results.
In Concrete, data is encrypted using Learning With Errors (LWE), which implies a series of constraints not only on the allowed operations and on the way that functions are implemented, but also on the size of the plain values. Moreover, this learning-based approach of translating arithmetic operations into table lookup operations is a probabilistic model which is prone to errors. The main drawback of Concrete is that it may not provide the expected answer in all test cases, but its default failure probability is very low (1 in 100,000).
As a fully homomorphic encryption scheme, TFHE implemented in Concrete overcomes the drawback of the traditional encryption schemes in which the data is temporarily encrypted during transmission between the client and the server. The server decrypts it upon receipt, executes the necessary operations on the plaintext, re-encrypts the result, and returns it to the client. In Concrete, the only private key holder is the client, and the server-side operations are entirely performed on encrypted data, using the public evaluation key, which is mathematically related to the client’s private key.
2.1. Private Histogram Construction
First, we define a function to determine whether a given value falls within a bucket defined by a specific range. While this may seem like a straightforward operation, implementing it directly on homomorphically encrypted data presents significant challenges. Homomorphic encryption imposes strict limits on the number of operations that can be performed on the same ciphertext, and conventional loops using a counter variable are not feasible, especially when the number of iterations is large. This restriction exists because each iteration increases the computational depth on the ciphertext, potentially exceeding the allowed limit. As only foreach loops and vectorial operations are allowed without any restrictions, alternative procedures need to be implemented to ensure compliance with the constraints imposed by the encryption scheme. Therefore, we implement the range-checking procedure in a vectorized manner, allowing us to efficiently determine whether a given data point x falls within a set of buckets, represented as lists of low values, , and of high values, .
Given an input value x and two lists containing, on the same position, the minimum () and, respectively, the maximum () value of each bucket, applying the previously defined procedure in a vectorial approach involves iteratively checking whether x falls within the range defined by the corresponding low and high values. The result of each comparison is appended to a new list , maintaining the same index as the original range lists. Therefore, the vectorized implementation returns a list of the same size as the and lists containing a single value of 1 at the position corresponding to the bucket where x fits, while all the other elements of the result list are equal to 0.
This vectorial approach to determine the bucket in which each value of the input fits can be formally described as a map operation, which takes a data sample and the lists containing the ranges of buckets as inputs and returns another vector as output, where each element of the output vector is the result of applying the
function to the corresponding elements of the input vectors, as follows:
where
x is a scalar and
and
are lists. Algorithm 1 shows the vectorial implementation of the procedure.
| Algorithm 1 Vectorial is in bucket. |
Require: x ▹ New sampled data from IoT devices
Require: low[], high[] ▹ Lists of bucket bounds in histogram
Ensure: r[] ▹ List with 1 at the position of the matching bucket
- 1:
- 2:
for to do - 3:
- 4:
end for - 5:
return
r
|
Using the vectorial approach to determine the bucket in which the given value fits, we can compute the histogram of an input dataset by adding the result vectors for each value in the input set, as shown in Algorithm 2. To achieve this, we use the vectorial addition operation which is defined as the element-wise addition of their corresponding components.
| Algorithm 2 Building equi-width histogram on homomorphically encrypted data. |
Require: x[] ▹ New sampled data stream from IoT devices
Require: low[], high[] ▹ Lists of bucket bounds in histogram
Ensure: h[] ▹Equi-width histogram
- 1:
- 2:
for alldo - 3:
- 4:
end for - 5:
return
h
|
For two given vectors
and
of size
n, the result of the vectorial addition is another vector,
, of the same size, defined as follows:
Generalizing the above relation for the case of m vectors,
,
, each having n components, the result of the vectorial addition is:
The vectorial addition can be performed only on vectors having the same number of components, since the components of the sum are the element-wise sums of the components of all input vectors. Therefore, for a given input list of elements, if we perform an element-wise addition of the results given by the vectorial range check function for each element, we determine the equi-width histogram of the input set, as depicted in
Figure 2.
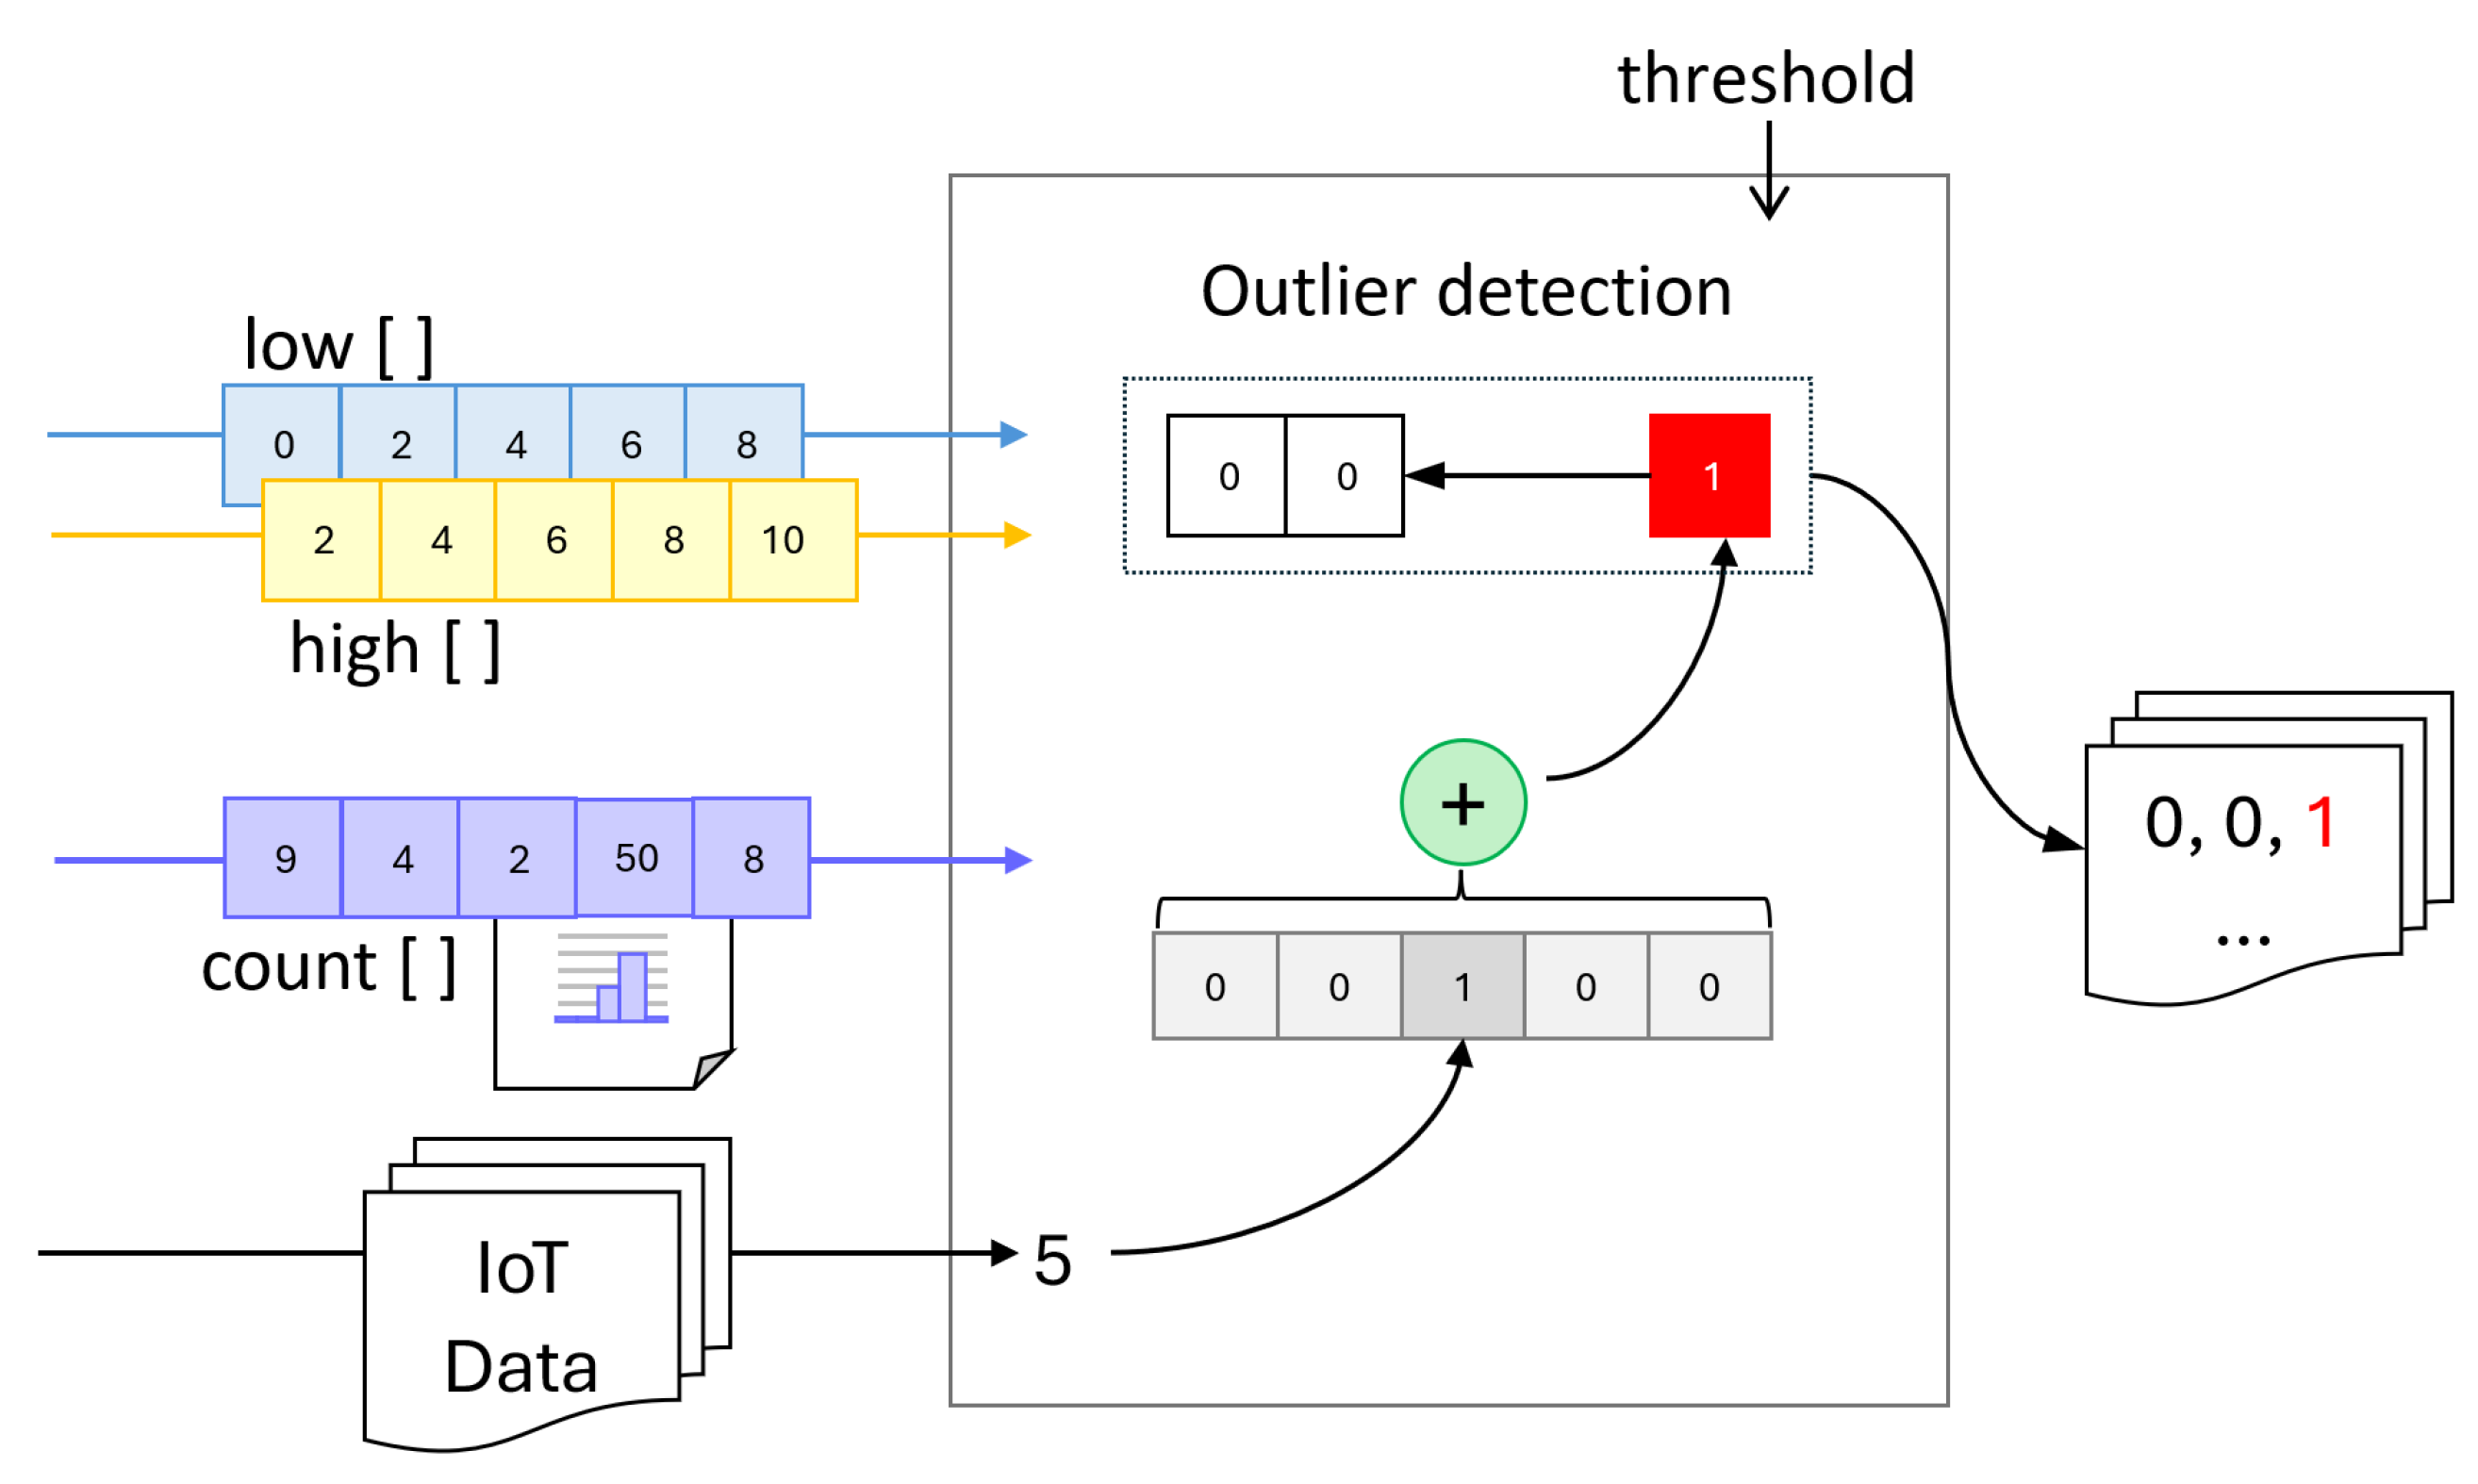
2.2. Detecting Outliers in Encrypted Data Using Private Histograms
As homomorphic encryption schemes impose significant limitations in terms of available operations, performing more complex data analysis on homomorphically encrypted data is a challenging task. In this section, we show how our private equi-width histogram can be utilized for detecting outliers in homomorphically encrypted IoT sensor data streams by analyzing the distribution of data across buckets. Since outliers typically appear less frequently than normal values, data points can be labeled based on the number of elements within the same bucket.
Therefore, to bypass the limitations of existing homomorphic encryption schemes, a mainly additive and comparison-based simple thresholding approach can be applied, where data falling into buckets with low counts is classified as an outlier. Values that belong to low-frequency buckets are identified as outliers, whereas values in high-frequency buckets are considered normal.
As in the case of constructing a private histogram, we adopt a vectorized approach for outlier detection on FHE-encrypted data, leveraging frequency-based labeling. Specifically, we define a procedure that, given an input value and a bucket, determines whether the value falls within the bucket and whether the bucket’s element count is below a predefined threshold (as shown in Algorithm 3). By vectorizing this procedure, we enable repeated application across an entire IoT sensor dataset, while adhering to the constraints of fully homomorphic encryption.
To accomplish this, we define a map operation that processes an IoT data sample alongside lists representing bucket ranges, element counts per bucket, and a predefined threshold. This operation outputs a list in which each element corresponds to the result of applying the
function (defined below) to the respective elements of the input lists. The function determines whether a given data point falls within a bucket and if the bucket’s element count is below the specified threshold, as follows:
where
x and
are scalars and
,
, and
are lists defining the buckets in the histogram. This approach is formally defined in Algorithm 3.
| Algorithm 3 Vectorial is in abnormal bucket. |
Require: x ▹New data sample
Require: low[], high[] ▹ Bucket bounds in histogram
Require: count[] ▹ Element counts per bucket
Require: th ▹ Threshold for outlier detection
Ensure: r[] ▹ Vector with 1 at the index of the abnormal bucket if any
- 1:
- 2:
for to do - 3:
- 4:
end for - 5:
return
r
|
To compute the binary label of a specific value, we perform a reduce operation on the result provided by the
procedure by summing all the elements in the list. Reducing a list by summing is a recursive vectorial operation which is defined as follows:
where
L is the original list,
x is the first element of the list, and
is the rest of the list. This operation generates a single value that is the sum of all the elements of the list, by adding the first element to the sum of the rest of the list, until the list is empty (see Algorithm 4). For an empty list, the reduce-by-summing operation returns 0.
| Algorithm 4 Equi-width histogram-based outlier detection on homomorphically encrypted data. |
Require: x[] ▹New sampled data stream from IoT devices
Require: low[], high[] ▹ Bucket bounds in histogram
Require: count[] ▹ Element counts per bucket
Require: th ▹ Frequency threshold for outlier detection
Ensure: a[] ▹ Vector of outliers detected per sample
- 1:
- 2:
for all
do - 3:
- 4:
- 5:
end for - 6:
return a
|
The vectorial approach of labeling an input value involves iteratively checking if the value is in each of the buckets defined by three lists: one for minimum values, one for maximum values, and one for the current element count in each bucket. When the bucket in which the value must be placed is determined, the number of values that it contains is compared to a given threshold.
The result of the vectorial procedure is a list of the same size as the lists containing the range limits for the buckets. It contains at most one element set to 1, positioned at the index of the bucket where the value fits, but only if the bucket’s element count is below the threshold. If no such bucket meets the condition, all elements in the output list are 0. This mechanism is depicted in
Figure 3.
2.3. Threat Model Definition and Assumptions
Our privacy-preserving histogram construction technique targets edge–cloud deployments in IoT environments, where sensitive data collected from distributed sensors is encrypted using homomorphic encryption and aggregated before being transmitted to the cloud. The data sources (i.e., sensors) are considered to be trusted entities. We assume that sensor data is encrypted at the source immediately upon collection using the private encryption keys managed by a trusted HE controller. Data is then transmitted to more capable but untrusted edge/cloud processors, where the histogram building and outlier detection modules are deployed, as shown in
Figure 4. These edge/cloud processors are not granted access to private encyption/decryption keys, but only to the evaluation public key to perform the histogram construction and anomaly detection. The HE controller is the only trusted entity responsible for distributing keys, validating computation circuits, and enforcing policies. Only a single trusted controller governs each deployment.
In such a deployment, we consider several potential risks, including the execution of tampered circuits by malicious edge nodes, replay attacks aiming to skew the histogram, and statistical inference from aggregate outputs. To mitigate these threats, all data is encrypted at the source using homomorphic encryption, and we assuume that only validated, signed computation circuits approved by the trusted controller are allowed to run. Additionally, we assume the existence of authenticated channels over which the encrypted data is transmitted, and that policy enforcement is centralized under a single trusted HE controller that governs key management and computation integrity. However, this setup introduces a single point of failure, as the HE controller is solely responsible for key management, policy enforcement, and circuit validation.
3. Evaluation Results
We implemented the proposed solution in Python 3.10.6, using the Concrete Homomorphic Encryption library [
40]. The code is available on GitHub (version 2.38.0) [
42]. All experiments were conducted in a laboratory environment and were not deployed in a real-world setting, such as the one described in
Section 2.3. The evaluation was performed on a computer equipped with an Intel(R) Core(TM) i7-10750H CPU @ 2.60 GHz (6 physical cores, 12 logical processors) and 16 GB of RAM. While this setup provides a reasonable baseline for assessing the computational performance of our methods, it does not reflect the constraints typically found on edge devices. Therefore, further optimization and testing would be required for deployment in resource-constrained environments. Nonetheless, the trained circuits generated with Concrete could be deployed on more powerful edge or fog computing nodes.
To evaluate our prototypes, we use the data provided by IoT devices in a city district, specifically an electricity production dataset [
43] containing measurements recorded by smart meters on an hourly basis. Since the values measured by the IoT meters are floating point values between 0 and 9.91 kW and our models can operate only on integer data which has a limited binary representation, we preprocess the electric power data by scaling it to integer values between 0 and 100 to meet the constraints of our prototypes. To achieve this, we normalize the data to ensure it fits into a limited range, multiply the normalized values by 100, and round the result to the nearest integer, as shown in
Figure 1. By applying this normalization-based data preprocessing, we aim at converting the data to small integers while not disturbing the general distribution of the values. As the device measures the produced electric power, the values are higher at midday and lower during the morning and the evening (see reference values in
Figure 5). The distribution of the data is preserved by the data preprocessing flow that we use. This preprocessing strategy also supports generalizability to other types of IoT data, such as temperature, motion, or air quality, since these values can similarly be normalized and scaled to the
range before encryption, allowing our modules to operate on a broad range of sensor inputs.
To simulate a real-world scenario in which the data received from IoT devices is already encrypted, we encrypted benchmark data using homomorphic encryption and then fed it to the outlier detection method in three use cases. However, in practice, the models would be pre-trained on data within the expected range of the IoT devices, without requiring this additional encryption step.
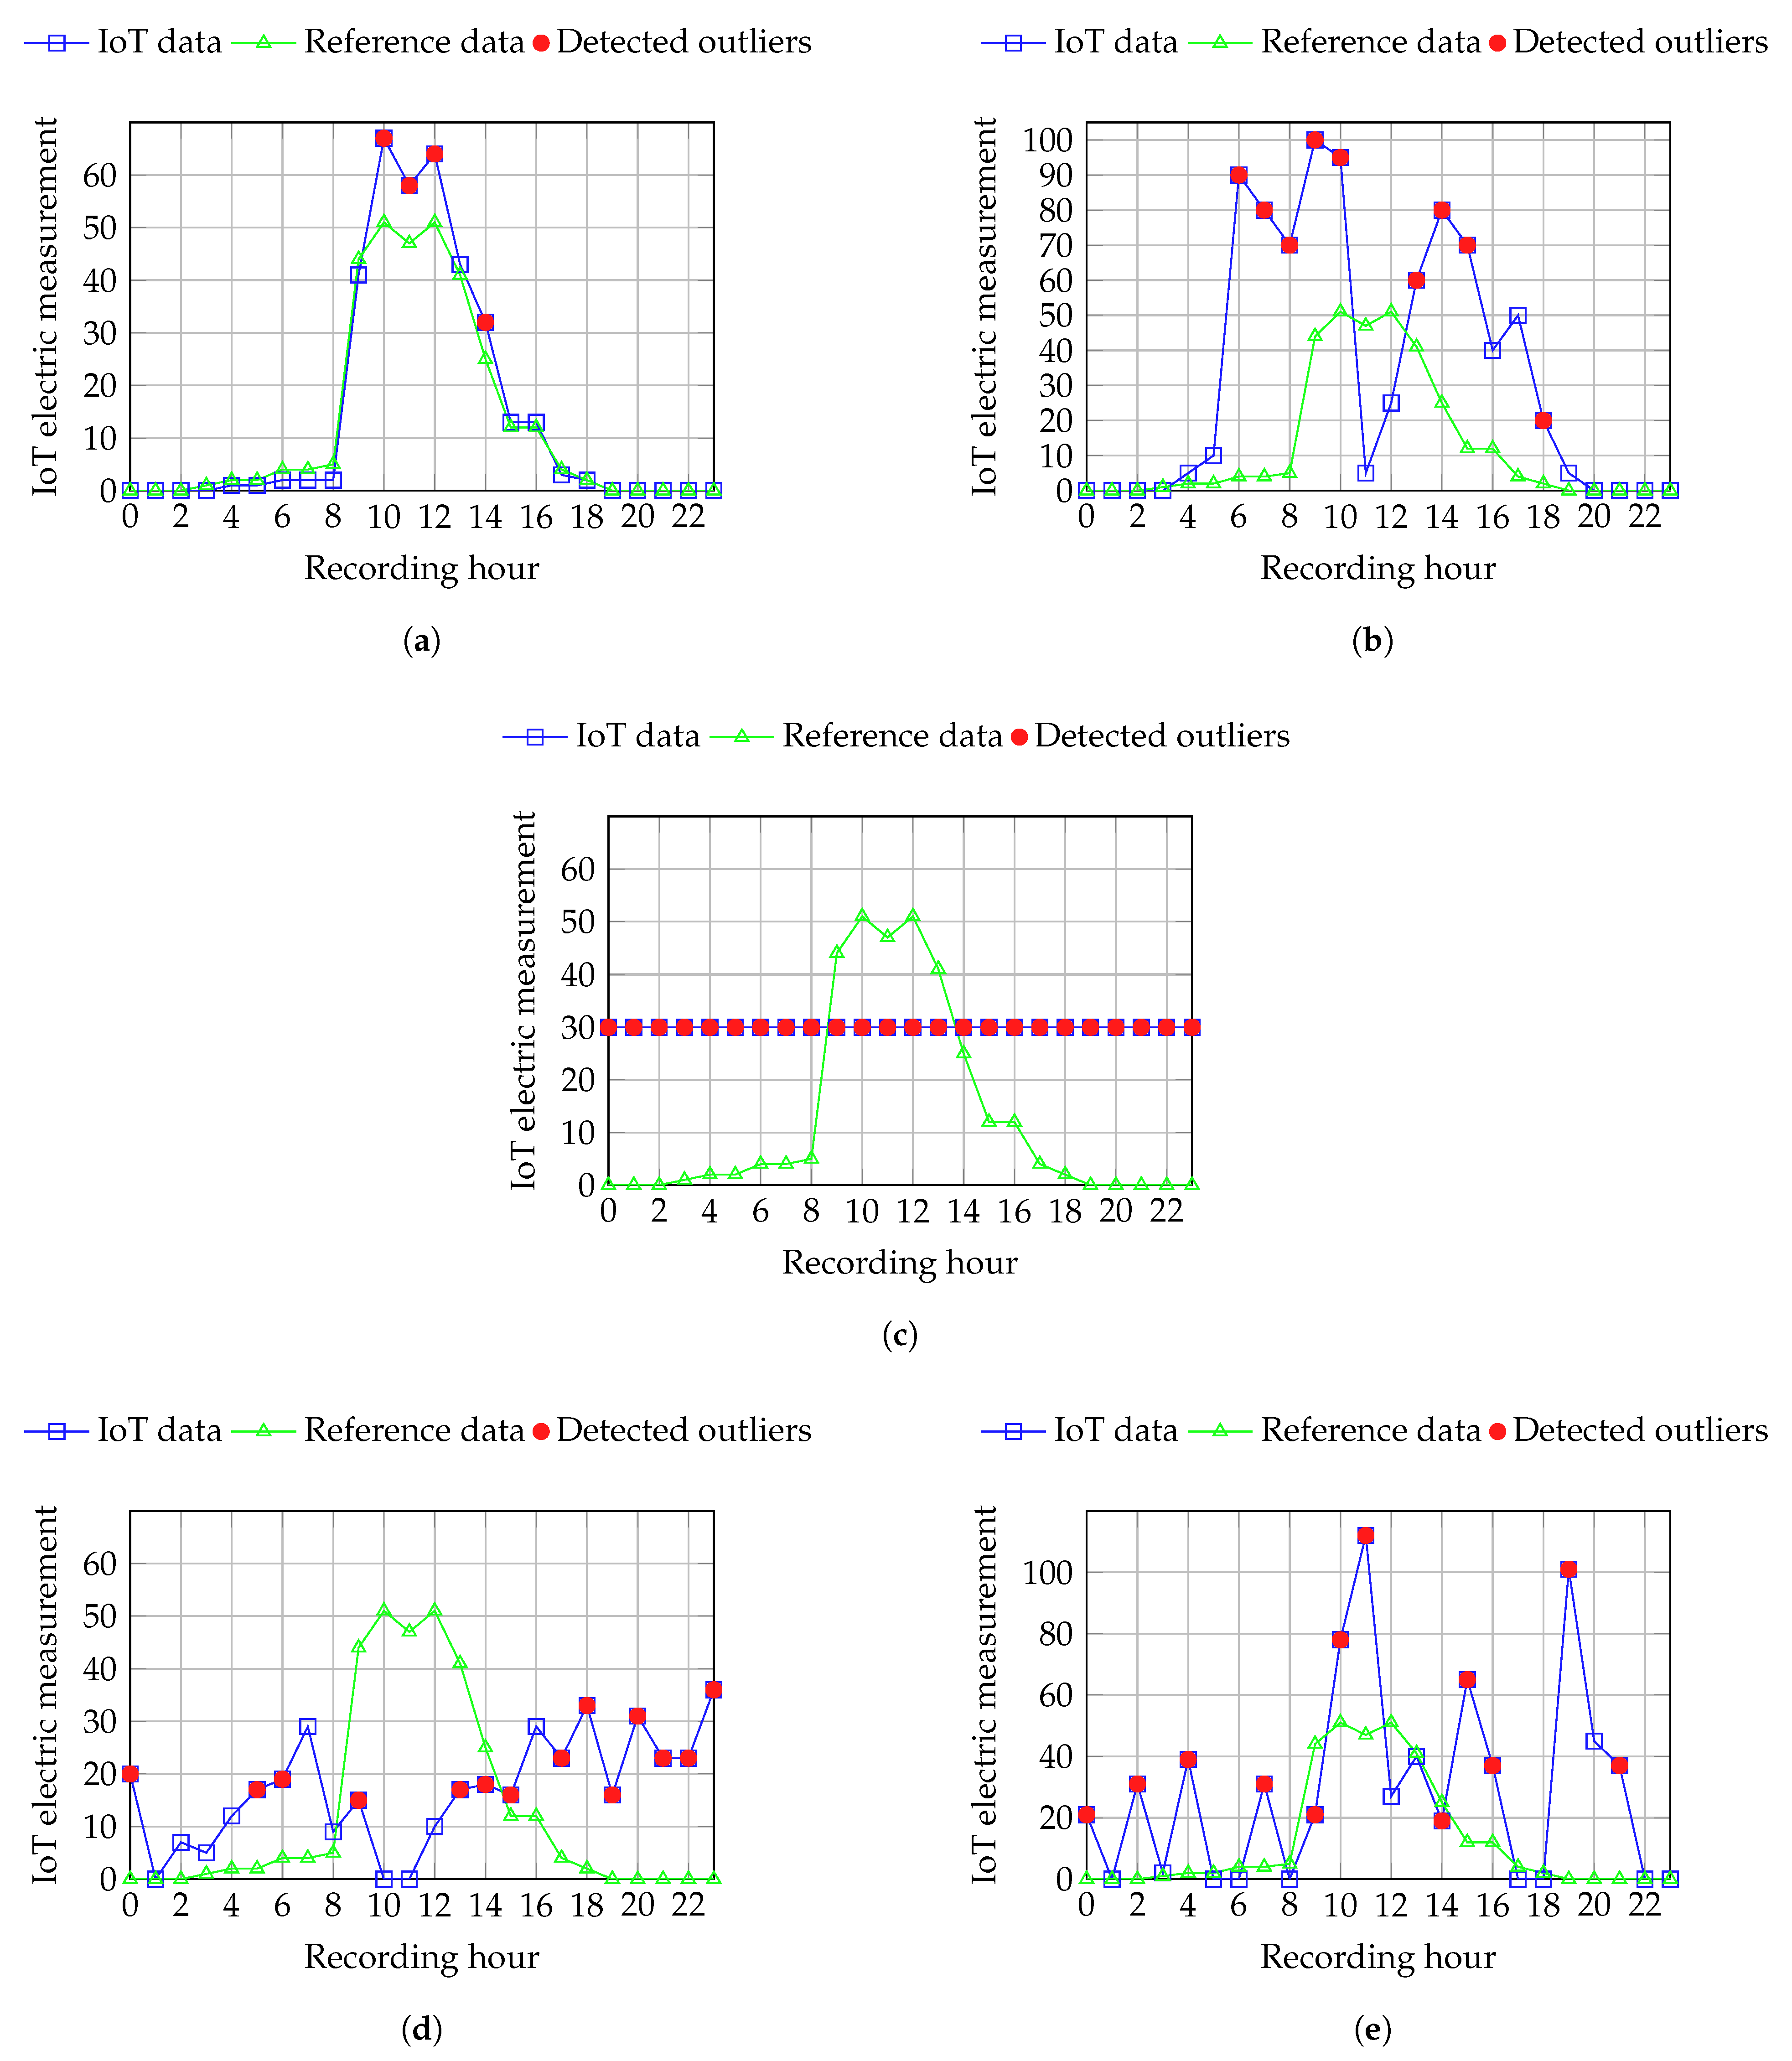
We ran multiple experiments on encrypted data to assess the performance of our outlier detection method on encrypted data under various challenges, including sensor noise, adversarial inputs, communication issues, and device malfunctions—such as sensors persistently reporting constant value regardless of environmental conditions. To this aim, we artificially introduced anomalies in the preprocessed data by adding noise values to simulate various kinds of abnormal situations which can be encountered in an IoT sensor-based system. To ensure that the data used at building the equi-width histogram reflects the expected behavior of the monitored phenomenon, we consider the average of the data recorded by the electric smart meter during five consecutive days as the reference data.
This histogram-based approach of detecting outliers based on a frequency threshold performs best on catching anomalies in data containing significant variations and samples which exceed the range of the reference data. However, the major assumption this technique makes is that outliers have a considerably lower frequency compared to normal data; this method does not catch constant anomalies when the value repeatedly reported by the sensor is present within the reference data used at building the histogram.
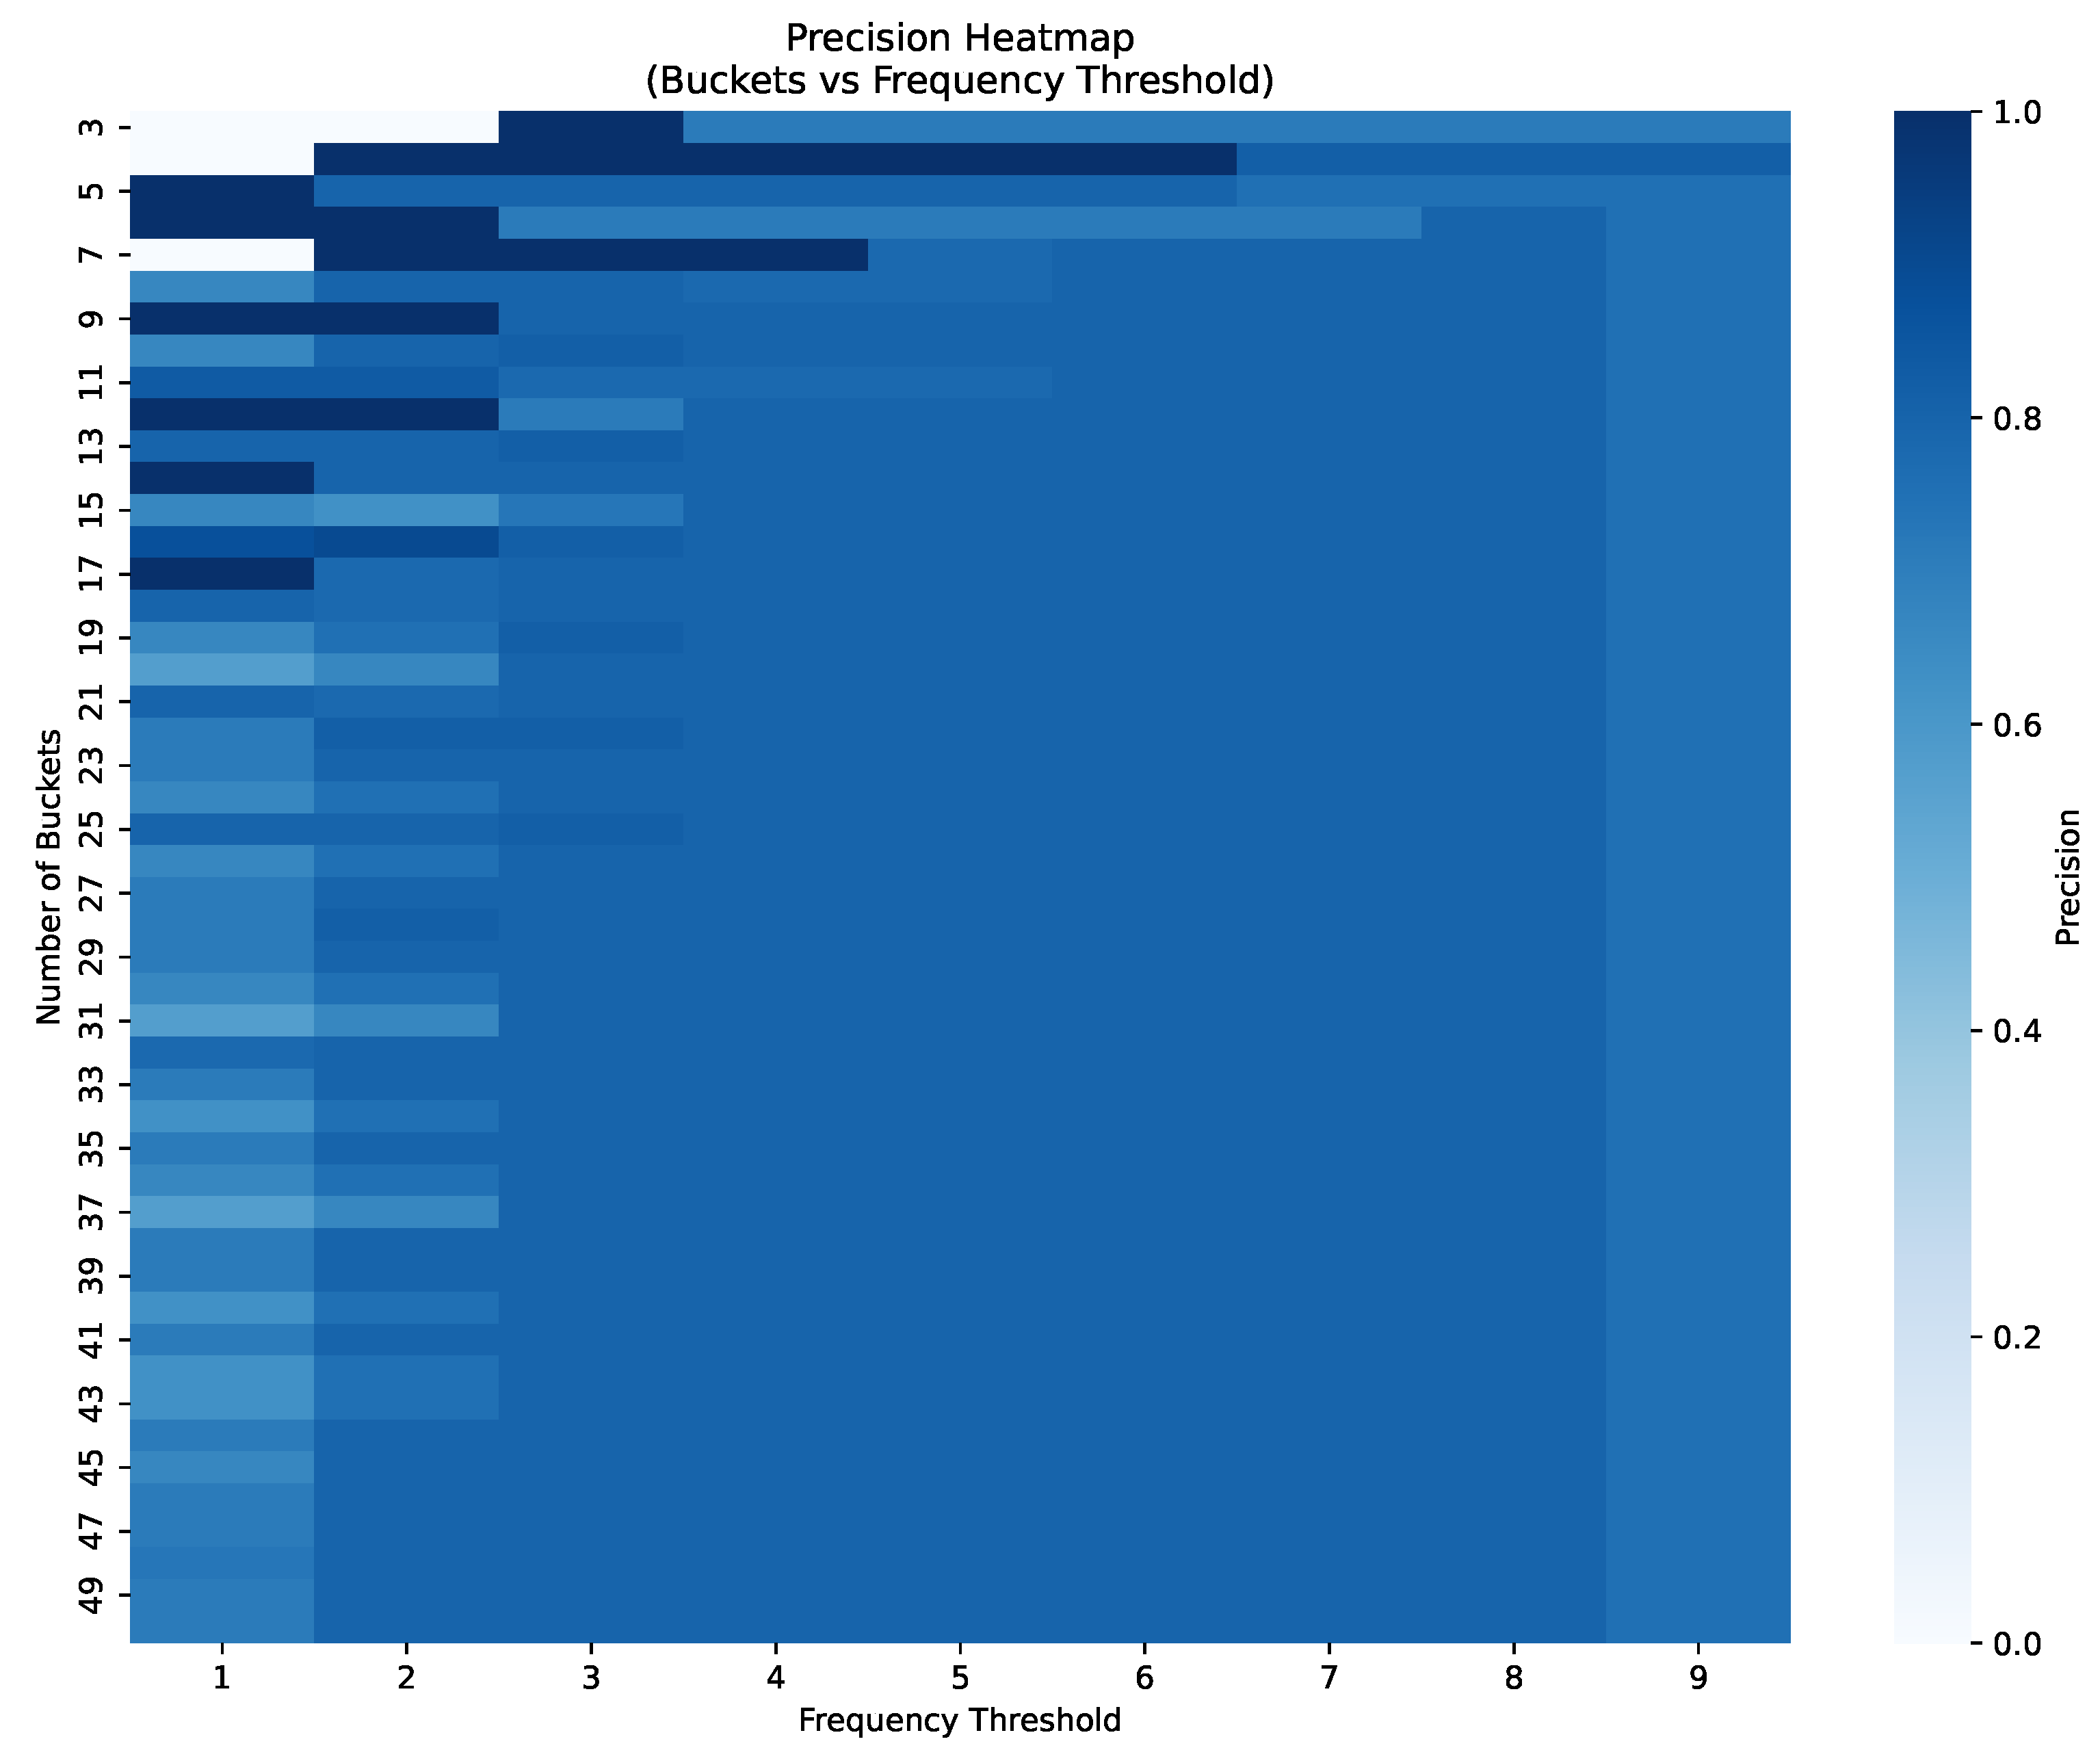
Determining the frequency threshold used at deciding if observations are outliers or not is crucial in ensuring a high detection precision. Overly high threshold values result in a larger number of bins being considered to contain outliers, increasing the number of false positives and thus lowering precision, while a low value of the threshold leads to a large number of false negative samples. Furthermore, the threshold value should also be selected according to the number of buckets in the histogram, as a large number of buckets implies lower frequencies inside buckets. Therefore, to determine an appropriate frequency threshold for detecting outliers, we performed a sensitivity analysis by varying the number of histogram buckets and frequency thresholds to evaluate how these parameters influence detection precision. Specifically, we computed precision scores for each combination and tried to identify the optimal match depending on the dataset, as shown in
Figure 6 for data depicted in
Figure 5b. Our analysis revealed that the precision generally decreases when both the number of buckets in the histogram and the threshold increase.
Figure 5 depicts the results of our method on various types of variations, including real measurements from the IoT smart meter as well as artificially modified data representing several abnormal behaviors. As shown in
Table 1, both the cryptographic and non-cryptographic methods detect the same number of outliers, indicating that our privacy-preserving histogram-based outlier detector achieves the same precision as the traditional method operating on raw data. The corresponding performance metrics for both the plaintext and cryptographic techniques are summarized in
Table 2. However, it is important to note that the accuracy of the private histogram outlier detection technique heavily depends on the training data. When presented with data in ranges that have not been seen during training, the private histogram may produce errors or fail to detect certain outliers as expected.
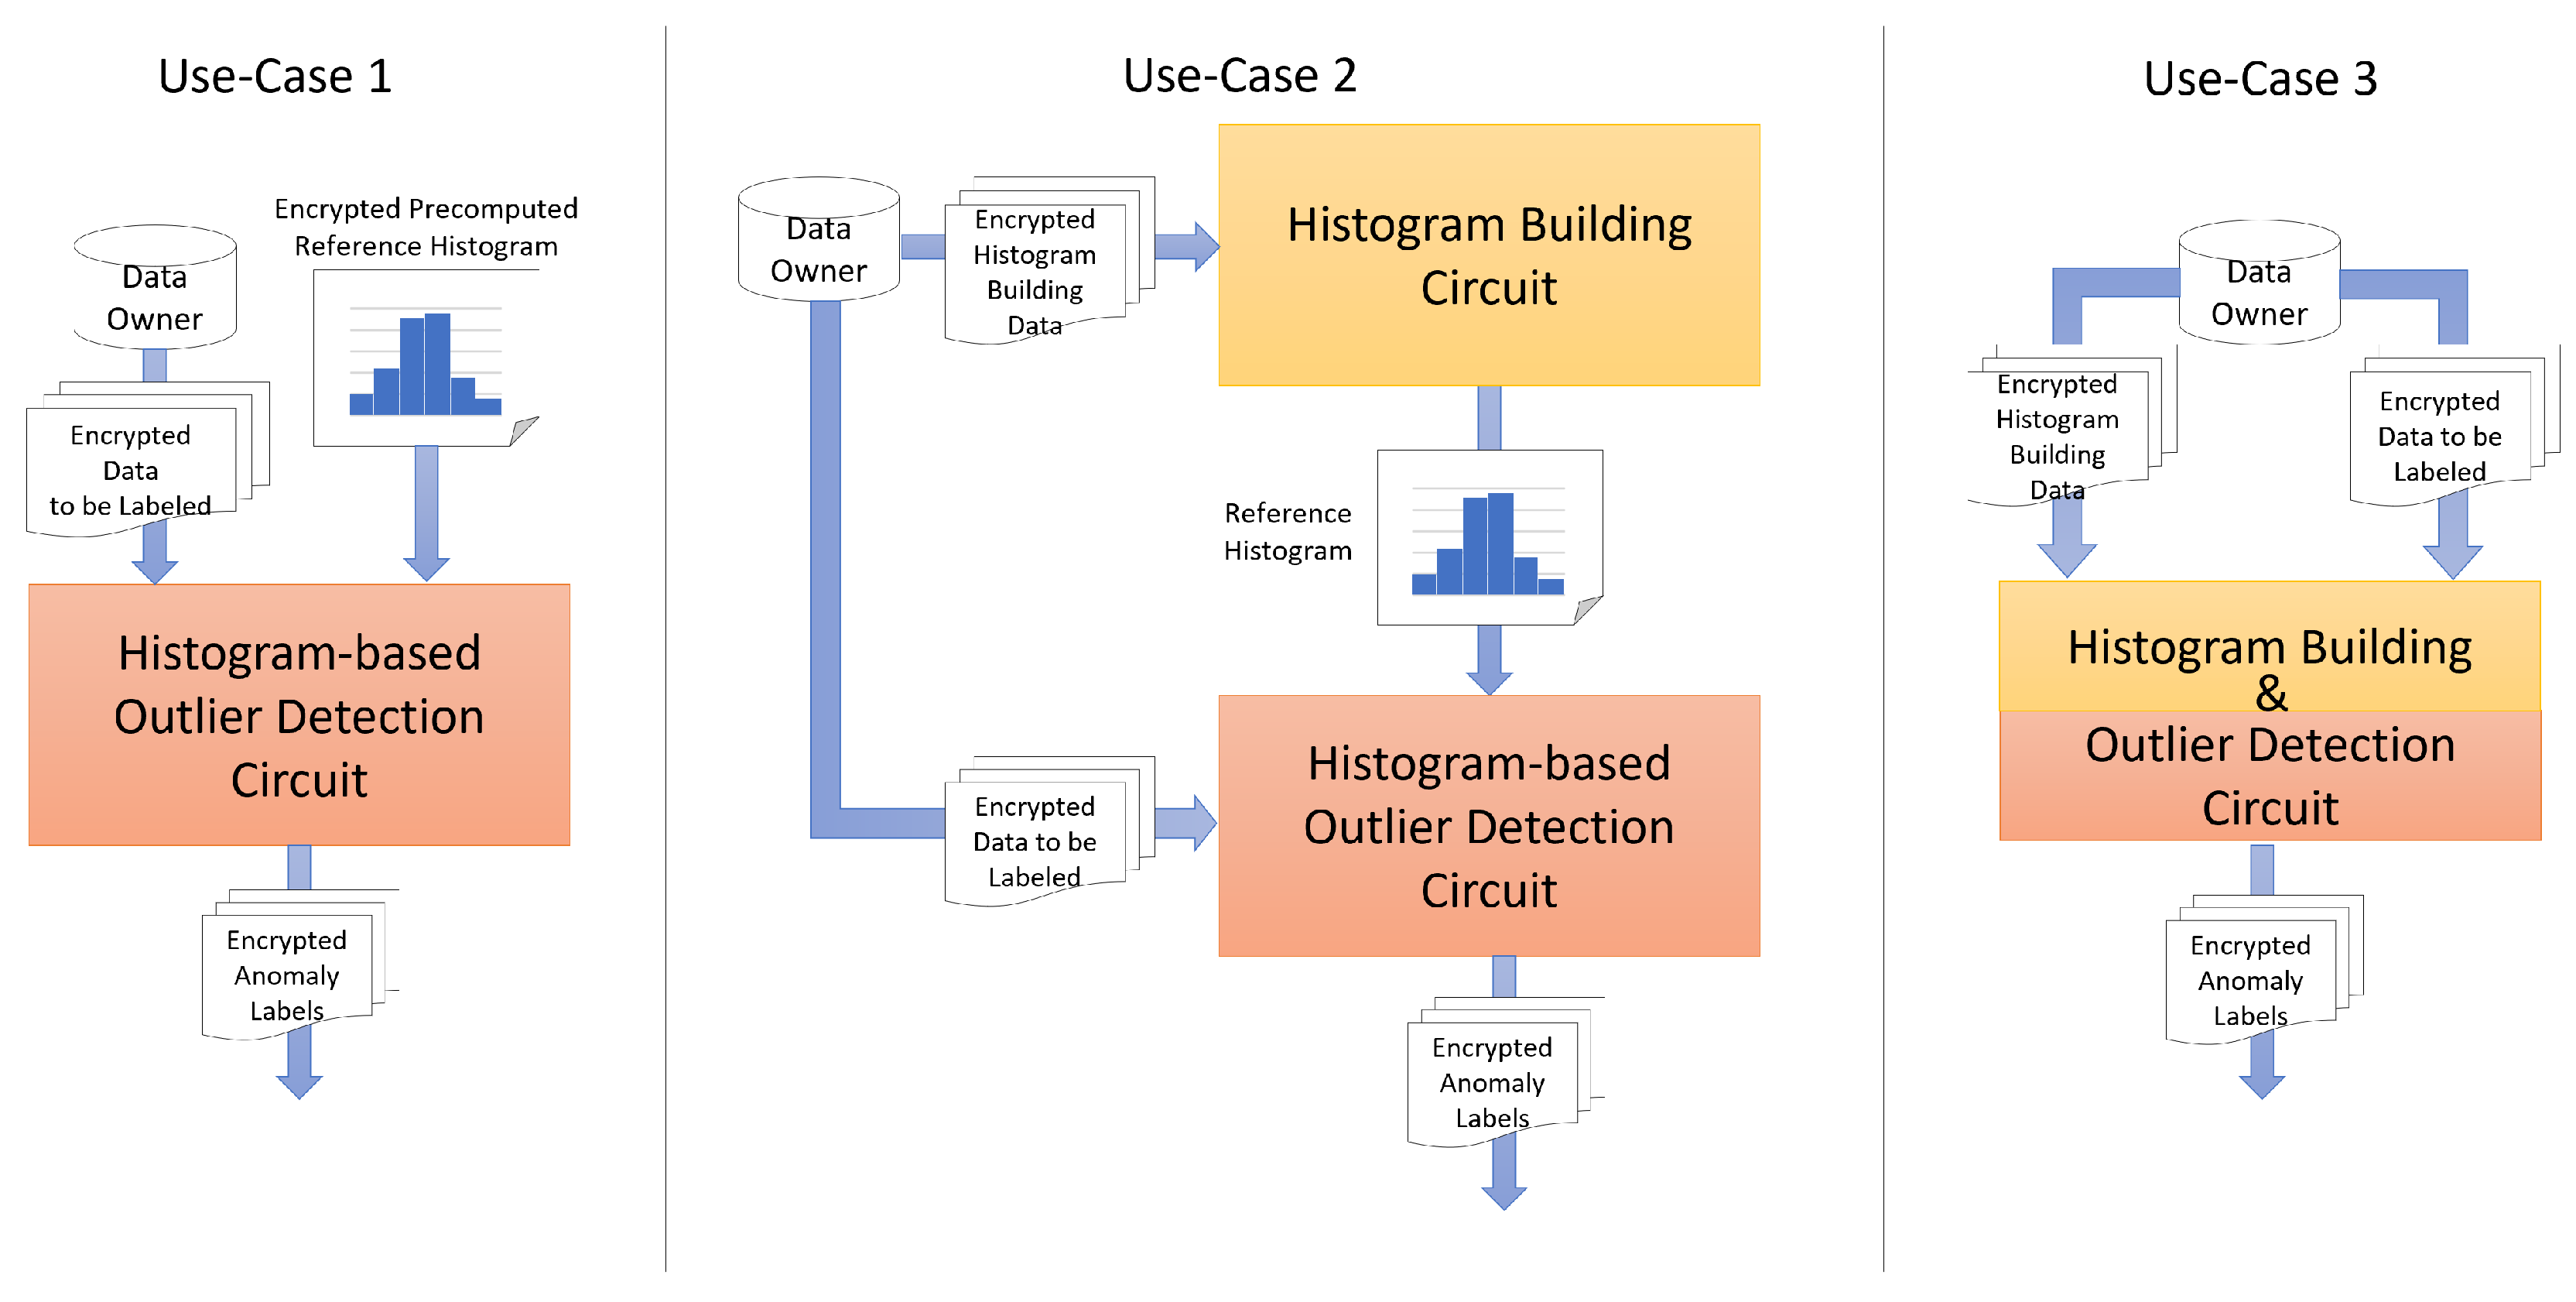
In the following, we discuss and compare the complexity and execution time of our outlier detection solution for encrypted data considering three different configuration use cases depicted in
Figure 7. The complexity of our configurations is determined in terms of basic operations, such as clear addition, encrypted addition, encrypted negation, and programmable bootstrap, which is used to reduce the amount of noise within the encrypted representation to allow performing multiple operations on the same encrypted operands. The relative complexity of the circuits gives a hint about which circuit is faster (lower complexity will determine a lower execution time), as presented in [
44]. To ensure the relevance and reliability of the reported results, we conducted approximately five runs for each of the experiments described below. The execution times and operation counts reported for our histogram construction and outlier detection circuits represent the average values computed across these runs. However, the results across all runs showed minimal variance, with the computed values remaining consistently close.
Table 1.
Comparison of outlier detection between non-cryptographic and cryptographic methods
performance on various types of outliers.
Table 1.
Comparison of outlier detection between non-cryptographic and cryptographic methods
performance on various types of outliers.
|
Outlier Type (in Figure 5)
|
# Outliers in Dataset
|
# Normal Samples in Dataset
|
# Outliers Detected by Non-Cryptographic Method
|
# Outliers Detected by Cryptographic Method
|
|---|
| Figure 5a | 3 | 21 | 4 | 4 |
| Figure 5b | 12 | 12 | 9 | 9 |
| Figure 5c | 24 | 0 | 24 | 24 |
| Figure 5d | 22 | 2 | 14 | 14 |
| Figure 5e | 13 | 11 | 12 | 12 |
Table 2.
Performance metrics of our outlier detection method.
Table 2.
Performance metrics of our outlier detection method.
3.1. First Configuration Use Case (UC-1)
UC-1 assumes the availability of a previously computed histogram of IoT sensor data for the normal behavior of the device. This histogram, along with new IoT sensor data, serves as input for the outlier detection circuit. In this setup, the expected data variance over the selected time interval is a key factor. To account for this, we construct a reference histogram using hourly mean energy measurements recorded over several past days. UC-1 is designed to evaluate the outlier detection circuit independently, focusing on identifying outliers in encrypted data without addressing the construction of the data distribution.
In our evaluation, we aim to determine how the size of the plain input data samples affects the size of the encrypted inputs, results, and secret keys. As all the values used in computations are preprocessed to fit in
, they can all be represented using 8 bits. Therefore, when computing the size of the plain inputs, we consider that the size of each value is 1 Byte. Thus, since the measurements are recorded on an hourly basis and each bucket is represented by a tuple containing three values, namely (low, high, count), the size of the clear inputs can be expressed, in bytes, as follows:
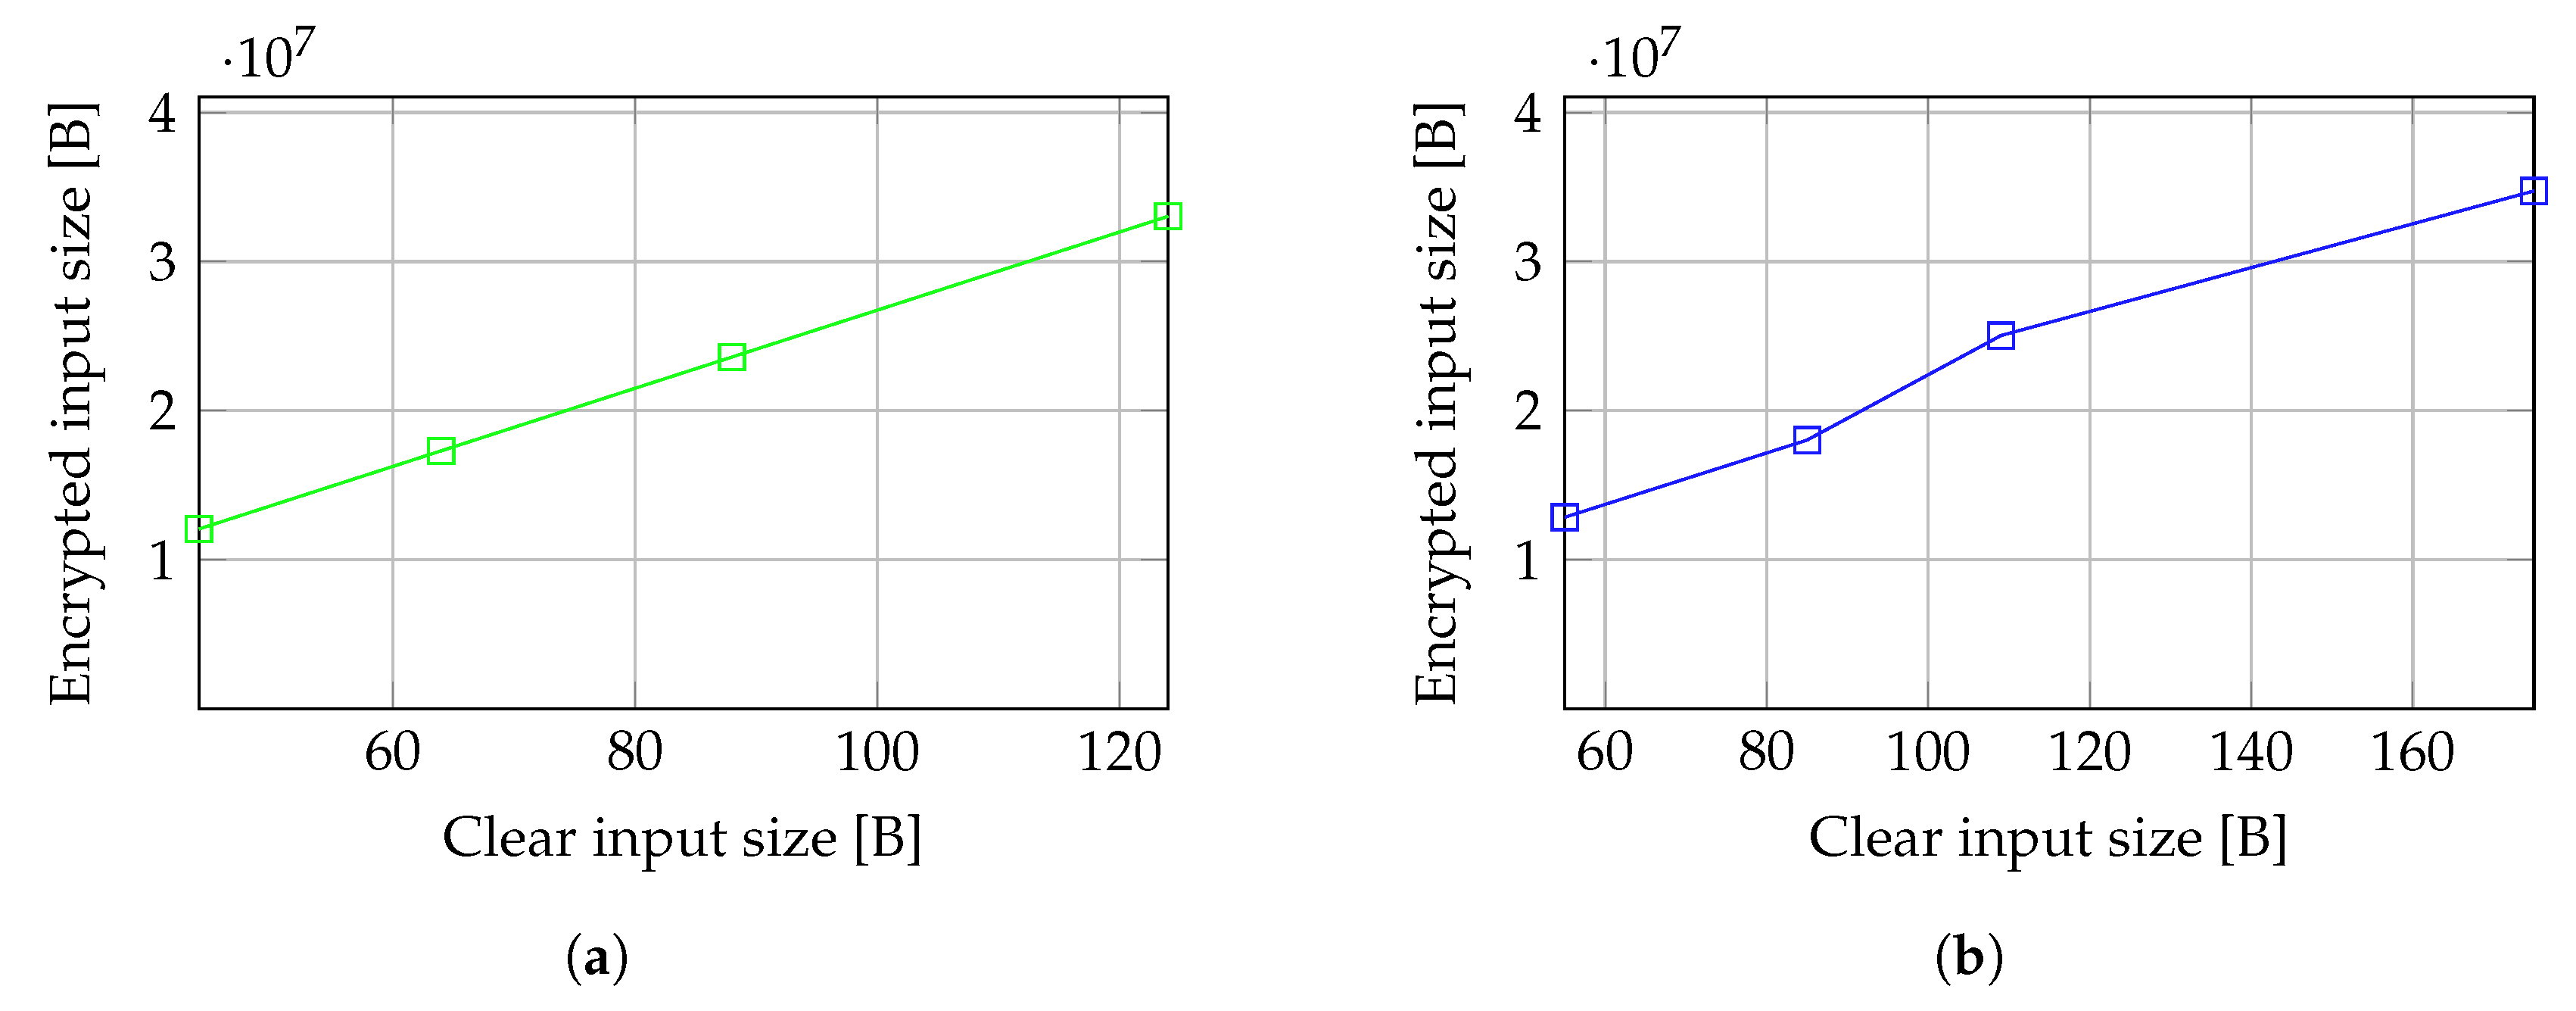
We measured the variation of the size of encrypted inputs, outputs, and secret keys with the size of the plain inputs, expressed as pairs of number of days considered, each containing 24 measurements, and the number of buckets in the reference histogram used to detect outliers. The actual size of the inputs, expressed in bytes, can be determined using relation 9. The size of the encrypted inputs is correlated to the size of the raw inputs, but the size of the encrypted data is considerably higher. The size of the encrypted output also increases with the size of plain inputs and depends only on the number of measurements to be labeled, as the module outputs an encrypted label associated with each input measurement. However, the size of the secret keys is not correlated with the size of input data, and it has the same order of magnitude, regardless of the size of the inputs. As depicted in
Figure 8a, even if the size of the encrypted inputs increases almost linearly with the size of the clear inputs, the overhead introduced by the encryption is significant (
).
The complexity of the model can be expressed in terms of operations performed during the outlier detection process. This complexity for UC-1 is highly dependent on the size of the input samples. As previously described, in our case, the length of the input is determined by the number of buckets in the histogram and the number of IoT data samples we want to process. We measured the variation of different types of operations with the size of the inputs. As expected, the number of operations performed increases when the size of the data input increases. However, since we propose an additive algorithm operating on encrypted data, encrypted addition is the most frequently performed operation. The number of programmable bootstrap operations, used to reduce the noise and to allow repeated computations on the same ciphertext, also significantly increases with the size of the inputs as the number of values that must be repeatedly operated on grows.
A synthetic view of the operation-based complexity variation is depicted in
Figure 8b. We consider the total number of operations as a measure of the complexity of the model. In this global view, the complexity of our prototype in UC-1 doubles when either the number of buckets or the number of measurements doubles, resulting in an almost linear variation.
We evaluate the performance of our prototype by measuring the compile time, which is the time needed to train the model using a set of plain input samples, the time taken by the model to generate the keys, and the time taken to generate the encrypted labels associated with the input encrypted measurements.
Figure 8c depicts the variation of all time components considered for UC-1 configuration, with the size of inputs. The time required for key generation is significantly lower than both the compilation and detection (execution) times. Meanwhile, compilation and detection times follow a similar pattern, increasing exponentially as the input size grows.
3.2. Second Configuration Use Case (UC-2)
UC-2 focuses on evaluating the histogram construction and outlier detection phases of our privacy-preserving solution. This approach ensures a more accurate representation of the data distribution, which may shift over time due to seasonality and other external factors. As a result, the reference histogram needs to be periodically updated. This histogram, along with the data to be labeled, is then fed into the outlier detection circuit. This use case allows for independent analysis of the two key phases in the proposed outlier detection process. Transferring the reference histogram between two circuits requires either decrypting and re-encrypting it with the second circuit’s key or securely sharing encryption keys via a trusted third party. While the Concrete library supports storing keys on disk and loading them for use in another circuit, this method introduces potential security risks by exposing sensitive data, making it more vulnerable to exploitation.
We measured the complexity of both the histogram construction and outlier detection modules concerning the size of encrypted inputs, outputs, and secret keys. The encrypted input size is similar for both modules. However, the encrypted output size is significantly larger for the outlier detection circuit. This increase is due to its strong dependence on input size, as the output consists of encrypted binary labels corresponding to each input value. Furthermore, the encrypted input and output sizes of the outlier detection circuit are comparable to the input size in UC-1, as both use the same circuit. Given that 24 measurements are sampled per day and each bucket range is represented as a
value pair, the size of the clear inputs for the histogram construction phase can be expressed as follows:
The size of the plain inputs of the outlier detection phase is equal to the size of the inputs in UC-1 (see (
9)). The overhead introduced by encrypting the inputs is around
in the case of both circuits in UC-2, as
Figure 9 shows. The relationship between encrypted and plain input sizes is linear for the histogram construction prototype and nearly linear for the outlier detection prototype.
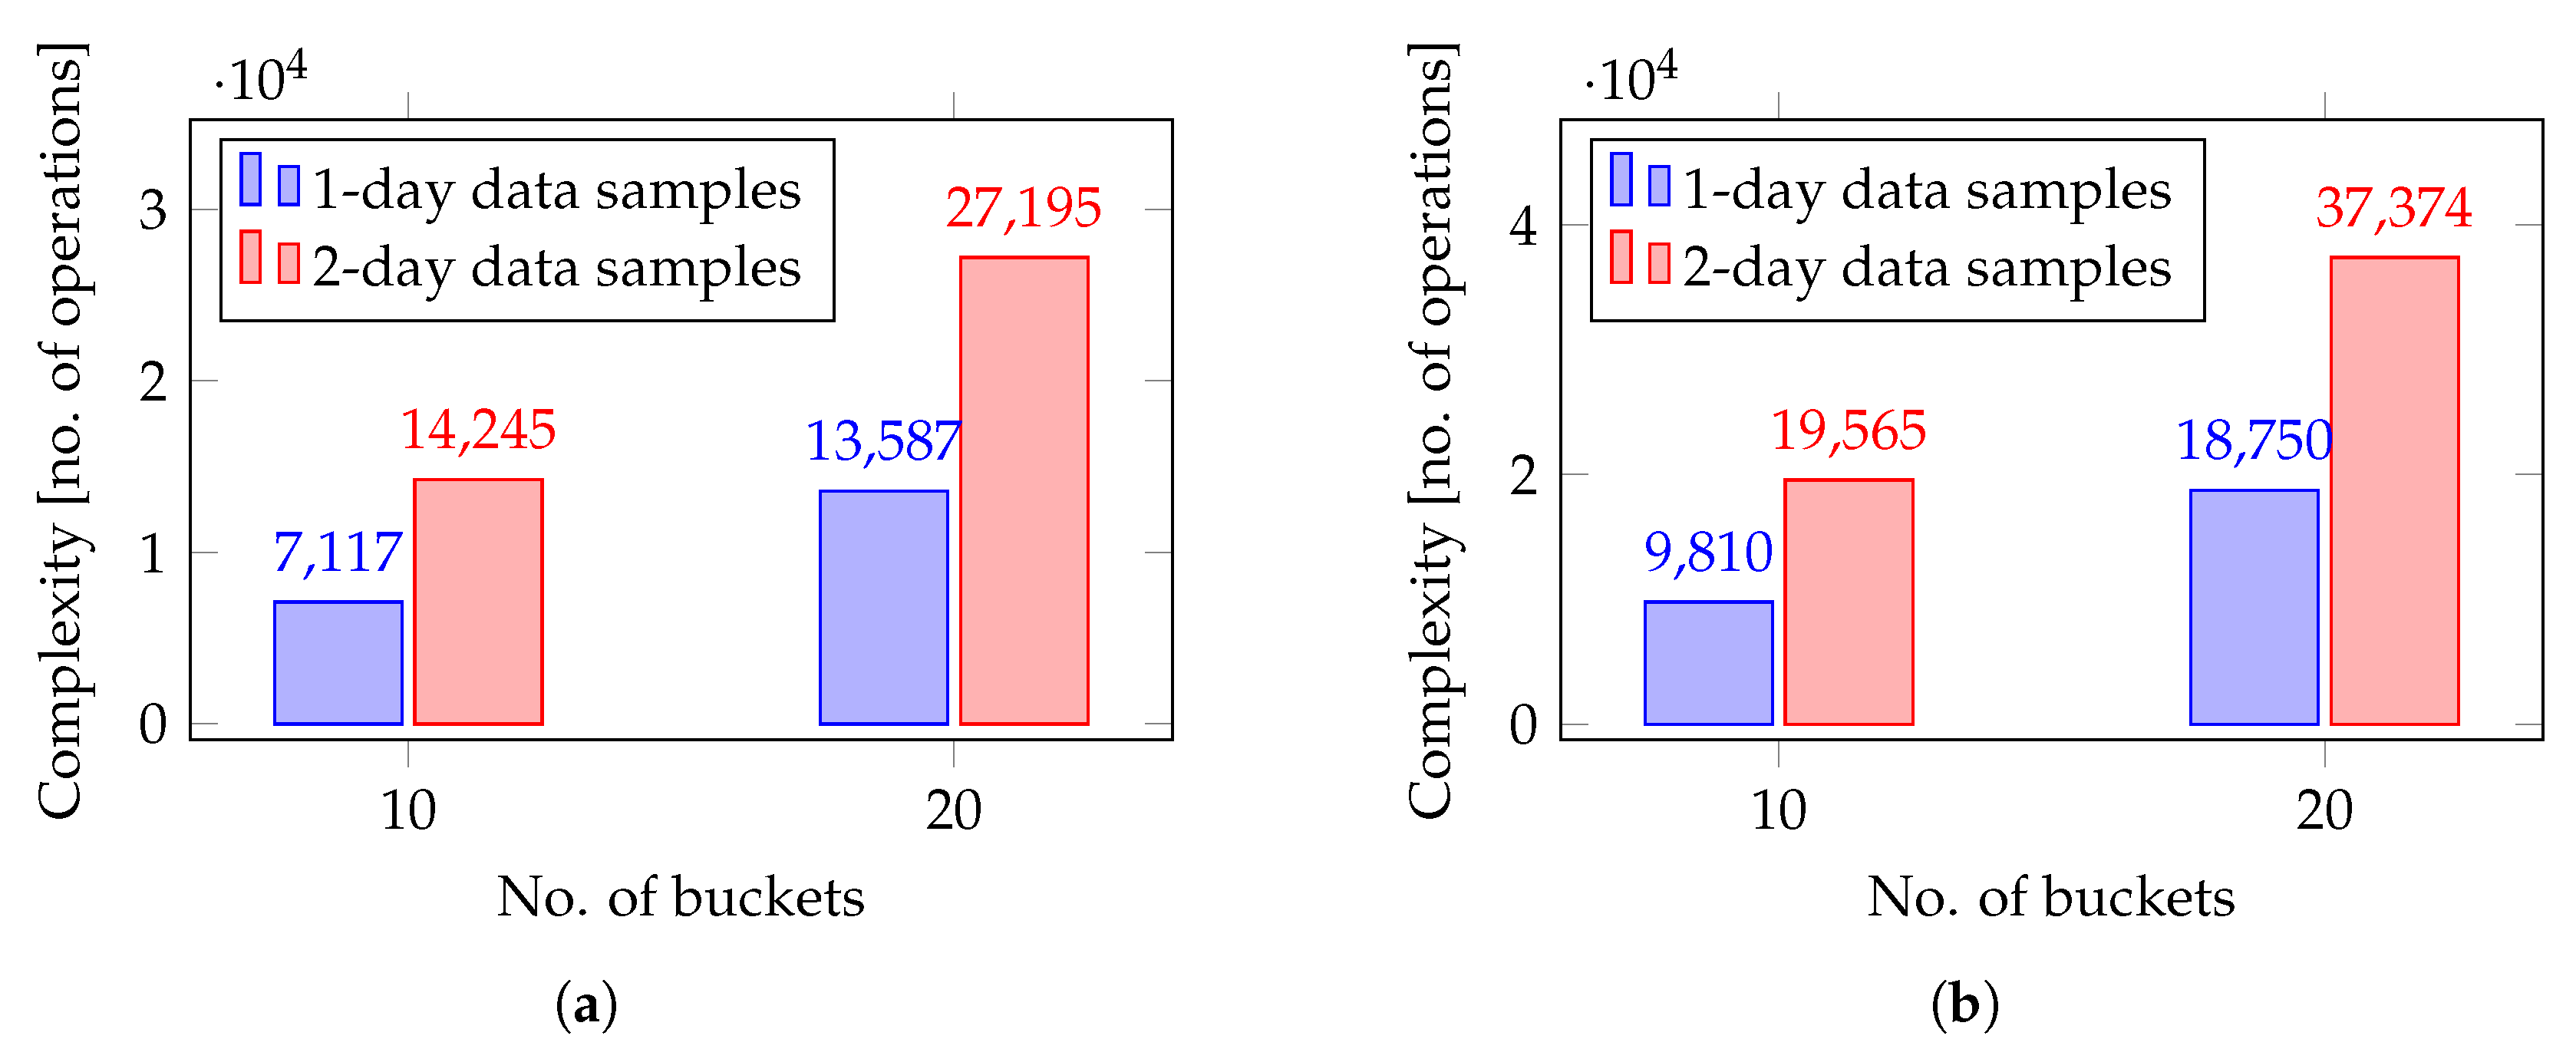
We evaluated the operation-based complexity of both models, displaying the number of operations of each type performed by each circuit. Similar to UC-1, encrypted addition is the most frequent operation, as both circuits rely primarily on vectorial addition. While the total number of operations is higher during the outlier detection phase leading to increased circuit complexity, it remains comparable to the complexity of the model in UC-1. As shown in
Figure 10, the operational complexity of both circuits, as well as the total number of operations performed in our prototype circuits for UC-2, approximately doubles when either the size of the data to be labeled or the number of buckets doubles. However, running the models in UC-2 with a 50-bucket histogram and two full days of data samples proved infeasible in our experimental setup, as it required excessive computation time and exceeded the available processing power.
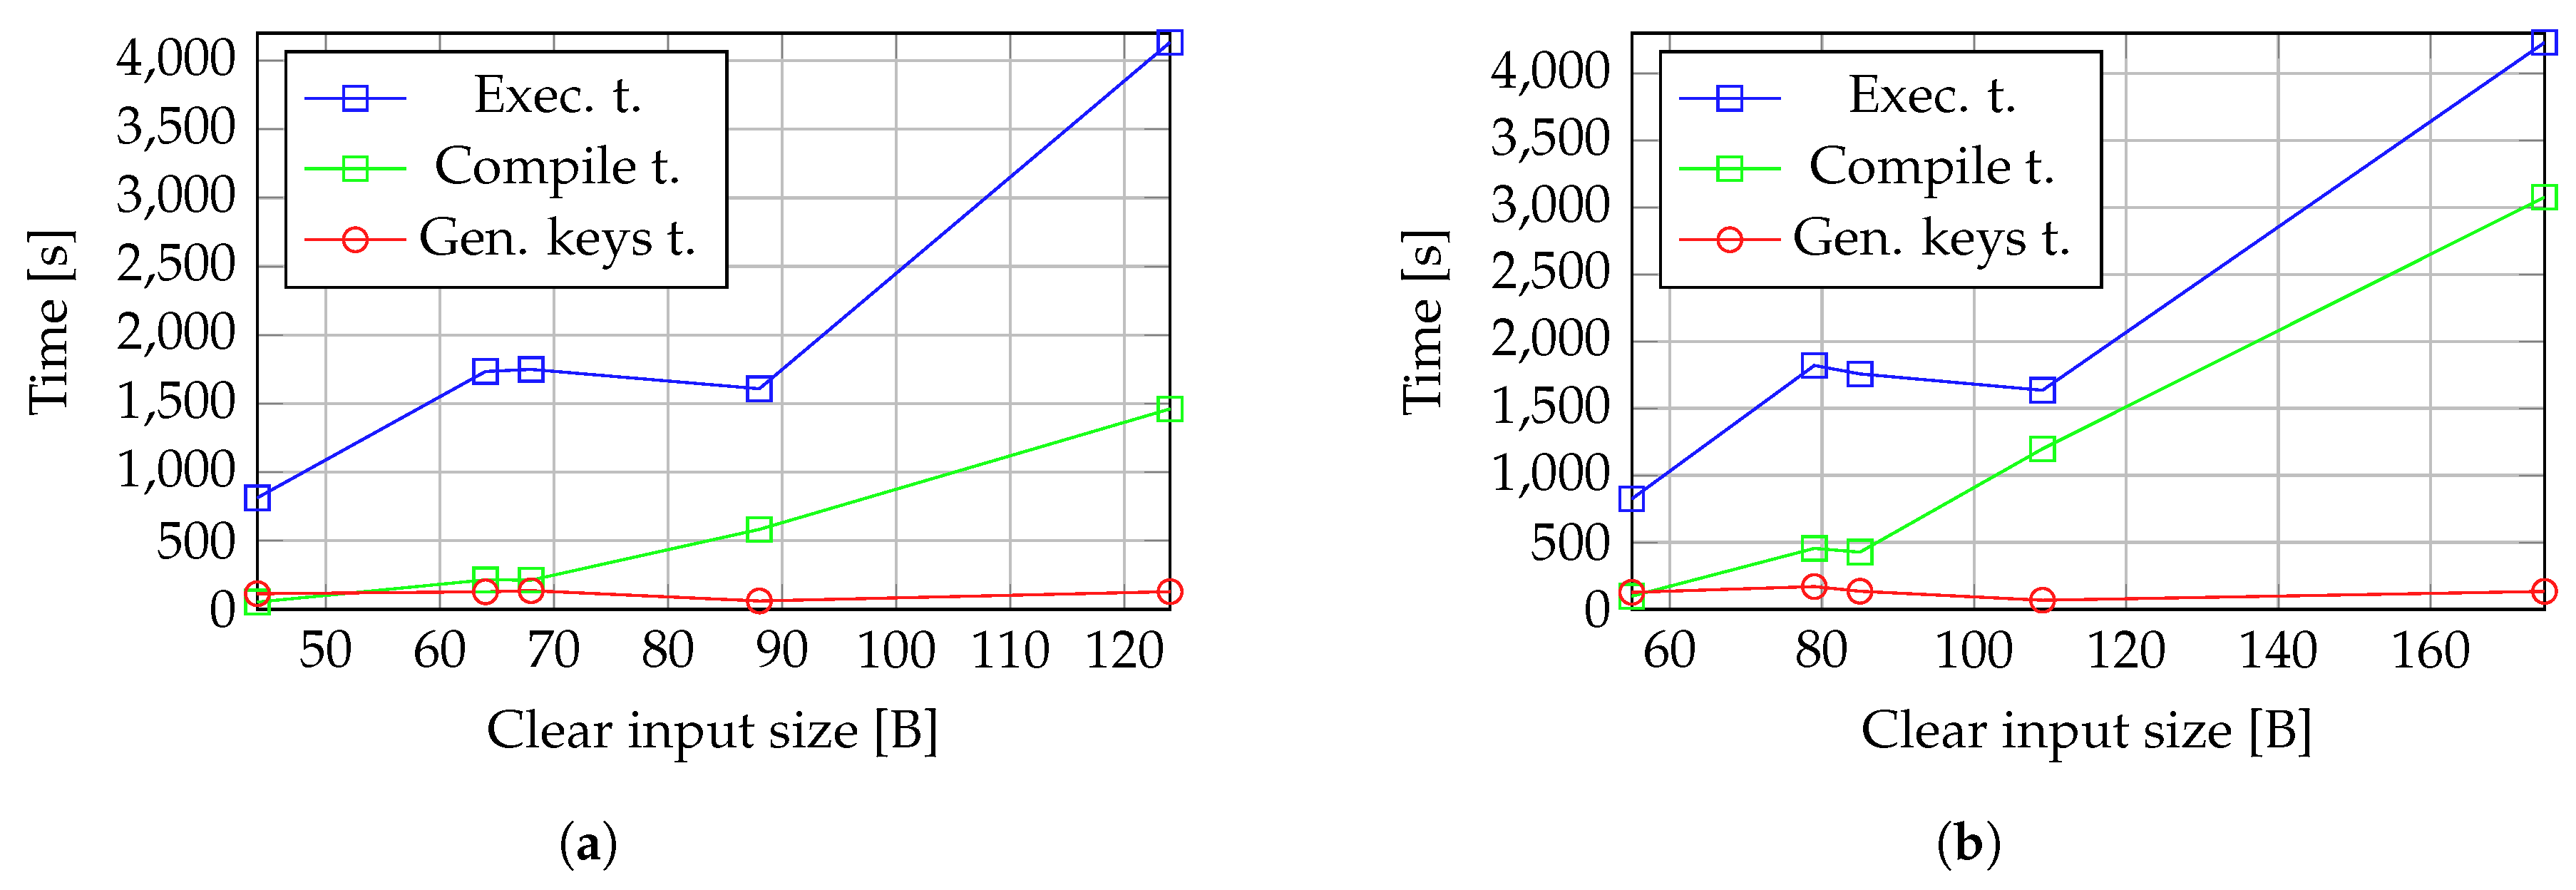
The performance of the circuits in UC-2 in terms of compile (training), generating keys, and building histogram or outlier detection time is synthetically presented
Figure 10. The compile time is considerably lower for the histogram building prototype, while the time taken to generate the keys and the execution (building histogram or outlier detection) time are comparable between the two circuits.
The execution time generally increases with the size of inputs and, implicitly, with the number of operations performed on input values. However, for both histogram building and outlier detection circuits, the execution time and key generating time shows a local minimum when the size of inputs is
, as depicted in
Figure 11, while, in the case of training (compile) time, the local minimum is encountered at an input of size
.
3.3. Third Use Case (UC-3)
UC-3 aims to increase the security of the overall process by computing the histogram and detecting outliers using the same circuit. However, this results in a higher complexity of the circuit and slower execution. In this scenario, the global complexity of the technique is evaluated.
As in UC-1 and UC-2, the complexity of the model regarding the size of encrypted inputs increases with the size of data, while the size of the encrypted outputs is influenced only by the number of buckets in the equi-width histogram. However, as more operations are performed in the model that we define in UC-3, we notice a slight increase in the size of secret keys compared to the size of secret keys generated in UC-1 and UC-2. The total size of the inputs is expressed for UC-3 in a totally similar way to the size of inputs corresponding to UC-1 and UC-2 (see relations (
9) and (
10)). As in UC-2, performing experiments on a 50-bucket histogram using 2-full-days data samples is not feasible in UC-3.
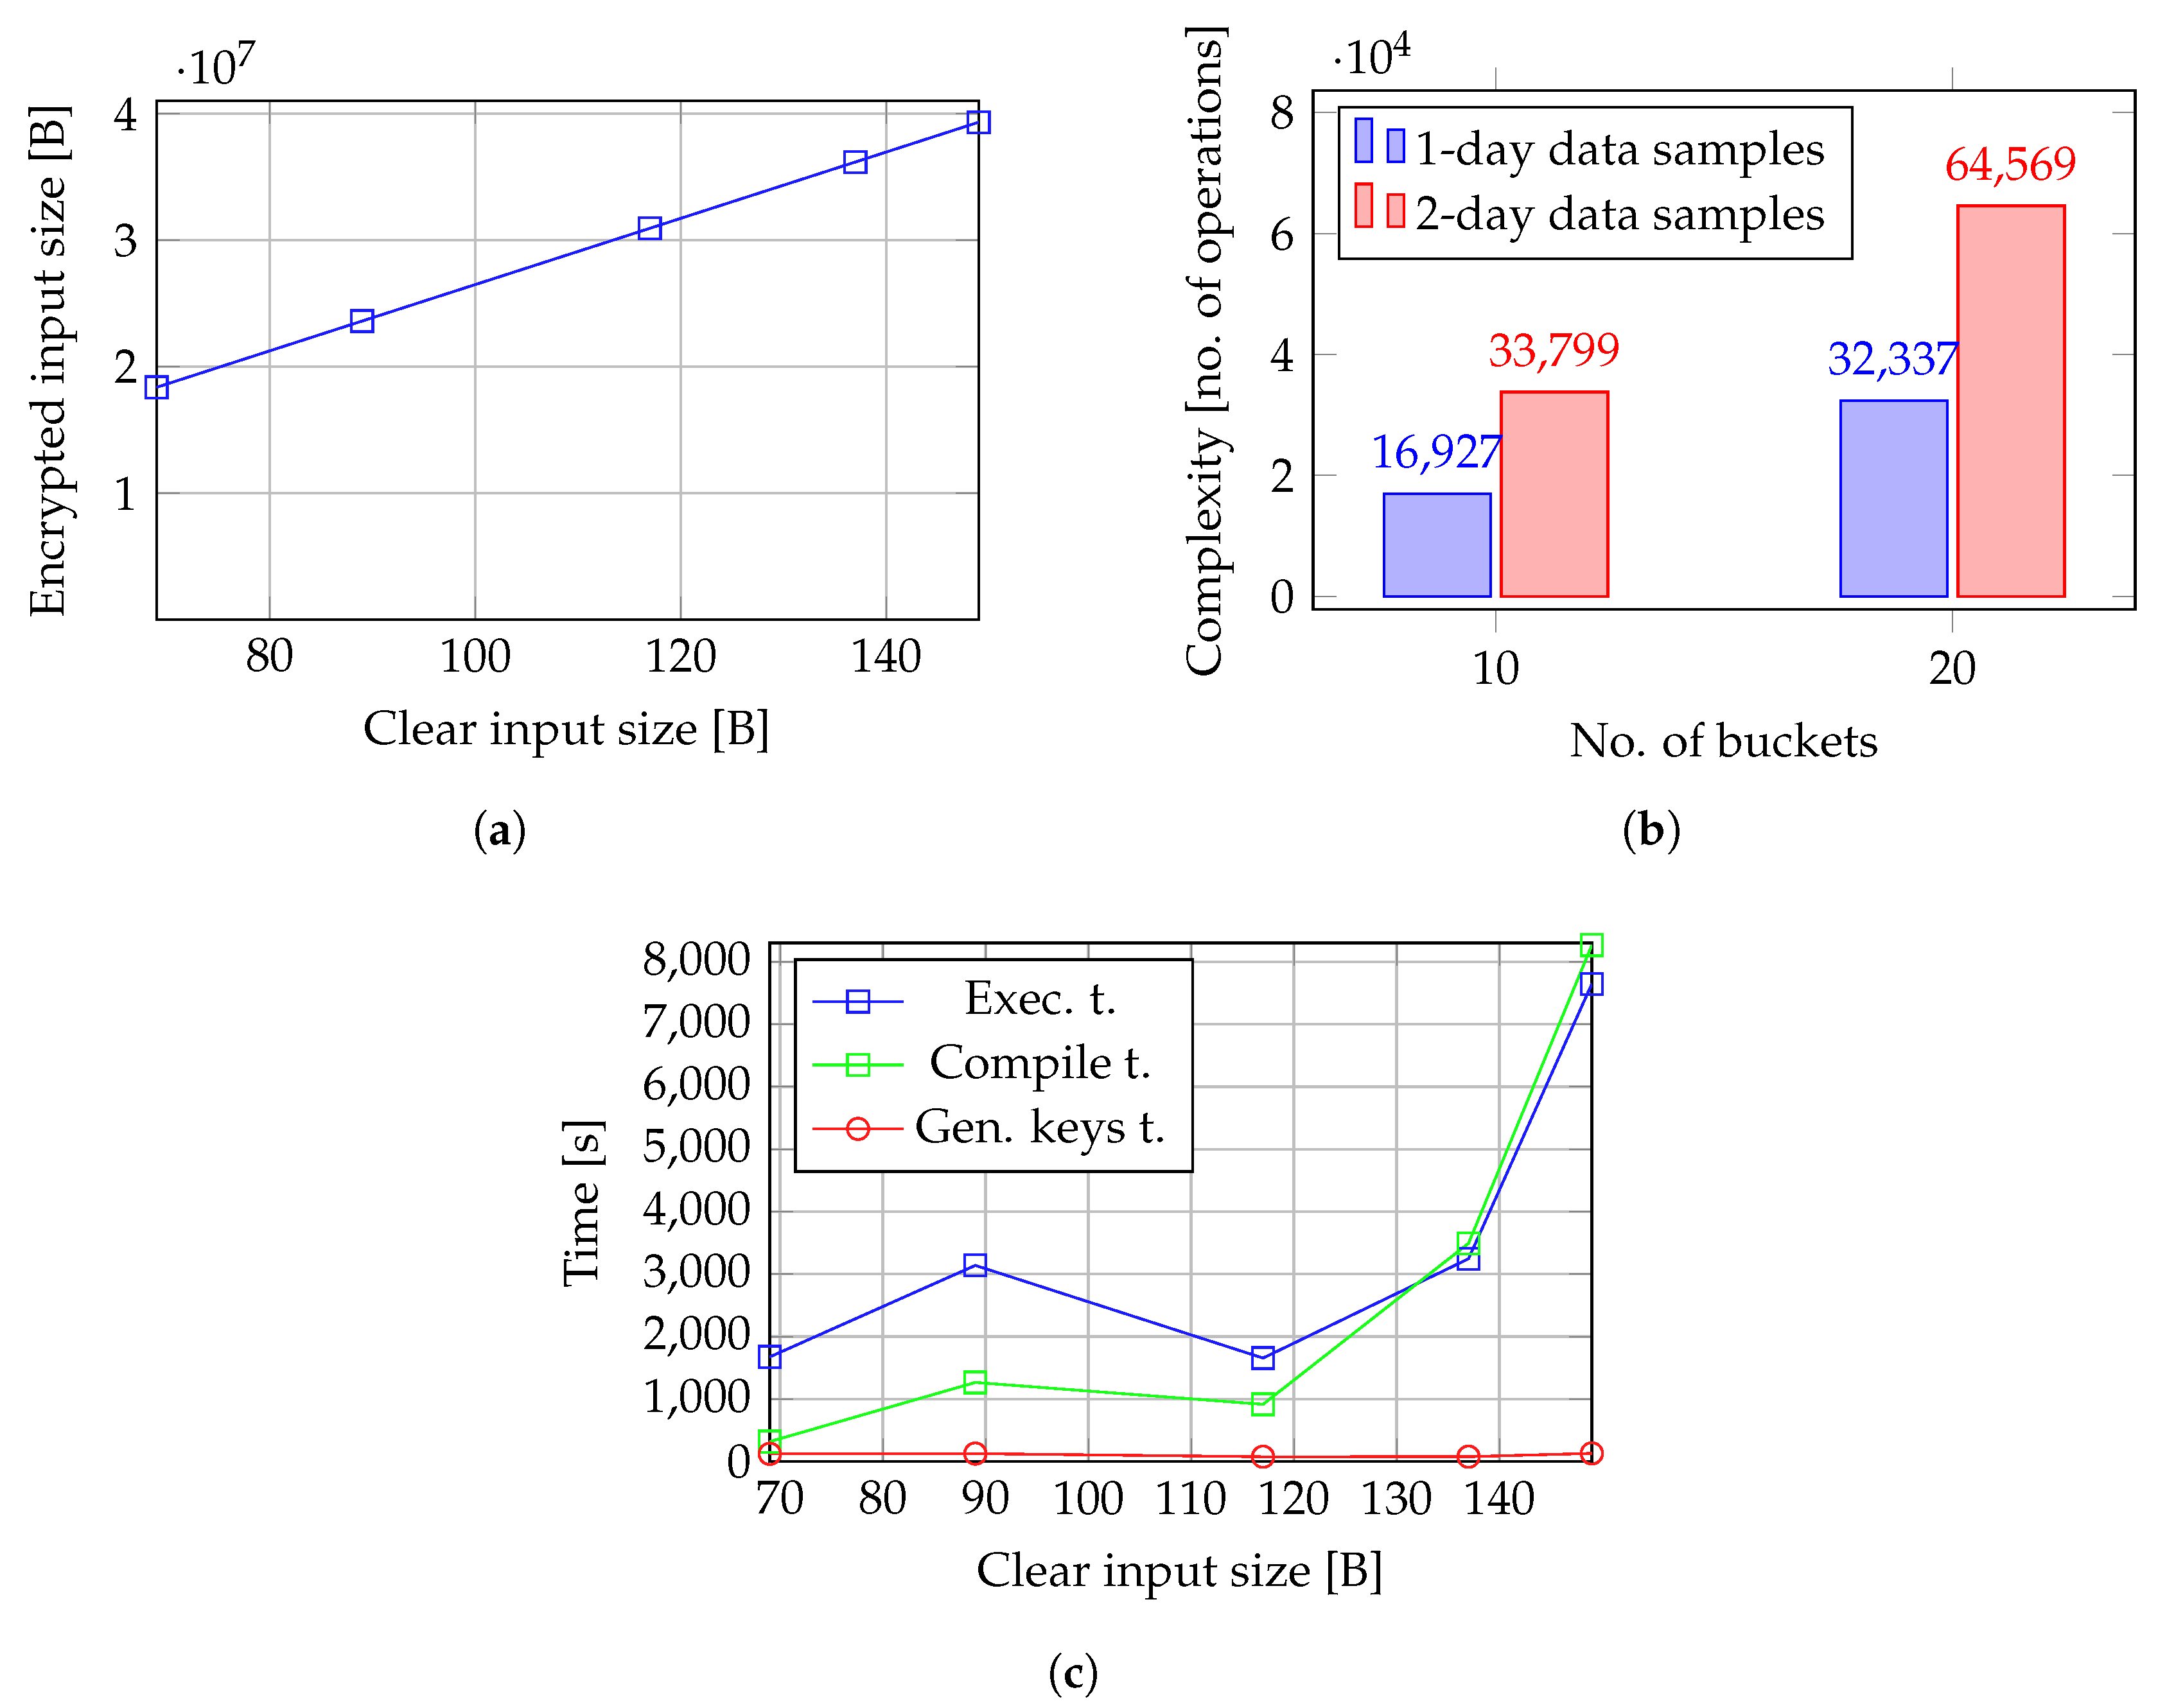
Since in UC-3, we compute the reference histogram and detect outliers using a single model, the size of inputs is considerably higher than in the case of circuits defined in UC-1 and UC-2. Therefore, the overhead introduced by encrypting the inputs is even higher than in UC-1 and UC-2, reaching an increase of almost
in the size of inputs, as shown in
Figure 12a.
Integrating both the histogram building and outlier detection phases into the same model, as defined in UC-3, increases the computational complexity of the circuit. This results in higher overall complexity due to the greater number of operations performed. The number of operations of each type performed by our prototype in UC-3 is roughly the sum of the operations from the circuits that separately handle histogram construction and outlier detection in UC-2. Consequently, the complexity of the circuit used in UC-3 provides a comprehensive view of the overall complexity of the proposed privacy-preserving outlier detection technique.
Similar to UC-1 and UC-2, the effect of the number of samples to be labeled and the number of buckets in the reference histogram on the model’s operation count is consistent. As shown in
Figure 12b, doubling both the number of data samples and the number of buckets results in models with comparable operational complexity.
We measured the time variation of the model in UC-3 relative to input size. Although the circuit in UC-3 is a combination of the two circuits from UC-2, the compile time, key generation time, and execution time of the UC-3 circuit do not simply add up to the sum of the corresponding times for the two individual circuits in UC-2. The execution and compile time for UC-3 follow the same pattern as the corresponding time components in UC-2. A local minimum can be identified for an input size of
for this prototype, as depicted in
Figure 12c. However, taking into consideration the high complexity of the model in terms of both input size and number of operations, the training and execution (i.e., histogram construction and outlier detection) are slower than in UC-1 and UC-2.
4. Conclusions
In this paper, we introduce a solution for building equi-width histograms and detecting outliers on homomorphically encrypted data generated by IoT devices. To address constraints such as the limited set of operations that can be performed on encrypted data, we leverage the TFHE scheme implemented in Concrete, a fully homomorphic encryption variant optimized for practical applications. Our approach incorporates a redesigned histogram-based technique tailored for encrypted IoT data streams, enabling the detection of sensor readings that statistically deviate from previous measurements and are therefore considered anomalous. We have implemented the main operations of the equi-width histograms’ outlier detection algorithm adapted for the TFHE homomorphic encryption scheme. The customization involves vectorizing additive operations, value placement in buckets, and labeling abnormal buckets based on a threshold frequency.
The proposed solution effectively constructs histograms and detects outliers on fully homomorphic encrypted data streams without decryption. While operations on encrypted numbers introduce significant execution overhead, they remain practical for offline processing. Labelling 24 to 48 sensor measurements can take minutes to hours, depending on input size and histogram complexity. Communication between the client and outlier detector is minimal, and deploying the detector closer to the edge reduces cloud traffic. The experiments were conducted in a laboratory setting using standard hardware. The proposed solution’s performance in an actual deployment still needs to be investigated, as in real-world conditions, it may be affected by more limited memory capacity, lower processing power, and stricter energy constraints typical of edge computing nodes.
Using the TFHE scheme and Concrete library offers advantages such as encrypted data operations, ready-to-deploy circuits, and efficient key management. However, limitations persist, including restrictions on computational depth, arithmetic precision, and function complexity. Errors may arise due to reliance on precomputed lookup tables, but these are generally less impactful than potential IoT sensor noise.
Processing encrypted IoT data is constrained by computational overhead, requiring careful data scaling to fit within limited bit representations. Vectorial operations offer a more flexible alternative to iterative methods. Our experiments used small integer values (8-bit) to ensure feasible outlier detection configurations.
Lastly, designing computations on encrypted data is rigid. Changes in input size or operations necessitate circuit recompilation and model retraining, which can take several hours. More complex algorithms result in larger, costlier circuits, increasing execution time.
While encrypted data processing introduces additional execution time and homomorphic encryption imposes constraints on operation size and precision, these trade-offs are inherent to secure computation. Additionally, adapting to changes in input size or operations requires recompilation and retraining, which may limit flexibility. However, our solution remains highly effective for constructing cryptographic equi-width histograms on homomorphically encrypted data and can be successfully applied to IoT data outlier detection, ensuring compliance with data protection regulations. The promising results highlight its potential for advancing privacy-preserving analytics.


