
Enhancing Customer Quality of Experience Through Omnichannel Digital Strategies: Evidence from a Service Environment in an Emerging Context

 ,
,  ,
,
Abstract
1. Introduction
- O1.
- To assess the level of customer satisfaction in relation to the service station’s current omnichannel strategy;
- O2.
- To evaluate the correlation between customer satisfaction and (a) the use of data for personalization, (b) the availability of digital payment options, and (c) the flexibility of logistical arrangements;
- O3.
- To interpret the findings within the conceptual framework of Net-Living and digital well-being, linking empirical results to broader issues of service inclusion, user autonomy, and experience optimization.
2. Materials
2.1. The Customer Journey Theory
2.2. Expectancy–Disconfirmation Paradigm
2.3. Omnichannel Design Dimensions
2.3.1. Data Integration
2.3.2. Digital Payment Systems
2.3.3. Logistics Orchestration
2.4. Quality of Experience (QoE) and Net-Living
3. Methodology
3.1. Research Design
3.2. Sample Characteristics and Setting
- n = sample size;
- p = 0.5;
- q = 1 – p = 0.5;
- N = population size = 150;
- E = error level (5% for 95% confidence) = 5%;
- Z = Z-value for 95% confidence interval = 1.96;
3.3. Data Collection Instruments
- Data integration (4 items): These items measured whether the customer perceived the product and service information as clear, centralized, and updated across digital and physical channels. This included visibility of the stock, personalized content, and consistent communication.
- Digital payment systems (6 items): These items assessed the availability and ease of various payment methods, such as mobile wallets, online card payments, and cash options synchronized with digital orders.
- Logistics flexibility (2 items): Questions evaluated the extent to which users could choose between home delivery and in-store pickup, as well as whether logistical processes were perceived as reliable and timely.
- Customer expectations (2 items): These items explored whether customers felt their expectations about the service were met or exceeded.
- Perceived value (6 items): Items in this category captured how customers assessed the benefits received in relation to the time, effort, and costs incurred. This included perceptions of fair pricing, efficient service, and emotional satisfaction.
3.4. Validation and Statistical Approach
- Omnichannel Service Questionnaire (12 items): α = 0.813
- Customer Satisfaction Questionnaire (8 items): α = 0.842
- Overall omnichannel strategy and customer satisfaction,
- Each of the three omnichannel dimensions (data, payment, logistics) and satisfaction scores.
- 0.00–0.19 = very weak;
- 0.20–0.39 = weak;
- 0.40–0.59 = moderate;
- 0.60–0.79 = strong;
- 0.80–1.00 = very strong.
4. Results
4.1. Description of the Omnichannel Variable
4.2. Description of the Satisfaction Variable
4.3. Hypothesis Testing
4.3.1. Data Normality and the General Hypothesis Test
4.3.2. Testing Specific Hypotheses
4.3.3. Additional Multivariate Analysis: Linear Regression
5. Discussion
5.1. General Interpretation of Findings
5.2. Theoretical and Practical Implications
- Data centralization and synchronization, to ensure that users encounter coherent, accurate, and personalized information across all platforms.
- Logistics transparency and flexibility, as users value the ability to select pickup or delivery options and trust services that fulfill promises reliably.
- The incremental introduction of digital payment options, accompanied by user education, interface simplicity, and the retention of cash alternatives to avoid alienating less digitally fluent customers.
5.3. Implications for Inclusive Digital Transformation and Net-Living
- Accessibility: ensuring that systems can be used by people regardless of income, education, or digital literacy.
- Responsiveness: enabling feedback loops that adjust service behavior in real time.
- Simplicity: reducing cognitive and procedural burdens that discourage use or that lead to abandonment.
6. Conclusions
Author Contributions
Funding
Data Availability Statement
Conflicts of Interest
Abbreviations
| AI | Artificial Intelligence |
| EDP | Expectancy–Disconfirmation Paradigm |
| ICT | Information and Communication Technologies |
| QoE | Quality of Experience |
| SPSS | Statistical Package for the Social Sciences |
Appendix A

| Variables | Dimensions | Indicators | Items |
|---|---|---|---|
| Variable 1: Omnichannel | Data | Product information | 1. The service station displays images and prices of its products on its various interaction channels. |
| 2. The service station provides specific information about the characteristics of the products it offers through its various interaction channels. | |||
| 3. The service station provides information about the available stock of each product through its various interaction channels. | |||
| Customized information according to the client | 4. The service station offers personalized service to each customer based on their needs or purchasing history, regardless of the interaction channel used. | ||
| Omnichannel Payment | Centralized and updated information in real time across all channels | 5. The service station displays centralized and up-to-date information about its products on its various service channels. | |
| Information about the level of customer loyalty | 6. The service station periodically asks its customers if they would recommend its services to other customers or family members. | ||
| Cash payments | 7. The service station accepts cash payments and provides exact change for every transaction. | ||
| Card payments at the physical location | 8. The service station accepts card payments at its physical location. | ||
| Card payments on digital channels | 9. The service station accepts card payments through its various digital channels. | ||
| Payments with digital wallets | 10. The service station accepts payments using digital wallets, such as YAPE or PLIN. | ||
| Omnichannel Logistics | Option to pick up products in a physical store | 11. The service station allows customers to purchase products from any channel and to schedule pickup at the physical location. | |
| Product shipping option | 12. The service station allows customers to purchase products from any channel and schedule delivery to a designated location. | ||
| Variable 2: Satisfaction | Expectations | Customer Expectations | 1. When I purchase a product from the service station, I expect personalized service tailored to my needs. |
| 2. The service station meets my expectations of reliability, meaning that it is available when I need to make a purchase, and its products usually meet my needs. | |||
| Perceived Value | Core product benefit | 3. The products offered by the service station offer reasonable performance in terms of my expectations. | |
| Benefit of complementary products | 4. The service received through the various service channels at the service station is reasonably good in terms of my expectations. | ||
| Monetary costs | 5. The prices of the products at the service station are reasonable. | ||
| 6. Omnichannel payment channels are free of commissions or additional payments. | |||
| Non-monetary costs | 7. The wait time for service at the service station is reasonable. | ||
| 8. The service station provides omnichannel services that reduce wait times. |
References
- Tondeur, J.; Howard, S.; Carvalho, A.A.; Kral, M.; Petko, D.; Ganesh, L.T.; Røkenes, F.M.; Starkey, L.; Bower, M.; Redmond, P.; et al. The DTALE Model: Designing Digital and Physical Spaces for Integrated Learning Environments. Technol. Knowl. Learn. 2024, 29, 1767–1789. [Google Scholar] [CrossRef]
- Piardi, L.; Leitão, P.; Queiroz, J.; Pontes, J. Role of digital technologies to enhance the human integration in industrial cyber–physical systems. Annu. Rev. Control 2024, 57, 100934. [Google Scholar] [CrossRef]
- Verhoef, P.C.; Kannan, P.; Inman, J.J. From Multi-Channel Retailing to Omni-Channel Retailing: Introduction to the special issue on multi-channel retailing. J. Retail. 2015, 91, 174–181. [Google Scholar] [CrossRef]
- Chatterjee, S.; Chaudhuri, R.; Vrontis, D. Examining the global retail apocalypse during the COVID-19 pandemic using strategic omnichannel management: A consumers’ data privacy and data security perspective. J. Strat. Mark. 2021, 29, 617–632. [Google Scholar] [CrossRef]
- Magliocca, P.; Faggioni, F.; Muto, V.; Caputo, F. Technology readiness and digital gap for depicting socio-economic dynamics in society 5.0: A meso-level observation. J. Technol. Transf. 2024, 1–17. [Google Scholar] [CrossRef]
- Yusof, Y.; Amirah, N.A.; Haron, N.F.; Mustafa, W.A.; Zin, Z.M.; Jusoh, M.Y.F.; Dhavaleshwar, C. Community Readiness Towards Digitalization: A Comprehensive Review. J. Adv. Res. Appl. Sci. Eng. Technol. 2025, 56, 157–179. [Google Scholar] [CrossRef]
- Lemon, K.N.; Verhoef, P.C. Understanding Customer Experience Throughout the Customer Journey. J. Mark. 2016, 80, 69–96. [Google Scholar] [CrossRef]
- Mousavi, P.; Shamizanjani, M.; Rahimnia, F.; Mehraeen, M. A metrics-driven approach for customer experience management evaluation: The case of commercial banks in developing countries. TQM J. 2024, 37, 504–524. [Google Scholar] [CrossRef]
- Agag, G.; Durrani, B.A.; Shehawy, Y.M.; Alharthi, M.; Alamoudi, H.; El-Halaby, S.; Hassanein, A.; Abdelmoety, Z.H. Understanding the link between customer feedback metrics and firm performance. J. Retail. Consum. Serv. 2023, 73, 103301. [Google Scholar] [CrossRef]
- Asociación Mexicana de Venta Online. Libro Blanco: Omnicanalidad en Ecommerce. Asociación Mexicana de Venta Online. Available online: https://issuu.com/im_gav/docs/amvo_libro_blanco (accessed on 5 April 2025).
- Sharma, N.; Fatima, J.K. Influence of perceived value on omnichannel usage: Mediating and moderating roles of the omnichannel shopping habit. J. Retail. Consum. Serv. 2024, 77, 103627. [Google Scholar] [CrossRef]
- Yang, Z.; Hu, D.; Chen, X. The role of omnichannel integration and digital value in building brand trust: A customer psychological perception perspective. Internet Res. 2024. ahead-of-print. [Google Scholar] [CrossRef]
- Hasselgren, B.; Chrysoulas, C.; Pitropakis, N.; Buchanan, W.J. Using Social Media & Sentiment Analysis to Make Investment Decisions. Futur. Internet 2023, 15, 5. [Google Scholar] [CrossRef]
- Puengwattanapong, P.; Leelasantitham, A. A Holistic Perspective Model of Plenary Online Consumer Behaviors for Sustainable Guidelines of the Electronic Business Platforms. Sustainability 2022, 14, 6131. [Google Scholar] [CrossRef]
- Pozza, I.D. The role of proximity in omnichannel customer experience: A service logic perspective. J. Serv. Manag. 2022, 33, 774–786. [Google Scholar] [CrossRef]
- Gerea, C.; Gonzalez-Lopez, F.; Herskovic, V. Omnichannel Customer Experience and Management: An Integrative Review and Research Agenda. Sustainability 2021, 13, 2824. [Google Scholar] [CrossRef]
- Gerea, C.; Herskovic, V. Transitioning from Multichannel to Omnichannel Customer Experience in Service-Based Companies: Challenges and Coping Strategies. J. Theor. Appl. Electron. Commer. Res. 2022, 17, 394–413. [Google Scholar] [CrossRef]
- Schweidel, D.A.; Bart, Y.; Inman, J.J.; Stephen, A.T.; Libai, B.; Andrews, M.; Rosario, A.B.; Chae, I.; Chen, Z.; Kupor, D.; et al. How consumer digital signals are reshaping the customer journey. J. Acad. Mark. Sci. 2022, 50, 1257–1276. [Google Scholar] [CrossRef]
- Gao, Y.; Liu, H. Artificial intelligence-enabled personalization in interactive marketing: A customer journey perspective. J. Res. Interact. Mark. 2022, 17, 663–680. [Google Scholar] [CrossRef]
- Barbosa, B.; Saura, J.R.; Bennett, D. How do entrepreneurs perform digital marketing across the customer journey? A review and discussion of the main uses. J. Technol. Transf. 2022, 49, 69–103. [Google Scholar] [CrossRef]
- Ciasullo, M.V.; Montera, R.; Mercuri, F.; Mugova, S. When Digitalization Meets Omnichannel in International Markets: A Case Study from the Agri-Food Industry. Adm. Sci. 2022, 12, 68. [Google Scholar] [CrossRef]
- Gao, W.; Fan, H.; Li, W.; Wang, H. Crafting the customer experience in omnichannel contexts: The role of channel integration. J. Bus. Res. 2021, 126, 12–22. [Google Scholar] [CrossRef]
- Oliver, R.L. A Cognitive Model of the Antecedents and Consequences of Satisfaction Decisions. J. Mark. Res. 1980, 17, 460–469. [Google Scholar] [CrossRef]
- Schiebler, T.; Lee, N.; Brodbeck, F.C. Expectancy-disconfirmation and consumer satisfaction: A meta-analysis. J. Acad. Mark. Sci. 2025, 1–22. [Google Scholar] [CrossRef]
- Ramasamy, G.; Ramasamy, G.D.; Ramasamy, P. Conceptual review of consumer satisfaction theories with expectation-confirmation and disconfirmation paradigm for business sustainable growth and decision making. F1000Research 2024, 13, 1399. [Google Scholar] [CrossRef]
- Zhang, J.; Chen, W.; Petrovsky, N.; Walker, R.M. The Expectancy-Disconfirmation Model and Citizen Satisfaction with Public Services: A Meta-analysis and an Agenda for Best Practice. Public Adm. Rev. 2021, 82, 147–159. [Google Scholar] [CrossRef]
- Lee, C.-P.; Hung, M.-J.; Chen, D.-Y. Factors affecting citizen satisfaction: Examining from the perspective of the expectancy disconfirmation theory and individual differences. Asian J. Politi-Sci. 2022, 30, 35–60. [Google Scholar] [CrossRef]
- Antonides, G.; Hovestadt, L. Product Attributes, Evaluability, and Consumer Satisfaction. Sustainability 2021, 13, 12393. [Google Scholar] [CrossRef]
- Yum, K.; Yoo, B. The Impact of Service Quality on Customer Loyalty through Customer Satisfaction in Mobile Social Media. Sustainability 2023, 15, 11214. [Google Scholar] [CrossRef]
- Uzir, U.H.; Al Halbusi, H.; Thurasamy, R.; Hock, R.L.T.; Aljaberi, M.A.; Hasan, N.; Hamid, M. The effects of service quality, perceived value and trust in home delivery service personnel on customer satisfaction: Evidence from a developing country. J. Retail. Consum. Serv. 2021, 63, 102721. [Google Scholar] [CrossRef]
- Li, Y.; Gong, X. What Drives Customer Engagement in Omnichannel Retailing? The Role of Omnichannel Integration, Perceived Fluency, and Perceived Flow. IEEE Trans. Eng. Manag. 2022, 71, 797–809. [Google Scholar] [CrossRef]
- Roldán, J.L.; Leal-Rodríguez, A.L.; Leal-Millán, A.G. Omnichannel customer experience: Key drivers and future research directions. J. Bus. Res. 2022, 139, 1255–1260. [Google Scholar] [CrossRef]
- Zhou, T.; Long, Q.; Law, K.M.; Wu, C. Multi-objective stochastic project scheduling with alternative execution methods: An improved quantum-behaved particle swarm optimization approach. Expert Syst. Appl. 2022, 203, 117029. [Google Scholar] [CrossRef]
- Yin, C.-C. Integrating or tailoring? Optimizing touchpoints for enhanced omnichannel customer experience. J. Res. Interact. Mark. 2024. ahead-of-print. [Google Scholar] [CrossRef]
- Sharma, S.; Kang, D.H.; de Oca, J.R.M.; Mudgal, A. Machine learning methods for commercial vehicle wait time prediction at a border crossing. Res. Transp. Econ. 2021, 89, 101034. [Google Scholar] [CrossRef]
- Quiñones, D.; Rojas, L. Understanding the customer experience in human-computer interaction: A systematic literature review. PeerJ Comput. Sci. 2023, 9, e1219. [Google Scholar] [CrossRef]
- Lazaris, C.; Sarantopoulos, P.; Vrechopoulos, A.; Doukidis, G. Effects of Increased Omnichannel Integration on Customer Satisfaction and Loyalty Intentions. Int. J. Electron. Commer. 2021, 25, 440–468. [Google Scholar] [CrossRef]
- Thaichon, P.; Quach, S.; Barari, M.; Nguyen, M. Exploring the Role of Omnichannel Retailing Technologies: Future Research Directions. Australas. Mark. J. 2023, 32, 162–177. [Google Scholar] [CrossRef]
- Djofack, S.; Ndeme, R.N.; Wamba, S.F. Assessing omnichannel strategies for global retailing industries in a developing country. J. Strat. Mark. 2021, 31, 655–668. [Google Scholar] [CrossRef]
- de Castro, V.; Martín-Peña, M.L.; Martínez, E.M.; Salgado, M. Combining Action Research With Design Science as a Qualitative Research Methodology. An Application to Service (Operations) Management Research. Int. J. Qual. Methods 2025, 24, 16094069241312018. [Google Scholar] [CrossRef]
- Maier, C.; Thatcher, J.B.; Grover, V.; Dwivedi, Y.K. Cross-sectional research: A critical perspective, use cases, and recommendations for IS research. Int. J. Inf. Manag. 2023, 70, 102625. [Google Scholar] [CrossRef]
- Joshi, S.; Sharma, M.; Chatterjee, P. Omni-Channel retailing enhancing unified experience amidst pandemic: An emerging market perspective. Decis. Making Appl. Manag. Eng. 2023, 6, 449–473. [Google Scholar] [CrossRef]
- Zhu, B.; Pan, X.; Broucke, S.V.; Xiao, J. A GAN-based hybrid sampling method for imbalanced customer classification. Inf. Sci. 2022, 609, 1397–1411. [Google Scholar] [CrossRef]
- Stević, Ž.; Tanackov, I.; Puška, A.; Jovanov, G.; Vasiljević, J.; Lojaničić, D. Development of Modified SERVQUAL–MCDM Model for Quality Determination in Reverse Logistics. Sustainability 2021, 13, 5734. [Google Scholar] [CrossRef]
- Jiang, J.; Zhang, X.; Yuan, Z. Feature selection for classification with Spearman’s rank correlation coefficient-based self-information in divergence-based fuzzy rough sets. Expert Syst. Appl. 2024, 249, 123633. [Google Scholar] [CrossRef]
- Zhou, T.; Chen, Z.; Cao, Y.; Miao, R.; Ming, X. An integrated framework of user experience-oriented smart service requirement analysis for smart product service system development. Adv. Eng. Inform. 2022, 51, 101458. [Google Scholar] [CrossRef]


| Criterion | Multichannel Management | Omnichannel Management |
| Channel focus | Interactive channels only | Interactive and mass communication channels |
| Channel scope | Retail sales channels | Retail channels, mobile channels, and customer touchpoints |
| Channel separation | Separate channels without overlap | Integrated channels that deliver seamless retail experiences |
| Goals | Channel objectives (sales experience by channel) | Multichannel objectives (overall retail customer experience) |
| Variables | Dimensions | Indicators | Scale of Measurement |
|---|---|---|---|
| Variable 1: Omnichannel | Data | Product information. Customized information according to the client. Centralized and updated information in real time across all channels. Reports on customer loyalty level. |
|
| Omnichannel payment | Cash payments. Card payments at the physical location. Card payments on digital channels. Payments with digital wallets. | ||
| Omnichannel logistics | Option to pick up products in a physical store. Product shipping option. | ||
| Variable 2: Satisfaction | Expectations | Customer expectations. |
|
| Perceived value | Core product benefit. Benefit of complementary products. Monetary costs. Non-monetary costs. |
| Level | Scale | fi | % |
|---|---|---|---|
| Low | From 12 to 28 | 65 | 60.19% |
| Half | From 29 to 45 | 32 | 29.63% |
| High | From 46 to 60 | 11 | 10.19% |
| Total | 108 | 100.00% |
| Level | Scale | fi | % |
|---|---|---|---|
| Low | From 6 to 14 | 74 | 68.52% |
| Half | From 3 to 11 pm | 22 | 20.37% |
| High | From 24 to 30 | 12 | 11.11% |
| Total | 108 | 100.00% |
| Level | Scale | fi | % |
|---|---|---|---|
| Low | From 4 to 9 | 21 | 19.44% |
| Half | From 10 to 15 | 66 | 61.11% |
| High | From 16 to 20 | 21 | 19.44% |
| Total | 108 | 100.00% |
| Level | Scale | fi | % |
|---|---|---|---|
| Low | From 2 to 4 | 20 | 18.52% |
| Half | From 5 to 7 | 62 | 57.41% |
| High | From 8 to 10 | 26 | 24.07% |
| Total | 108 | 100.00% |
| Level | Scale | fi | % |
|---|---|---|---|
| Low | From 8 to 18 | 45 | 41.67% |
| Medium | From 19 to 29 | 51 | 47.22% |
| High | From 30 to 40 | 12 | 11.11% |
| Total | 108 | 100.00% |
| Level | Scale | fi | % |
|---|---|---|---|
| Low | From 2 to 4 | 47 | 43.52% |
| Medium | From 5 to 7 | 51 | 47.22% |
| High | From 8 to 10 | 10 | 9.26% |
| Total | 108 | 100.00% |
| Level | Scale | fi | % |
|---|---|---|---|
| Low | From 6 to 14 | 50 | 46.30% |
| Medium | From 3 to 11 pm | 45 | 41.67% |
| High | From 24 to 30 | 13 | 12.04% |
| Total | 108 | 100.00% |
| Kolmogorov–Smirnov (n > 50) | |||
|---|---|---|---|
| Statistical | df | Sig. | |
| Omnichannel | 0.167 | 108 | 0.000 |
| Satisfaction | 0.140 | 108 | 0.000 |
| Satisfaction | |||
|---|---|---|---|
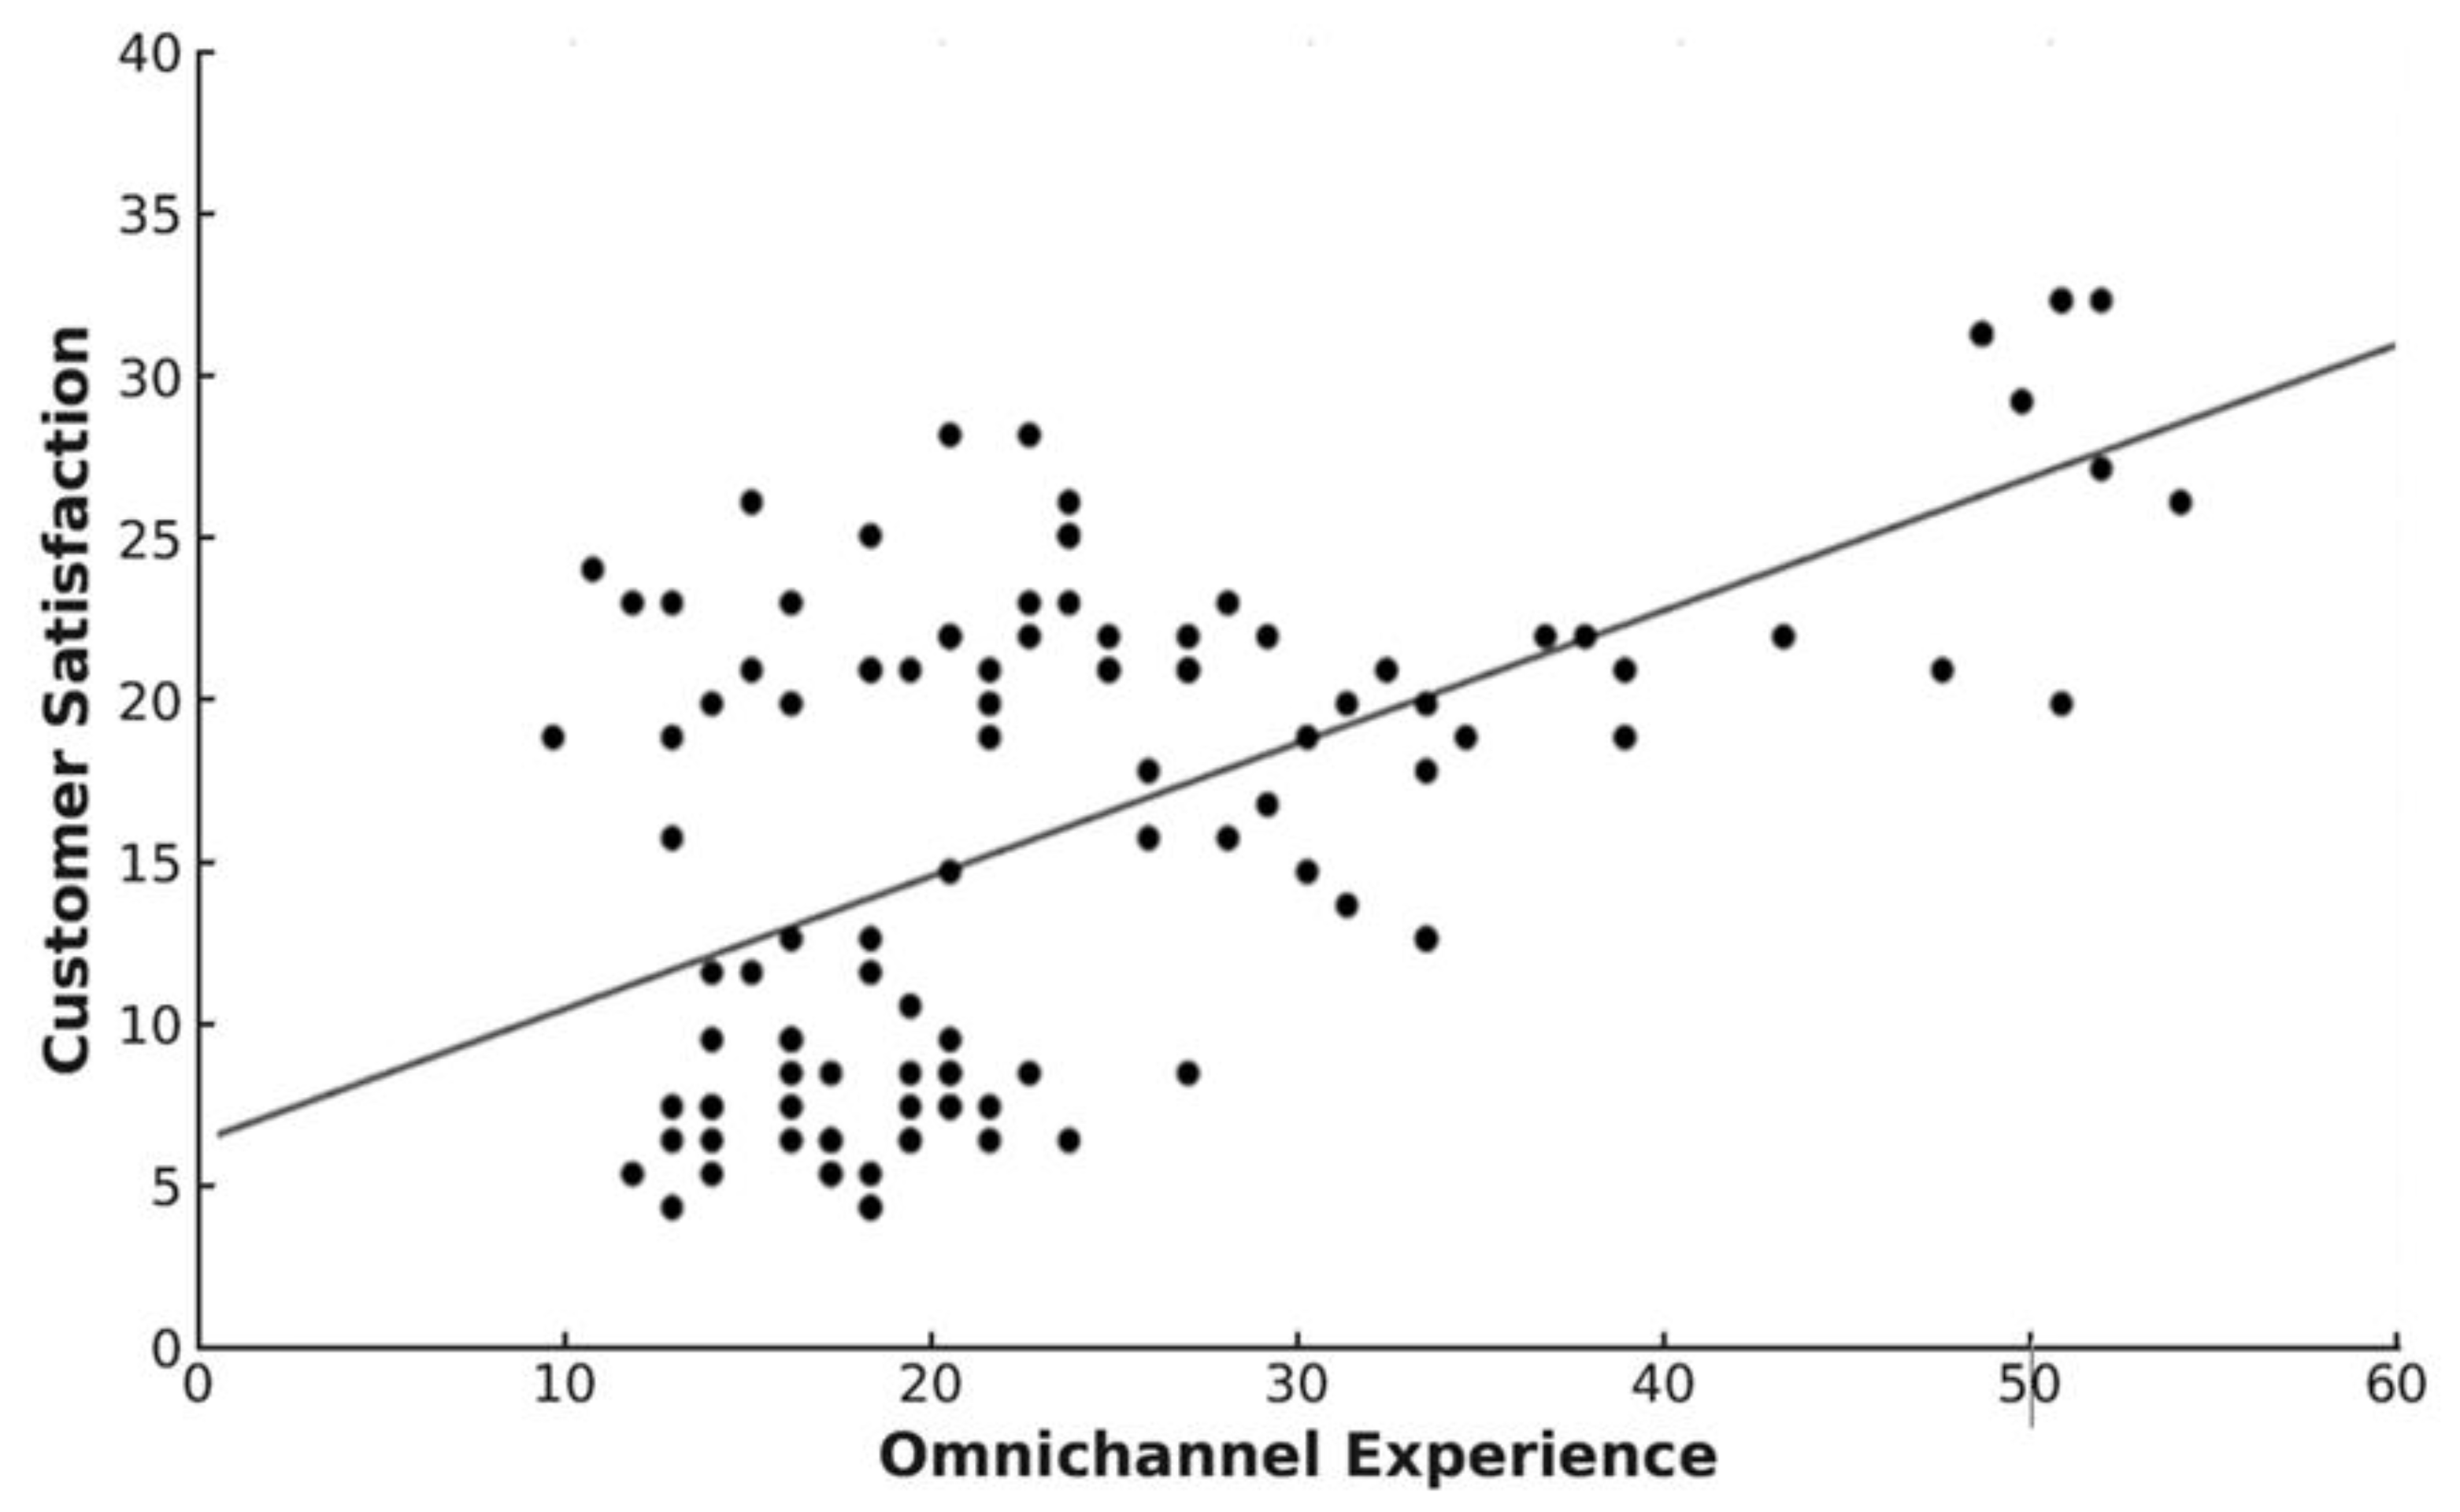
| Spearman’s Rho | Omnichannel | Correlation coefficient | 0.555 |
| Sig. (bilateral) | 0.000 | ||
| N | 108 | ||
| Satisfaction | |||
|---|---|---|---|
| Spearman’s Rho | Data | Correlation coefficient | 0.531 |
| Sig. (bilateral) | 0.000 | ||
| N | 108 | ||
| Satisfaction | |||
|---|---|---|---|
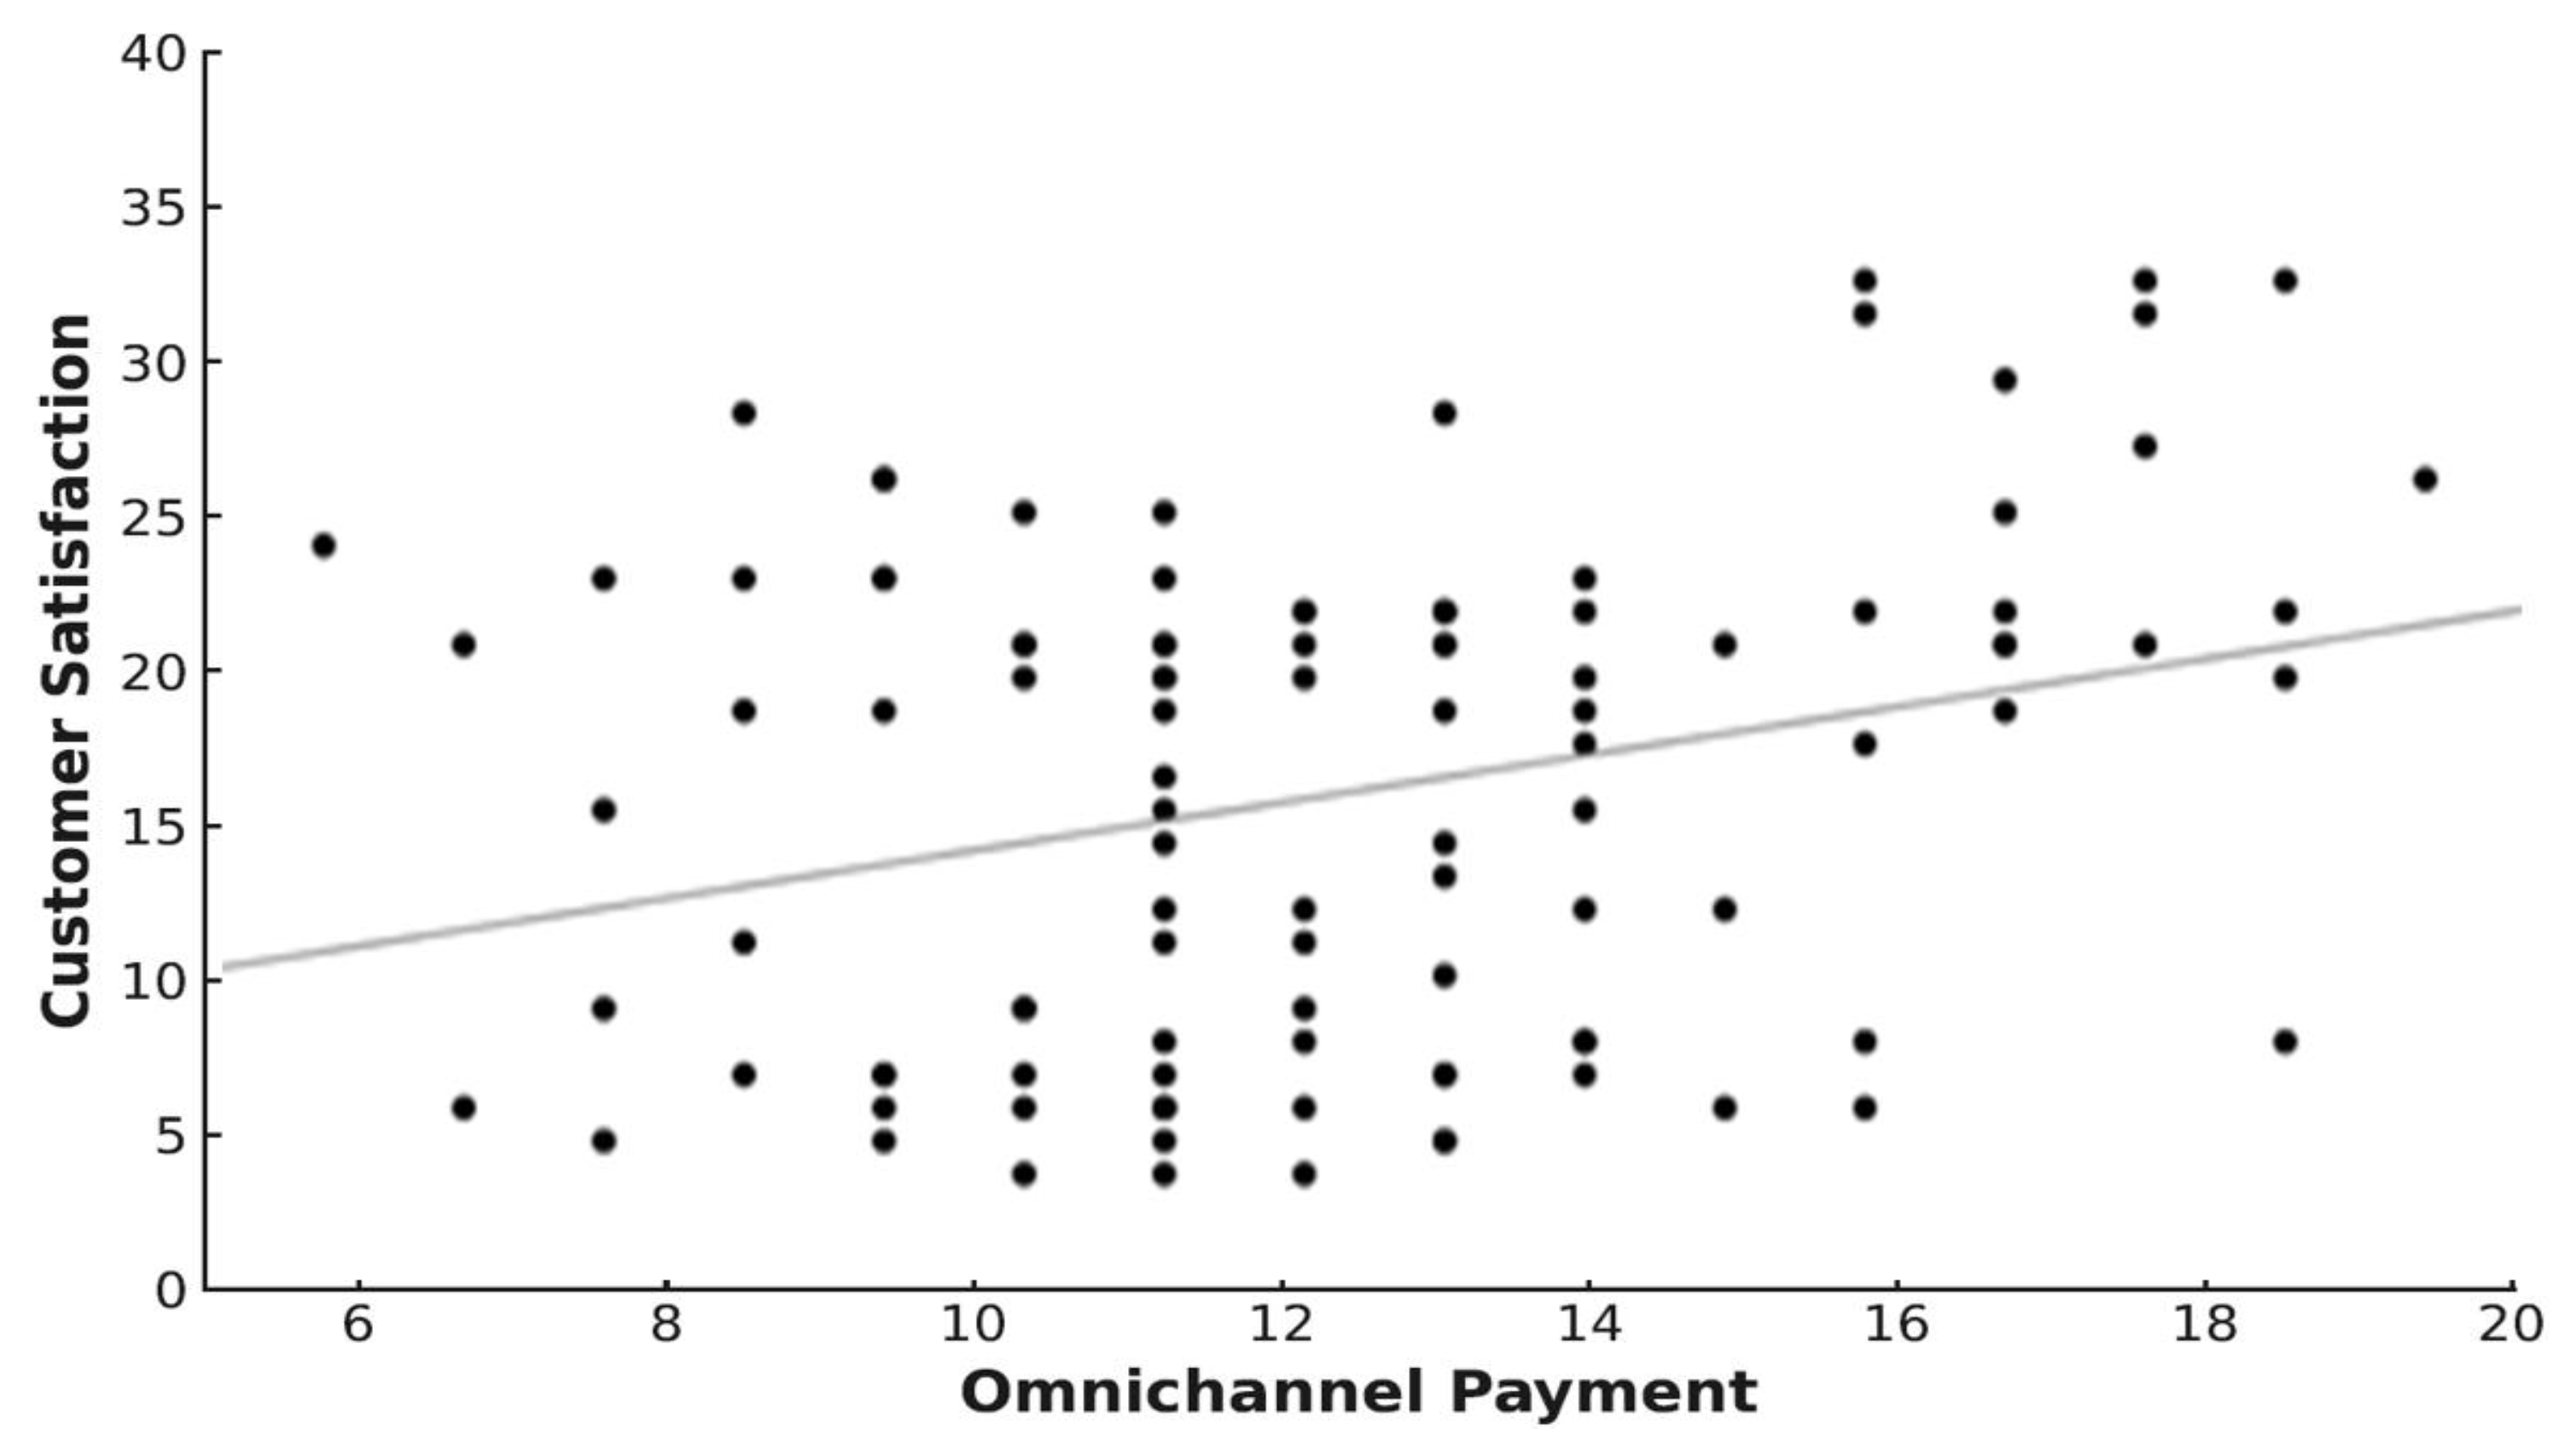
| Spearman’s Rho | Omnichannel payment | Correlation coefficient | 0.234 |
| Sig. (bilateral) | 0.000 | ||
| N | 108 | ||
| Satisfaction | |||
|---|---|---|---|
| Spearman’s Rho | Omnichannel logistics | Correlation coefficient | 0.498 |
| Sig. (bilateral) | 0.000 | ||
| N | 108 | ||
| Predictor | β | Std. Error | t | p-Value |
|---|---|---|---|---|
| Constant | 25.877 | 2.890 | 8.955 | 0.000 |
| Data | 0.060 | 0.102 | 0.586 | 0.559 |
| Omnichannel Payment | −0.066 | 0.142 | −0.467 | 0.642 |
| Logistics | −0.349 | 0.212 | −1.644 | 0.103 |
Disclaimer/Publisher’s Note: The statements, opinions and data contained in all publications are solely those of the individual author(s) and contributor(s) and not of MDPI and/or the editor(s). MDPI and/or the editor(s) disclaim responsibility for any injury to people or property resulting from any ideas, methods, instructions or products referred to in the content. |
© 2025 by the authors. Licensee MDPI, Basel, Switzerland. This article is an open access article distributed under the terms and conditions of the Creative Commons Attribution (CC BY) license (https://creativecommons.org/licenses/by/4.0/).
Share and Cite
Moreno-Menéndez, F.M.; Zacarías-Rodríguez, V.E.; Zacarías-Vallejos, S.R.; González-Prida, V.; Torres-Quillatupa, P.E.; Romero-Girón, H.; Rada-Vittes, J.F.V.y.; Huaynate-Espejo, L.Á. Enhancing Customer Quality of Experience Through Omnichannel Digital Strategies: Evidence from a Service Environment in an Emerging Context. Future Internet 2025, 17, 240. https://doi.org/10.3390/fi17060240
Moreno-Menéndez FM, Zacarías-Rodríguez VE, Zacarías-Vallejos SR, González-Prida V, Torres-Quillatupa PE, Romero-Girón H, Rada-Vittes JFVy, Huaynate-Espejo LÁ. Enhancing Customer Quality of Experience Through Omnichannel Digital Strategies: Evidence from a Service Environment in an Emerging Context. Future Internet. 2025; 17(6):240. https://doi.org/10.3390/fi17060240
Chicago/Turabian StyleMoreno-Menéndez, Fabricio Miguel, Victoriano Eusebio Zacarías-Rodríguez, Sara Ricardina Zacarías-Vallejos, Vicente González-Prida, Pedro Emil Torres-Quillatupa, Hilario Romero-Girón, José Francisco Vía y Rada-Vittes, and Luis Ángel Huaynate-Espejo. 2025. "Enhancing Customer Quality of Experience Through Omnichannel Digital Strategies: Evidence from a Service Environment in an Emerging Context" Future Internet 17, no. 6: 240. https://doi.org/10.3390/fi17060240
APA StyleMoreno-Menéndez, F. M., Zacarías-Rodríguez, V. E., Zacarías-Vallejos, S. R., González-Prida, V., Torres-Quillatupa, P. E., Romero-Girón, H., Rada-Vittes, J. F. V. y., & Huaynate-Espejo, L. Á. (2025). Enhancing Customer Quality of Experience Through Omnichannel Digital Strategies: Evidence from a Service Environment in an Emerging Context. Future Internet, 17(6), 240. https://doi.org/10.3390/fi17060240