Article

Analysis of Digital Skills and Infrastructure in EU Countries Based on DESI 2024 Data

by
Kvitoslava Obelovska
1,*,
Andrii Abziatov
1,
Anastasiya Doroshenko
1,
Ivanna Dronyuk
2,*,
Oleh Liskevych
1 and
Rostyslav Liskevych
3
1
Department of Automated Control Systems, Lviv Polytechnic National University, 79-013 Lviv, Ukraine
2
Mathematics and Informatics Department, Jan Dlugosz University in Czestochowa, 42-200 Czestochowa, Poland
3
Interregional Academy of Personnel Management, Frometivska Str., 2, 03-039 Kyiv, Ukraine
*
Authors to whom correspondence should be addressed.
Future Internet 2025, 17(6), 228; https://doi.org/10.3390/fi17060228
Submission received: 15 April 2025 / Revised: 6 May 2025 / Accepted: 19 May 2025 / Published: 22 May 2025
(This article belongs to the Special Issue ICT and AI in Intelligent E-systems)

Abstract

:
This paper presents an analysis of digital skills and network infrastructure in the European Union (EU) countries based on data from the Digital Economy and Society Index (DESI) 2024. We analyze the current state of digital skills and network infrastructure in EU countries, which in the DESI framework is called digital infrastructure, identifying key trends and differences between EU member states. The analysis shows significant differences in the relative share of citizens with a certain level of digital skills across countries, both among ordinary users of digital services and among information and communication technology professionals. The analysis of digital infrastructure includes fixed broadband coverage, mobile broadband, and edge networks, the latter of which are expected to become an important component of future digital infrastructure. The results highlight the importance of harmonizing the development of digital skills and digital infrastructure to support the EU’s digital transformation. Significant attention is paid to 5G technology. The feasibility of including a new additional indicator in DESI for next-generation 5G technology in the frequency range of 24.25–52.6 GHz is shown. The value of this indicator can be used to assess the readiness of the EU economy for technological leaps that place extremely high demands on reliability and data transmission delays. The results of the current state and the analysis of digital skills and infrastructure contribute to understanding the potential for the future development of the EU digital economy.

1. Introduction

One of the main priorities of the EU countries is the digital transformation of states. The goal of digital transformation is to develop and implement new opportunities and methods in virtually all areas of human activity: education, research, work, medicine, business, and entertainment [1]. The directions of development of the EU digital transformation by 2030 are reflected in the strategic document “The EU Digital Decade”. The political program “The EU Digital Decade by 2030” focuses on such main areas of activity of the countries and governments of the EU member states as secure digital infrastructure and digital skills, digitalization of public services, and digitalization of the economy [2]. This, in turn, aims to clarify the features of the main trends, advantages, and disadvantages of digital transformation in the context of reorganizing the relevant processes in different countries [3,4,5].
The European Union annually conducts a comprehensive monitoring of the digital progress of its member states using the Digital Economy and Society Index (DESI). The latest data is the DESI 2024 data, which allows updating the assessment of the digital transformation and its components: digital competences, network infrastructure, digital public services, and the level of implementation of digital technologies in business and management. Since the level of development of the digital skills of the population and the state of the digital infrastructure are key factors in the socio-economic growth and competitiveness of countries, it is essential to identify bottlenecks in these areas and develop recommendations for their elimination. In this case, it is essential to pay attention to the following contextual factors:
-
Uneven digital development between EU countries, which may create a risk of digital fragmentation of Europe and, as a result, a decrease in the overall level of its digital economy;
-
An insufficient level of digital skills among the population and workers, which will slow down the digital transformation of the labor market and cause low labor productivity;
-
Limited network infrastructure in certain areas, which makes access to modern digital services difficult or impossible.
And, perhaps most importantly, it is necessary to review the relevance of the existing DESI indicators that are being monitored and, if required, develop recommendations for their update.
The main contributions of this paper relate to the state of digitization in the EU countries and can be summarized as follows:
  • An analysis of the digital skills, and the fixed and mobile digital infrastructure of EU countries was analyzed;
  • It has been shown that the successful development of the economy and society requires the harmonization of digital skills and digital infrastructure;
  • It has been shown that the feasibility of adding a new indicator to DESI that would separately consider the 5G technology frequency range (24.25 GHz–52.6 GHz), which would allow assessing the country’s readiness for technological leaps in areas that require extremely low latency and high reliability and speed.

2. Related Works

Achievements in internet communications, which allow the necessary quality of service to be provided in various spheres of human activity, have made the digital economy a constantly developing global phenomenon. Today, doing business online is commonplace, but its further spread requires improved digital technologies.
The development of digital technologies in EU countries is monitored using a composite index that measures and compares the progress of EU countries in the field of digital economy and society. DESI allows for measurement indicators of digital society, digital technologies, and the economy [1,6,7]. Therefore, DESI is the basis and also the object for many studies, for example, on digitalization and convergence analysis [1], on analysis of the state of network infrastructure and recommendations for its deployment and improvement [8], on Sustainable Development Indicators [9], and DESI analysis through cluster analysis [5] and in the Pre- and Post-Pandemic Period [10]. In [11], a reduced and statistically robust version of the DESI that enhances its applicability at the regional level is proposed.
From 2014 to 2022, the DESI provided an overall assessment of Europe’s digital performance and tracked the progress of EU countries. Now, Europe is committed to empowering companies and people in a human-centric, sustainable, prosperous digital future, according to the Digital Decade Policy Programme 2030. Starting in 2023, DESI has continued to be used to monitor Europe’s performance towards the digital goals, but now as part of this program. A description of the current state of the DESI indicators in 27 European countries is available in [12].
At the current stage, the successful development of society and its economy depends on various factors and digital transformation components. In 2021, the European Commission presented the roadmap for Europe’s digital transformation by 2030. It presented these in the form of a digital compass for the EU’s Digital Decade, which contains the following four main components:
  • Skills;
  • Infrastructures;
  • Business;
  • Government.
The digital skills of society members and the high-quality digital infrastructure to which they have access are the basis for improving, implementing, and disseminating digital business and government. Even more crucial is the qualification level of Information Technology (IT) specialists, who will support existing applications, enhance them, and develop new ones. It is very positive that DESI provides data to analyze the state of digital skills separately for consumers of IT services and IT specialists.
Today, the competitiveness of a country’s economy depends on many factors, among which is the implementation of advanced digital network technologies and services [12]. No less important is their harmonization and consistency with the network technologies of other countries. The issue of describing network technologies in terms of their technical characteristics and capabilities is widely presented in the literature today, for example, regarding 5G, 5Ge, and 6G technologies in [13,14,15], cloud networks in [16], the Internet of Things in [17,18], Personal Local Wireless Networks in [19], a mobile robot system in [20], Enterprise Networking in [21], and an Intelligent Edge Environment for Smart Cities in [22]. The IT sector structure and development in all creative industries in the EU countries are considered in [23].
The analysis of sources has shown that DESI indicators are an important basis for many scientific studies. In most cases, this is the study of key aspects of digital transformation in Europe and the analysis of their regional differences. Existing works on the study of DESI indicators consider individual specific indicators. Therefore, a systematic analysis of a certain class of indicators, covering all its currently existing components, is an urgent task. This work is devoted to studying two classes of indicators: digital skills and digital infrastructure. The issue of providing digital infrastructure and the possibility of its effective use to ensure digital transformation, as well as the issue of ensuring a certain level of digital skills, require further analysis. Therefore, analyzing the state of digital skills and network infrastructure in the EU countries is relevant to identifying the challenges countries must address to develop digital transformation successfully.
The work aimed to analyze all existing components of digital skills and digital infrastructure indicators, study their mutual influence, and develop recommendations for the modernization of existing sets of indicators.
To analyze the current possibilities of the European countries’ community to implement “the program “The EU Digital Decade by 2030”, we will base our analysis on the DESI 2024. The current value of the DESI indicator for 27 European countries is presented in [6].

3. Research Tools for Investigation
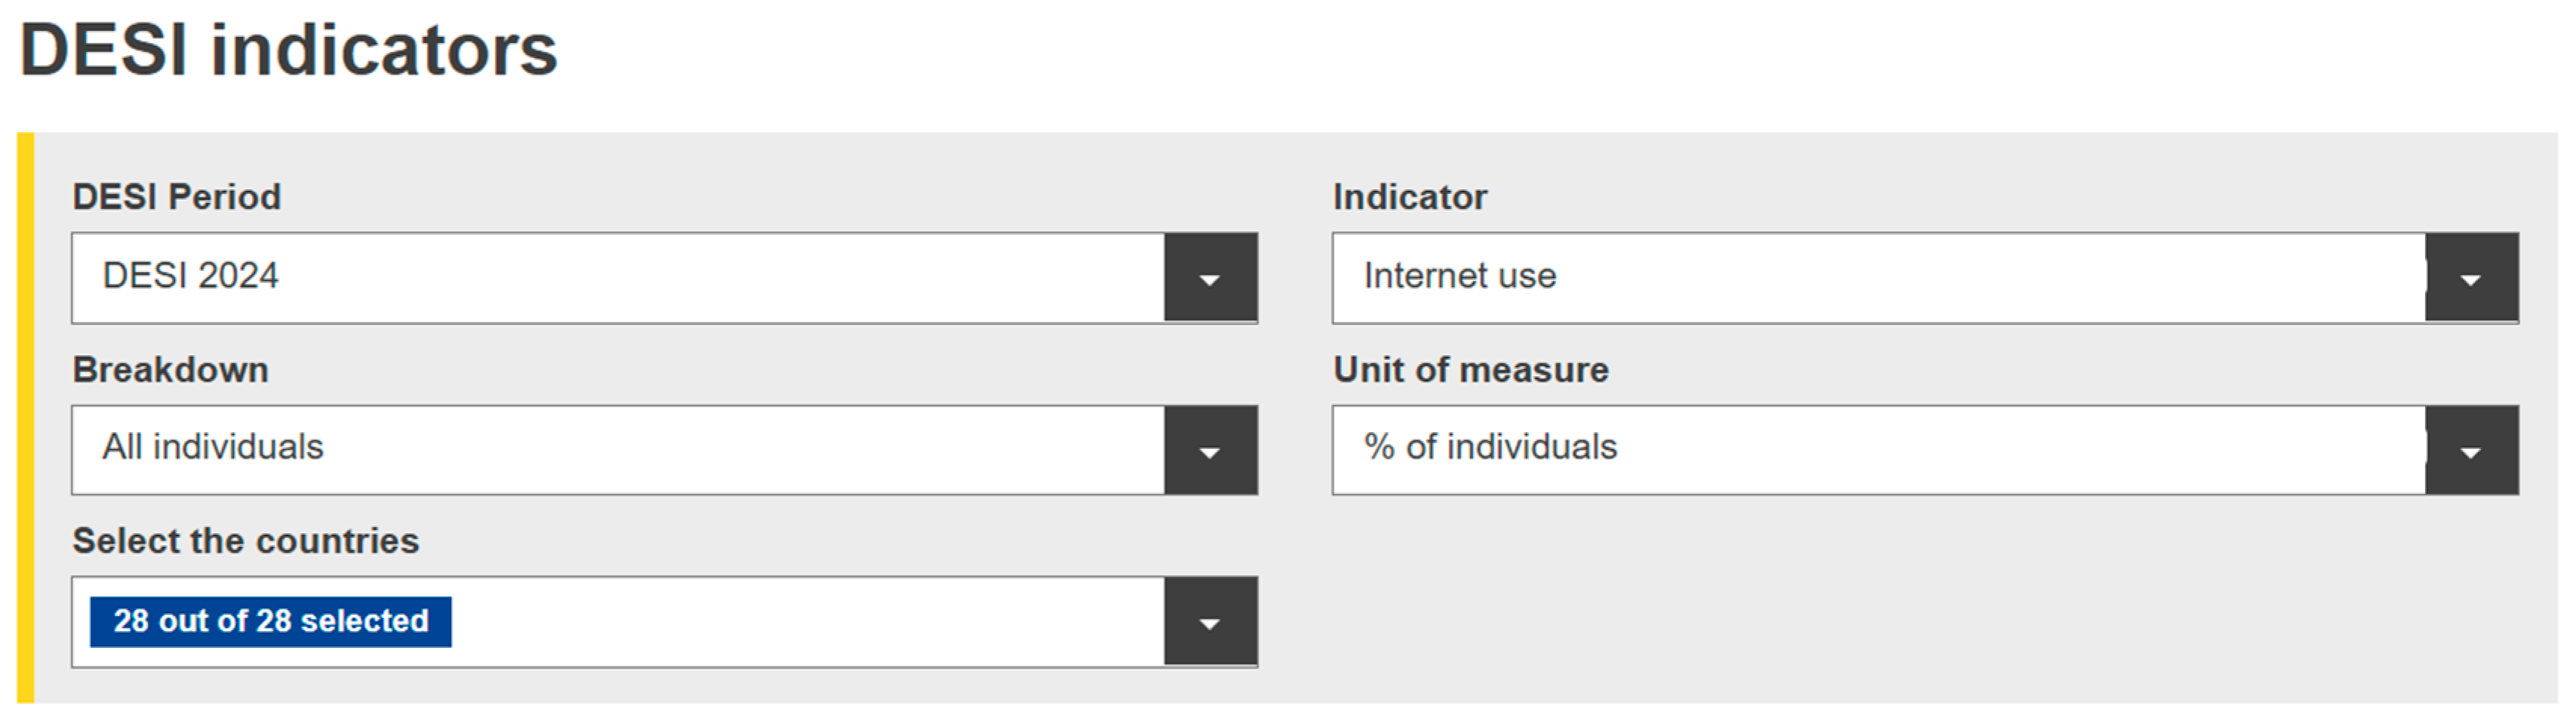
To conduct an analysis to assess the current level of digital development of EU countries, we used the Digital Decade DESI visualization tool [24] developed and offered by the European Commission. This tool provides access to existing structured data on digital transformation in EU member states according to certain key dimensions. The software product developed by the European Commission is a set of visual and analytical tools with a convenient, intuitive interface that provides flexible access to regularly updated data.

DESI Indicators

The tool provides access to detailed digital indicators, grouped into four key components:
  • Human Capital—digital skills and ICT specialists;
  • Connectivity—broadband internet and 5G infrastructure;
  • Integration of Digital Technology—digitalization of business and adoption of advanced technologies;
  • Digital Public Services—availability and use of e-government services.
Users can customize the data selection (Figure 1) using the following parameters:
  • DESI Period—year of observation;
  • Breakdown—structural disaggregation of the index;
  • Select the countries—country selection for comparative analysis;
  • Indicator—specific digital indicator;
  • Unit of measure—unit of measurement (%, index, scale, etc.).
The last component, the unit of measurement, also serves to normalize the data.
It is used for preliminary hypothesis testing in further empirical research and is particularly valuable for uncovering inter-component relationships in the process of digital transformation.
All figures generated by the official DESI analytical tool have a standardized format. This format is informative and ensures comparability of all visualized indicators. In particular, the horizontal axis (X-axis) consistently represents the EU member states, while the vertical axis (Y-axis) displays the value of the selected indicator, usually expressed as a percentage (e.g., percent of enterprises or percent of population). This approach ensures comparability of all visualized indicators.
The presented DESI analytical tool is provided by the European Commission’s Digital Decade Platform and is a reliable and versatile tool for assessing the state and dynamics of digital transformation in the countries of the European Union.
Its modular structure allows the integration of statistical data, visual analytics, and policy insights. DESI is widely used in empirical research, international comparisons, and evidence-based policymaking in the field of the digital economy.

4. Results and Discussion
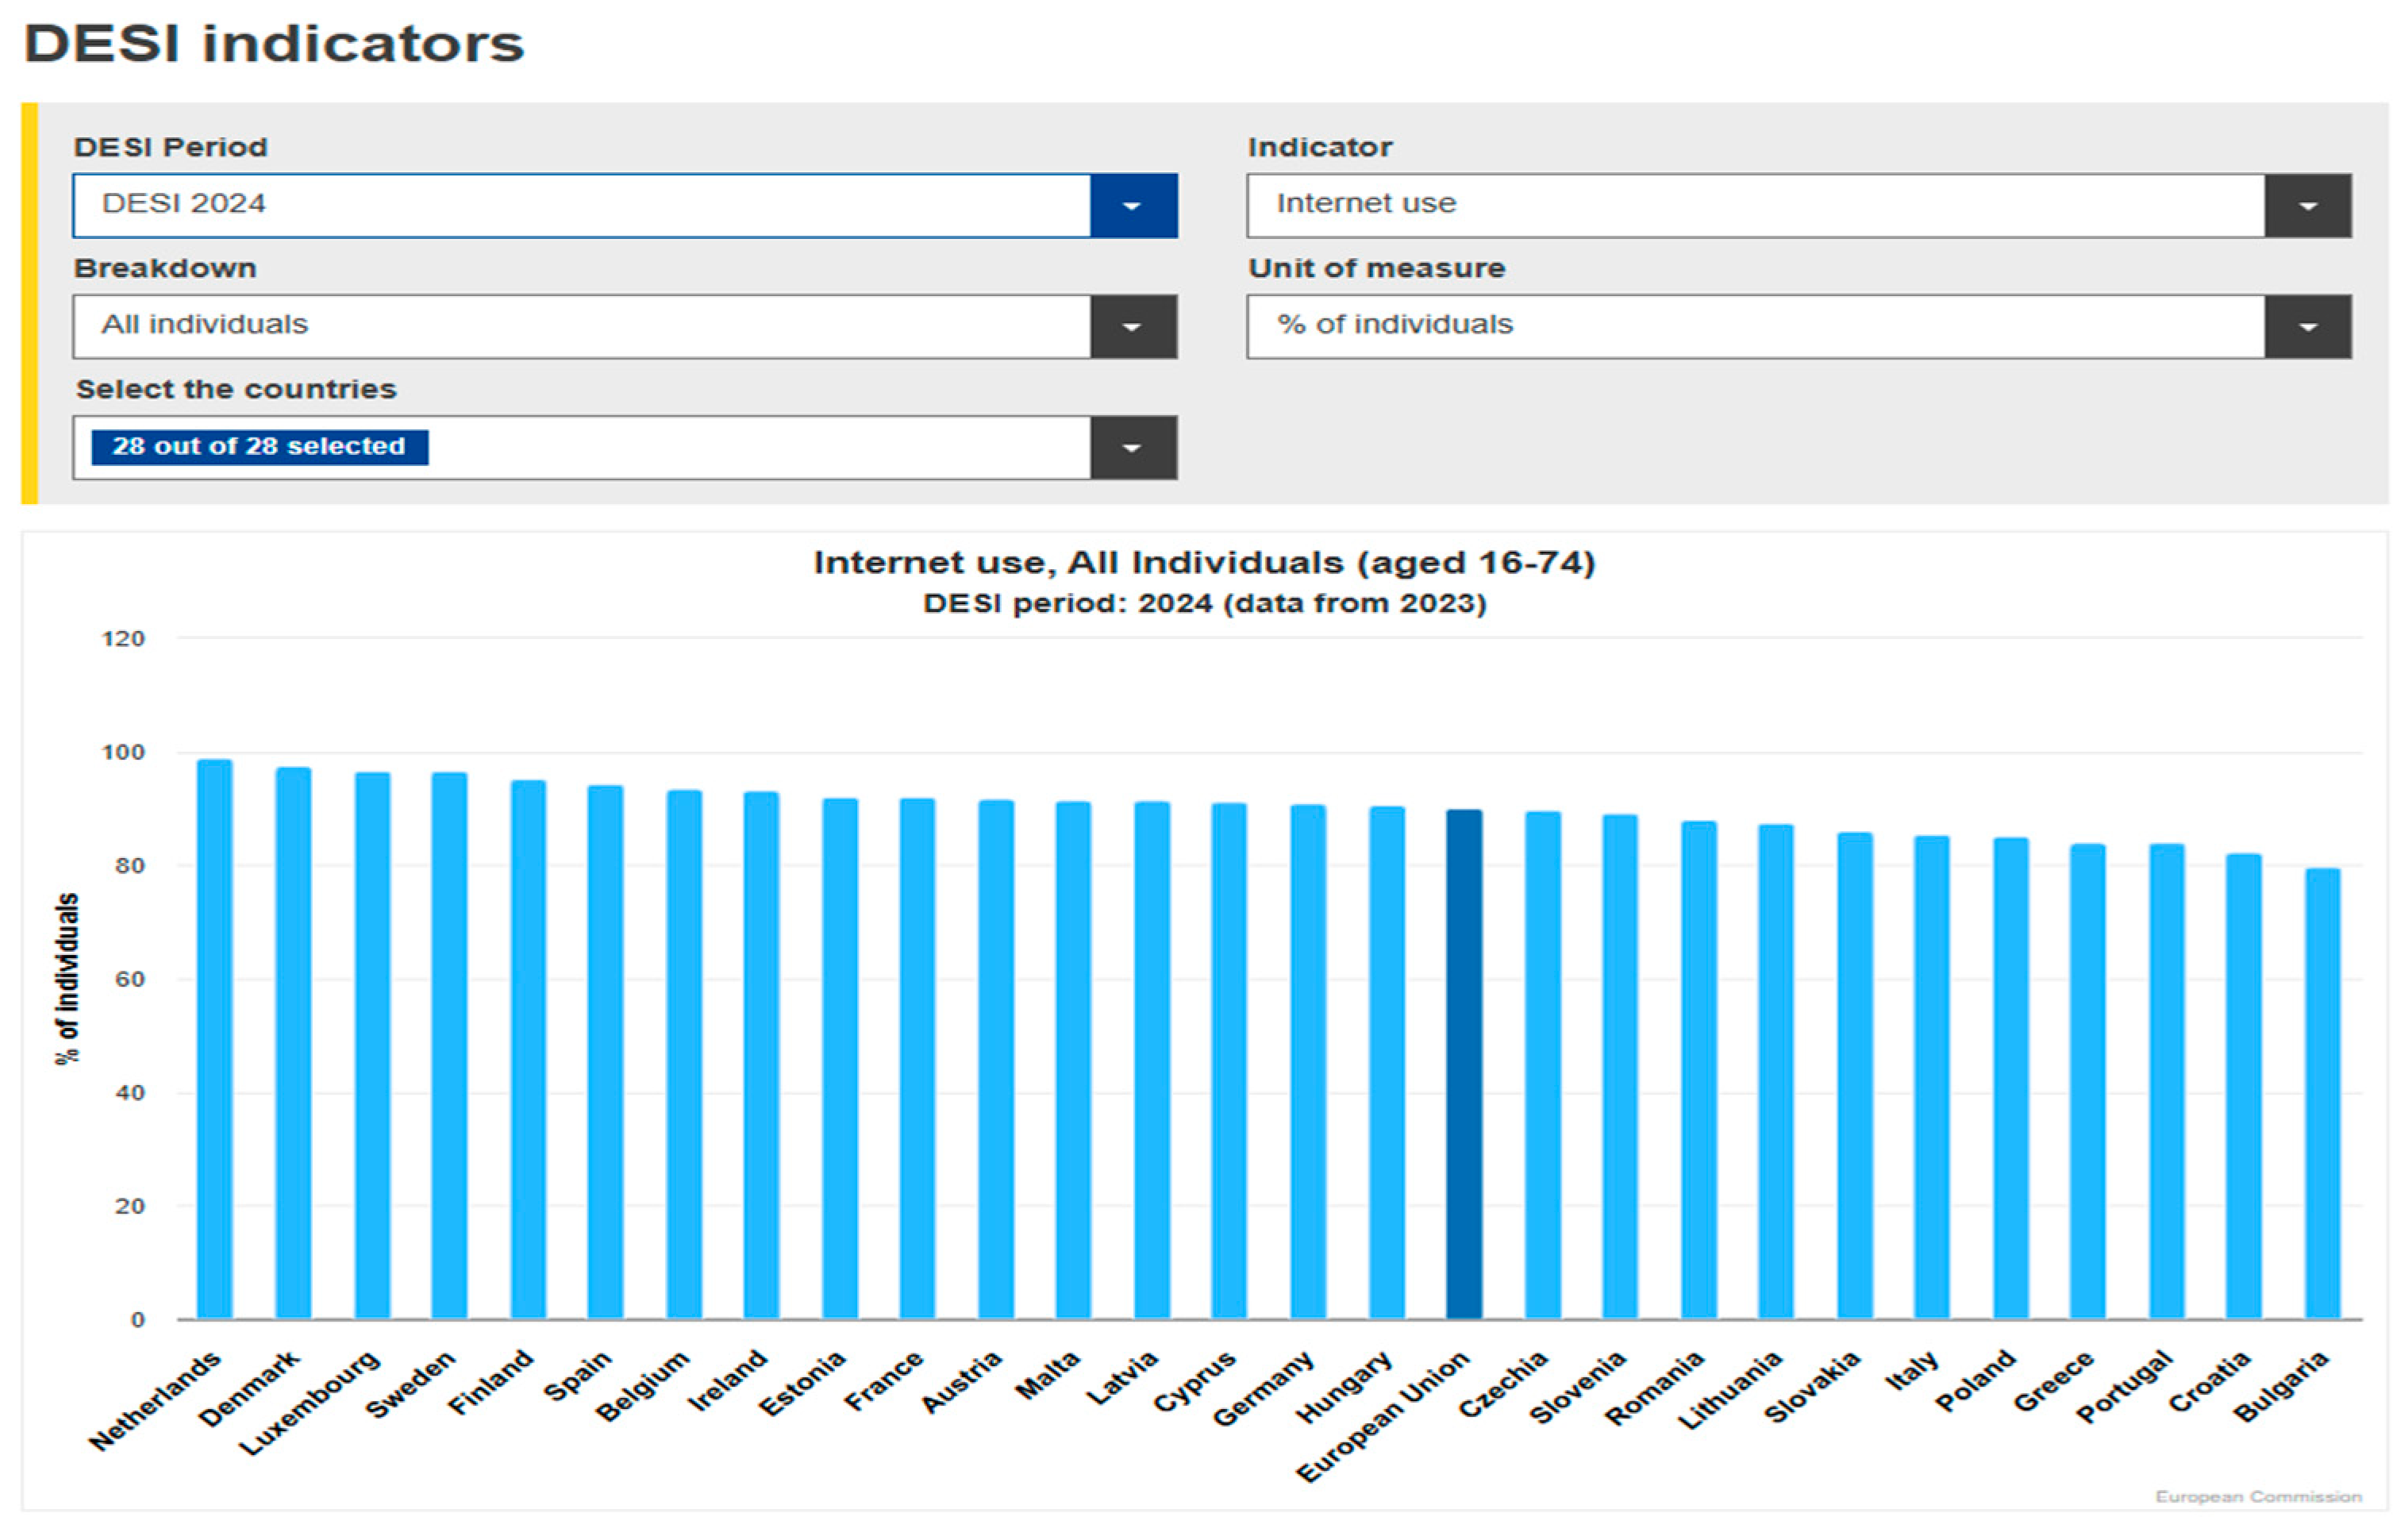
This paper examines two aspects of Europe’s digitalization, digital skills and digital infrastructure, and the impact of one on the other. Let us first look at the direction of digital skills.

4.1. Digital Skills

The following indicators are currently used to characterize digital skills:
  • Internet use;
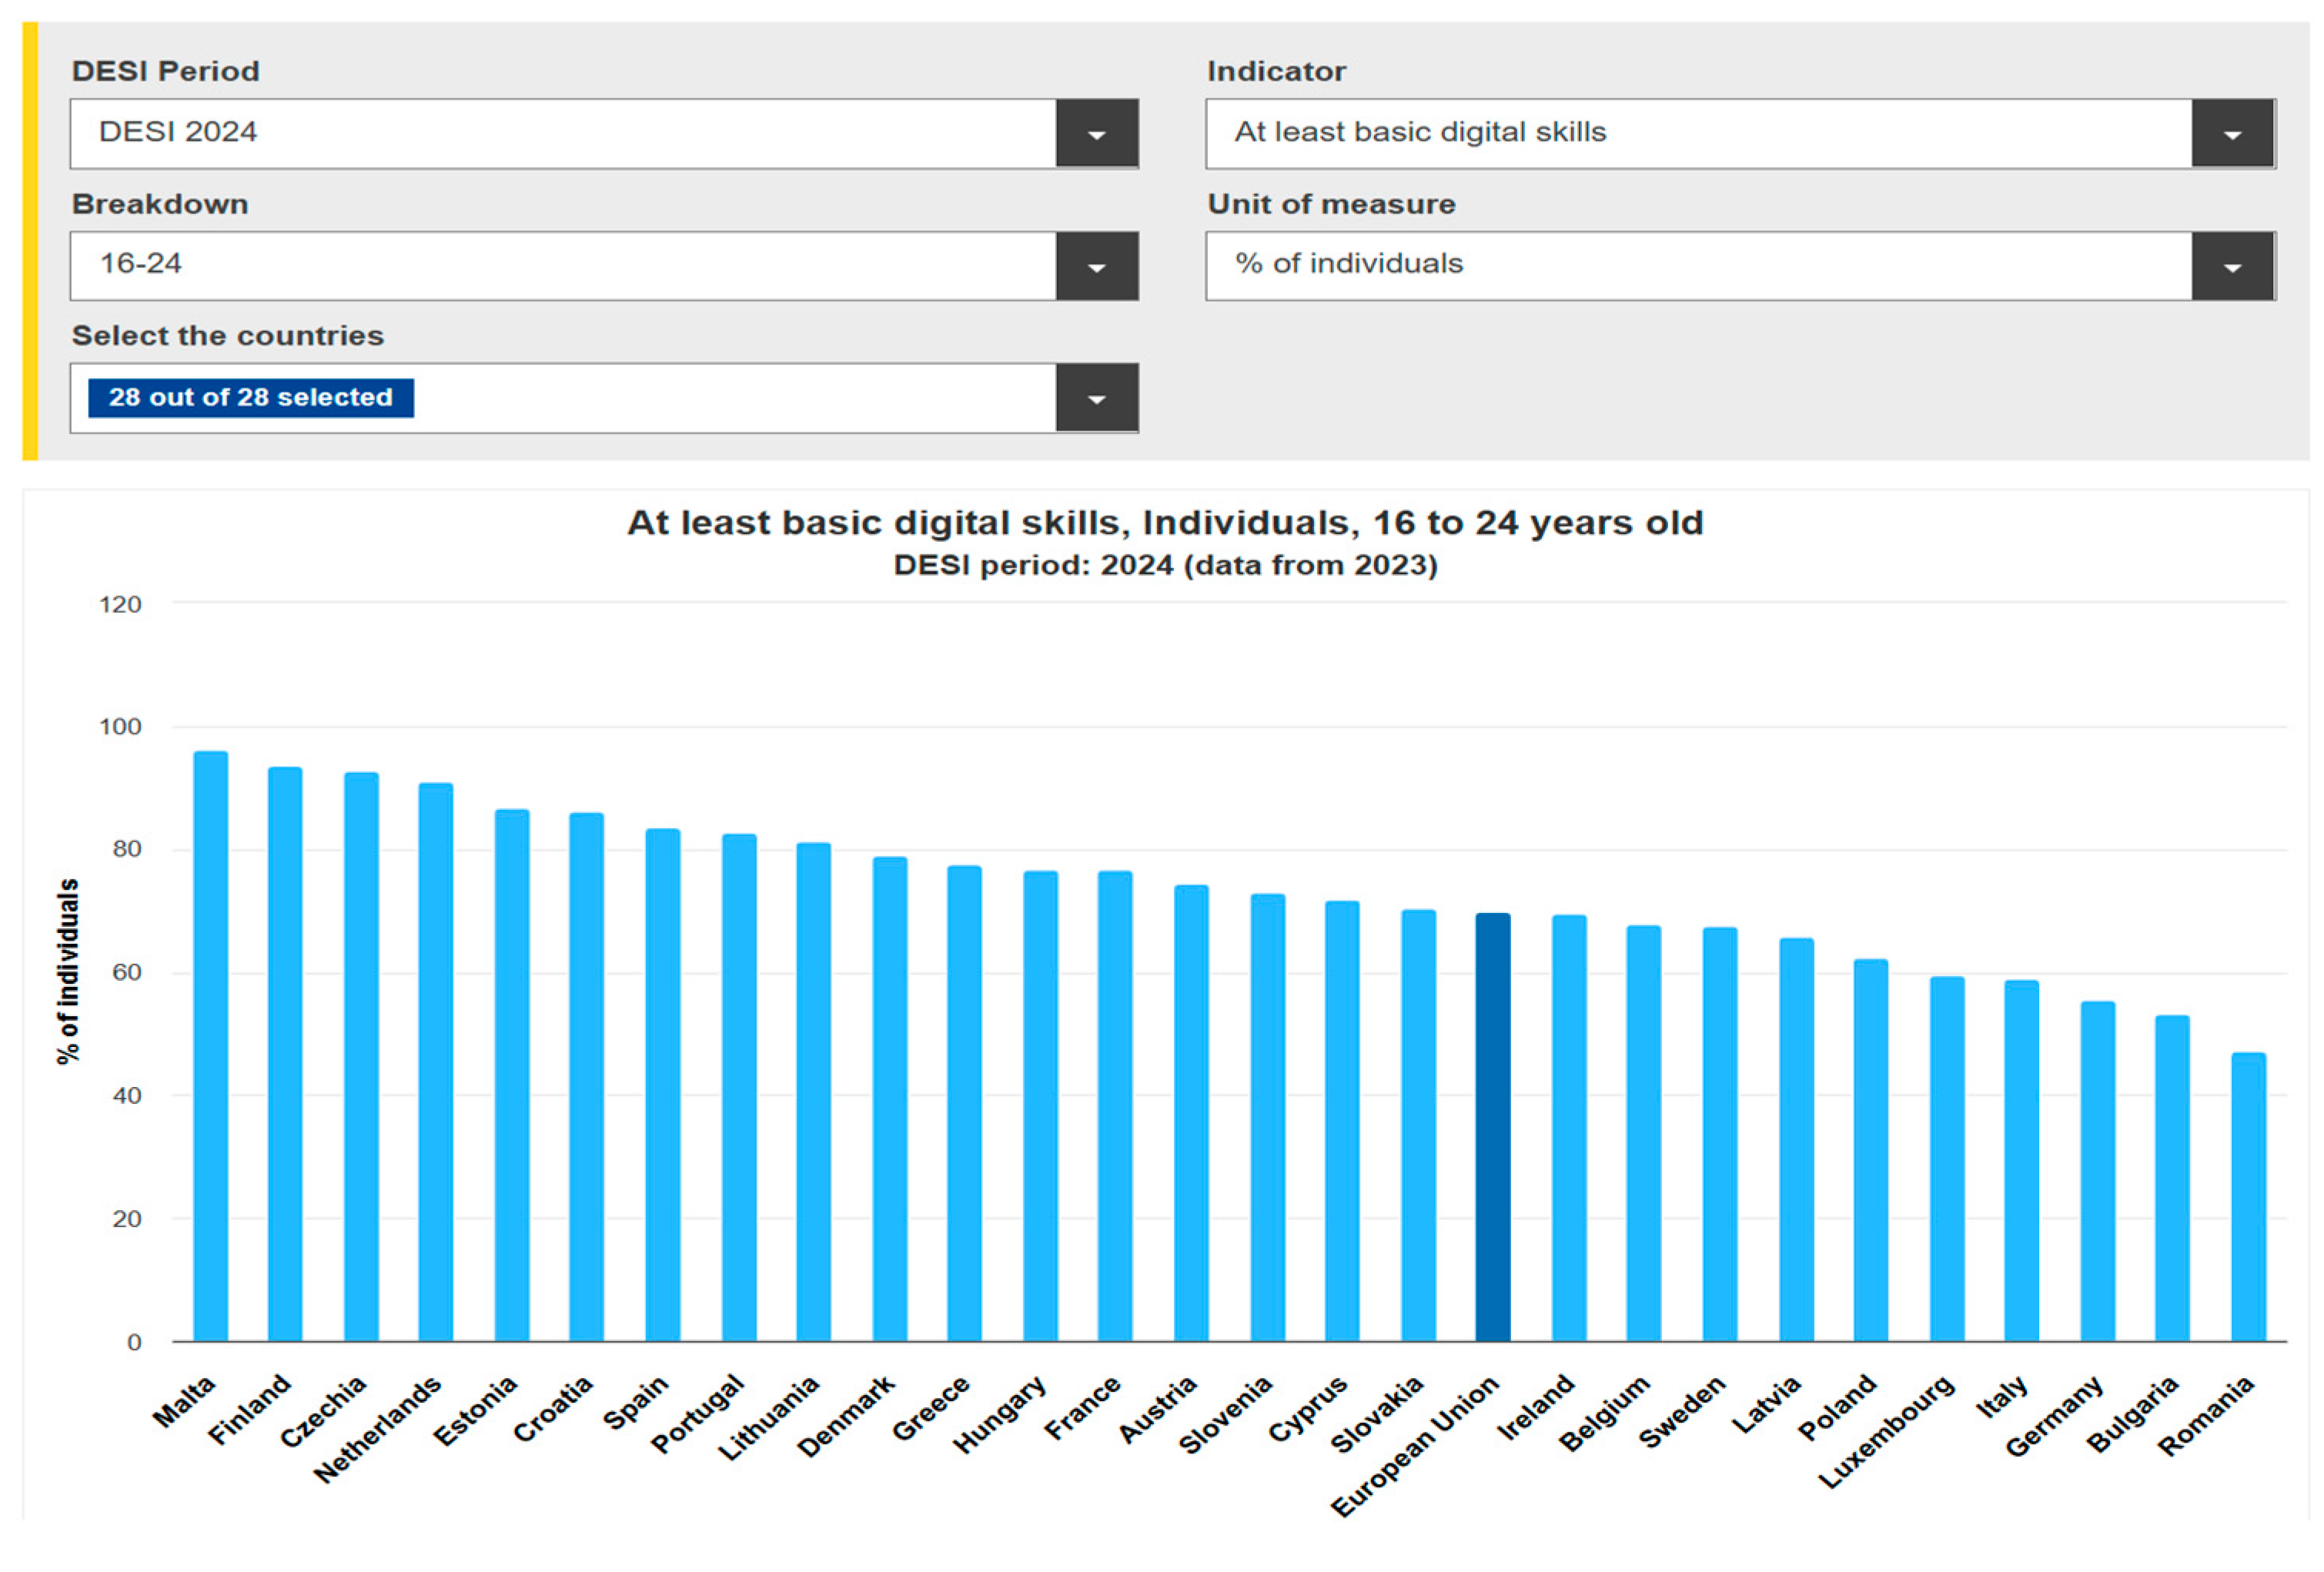
  • At least basic digital skills;
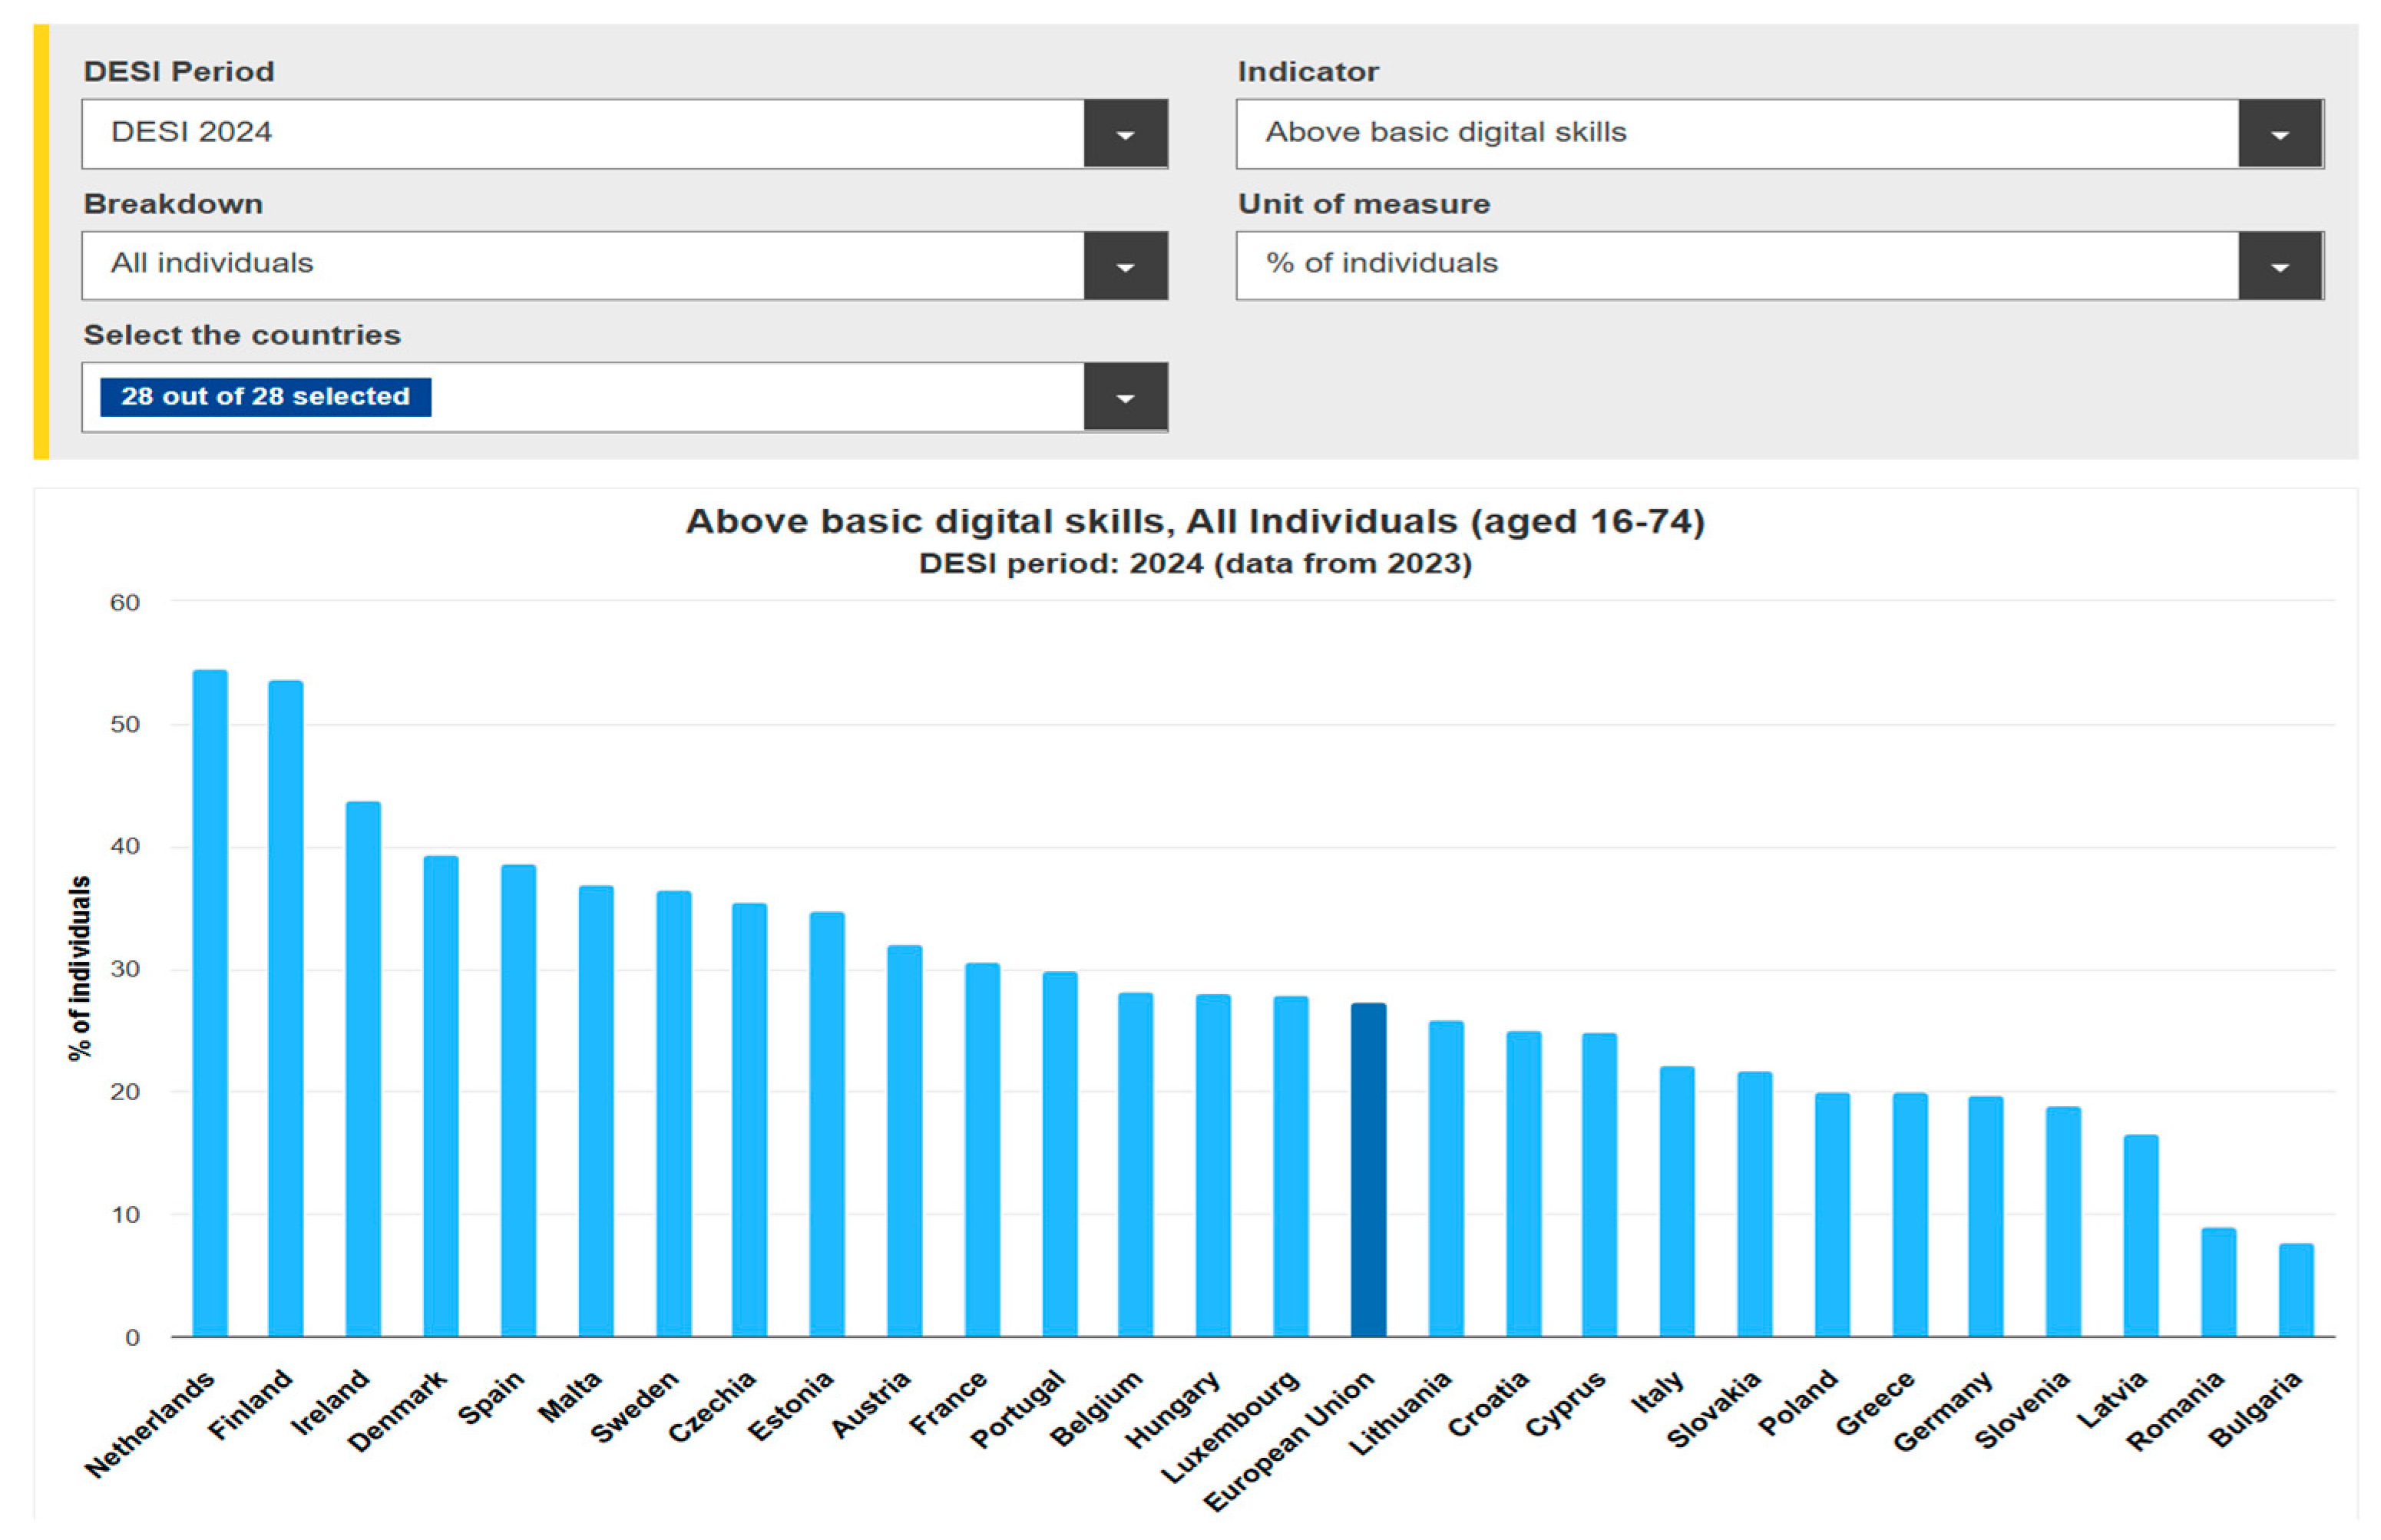
  • Above basic digital skills;
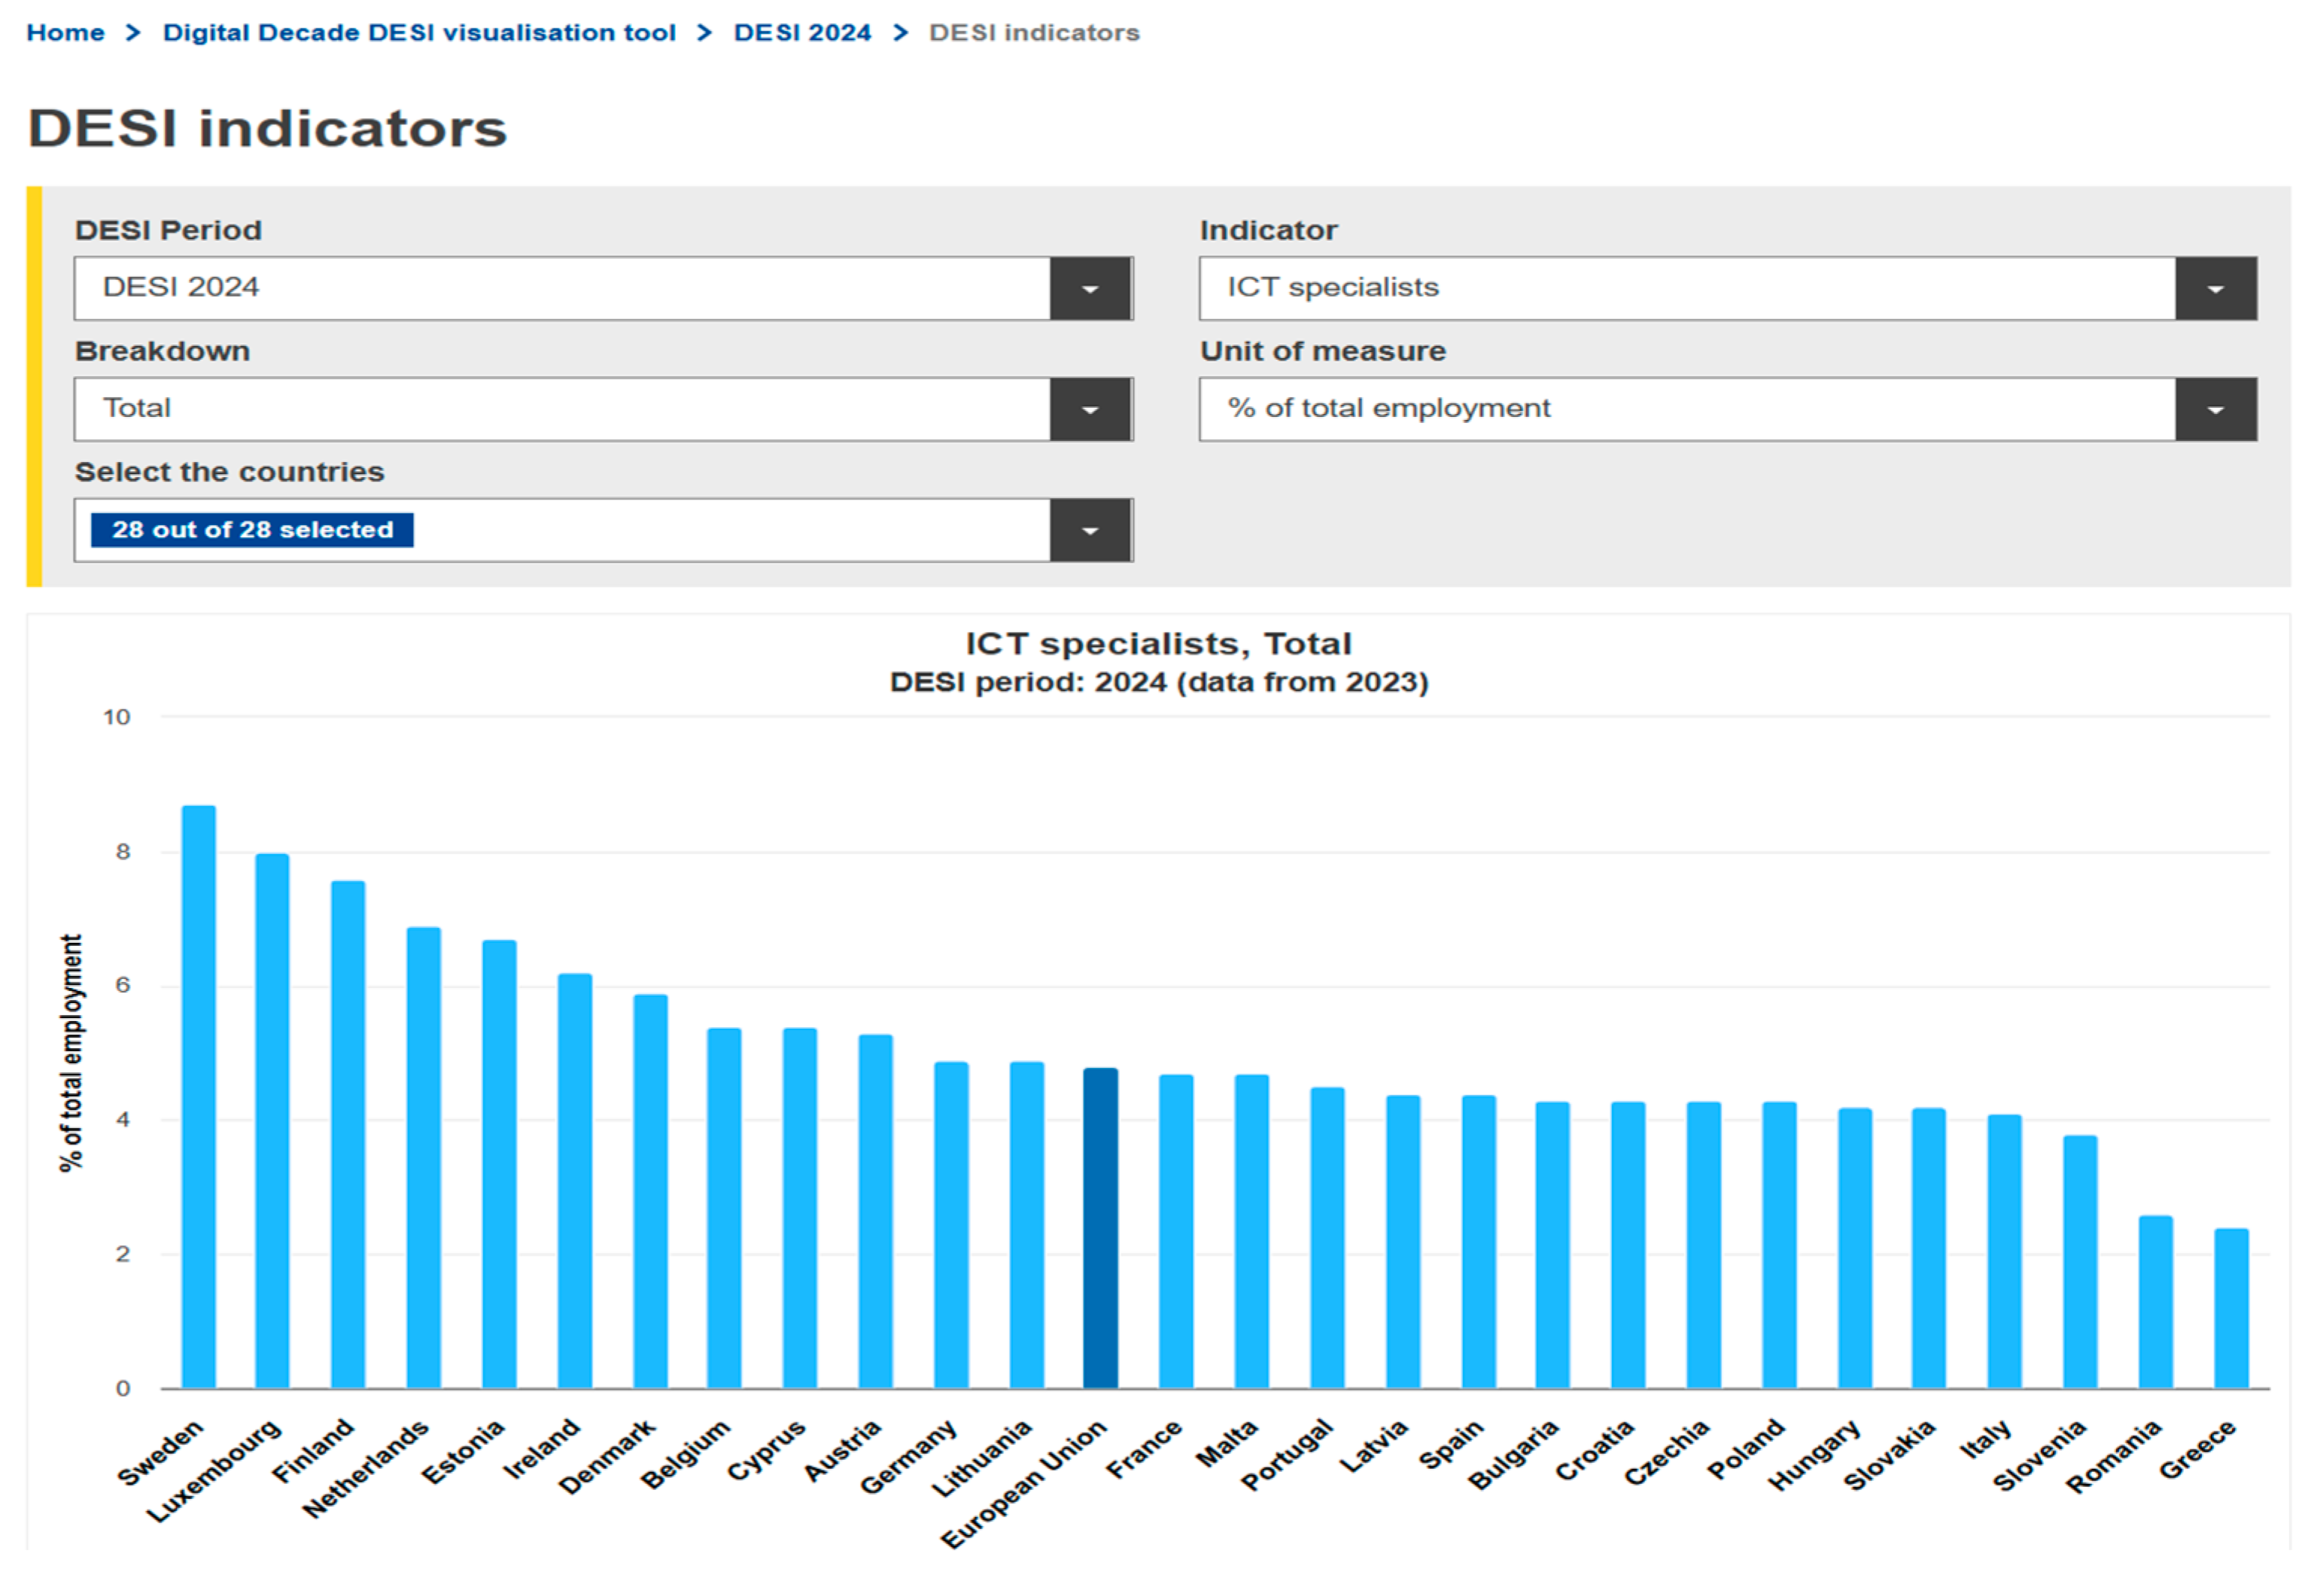
  • Information and communication technology (ICT) specialists;
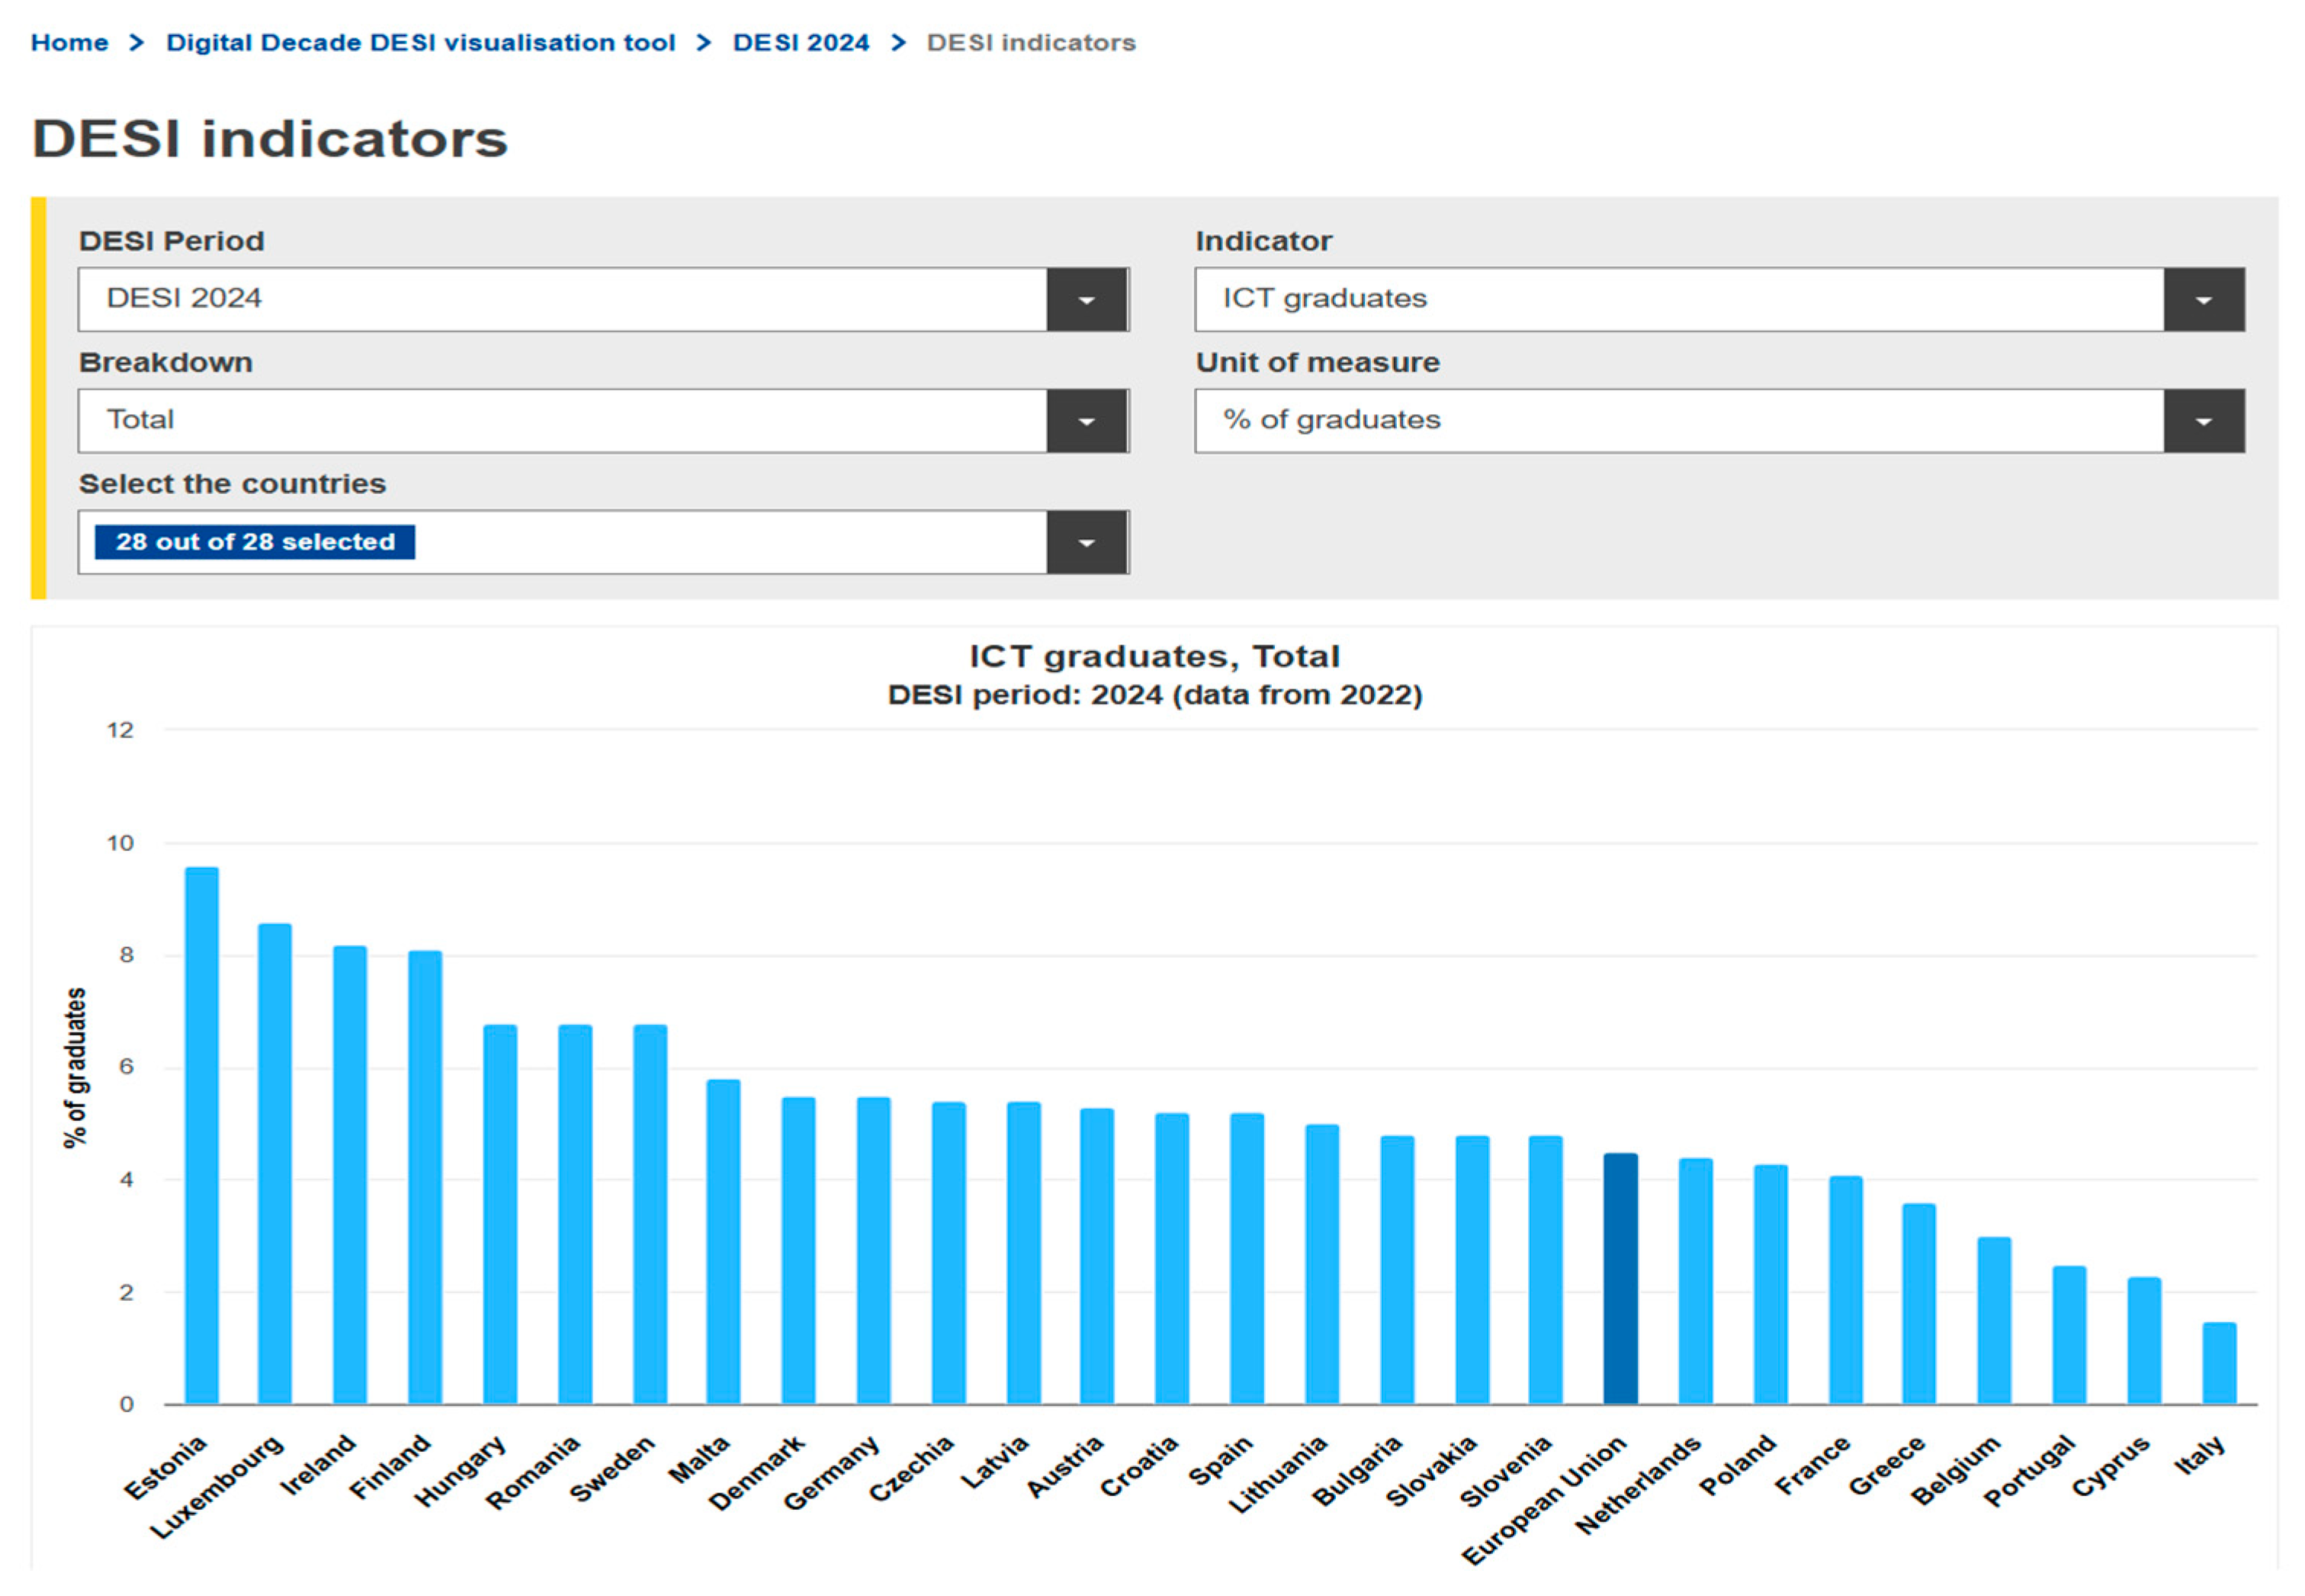
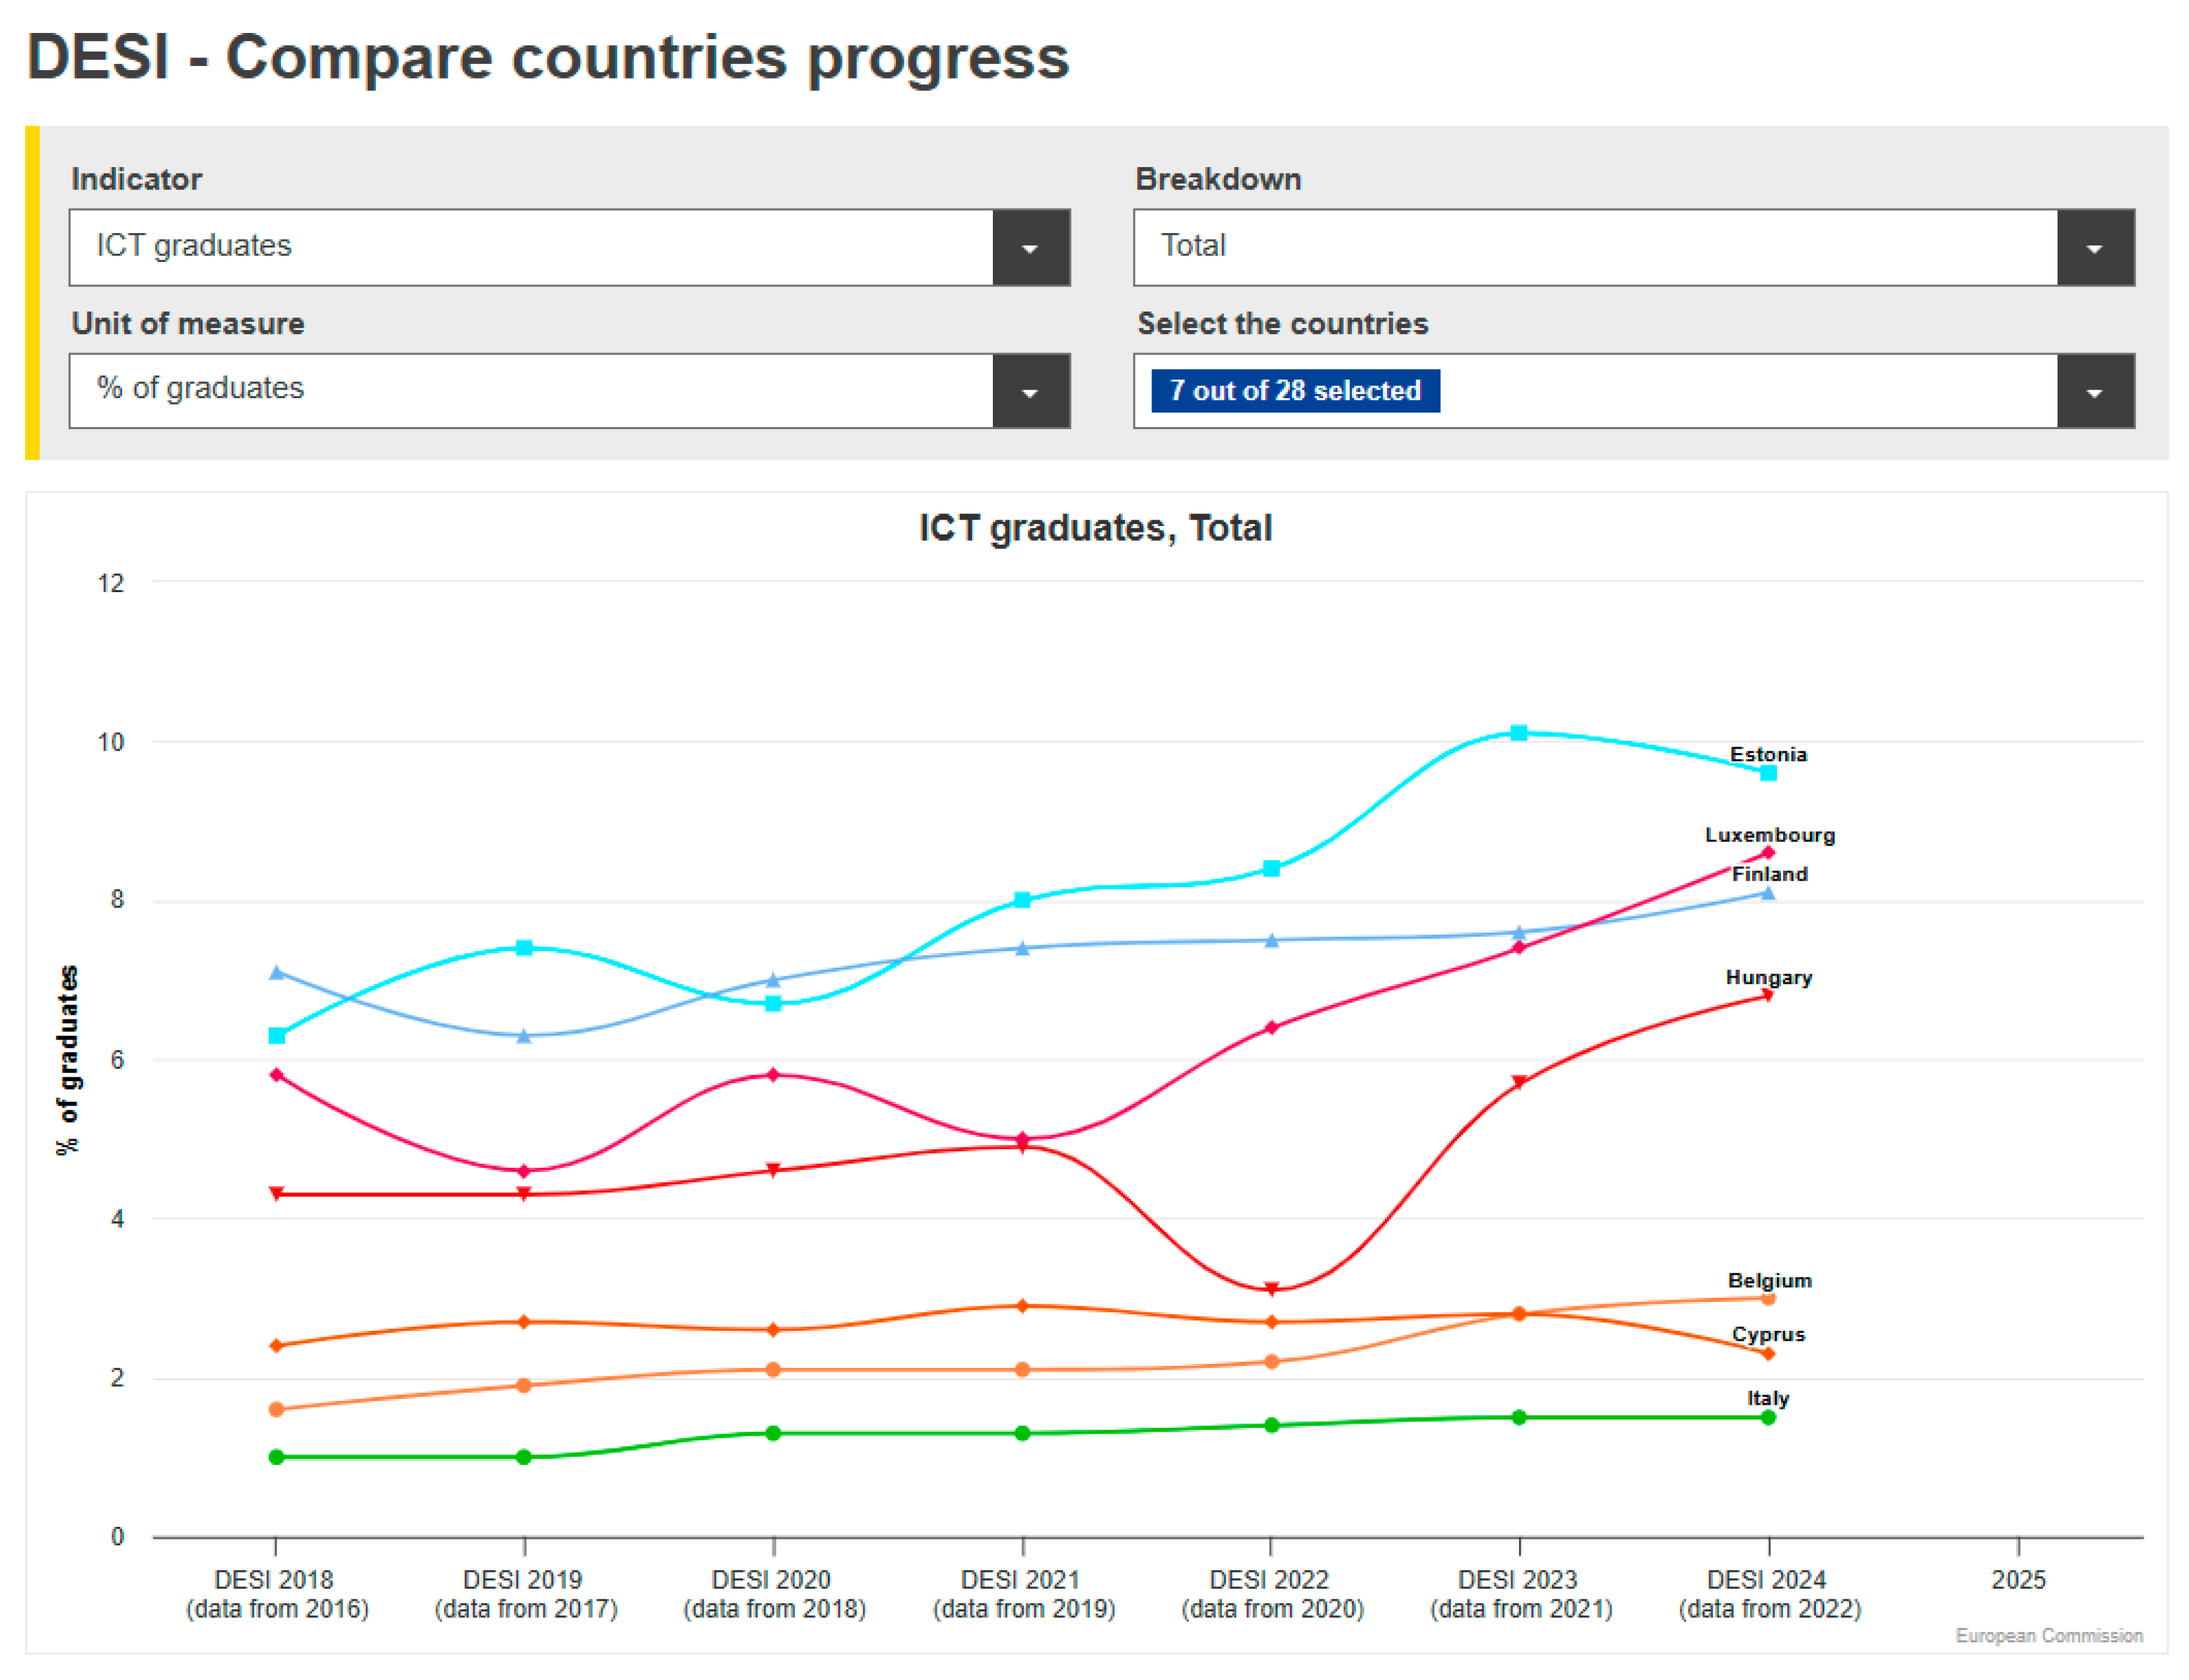
  • ICT graduates.
Using these criteria, we will examine the state of society in the EU countries. Let us start with the first indicator—internet use. Figure 2 illustrates the Digital Decade DESI visualization tool interface with this indicator selected in the menu.
The unit of measure is the percentage of individuals; only individuals who use the internet at least once a week are counted. As can be seen in Figure 1, internet usage in different EU countries ranges from 79% (Bulgaria) to 99% (Netherlands). The average value of internet usage for the EU is 90.27%. The data provided are for 2023 (the latest available at the moment) and correspond to the age range from 17 to 64. The tool also allows you to see internet usage in the age range from 16 to 24, where the average value is higher at 98.08%.
Figure 3 shows data according to the second indicator, “at least basic digital skills”.
As you can see, basic digital skill levels vary significantly across EU countries. It is highest in the Netherlands and Finland (nearly 83%), and lowest in Romania (28%) and Bulgaria. The average value for the EU is 56.56%. Let us look at these same indicators (Figure 4) for another age range from 16 to 24 years old.
Table 1 shows the results of the comparison of at least basic digital skills by two age categories.
The best results, as expected, are for the young category (16–24 years old). The average value for the EU in the young category is 69.97% compared to the Total category at 56.56%. In addition, in the Total category, in the country with the minimum level of digital skills of 27.73% (Romania), this level is nearly three times lower than in the country with the maximum level of 82.7% for the Netherlands. At the same time, for the young category, this gap decreased to nearly two times: 96.09% for Malta and 47.19% for Romania.
By DESI’s definition, individuals with basic or above-basic digital skills, likely to be assumed to have different qualities for each of these two categories, should possess all of the following five competencies:
  • Information and data literacy, including reading online news, finding information about services, and activities related to fact-checking online information and its sources;
  • Communication and collaboration;
  • Digital content creation;
  • Safety;
  • Problem solving.
The last category itself involves the following: downloading or installing software or apps; changing settings of software, application, or device; online purchases; selling online; using online learning resources; internet banking; looking for a job or sending a job application.
Figure 5 shows the level of values of the above-basic digital skills indicator.
The number of individuals with a given level of digital skills is much smaller and the spread across different countries is much larger. The average value for the EU is only 27.32% of individuals, the best results being from the Netherlands (maximum, 54.53%) and Finland. The worst results are for Bulgaria (7.73%) and Romania.
The next DESI digital skills indicator is ICT specialists. By definition, it only counts employed ICT specialists, and according to 2023 statistics, their number in the EU was almost 10 million. The values of the ICT specialists indicator are shown in Figure 6, where the unit of measure is the percentage of total employment.
The two-percentage range (4.8 ± 1)% includes 18 countries out of 27 possible, where 4.8% is the average percentage of employed IT specialists in total employment in the EU. This indicates a relatively uniform state of digitalization in the EU countries’ economies.
Greece and Romania have the worst indicators, at 2.4% and 2.6%, respectively, which indicates that in their economies, the ratio of IT specialists to total employment is half the average in the EU. The top three countries are Sweden, Luxembourg, and Finland, with values of 8.7%, 8.0%, and 7.6%, respectively.
The last DESI digital skills indicator is ICT graduates (Figure 7), or in other words, individuals with a degree in ICT. The unit of measurement is the percentage of ICT graduates out of the total number of graduates.
The percentage of ICT graduates out of the total number of graduates is 4.5% on average in the EU, with the best value of 9.6% in Estonia and the worst value of 1.5% in Italy.
Although it may not be obvious at first glance, digital skills are actually the basis for a country’s successful digital transformation. The low level of digital skills of society, even with a developed digital infrastructure and a wide range of proposed applications, will be a deterrent factor in the implementation of information technologies both in public life and in the country’s economy. The level of ICT specialists’ qualifications has an even greater impact on the country’s digital transformation, since their task is to provide for the effective use of network infrastructure, as well as the creation, support, and improvement of existing software applications.
Based on this, in our opinion, the ICT graduates indicator is one of the most important for ensuring the country’s competitiveness in the context of digital transformation. Therefore, let us look at the dynamics of ICT graduates (Figure 8) as a percentage of all graduates in EU member states, based on DESI data from 2016 to 2022.
Figure 8 presents the proportion of ICT graduates as a percentage of total graduates in EU countries from 2016 to 2022, based on the DESI 2024 dataset. The figure reveals significant disparities between member states in terms of the output of digital specialists. Estonia consistently leads the ranking, showing a sharp upward trend and reaching nearly 11% of total graduates by 2022. Other high-performing countries include Luxembourg, Finland, and Hungary. In contrast, countries such as Italy, Cyprus, and Belgium remain at the lower end of the spectrum, with shares below (1–3)%, indicating persistent gaps in the digital talent pipeline.
Based on the analysis of the chart presented in Figure 8, we can draw the following conclusions:
  • Growth trends
Several countries—particularly Estonia and Luxembourg—have demonstrated a strong and consistent increase in the share of ICT graduates over the past six years. This suggests effective national strategies to promote ICT education and align higher education output with digital labor market demands.
  • Regional imbalances
The chart shows a clear division between digitally advanced member states and those lagging behind. Southern European countries such as Italy and Cyprus have seen little progress, which may hinder their long-term competitiveness in the digital economy.
  • Policy implications
The data underscore the need for targeted policy interventions in countries with stagnating ICT graduation rates. Financial incentives, curriculum reforms, and closer cooperation between academia and industry could help boost digital skill development and address the EU-wide talent shortage in ICT fields.
  • Digital capacity building
The upward trend in several countries indicates growing awareness of the role of ICT professionals in driving innovation and digital transformation. However, convergence across member states remains limited, and more harmonized efforts are required to reduce disparities and support inclusive growth.

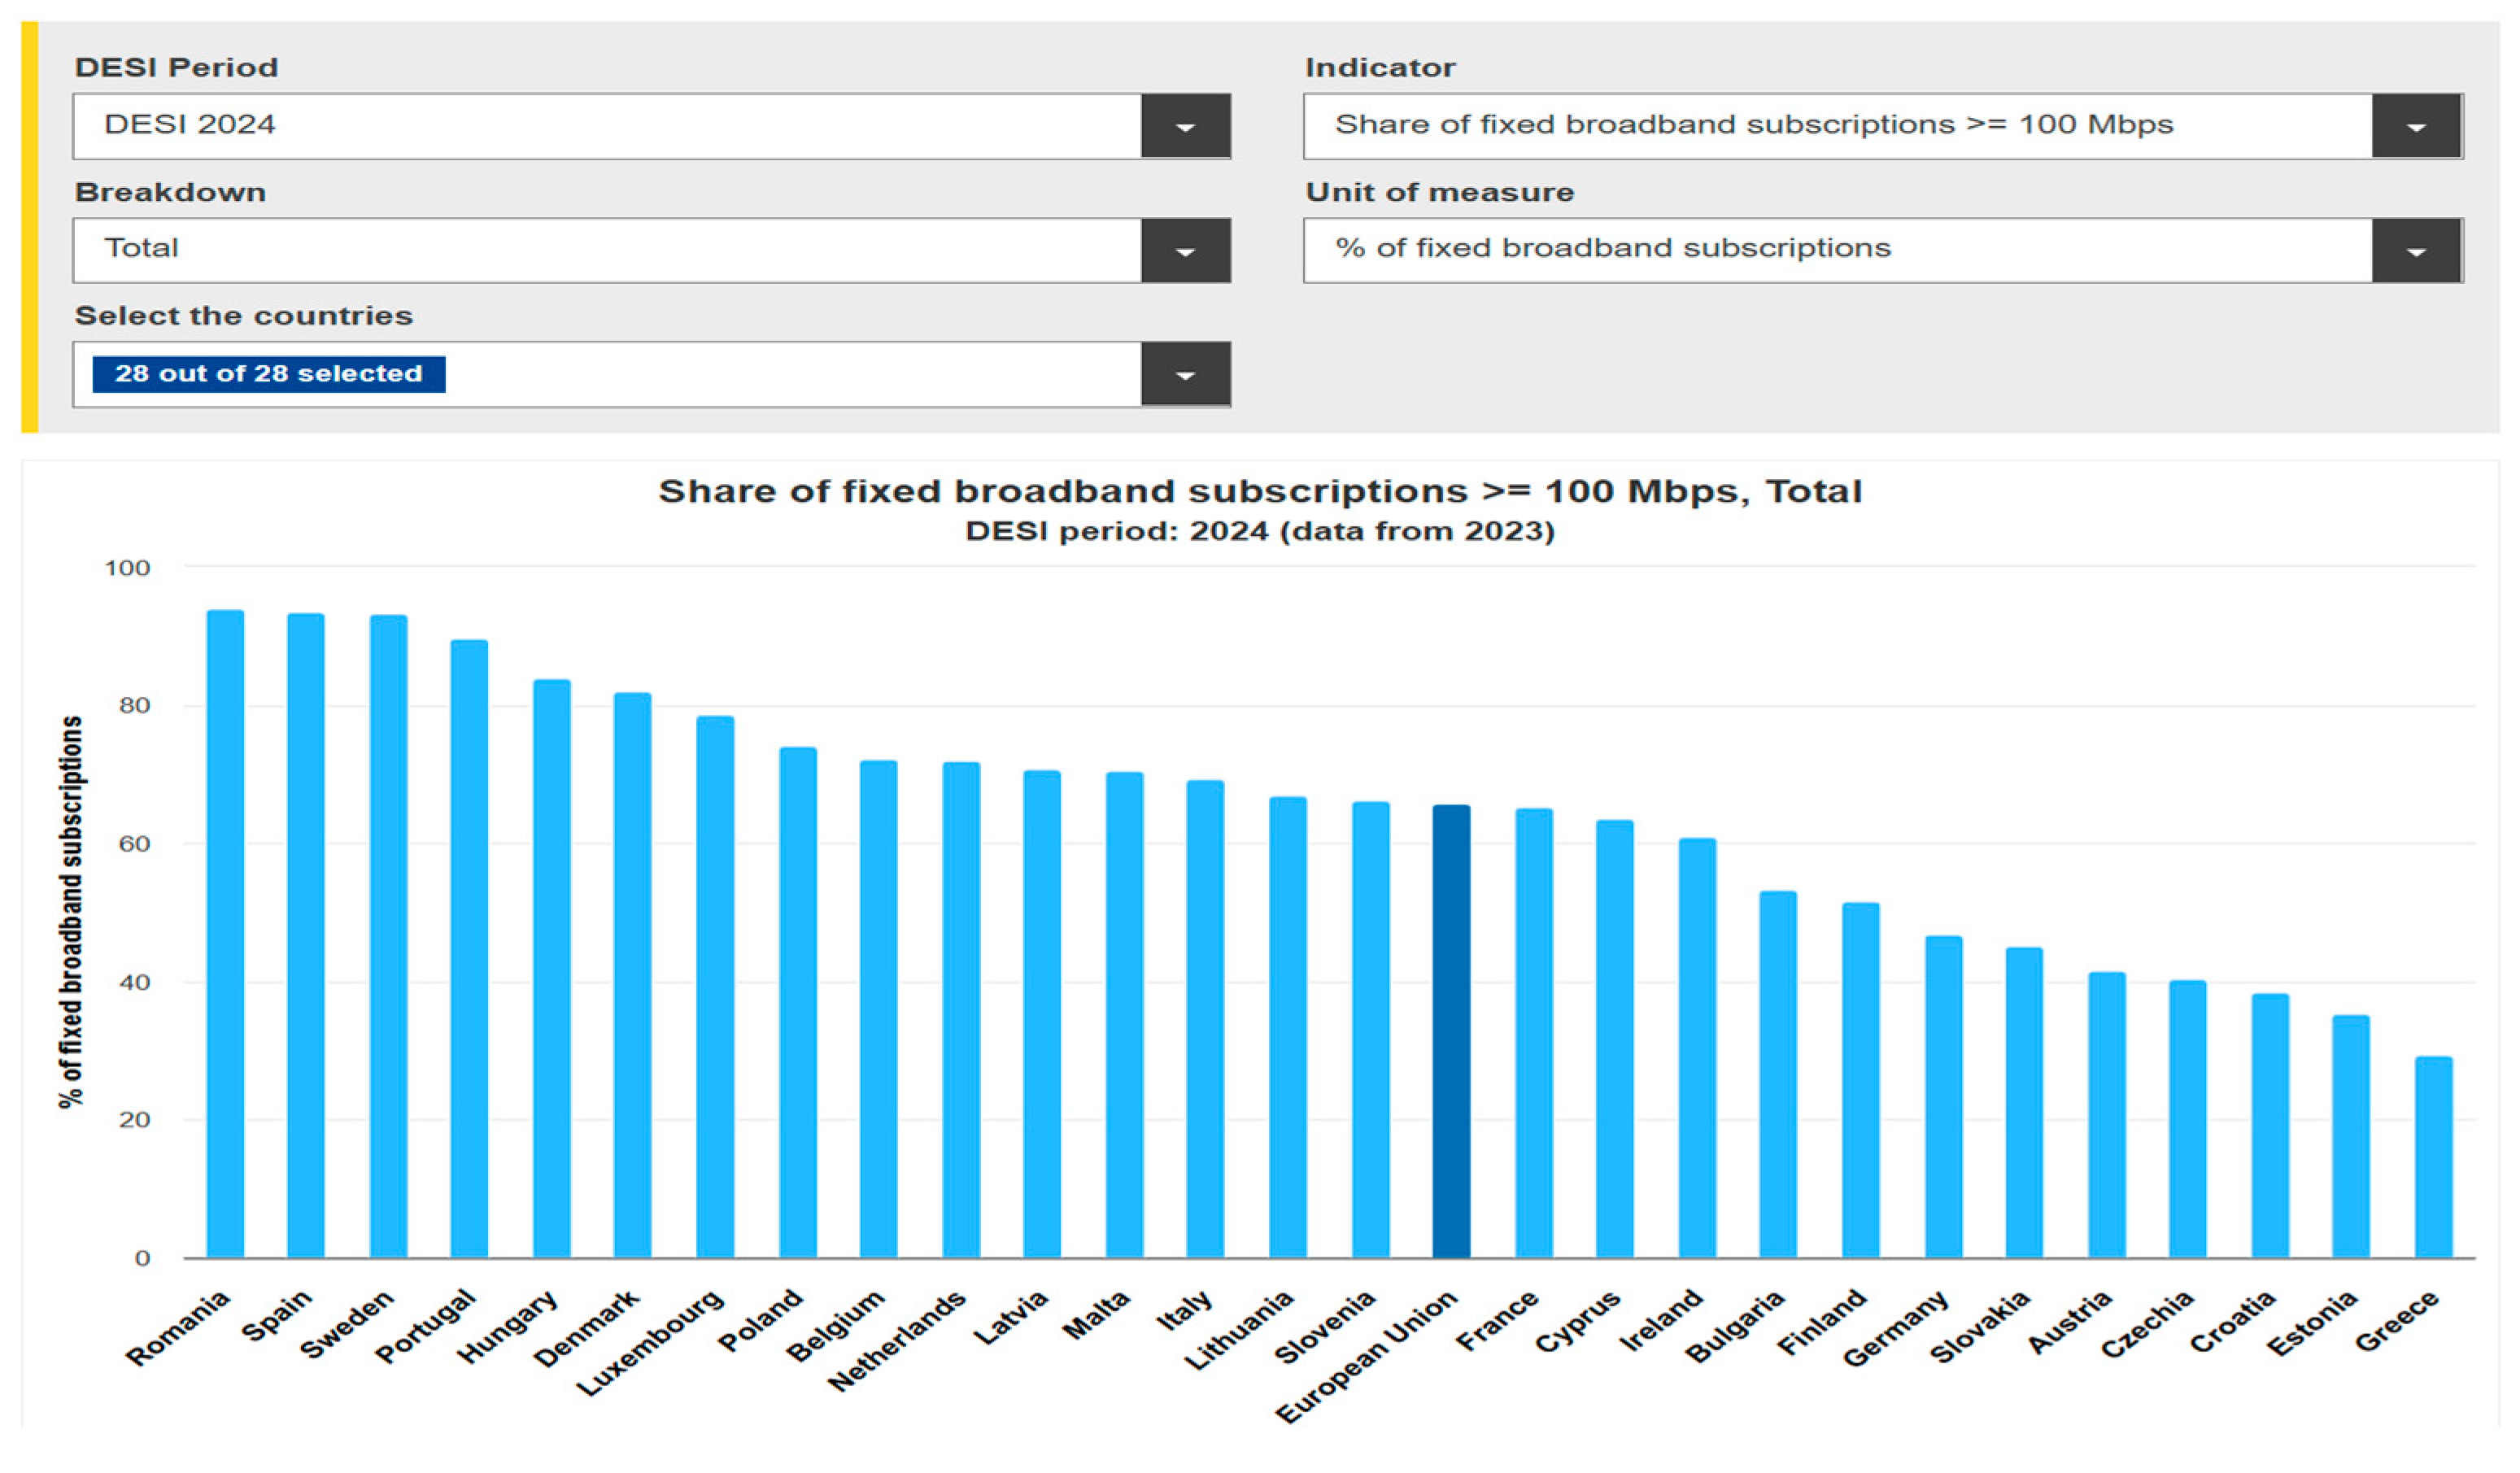
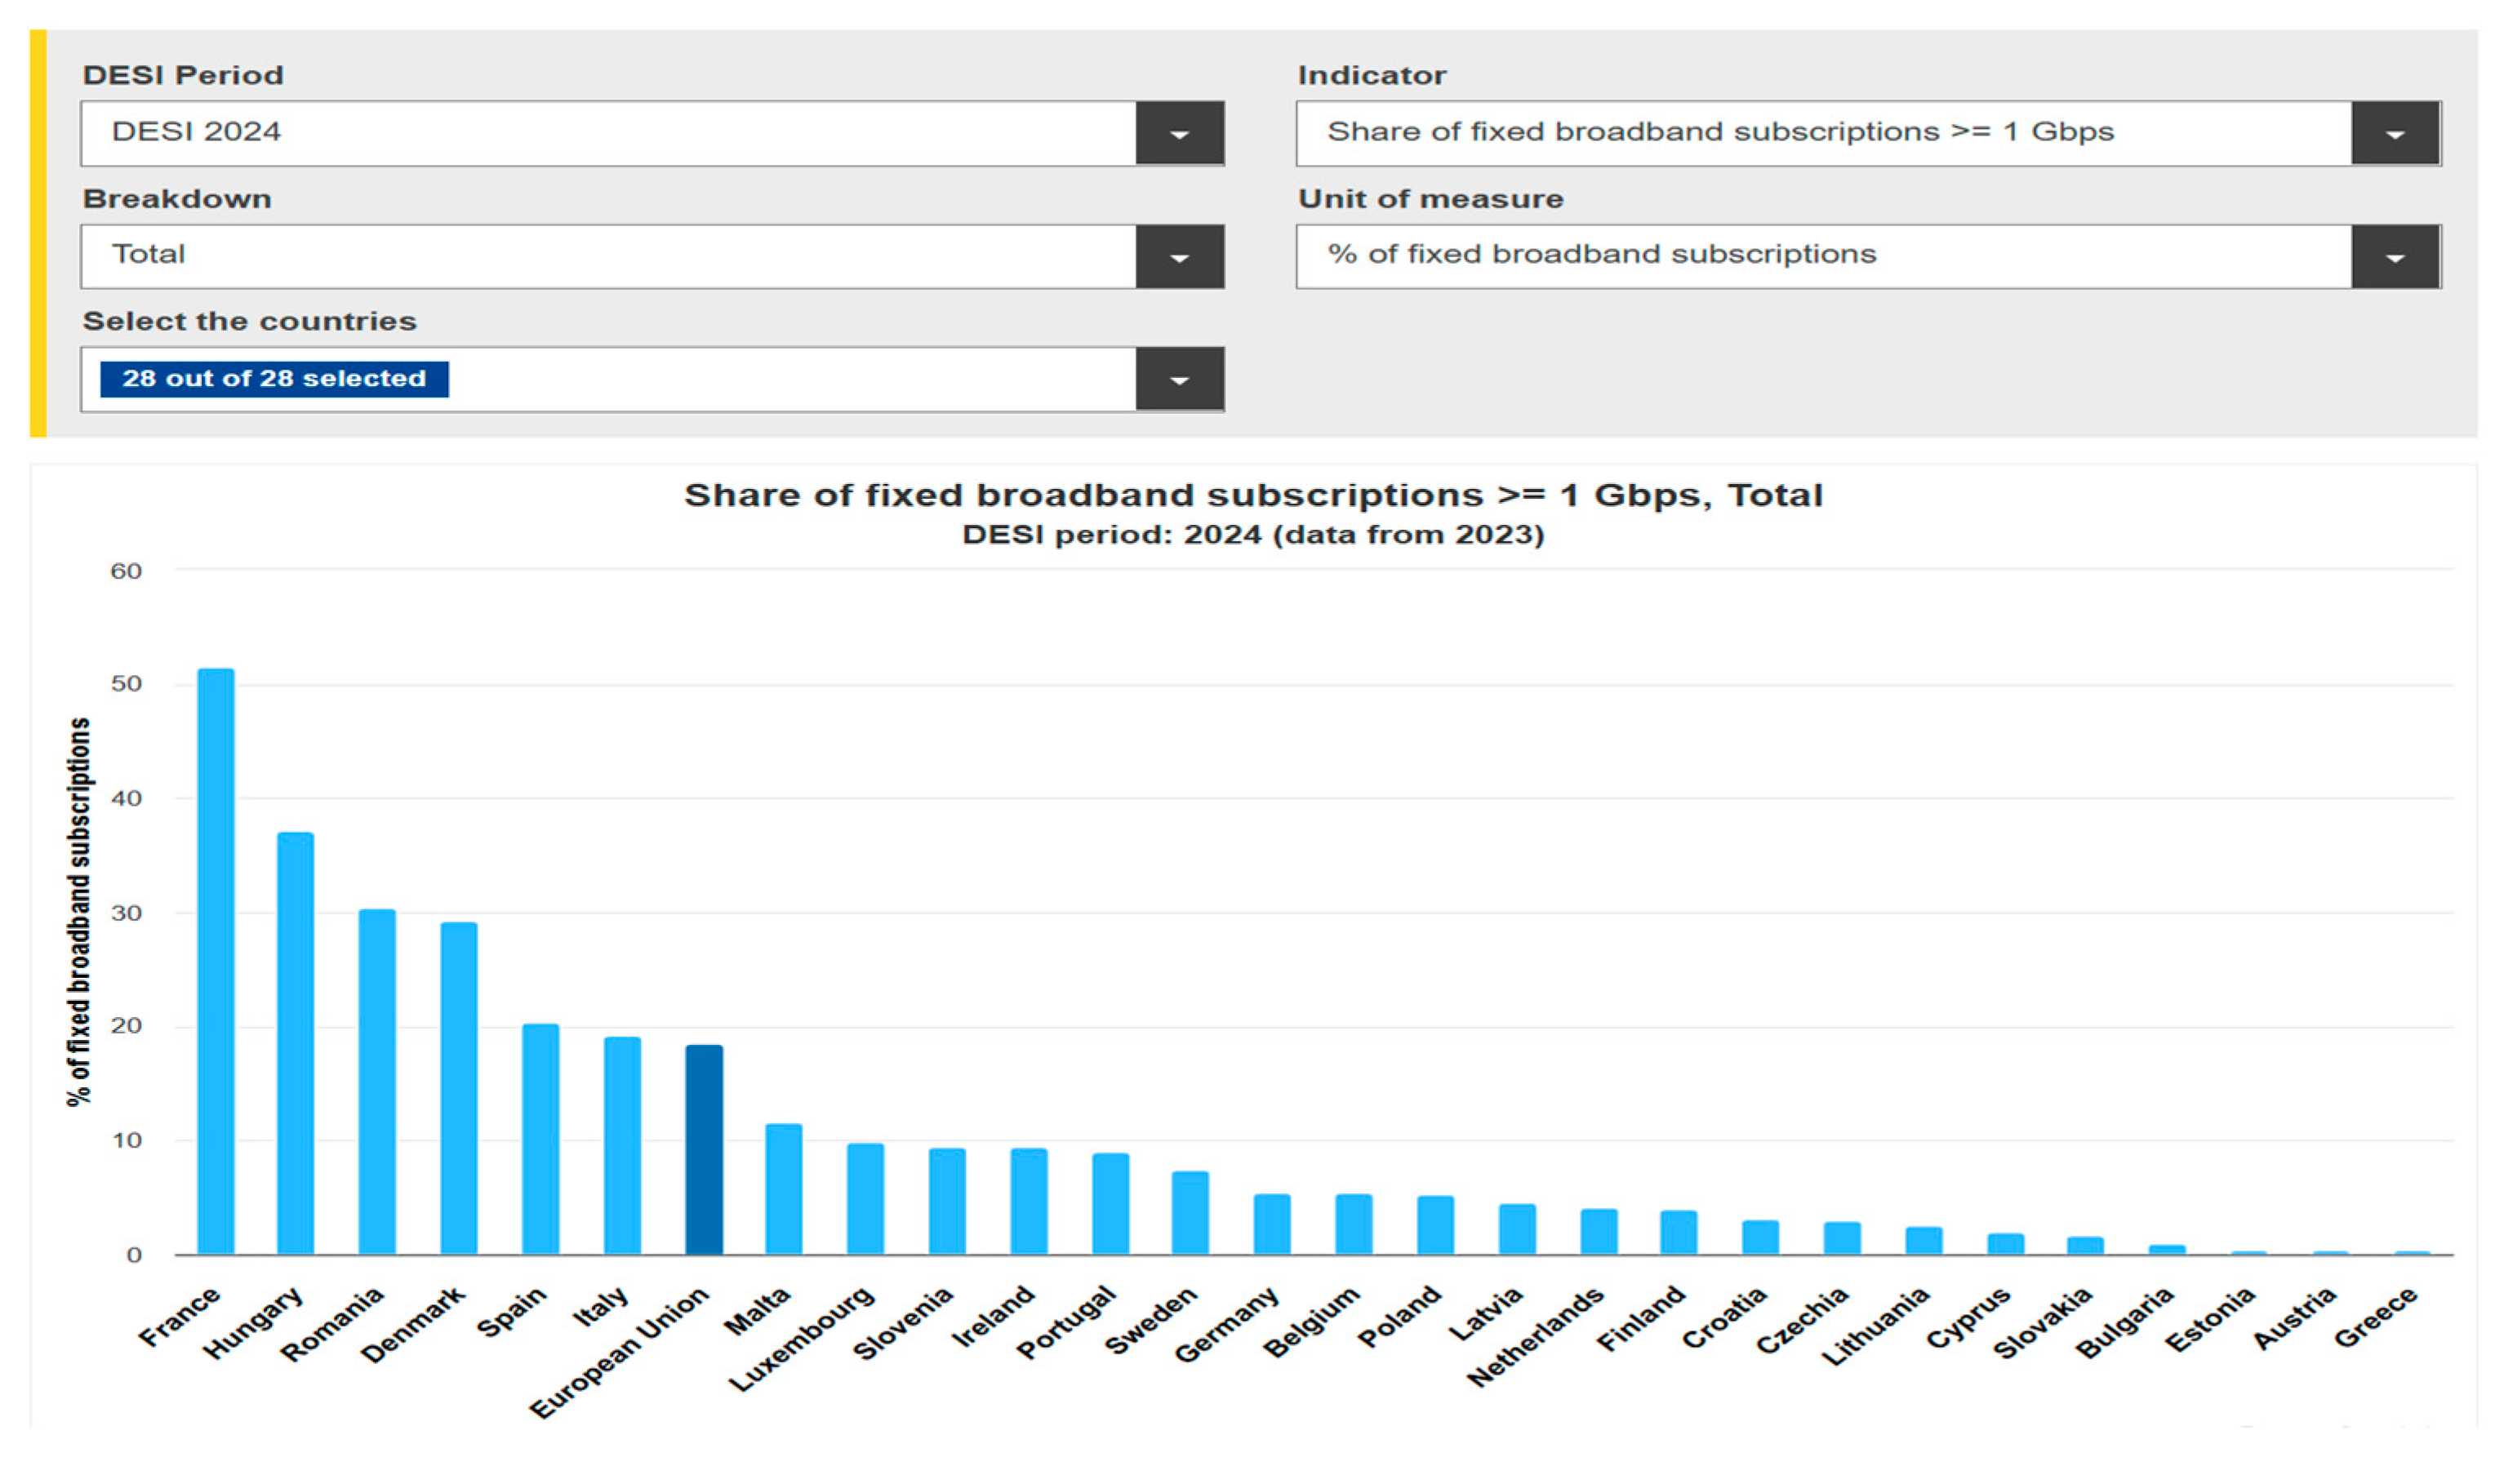
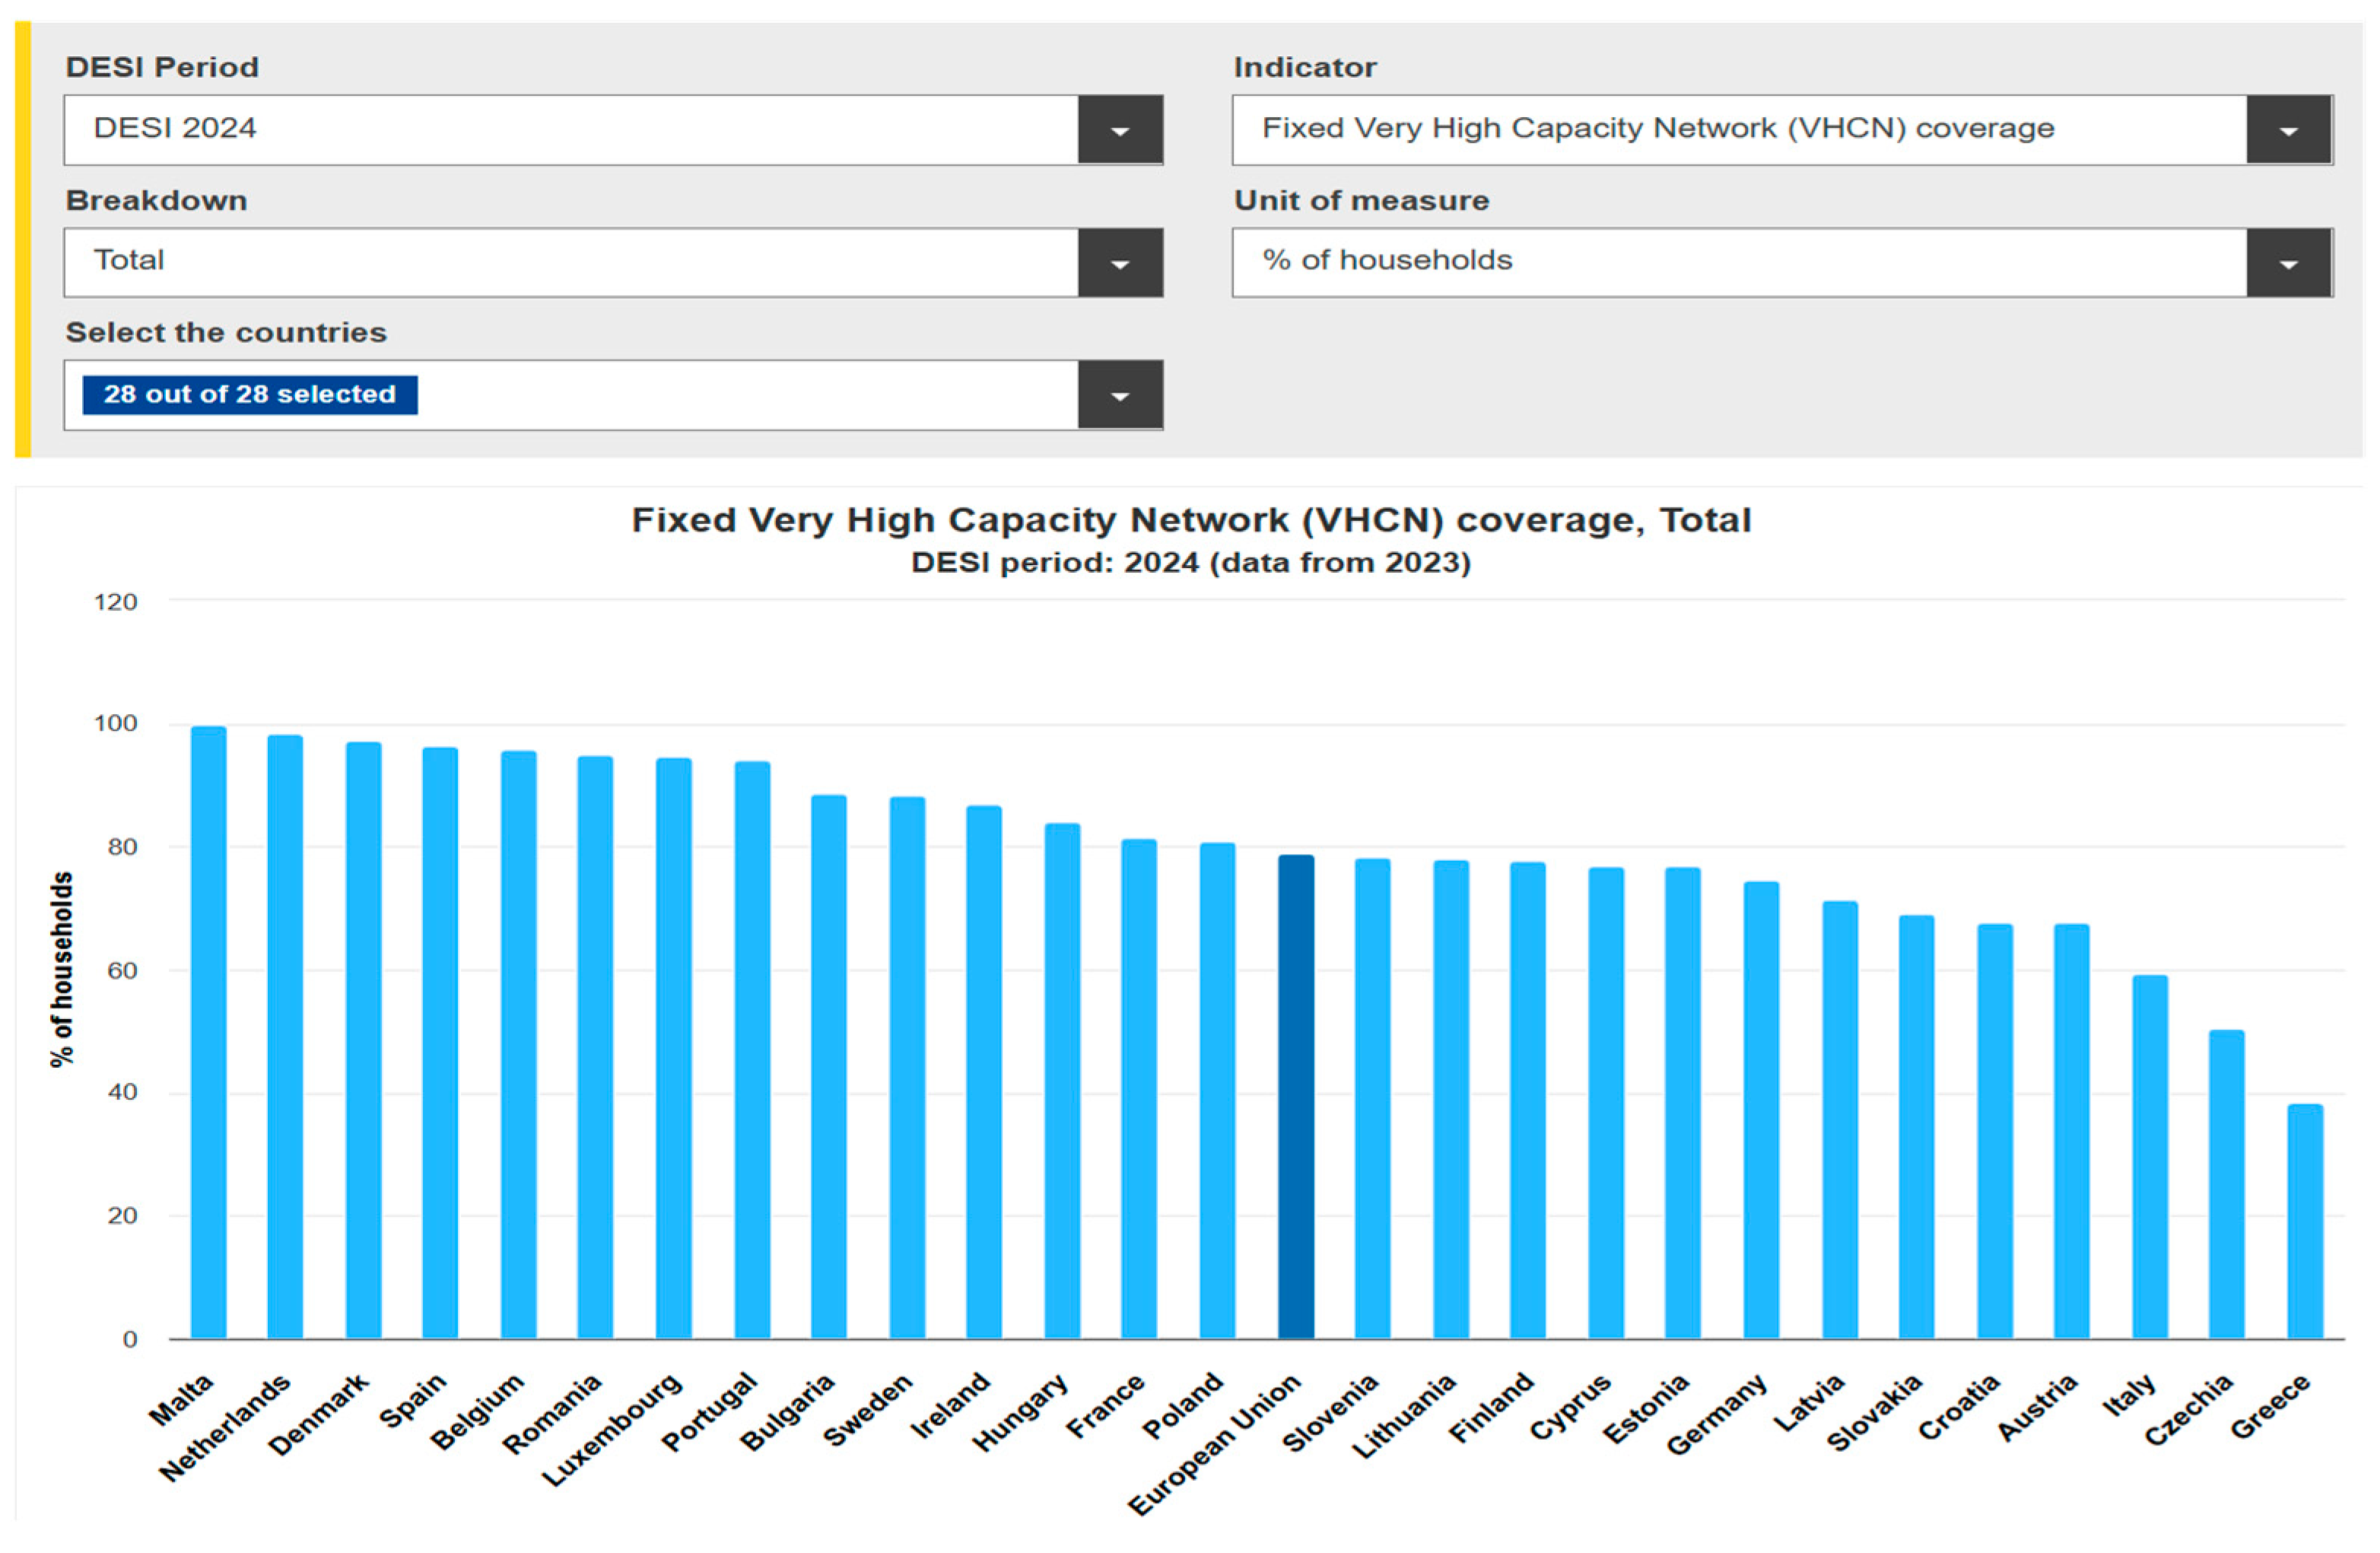
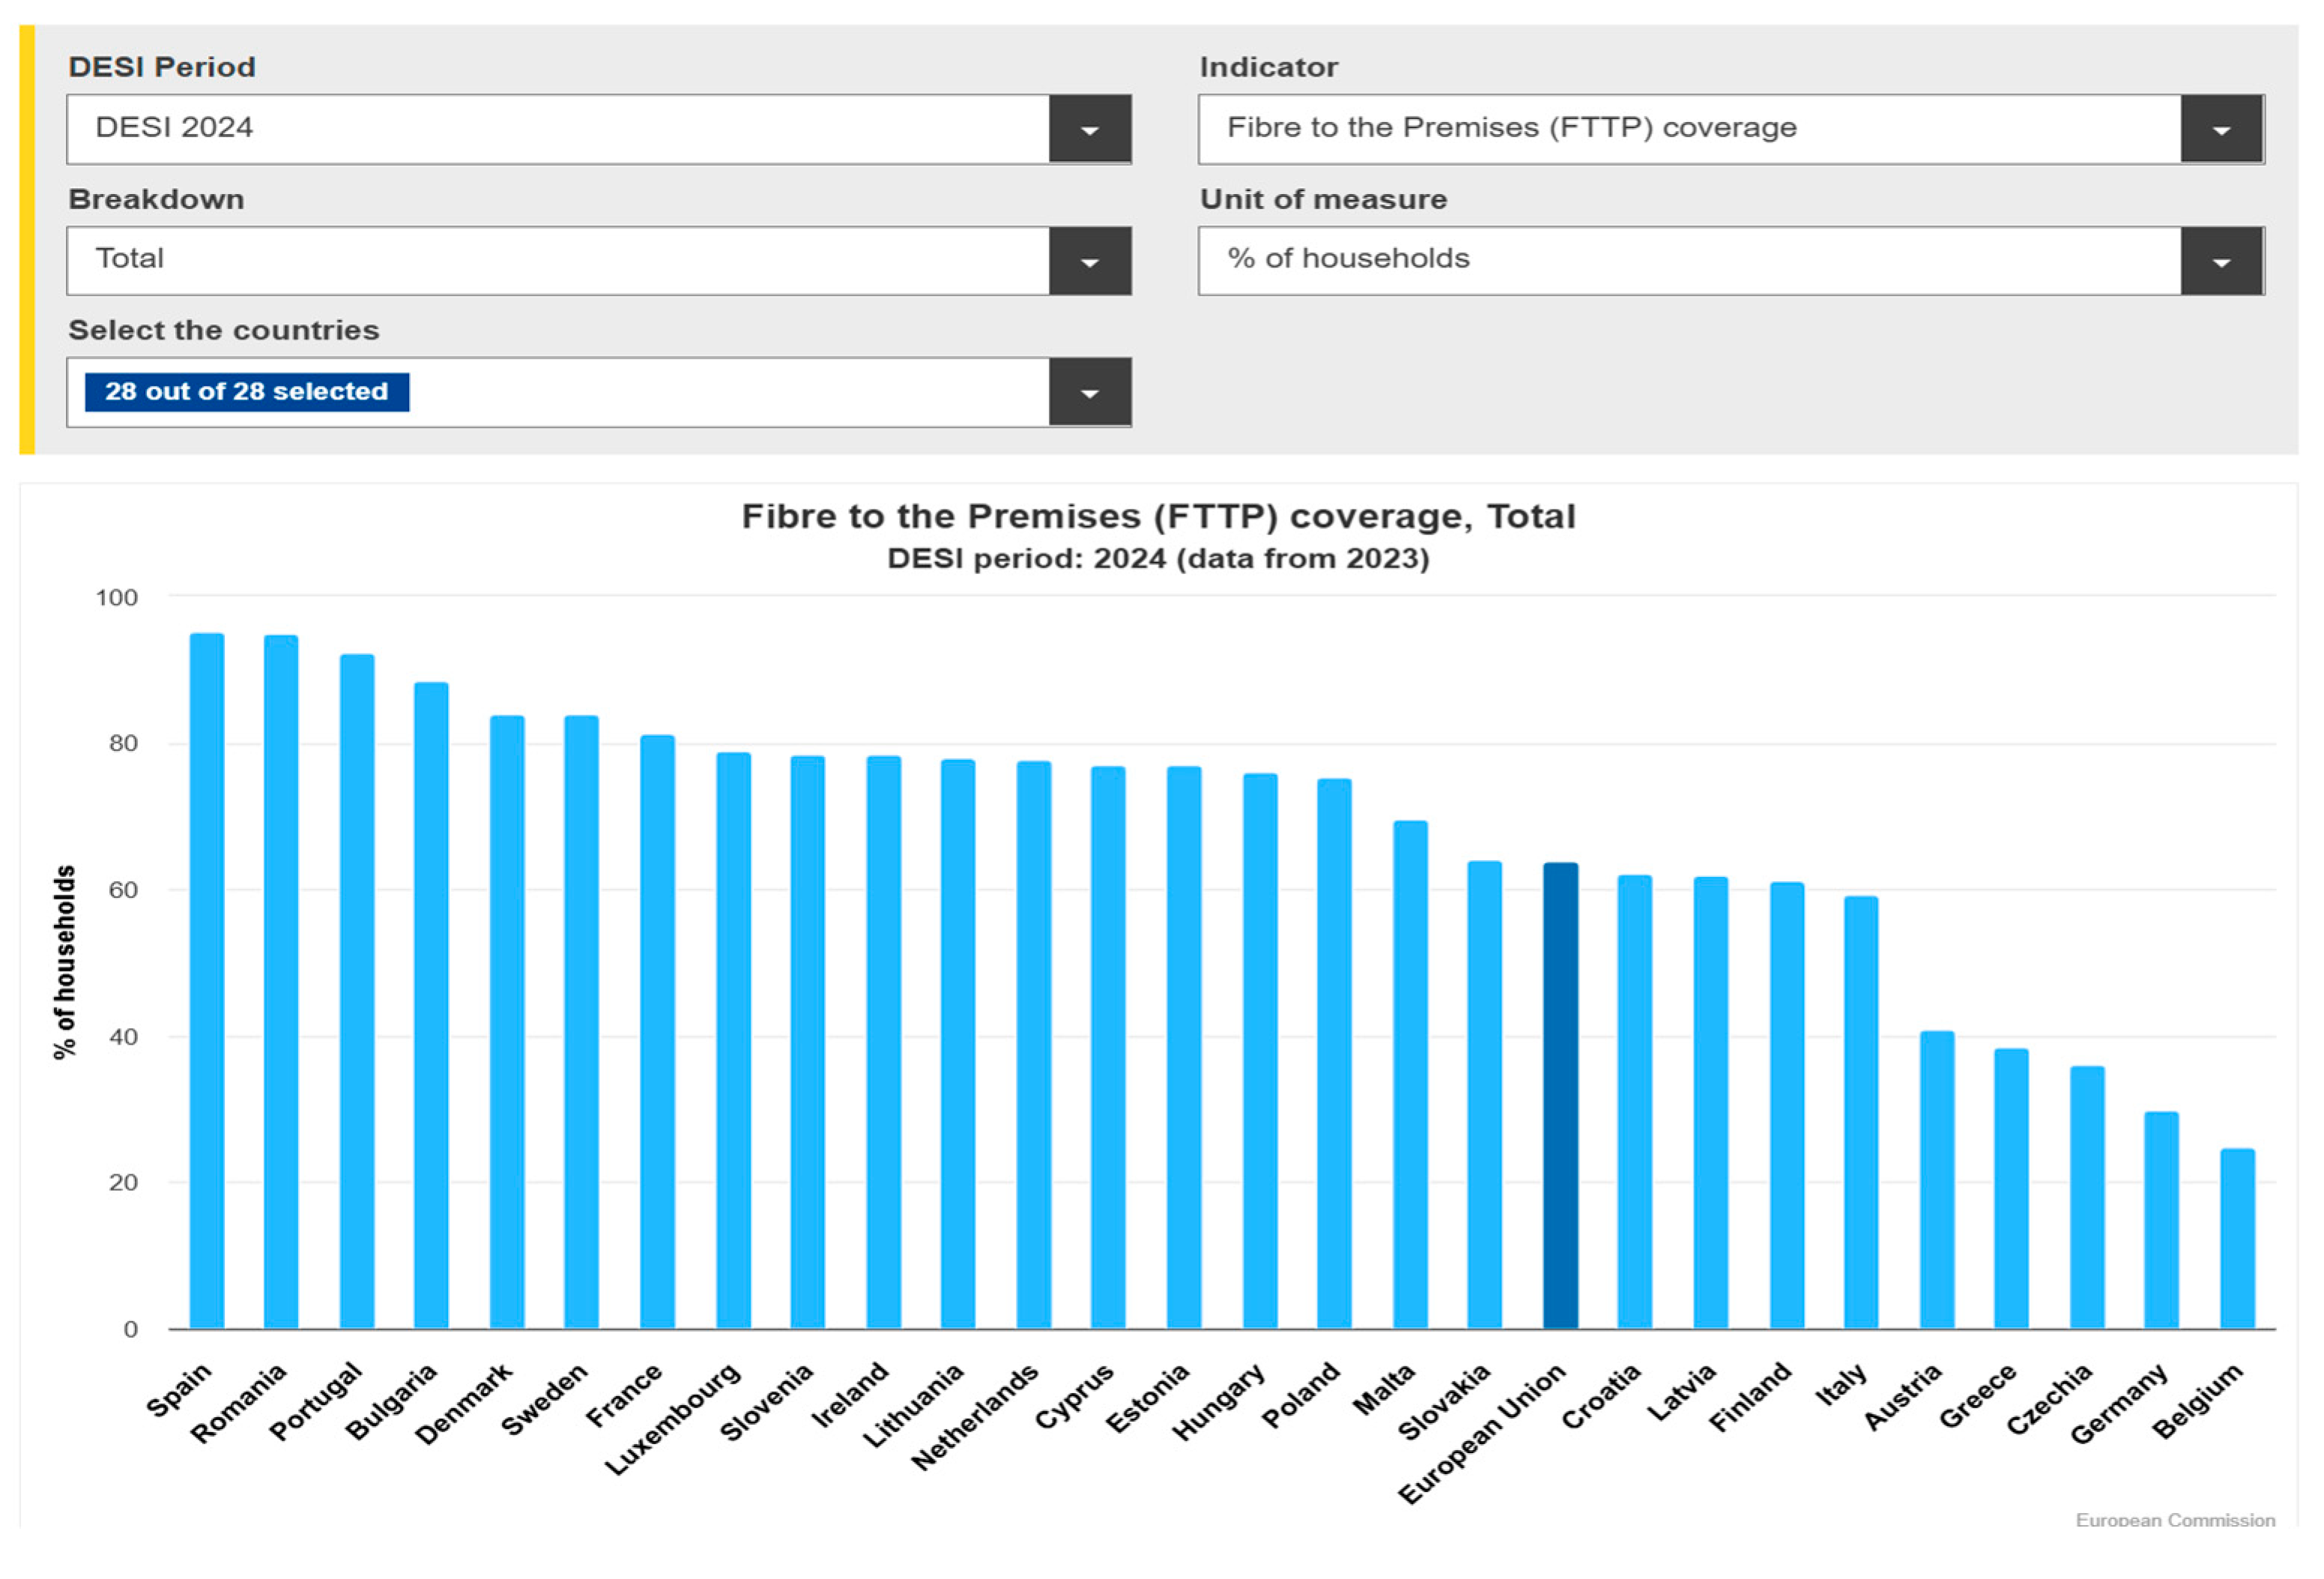
4.2. Digital Infrastructure

The following indicators are currently used to characterize digital infrastructure in DESI 2024:
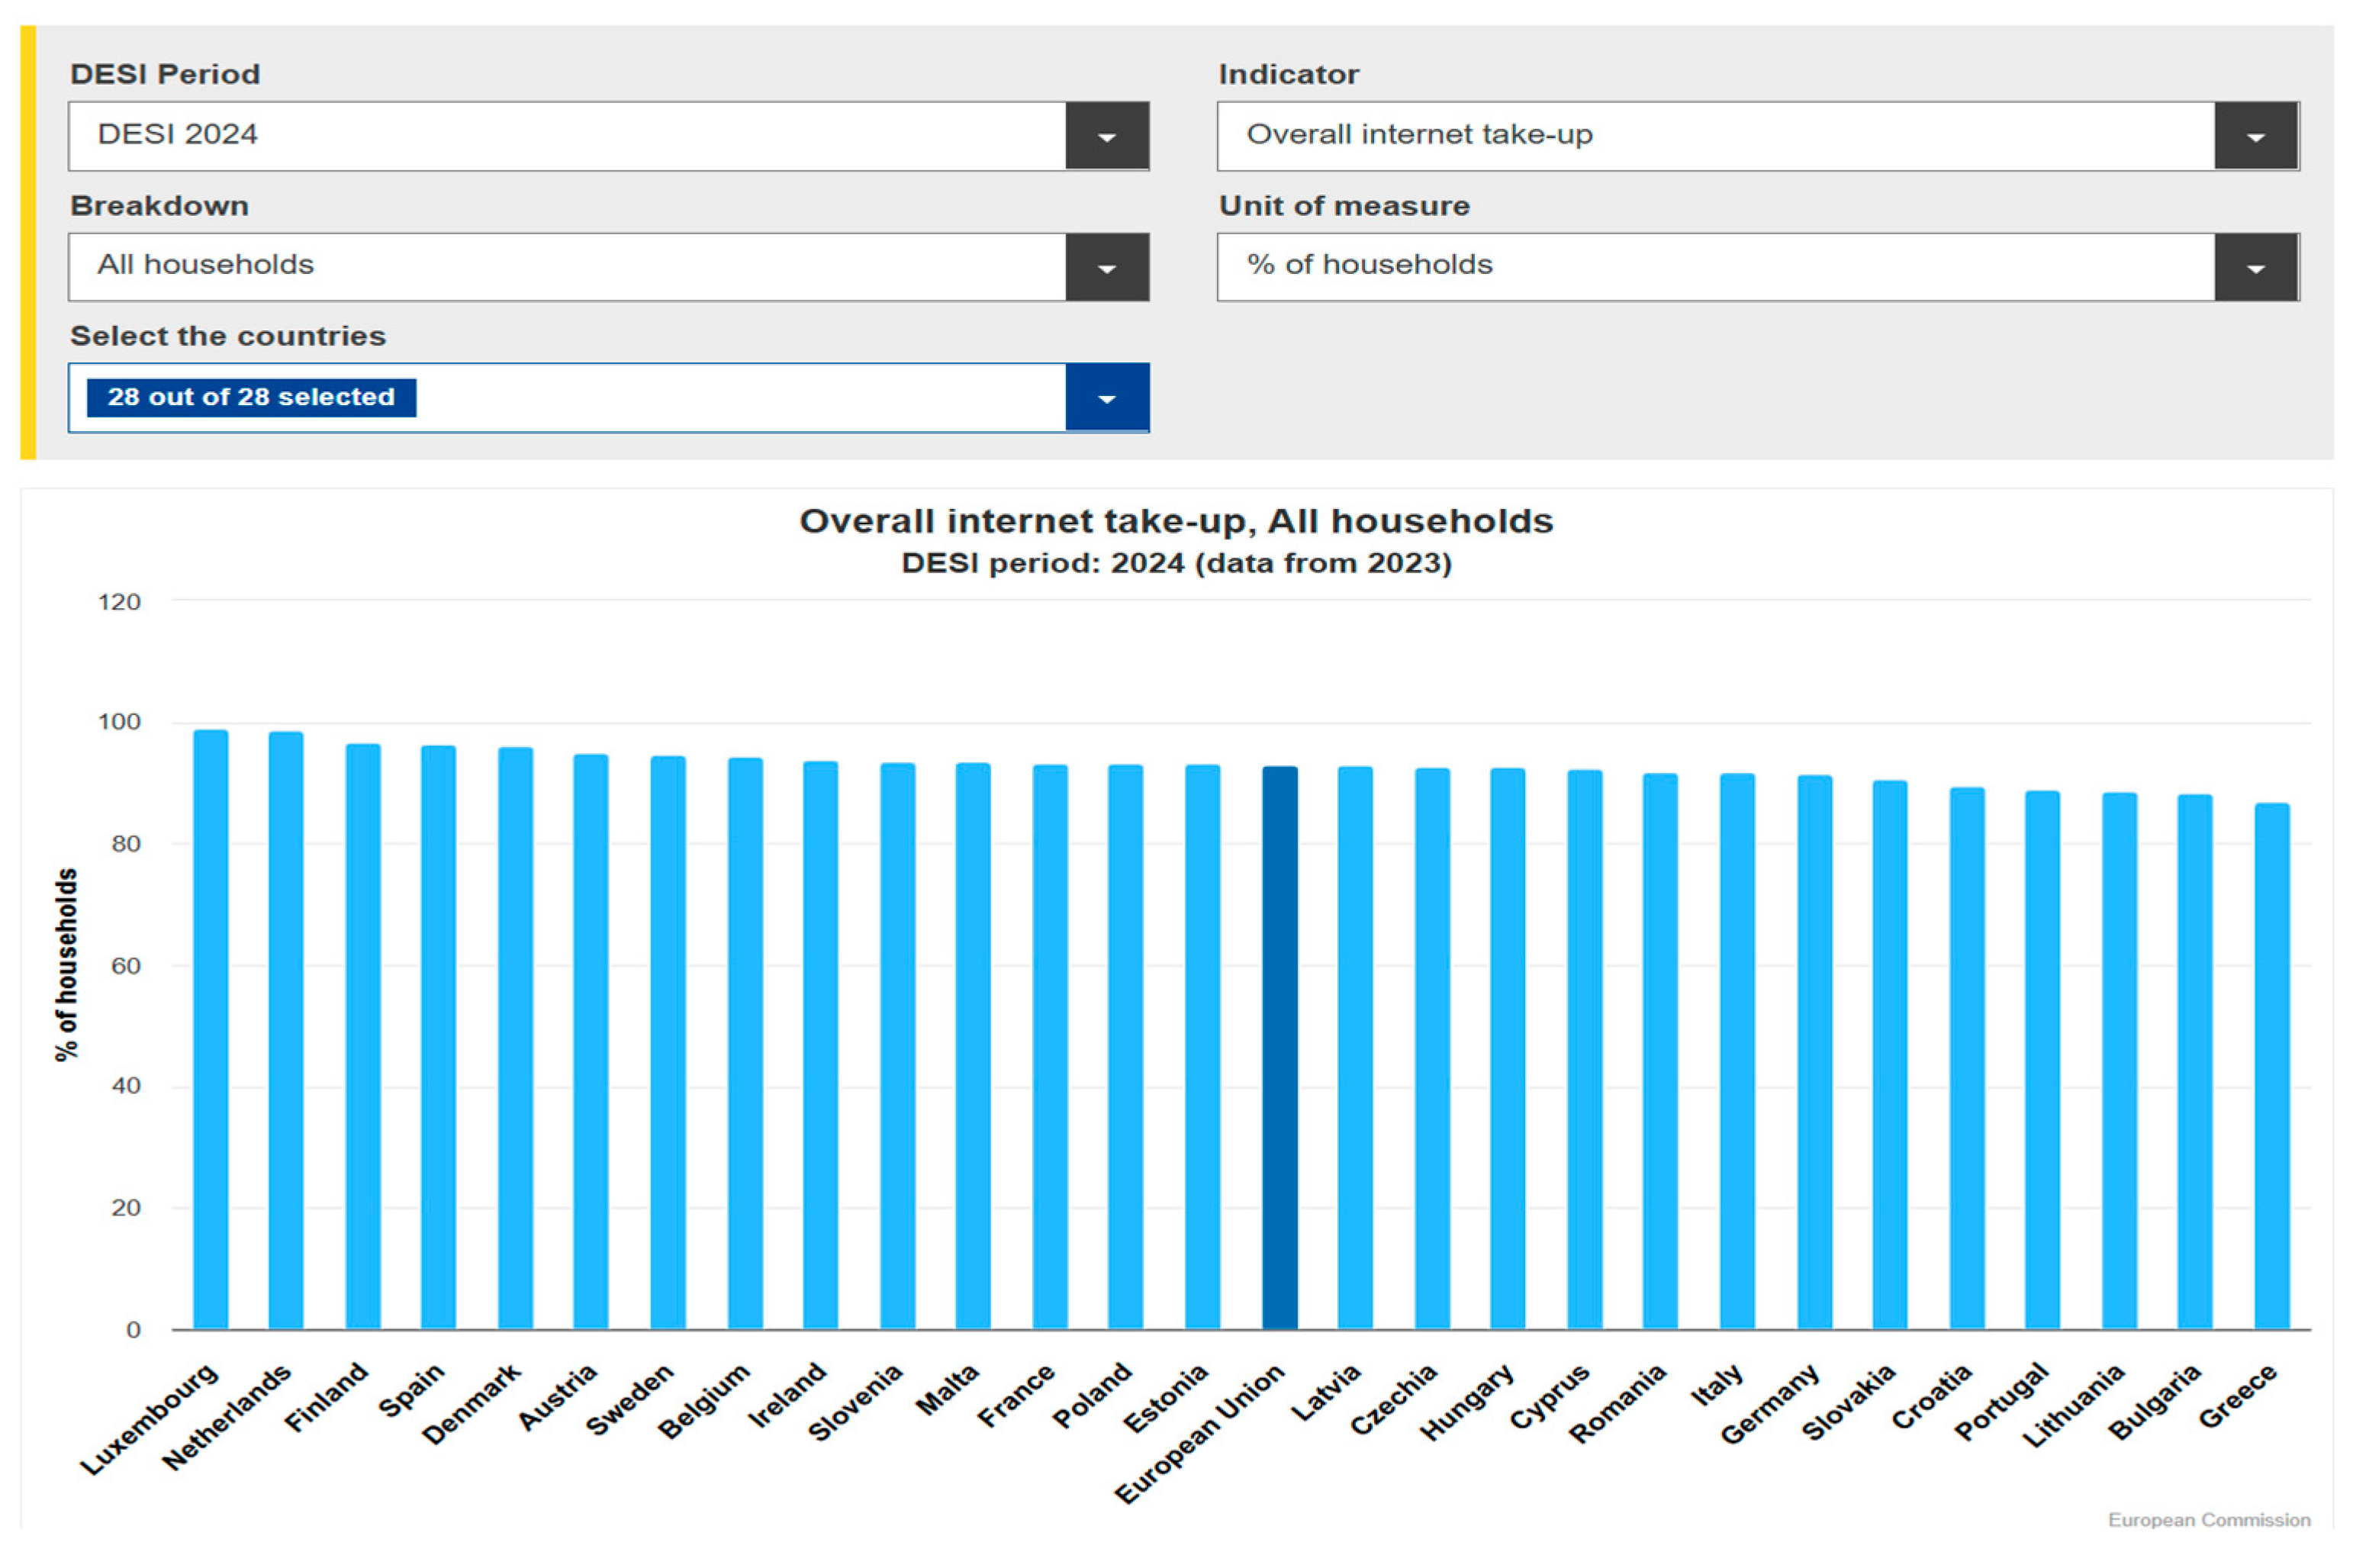
  • Overall internet take-up;
  • Share of fixed broadband subscriptions ≥ 100 Mbps;
  • Share of fixed broadband subscriptions ≥ 1 Gbps;
  • Fixed Very-High-Capacity Network (VHCN) coverage;
  • FTTP coverage;
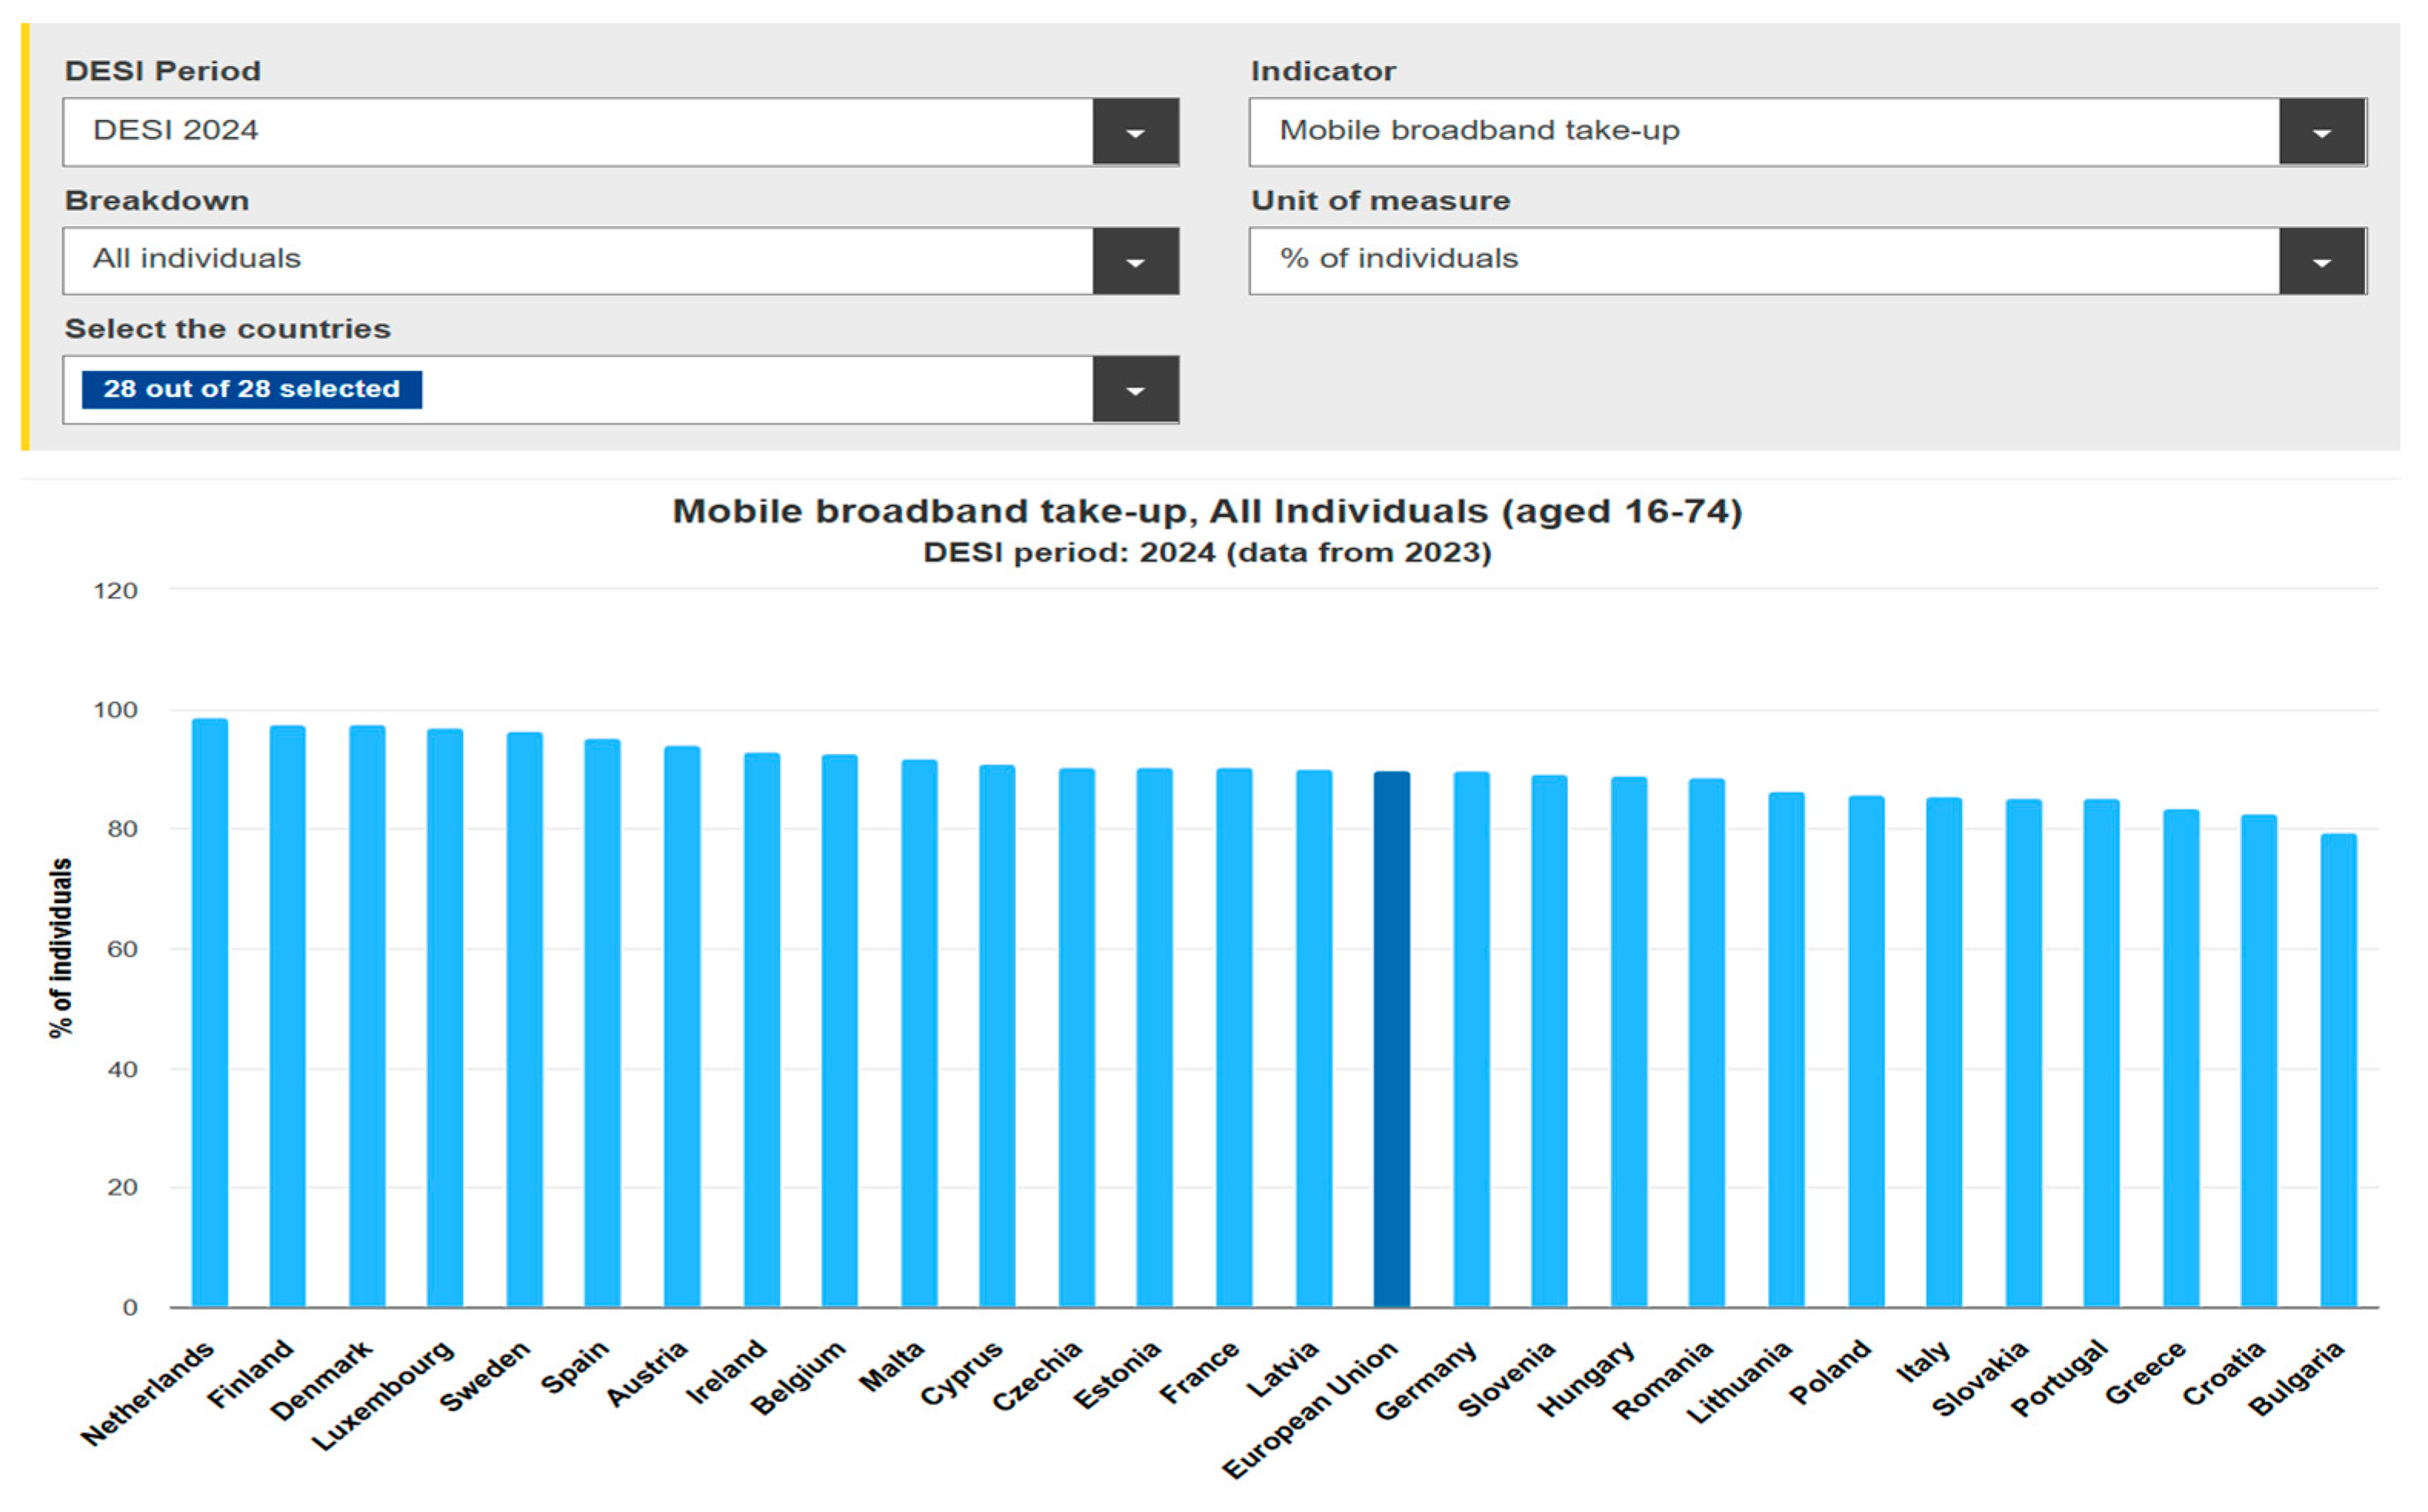
  • Mobile broadband take-up;
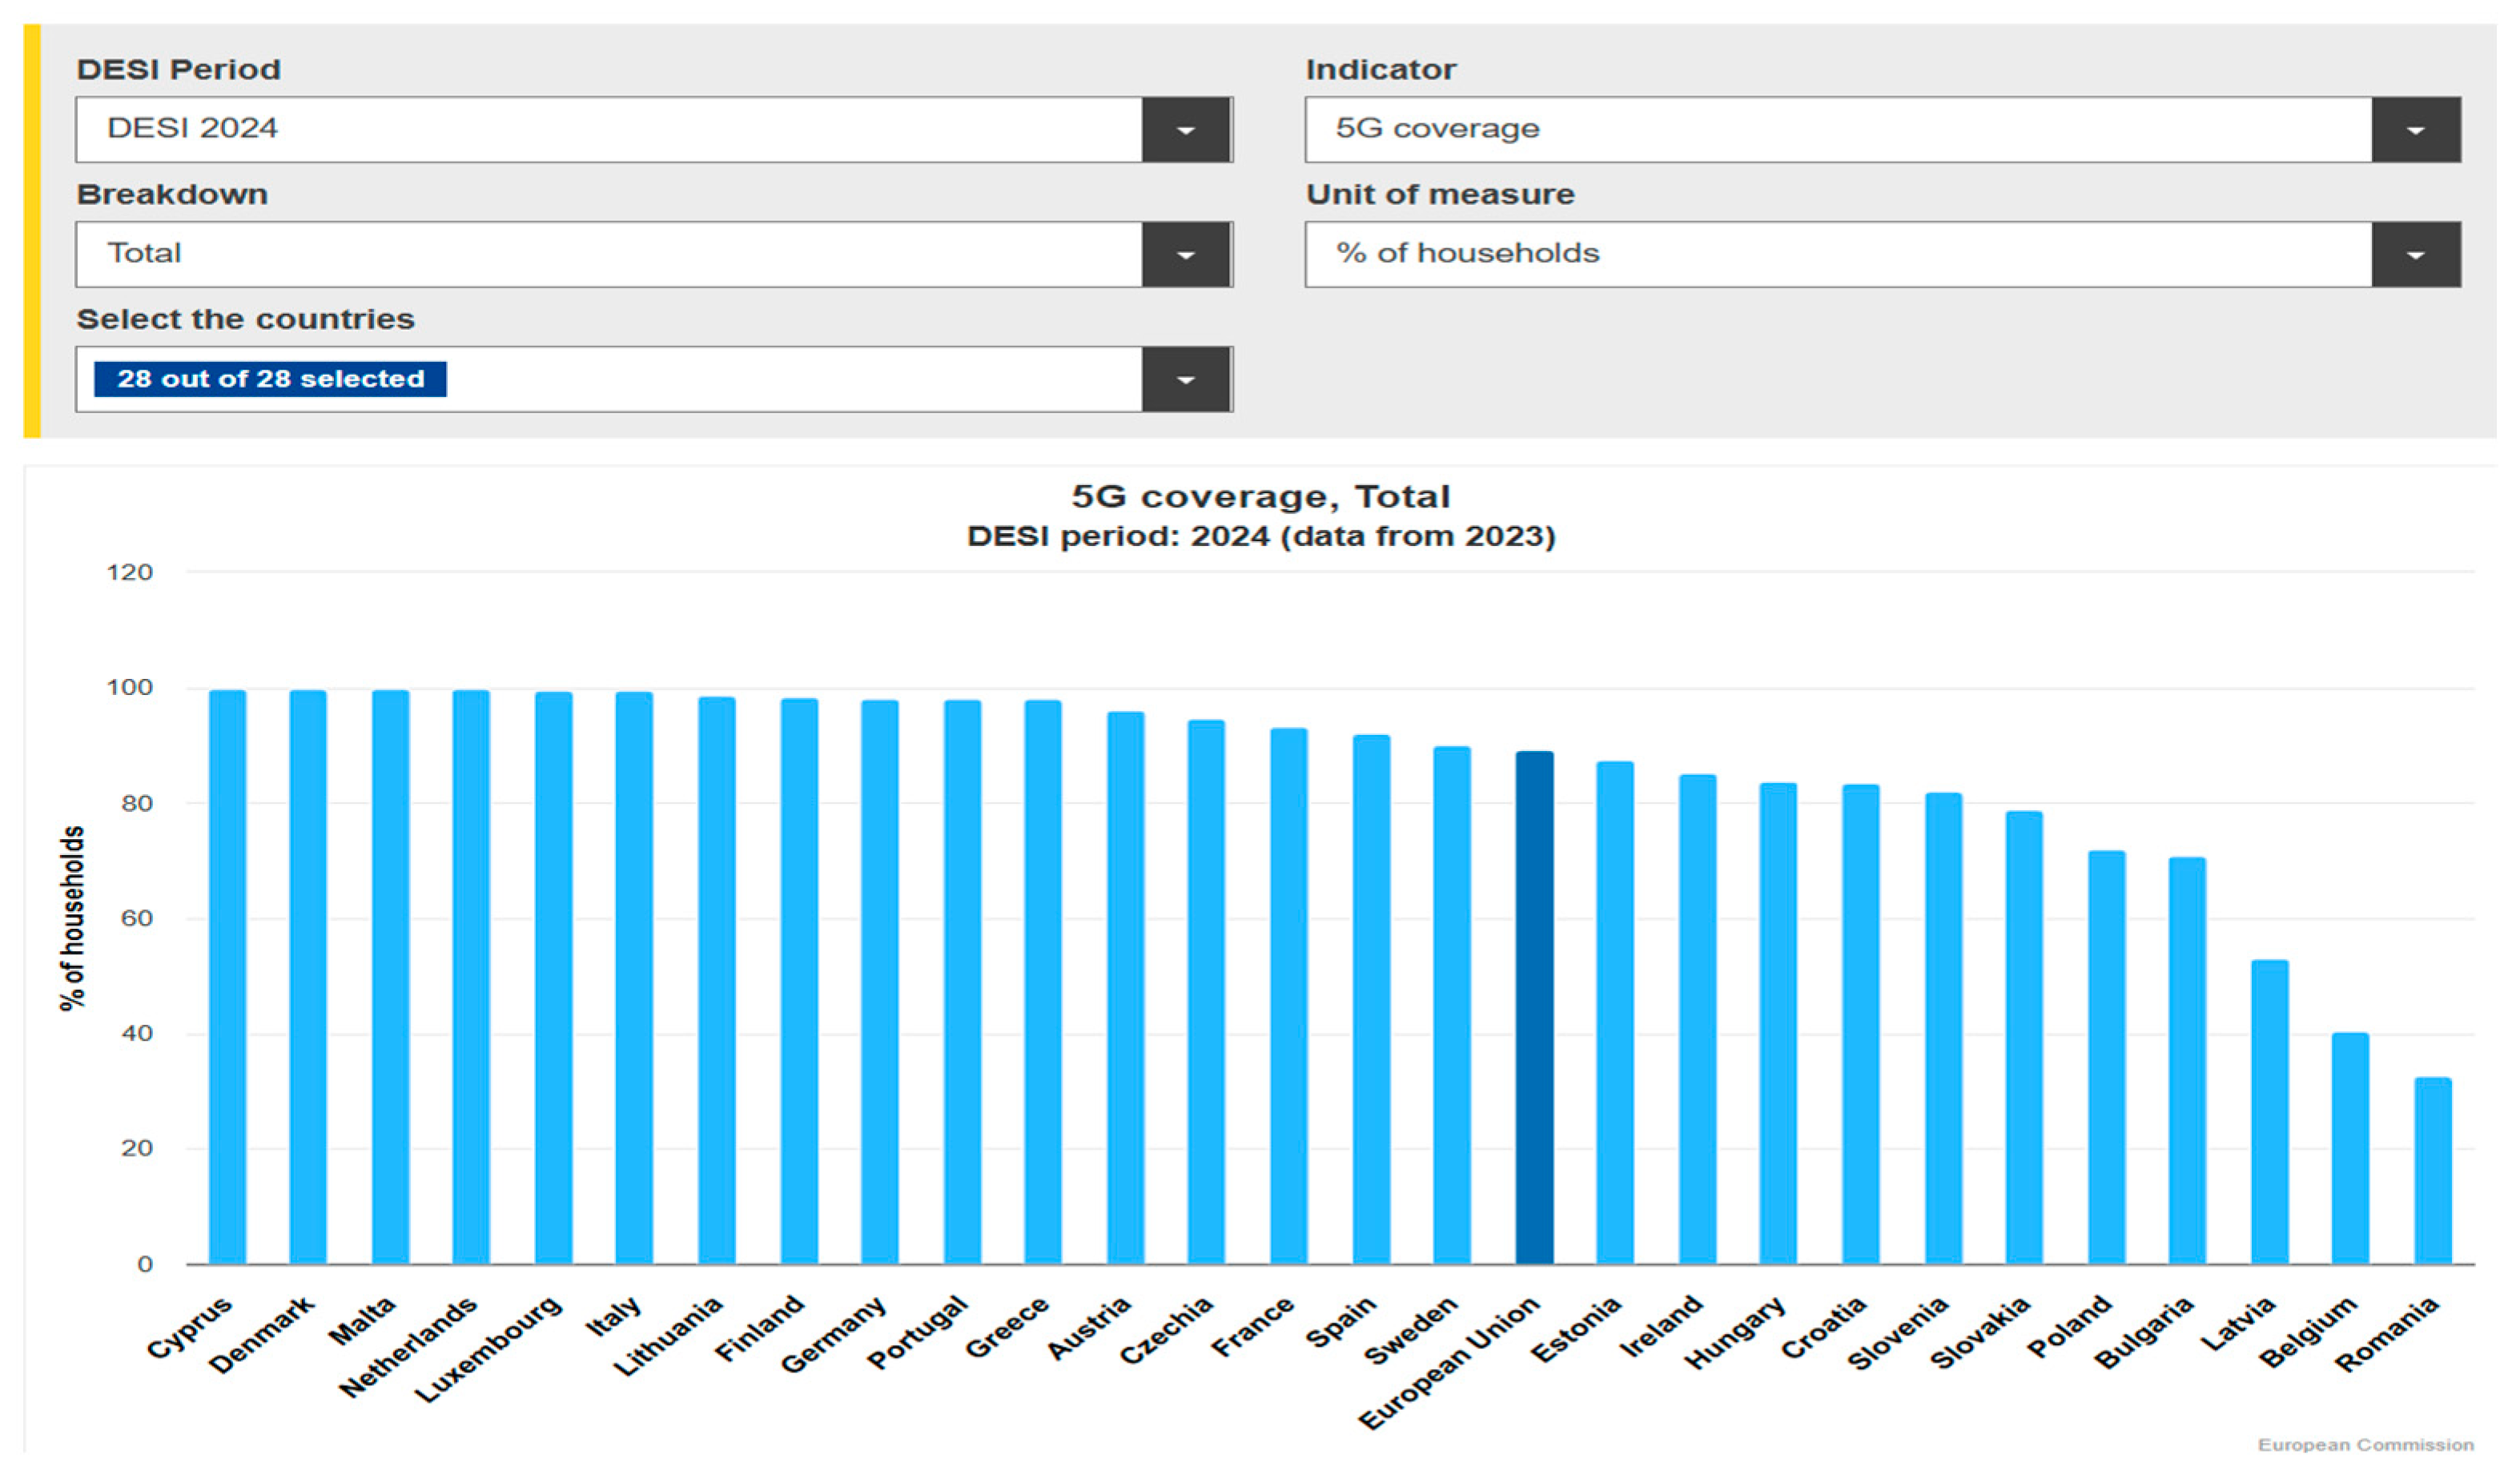
  • Overall 5G coverage;
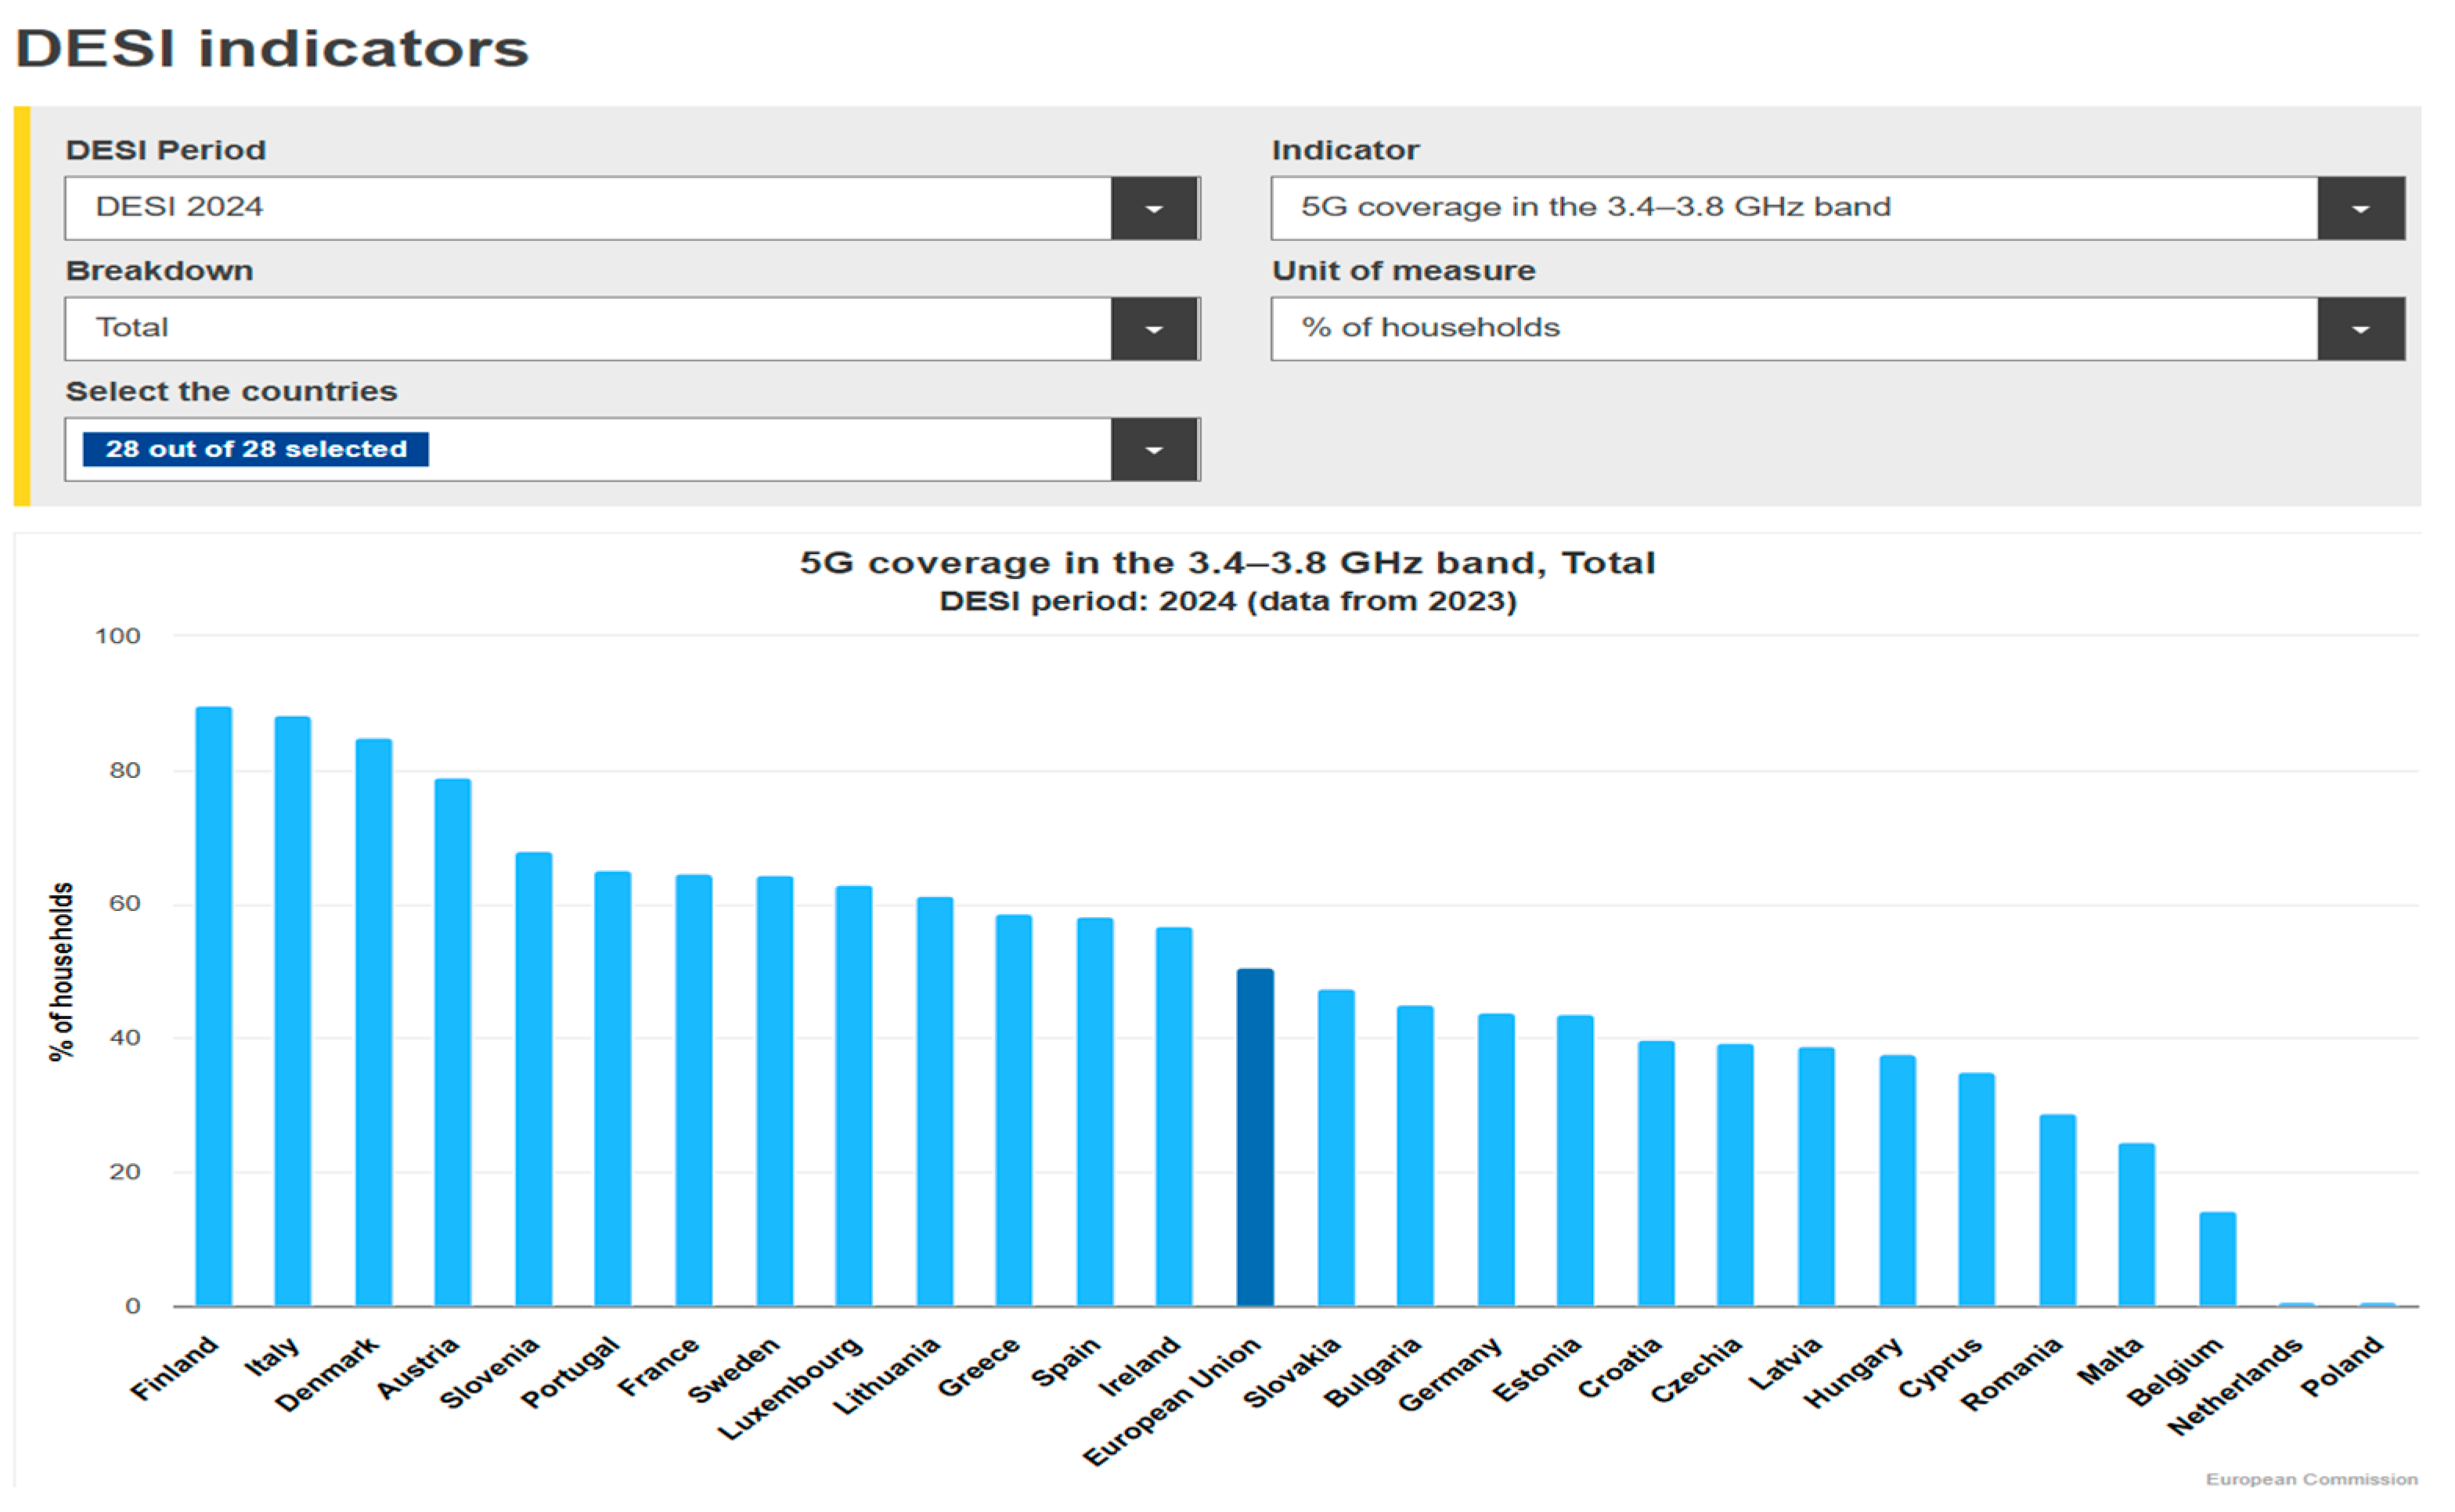
  • 5G coverage in the 3.4–3.8 GHz band;
  • 5G spectrum;
  • 5G Subscriber Identity Module (SIM) cards share of population;
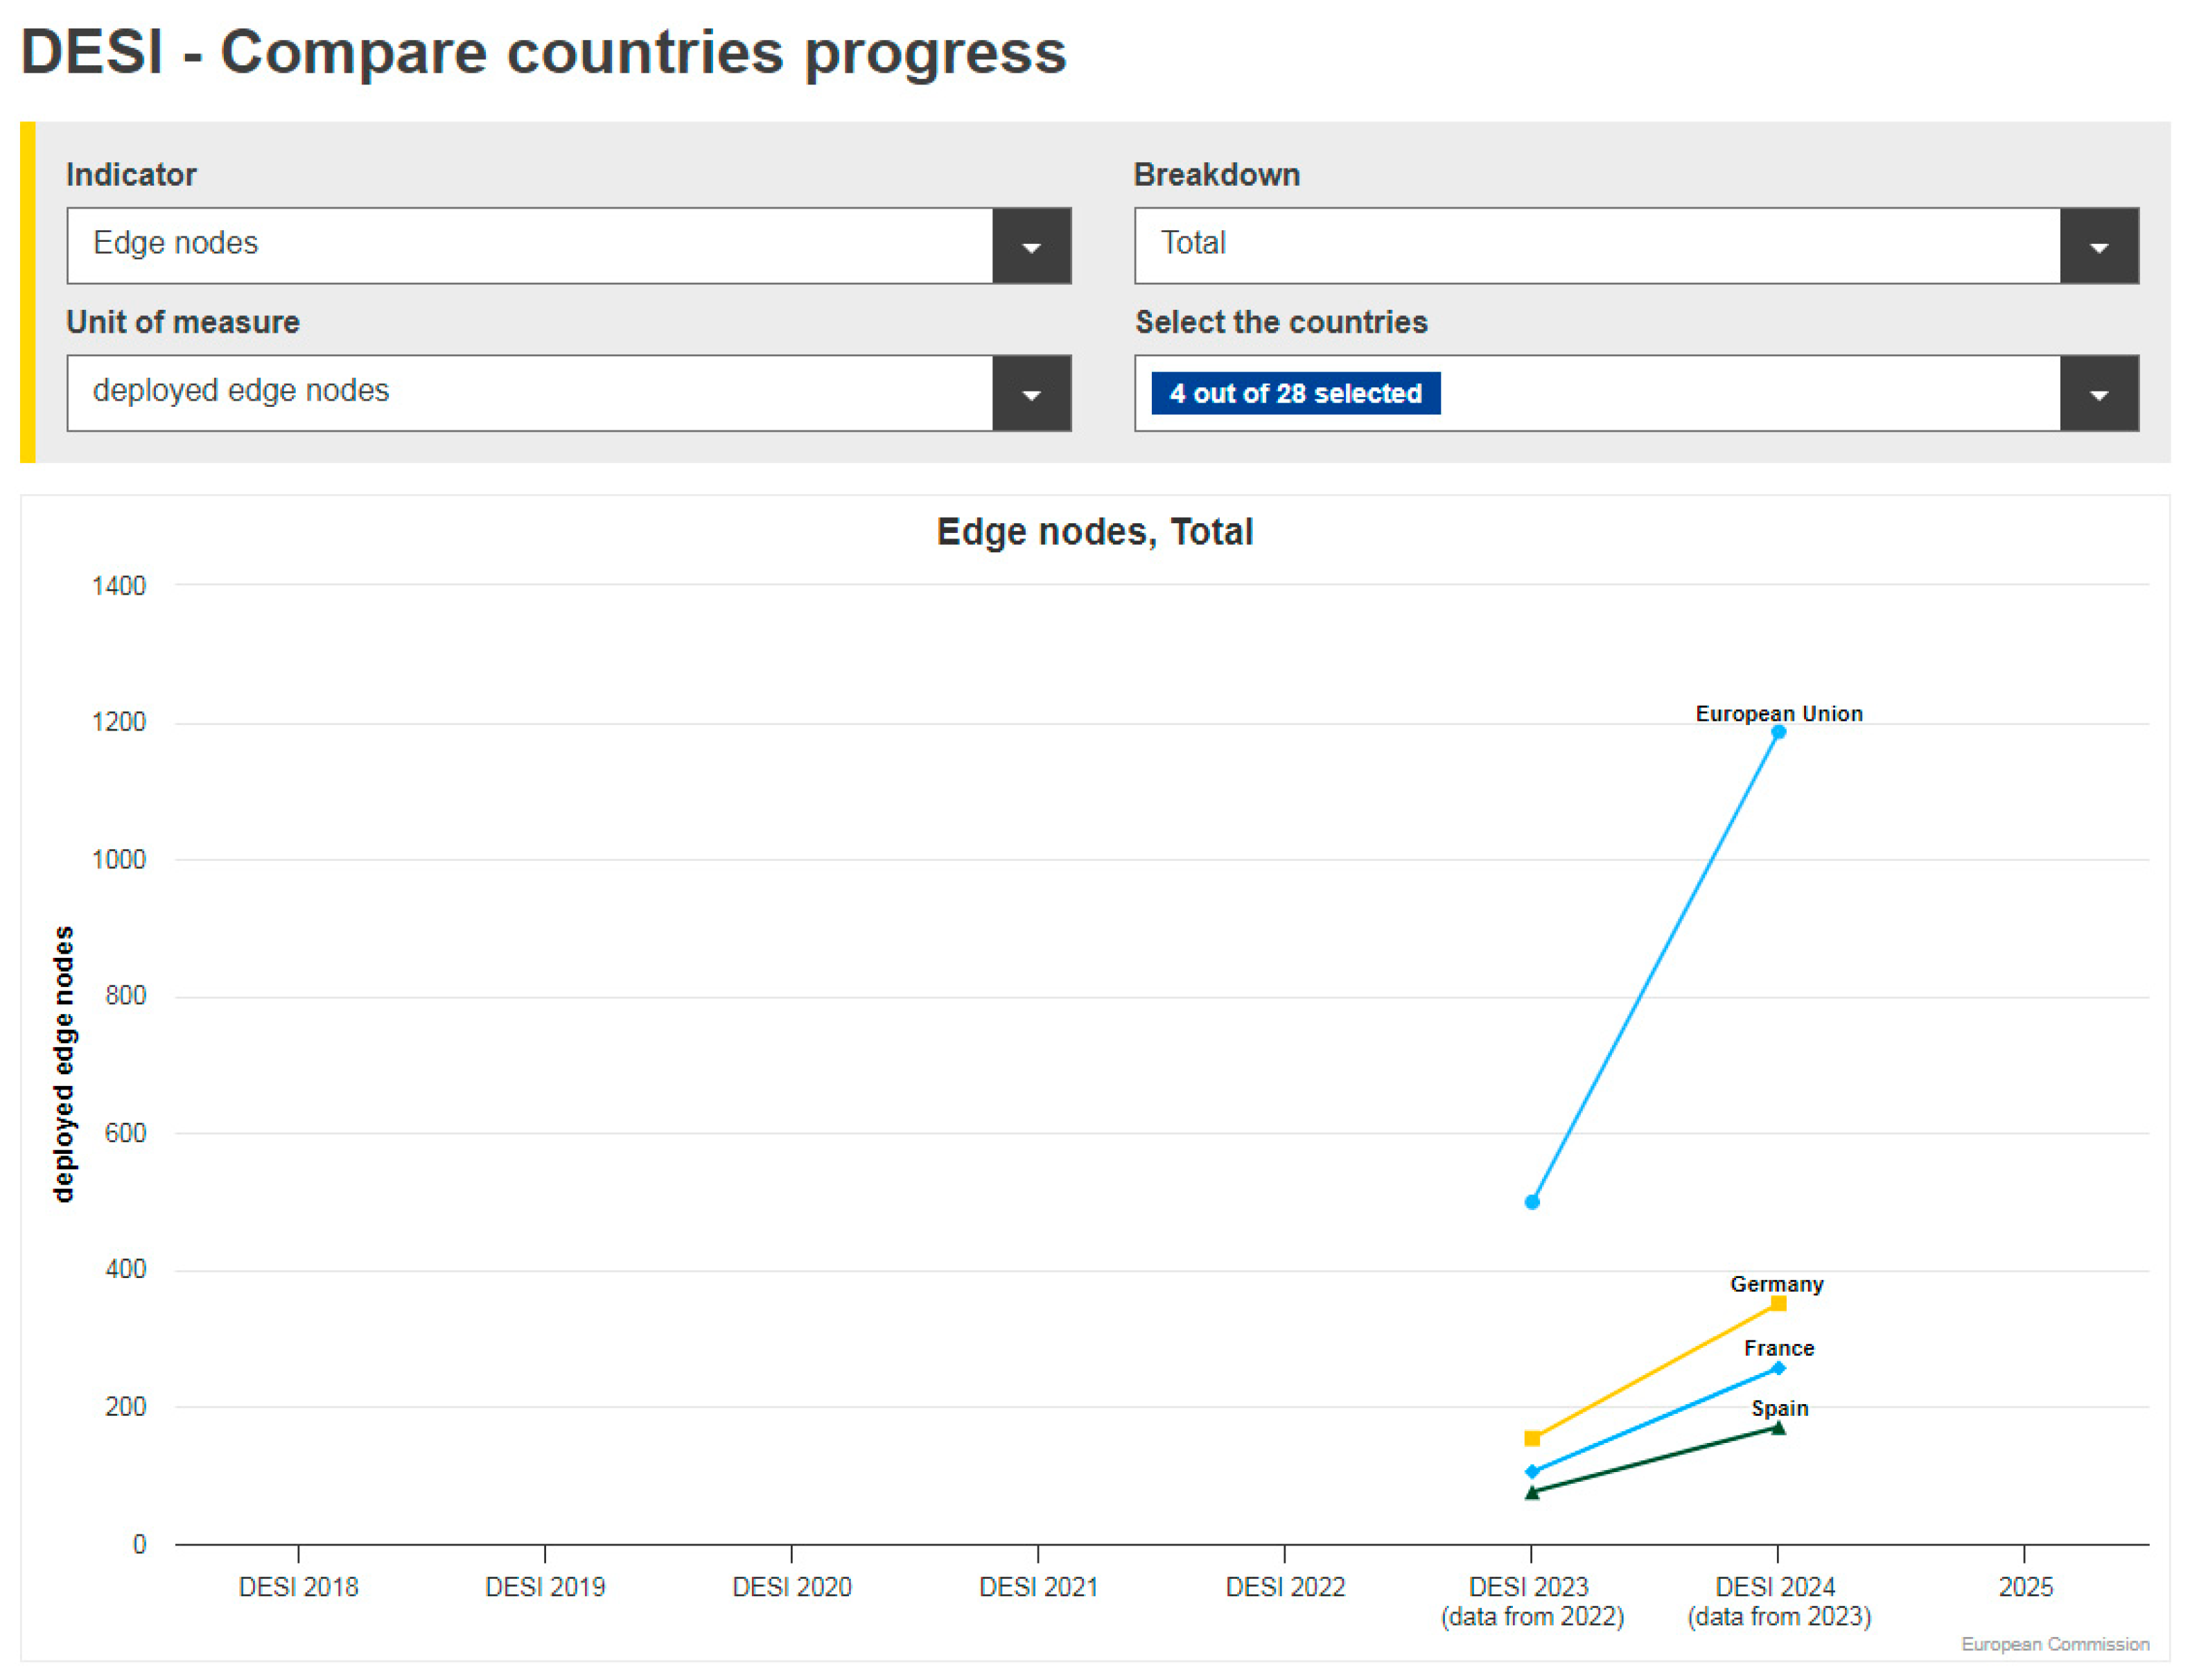
  • Edge nodes.
Note that this list is expanded compared to last year’s version of DESI 2023.
By definition, the indicator “Overall internet take-up” counts the percentage of households that have access to the internet at home. As can be seen in Figure 9, the EU has quite good and uniformly distributed coverage of internet access at home across the different countries. The average for the EU is 93.09%, with the maximum being 99.06% for Luxembourg and the minimum being 86.9% for Greece having access to the internet at home.
Fixed internet usage in the EU is shown in Figure 10, Figure 11 and Figure 12. Figure 10 shows the use of a share of fixed broadband subscriptions ≥ 100 Mbps.
Data on using the “Share of fixed broadband subscriptions ≥ 1 Gbps” indicator is shown in Figure 11.
Analysis of the data in Figure 10 and Figure 11 shows that currently in the EU, fixed gigabit connections are used nearly 3.5 times less than fixed 100 Mbps connections. The average value for fixed 100 Mbps connections is 65.9%, while for fixed gigabit connections, it is only 18.5%.
For the analysis of fixed communication systems, DESI provides two more indicators: VHCN coverage (Figure 12) and Fiber to the Premises (FTTP) coverage (Figure 13). By definition, the first (Figure 12) is the percentage of households covered by any fixed VHCN, that is, an all-optical-fiber network, and the second (Figure 13) is the percentage of households covered by Fiber to the Home and Fiber to the Building.
The average value for VHCN coverage is 78.81%, with the maximum of 100% for Malta and the minimum of 38.41% for Greece.
The average value for FTTP coverage, today’s most promising fixed-line technology, is 63.99%.
The following indicators characterize the state of mobile communication use in the EU. The first indicator is mobile broadband take-up (Figure 14); the DESI indicator counts individuals who use the internet on a mobile device.
The figure shows high levels of mobile device usage in most countries, ranging from 80 to 99%, with an average of almost 90%.
The first indicator for characterizing the use of mobile communications in the EU is the 5G coverage indicator. By definition, it is the percentage of households with coverage by at least one 5G mobile network (Figure 15).
In five countries, we see 100% use of 5G technology, with six more in the range above 98%; the average value for the EU is also high (89.3%), but there are a few countries with low use, with the minimum value of 32.75% in Romania. It should be noted that the EU is actively working to expand 5G coverage on its territory; over the past year, it has increased by 10%. To obtain an idea of using 5G in the world as a whole, you can look at Figure 16 [25], where 5G coverage areas are shown in purple. The figure illustrates that the EU is one of the world leaders in using 5G technology.
Different 5G services and use cases use different frequency bands. The designated Frequency Range 1 (FR1) band (410 MHz–7.125 GHz) is suitable for cellular mobile communications, while the FR2 band (24.25 GHz–52.6 GHz) is ideal for high data rates, but only over short distances [26,27]. The Digital Decade DESI visualization tool provides an opportunity to analyze in more detail the use of 5G technology, depending on its varieties. The next indicator, “5G Coverage in the 3.4–3.8 GHz Band”, provides an estimate of the percentage of households that have 5G coverage in this spectrum band (Figure 17). The average percentage of EU households covered by 5G in the 3.4–3.8 GHz band is 50.6% and varies widely across countries, ranging from 0% in Poland to nearly 90% in Finland.
The next metric, “5G spectrum” (Figure 18), is defined as the amount of spectrum designated and ready for 5G use in the so-called 5G pioneer bands, each of which has equal weight. The pioneer bands are the 700 MHz band (703–733 MHz and 758–788 MHz), the 3.6 GHz band (3400–3800 MHz), and the 26 GHz band (1000 MHz within 24,250–27,500 MHz). The unit of measurement is the percentage of harmonized spectrum assigned. In ten EU27 countries, the coverage rate is in the range of (95–100)%, and in the other ten, it is in the range of (59–67)%, with an average coverage rate of 73.4%.
The last indicator for 5G technology is “5G SIM cards share of population” (Figure 19). This is a new indicator; it did not exist in DESI 2023 last year. By definition, these are 5G mobile subscriptions related to SIM cards that have generated internet traffic in the previous 90 days. The unit of measure is the percentage of the total population.
Three countries have a 5G SIM card share value that exceeds 100%: Cyprus, Luxembourg, and The Netherlands. The average value for the EU is just 24.62%, while the remaining 20 countries, which make up the vast majority, use 5G SIM card services below the average.
The final indicator for digital infrastructure is “Edge nodes” (Figure 20). This is a relatively new indicator in DESI, first appearing two years ago. Edge nodes are the basis for edge networking, which is characterized by moving processes closer to the user, to data collection sources. For an edge network to work, clients must connect to an edge module nearby. This minimizes latency compared to communicating with remote devices. The Edge nodes indicator measures the number of deployed edge nodes that provide latencies of less than 20 ms. Twenty milliseconds is the ping from you to the destination you pinged.
The total number of deployed nodes in the EU is 1186. Only three countries have more than 100 edge nodes. However, the need for such nodes depends on the country’s area, so this indicator cannot directly assess the state of this technology as a whole.
However, we would like to highlight the rapid growth of edge nodes in the EU countries over the past year. Figure 21 helps to do that.
Figure 21 illustrates that, according to DESI 2023, the number of edge nodes in the EU was only 499, and according to DESI 2024, it is already 1186. That is, their number has increased by more than 2.3 times, which indicates the rapid growth of this technology over the past year.
Deploying end nodes to perform computing processes closer to the sources and consumers of information allows you to reduce network latency and improve their security significantly. The increase in end nodes can become the basis for a leap in the EU digital transformation in terms of the Internet of Things, the Internet of Everything, and the automation of production processes.

5. Discussion

Digital skills are one of the most critical factors influencing society’s and the economy’s digital transformation. Even with a developed ICT sector, weak digital skills in civil society will hinder its further development due to the low active use of the opportunities already provided to society. It is important to analyze separately the level of digital skills for consumers and digital skills for professionals working in the ICT sector. Analyzing the level of their skills, comparing them with the best and average values in EU countries, and aligning them with the needs of sectors will contribute to developing the countries’ economies.
A high level of digital skills among both citizens and IT specialists is a good assistance in the digital transformation of the country, but the basis for this is and always will be digital infrastructure. Therefore, the transition to advanced digital infrastructures that are secure, resilient, and capable of supporting future applications in different sectors can be considered a strategic challenge for the EU.
Among fixed wired communications, the best opportunities and prospects today are provided by fiber-optic communications. The average value for FTTP coverage for EU27 countries is 63.99%.
As for wireless mobile technologies, it is recommended to focus on the development of 5G technology, especially on those components that ensure highly reliable communication with ultra-low delays. The latter is very promising for the rapid improvement of the quality of the digital economy in certain industries.
5G SIM card service is also not yet widespread in Europe. The average penetration of this service does not exceed a quarter of the total population, although there are three countries where this value exceeds 100%.
DESI indicators must evolve in step with next-generation digital technologies. Currently, DESI 2024 does not include data on the separate use of the 5G frequency band (24.25 GHz–52.6 GHz). Adding such an indicator would allow assessing a country’s readiness for technological leaps in areas that require extremely low latency, high speeds, and reliability. Examples of such technologies include smart vehicles, remote control of critical devices, and remote surgery.
One of the latest trends in the development of the EU’s digital infrastructure is edge networking. Edge networking minimizes latency because client devices communicate not with remote processing devices, but with peripheral nodes located nearby. Edge networking enables the implementation of edge computing, which in turn provides companies the means to change the way they do business. Ultimately, this technology will allow organizations to improve service efficiency and security while reducing costs. It should be noted that different edge networks have different requirements for edge nodes in terms of bandwidth, computing power, power consumption, and network connectivity. Edge networking may require increased reliability and resilience. If so, networks should be designed with redundant edge nodes in order to provide customer service in the case of node failure.
Finally, it should also be noted that the issue of network infrastructure security is now coming to the fore. Various methods are being developed to improve data transmission security, such as enhancing 5G Network Slicing Security by using Artificial Intelligence and Soft Defined Networks (SDN) [28], ensuring traffic protection when only passive optical components are used in remote nodes of the Wavelength Division Multiplexer passive optical networks (WDM-PON) network [29], bypassing distrustful routers at packet routing [30], and special algorithms for the detection of DDoS attacks for SDN [31]. The review [32] presents the area of risks in information security of smart cities, and provides literature sources relevant to cloud threats and security attacks, including attacks on Internet of Things devices. Despite this, DESI materials still do not contain indicators that could assess the security status of digital infrastructure.

6. Conclusions

Based on the DESI visualization tool developed by the European Commission, a study and analysis of digital skills and digital infrastructure in the European Union countries was conducted. It is shown that only the harmonious combination of these two indicators will contribute to the successful development of countries in terms of their digital transformation.
It has been shown that one of the most important indicators of digital skills, namely the ICT graduate rate, which affects the ability to maintain IT products and create new ones, is significantly uneven across the European Union countries, ranging from 11% in the best cases to 1–3 % in some countries. Regional imbalances identified in some southern European countries will hinder their long-term competitiveness in the digital economy. The identification of such risks highlights the need for targeted policy interventions in the planning of IT education in countries where stagnant ICT graduation rates have been observed.
Today, positive trends in the field of digital infrastructure within fixed communications include fiber-optic FTTP, which currently has a coverage of about 70% in the EU. Within the framework of mobile communications, efforts should be focused on the development of 5G technology, especially on those components of it that provide highly reliable communication with ultra-low latency. To this end, we recommend that a new indicator be added to DESI within the framework of 5G technology, which would separately take into account the frequency range 24.25 GHz–52.6 GHz.

Author Contributions

Conceptualization, K.O. and A.A.; methodology, K.O., A.D. and A.A.; formal analysis, I.D., O.L. and R.L.; investigation, K.O. and A.A.; writing—original draft preparation, K.O. and O.L.; writing—review and editing, I.D. and R.L; visualization, I.D.; supervision, O.L. and R.L.; project administration, A.D. and I.D.; funding acquisition, A.D. All authors have read and agreed to the published version of the manuscript.

Funding

The research was carried out within the framework of the Erasmus + Jean Monnet Module «European Data Strategy: Data Governance for New Opportunities», 101127839—Data4EU—ERASMUS-JMO-2023-HEI-TCH-RSCH.

Data Availability Statement

The original contributions presented in this study are included in the article. Further inquiries can be directed to the corresponding author.

Acknowledgments

The authors would like to thank the Armed Forces of Ukraine for providing security to perform this work. This has become possible only due to the resilience and courage of the Ukrainian Army.

Conflicts of Interest

The authors declare no conflicts of interest.

Abbreviations

The following abbreviations are used in this manuscript:
DESIDigital Economy and Society Index
EUEuropean Union
ITInformation Technology
ICTInformation and Communication Technology
VHCNVery-High-Capacity Network
FTTPFiber To The Premises
SIMSubscriber Identity Module
FRFrequency Range
SDNSoft Defined Networks
DDoSDistributed Denial of Service
WDM-PONWavelength Division Multiplexer Passive Optical Networks

References

  1. Szajt, M.; Smoląg, K.; Chomiak-Orsa, I. Digitization in European Union countries. Convergence analysis based on DESI. Procedia Comput. Sci. 2024, 246, 5448–5457. [Google Scholar] [CrossRef]
  2. Europe’s Digital Decade. Available online: https://digital-strategy.ec.europa.eu/en/policies/europes-digital-decade (accessed on 14 April 2025).
  3. Bielialov, T.; Kalina, I.; Goi, V.; Kravchenko, O.; Shyshpanova, N. Global Experience of Digitalization of Economic Processes in the Context of Transformation. J. Law Sustain. Dev. 2023, 11, e814. [Google Scholar] [CrossRef]
  4. Vărzaru, A.A.; Bocean, C.G. Digital Transformation and Innovation: The Influence of Digital Technologies on Turnover from Innovation Activities and Types of Innovation. Systems 2024, 12, 359. [Google Scholar] [CrossRef]
  5. Sevgi, H. Analysis of the digital economy and society index (DESI) through a cluster analysis. Trak. Üniversitesi Sos. Bilim. Derg. 2021, 23, 37–51. [Google Scholar] [CrossRef]
  6. The Digital Economy and Society Index (DESI). Available online: https://digital-strategy.ec.europa.eu/en/policies/desi (accessed on 14 April 2025).
  7. Doroiman, M.; Sîrghi, N. The digital enterprise landscape: How DESI metrics shape economic growth in the EU. Oradea J. Bus. Econ. 2024, 9, 36–46. [Google Scholar] [CrossRef]
  8. Forzati, M.; Lane-Spollen, A. Analyzing DESI 2022: Deployment of Rural Very High-Capacity Networks Must Accelerate. 2022. Available online: https://digital-strategy.ec.europa.eu/en/news/analysing-desi-2022-deployment-rural-very-high-capacity-networks-must-accelerate (accessed on 14 April 2025).
  9. Imran, M.; Liu, X.; Wang, R.; Saud, S.; Zhao, Y.; Khan, M.J. The Influence of Digital Economy and Society Index on Sustainable Development Indicators: The Case of European Union. Sustainability 2022, 14, 11130. [Google Scholar] [CrossRef]
  10. Paraschiv, D.M.; Atif, M.; Petrariu, I.R.; Gheorghe, M.; Dieaconescu, R.I.; Istudor, M. Shaping Europe’s digital and sustainable future: Analysis of the digital economy and society index in the pre-and post-pandemic period. Amfiteatru Econ. J. 2024, 26 (Special 18), 1012. [Google Scholar] [CrossRef]
  11. Bruno, G.; Diglio, A.; Piccolo, C.; Pipicelli, E. A reduced Composite Indicator for Digital Divide measurement at the regional level: An application to the Digital Economy and Society Index (DESI). Technol. Forecast. Soc. Change 2023, 190, 122461. [Google Scholar] [CrossRef]
  12. DESI Indicator. Available online: https://digital-decade-desi.digital-strategy.ec.europa.eu/datasets/desi/charts/desi-indicators?period=desi_2024&indicator=desi_sme_eturn&breakdown=ent_sm_xfin&unit=pc_turn&country=AT,BE,BG,HR,CY,CZ,DK,EE,EU,FI,FR,DE,EL,HU,IE,IT,LV,LT,LU,MT,NL,PL,PT,RO,SK,SI,ES,SE (accessed on 14 April 2025).
  13. Kovtun, V.; Izonin, I. Study of the Operation Process of the E-Commerce Oriented Ecosystem of 5Ge Base Station, which Supports the Functioning of Independent Virtual Network Segments. J. Theor. Appl. Electron. Commer. Res. 2021, 16, 2883–2897. [Google Scholar] [CrossRef]
  14. Shah, H.; Vyas, A.K. A systematic review for 6G and beyond 6G enable IoT Network. In Proceedings of the 2024 2nd International Conference on Computer, Communication and Control (IC4), Indore, India, 8–10 February 2024; pp. 1–5. [Google Scholar] [CrossRef]
  15. Kovtun, V.; Grochla, K.; Altameem, T.; Al-Maitah, M. Evaluation of the QoS policy model of an ordinary 5G smart city cluster with predominant URLLC and eMBB traffic. PLoS ONE 2023, 18, e0295252. [Google Scholar] [CrossRef]
  16. Obelovska, K.; Mamchuk, O.; Abzyatov, A.; Gregus ml, M.; Liskevych, O.; Liskevych, R. Enhancing Autoscaling in Cloud Environment: Case of Hotels Network Management System. Procedia Comput. Sci. 2024, 251, 639–644. [Google Scholar] [CrossRef]
  17. Walczyk, G.; Ożadowicz, A. Building Information Modeling and Digital Twins for Functional and Technical Design of Smart Buildings with Distributed IoT Networks—Review and New Challenges Discussion. Future Internet 2024, 16, 225. [Google Scholar] [CrossRef]
  18. Krishnamoorthy, V.; Izonin, I.; Subramanian, S.; Shandilya, S.; Velayutham, S.; Munichamy, T.; Havryliuk, M. Saving Optimization Technique-Based Routing Protocol in Mobile Ad-Hoc Network with IoT Environment. Energies 2023, 16, 1385. [Google Scholar] [CrossRef]
  19. Tymchenko, O.; Havrysh, B.; Nazarkevych, M.; Tymchenko, O.O.; Khamula, O. Architecture of the Simulator of the Personal Local Wireless Networks: Examples of implementation. In Proceedings of the IntelITSIS: 2nd International Workshop on Intelligent Information Technologies and Systems of Information Security, Khmelnytskyi, Ukraine, 24–26 March 2021. [Google Scholar]
  20. Mochurad, L.; Hladun, Y.; Zasoba, Y.; Gregus, M. An Approach for Opening Doors with a Mobile Robot Using Machine Learning Methods. Big Data Cogn. Comput. 2023, 7, 69. [Google Scholar] [CrossRef]
  21. Afolalu, O.; Tsoeu, M.S. Enterprise Networking Optimization: A Review of Challenges, Solutions, and Technological Interventions. Future Internet 2025, 17, 133. [Google Scholar] [CrossRef]
  22. Karthick, G.; Mapp, G. Developing a Secure Service Ecosystem to Implement the Intelligent Edge Environment for Smart Cities. Future Internet 2024, 16, 317. [Google Scholar] [CrossRef]
  23. Dronyuk, I.; Moiseienko, I.; Greguš ml, J. Analysis of creative industries activities in European Union countries. Procedia Comput. Sci. 2019, 160, 479–484. [Google Scholar] [CrossRef]
  24. Digital Decade DESI Visualization Tool. Available online: https://digital-decade-desi.digital-strategy.ec.europa.eu/ (accessed on 14 April 2025).
  25. 5G Map. Available online: https://www.nperf.com/en/map/5g (accessed on 14 April 2025).
  26. Andrade-Gonzalez, E.A.; Reyes-Ayala, M.; Luna, J.I.V.; Terres-Peña, H.; Rivera, R.R.; Sánchez, S.C. Fractal Monopole Antenna based on Tree Fractal for Future Bands 5G. WSEAS Trans. Commun. 2025, 24, 1–6. [Google Scholar] [CrossRef]
  27. Asgharzadeh, A.; Maroufi, M. Performance Analysis of 5G for Low Latency Transmission Based on Universal Filtered Multi-Carrier Technique and Interleave Division Multiple Access. Eng. World 2021, 3, 52–57. [Google Scholar]
  28. Cunha, J.; Ferreira, P.; Castro, E.M.; Oliveira, P.C.; Nicolau, M.J.; Núñez, I.; Sousa, X.R.; Serôdio, C. Enhancing Network Slicing Security: Machine Learning, Software-Defined Networking, and Network Functions Virtualization-Driven Strategies. Future Internet 2024, 16, 226. [Google Scholar] [CrossRef]
  29. Róka, R. An Effective Evaluation of Wavelength Scheduling for Various WDM-PON Network Designs with Traffic Protection Provision. Symmetry 2021, 13, 1540. [Google Scholar] [CrossRef]
  30. Obelovska, K.; Snaichuk, Y.; Liskevych, O.; Mitoulis, S.-A.; Liskevych, R. Mitigation of Risks Associated with Distrustful Routers in OSPF Networks—An Enhanced Method. Computers 2025, 14, 43. [Google Scholar] [CrossRef]
  31. Zaman, A.; Khan, S.A.; Mohammad, N.; Ateya, A.A.; Ahmad, S.; ElAffendi, M.A. Distributed Denial of Service Attack Detection in Software-Defined Networks Using Decision Tree Algorithms. Future Internet 2025, 17, 136. [Google Scholar] [CrossRef]
  32. Poleto, T.; Nepomuceno, T.C.C.; de Carvalho, V.D.H.; Friaes, L.C.B.d.O.; de Oliveira, R.C.P.; Figueiredo, C.J.J. Information Security Applications in Smart Cities: A Bibliometric Analysis of Emerging Research. Future Internet 2023, 15, 393. [Google Scholar] [CrossRef]
Figure 1. DESI visualization tool interface.
Futureinternet 17 00228 g001
Figure 2. Data on the use of the “internet use” indicator.
Futureinternet 17 00228 g002
Figure 3. Data on using the “at least basic digital skills” indicator.
Futureinternet 17 00228 g003
Figure 4. Data on using the “at least basic digital skills” indicator for the age range from 16 to 24 years old.
Futureinternet 17 00228 g004
Figure 5. Data on using the “above basic digital skills” indicator.
Futureinternet 17 00228 g005
Figure 6. Data on using the “ICT specialists” indicator.
Futureinternet 17 00228 g006
Figure 7. Data on using the “ICT graduates” indicator.
Futureinternet 17 00228 g007
Figure 8. Dynamics of ICT graduates as a percentage of all graduates in EU member states, based on DESI data from 2016 to 2022.
Futureinternet 17 00228 g008
Figure 9. Data on using the “Overall internet take-up” indicator.
Futureinternet 17 00228 g009
Figure 10. Data on using the “Share of fixed broadband subscriptions ≥ 100 Mbps.” indicator.
Futureinternet 17 00228 g010
Figure 11. Data on using the “Share of fixed broadband subscriptions ≥ 1 Gbps” indicator.
Futureinternet 17 00228 g011
Figure 12. Data on using the “Fixed Very High Capacity Network coverage” indicator.
Futureinternet 17 00228 g012
Figure 13. Data on using the “FTTP coverage” indicator.
Futureinternet 17 00228 g013
Figure 14. Data on using the “Mobile broadband take-up” indicator.
Futureinternet 17 00228 g014
Figure 15. Data on using the “Overall 5G coverage” indicator.
Futureinternet 17 00228 g015
Figure 16. Using 5G technology in the world as a whole.
Futureinternet 17 00228 g016
Figure 17. Data on using the “5G Coverage in the 3.4–3.8 GHz Band” indicator.
Futureinternet 17 00228 g017
Figure 18. Data on using the “5G spectrum” indicator.
Futureinternet 17 00228 g018
Figure 19. Data on using the “5G SIM cards shared of population” indicator.
Futureinternet 17 00228 g019
Figure 20. Data on using the “Edge nodes” indicator.
Futureinternet 17 00228 g020
Figure 21. Growth of employed edge nodes from 2023 to 2024.
Futureinternet 17 00228 g021
Table 1. The comparison results of at least basic digital skills by two age categories.
Age RangeAverage in the EU, %Max, %Min, %
16–7456.5682.7Netherlands27.73Romania
16–2469.9796.09Malta47.19Romania
Disclaimer/Publisher’s Note: The statements, opinions and data contained in all publications are solely those of the individual author(s) and contributor(s) and not of MDPI and/or the editor(s). MDPI and/or the editor(s) disclaim responsibility for any injury to people or property resulting from any ideas, methods, instructions or products referred to in the content.

