Article

U-SCAD: An Unsupervised Method of System Call-Driven Anomaly Detection for Containerized Edge Clouds

School of Computer Science, Fudan University, Shanghai 200438, China
*
Authors to whom correspondence should be addressed.
Future Internet 2025, 17(5), 218; https://doi.org/10.3390/fi17050218
Submission received: 8 April 2025 / Revised: 6 May 2025 / Accepted: 9 May 2025 / Published: 14 May 2025

Abstract

:
Container technology is currently one of the mainstream technologies in the field of cloud computing, yet its adoption in resource-constrained, latency-sensitive edge environments introduces unique security challenges. While existing system call-based anomaly-detection methods partially address these issues, they suffer from high false positive rates and excessive computational overhead. To achieve security and observability in edge-native containerized environments and lower the cost of computing resources, we propose an unsupervised anomaly-detection method based on system calls. This method filters out unnecessary system call data through automatic rule generation and an unsupervised classification model. To increase the accuracy of anomaly detection and reduce the false positive rates, this method embeds system calls into sequences using the proposed Syscall2vec and processes the remain sequences in favor of the anomaly detection model’s analysis. We conduct experiments using our method with a background based on modern containerized cloud microservices. The results show that the detection part of our method improves the F1 score by 23.88% and 41.31%, respectively, as compared to HIDS and LSTM-VAE. Moreover, our method can effectively reduce the original processing data to 13%, which means that it significantly lowers the cost of computing resources.

1. Introduction

Container technology is now one of the mainstream technologies in the field of cloud computing [1]. In contrast to the traditional virtual machine (VM) model, containers share the same kernel with the host, making them more efficient in terms of resource sharing, deployment, and scalability. This makes them well-suited to microservices architectures, serverless applications, and CI/CD (continuous integration and continuous development) workflows. The container ecosystem has been widely adopted on major cloud-computing platforms. However, container technology does not inherently solve the security issues found in traditional edge-cloud environments.
In fact, due to lower resource isolation and the dynamic relationship between microservices across distributed edge nodes, containerized edge clouds face more security risks, such as container escape through kernel vulnerabilities, impacting the confidentiality, integrity, and availability of the host and cloud platform. The CNCF 2022 survey [2] indicated that 41% of respondents considered container security issues a significant challenge in production environments. On the other hand, the widespread adoption of microservices architectures has led to an expanded attack surface and increased risks. In contrast to monolithic applications with few entry points, microservices-based edge applications have numerous entry points, all of which must be protected. In the past, people relied on simply trusting the network in order to avoid security checks for each microservice. However, currently, network trust has become an outdated approach, and the industry is moving towards the principles of a zero-trust network. The polyglot architecture also increases the cost of securing microservices, as each technology stack requires its own security tools for static code analysis and dynamic testing.
While Linux provides various kernel security mechanisms like Namespace, Cgroup, and Capability [3] as the foundation for container environments, research [4] suggests that these mechanisms are not sufficient to defend against all privilege escalation vulnerabilities. Furthermore, the interdependencies and interactions among these kernel security mechanisms can weaken their protective capabilities.
Consequently, organizations have increasingly adopted Kubernetes security tools, with observability tools being the most prominent, to address these security concerns, including security tools based on system calls.
System calls, as the interface for interactions between user programs and the operating system, provide valuable insights into various system resource-related behaviors, such as device I/O (input/output) operations or network communication. Thanks to their advantages of lightweight operation and low latency, system calls have emerged as critical data sources for anomaly detection in containerized edge-cloud environments. Due to the shared kernel nature of containers (except for certain “secure containers”, like Kata (https://katacontainers.io/)), system call behaviors can easily be obtained in a non-proxy mode on the host, making them one of the mainstream approaches for container security monitoring. Currently, the primary methods for detecting container system call anomalies include rule-based and machine learning-based approaches.
Rule-based methods face the challenge of effectively generating rules in practice. Additionally, such methods often only apply to individual anomalies and are unable to detect anomalies at the sequence level. Methods based on machine learning face the challenges of performance overheads and false alarms. It has been observed that a single container application can generate millions of system calls per second during normal operation, and the number of system calls can only be larger in containerized edge-cloud environments. At high loads and across the entire environment, especially in a microservices architecture, such a data volume may place significant stress on machine learning analysis, making the resource overhead unacceptable. Meanwhile, even with models that achieve high accuracy, dealing with such data volumes can lead to alarm flooding, rendering the entire security monitoring system ineffective. Thus, effective filtering of unnecessary system call data before inputting it into a machine learning model is an essential step. For both types of methods, in terms of feature selection, most methods tend to focus primarily on the system call type (like “open”, “execve”), while neglecting parameters and specific behavioral information, or on using the file path only. This potentially causes them to miss anomalies that could be detected using these data [5,6,7].
To address the above-mentioned issues, this paper proposes an unsupervised anomaly-detection method based on system calls for containerized edge-cloud environments, and this method is named U-SCAD. The method utilizes automatic rule generation to filter out irrelevant system data with minimal resource overhead. It then vectorizes the unfiltered system call sequences with parameters and subjects them to secondary analysis using a neural network to improve the accuracy of anomaly detection and reduce false positives. Figure 1 shows a typical application scenario of our method. In summary, the main contributions of this paper include:
  • We introduce an unsupervised method for generating container cloud system call filtering rules. This method is based on using templates and sequence pattern mining at the cluster level to generate multi-level filtering rules, striking a balance between filtering performance and effectiveness. This enables the anomaly-detection method to filter out a large amount of irrelevant information while retaining suspicious or high-risk sequences for subsequent analysis. Furthermore, these rules support online analysis and hot updates, allowing the method to dynamically adapt to edge-cloud environments’ frequent changes while avoiding rule contamination issues.
  • We introduce a method for embedding parameterized container system call sequences named Syscall2vec, and an anomaly-detection model. It embeds system call sequences based on automatically discovered templates and feeds them into a deep learning model for secondary analysis of unfiltered system call sequences. This enhances anomaly-detection accuracy and reduces false positives. The model enhances robustness through random masking and provides rapid root cause analysis through per-parameter anomaly scores.
  • We construct a dataset based on a modern containerized microservice cloud with environmental realism, accurate labeling, and reduced similarity. We validate the applicability of existing anomaly-detection methods in this context and demonstrate the advantages of our method over traditional methods. We also compare the detection performance under different parameter settings.
The remainder of this article is organized as follows. Section 2 reviews related studies. Section 3 describes the design of our anomaly-detection method as well as the details of the automatic rule mining method and the unsupervised classification model. Section 4 introduces our proposed dataset and scenarios. Section 5 evaluates our method from different aspects. Section 6 concludes the paper and discusses the limitations of our work as well as future work.

2. Related Works

Rule-based container anomaly detection. As a foundational approach to container security, there are several mature rule-based system call anomaly detection and control applications available for cloud container environments. Among them, the popular ones include Seccomp (Secure Computing Mode) and AppArmor, which are based on Linux Security Modules [8] (LSM) and are natively supported by Docker and Kubernetes. LSM is a lightweight general-purpose access control framework within the Linux kernel designed to achieve Mandatory Access Control (MAC). It utilizes hook points set in the Linux kernel on system calls to capture application system call information and perform corresponding processing. Additionally, there are system call rule engines tailored for container environments like Falco [9] from Sysdig and tracee [10] from Aqua that can achieve real-time anomaly detection. However, in practice, the generation of specific system call rules is often complex, especially for containerized cloud environments. To create fine-grained security policies, an analysis of the possible behaviors of every service in a container is required, and maintenance for iterative updates becomes nearly impossible with manual intervention. Multiple studies have focused on automatic Seccomp and AppArmor policy generation for containers to address this issue. Ghavamnia et al. [11] proposed an automatic Seccomp policy generation framework. The framework relies on static scanning of executable programs or source code and their components within the image to identify possible system call types. Zhu and Gehrmann [12] proposed Lic-sec, an automated rule generation system based on AppArmor, which was introduced by combining the ideas from Docker-sec and LiCShield. It automatically augments rules based on parameters during container and image creation, as well as Audit logs obtained during runtime through AppArmor. It is claimed that this framework can automatically defend against zero-day vulnerabilities while incurring minimal performance overhead. Song et al. [13] collected vulnerability code, vulnerability metadata, and C library unit tests from public sources. Then they employed static analysis on top of the vulnerability code to extract possible sequences of library functions on the control flow that can successfully trigger the vulnerability, and dynamic analysis on top of C library unit tests to establish a mapping between library functions and system call sequences to generate system call sequences corresponding to each vulnerability-exploiting code. Using the Generalized Sequential Pattern (GSP) mining algorithm to discover common system call sequence patterns of various lengths. They found that it could deliver 69% 86% additional defense in theory against exploits that were previously exposed to attacks under individual syscall-based filtering methods.
However, these methods often face several issues: (1) Static analysis methods are typically applicable only to specific languages and component libraries, such as C/C++ and glibc. (2) Limitations in LSM implementations can lead to overly lenient or overly strict policies, resulting in false positives or bypasses that affect security or normal application operation. Moreover, configuration files for such methods are generally static, making them unable to adapt dynamically to changes in the environment, such as image updates.
Machine-learning-based container anomaly detection. Flora and Antunes [14] presented a host-based intrusion detection system for containerized environments. Their system collects and analyzes system calls using the Sequence Time-Delay Embedding (STIDE) and Bag of System Calls (BoSC) algorithms. The obtained results show a stable learning state for STIDE with window sizes between 3 and 4, and ranging from 3 to 6 for BoSC. Shen et al. [15] proposed an anomaly-detection framework that combines clustering algorithms. The framework utilizes Sysdig to collect system call data generated by containers, employs the Density-Based Spatial Clustering of Applications with Noise (DBSCAN) algorithm to classify containers in an unsupervised manner, and utilizes a RandomForest classifier for anomaly detection for each application category. Lin et al. [16] proposed a Classification-based Distributed Learning framework, namely CDL, for detecting anomalies in containerized applications. They process the original system call traces into frequency vector streams, and these extracted feature vectors are used to identify applications. To identify applications, they employ a random forest learning approach. However, traditional ML-based methods are known to suffer from low detection rates, weak generalization, and challenges in dealing with unknown anomalies, as they cannot learn the deep feature from complex data. Also, they are inefficient when facing a large scale of data. Thus, deep-learning-based methods have gained popularity for system call anomaly detection in recent years. These methods offer higher accuracy, general applicability, and often require minimal human intervention. Tien et al. [17] proposed a supervised neural network-based method for anomaly detection in Kubernetes platforms. This method captures system call information through Falco, counts the number of each system call type within fixed time intervals as feature vectors, and inputs them into a Long Short-Term Memory (LSTM) for anomaly detection. The algorithm achieves a 98% detection rate and is effective in detecting injection attacks and denial of service attacks. Kosinska and Tobiasz [18] proposed a system known as the Kubernetes Anomaly Detector (KAD) for detecting anomalies in Kubernetes clusters. The KAD system selects the appropriate model for detection; thus, different models can match different data types. These models include Seasonal Autoregressive Integrated Moving Average (SARIMA), Hidden Markov Model (HMM), LSTM, and autoencoders. Wang et al. [19] proposed a real-time unsupervised anomaly detection system, Pudding, for monitoring system calls in container cloud via BiLSTM(Bidirectional LSTM)-based variational auto-encoder (VAE). Their evaluations using real-world datasets show that the BiLSTM-based VAE network achieves excellent detection performance without introducing significant running performance overhead to the container platform. El Khairi et al. [20] proposed a HIDS (Host-based Intrusion Detection System) that relies on monitoring system calls. In terms of feature selection, they constructed a graphical representation of system calls using parameter information. This graphical representation itself includes recently observed system calls. When training is complete and testing begins, any unseen vectors are classified based on the benign graph data set constructed earlier. Kotenko et al. [21] proposed an anomaly-detection software prototype based on histograms of normal process and an auto-encoder. They constructed histograms of the analyzed processes based on system calls, using these histograms as input vectors of the auto-encoder’s deep learning model. To solve the problem of explicit data markup, an unsupervised learning model of the auto-encoder is used. Bu et al. [22] proposed a container anomaly-detection method based on singular spectrum transformation(SST) and local outlier factor(LOF), called SST-LOF. They enhance both algorithms to meet the needs of streaming unsupervised detection and reduce false positives of noisy data. Based on these efforts, they constructed a real-time unsupervised streaming anomaly detection on containers.
These solutions encounter four persistent challenges that hinder their practical implementation: (1) High performance overhead—In the containerized edge-cloud environment, each edge node can generate a huge number of system calls per second during normal operation. At high loads and across the entire cloud platform, this large data volume places significant stress on analysis and resource utilization. (2) False positives—Even high-accuracy models can lead to a flood of alerts when dealing with large data volumes, posing a significant challenge to their use in real production environments. (3) Loss of parameter information—In terms of feature selection, such methods often consider only system call types as the main feature and ignore parameters and specific behavioral information, potentially causing them to miss anomalies that could be detected using this information.

3. Approach

3.1. Problem Definition

For rule mining, consider a set S = S 0 , , S x of system calls generated during normal operation of an application, generate a primitive rule set R = R 0 , , R y , and for a system call S k ( k < x ) in S, there exists exactly 1 rule R j that matches it. After completing the rule set generation, the rules in R that do not satisfy the formal rule condition are removed according to the condition to obtain the formal rule set R. For the anomaly-detection problem, given a training input length sequence T, consider a sequence of system calls S = S 1 , , S T of length T with the same pattern as the training sequence, and predict Y = y 1 , , y T , where y t 0 , 1 is used to indicate whether a data point at timestamp t of the test set is anomalous or not (1 denotes an anomalous data point).

3.2. Method Design

Overall Architecture

To strike a balance between performance overhead, security, and false positive rates, we enhance our previous work [23] and propose a neural network anomaly-detection model for container cloud system calls and their parameters, which is combined into the following container cloud anomaly-detection method. Figure 2 illustrates the overall architecture of this method, which is divided into two stages: offline training and online detection.
  • Training Stage: This stage mines normal system call parameter templates and behavioral models for new applications deployed in the cluster.
First, the system call collection module, rule filtering module, and event output module are deployed on each Kubernetes worker node. These modules collect system call data, filter it based on basic rules (e.g., excluding system calls like ‘getuid’ that rarely contribute to anomalies), and output the remaining events to the event processing module in the analysis service. The event processing module receives raw system call events, distinguishes the subjects of system calls, obtains the dataset for training, and stores it persistently. Then, it outputs the dataset to the rule mining and analysis module.
Second, the rule mining module analyzes the received system call events, generates a series of corresponding event templates based on system call types and system call parameters. The analysis service learns from the received system call datasets of different applications. First, it embeds each event using the event templates obtained through the proposed Syscall2vec, and then trains the neural network classification model to build the normal behavior models for each application. Meanwhile, the sequence patterns generated from the trained models are fed back to the rule mining module.
Ultimately, the rule mining module generates the final multi-level filtering rule set by combining existing templates and the sequence patterns output by the models, and notifies the rule filtering modules on each worker node to update their rules.
2.
Detection Stage: This stage is designed for the near real-time detection of system calls generated by the same or similar applications.
First, the same system call collection module, rule filtering module, and event output module are deployed on each Kubernetes worker node. They collect system call data, detect and filter it based on the rules automatically generated. The filtering module keeps a fixed number of the most recent system call events for each container, providing historical information for events that need to be analyzed. For each system call event, it first forms a type sequence with the historical events in the record and the current event, and then uses a rolling hash algorithm to determine if the sequence meets the sequence filtering conditions. If it does not meet the conditions, the event will then be matched with single-point rules based on system call parameters to see if it can be filtered.
Second, if there are system call events that remain unfiltered, a fixed size of events before and after that event are output to the event handler module in the analysis service. The event handler module identifies the primary information in these sequences and forwards it to the analysis module. The analysis module receives the system call log sequences, embeds the system calls based on the templates obtained during mining, and then performs anomaly detection using a classification model, finally generating relevant alerts.
In terms of the Syscall datasource, we use the Sysdig kernel module as a non-proxy system call capture module. This module offers better support and performance for containerized applications compared to methods like strace and systemtap.

3.3. Filtering Rules Mining

In this work, we enhance and develop the rules mining module that was proposed by us in [23] to fit multiple types of rules and a wider range of abnormal system calls.

3.3.1. Filtering Rule Types

The target filtering rules are divided into two types: one is single-point rules based on system call parameters (such as access paths, process startup parameters), and the other is sequence rules based on system call types.
The single-point rules are designed to replace the laborious LSM rules written manually for each application. These rules are designed to be as precise as possible to avoid missing any abnormal system calls. As for the sequence rules, based on our observation, container applications in normal scenarios generate a large amount of system call data that is unhelpful for anomaly detection from the perspective of the single syscall itself. In addition, according to the research by Song et al. [13], abnormal behavior often results in system call type sequences that are different from normal behavior, so we use the sequence rules as the first filtering rules for the method.

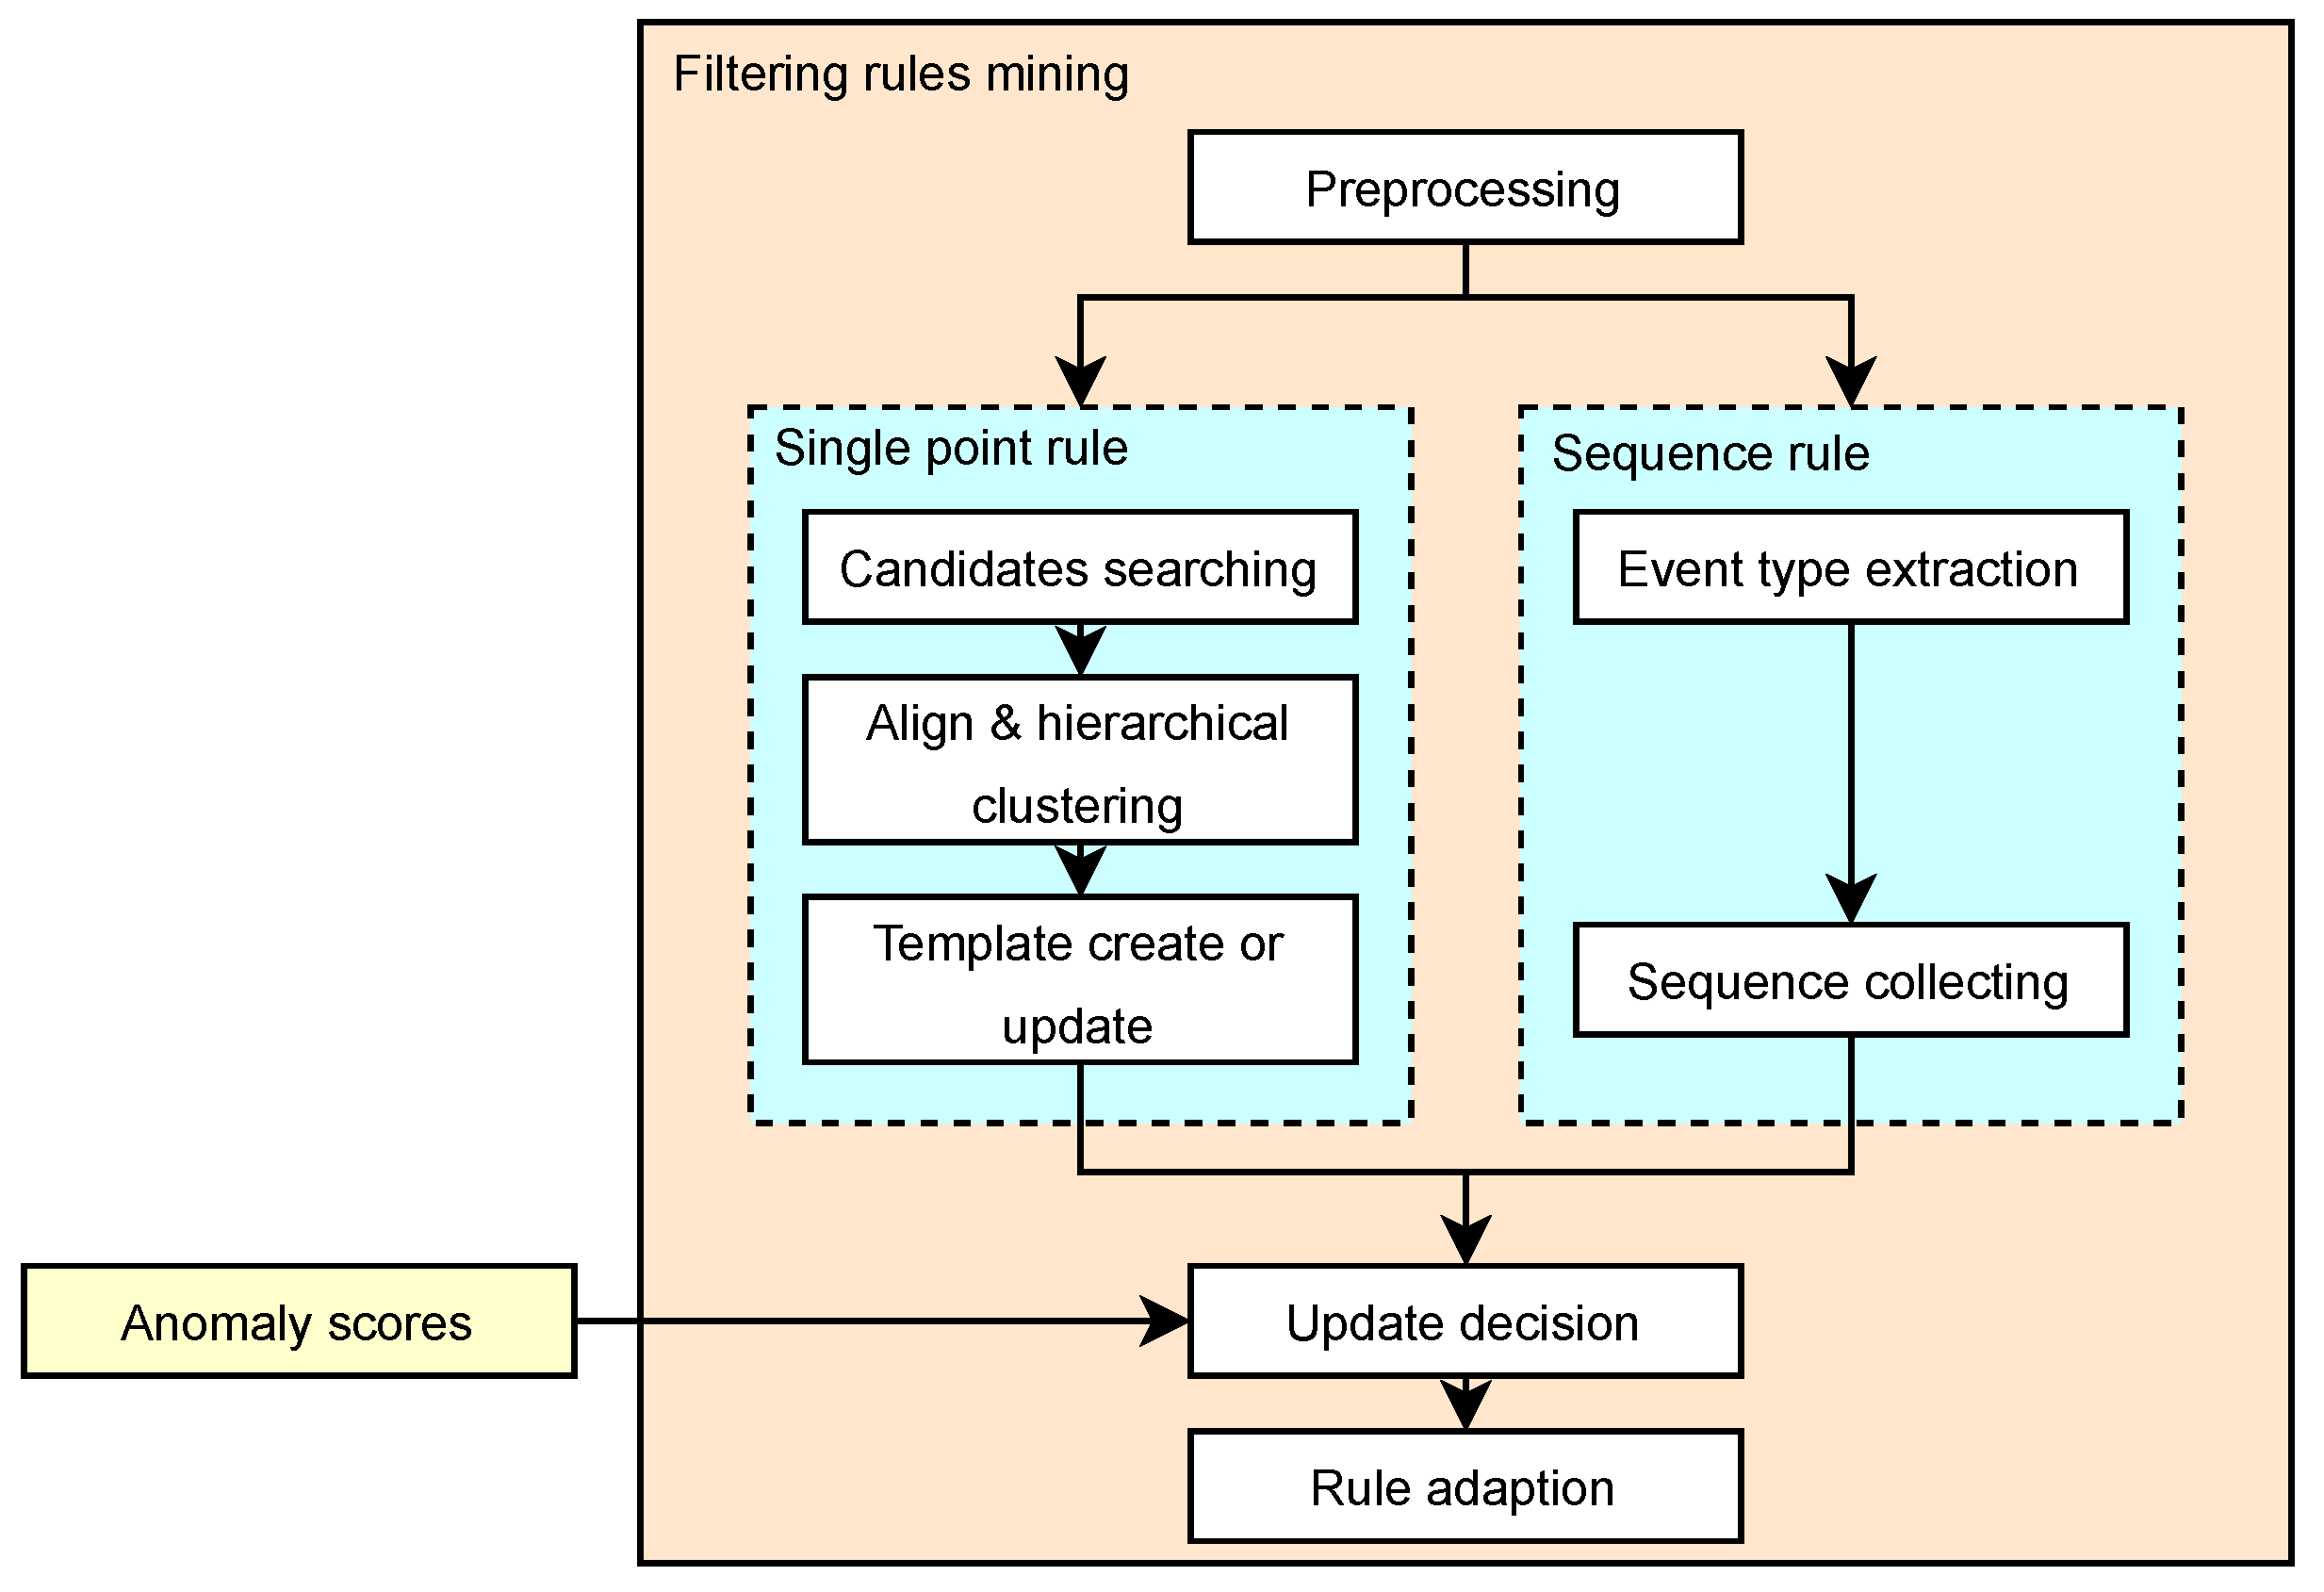
3.3.2. Workflow of Rule Mining

The workflow of the rule mining module is depicted in Figure 3. For the raw system call events, the following steps are carried out sequentially: preprocessing, single-point rule mining (candidate template search, hierarchical clustering, and active template set updating) [23], sequence rule mining (event type extraction and sequence collecting), update decision based on the anomaly scores generated by the classification model, and final rule adaption.
Templates, which refer to the type of log that can be obtained by replacing variables in a word sequence with wildcards, within this set are continuously updated based on multiple event records. These templates can be considered intermediate objects between the final generated rules and contain various field information required to create specific rules. They establish a many-to-one or one-to-one relationship with the rules. If a decision is made to generate new rules, further adaptation and updates of the rules are performed. In our method, we employ the comparison and mining algorithms based on templates in [23]. In Section 4, we will compare our mining algorithm with the most effective algorithms, such as Drain [24] and SwissLog [25], summarized in the literature [26].
Data preprocessing. Data preprocessing involves field identification, entity recognition, and tokenization of system call events to generate processed system call log objects [23]. Initially, in field identification, system call parameter information and container/Kubernetes-related metadata are extracted from the raw events to serve as the basis for entity recognition. Subsequently, entity recognition is identified based on container ID, image ID, and process-related information, and assigns identifiers to the log objects. This field can also be replaced by other labels, such as Pod, Deployment labels, etc. Finally, in tokenization, for fields requiring template mining, the following steps are taken: (1) special content in the logs is recognized using regular expressions and masked with identifiers, while recording the specific content in sequence for further analysis during template mining. This approach allows for a more fine-grained matching. (2) For main information within processed logs and system call parameter fields, content is tokenized finely based on separators to create token sequences, which serve as data for the corresponding fields in the system call log objects.
Candidate Search. This step’s input is the token sequences mentioned above. Here, we use the selecting method in [23], which separately treats short and long token sequences. For short inputs (usually up to 3 tokens), candidate templates are directly selected from the existing active template set based on their length differences from the input within a certain range. For long parameters, the Best Matching 25 (BM25) algorithm, an improved version of term frequency–inverse document frequency (TF-IDF), is used to calculate the coarse-grained similarity between the input and templates. The calculation method is as (1) and (2) [23].
s c o r e ( D , Q ) = i = 1 n I D F ( q i ) · f ( q i , D ) · ( k 1 + 1 ) f ( q i , D ) + k 1 · ( 1 b + b · | D | a v g d l )
I D F ( q i ) = ln ( N n ( q i ) + 0.5 n ( q i ) + 0.5 + 1 )
Candidate templates are selected based on this score reaching a certain threshold, forming the candidate template set. Additionally, it is generally considered reasonable to include templates with similar lengths in the candidate search, so during the candidate search, only templates with a certain length difference are included. When the goal is data parsing, if the candidate template set is empty, the template with the highest BM25 score is added to the candidate template set. As a result, the collection of templates for clustering candidate items is obtained.
Hierarchical Clustering. When the candidate template set is empty, a new active template is formed directly as the pattern based on the input token sequence. The form of active templates is a tree, where non-leaf nodes represent patterns matching all input token sequences belonging to that template, and leaf nodes represent individual original input token sequence records. For performance considerations, the degree and maximum height of the tree are set to specific values. If the candidate template set is not empty, for each non-leaf node in the candidate templates, alignment is performed with the input token sequence based on word-level Longest Common Subsequence (LCS). [23] For templates with the wildcard <*>, they can match any number of tokens until the token after the wildcard matches the input token. However, this matching is not counted in the length of the LCS. After word alignment is complete, similarity is calculated between the corresponding differences, using the original content that was not masked. According to the analysis and comparison in [27,28,29,30], the algorithm selects the Jaro similarity (3) as the method for calculating word-level similarity. The overall process involves finding similarities between the input token sequences and the non-leaf nodes in the candidate templates, which leads to hierarchical clustering.
s i m j = 0 , if m = 0 1 3 ( m | s 1 | + m | s 2 | + m t m ) , otherewise
In the equations, | s i | represents the length of string s i , m is the number of matching characters, and t is the number of transpositions. If two strings do not match at all, the Jaro similarity is 0, and if they are identical, the Jaro similarity is 1. Then, the similarity between the input and the sub-template is calculated as (4).
S i m ( D , Q ) = L e n g t h ( L C S ( D , Q ) ) + j = 0 | D i f f s | s i m j L e n g t h ( Q )
D represents the sub-template, Q represents the input, L e n g t h ( L C S ( D , Q ) ) is the length of the Longest Common Subsequence between the two, | D i f f s | is the number of differences, and s i m j is the similarity between the aforementioned differences. The sub-template with the highest similarity is selected as the best-matching template.
The specific operation of hierarchical clustering is illustrated in Figure 4. It involves further merging the input with the records under this sub-template (extracting the differing parts as variable identifiers). For different numbers and types of differences, variable identifiers are assigned as enumeration values (<E>), range values (<R>), or free variable values (<*>). If the merged pattern matches the template pattern, no update is made to the template tree. Otherwise, the update is made based on the node’s depth and the number of child nodes [23].
Sequence rule mining. To achieve system call rules mining at the sequence level, our work additionally implements rule mining based on system call type sequences. The system call type sequence filtering uses a similar concept to the rolling hash algorithm for fast matching. Rolling Hash is a hash function used to quickly calculate the hash value of consecutive substrings in a string. In this method, each system call type is mapped to an integer between 0 and 255, and then the Rabin–Karp algorithm is used to calculate the hash value corresponding to each event and its historical window sequence, to quickly determine whether this sequence is in the sequence filtering rules.
Since a large length can cause the sequence vector space explosion, and a small length can result in a lack of sequence information for events, each rule in this method adopts a fixed-length type sequence of 16, based on the conclusion of the research [13] and our analysis of the length of real anomaly sequences.
The sequence collecting process initially involves the simple collection of 16-g of system call types present in the training set. Then, these sequences are sorted based on their frequency, and those within the 90th percentile are considered to be candidate sequence filter rules. Finally, the process waits to obtain anomaly scores for each corresponding sequence of n-grams for further filtering.
Decision and Update. When templates are generated or updated through clustering, the method makes a decision on whether to accept the update based on certain conditions instead of immediately incorporating them into the rule set to avoid potential pollution of the rule set by templates generated from anomalous noise [23]. The conditions considered in the decision-making process include: (1) similar system calls produced by the same type of entity in the entire cluster, with a certain level of overall frequency and container count. (2) Minimal time intervals between the occurrences to avoid considering them as multiple anomalous events. (3) Similar contextual information for the events. (4) Sequence anomaly scores generated by the classification model are below the 60% percentile.
Rule Set Adaptation and Update. To prevent frequent updates, the rule adaptation module detects changes in the template set after each cycle. It then converts the changed parts, based on entity information templates, type templates, and parameter templates, into corresponding new rule sets. These new rule sets are stored in the cluster’s internal database. Additionally, messages are sent to the rule detection and filtering modules on various nodes to notify them of the rule set updates. When the rule detection and filtering modules receive this message, they retrieve the new rule sets from the database and perform a hot update of their internal rules.

3.4. Anomaly Classification

3.4.1. Anomaly Classification Model

The proposed abnormal classification model for system calls with parameters is illustrated in Figure 5. Initially, the input system call sequences are embedded using Syscall2vec, resulting in input vector sequences for the model. These sequences are then fed into a model based on multi-variable time series reconstruction. After obtaining the reconstructed output, the loss is calculated using the mean square error. The model is divided into offline training and online detection phases.
In the offline training phase, the model takes the full system call sequences for each application as input, assuming that these sequences do not contain any abnormal behavior. In addition to the Syscall2vec embedding preprocessing, random masking of system call types is performed during training to enhance the model’s robustness. Following training, system call type sequence patterns with loss values below the 60% percentile are fed back to the rule mining module as the primary filtering rules for the rule filtering module.
In the online detection phase, the model takes the filtered application system call sequence window as input. After obtaining the reconstructed output and the corresponding loss values, the current sequence’s abnormality threshold is determined using the POT (Peak Over Threshold) algorithm. If the current loss exceeds this threshold, the sequence is classified as abnormal.

3.4.2. Syscall2vec

To obtain feature vectors for the system call sequence S = S 1 , . . . , S t , we first embed individual system calls and then generate a sequence of feature vectors for the entire sequence. We classify system call parameters into different categories: type parameters, numeric parameters, structured parameters, and text parameters. Each category is extracted as a feature vector using different embedding methods, as shown in Table 1 (the parameter names and their meanings at Falco website https://falco.org/docs/rules/supported-fields/, accessed on 10 April 2023).
-
Type Parameters: These parameters are embedded directly using the OneHot encoding method since system call types and similar parameters are not natural language words and are relatively independent of each other.
-
Numeric Parameters: Feature vectors are generated using the sign of the parameter value and the standardized absolute value. For example, if the maximum absolute value in the training set is 4, the value −2 is represented as (1, 0.5).
-
Structured Parameters: Embedding structured parameters involves two parts: templates and variables. First, based on the event template set mined in Section 3.2, we parse the parameters using existing templates and compare them to find the template that best matches the system call and its corresponding variable list. When the template and parameters do not match entirely, the differing parts are added as new variables to the end of the variable list. Embedding of template content and variables is carried out using fastText [31]. FastText is a text embedding method proposed by Facebook in 2016, which is similar in architecture to the CBOW structure in word2vec but with the addition of word-level n-gram features. This feature allows it to handle out-of-vocabulary (OOV) situations using subword vectors to represent a word, rather than treating it as a default value. FastText is known for providing similar accuracy to deep learning models (e.g., Convolutional Neural Network (CNN)) but with significantly lower computation time. In text classification and embedding models, fastText is often used as a baseline. According to experiments, fastText achieves nearly 74% similarity with only a fraction of the time taken by SentenceBert. Since the templates and parameters in this case are generally short inputs, using fastText for upstream embedding preprocessing effectively meets the performance and effectiveness requirements. For each template’s feature vector, to prevent excessive dimensionality, we represent it with a reduced 100-dimensional feature vector. For the variable part, we take the average of the embedding representations of each variable to create the feature vector.
With Syscall2vec, we generate feature vectors for each system call in the sequence, resulting in V = V 1 , . . . , V T , where T is the length of the sequence. Now, we process the new feature vector sequence V as follows. For the t-th feature vector V t in V, we create a local context window of length K, I t = V t K + 1 , . . . , V t . When t < K , we use replication padding, which means we append a vector of length K t to the I t window, consisting of V t , , V t , to maintain a window length of K. Thus, we transform the input sequence V into a sliding window sequence I = I 1 , . . . , I t . This method is commonly used in similar works, allowing a data point to retain its local context information, rather than being treated as an independent vector. As a result, we obtain the feature vector sequence I as input for the classification model.

3.4.3. Anomaly Detection

The anomaly-detection model is based on the multivariate time series anomaly-detection model DGHL [32]. We utilize the Encoder and Decoder components from the DGHL model architecture to reconstruct the input sequence I as described earlier. The syscall vectors I are passed through the Encoder block. The Decoder combines the compressed vector with the previously generated target sequence. This process iterates to generate the reconstructed representation O. In the training phase, we apply random masks to the system call types, thus enhancing the robustness of the model.
Once the reconstructed output O is obtained, the loss between O and I is calculated using the L2-norm, denoted as L = O I , and is used as an anomaly score. In the training phase, we minimize the L. In the testing phase, the POT threshold (Peak Over Threshold) method [33] is then used to dynamically select the threshold. This method is a statistical approach that fits the data distribution to a generalized Pareto distribution using extreme value theory and determines an appropriate risk value for dynamic thresholding. Ultimately, during testing, if there are items in the sequence with an anomaly score greater than the POT threshold, they are considered to be detected anomalies; otherwise, the sequence is considered normal behavior. The loss of each parameter is calculated separately to demonstrate the root of the anomalies.

4. Datasets

Due to the abundance of parameters and the risk of overfitting, the training of deep learning models often requires large-scale datasets. To the best of our knowledge, there are currently a few datasets for system call anomaly detection based on containerized environments, among which the two most suitable are the LID-DS [34] and CB-DS [20]. However, to validate the effectiveness of the proposed method in a modern container cloud microservice environment closer to the real world, we constructed a scenario based on a sample of Spring Cloud on Kubernetes. The service structure is depicted in Figure 6.
In our discussion, we will approach the container security challenge from two perspectives. First, the security of applications running in containers. If an application has vulnerabilities, running it in a container cannot prevent these vulnerabilities from being exploited. Second, we consider the security of the containerization mechanism itself. Ensuring that the isolation and restriction of the runtime environment produce a reliable system. Otherwise, when containers are run in a multi-tenant environment, they may suffer a loss of confidentiality due to data leakage. We assume that the attacker originates from external sources and has not yet gained any initial access privileges to the system, such as having an account within the cloud environment. We do not consider denial of service (DoS) attacks, as well as attacks targeting the operating system and layers below, such as hardware vulnerabilities, as these types of attacks are not specific to the containerized cloud environment or containerized applications. We also do not consider the prevention or tampering of captured system calls by the attacker after achieving privilege escalation. Such behavior should be blocked upon the detection of privilege escalation.
Under normal scenarios, external users access the Gateway Service in the microservices at random through different containers via WebUI with a concurrency ranging from 1 to 1000 requests per second. The requests are then processed by the Organization Service, Department Service, and Employee Service, and interactions occur with the Redis and MySQL databases on the backend. In typical access patterns, operations include adding, deleting, updating, and querying employee, organization, and department data, with each operation randomly executed according to a specified range of proportions.
While under abnormal scenarios, there are ten different types of anomalous access, as described in detail in Table 2. To simulate attacks based on application vulnerabilities, we configured the Spring Boot version as 2.6.3, Spring Cloud version as 2021.0.0, Spring Cloud Gateway version as 3.0.6, and MySQL version as 5.23. We also exposed the Gateway Actuator endpoints to exploit Common Vulnerabilities and Exposures(CVE) vulnerabilities for Remote Code Execution (RCE) and Arbitrary File Access (AFA). To simulate the misconfiguration exploits, we mount the docker.sock and a host path (/etc) to the target pod, then the attacker uses the CVE_2022_22965/CVE_2022_22947/CVE_2022_0543 RCEs to achieve further exploits. To remove the trace of CVE exploits, the further exploits are delayed by several seconds, and the actual starting timestamps are recorded in the labels.
With the above approach, we constructed the dataset with the following characteristics: Environment realism: Real container cloud scenarios are simulated by Spring on the Kubernetes framework, with reasonable access as normal behavior. Accurate labeling: Unlike the way of dividing by whole segments, we label the occurrence of attacks by timestamps, which makes the validation of the effect of anomaly detection more accurate. Reduced similarity: Through multi-container, multi-environment deployment, the dataset itself is less redundant and has better robustness. Scalability and reproducibility: Through modularized Skaffold configuration, it makes subsequent scenarios increase and reproduction possible.
Our data collection is carried out by Sysdig (https://github.com/draios/sysdig, accessed on 10 April 2023), which is suitable for Container Cloud. In the end, we capture 2 h of syscall data with a total of 323,881,547 syscall events, including 0.005% of attacks or anomalous accesses for each scenario. The source code for the specific environment setup, as well as the capture files, has been publicly released on GitHub (https://github.com/wsl-fd/KAS-DS, accessed on 15 March 2025).
In the subsequent evaluation, we will perform rule mining and model training separately for the Gateway Service, Employee Service, Redis Service, and MySQL Service.

5. Experiment

In this section, we evaluate the anomaly-detection capabilities of our method with both a publicly available dataset and a scenario constructed by us based on modern containerized microservices. We also compare the applicability of existing system call-based anomaly detection in different scenarios and the advantages of our method over existing methods. The experiments are divided into two main parts: evaluating automatic rule mining and anomaly-detection classification models. Section 5.1 presents our experimental environment. Section 5.2 describes the scenario we built based on modern containerized microservices and the corresponding dataset creation method. Section 5.3 evaluates the effectiveness of automatic rule mining, while Section 5.4 assesses the anomaly-detection classification model.

5.1. Experiment Setup

The experimental environment consists of a Kubernetes 1.18 cluster composed of four Intel CPU E5-2637 machines with 64 GB of RAM. The cluster runs on CentOS 7 physical servers and is developed using Python 3.8. In terms of rule engine implementation, a modified version based on Falco 0.32.2 is employed. We deploy target application containers, Sysdig, and Falco Daemonset on Kubernetes worker nodes. We deploy the rule mining module and analyzer module on the analysis node. The modified Falco outputs raw syscall data to the analysis service through Kafka. The rule mining module maintains the filtering rules and event templates for each Kubernetes application in a Redis database. The analyzer module processes the syscall sequences according to the templates and outputs the anomaly classification results to an Elastic Search service.

5.2. Dataset

Under the scenarios described in Section 4 with the dataset containing 2 h of syscall data with a total of 323,881,547 syscall events, with 0.005 percentage of attacks or anomalous accesses. The dataset is divided into 50% for training and 50% for testing. In the subsequent evaluation, we will perform rule mining and model training separately for the Gateway Service, Employee Service, Redis Service, and MySQL Service.

5.3. Filter Rule Mining

In this section, we compare the system call log parsing part of our method with the state-of-the-art log parsing algorithms, SwissLog and Drain, to test the correctness and precision of template mining in our method. Lastly, we will test the automatically generated rules alongside Falco’s default rules and manually written rules in real-world anomaly-detection scenarios to compare their anomaly-detection capabilities.
Exp1. Quality of System Call Template Mining. In this experiment, we will compare the system call template mining part of our method with the best-performing log parsing algorithms, SwissLog and Drain, to test the correctness and precision of template mining in our method.
To avoid manual creation of log template expressions, we refer to unsupervised evaluation metrics as per the reference [35]. This measurement standard ensures that log templates should neither be overly generalized nor should they have undetected variables. Given a set of log templates T, the following metrics are calculated:
A v g T o k e n L o s t ( t ) = A v g M a t c h L e n g t h ( t ) | t |
L e n g t h L o s s ( T ) = ( log | T | ) θ
Q u a l i t y L o s s ( T ) = i = 0 | T | ( A v g T o k e n L o s t ( t i ) | t i | ) 2
L o s s = L e n g t h L o s s ( T ) + Q u a l i t y L o s s ( T )
-
t i is a template in T.
-
A v g M a t c h L e n g t h ( t ) is the average match length of all original logs in the log collection evaluated against template t.
-
LengthLoss reflects how many templates are generated in T.
-
QualityLoss evaluates if the generated templates suffer from overgeneralization.
-
θ is a hyper-parameter controlling the importance between the two factors. According to the original paper, θ is set to 1.5.
-
Loss represents the total loss of the template set.
In the experiment, we set additional URL and file path regular expressions for Drain, with values of 4 and 0.5 for depth and threshold, respectively. For SwissLog, we set extra delimiters while using its default configuration. Both methods use an online mode, processing system call logs line by line.
As shown in Table 3, our algorithm has its own strengths and weaknesses in terms of the total number of generated templates compared to Drain and SwissLog. In most scenarios, our algorithm has the least total loss or is close to the best performer, indicating that our algorithm provides higher-quality log templates in terms of both accuracy in matching original logs and stability when the total number of templates is close.
Exp2. System Call Filtering Effectiveness. In this experiment, we compare the number of system calls after filtering using system call type sequences and rule-based filtering with the original number of system calls. When filtering, we use a window size of 128, which means that if a sequence of 128 events appears in the analyzed type sequence or if there is any system call behavior within this window that is not in the whitelist, then this window and the subsequent 128 events are considered for analysis. For each application, we collect 30 min of system call data and ultimately obtain the average number of system calls per second.
As shown in Table 4, the primary system call type sequence filtering reduces the original number of system calls by an average of 40%. After the secondary rule-based filtering, we end up with only 13% of the original system call count, effectively filtering out a large number of normal system calls.
To assess the practical efficiency of analyzing the corresponding data, we run classification models on both the original data and the filtered data using the CPU and record the CPU times and duration required for analysis. Table 5 and Figure 7 display the average CPU time needed to analyze each second of original and filtered system call events, as well as the testing duration. The results indicate that the filtering mechanism in our method significantly reduces the resources required for analysis and saves a substantial amount of analysis time. Even when using a CPU instead of a GPU, it achieves near real-time detection speed with no significant delays and backlogs.

5.4. Anomaly-Detection Classification Model

Exp3. Anomaly classification. In this experiment, we evaluate the effectiveness of the method’s anomaly-detection models using the following evaluation metrics:
P r e c i s i o n = T P T P + F P
R e c a l l = T P T P + F N
F 1 = 2 × P r e c i s i o n × R e c a l l P r e c i s i o n + R e c a l l = 2 × T P 2 × T P + F P + F N
For each input sequence window, if it carries an anomaly label and is classified as an anomaly in the detection results, it is considered a True Positive (TP); otherwise, it is a False Negative (FN). To compare the difference between deep learning-based solutions, the HIDS adopted by Khairi et al. [20] and the LSTM-VAE adopted by Wang et al. [19] are taken as the representatives of the traditional reconstructed anomaly-detection model and compared with the model in our method. The settings for each model are presented in Table 6.
The results are presented in Table 7 and Figure 8. As observed from the data in the table, when using system call vectors with parameters, the detection performance across various scenarios averages a precision of 0.91, a recall of 0.978, and an F1 score of 0.944, with a low False Positive Rate of 0.014. Compared to HIDS, our approach achieves higher accuracy and F1 values in all scenarios, which is likely due to the fact that HIDS ignores parameter information other than file paths. Moreover, HIDS analyzes the system calls of the whole host without dividing them by applications and containers, which may degrade its performance under a large number of containers and high environmental noise. On the other hand, the inclusion of various parameters makes the information richer and reduces false positives. Compared to LSTM-VAE, our model also performs better.
To validate our competitiveness and robustness in different datasets and scenarios, we experiment with CB-DS along with HIDS. The results are shown in Table 8. In this dataset, U-SCAD achieves a great performance that is roughly the same as HIDS. These experiments show that our method not only outperforms the comparison methods in certain scenarios, but also has robustness for a wider range of scenarios.
Exp4. Case study. In this experiment, we select several typical scenarios to evaluate the principles of anomaly detection using visual methods and to demonstrate the reliability of the method through Receiver Operating Characteristic (ROC) curves. In Figure 9 and Figure 10, each point on the X-axis represents a time window of the original sequential data, and the Y-axis represents the anomaly score of a current time window.
The Figure 9 depicted the effect of our anomaly-detection method in CVE_2012_2122. The plot above shows the anomaly score of each timestamp generated by the classification model. In addition, the plot below shows the time when the exploits start. As we can see, the anomaly score increases when the exploit starts.
The left image shows anomaly scores using parameter information, while the right one depicts the scenario where only system call types are used as features. From the images, it is evident that utilizing parameter information enables the anomaly-detection method to yield higher anomaly scores effectively when anomalies occur, distinguishing them from normal behavior. On the contrary, without parameter information, it is not possible to effectively differentiate between normal and anomalous behavior.
As shown in Figure 10, for the CVE_2022_22947 scenario, although without using parameters, there is some ability to distinguish between normal and anomalous behavior to some extent, when parameters are used, the anomaly scores for normal behavior are significantly lower, and the difference in anomaly scores between normal and anomalous behavior becomes more apparent.
Figure 11 displays the ROC curves for the three types of scenarios: application CVE exploits, misconfiguration exploits, and direct access. As we can see in the figure, all the AUCs of these scenarios reached 0.98 or above. In addition, the ROC curves illustrate that the anomaly scores generated by our method effectively differentiate between normal and anomalous behaviors, demonstrating good stability.
Exp5. Ablation Study and Hyper-parameter Exploration. To further evaluate the model’s performance under different configurations, we conduct an ablation study across various window sizes by comparing the detection results using full system call parameters (including payload information) versus those using only one-hot encoded features. The results are summarized in Table 9.
As shown in the table, when the window size reaches 256, the model with all system call parameters achieves nearly optimal detection performance. Moreover, even with a smaller window size of 128, it still outperforms the no-parameter case (i.e., one-hot only) at a window size of 256.
Notably, the F1-score of the full-parameter setting consistently surpasses that of the one-hot-only setting across all tested window sizes. Specifically, when the window size is set to 256, the difference in F1-score between the two settings reaches 16.5%. This significant improvement demonstrates the effectiveness of our proposed method.

6. Conclusions

We introduce an unsupervised method for generating containerized edge-cloud system call filtering rules. This method, based on cluster templates and sequence pattern mining, obtains multi-level filtering rules to strike a balance between filtering performance and effectiveness. This enables the anomaly-detection method to filter out substantial irrelevant information while retaining suspicious or high-risk sequences for subsequent analysis. Furthermore, these rules support online analysis and hot updates, allowing the method to dynamically adapt to environmental changes while avoiding rule contamination issues. These characteristics meet the requirements of anomaly detection in containerized edge-cloud environments. The experiment shows that our filtering rules can significantly reduce the number of system calls that need to be handled by the anomaly-detection model, remaining only 13% of the original system calls, which reduces the cost of computing resources.
We propose Syscall2vec, a method for embedding parameterized container system call sequences, along with an anomaly-detection model. This method embeds system call sequences based on automatically discovered templates and feeds them into a deep learning model for secondary analysis of unfiltered sequences. The approach enhances anomaly-detection accuracy while reducing false positives. Through random masking, the model improves robustness and enables rapid root cause analysis via per-parameter anomaly scores. The experiment shows that with the combination of Syscall2vec and our anomaly-detection model, our method improves the F1 score by 23.88% and 41.31%, respectively, compared to HIDS and LSTM-VAE, two representative methods in this field, in the experiment scenarios of this work. Along with the case study and the ablation study, we believe our method shows powerful capabilities in utilizing system calls for anomaly detection with less resource overhead.
We construct a dataset based on modern containerized cloud microservices as an experimental background. We validate the applicability of traditional anomaly-detection methods that consider only system call types in this context. We also compare the detection performance under different parameters.
Future works. We consider adding the payload of certain system calls (read, write, etc.) as additional features for container anomaly detection to capture a broader range of anomalous behaviors. Additionally, we plan to explore the use of large language models (LLMs) to enhance the interpretability of the detection results. Apart from that, we intend to perform evaluations in high-load environments on larger-scale clusters, such as by increasing the number of Kubernetes nodes and the rate of active containers per second, to better assess the scalability and performance of our system under realistic scenarios. We also intend to evaluate our method with other existing methods in a wider range of experiment scenarios and datasets.

Author Contributions

Conceptualization, J.Y. and M.Y.; Methodology, J.Y., M.Y. and S.W.; Software, S.W.; Validation, S.W.; Resources, J.Y. and M.Y.; Data curation, S.W. and J.T.; Writing—original draft, J.Y., S.W. and M.Y.; Writing—review and editing, J.W., J.Y. and J.T.; Visualization, S.W. and J.T.; Supervision, J.W. and M.Y. All authors have read and agreed to the published version of the manuscript.

Funding

This work was supported by the Shanghai Science and Technology Project under Grant (No. 23511100500, No. 22510761000), the National Natural Science Foundation of China under Grant (No. 61873309), the Intel Sponsored Research Agreement under Grant (Intel CG No. 89533661).

Data Availability Statement

The dataset in this article is available at https://github.com/wsl-fd/KAS-DS, accessed on 15 March 2025.

Conflicts of Interest

The authors declare no conflict of interest.

References

  1. Bernstein, D. Containers and cloud: From lxc to docker to kubernetes. IEEE Cloud Comput. 2014, 1, 81–84. [Google Scholar] [CrossRef]
  2. Cloud Native Survey. 2022. Available online: https://www.cncf.io/reports/cncf-annual-survey-2022/ (accessed on 13 April 2023).
  3. Linux Manual Pages: Section 7. 2009. Available online: https://man7.org/linux/man-pages/dir_section_7.html (accessed on 10 August 2023).
  4. Tunde-Onadele, O.; He, J.; Dai, T.; Gu, X. A study on container vulnerability exploit detection. In Proceedings of the 2019 IEEE International Conference on Cloud Engineering (IC2E), Prague, Czech Republic, 24–27 June 2019; pp. 121–127. [Google Scholar]
  5. Khraisat, A.; Gondal, I.; Vamplew, P.; Kamruzzaman, J. Survey of intrusion detection systems: Techniques, datasets and challenges. Cybersecurity 2019, 2, 1–22. [Google Scholar] [CrossRef]
  6. Abdulganiyu, O.H.; Ait Tchakoucht, T.; Saheed, Y.K. A systematic literature review for network intrusion detection system (IDS). Int. J. Inf. Secur. 2023, 22, 1125–1162. [Google Scholar] [CrossRef]
  7. Azab, A.; Khasawneh, M.; Alrabaee, S.; Choo, K.K.R.; Sarsour, M. Network traffic classification: Techniques, datasets, and challenges. Digit. Commun. Netw. 2024, 10, 676–692. [Google Scholar] [CrossRef]
  8. Moore, P.; Smalley, S.P.E. Linux Security Module Usage. 2018. Available online: https://www.kernel.org/doc/html/v4.16/admin-guide/LSM/index.html (accessed on 10 August 2023).
  9. Falco. Falco Security. 2023. Available online: https://falco.org (accessed on 10 April 2023).
  10. Apuasecurity. Tracee. 2023. Available online: https://github.com/aquasecurity/tracee (accessed on 10 April 2023).
  11. Ghavamnia, S.; Palit, T.; Benameur, A.; Polychronakis, M. Confine: Automated system call policy generation for container attack surface reduction. In Proceedings of the 23rd International Symposium on Research in Attacks, Intrusions and Defenses (RAID 2020), Sebastian, Spain, 14–16 October 2020; pp. 443–458. [Google Scholar]
  12. Zhu, H.; Gehrmann, C. Lic-Sec: An enhanced AppArmor Docker security profile generator. J. Inf. Secur. Appl. 2021, 61, 102924. [Google Scholar] [CrossRef]
  13. Song, S.; Suneja, S.; Le, M.V.; Tak, B. On the value of sequence-based system call filtering for container security. In Proceedings of the 2023 IEEE 16th International Conference on Cloud Computing (CLOUD), Chicago, IL, USA, 2–8 July 2023; pp. 296–307. [Google Scholar]
  14. Flora, J.; Antunes, N. Studying the applicability of intrusion detection to multi-tenant container environments. In Proceedings of the 2019 15th European Dependable Computing Conference (EDCC), Naples, Italy, 17–20 September 2019; pp. 133–136. [Google Scholar]
  15. Shen, J.; Zeng, F.; Zhang, W.; Tao, Y.; Tao, S. A clustered learning framework for host based intrusion detection in container environment. In Proceedings of the 2022 IEEE International Conference on Communications Workshops (ICC Workshops), Seoul, Republic of Korea, 16–20 May 2022; pp. 409–414. [Google Scholar]
  16. Lin, Y.; Tunde-Onadele, O.; Gu, X.; He, J.; Latapie, H. Shil: Self-supervised hybrid learning for security attack detection in containerized applications. In Proceedings of the 2022 IEEE International Conference on Autonomic Computing and Self-Organizing Systems (ACSOS), Online, 19–23 September 2022; pp. 41–50. [Google Scholar]
  17. Tien, C.W.; Huang, T.Y.; Tien, C.W.; Huang, T.C.; Kuo, S.Y. KubAnomaly: Anomaly detection for the Docker orchestration platform with neural network approaches. Eng. Rep. 2019, 1, e12080. [Google Scholar] [CrossRef]
  18. Kosińska, J.; Tobiasz, M. Detection of Cluster Anomalies With ML Techniques. IEEE Access 2022, 10, 110742–110753. [Google Scholar] [CrossRef]
  19. Wang, Y.; Chen, X.; Wang, Q.; Yang, R.; Xin, B. Unsupervised anomaly detection for container cloud via bilstm-based variational auto-encoder. In Proceedings of the 2022 IEEE International Conference on Acoustics, Speech and Signal Processing (ICASSP 2022), Singapore, 22–27 May 2022; pp. 3024–3028. [Google Scholar]
  20. El Khairi, A.; Caselli, M.; Knierim, C.; Peter, A.; Continella, A. Contextualizing system calls in containers for anomaly-based intrusion detection. In Proceedings of the 2022 on Cloud Computing Security Workshop, Los Angeles, CA, USA, 7–11 November 2022; pp. 9–21. [Google Scholar]
  21. Kotenko, I.V.; Melnik, M.V.; Abramenko, G.T. Anomaly Detection in Container Systems: Using Histograms of Normal Processes and an Autoencoder. In Proceedings of the 2024 IEEE 25th International Conference of Young Professionals in Electron Devices and Materials (EDM), Altai, Russia, 28 June–2 July 2024; pp. 1930–1934. [Google Scholar]
  22. Bu, S.; Jin, M.; Wang, J.; Xie, Y.; Zhang, L. SST-LOF: Container Anomaly Detection Method Based on Singular Spectrum Transformation and Local Outlier Factor. IEEE Transactions on Cloud Computing 2024, 13, 130–147. [Google Scholar] [CrossRef]
  23. Wu, S.; Liu, W.; Yan, M.; Wu, J. A Real-Time Anomaly Detection System for Container Clouds Based on Unsupervised System Call Rule Generation. Netinfo Secur. 2023, 23, 91–102. [Google Scholar]
  24. He, P.; Zhu, J.; Zheng, Z.; Lyu, M.R. Drain: An Online Log Parsing Approach with Fixed Depth Tree. In Proceedings of the 2017 IEEE International Conference on Web Services (ICWS), Honolulu, HI, USA, 25–30 June 2017; pp. 33–40. [Google Scholar] [CrossRef]
  25. Li, X.; Chen, P.; Jing, L.; He, Z.; Yu, G. SwissLog: Robust and Unified Deep Learning Based Log Anomaly Detection for Diverse Faults. In Proceedings of the 2020 IEEE 31st International Symposium on Software Reliability Engineering (ISSRE), Coimbra, Portugal, 12–15 October 2020; pp. 92–103. [Google Scholar] [CrossRef]
  26. Lupton, S.; Washizaki, H.; Yoshioka, N.; Fukazawa, Y. Literature Review on Log Anomaly Detection Approaches Utilizing Online Parsing Methodology. In Proceedings of the 2021 28th Asia-Pacific Software Engineering Conference (APSEC), Taipei, Taiwan, 6–9 December 2021; pp. 559–563. [Google Scholar] [CrossRef]
  27. Prasetya, D.D.; Wibawa, A.P.; Hirashima, T. The performance of text similarity algorithms. Int. J. Adv. Intell. Inform. 2018, 4, 63–69. [Google Scholar] [CrossRef]
  28. Raju, T.N.; Rahana, P.; Moncy, R.; Ajay, S.; Nambiar, S.K. Sentence similarity-a state of art approaches. In Proceedings of the IEEE 2022 International Conference on Computing, Communication, Security and Intelligent Systems (IC3SIS), Kochi, India, 23–25 June 2022; pp. 1–6. [Google Scholar]
  29. Pradhan, N.; Gyanchandani, M.; Wadhvani, R. A Review on Text Similarity Technique used in IR and its Application. Int. J. Comput. Appl. 2015, 120, 29–34. [Google Scholar] [CrossRef]
  30. Christen, P. A comparison of personal name matching: Techniques and practical issues. In Proceedings of the 6th IEEE International Conference on Data Mining-Workshops (ICDMW’06), Washington, DC, USA, 18–22 December 2006; pp. 290–294. [Google Scholar]
  31. fastText. Facebook AI Research. 2016. Available online: https://fasttext.cc/ (accessed on 10 August 2023).
  32. Challu, C.I.; Jiang, P.; Wu, Y.N.; Callot, L. Deep generative model with hierarchical latent factors for time series anomaly detection. In Proceedings of the International Conference on Artificial Intelligence and Statistics (PMLR), Valencia, Spain, 25–27 April 2022; pp. 1643–1654. [Google Scholar]
  33. Siffer, A.; Fouque, P.A.; Termier, A.; Largouet, C. Anomaly detection in streams with extreme value theory. In Proceedings of the 23rd ACM SIGKDD International Conference on Knowledge Discovery and Data Mining, Halifax, NS, Canada, 13–17 August 2017; pp. 1067–1075. [Google Scholar]
  34. Grimmer, M.; Röhling, M.M.; Kreusel, D.; Ganz, S. A modern and sophisticated host based intrusion detection data set. IT-Sicherh. als Voraussetzung für eine Erfolgreiche Digit. 2019, 11, 135–145. [Google Scholar]
  35. Zhu, Y.Q.; Deng, J.Y.; Pu, J.C.; Wang, P.; Liang, S.; Wang, W. Ml-parser: An efficient and accurate online log parser. J. Comput. Sci. Technol. 2022, 37, 1412–1426. [Google Scholar] [CrossRef]
Figure 1. A typical application scenario of our anomaly-detection service.
Futureinternet 17 00218 g001
Figure 2. Method Architecture.
Futureinternet 17 00218 g002
Figure 3. Rule Mining Flow.
Futureinternet 17 00218 g003
Figure 4. Hierarchical clustering. In this figure, FOO_URL1 represents “http://foo.ns1.svc.cluster.local:80”, BAR_URL2 represents “http://bar.ns2.svc.cluster.local:8080”, BAZ_URL3 represents “http://baz.ns3.svc.cluster.local:80”, URL_TEMPLATE represents “http://<*>.<*>.svc.cluster.local:80”.
Futureinternet 17 00218 g004
Figure 5. Anomaly classification model.
Futureinternet 17 00218 g005
Figure 6. Scenario struct.
Futureinternet 17 00218 g006
Figure 7. CPU usage and time for testing.
Futureinternet 17 00218 g007
Figure 8. F1 scores of models’ anomaly detections in KAS-DS.
Futureinternet 17 00218 g008
Figure 9. CVE_2012_2122 anomaly scores, w/params versus w/o params.
Futureinternet 17 00218 g009
Figure 10. CVE_2022_22947 anomaly scores, w/params versus w/o params.
Futureinternet 17 00218 g010
Figure 11. The ROC curves of application CVE exploits, misconfiguration exploits, and direct access.
Futureinternet 17 00218 g011
Table 1. Parameter Embedding Methods.
Type of ParameterParameters IncludedEmbedding Method
Typed Parametersevt.type, evt.dir,OneHot Embedding
fd.type, evt.arg.mode
Numerical parametersevt.deltatime, fd.numSigned normalization
evt.rawres, evt.arg.size,
evt.buflen
Structural parametersproc.sname, proc.pname,Template-based embedding
proc.name, proc.exe,
proc.args, evt.arg.name,
evt.arg.addr, evt.arg.tuple,
evt.arg.path
Table 2. Scenario description.
Application CVE Exploit
CVE_2022_22965Spring Framework RCE via Data Binding on JDK 9+
CVE_2022_22947Spring Cloud Gateway Actuator API SpEL Code Injection
CVE_2022_0543Redis Lua Sandbox Escape and Remote Code Execution
CVE_2020_1938Apache Tomcat AJP Arbitrary File Read/Include Vulnerability
CVE_2012_2122Mysql Authorization Bypass.
Misconfiguration Exploit
Mounted docker.sock exploitUse mounted docker.sock to
interact with the host docker daemon.
Kubeconfig exploitUse the Kubernetes tokens in the pod to
interact with the Kubernetes api server.
Host mount exploitUse the mounted host path to
read/write host files.
Abnormal Access
redis_unaccDirect redis access.
mysql_unaccDirect MySQL access.
Table 3. Template mining results.
ScenarioTotal TemplatesTotal Loss
OursDrainSwissLogOursDrainSwissLog
Employee Service1724195.1605.5906.920
Gateway Service1122146.0609.1106.010
Redis Service15382713.78066.37023.330
MySQL Service21576113.19028.41030.680
Table 4. Syscall filtering results.
ScenarioTotal Templates
OriginalFiltered by SeqFiltered by RulesFinal
Employee Service7160253104134175081
Gateway Service3038810217140776094
Redis Service7337149522483594
MySQL Service167561146335401753
Table 5. The performance benefit by filtering.
Average CPU Times (s)Testing Time (s)
OriginalFilteredOriginalFiltered
27.083.356.240.81
Table 6. Model settings.
AlgorithmsSettings
(Input dimension = 512, Encoder layers = 3, Attention heads = 8,
U-SCADFeedForward hidden dimension = 512, max_window_size = 256,
criterion = MSELoss, fasttext_dim = 50)
HIDS(thres = 0.8)
LSTM-VAE(hidden_size = 2048, latent_size = 1024)
Table 7. Anomaly classification results in KAS-DS.
ModelU-SCADHIDSLSTM-VAE
PRF1PRF1PRF1
CVE_2022_229650.8560.9990.9220.8610.9000.8800.5430.7680.636
CVE_2022_229470.9780.9910.9890.6270.1810.2810.3480.8840.499
CVE_2022_05430.8450.9980.9130.7611.0000.8640.3080.7230.432
CVE_2020_19380.9900.9920.9950.9411.0000.9700.7380.9450.829
CVE_2012_21220.8970.9980.9450.7350.5100.6020.5430.7680.636
Docker_sock0.9530.9730.9630.9320.9900.9600.7040.9540.810
Kubeconfig0.9870.9900.9880.8050.8900.8450.5880.8830.706
Host_mount0.9880.9880.9810.9140.9800.9460.8200.9790.892
redis_unacc0.8040.9820.8840.4310.5000.4630.3080.7230.432
mysql_unacc0.8470.8720.8590.7970.8200.8080.7410.8870.807
Avg.0.9150.9780.9440.7800.7770.7620.5640.8510.668
Table 8. Anomaly classification results in CB-DS.
ModelU-SCADHIDS
PRF1PRF1
CVE_2016_99620.9770.9900.9830.9970.9960.997
M-Socket0.9890.9940.9910.9970.9940.996
CVE_2019_57360.9951.0000.9970.9970.9910.994
CVE_2022_04920.9881.0000.9940.9970.9910.994
CVE_2022_08470.9930.9960.9940.9970.9890.993
M-SYS_MOD0.9900.9880.9890.9970.9990.998
M-SYS_ADMIN0.9870.9950.9910.9970.9960.997
M-MKNOD0.9940.9900.9920.9970.9940.996
M-NET0.9840.9950.9890.9970.9910.994
M-U_HELPER0.9930.9920.9920.9970.9980.998
Avg.0.9890.9940.9910.9970.9940.995
Table 9. Anomaly classification results in different window sizes.
Window SizeU-SCAD with ParamsU-SCAD Without Params
PRF1FPRPRF1FPR
640.6291.0000.7720.0200.5790.8190.6790.019
1280.7741.0000.8730.0110.6770.8430.7510.013
2560.9140.9780.9440.0140.8020.8220.7790.031
Disclaimer/Publisher’s Note: The statements, opinions and data contained in all publications are solely those of the individual author(s) and contributor(s) and not of MDPI and/or the editor(s). MDPI and/or the editor(s) disclaim responsibility for any injury to people or property resulting from any ideas, methods, instructions or products referred to in the content.

