1. Introduction
In recent years, the advent of emerging network technologies such as the edge computing, the Internet of Things (IoT), and 5G communication networks has significantly enhanced people’s quality of life and facilitated deeper integration of networks into various aspects of social life. In an edge computing scenario shown in
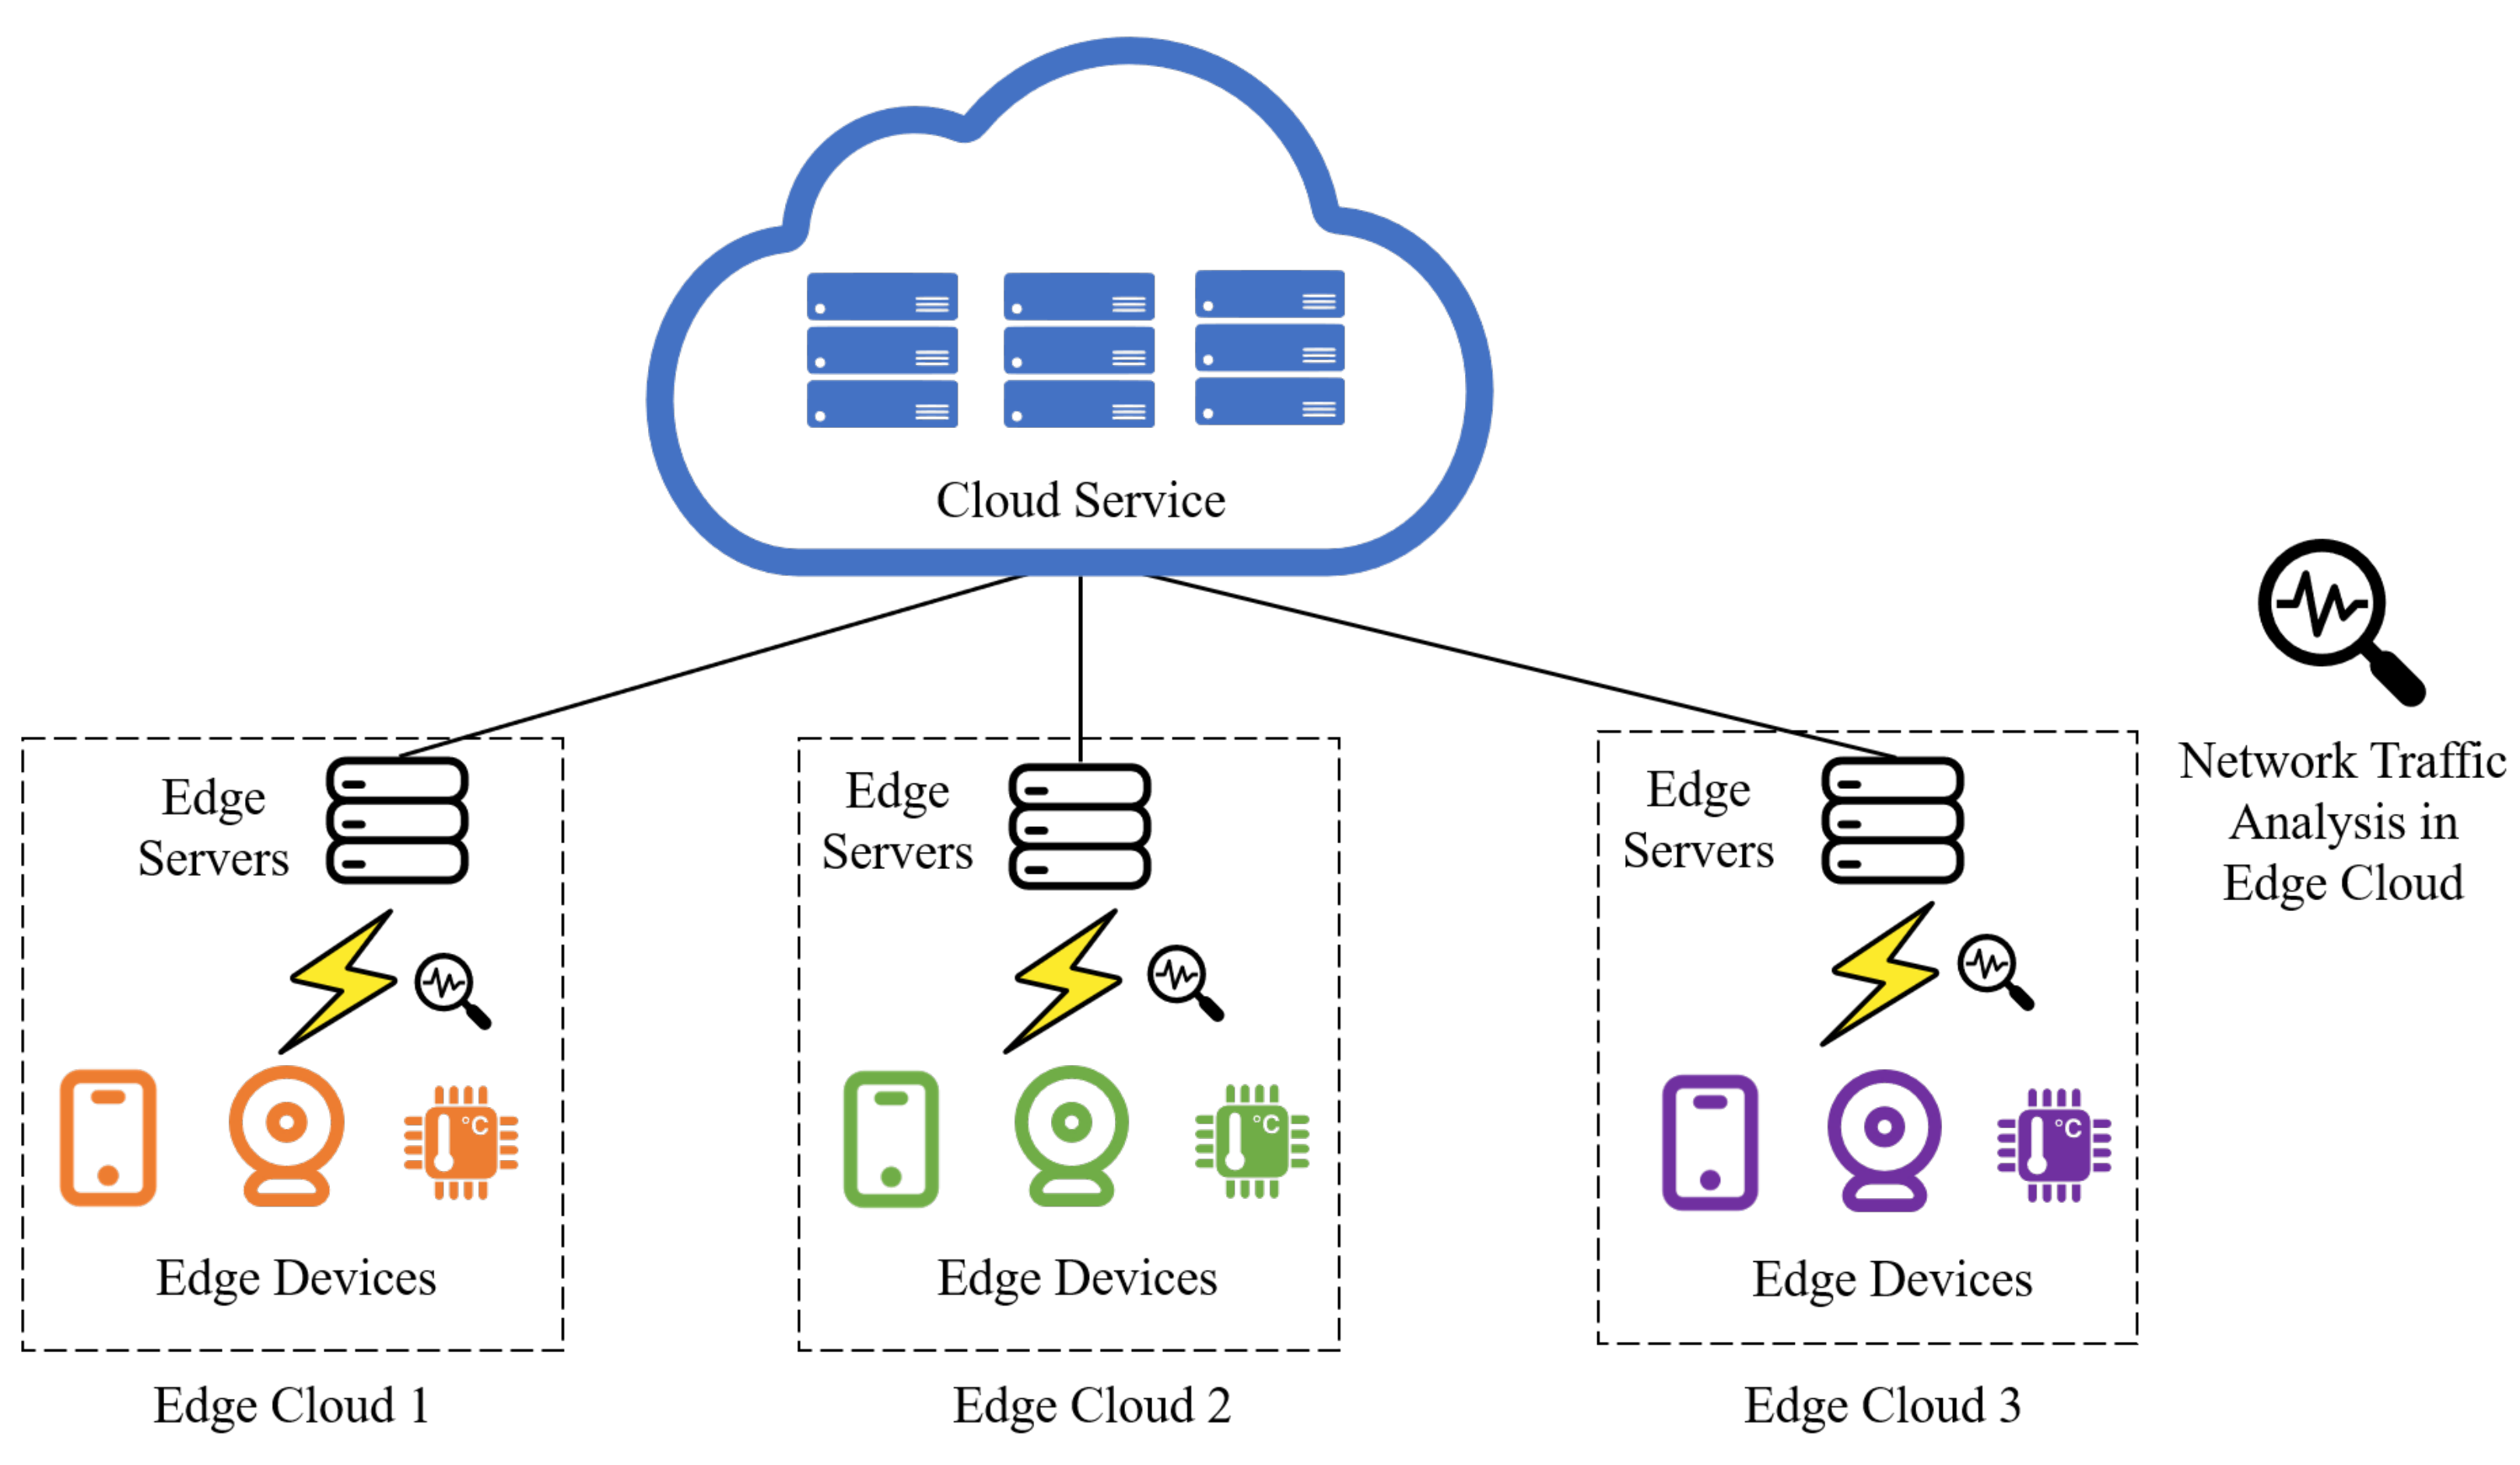
Figure 1, multiple different edge devices are connected via wireless channels to the edge compute node, which is then connected to the cloud. In this process, the edge node acts as the access for edge devices, transmitting relevant data to the cloud while running multiple downstream tasks like network analysis on these data. This wave of networking is driving a rapid expansion in network size, with the number of global Wi-Fi devices exceeding 7.2 billion by the end of 2023 and projected to reach 8.9 billion by 2028, widely distributed across industrial sites, commercial offices, home access, and other scenarios; while the total number of connections is expected to reach 100 billion by 2028 [
1], and IoT Analytics further predicts that 40 billion IoT devices will be connected by 2030, predominantly wireless IoT devices [
2], with the total traffic generated by mobile users and IoT devices estimated to reach 850 ZB in 2021 [
3]. However, this wireless trend brings new challenges to current network technology.
Transmission instability caused by environmental interference. Because the signals in the wireless communication environment are transmitted in the same space, the external environment will have a significant impact on the transmission, such as shelter in the environment, rain attenuation, etc., and this problem is more obvious in high-frequency communication (such as 5G) [
4,
5]. Additionally, in high-density deployment environments, the simultaneous transmission of multiple devices may lead to channel competition and collision, such as the collision between Bluetooth Low Energy and LoRaWAN in high-density scenarios [
6]. Moreover, different wireless technologies (e.g., Wi-Fi, ZigBee, Bluetooth) may interfere with each other when operating in shared spectrum bands. For instance, ZigBee and Wi-Fi operate in the same 2.4 GHz band, and without proper interference mitigation techniques, signal collisions may occur [
7]. Channel competition, environmental interference, and other factors in wireless communication can disrupt packet transmission, leading to high packet loss rates in edge computing. In addition, retransmission mechanisms fail to mitigate packet loss due to persistent channel errors caused by environmental dynamics, further exacerbating the negative impact on downstream network tasks.
Conventional retransmission mechanisms fail to recover lost packets under persistent channel errors (e.g., rain attenuation in millimeter-wave links) [
8], and in order to reduce the interference of downstream tasks, network traffic needs to be completed and reconstructed to ensure the good operation of downstream tasks in the network. In the field of data reconstruction, data imputation algorithms have proven to be effective in various scenarios, as demonstrated in previous studies [
9,
10,
11,
12]. However, network traffic presents a unique challenge due to its complexity, encompassing diverse types, lengths, and structures of missing packets, which makes it impossible to reconstruct the raw traffic data. In addition, in recent years, on edge computing networks, common downstream tasks (such as network traffic information extraction, traffic classification, and network intrusion detection) have mostly been based on processed network traffic characteristics data [
13,
14,
15,
16]. For the characteristics of downstream tasks, we decided to reconstruct the network traffic characteristics instead of the full packet data. Interestingly, we have observed certain similarities between network traffic and other fields, such as image data and natural language. These domains can be abstracted as vectors, where each object may have relationships with its neighboring elements. This observation suggests that novel approaches inspired by these fields could potentially be leveraged for network traffic reconstruction tasks.
To test the validity of our model, we chose network traffic analysis, which has received academic attention and urgency in the edge computing field in recent years, as a downstream task [
17,
18,
19]. Due to the low computing power of edge nodes, their security protection capabilities are also low, which makes them easy targets for attackers. According to Kaspersky researchers, the number of attacks against IoT devices rose to 15 billion in 2020–2021, an increase of more than 100% [
20], and Gartner’s annual report estimates that about 90% of IoT devices will be unmanaged and unprotected in 2025 [
21]. This poses significant challenges to current network security. To address the growing number of network attacks, traffic analysis serves as an effective means to detect and mitigate these threats [
22,
23]. Through traffic analysis, their ability to provide detection and surveillance of attacks throughout their life cycle enables a response to advanced persistent threats that can evade existing security measures. In this field, machine learning and deep learning methods have been widely adopted in the field of network traffic analysis in recent years [
24,
25,
26]. These models use the pre-processed network data flow to train and classify the traffic to be analyzed to determine whether it is harmful traffic. However, such methods rely heavily on complete data. If significant packet loss occurs, models struggle to accurately classify traffic types due to insufficient information. Our experiments on the CIC-IDS-2017 dataset show that when packet loss reaches 70%, the F1-score of downstream deep learning models for traffic classification drops sharply, with a maximum decline of 73.86% (see
Section 4.4 for detailed information). Therefore, it is very difficult to analyze network traffic when network traffic is lost, and it is more difficult for the model to find abnormal behavior in the network.
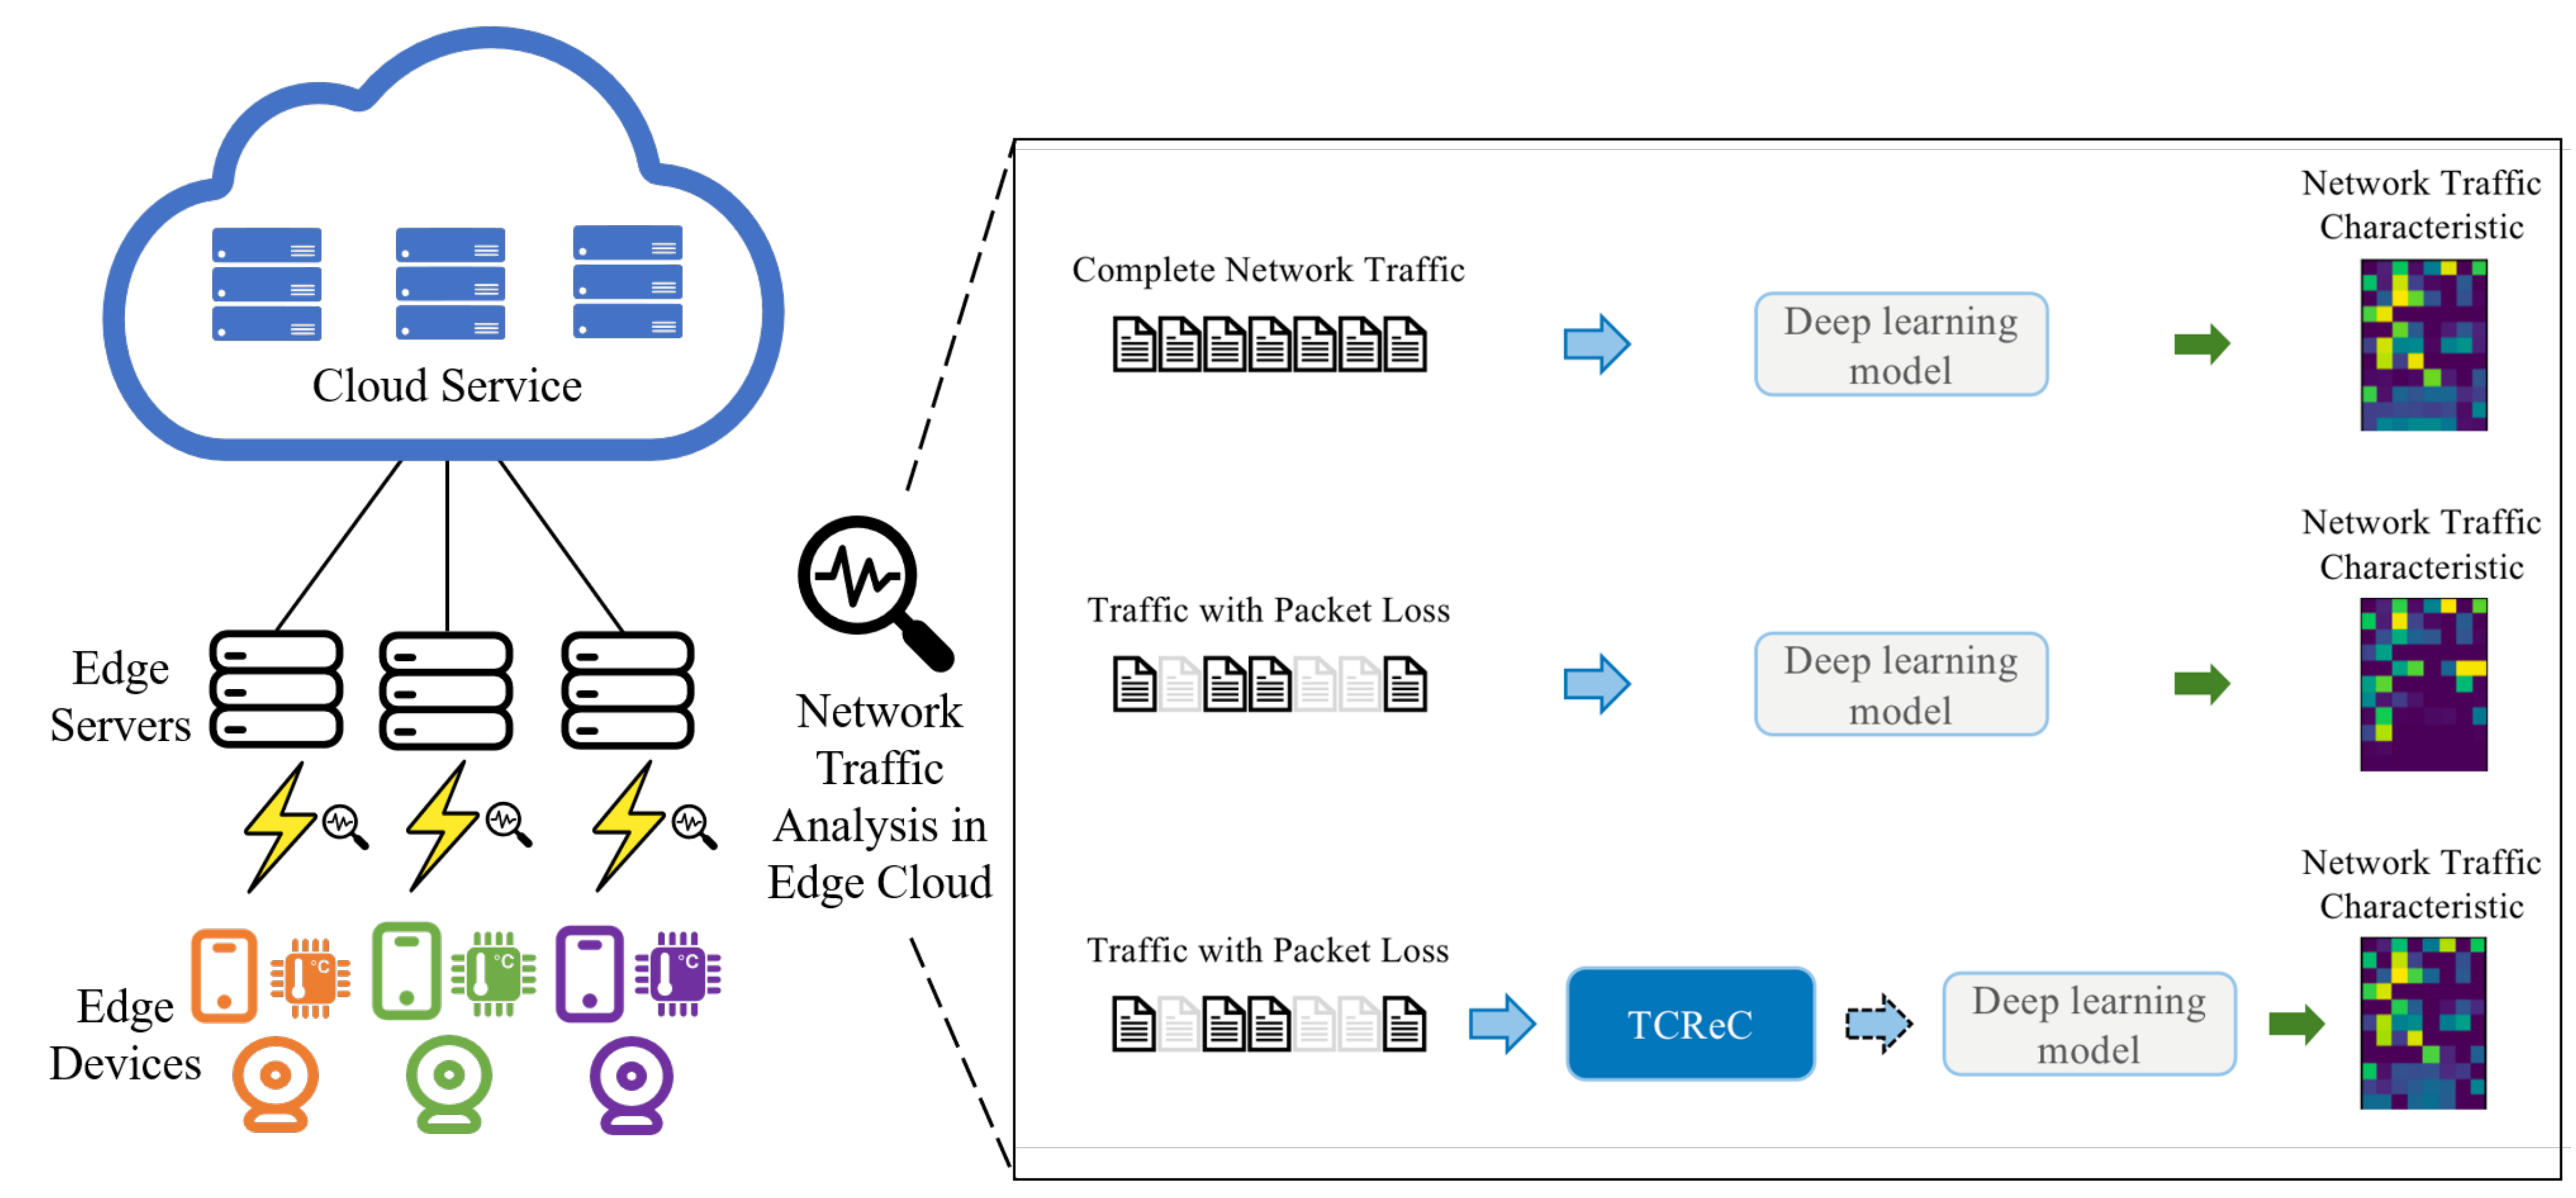
To address these challenges, we have introduced TCReC, an innovative model specifically designed to reconstruct lost network traffic characteristics.
Figure 2 illustrates the typical deployment scenario of deep learning methods in edge computing environments. In such scenarios, network traffic analysis tasks are deployed on edge servers or cloud servers, utilizing network traffic data for analysis and inference. When utilizing the proposed approach outlined in this paper, the reconstructed network traffic characteristics exhibit a remarkable similarity to the complete ones in terms of the deep learning model’s comprehension. This approach enables the effective extraction of underlying characteristics from network data flows and intelligent identification of patterns, highlighting the efficacy of the proposed method in achieving accurate identification and understanding of network traffic characteristics.
In summary, the main contributions of this study are as follows:
We propose TCReC, a novel model for reconstructing network traffic characteristics through masked autoencoder-driven feature recovery, which effectively mitigates the adverse effects of packet loss on downstream analysis tasks in edge computing environments;
We employed t-SNE for dimensionality reduction on both original and reconstructed network traffic data, visualizing the 2D representations with scatter plots to depict traffic relationships, distances, and aggregations;
We introduce RAI, an evaluation metric, to quantify TCReC’s performance in practical scenarios, which is independent of specific deep learning-based services;
We conduct extensive experiments on the ISCX-VPN-2016 [
27], CIC-IDS-2017 [
28] dataset, with the results showing that TCReC outperforms five other reconstruction methods, including Transformer, achieving the highest F1-score and RAI.
The remainder of this paper is organized as follows:
Section 2 introduces the related works of this study.
Section 3 provides a detailed description of our proposed model.
Section 4 presents an experimental analysis in three parts. Finally,
Section 5 presents the conclusions of the study and our future research direction.
2. Related Works
Packet loss is essentially a case of data loss, and the requirements for data integrity are different in various scenarios. It is necessary to set appropriate reconstruction targets according to different application scenarios. In the current research, two kinds of reconstruction methods are employed:
Reconstruction for precise data, which means filling the original value of the missing bytes, such as the data imputation algorithms [
29,
30,
31,
32]. The classic data imputation methods, including middle value imputation, mean value imputation, k-nearest neighbors, and decision trees, are often used for comparison [
33,
34]. In recent years, the autoencoder (AE) and its variants have often been applied to the data imputation field due to their properties concerning their ability of learning from corrupted data [
35]. The commonly used evaluation indexes of data imputation methods, including Mean Square Error (MSE), mainly focus on the difference between the original data and reconstructed data.
However, in data imputation studies, most of the study object comprises tabular data, which are quite different from the network traffic data. Tabular data are multidimensional and structured. In most cases, each dimension of the tabular data represents a feature, and each feature has a clear meaning. However, network traffic is one-dimensional and cannot be segmented into multiple features with clear semantics.
When imputing tabular data, the type and meaning of the missing data is clear, and the length of a single missing value is relatively short. However, network traffic data vary greatly, and it is difficult to determine the meaning of the missing parts. When packet loss happens, the length of the missing values equals the length of the lost packets, which are much larger than the missing tabular value. Thus, some of the classical methods that are suitable for tabular data, such as mean value imputation and middle value imputation, are not applicable for network traffic since these methods are too simple.
Reconstruction for characteristics, which means reconstructing the characteristics of the missing data. The mainstream method of analysing raw traffic data is the deep learning method, which is mainly based on the potential characteristics of network traffic [
36]. Therefore, learning the deep characteristics of the network traffic and reconstructing the missing part at the character level rather than the original byte level can reduce the difficulty of data reconstruction. Some deep learning-based models can effectively extract and reconstruct the characteristics of the data and are mainly used in the field of natural language processing (NLP) and computer vision (CV). BERT (Bidirectional Encoder Representation from Transformer) [
37] proposed by Devlin et al. in 2018 adopts a masked language model (MLM), which randomly covers or replaces words in sentences during training. BERT can generate deep bi-directional linguistic representation and predict the covered or replaced words. Masked Autoencoder (MAE) [
38] proposed by He et al. in 2021 learns image features by randomly masking image patches. It performs work similar to image restoration in the pre-training stage and reconstructs lost pixels in the output. The evaluation method of these kinds of methods is usually closely related to practical application, such as image recognition and language classification.
However, in the field of network traffic analysis, there is no widely used method or model that tries to reconstruct the characteristics of the missing network flow data.
This study proposes TCReC, which reconstructs the characteristics of the lost packets. To better describe the reconstruction effect in the application scenarios of TCReC, we design an evaluation index that illustrates TCReC’s capability under practical network traffic classification experiments.
To further summarize and compare the characteristics of existing traffic reconstruction and imputation methods, we present a comparative overview in
Table 1. The table outlines key aspects of several representative approaches, including their loss handling strategies, model architectures, ability to reconstruct network traffic characteristics, and evaluation metrics used in related studies. This comparison highlights the limitations of traditional methods and emphasizes the strengths of our proposed TCReC framework, particularly its robustness under high-packet-loss scenarios and its ability to preserve meaningful traffic features for downstream tasks such as intrusion detection and classification.
3. Model Description
3.1. Overview of TCReC
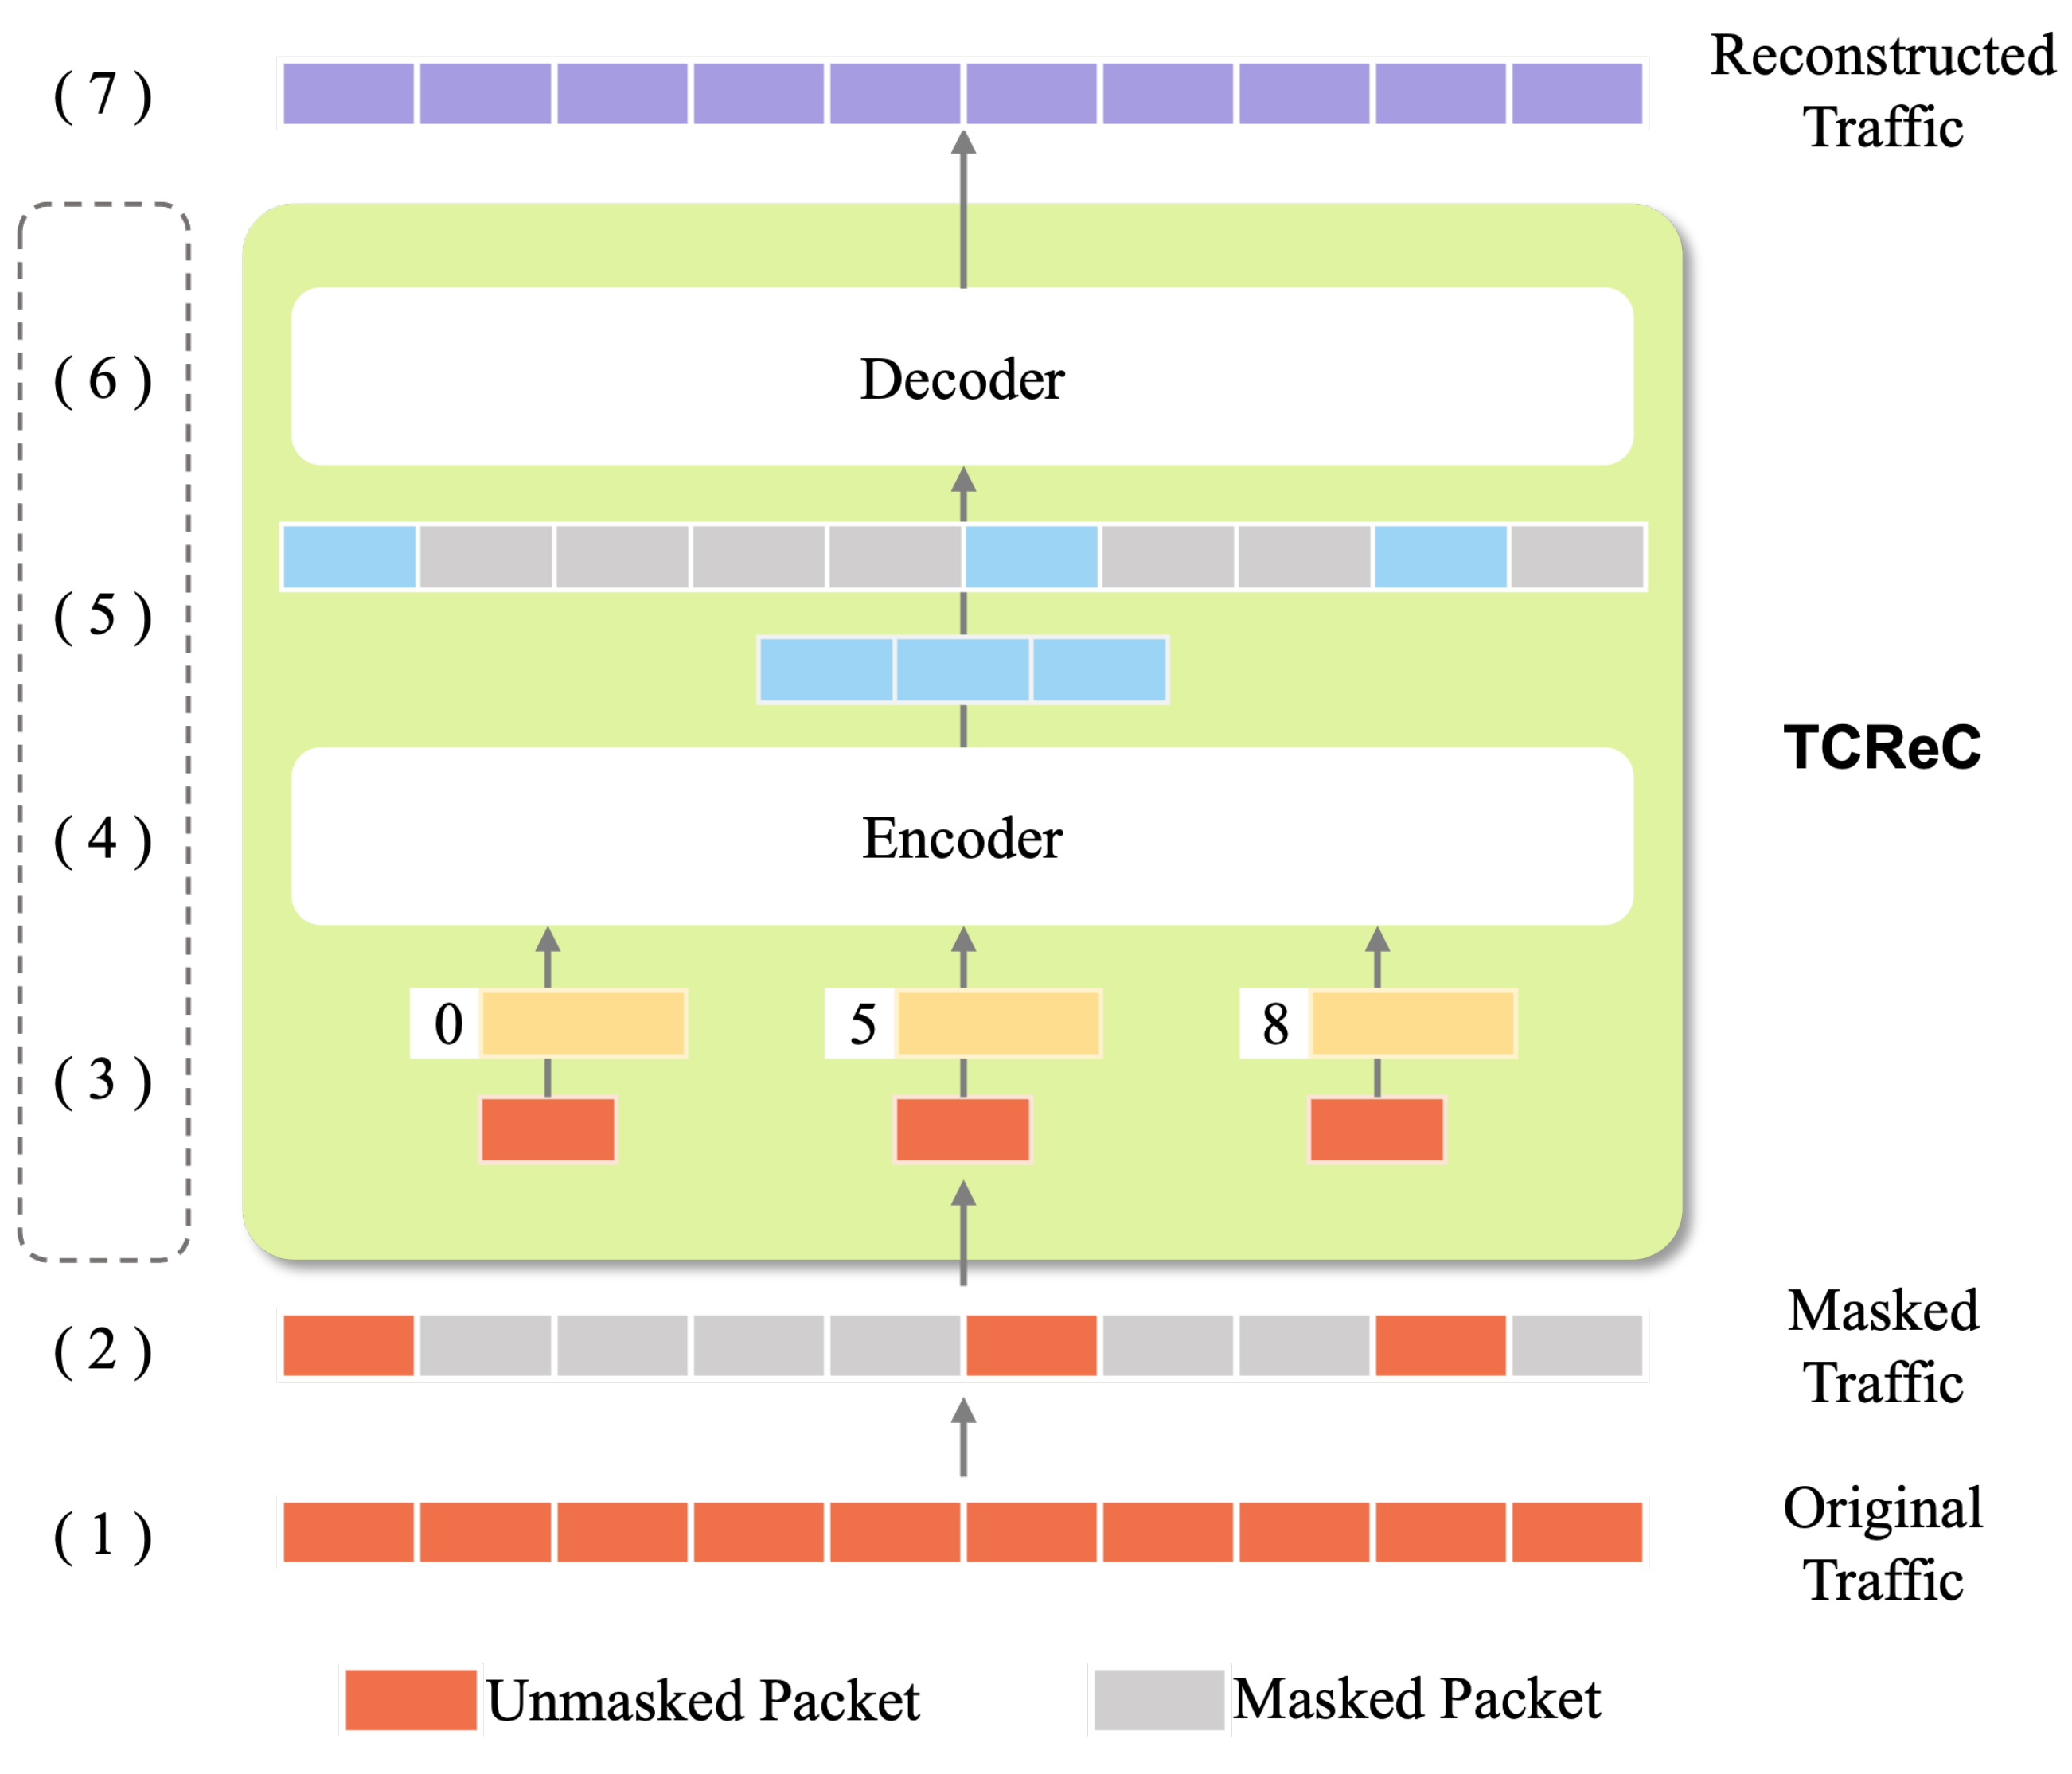
TCReC can reconstruct the characteristic information of network flow according to incomplete data. This section takes the training process of the TCReC model as an example to introduce the process of the method. The process can be divided into four parts, and contains seven key steps, as illustrated in
Figure 3.
The steps of the process are as follows:
The original network traffic data is preprocessed to form the input data suitable for the model.
The input data are segmented into fixed-size data blocks. The packets are then masked according to the mask ratio, and form two groups of packets: masked and unmasked.
The two groups of data are embedded, and positional embeddings are added based on the whole input data.
Unmasked blocks are sent to the encoder. These high-dimensional data will be mapped into low-dimensional space by the encoder.
The output is spliced with the masked blocks according to the position information.
The spliced data blocks are input into the decoder, and the missing characteristics are reconstructed according to the characteristics extracted by the encoder.
The decoder outputs the reconstructed network traffic data.
The main component of the process, comprising steps (3) to (6), is referred to as TCReC.
The key functions of TCReC are as follows:
Obtaining the characteristics of network traffic is the premise of characteristic reconstruction. TCReC has good characteristic extraction ability and can fully learn the characteristic information of the data.
This study focuses on the reconstruction of network traffic, while the decoder of TCReC can play the role of data reconstruction.
Our research object is the packet loss traffic data, while the mask operation tries to simulate a packet-loss scenario and enables TCReC to learn and reform the characteristics of missing data, then complete the reconstruction task through incomplete data.
It is worth noting that TCReC functions as an intermediary between the data collection process and model inference, rather than an inline network component. It operates after packet collection and before downstream analysis tasks such as traffic classification or intrusion detection. As a result, it does not introduce latency into the actual data transmission process. Its computational cost affects only the processing time of the analytical pipeline, making it well-suited for deployment in edge computing environments where reliable traffic analysis is needed without compromising network responsiveness.
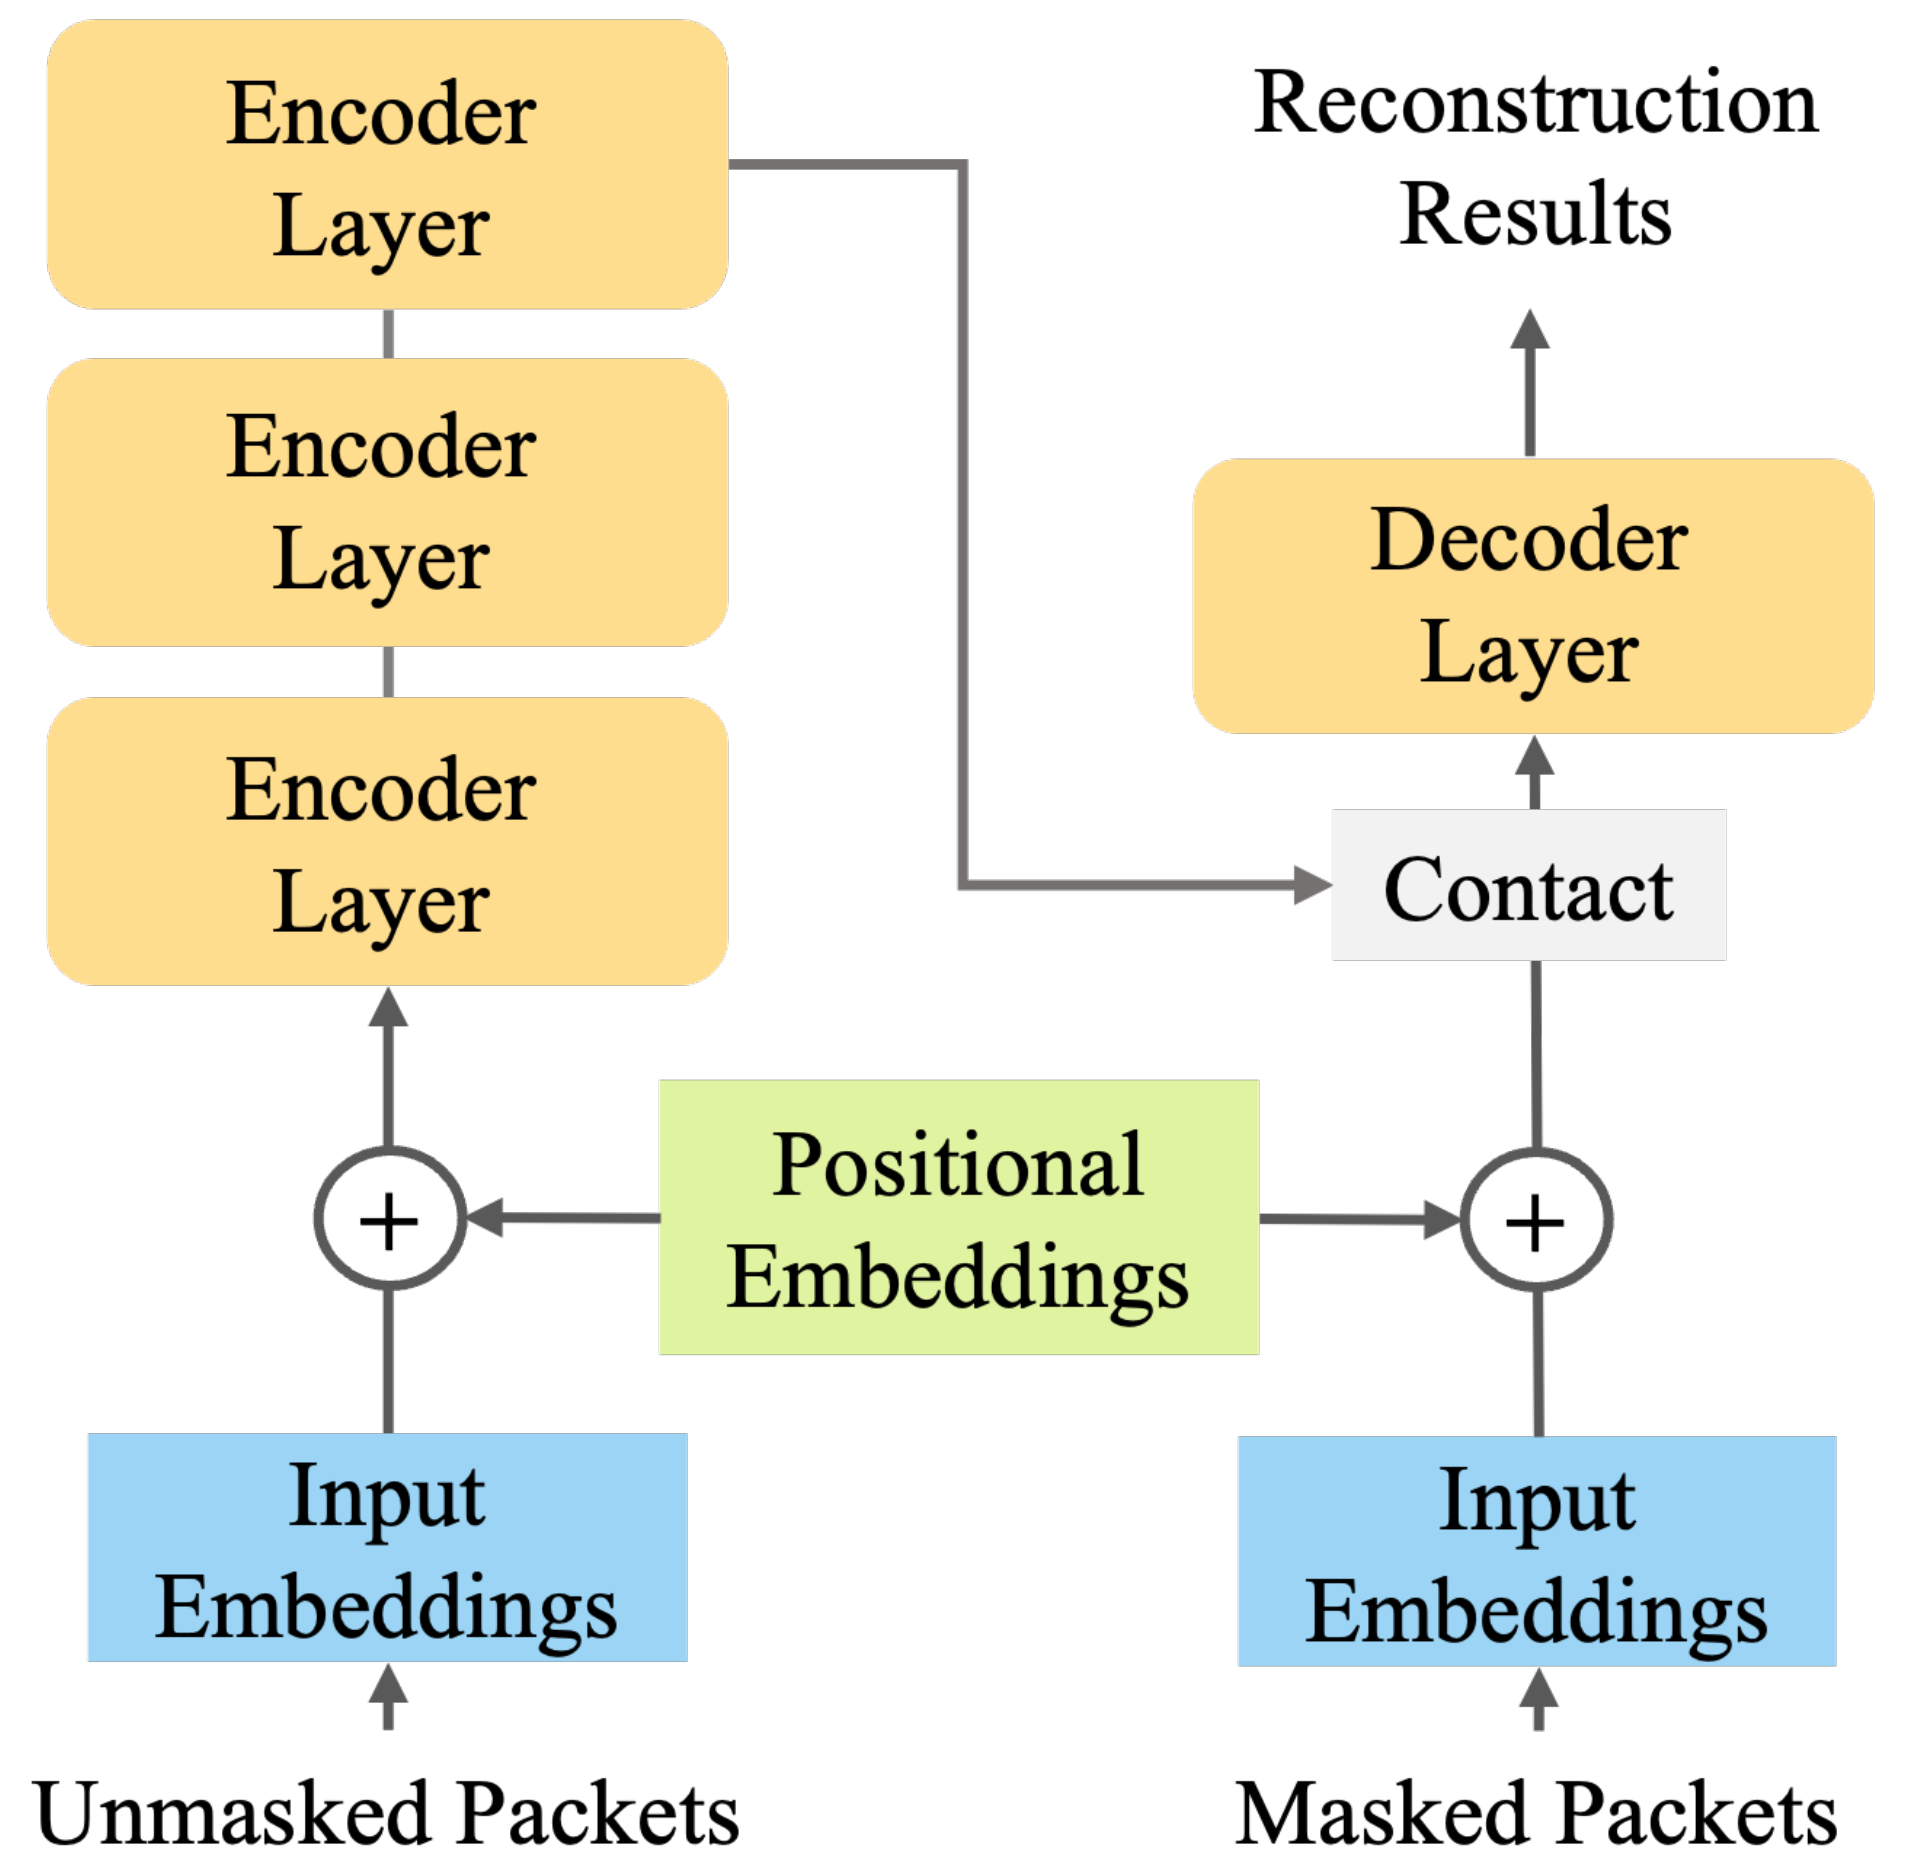
3.2. Detailed Structure of TCReC
The basic architecture of TCReC is an autoencoder based on Transformer [
39], which can realize characteristic extraction and reconstruction of incomplete network traffic data. The input to the model is the one-dimensional network traffic with packet loss, which is mapped to potential characteristics by the encoder. The decoder reconstructs the missing part of the traffic data according to the extracted characteristics, and finally, outputs the reconstructed data flows. The detailed structure of TCReC is shown in
Figure 4.
The inner structure of the encoder and decoder module is shown separated onto the left and right. The encoder is stacked by encoder layers, and the decoder is stacked by decoder modules. The number of stacked layers can be adjusted according to the application scenarios. The whole structure follows an encoder–decoder pattern. The mask operation is performed before data is input into the encoder.
According to the structure of TCReC, the following sections introduce the data pre-processing algorithm, the data segmentation and mask methods, the positional embedding, the encoder and decoder, the reconstruction target, and the effective evaluation method for the model.
3.2.1. Data Pre-Processing
Typically, the captured network data are divided into multiple data flows based on the five-tuple (source IP address, destination IP address, source port number, destination port number, and transport-layer protocol) information. The input size of TCReC is fixed, while the size of network flows varies greatly. In order to adapt the input size of TCReC, a fixed amount of continuous data packets is required. We use the concept of segmentation to label different parts of the data flows. The size of the segment is fixed. As reported in previous studies [
40], most network flows in real-world scenarios contain only a small number of packets—often around five. Based on the previous studies and experimental comparison, we set the segment size to 10 packets to accommodate this characteristic while preserving more contextual information. When the length of the data flow is longer than a segment, every 10 packets will be cut into a segment and input to TCReC for processing. When the data flow length is less than the segment size, or the remaining length is less than 10 packets, 0 will be used to fill. A total of 112 bytes are selected from each packet to represent the whole packet, comprising 56 bytes of the header and 56 bytes of the payload.
This pre-processing method can effectively expand the number of input data and facilitate the model to fully learn the local characteristics of the data flow.
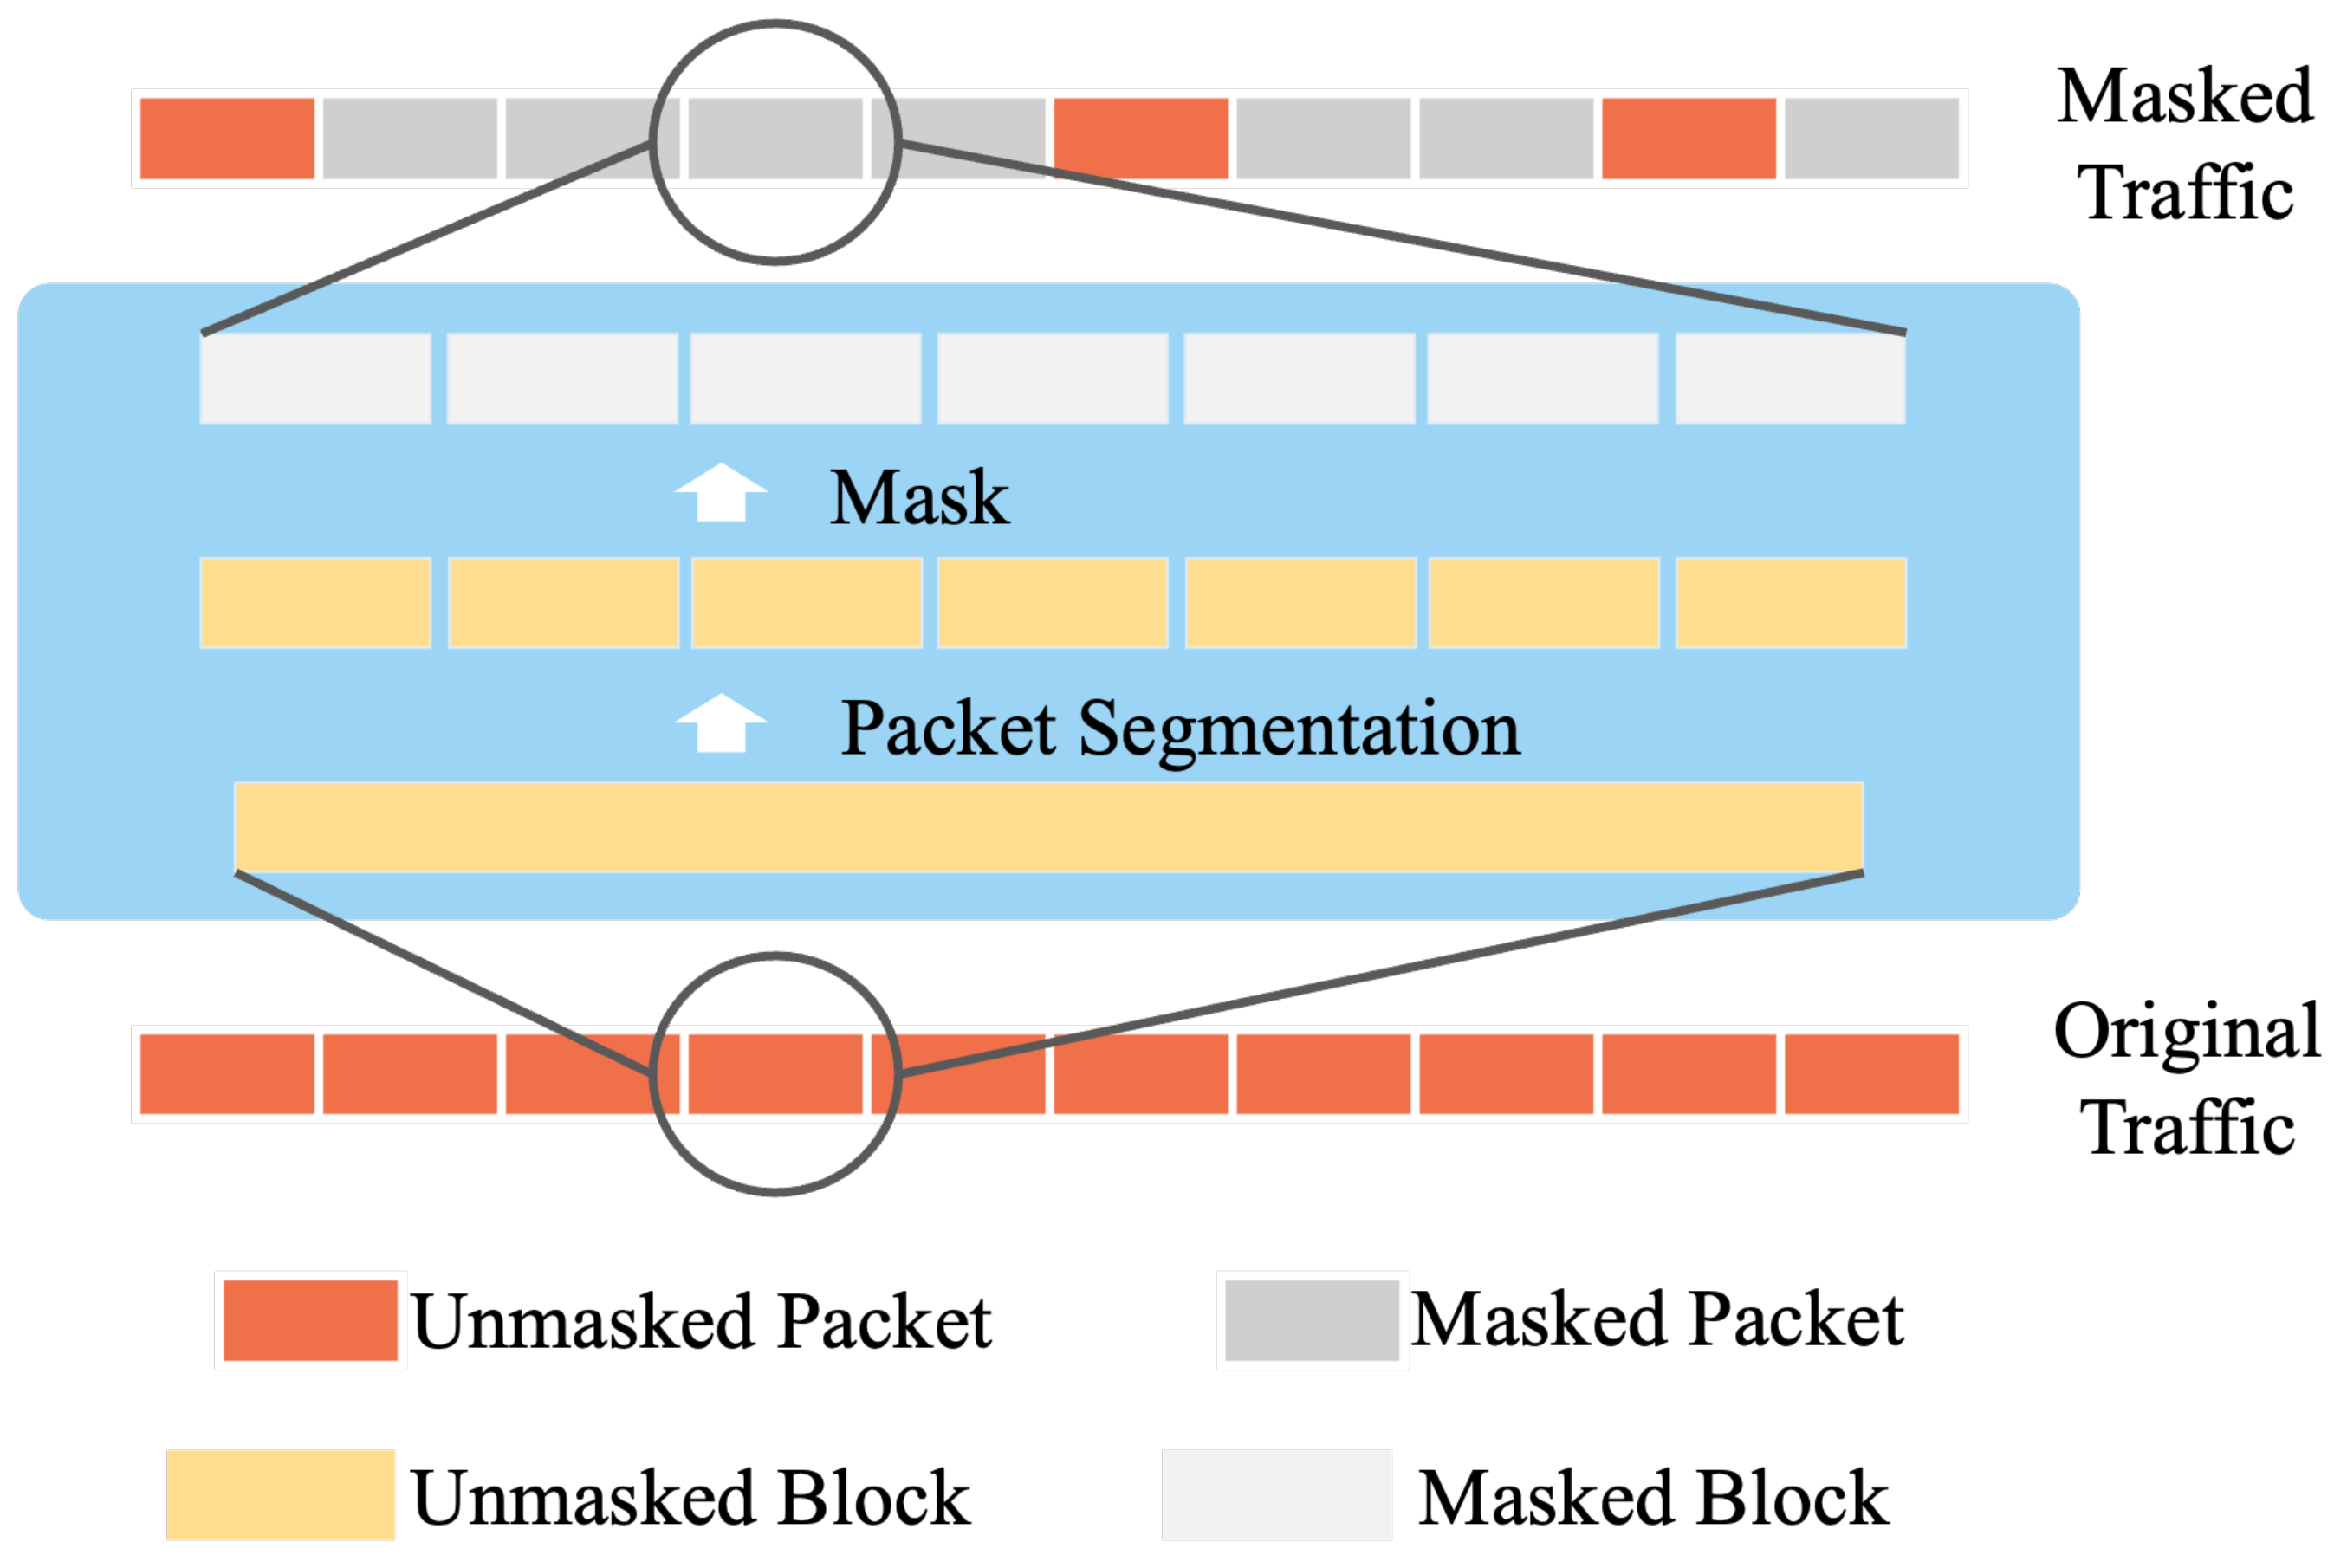
3.2.2. Mask Method and Data Segmentation
Prior to feeding the data to the encoder, TCReC applies a masking operation on the network traffic. The purpose of this mask operation is to enable the encoder to learn how to extract meaningful features from incomplete data during the training process. The masking process involves several steps. First, TCReC determines the number of packets in a flow and calculates the number of packets to be masked. Next, the packets are divided into two categories: masked and unmasked. The packets in the masked category are then masked, while the packets in the unmasked category remain unchanged. This approach allows TCReC to train the model to effectively handle and reconstruct data with missing or masked packets.
During the mask operation, we incorporate a packet segmentation method. As shown in
Figure 5, before applying the mask to the packets, we divide each packet into fixed-length blocks and mask these blocks. This block-based masking approach enables effective masking of the packets. Furthermore, these data blocks also affect the location encoding part, which will be discussed in detail in a subsequent section.
Data segmentation is implemented to address the issue of ignoring detailed information when masking long segments of data, such as an entire packet or longer. Such masking can lead to a poor reconstruction effect. Conversely, if the data blocks are too short, it becomes challenging for the model to extract meaningful characteristics as they contain minimal information. Through experimentation, we have determined that a small data block strategy is effective, where a data block length of 16 bytes is used. This length strikes a balance between preserving essential information and facilitating the extraction of meaningful features.
3.2.3. Positional Embedding
We adopt the absolute positional embedding method. A tensor with the same size as the embedded data block is generated according to the position information of the data block, and it is added to the embedded data block to record the position of the block in the whole data flow to facilitate the model to learn the relationship between features and positions from the spatial aspect.
Due to the aforementioned data segmentation, the location encoding is actually a location encoding of traffic blocks, which enables the model to learn more feature details of the traffic data, and then perform a more accurate reduction.
3.2.4. Enecoder and Decoder
The encoder of TCReC maps the input data to a low dimension in order to extract characteristics with high density, and the decoder can remap the characteristics to high-dimensional data to realize data reconstruction. The encoder is mainly based on the encoder module of Transformer, and its structure is shown in
Figure 4. In order to simplify the model, the decoder used in this paper has the same structure as the encoder.
An encoder module is mainly composed of a multi-head self-attention layer and a feedforward neural network layer. Self-attention mainly focuses on the relevance of the internal parts of the input, which enables the model to better understand the various parts of the characteristics in the network traffic and extract the valuable information. However, an attention matrix can only obtain one set of correlation. The multi-head attention initialize multiple matrices for training to obtain multiple groups of outputs, and can obtain the correlation between data blocks from multiple expression spaces.
Residual connection is used in both encoder and decoder layers, the essence of which is to express the output as the superposition of a nonlinear transformation of input and output, enhance gradient flow through layer hopping connection, break the symmetry of the network, and solve the problem of gradient disappearance and degradation in a deep neural network [
41].
In addition, the data will undergo layer normalization before being input into each layer. This mode of layer normalization before input is called the pre-norm mode. Different from the post-norm mode adopted in the original Transformer encoder module, this method does not rely on the pre-heating stage of learning rate, which can reduce the amount of introduced super parameters, and make the training process more efficient [
42].
3.2.5. Reconstruction Target
TCReC reconstructs the input traffic data by predicting the bytes in masked packets. Since the model does not learn and reconstruct the packet format in strict accordance with the data in the original packet, this cannot be accurately restored; for example, the field in the header of the packet may lose its semantics and become unexplainable after reconstruction. Therefore, the reconstructed data may be quite different from the original data at the byte level. However, the model can fully learn the characteristics of the network traffic and its related location information during the training process; thus, the reconstructed data can still maintain high consistency with the original data at the deep feature level.
3.3. Comparison of Data Distribution
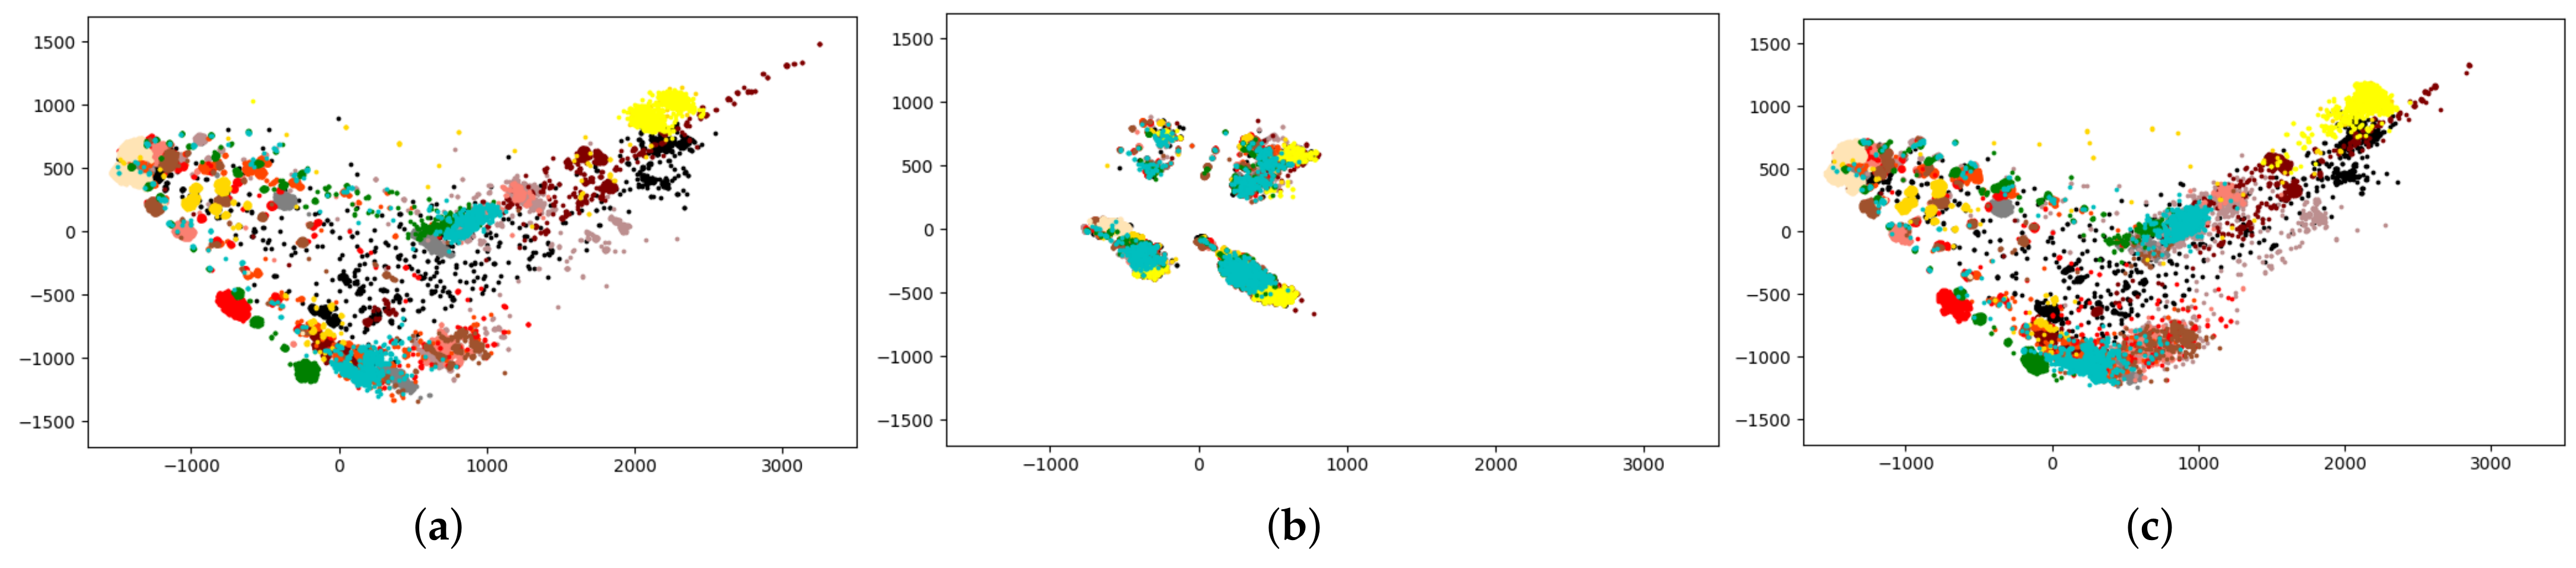
In order to explain the reconstruction ability of TCReC based on the characteristics of the reconstructed data itself and compare it with other reconstruction algorithms, we employed the t-SNE algorithm to perform feature dimensionality reduction to 2D on the original traffic data, reconstructed traffic data from different algorithms, and traffic data with 70% masked proportion (to simulate scenarios of packet loss), and visualized these on scatter plots. The scatter plot represents the relative positions between different traffic types as well as the clustering degree of each individual traffic flow. Different colors are used to represent different traffic types, and each point in the plot represents a traffic flow. From multiple scatter plots in
Figure 6, we observed the following points:
The distribution of the data flows after 70% masking is significantly altered and shows substantial differences from the distribution of the original data.
Compared to the scatter plot of the original traffic flows, each traffic flow reconstructed by TCReC is distributed in positions that are close to the original ones.
The clustering degree of each type of flow reconstructed by TCReC is also similar to that of the original flows.
The reconstructed data from other algorithms exhibit varying degrees of data distribution shift, while some algorithms achieve an overall distribution that is close to the original traffic, there are significant changes in the relative positions of each type of flow’s clustering with respect to other types. We will provide a detailed discussion on this aspect in the experimental section.
It should be noted that, even though the t-SNE algorithm can not represent precisely the actual distribution of the high-dimensional feature of the traffic data after the reduction to a two-dimensional plane, we can still compare different reconstructed data with the original data and observe the similarity and clustering degree of the traffic data intuitively.
Figure 6.
(a) t-SNE plot of original traffic, (b) t-SNE plot of 70% packet loss traffic, (c) t-SNE plot of TCReC reconstructed traffic.
Figure 6.
(a) t-SNE plot of original traffic, (b) t-SNE plot of 70% packet loss traffic, (c) t-SNE plot of TCReC reconstructed traffic.
4. Experimental Analysis
Given that the characteristics of network traffic are highly abstract, evaluating the accuracy of their reconstruction via the result of the loss function is challenging. Therefore, we integrate the evaluation process with downstream tasks such as network traffic classification and intrusion detection. By doing so, we can illustrate the impact of reconstruction results on the subsequent analysis results.
Typically, a deep learning model is necessary for the network traffic analysis task. As Convolutional Neural Networks (CNNs) [
43] are widely used to learn spatial data characteristics, and Long-Short Term Memory (LSTM) [
44] is effective for learning temporal data characteristics, we select either CNN or LSTM as the classifier of downstream analysis tasks. This enables us to compare the efficacy of TCReC across different application scenarios.
In this section, we evaluate the reconstruction ability of TCReC through four groups of experiments. The reconstruction ability mainly includes the following aspects:
- (1)
Reconstruction ability of various models (
Section 4.4) using CNN as a classifier to analyze the accuracy of reconstructed attack traffic data (CIC-IDS-2017 dataset).
- (2)
Reconstruction ability of TCReC adapting different classifiers (
Section 4.5) using CNN and LSTM as classifiers to analyze temporal and spatial features TCReC reconstructed (CIC-IDS-2017 dataset).
- (3)
Reconstruction ability of TCReC under different packet loss rates (
Section 4.6) using CNN and LSTM as classifiers to analyze the effect of packet loss rates (CIC-IDS-2017 dataset).
- (4)
Reconstruction ability of TCReC in common network traffic analysis scenarios (
Section 4.3) using CNN to analyze Internet application traffic data (ISCX-VPN-2016 dataset).
4.1. Experiment Setup
4.1.1. Datasets
To evaluate the effectiveness of TCReC in addressing transmission instability caused by channel interference in edge computing environments, we selected two widely recognized and representative network traffic datasets: ISCX-VPN-2016 and CIC-IDS-2017. These datasets contain rich and diverse traffic patterns that could be observed in real-world edge computing and IoT scenarios. Specifically, ISCX-VPN-2016 includes seven different types of Internet application communication data, while CIC-IDS-2017 covers a broad range of normal and malicious traffic, including 12 kinds of attack types such as DoS, PortScan, and Infiltration. The characteristics of these datasets make them particularly suitable for evaluating TCReC’s ability to reconstruct meaningful traffic features under packet loss conditions induced by wireless channel interference and environmental dynamics.
4.1.2. Parameters
According to experiments, the parameters of TCReC are set as
Table 2.
4.1.3. Evaluation
The characteristics of network flow reconstructed by the decoder of TCReC will serve as input to the CNN or LSTM model for classification. The classification data consist of various traffic types, and we evaluate the experimental results by using a multiple confusion matrix, precision, recall, and F1-score as comparison metrics. The confusion matrix is presented in
Table 3.
Precision is positive predictive value:
Recall is true positive rate:
F1-score is the harmonic mean of precision and sensitivity:
4.2. Reconstruction Ability Index
It should be noted that the classification model does not belong to the main work of this study. Different models have different effects. Therefore, in order to reduce the impact of the classifier on the reconstruction accuracy, we take the classification results of the original network traffic as a baseline and calculate the ratio of the classification results of the reconstructed data with the original data. This ratio is called “Reconstruction Ability Index” (RAI), which forms an evaluation index to represent the reconstruction ability, as shown in Formula (
4):
, , and represent the -score, , and of classification on the reconstructed data, respectively; , , and represent the -score, , and of classification on the original data, respectively; i represents the number of network traffic categories, and n represents the total number of traffic categories; is the evaluation index of reconstruction ability.
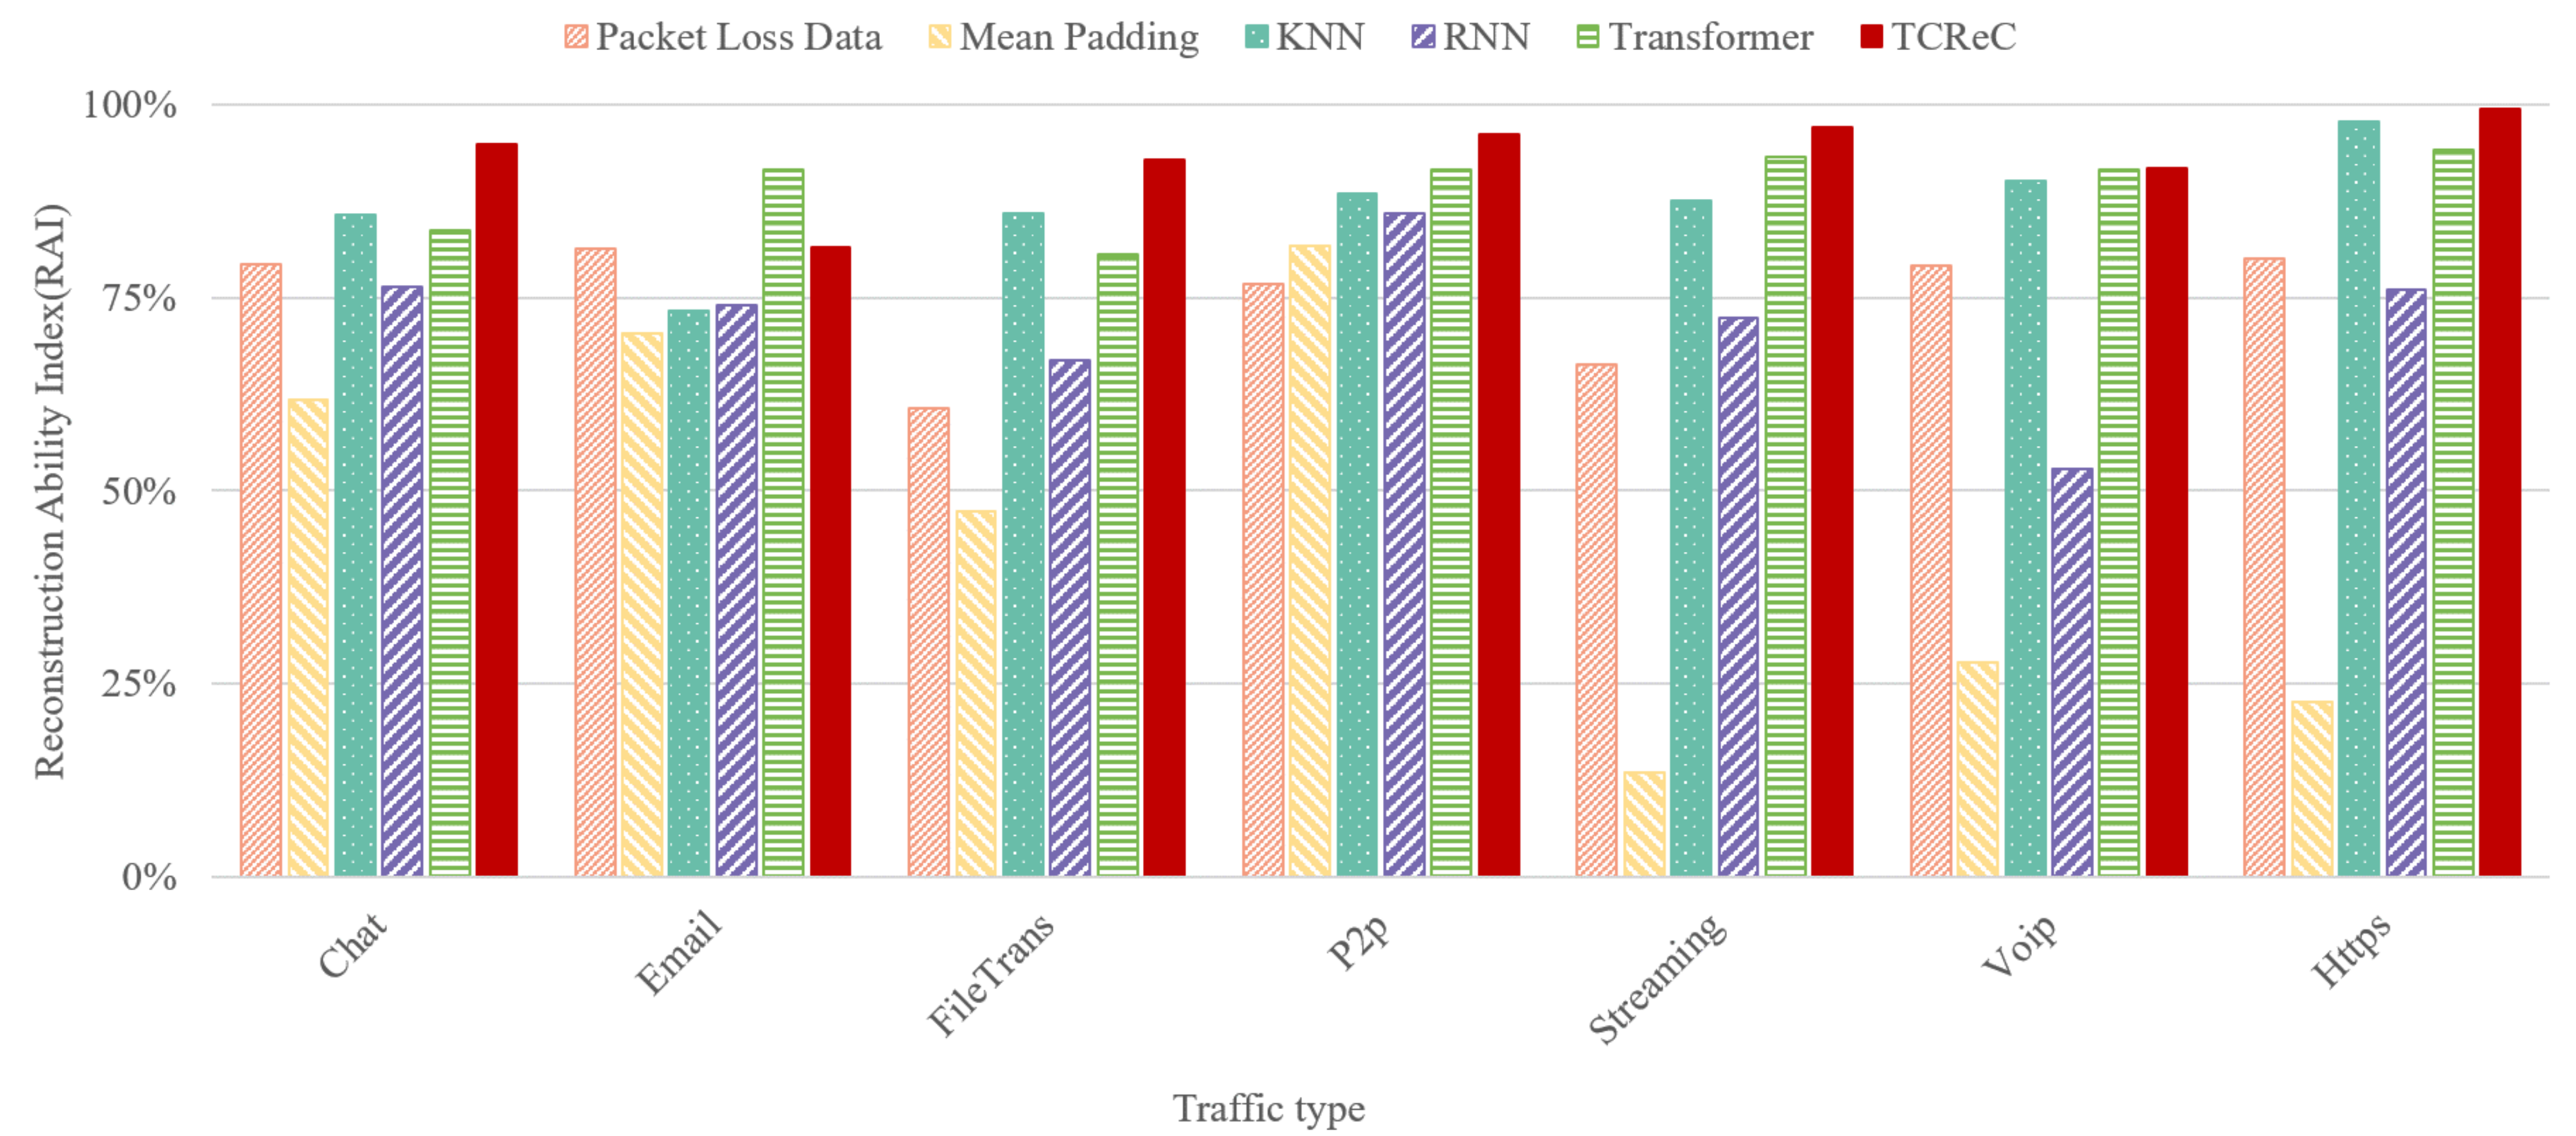
4.3. TCReC’s Reconstruction Ability to Common Network Traffic
We implement our novel model TCReC and compare it with existing models: mean padding algorithm, k-Nearest Neighbors (KNN), Recurrent Neural Network (RNN), and Transformer. The raw data of ISCX-VPN-2016 dataset are used to simulate the complete network flows and the flows with lost packets. In order to verify the reconstruction ability of different models for Internet application communication data, we adopt a relatively serious packet loss ratio of 70% using CNN as the classifier, and RAI is used as the metric. The experimental results are shown in
Figure 7.
The results show that TCReC also has a strong ability to reconstruct the network data flow characteristics of common Internet applications, and this ability is better than that of other models. However, we found that the reconstruction ability of TCReC is weaker than that of Transformer in this experiment. Considering that the classifier is CNN in this experiment, we did another comparative experiment. When using LSTM as the classifier, the RAI of TCReC is 94.02%, higher than the 91.68% of Transformer, while other models are still lower than TCReC. This phenomenon, compared with what we observed in the experiment in
Section 4.5, is due to the difference in the ability of the detection classification model to recognize features, not the lack of reconstruction ability of TCReC.
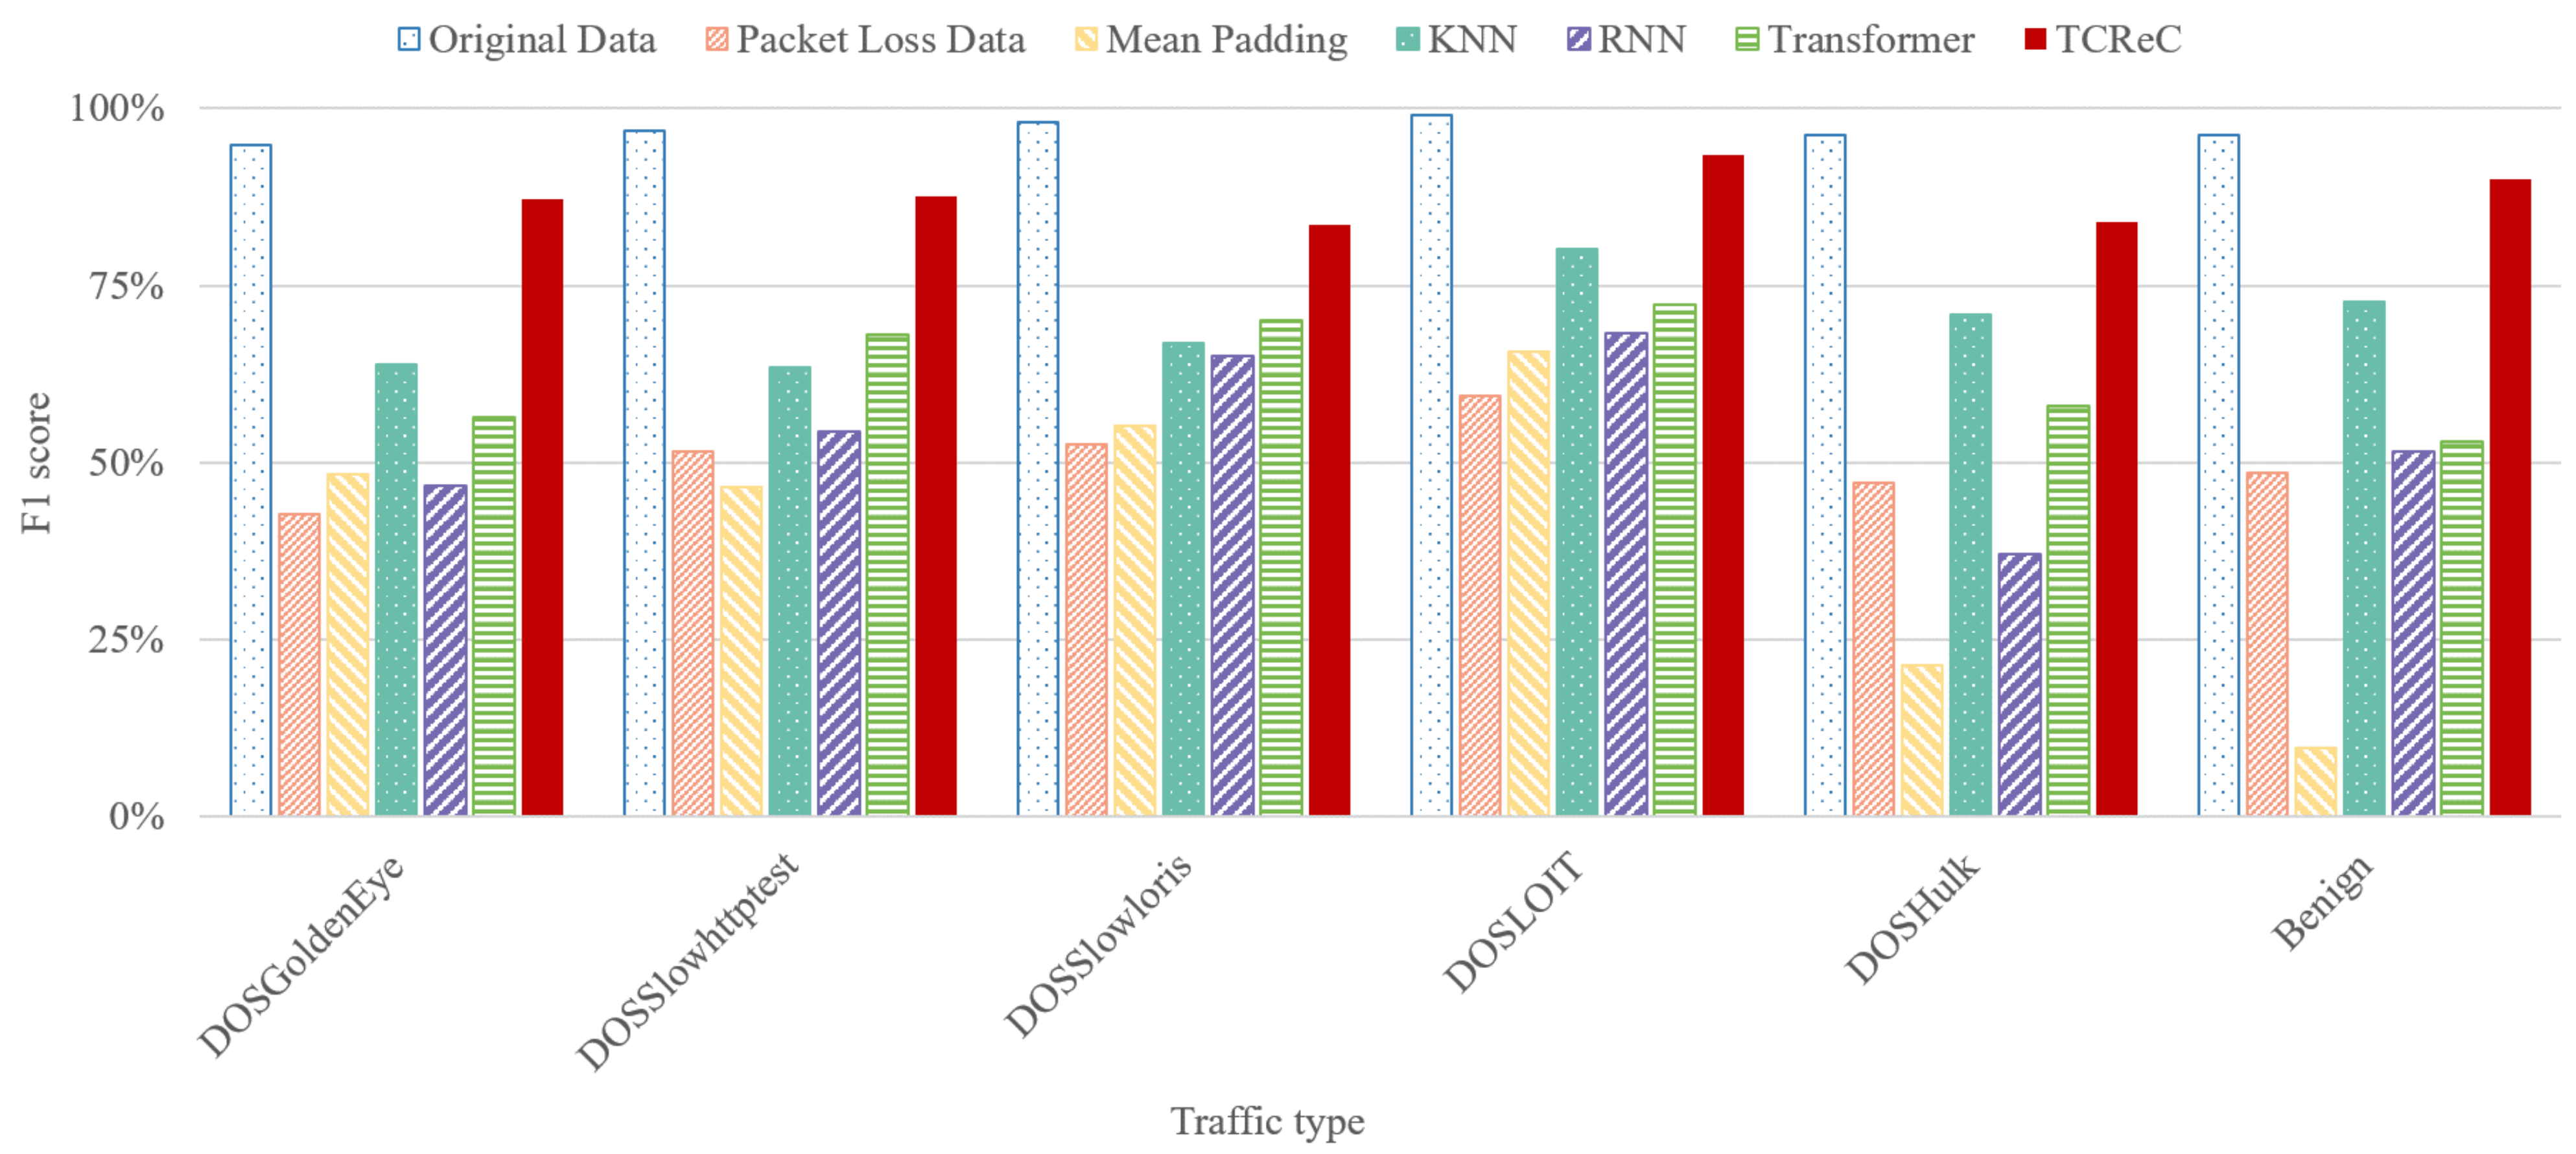
4.4. Reconstruction Ability to Malicious Network Traffic
We implement our novel model TCReC and compare it with existing models: mean padding algorithm, k-Nearest Neighbors (KNN), Recurrent Neural Network (RNN), and Transformer, adopting CNN as a classifier for analyzing attack traffic. The raw data of CIC-IDS-2017 dataset are used to simulate the complete network flows and the flows with lost packets. In order to show the reconstruction effect of the models, we adopt a relatively serious packet loss ratio of 70%. The reconstruction effect of these models at other packet loss rates will be shown in
Section 4.6.
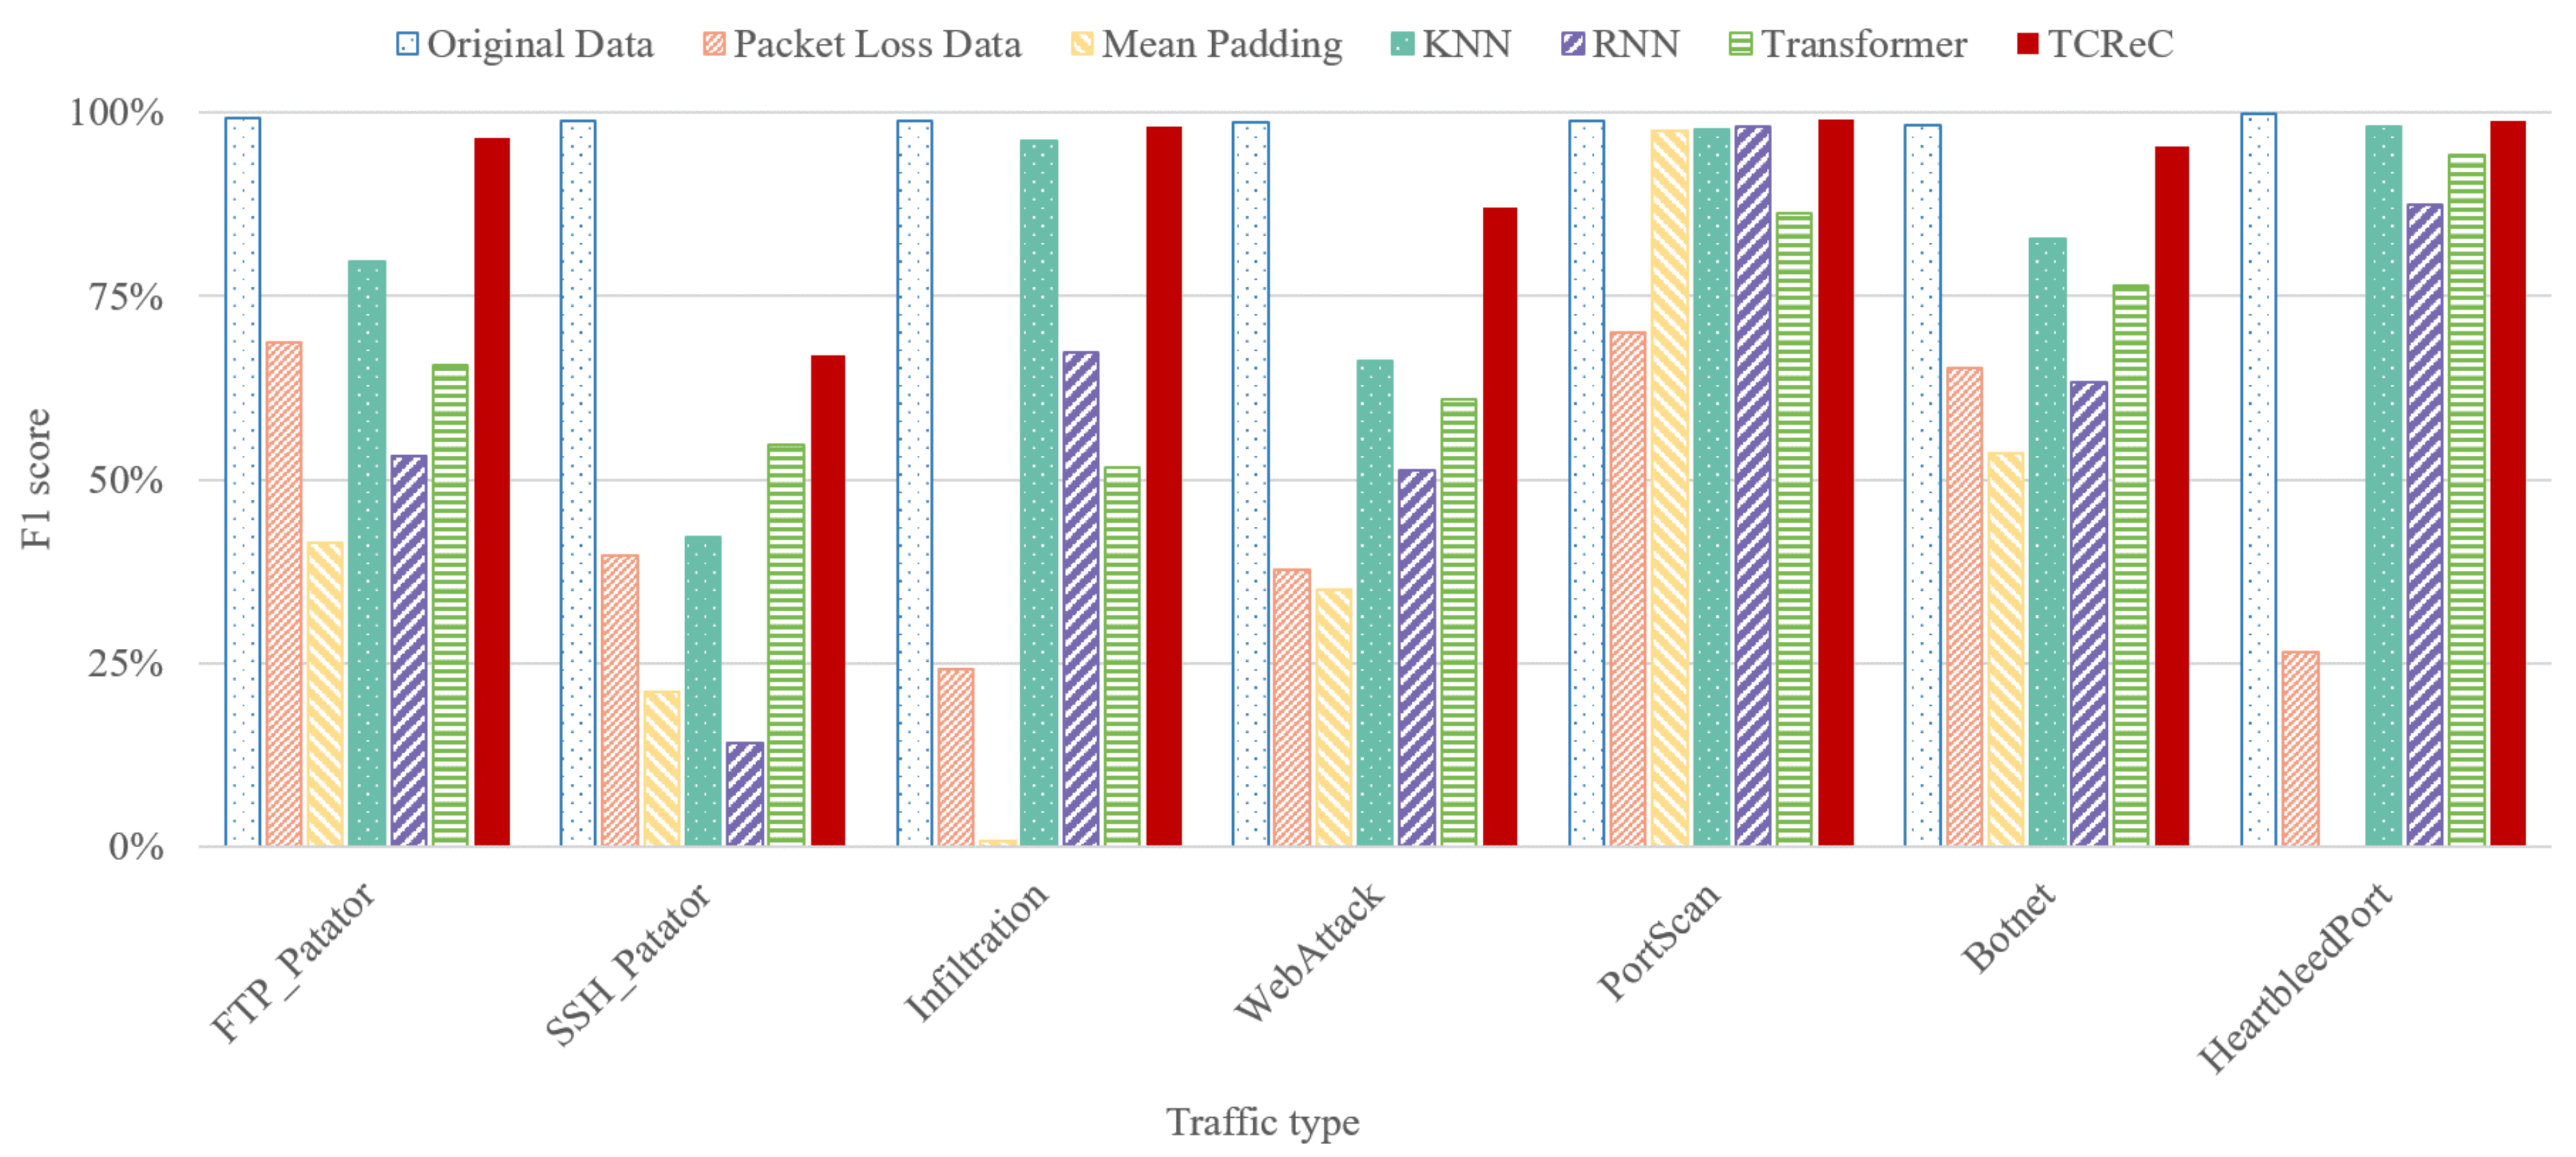
Figure 8 and
Figure 9 show the results at the packet loss ratio of 70%. The groups of columns represent the classification accuracy (F1-score) of each type of traffic.
According to the results, TCReC shows better reconstruction ability than the other models for all traffic types. This advantage is reflected in two aspects. On the one hand, the reconstruction ability of TCReC shows strong stability, and it can obtain good results in reconstructing characteristics of all types of data flows. On the other hand, in terms of the identification of some specific attacks, TCReC is able to help the detection model to obtain results very close to the original traffic in the case of 70% packet loss, such as FTP_Patator, Infiltration, PortScan, and HeartbleedPort in
Figure 9.
We also conducted an ablation study comparing Transformer and TCReC. From the experimental results, it is evident that although TCReC and Transformer share similarities in terms of model structure and parameters, TCReC exhibits significantly stronger overall reconstruction ability. This observation suggests that the approach of TCReC in handling masked and unmasked data contributes to the enhanced data reconstruction capability of TCReC.
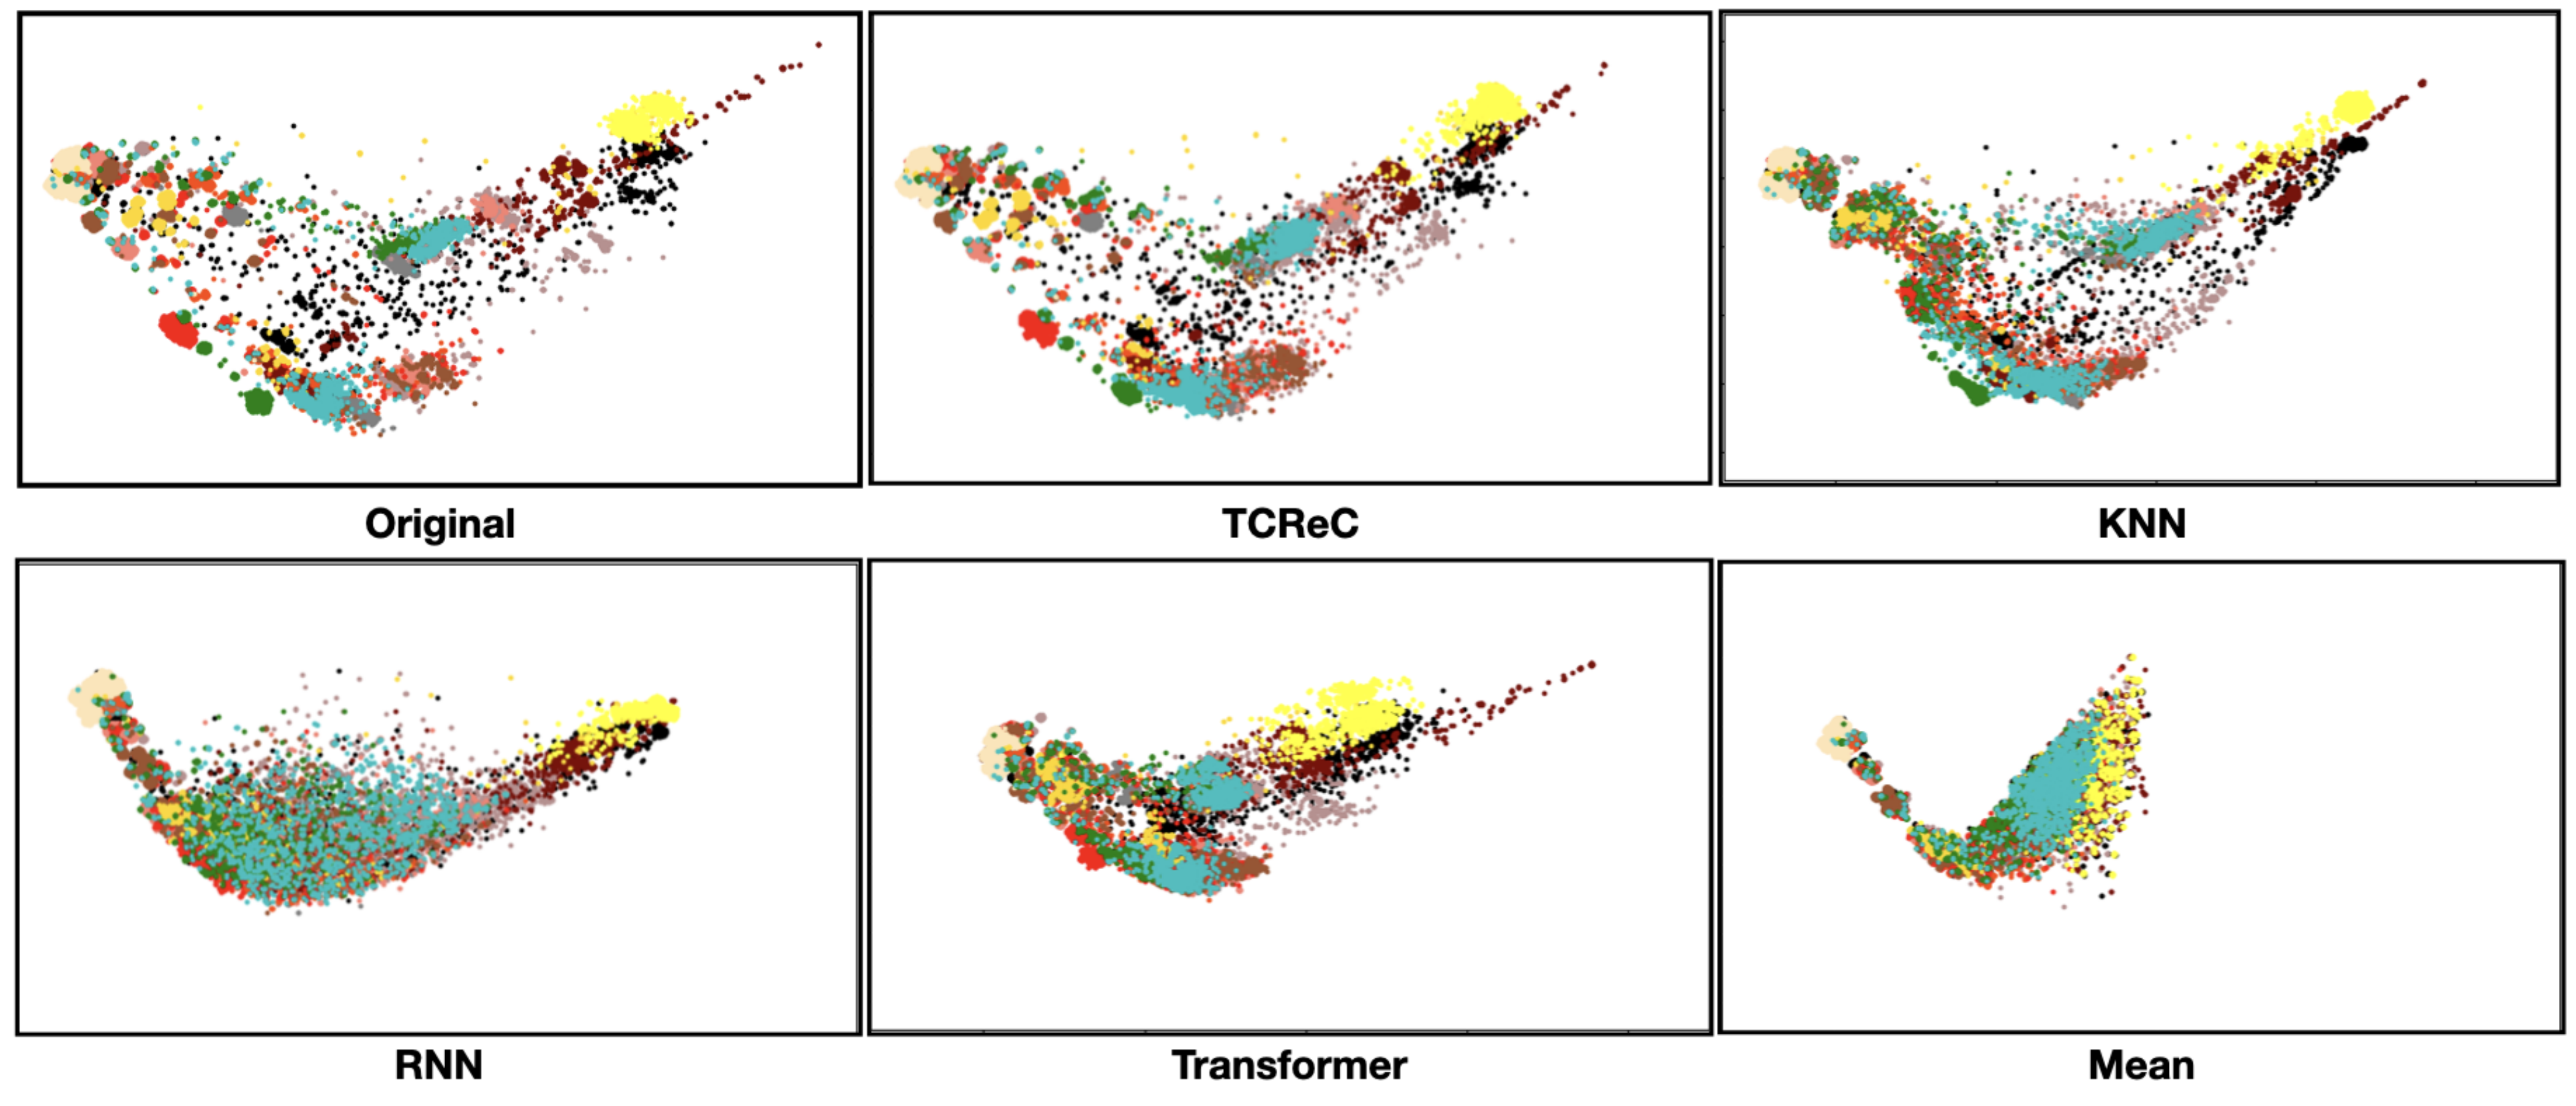
From the data distribution perspective, we compare the reconstructed data distribution of five methods with the original one in
Figure 10, in which different colors represent different traffic types and each point stands for a single traffic flow. The results depicted in
Figure 10 demonstrate that TCReC exhibits a high degree of consistency with the original data flows, both in terms of the overall distribution on the two-dimensional plane and the clustering degree within each flow type. Furthermore, the reconstructed data using the KNN method shows a close resemblance to the original distribution as a whole; however, the overlap between different data flows is high, resulting in poor discrimination among them. Conversely, the three models shown in the second row of
Figure 10 exhibit inferior performance in terms of both the overall distribution and the discrimination between different flow types.
4.5. TCReC’s Reconstruction Ability Employing A Different Classifier
It is well known that CNN has specialties in spatial feature processing, while LSTM has advantages in temporal feature processing. In this experiment, we employ TCReC with different classifiers, CNN and LSTM, to compare whether there is a difference in the reconstruction ability of TCReC in spatial features and temporal features.
In order to avoid the bias of results caused by differences in input data, we conduct three sets of comparative experiments:
- (1)
CNN or LSTM is used as the classifier to classify and identify a set of raw data randomly selected from the CIC-IDS-2017 dataset, and the result is recorded as “Original Data”.
- (2)
Using the same dataset, randomly delete 70% data in bytes to simulate the scenario of packet loss, and then use CNN or LSTM to classify and identify different data flows, the result is recorded as “Packet Loss”.
- (3)
Finally, TCReC is used to reconstruct the features of the simulated packet loss data, and then input into CNN or LSTM for classification and recognition, and the result is recorded as “TCReC”.
The experimental data show that TCReC has good ability in the reconstruction of spatial and temporal features. It should be noted that in a few cases, TCReC may display different performance under different detection task scenarios. The most prominent example is SSH_Patator. By comparing the data in the table, it can be found that in the case of a packet loss of 70%, TCReC cannot help the detection model based on CNN to accurately identify SSH_Patator. However, the reconstruction ability of TCReC is well reflected when LSTM is used as the classifier.
The experimental results are shown in
Table 4.
According to our analysis, the spatial characteristics of SSH_Patator traffic are fewer than the temporal characteristics. When packet loss occurs, the detection model based on spatial feature analysis will be more affected. This can also be seen in the comparison of “packet loss” in
Table 4. Therefore, the main reason for the difference in TCReC performance is the differences in the identification ability of the detection models toward the network data traffic characteristics, rather than the reconstruction ability of TCReC. In a sense, TCReC can mitigate this difference.
Based on the aforementioned experimental results, we computed the Reconstruction Ability Index (RAI) to mitigate the influence of different models on the experimental data, with the results presented in
Table 5.
As shown in
Table 5, the RAI of TCReC is significantly higher than that of the other models, and there is little difference when TCReC is combined with different classifiers. However, the experimental results also show that the ability of the classification model cannot be ignored.
4.6. TCReC’s Reconstruction Ability Under Different Packet Loss Rates
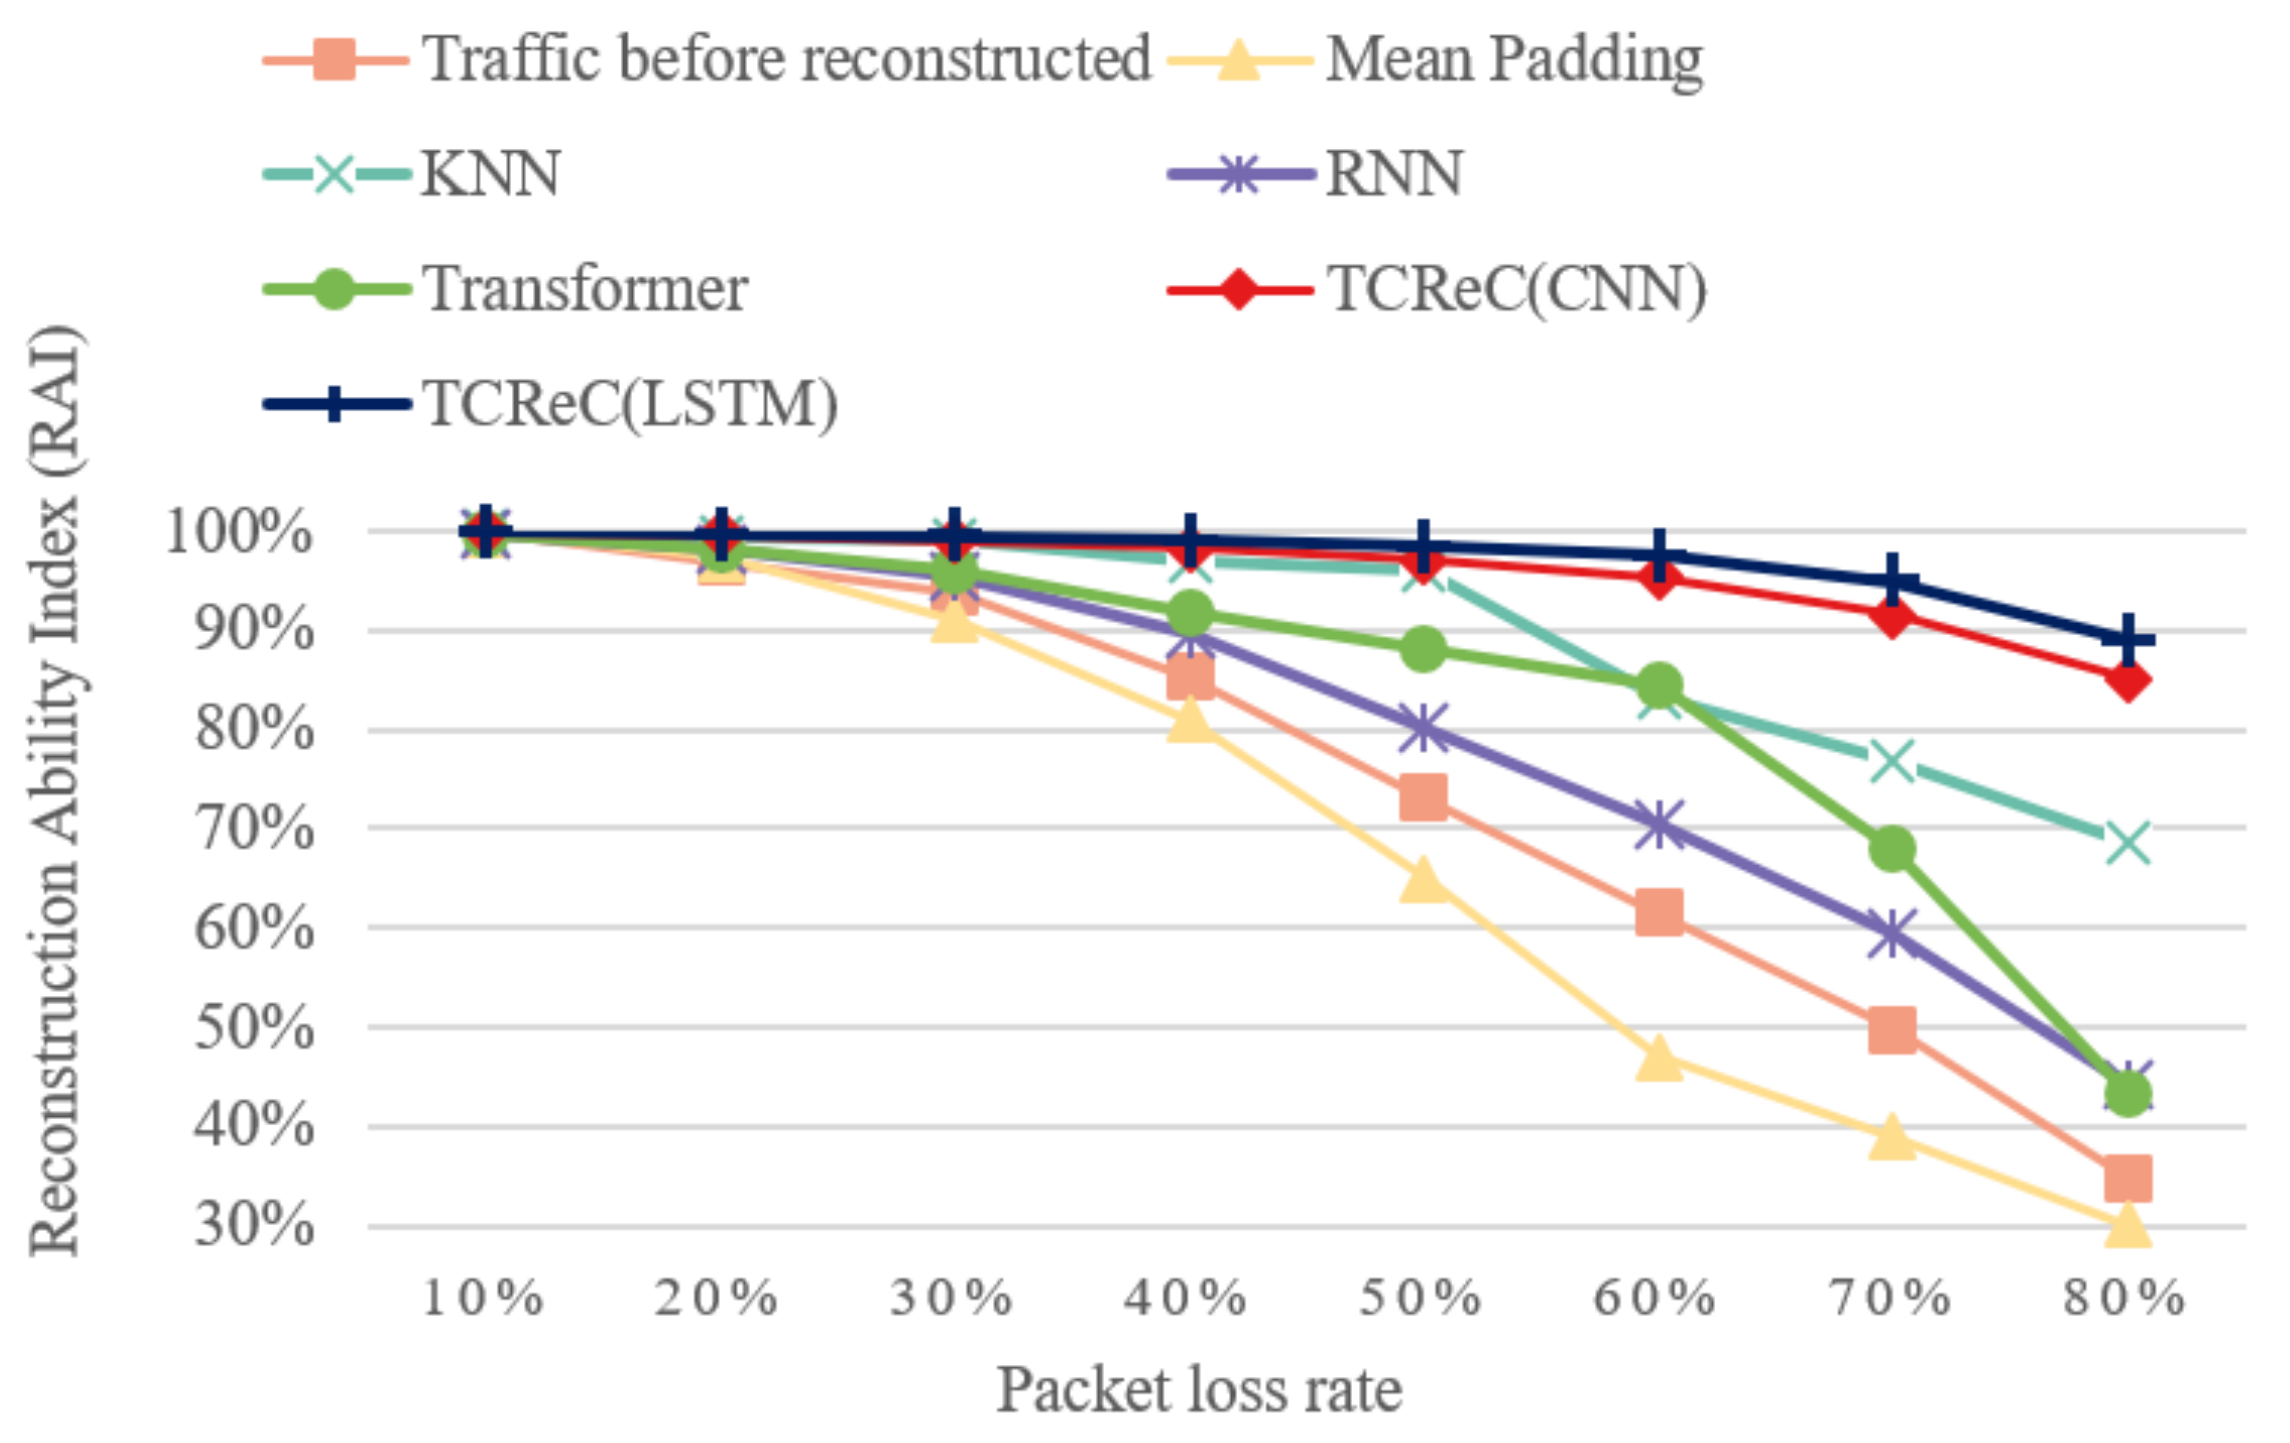
To test the reconstruction ability of the model under different packet loss rates, experiments were implemented based on the CIC-IDS-2017 dataset. The results are shown in
Figure 11. To show the effect of reconstruction, RAI is used as the metric.
The results demonstrate a consistent trend where the RAI of all the models decreases as the packet loss ratio increases. Additionally, the discrepancy between the RAI of the reconstructed data and the data without reconstruction increases with higher packet loss ratios. This indicates that the advantage of the reconstruction models becomes more pronounced as the packet loss ratio grows.
The RAI values of TCReC and KNN are close when the packet loss ratio is lower than 50%, while the RAI values of other models are much lower. When the ratio exceeds 50%, TCReC shows significantly better reconstruction ability than the other models. The RAI of TCReC (combined with LSTM) is 94.99% even when the packet loss ratio reaches 70%, while the RAI of traffic before reconstruction is only 49.77%.
It is noteworthy that there may be variations in the RAI values of TCReC when using CNN or LSTM as the detection classifier. However, it is remarkable that the experimental results consistently exhibit similar changes in the data curves under different packet loss rates. This consistency suggests that TCReC possesses a high level of robustness in its reconstruction ability, and any differences observed in the experimental results can be attributed to the performance of the detection classifier rather than the reconstruction model itself.
In summary, TCReC exhibits a strong reconstruction effect across various packet loss ratios.
4.7. Summary and Analysis
The experimental results presented in this section demonstrate the impressive capability of TCReC in reconstructing network traffic characteristics, surpassing traditional data completion methods and other machine learning and deep learning-based approaches. TCReC exhibits robustness in supporting various detection tasks in the presence of packet loss. Notably, the reconstruction ability of TCReC remains stable across different detection tasks, although its effectiveness may be influenced by the performance of the detection classifier. In our experiments, we utilized CNN and LSTM as the underlying detection classifiers, achieving favorable outcomes. This provides assurance that TCReC can deliver high-quality input data in scenarios with packet loss when integrated with other advanced detection models.
5. Conclusions and Future Work
This paper investigates the significant impact of packet loss on the performance of deep learning-based network traffic analysis tasks, particularly in edge computing scenarios where wireless channel interference and limited bandwidth exacerbate data transmission challenges. Inspired by research on data imputation methods, we propose TCReC as an innovative approach to the reconstruction of the characteristics of lost packets in edge computing scenarios. Experimental evaluations on the CIC-IDS-2017 dataset demonstrate TCReC’s robustness: even with 70% packet loss, downstream classifiers (CNN/LSTM) trained on TCReC-reconstructed data retain F1-scores within 10% of the original performance, outperforming traditional methods like mean imputation (35–60% decline) and baseline models such as Transformer (12–25% decline). On the ISCX-VPN-2016 dataset, TCReC achieves a Reconstruction Ability Index (RAI) of 94.02% with LSTM classifiers. Comparative analyses using t-SNE visualization further confirm that TCReC preserves the distribution and clustering of traffic types with high fidelity. Additionally, we establish an evaluation index called Reconstruction Ability Index (RAI) to describe the reconstruction ability by connecting the reconstruction model with downstream tasks. Through extensive experiments, we validate the robustness of TCReC and its ability to maintain high reconstruction accuracy across varying packet loss rates and datasets, underscoring its importance in edge computing environments where reliable transmission is often compromised by unstable wireless channels.
Moreover, TCReC demonstrates strong practical relevance in real-world applications. Within edge computing architectures, it can be deployed on infrastructure such as edge servers, facilitating reliable traffic analysis at the network edge—where data loss frequently arises due to constrained bandwidth and unstable wireless conditions. In the context of cybersecurity, TCReC enhances the detection of malicious activities, such as PortScan and DoS attacks, by effectively preserving the intrinsic characteristics of attack traffic and maintaining clustering patterns consistent with those observed in the original data (
Figure 10).
While TCReC has demonstrated its effectiveness in reconstructing network traffic characteristics, there still exist opportunities for further enhancement and improvement in certain areas. Firstly, we plan to evaluate TCReC on real IoT network traffic and network simulators to better understand its performance in practical deployment scenarios and its interaction with specific network protocols and hardware constraints. Secondly, we will delve into the distinct characteristics of different traffic types and enhance TCReC’s scalability to encompass a broader range of scenarios. Thirdly, we will explore incremental training techniques for TCReC to accommodate the increasing volume of online data samples over time. Lastly, optimizing the execution time of TCReC is essential to meet the demands of real-time analysis scenarios. By addressing these aspects, we aim to enhance TCReC’s performance and applicability in network traffic analysis.


