Article

Design of an Improved IoT-Based PV-Powered Soil Remote Monitoring System with Low Data Acquisition Failure Rate

1
College of Sciences, Henan Agricultural University, Zhengzhou 450002, China
2
School of Mechatronics Engineering and Automation, Shanghai University, Shanghai 200444, China
*
Author to whom correspondence should be addressed.
Future Internet 2025, 17(12), 538; https://doi.org/10.3390/fi17120538
Submission received: 6 October 2025 / Revised: 16 November 2025 / Accepted: 22 November 2025 / Published: 25 November 2025

Abstract

To enable remote and automatic monitoring of the farmland soil information, this paper has developed a soil monitoring system based on the Internet of Things (IoT), which mainly involves the development of a gateway server node, wireless sensor nodes, a remote monitoring platform, and photovoltaic (PV) modules. The Raspberry Pi 5-based gateway server periodically sends data acquisition commands to wireless sensor nodes via LoRa, receives soil data returned by sensor nodes, and stores them in a MySQL database. Using a remote monitoring platform, Internet users can monitor real-time and historical soil data stored in the database. The STM32F103C8T6-based wireless sensor node receives data acquisition commands from the gateway server, uses soil temperature and humidity sensors as well as a pH sensor to collect soil status, and then sends sensor data back to the gateway server via LoRa. The system is powered by both PV energy and batteries, which enhances the endurance capability. Experimental results show that the designed system works well in remotely monitoring soil information. Using the proposed query attempt dynamic adjustment (QADA) method, the wireless sensor node dynamically adjusts the number of query attempts, which reduces the data acquisition failure rate from 21–25% to no more than 0.33%. Using the obtained qualitative relationship that the data acquisition delay varies inversely with the LoRa transfer rate, the data acquisition delay can be reduced to less than 67 ms.

1. Introduction

Agricultural soil status monitoring serves as the core foundation for the sustainable development of modern agriculture. Precisely acquiring key parameter information, such as soil temperature, humidity, and pH value, is of great significance for understanding crop growth environments and optimizing agricultural resource management [1,2]. Therefore, developing intelligent agricultural soil monitoring systems is an important technological path for realizing smart agriculture [3], as well as an inevitable requirement for safeguarding food security and agricultural ecological environment.
With the rapid development of modern information technology, intelligent agricultural monitoring systems have been increasingly used [4]. The characteristics of the existing works, such as the contributions, are summarized in Table 1.
In addition to the respective strengths and limitations of the aforementioned literature, they also have the following common limitations. Most nodes exchange information using Wi-Fi or Bluetooth technologies, which limits the communication range. Most sensor and gateway nodes are powered by battery packs, which limits the endurance time. Data acquisition failure rate and delay are seldom studied, which can deteriorate system performance. To address the aforementioned issues, this paper designs an IoT-based PV-powered soil remote monitoring system with low data acquisition failure rate and low data acquisition delay. Main contributions are presented as follows. First, a complete hardware system with an IoT architecture has been independently developed, where the Raspberry Pi 5-based gateway server node can collect soil information from multiple STM32F103C8T6-based wireless sensor nodes via the long-range, low-power LoRa protocol. Second, a comprehensive software system has been independently designed, which enables the hardware system to automatically collect and store soil temperature, humidity, and pH value information, while providing a remote access platform for Internet users to view real-time and historical data. Third, a novel QADA method is proposed to enable wireless sensor nodes to dynamically adjust the number of query attempts, reducing the data acquisition failure rate from 21–25% to 0.33% or less. Using the obtained inverse relationship between the data acquisition delay and the LoRa transfer rate, the data acquisition delay can be reduced to less than 67 ms.

2. System Architecture

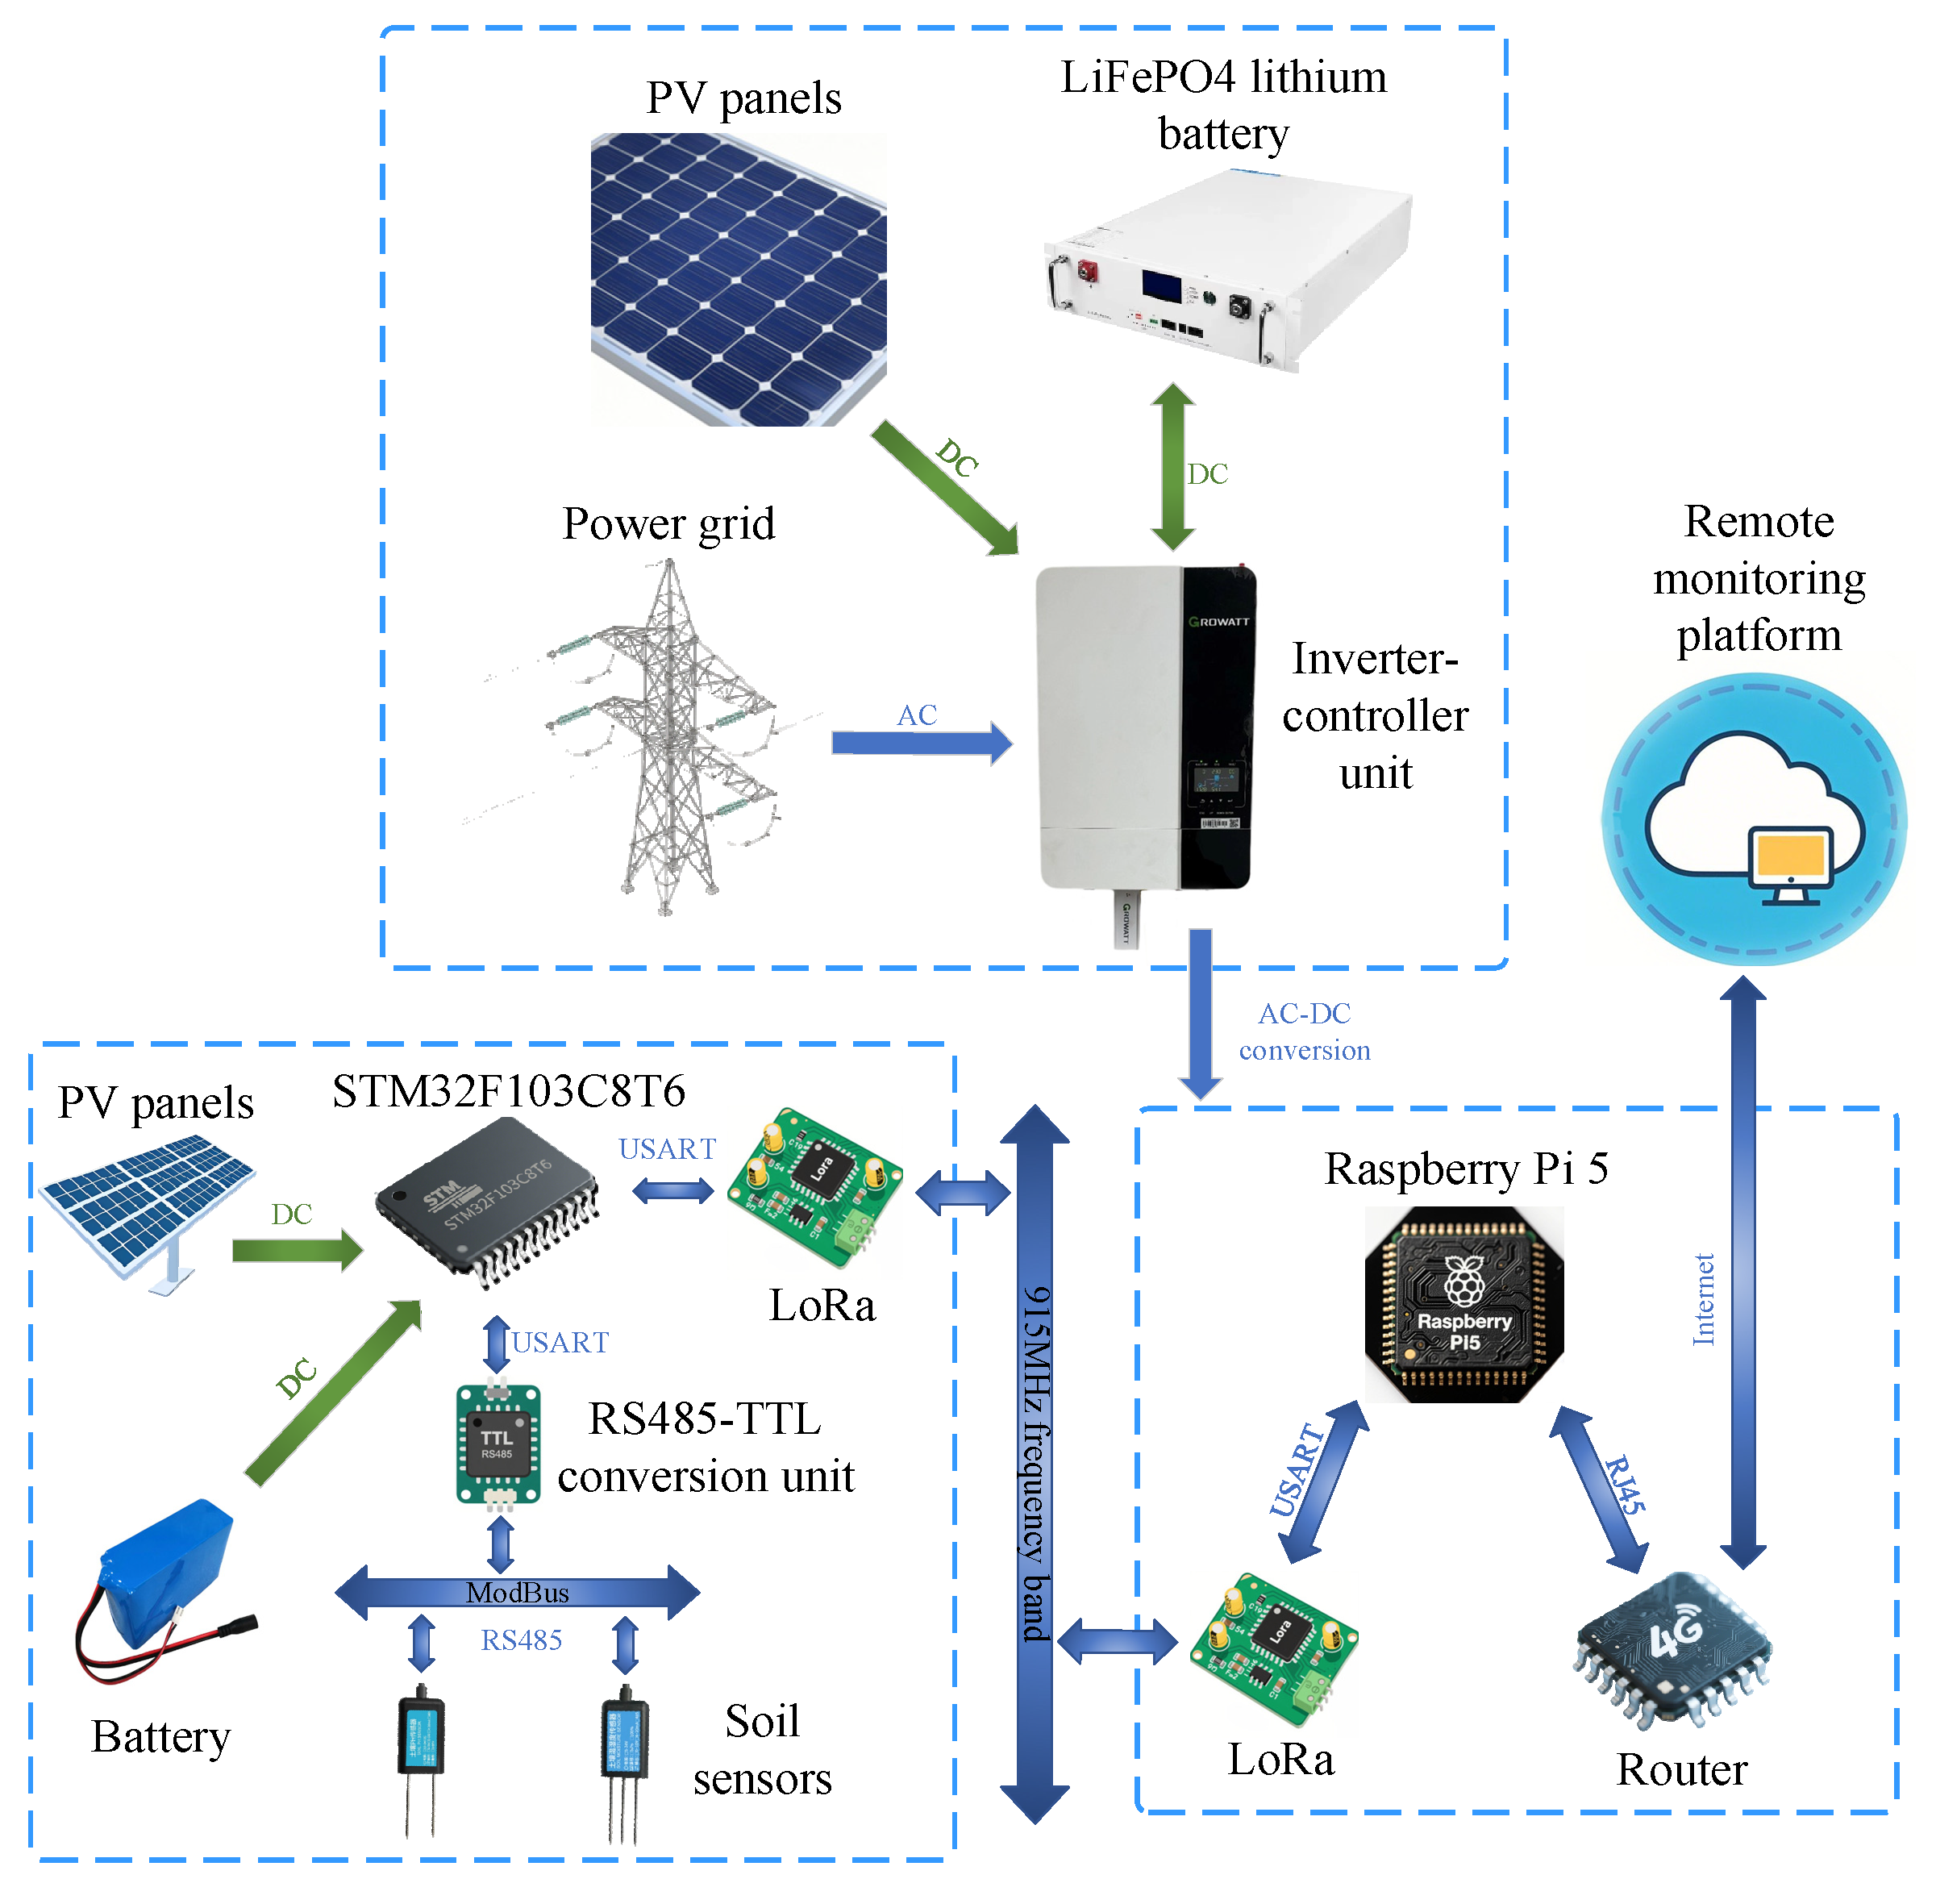
The system architecture is shown in Figure 1. In the perception layer, wireless sensor nodes detect information of soil moisture, temperature, and pH value, which are designed using the STM32F103C8T6 microcontroller unit (MCU) and soil sensors. In the network layer, the LoRa wireless communication technology is used for data transmission between the sensor node and the gateway server node. In the application layer, the gateway server node is designed based on the Raspberry Pi 5 with the Django framework, which receives sensor data and stores them in a MySQL database. The gateway server node uses a 4G/Wi-Fi unit to connect to the Internet, and employs the fast reverse proxy (FRP) network address translation (NAT) traversal service for public network access. Using the designed remote monitoring platform, remote users can conveniently monitor real-time and historical soil information via Internet terminals.
The main objective of this paper is to develop an IoT-based PV-powered soil remote monitoring system with a low data acquisition failure rate and low data acquisition delay. It mainly encompasses the development of both hardware and software systems, primarily involving the design of wireless sensor nodes, a gateway server node, PV power supply systems, and a remote monitoring platform. In addition to enabling remote monitoring of soil temperature, humidity, and pH, the system to be designed is required to maintain a data acquisition failure rate of less than 1% and a data acquisition delay of less than 100 ms.

3. System Hardware Design

The system hardware structure is shown in Figure 2, which mainly includes a wireless sensor node, a gateway server node, and a PV power module. The wireless sensor node communicates with the gateway server node via LoRa unit using the 915 MHz frequency band, while the gateway server node connects with Internet via 4G/Wi-Fi. The PV power module with converters provides energy to loads such as the gateway server node.

3.1. Wireless Sensor Node

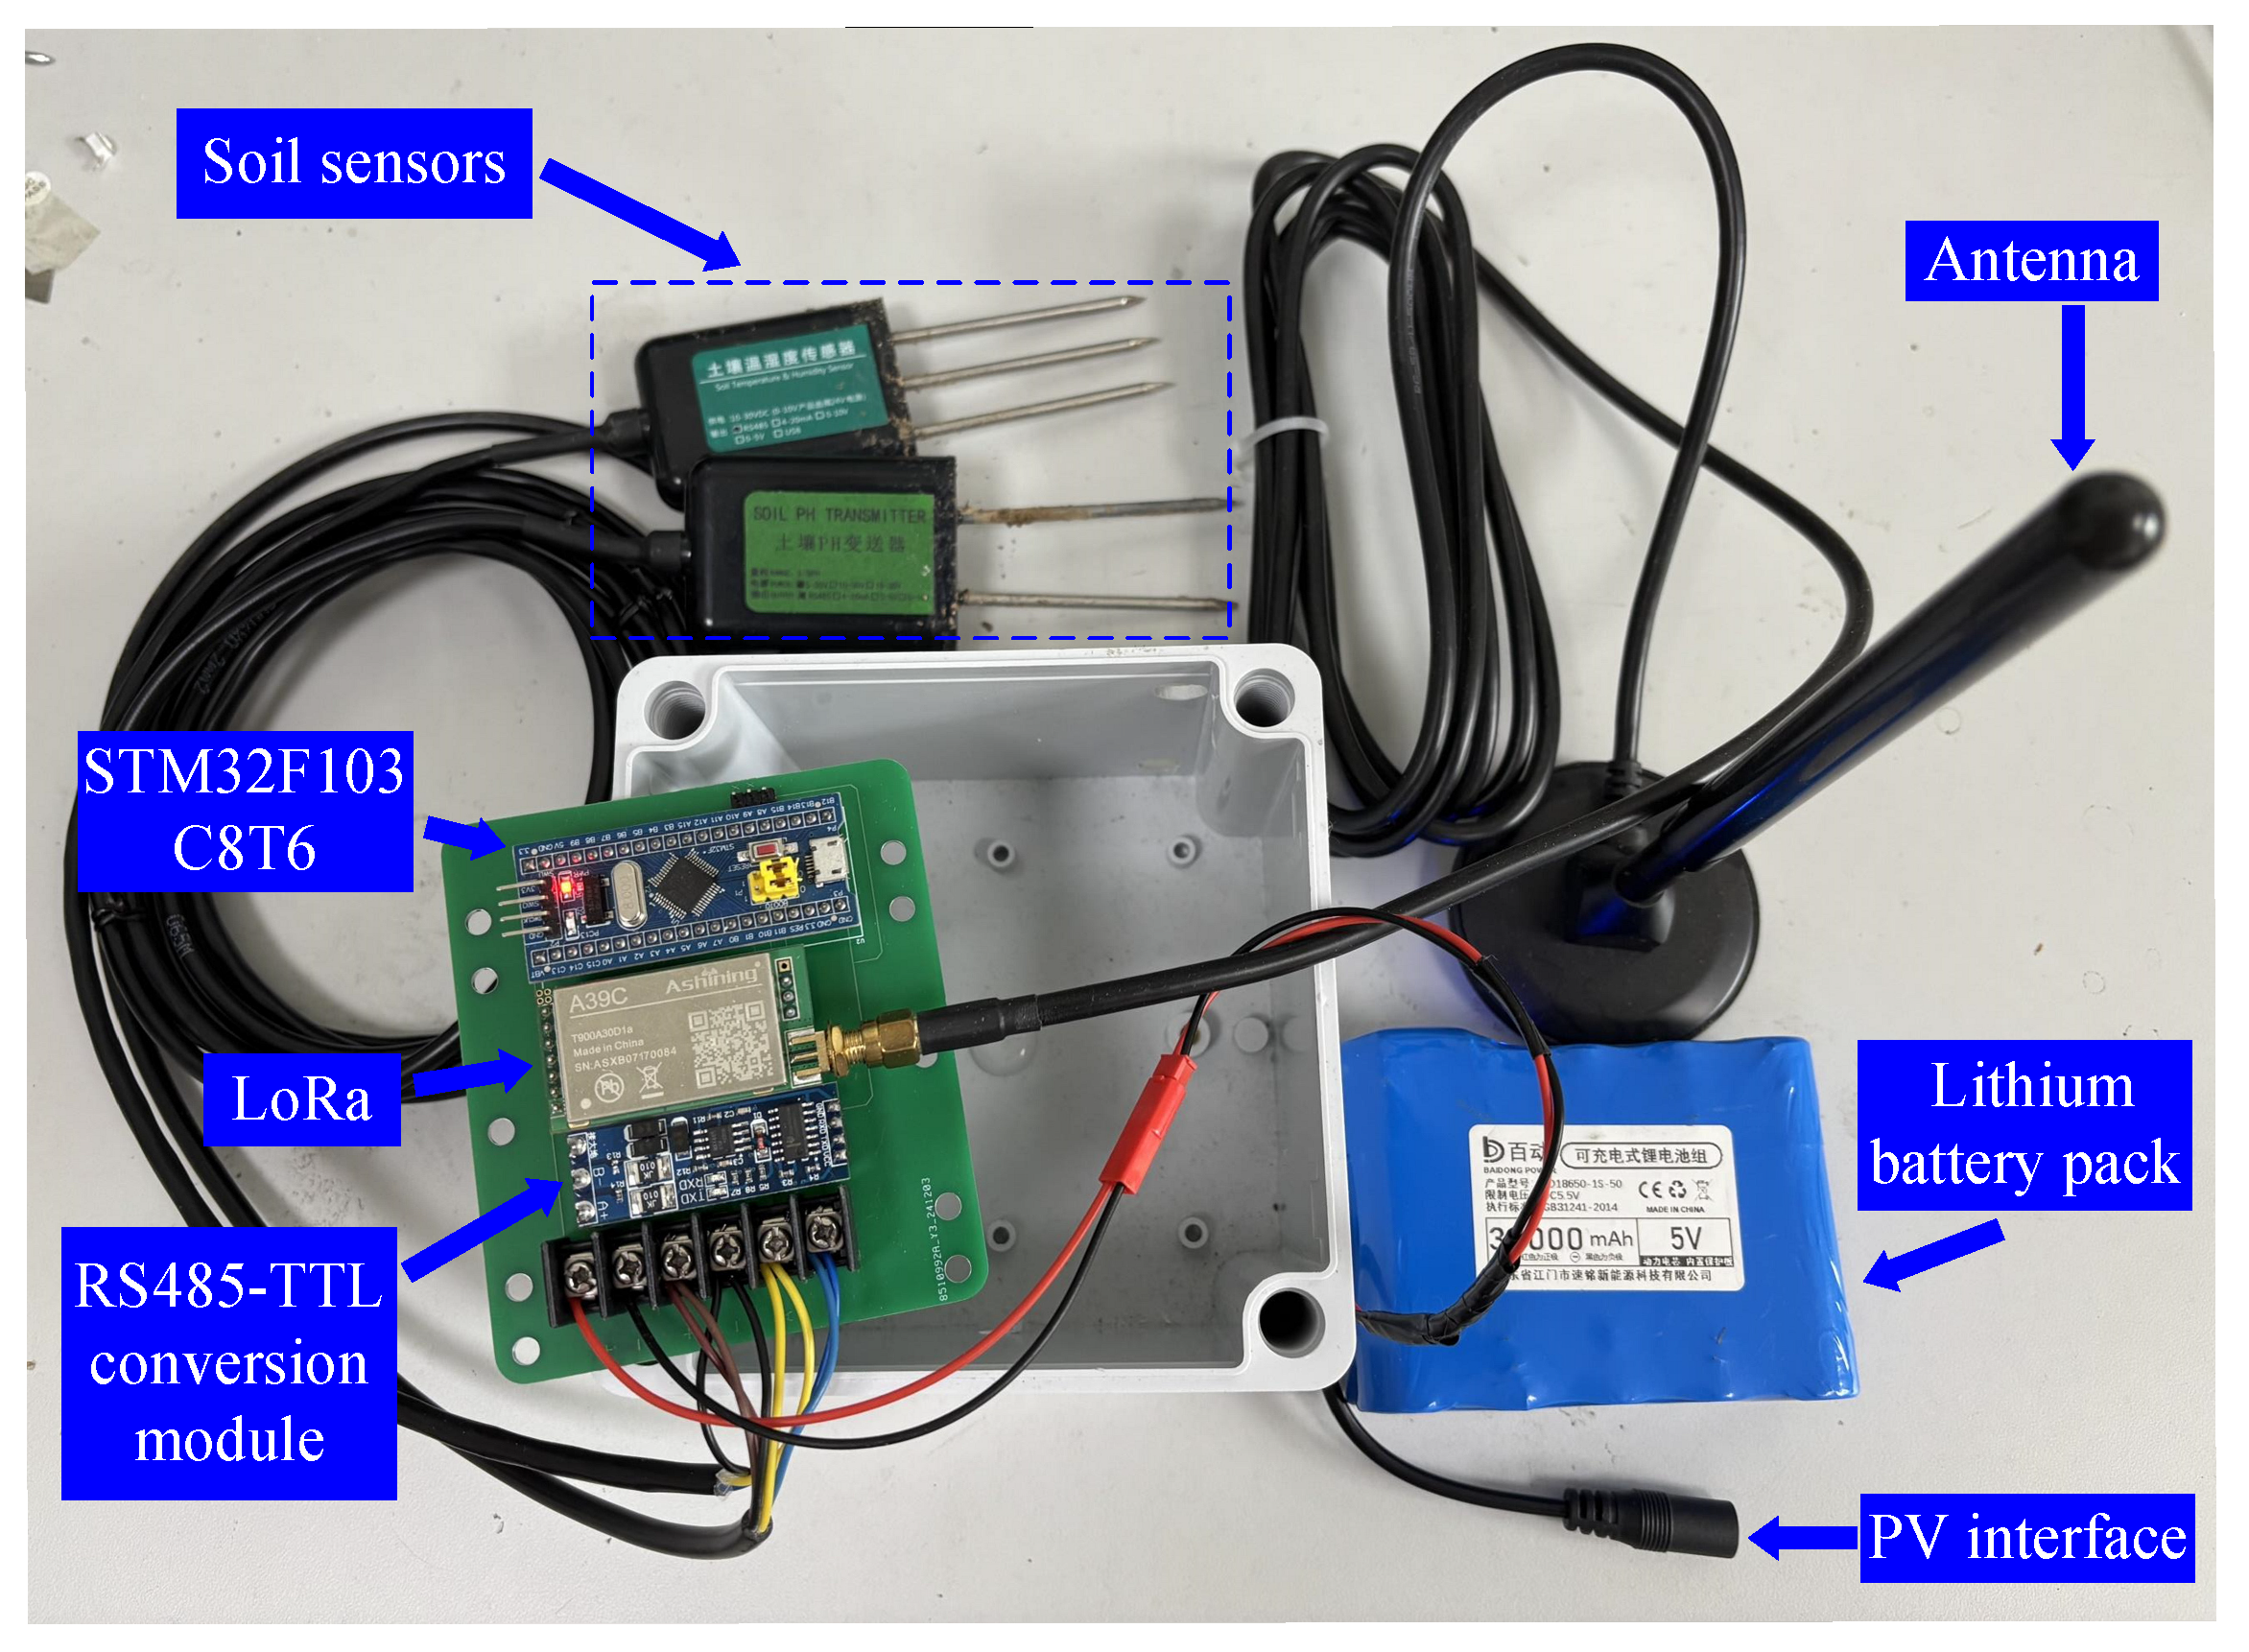
As shown in Figure 3, the wireless sensor node is designed using the LoRa communication unit with antenna, STM32F103C8T6 MCU, RS485-TTL conversion unit, soil temperature and humidity sensor, and pH sensor. To improve the node’s endurance capacity, it is powered by both of lithium battery pack and a PV power unit.
Using the RS485-TTL conversion unit, the STM32F103C8T6 MCU collects data from the soil temperature and humidity sensor SN-3000-TR-N01 and the pH sensor ZTS-3000-TR-pH. As shown in Table 2, these sensors have the advantages of wide voltage compatibility, high resolution, and high accuracy.

3.2. LoRa Communication Unit

For the wireless communication protocols, including LoRa, Zigbee, Wi-Fi, Bluetooth, and fifth generation, Table 3 provides a comparison in terms of transmission range, power consumption, data rate, and cost [27,28,29]. Clearly, LoRa has the advantages of long transmission range, low power consumption, and low cost, but it suffers from a low data rate. In the soil remote monitoring system to be designed, wireless sensor nodes need to be deployed in farmland, with requirements for long communication distance, low power consumption, and low cost. These wireless sensor nodes primarily transmit information on soil temperature, humidity, and pH value, with low demands on the data rate. LoRa is adequate to meet these requirements. Therefore, LoRa has been selected as the wireless communication protocol for this application.
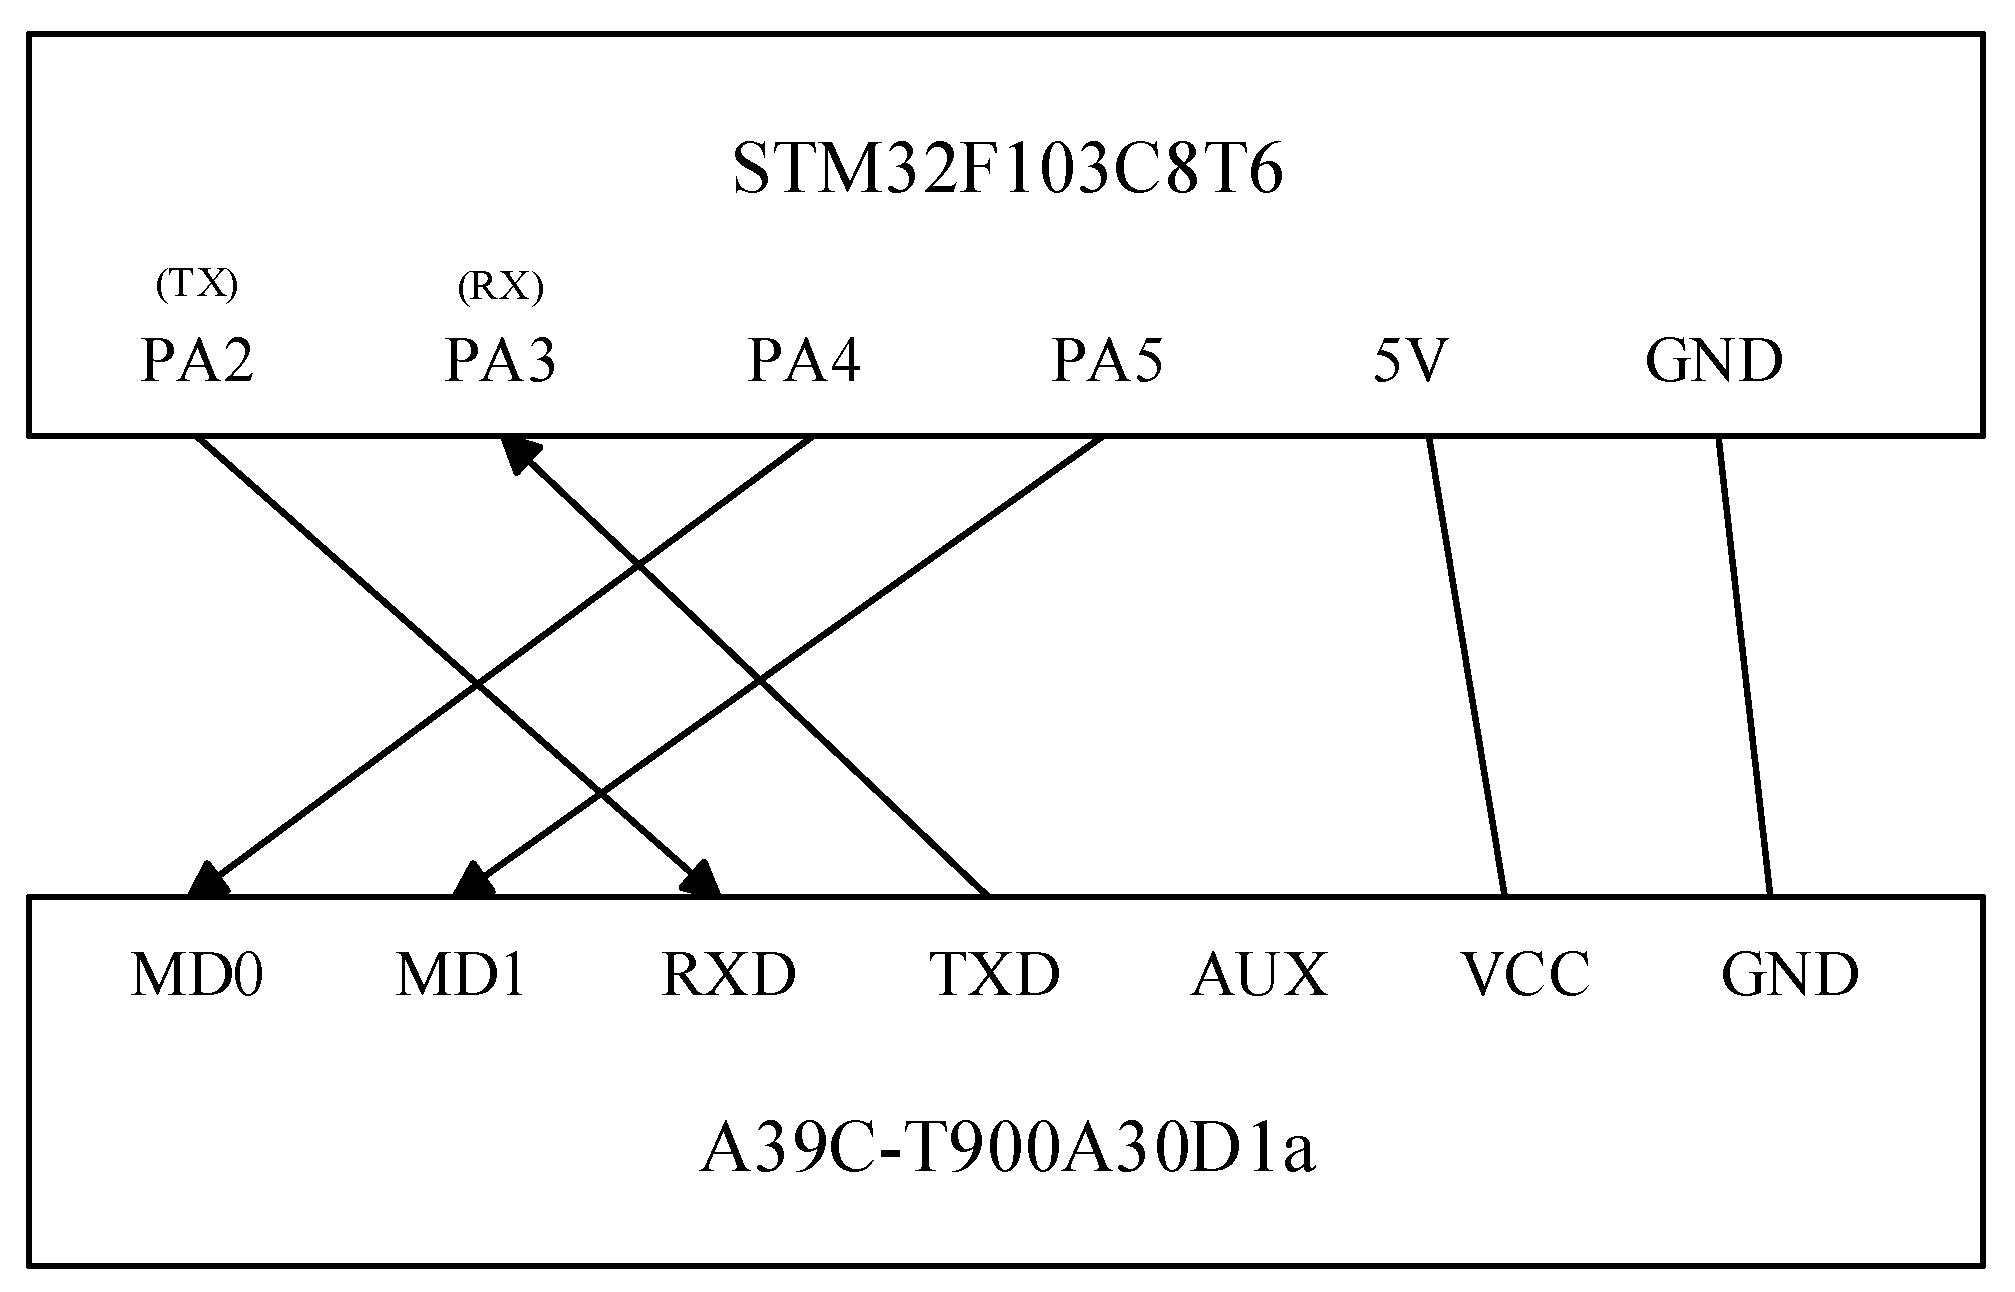
The LoRa unit A39C-T900A30D1a works in fixed-point transmission mode with a frequency band of 915 MHz and maximum transmission power of 30 dBm. The circuit connection between the LoRa unit and the STM32F103C8T6 MCU is shown in Figure 4. VCC and GND provide a 5 V DC power supply. RXD and TXD are used for serial communication with the STM32F103C8T6 MCU. The logic levels in MD1 and MD2 are used to adjust LoRa’s operating mode [30]. When transmitting data, the LoRa unit switches to running mode with an operating current of approximately 6.4 mA. During idle periods, it switches to standby mode with an operating current of approximately 2.5 μA, which helps to reduce energy consumption.

3.3. Gateway Server Node

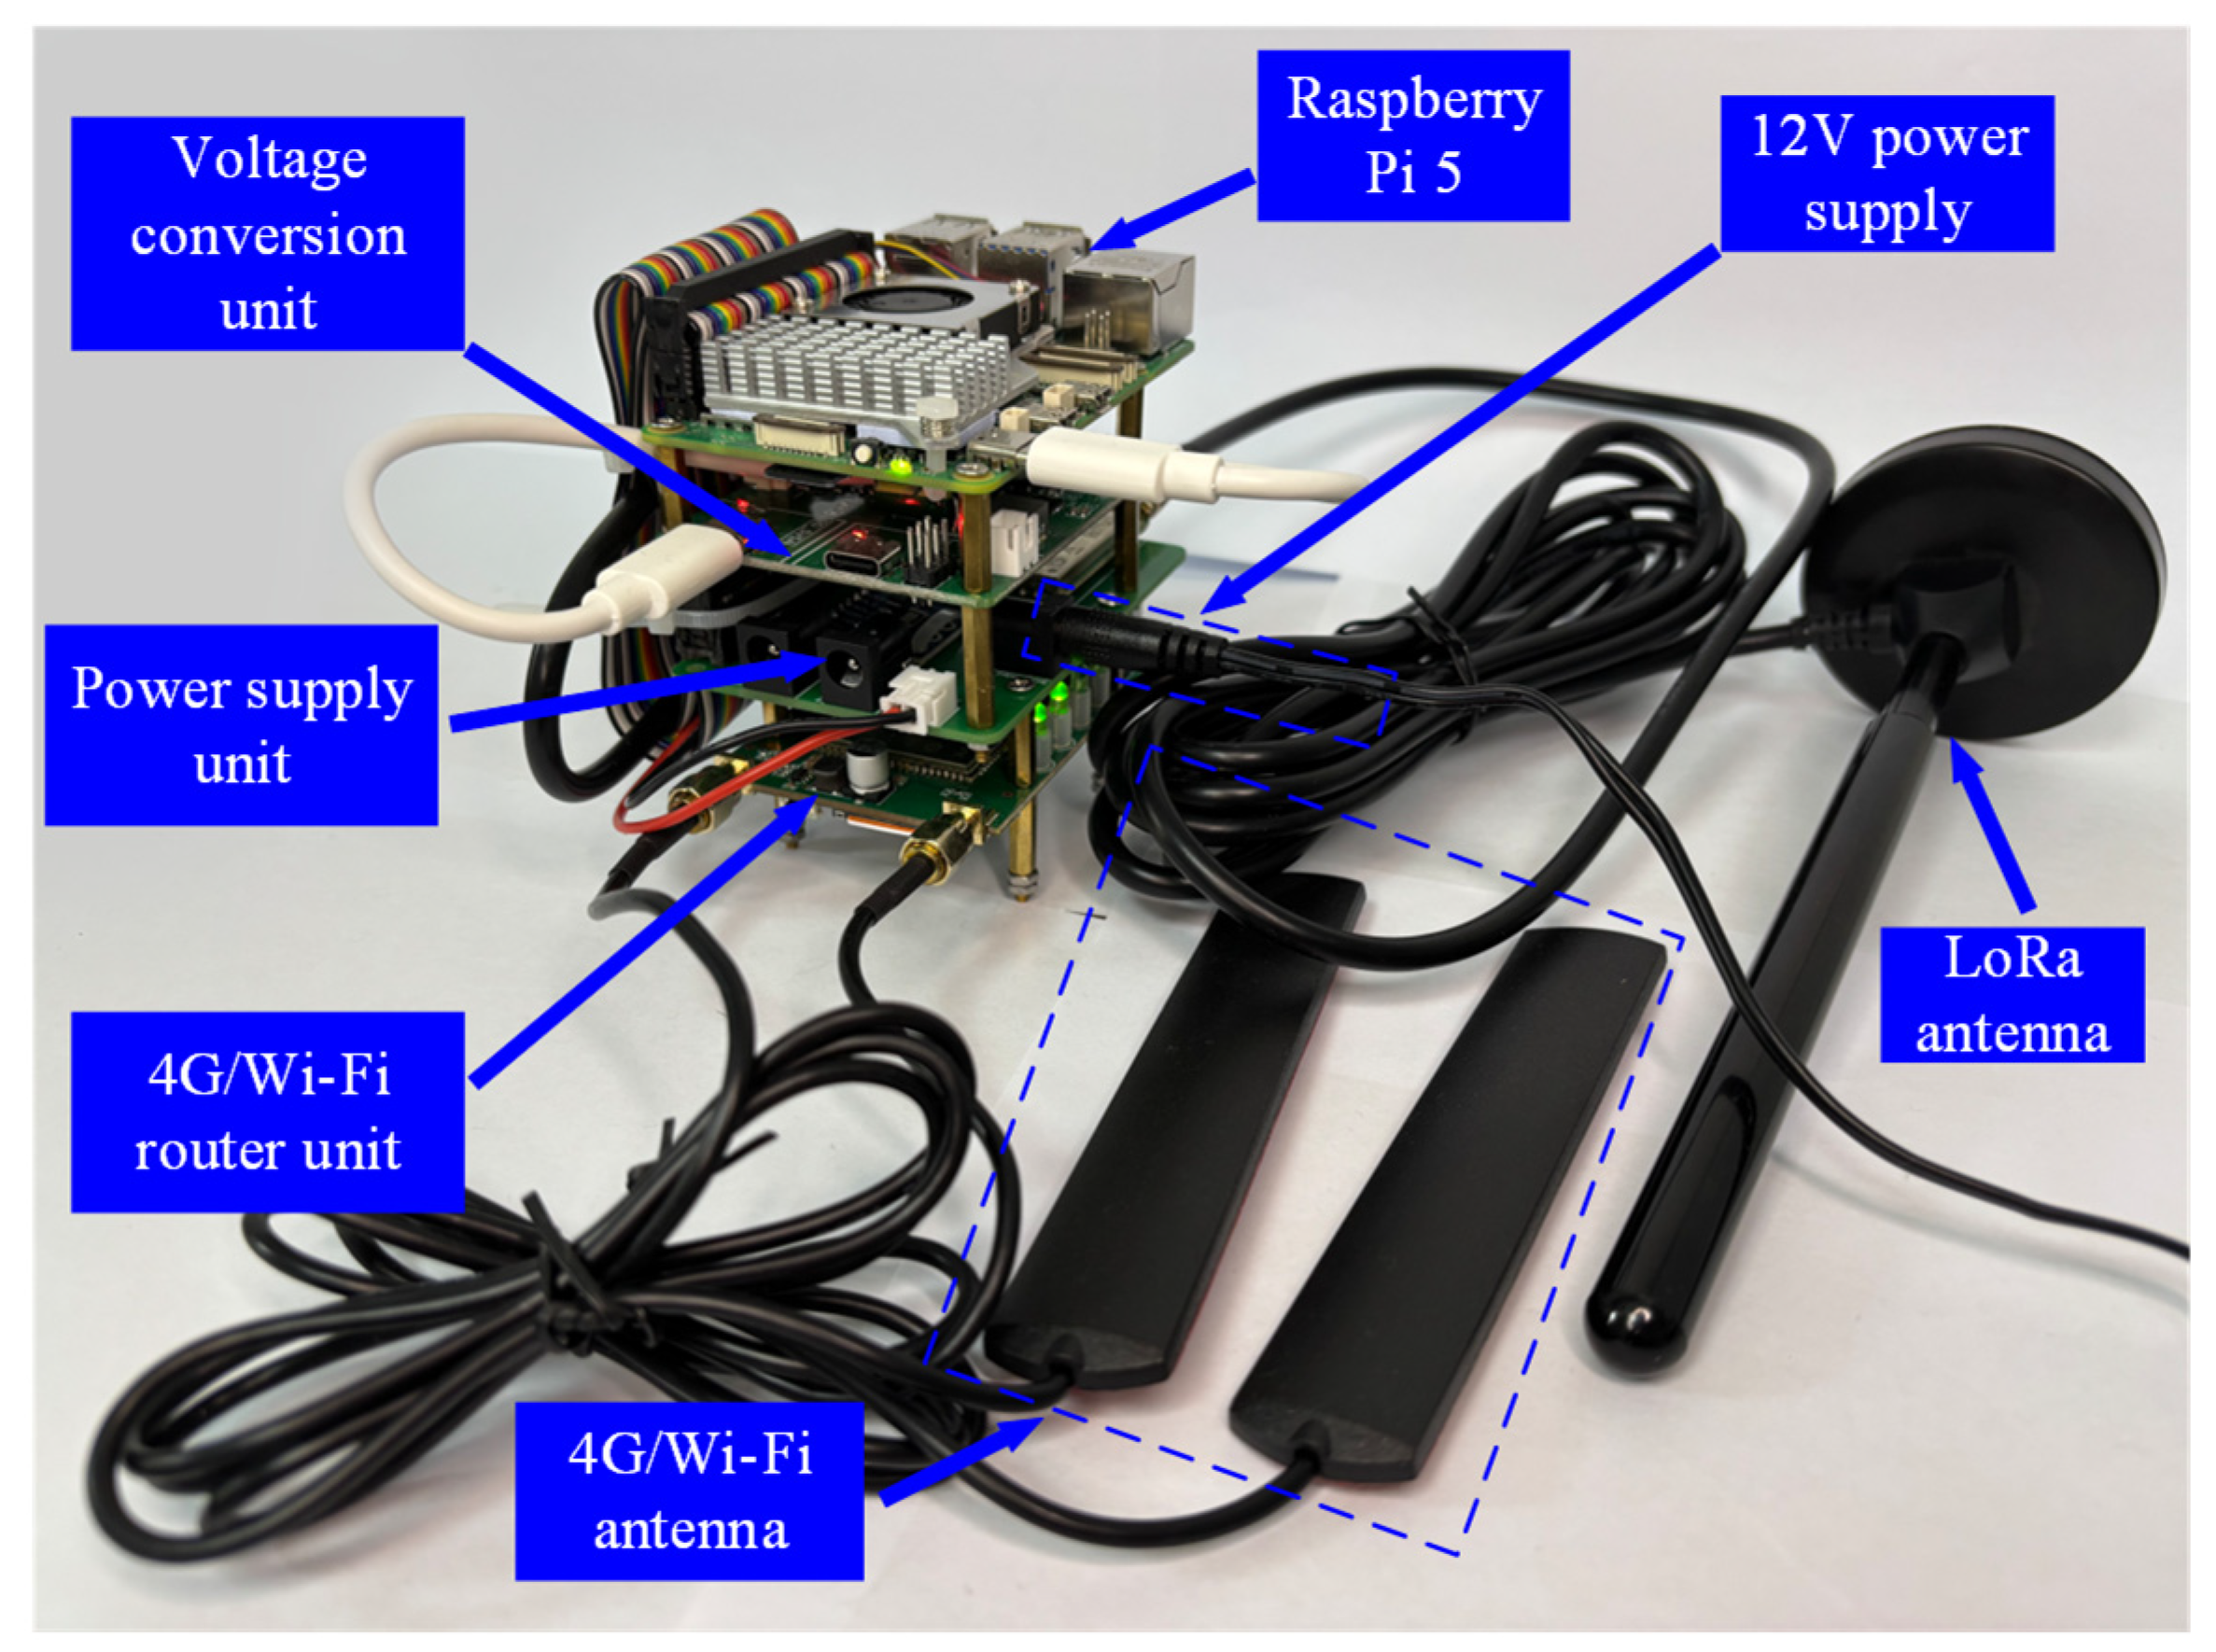
As shown in Figure 5, the gateway server node is designed using the Raspberry Pi 5, LoRa unit, 4G/Wi-Fi router unit, and power supply unit. The Raspberry Pi 5 is equipped with a 2.4 GHz quad-core 64-bit Arm Cortex-A76 processor and Debian-based operating system [31]. By deploying a Django Web server and MySQL database, the Raspberry Pi 5 can perform data collection, storage, and push functions. By configuring the FRP client to achieve NAT traversal, the gateway server can be accessible from the public Internet. The LoRa unit is connected to the Raspberry Pi 5 using a 40-pin ribbon cable with communication baud rate of 115,200. Using this LoRa unit with broadcast address 0x02, the Raspberry Pi 5 communicates wirelessly with the wireless sensor node. The 4G/Wi-Fi industrial router unit AR300 is connected to the Raspberry Pi 5 via RJ45 ethernet interface, which enables Internet users to access the server.
The power supply unit is connected to a 12 V power source, which can be PV power, a battery, or utility power. In addition to powering the LoRa and router units, the power supply unit also supplies 5 V voltage to the Raspberry Pi 5 through a power delivery (PD) protocol-based voltage conversion unit.

3.4. PV Power Module

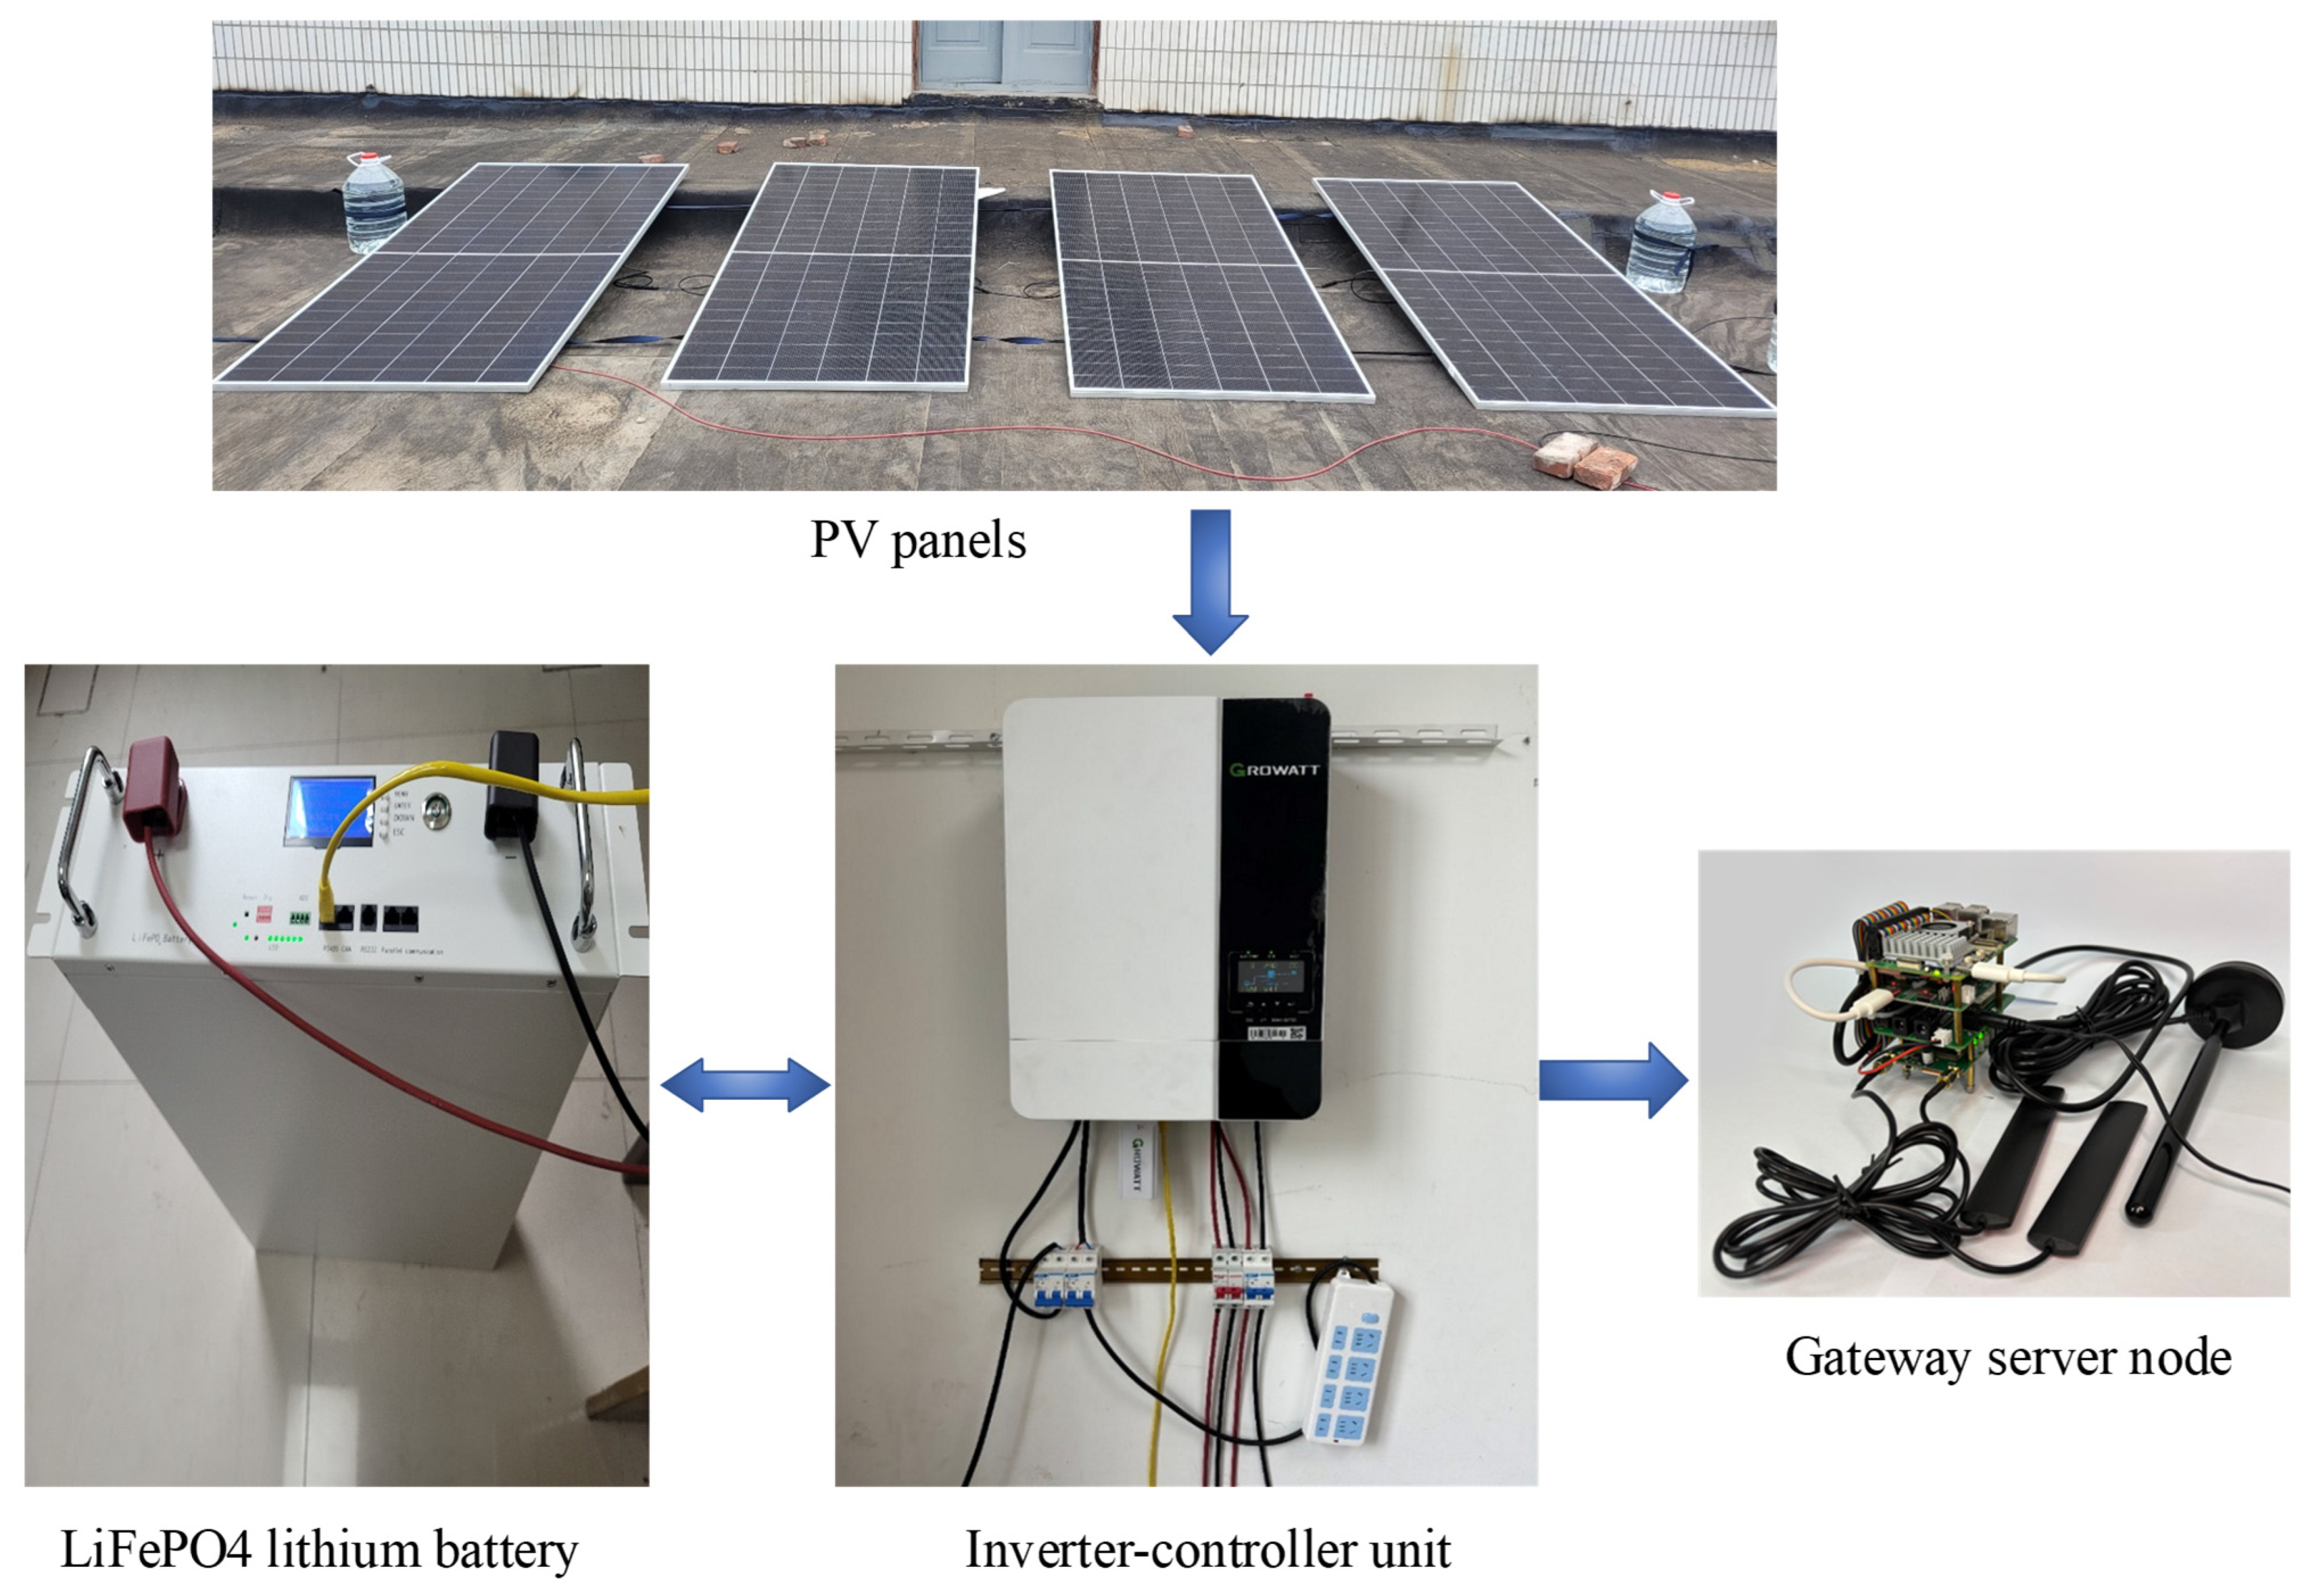
As shown in Figure 6, the PV power module is designed to provide power to the gateway node and other loads, such as the irrigation pump, which contains PV panels, a lithium battery, and an inverter-controller unit. Four LR5-72HGD-580M PV panels connect in series with a peak voltage of 164.28 V, peak current of 10.75 A, and peak power of 1766 Wp. Inverter-controller unit GROWATT-SPF 3500 ES has the Maximum Power Point Tracking function with operating voltage 120 V–430 V DC, rated power 3500 W, and maximum PV charging current 80 A. Lithium battery LiFePO4 has the parameters of capacity 100 AH, rated voltage 51.2 V, maximum charging current 50 A, and maximum discharging current 100 A.
PV panels generate electricity, supply power to the loads, and store the surplus electricity in the battery. If the output of PV panels is insufficient, the inverter-controller unit controls the battery to supply power to the loads.

4. System Software Design

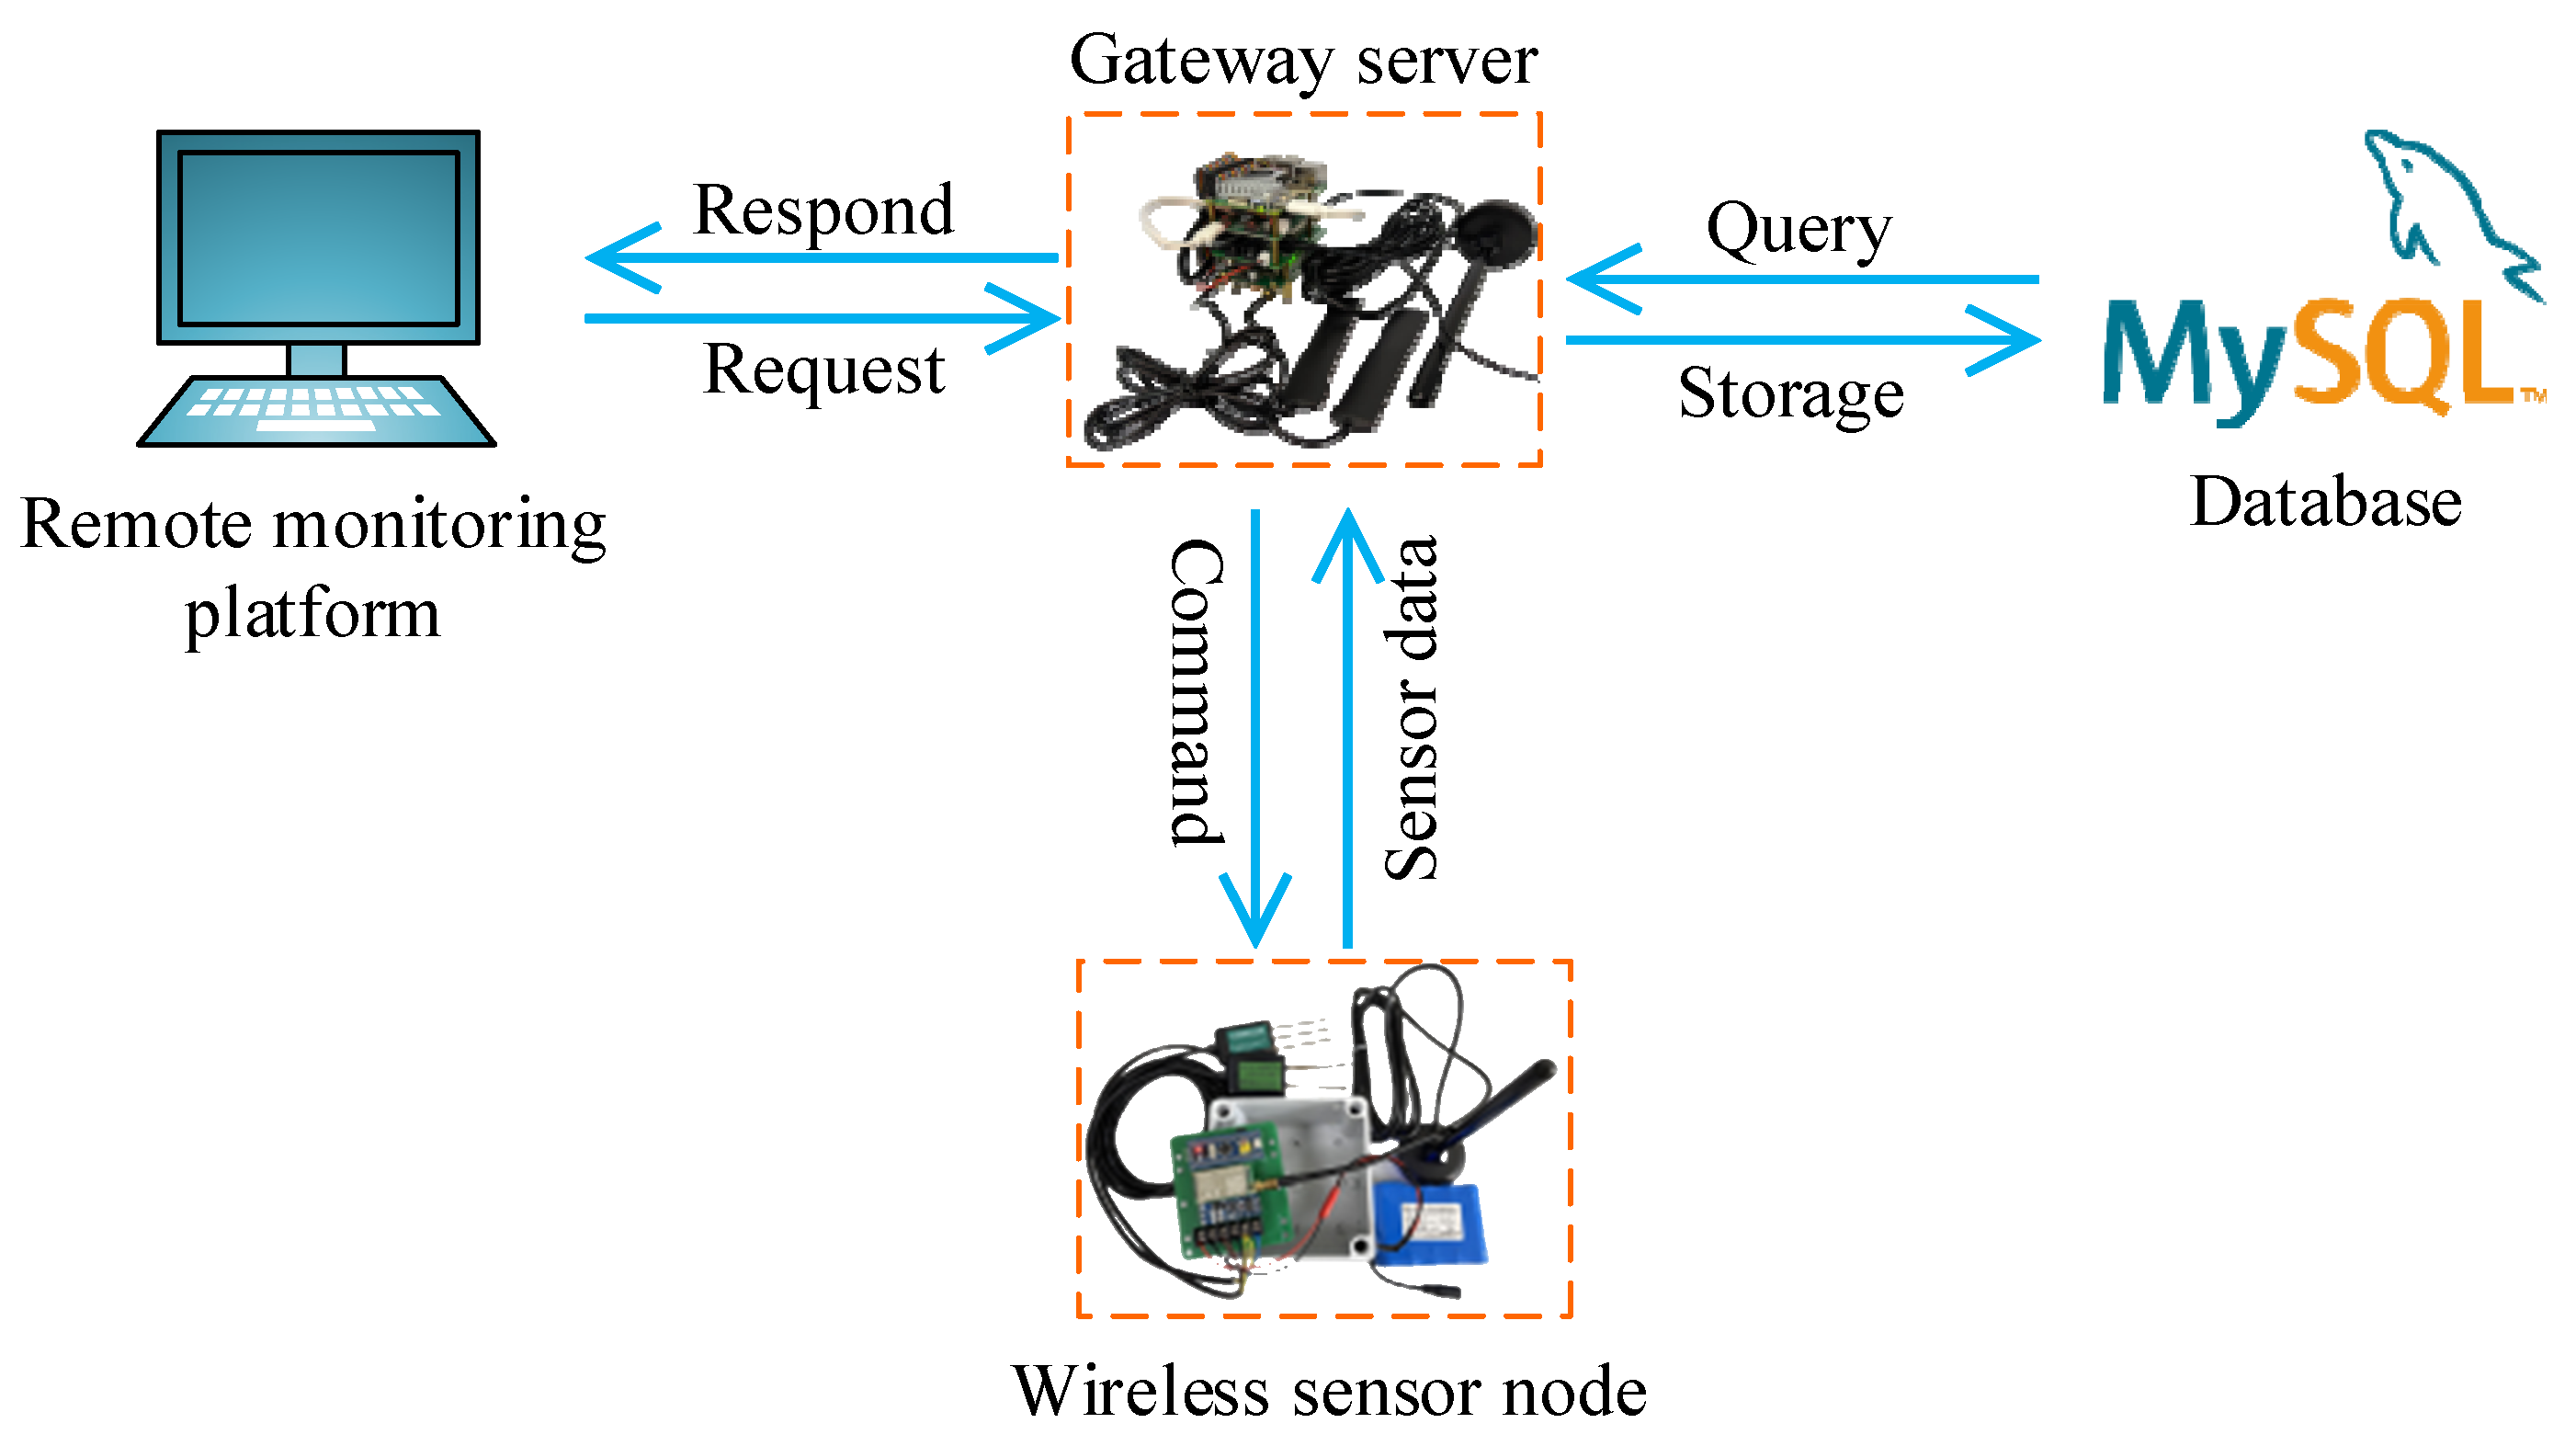
As shown in Figure 7, system software mainly contains software in the gateway server and wireless sensor nodes and the remote monitoring platform. The gateway server periodically sends a data acquisition command to the wireless sensor node via LoRa. The wireless sensor node collects soil information and transmits sensor data to the gateway server via LoRa. The gateway server receives sensor data, appends the timestamp, and stores it in the MySQL database [32]. Using a remote monitoring platform, Internet users can send web requests to the gateway server via the HTTP protocol. The server responds to web requests, retrieves data from the MySQL database, and sends data back to user terminals.

4.1. Software Design for Gateway Server

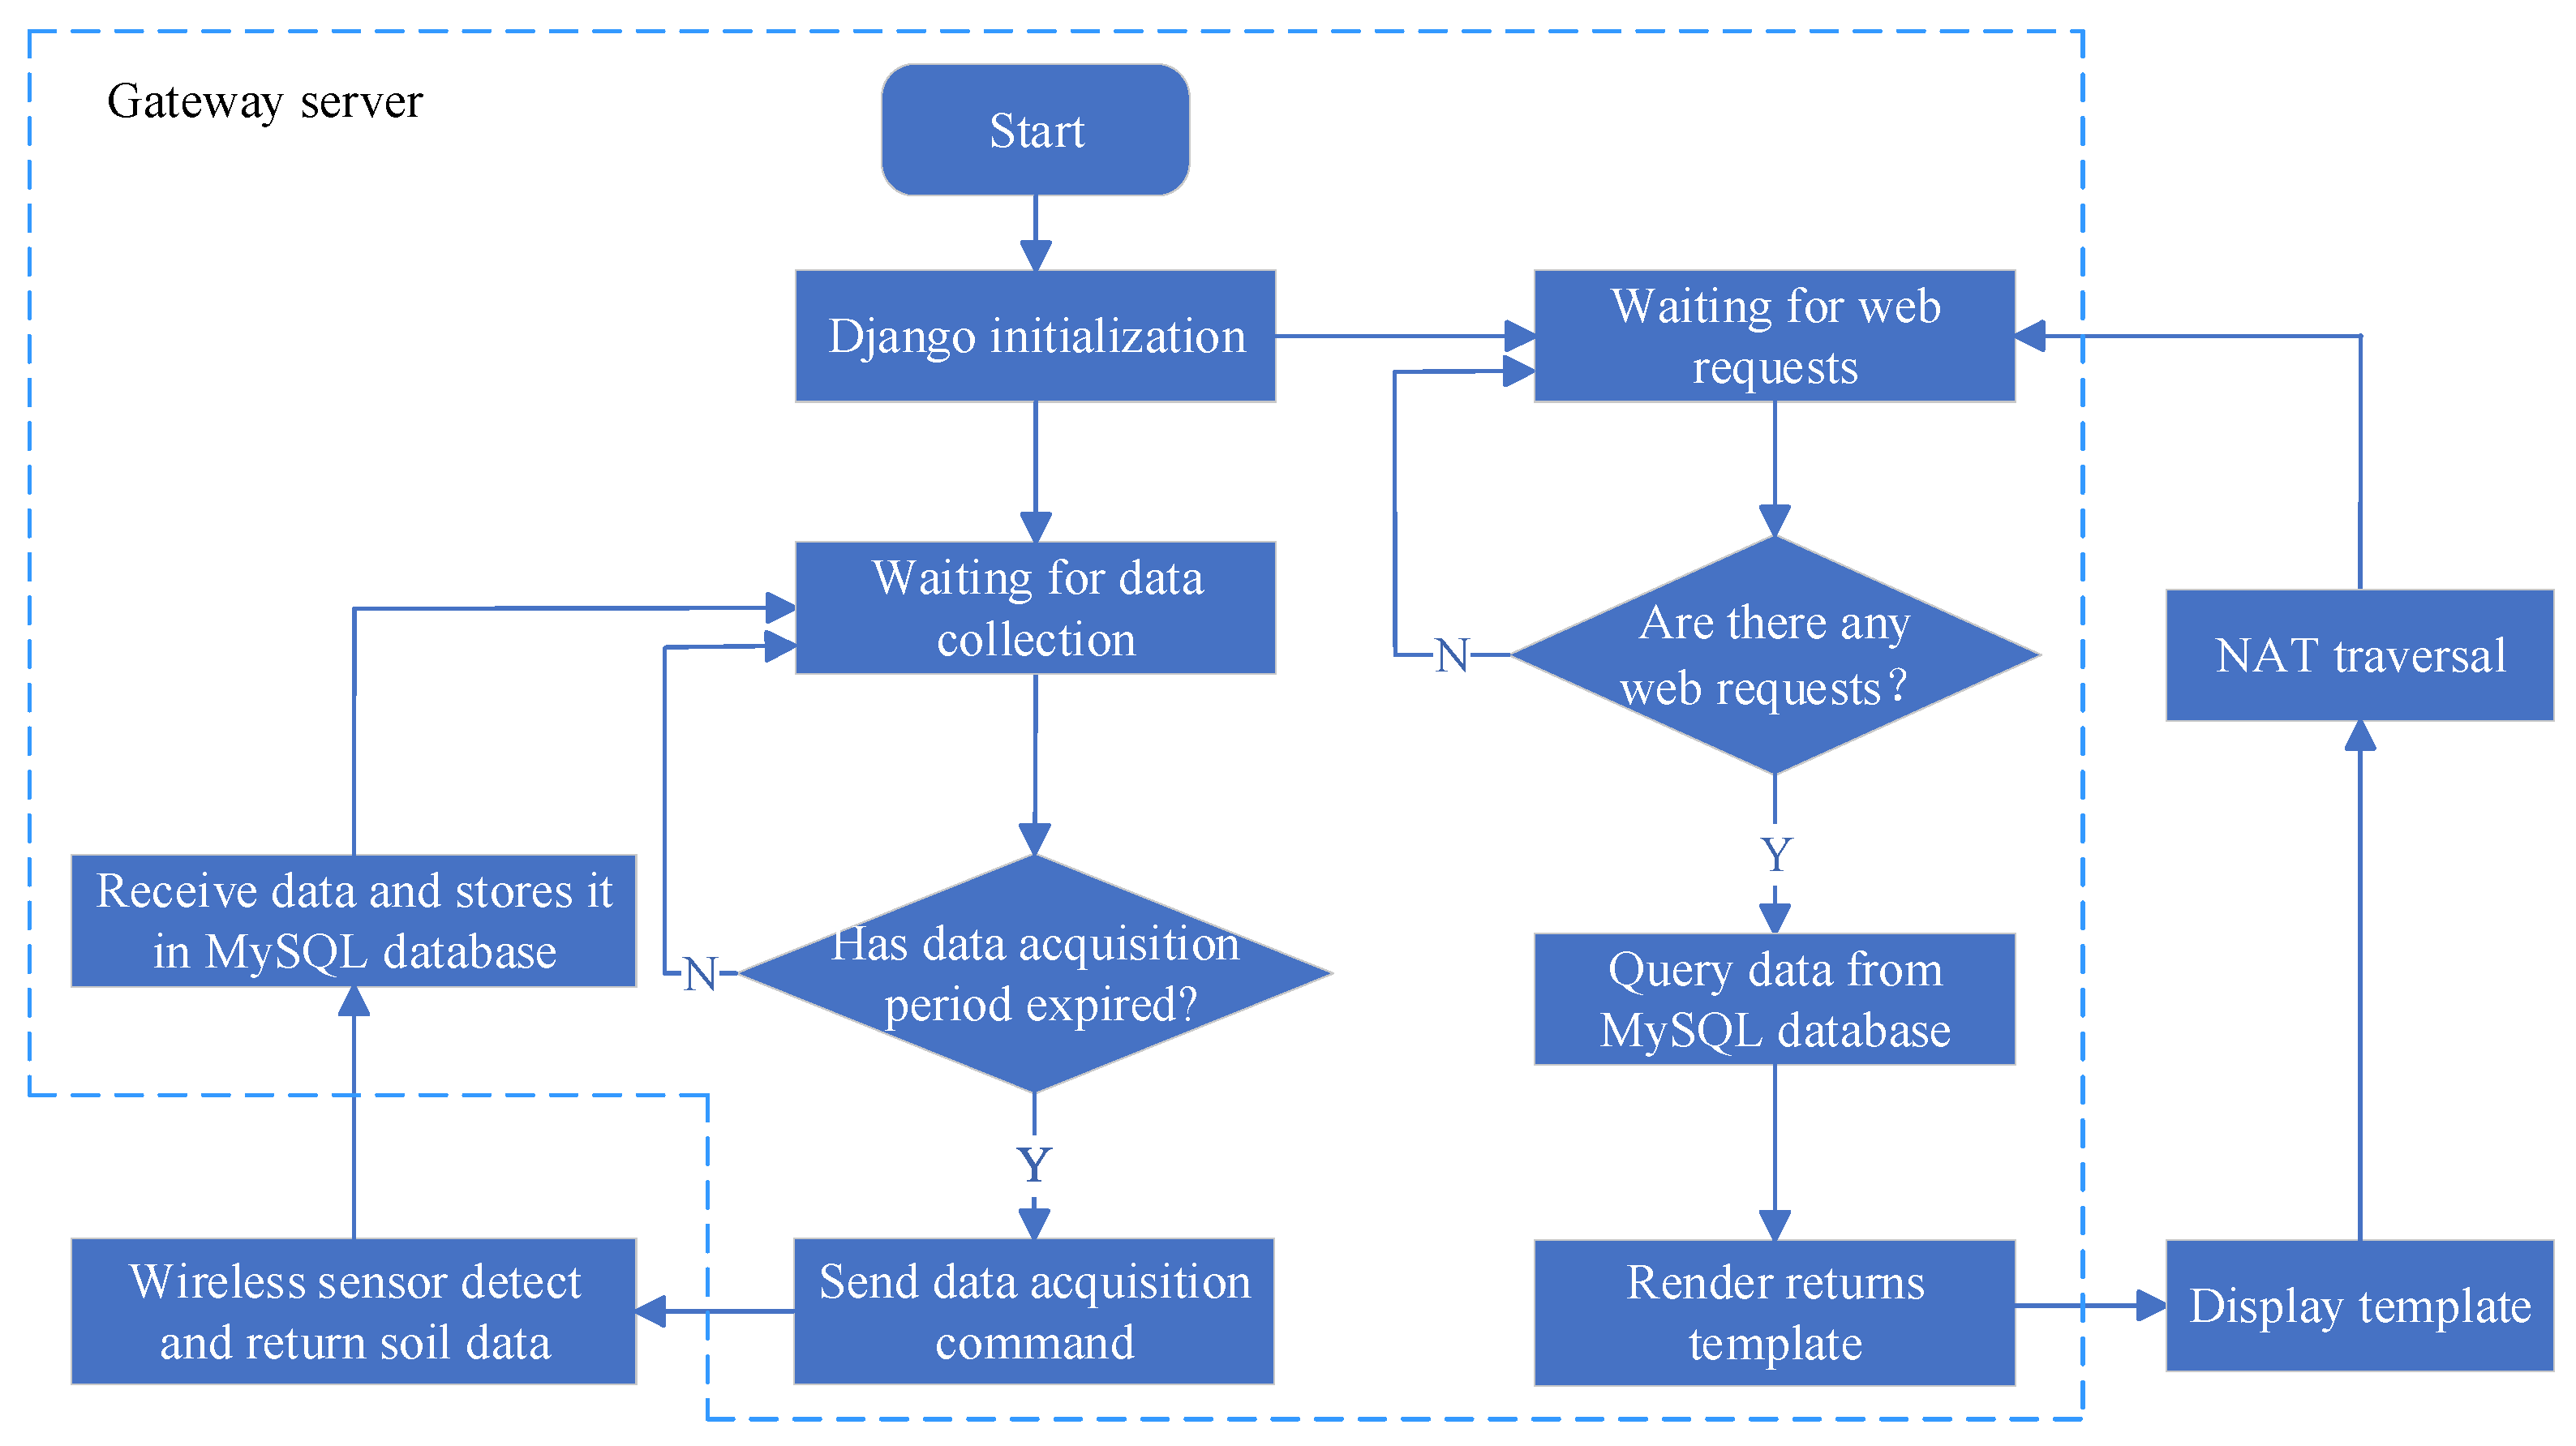
The gateway server mainly handles the reception, processing, and storage of data transmitted by wireless sensor nodes, as well as HTTP template management and web application programming interface (API) processing. The gateway server software is developed based on the Django’s MVC (Model-View-Controller) design pattern [33]. The Controller handles web requests and interacts with the Model when retrieving sensor data. The Model establishes connections to the database, executes data query operations, and sends the results to the View. The View, represented by HTML files, dynamically displays the data through charts.
As shown in Figure 8, using the preset period, the gateway server sends a data acquisition command 0x00 0x05 0x41 0xDA 0xDA to its LoRa unit via the USART interface where 0x00 0x05 indicates the LoRa address of wireless sensor node, 0x41 denotes the communication channel with a frequency band of 915 MHz, and 0xDA 0xDA indicates that the objective is to obtain sensor data. Using LoRa communication, the wireless sensor node receives the data acquisition instruction 0xDA 0xDA, drives sensors to collect soil data, and transmits sensor data back to the gateway server. The gateway server receives sensor data and stores them with the timestamp in dat_soildata table in the MySQL database, which includes fields of id, Soiltime, Soiltemp, Soilhum, and Soilph.
Using a remote monitoring platform, the gateway server can respond to web requests initiated by Internet users and retrieve the stored sensor data from the database for display, which will be comprehensively introduced in Section 4.3.

4.2. Software Design for Wireless Sensor Node

Wireless sensor node receives data detection instructions from the gateway server via LoRa, uses sensors to collect soil temperature, humidity, and pH value, and then returns sensor data to the gateway server.
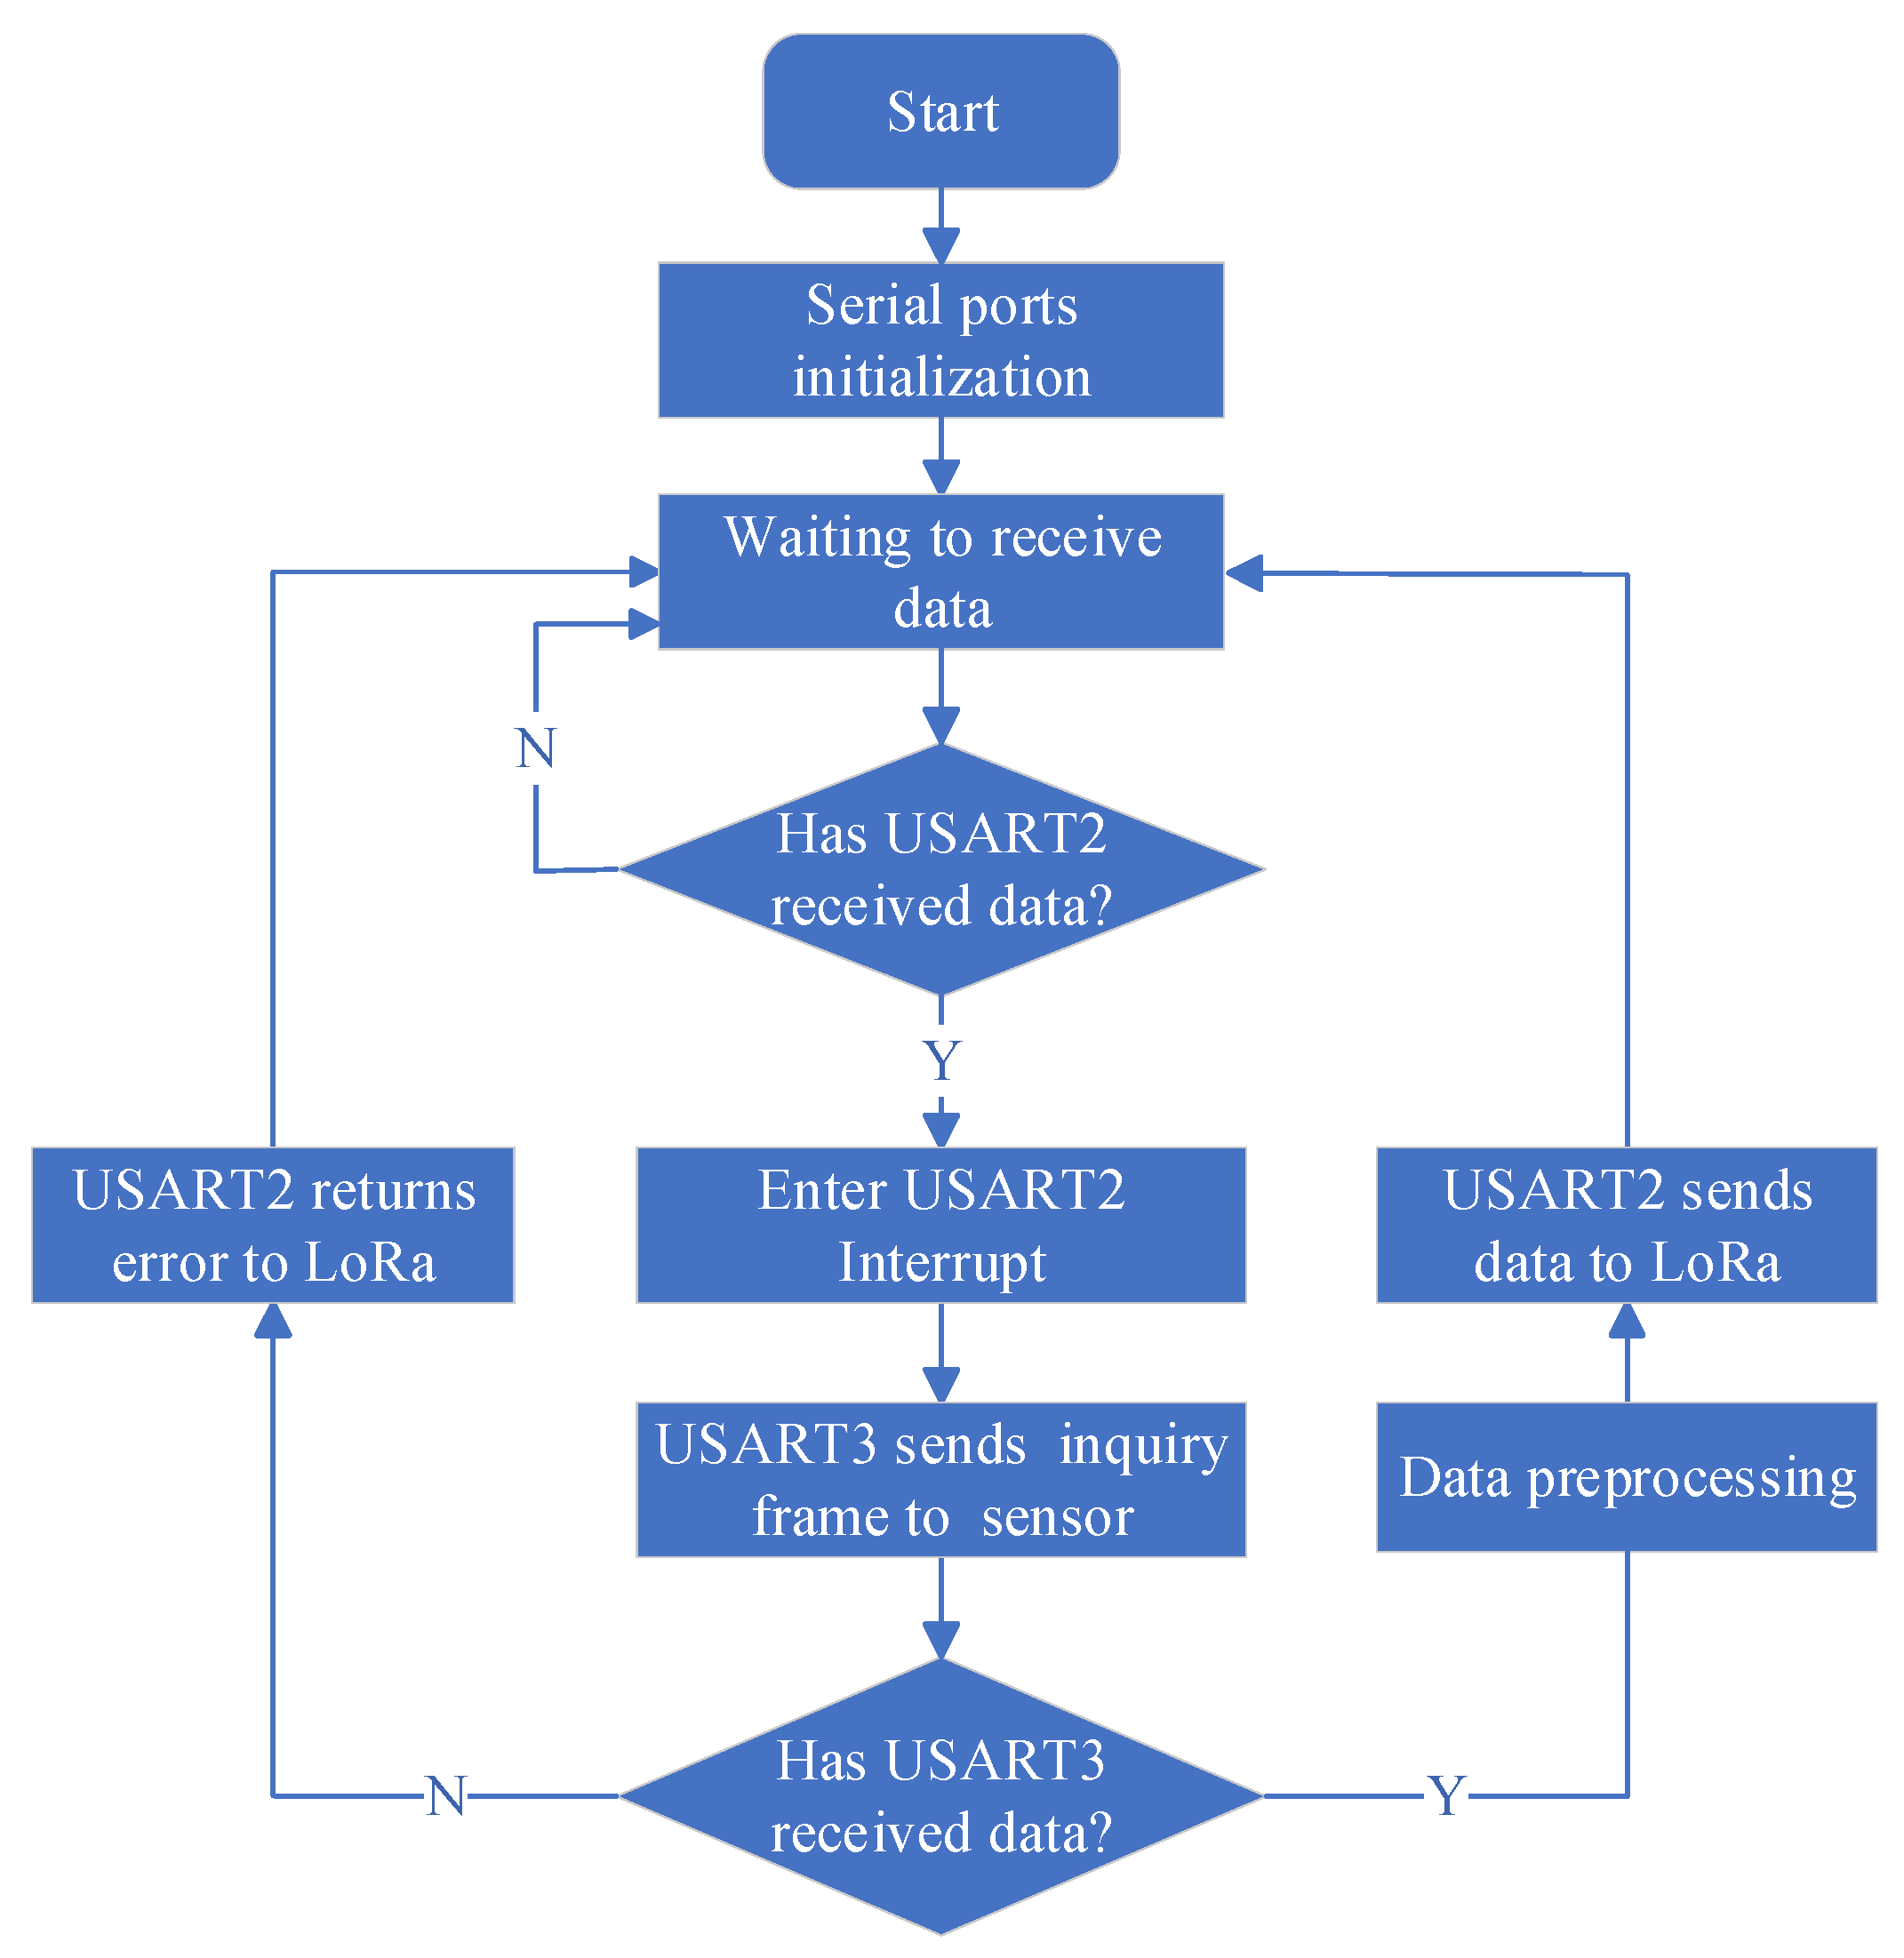
As shown in the flowchart in Figure 9, the serial ports of the STM32F103C8T6 board are initialized. USART1 serves as a debug interface using a baud rate of 9600, USART2 communicates with the LoRa unit using a baud rate of 9600, and USART3 interfaces with sensors via the RS485-TTL conversion unit using a baud rate of 115,200. In addition, interrupt handler functions USART2_IRQHandler of USART2 and USART3_IRQHandler of USART3 are initialized. Direct Memory Access (DMA), including DMA1 and DMA2, is also configured, where the sixth channel and third channel of DMA1 are used to store the received data of USART2 and USART3, respectively.
After receiving data from the gateway server, the LoRa unit sends them to the STM32F103C8T6 MCU via USART2. If it is the data acquisition command 0xDA 0xDA, the STM32F103C8T6 MCU sends data query frames to soil sensors through USART3. First, the STM32F103C8T6 MCU sends a query frame 0x01 0x03 0x00 0x00 0x00 0x02 0xC4 0x0B via USART3, the soil temperature and humidity sensor with address 0x01 returns response frame 0x01 0x03 0x01 0xE6 0x00 0xFC 0x80 0xA5 with humidity 0x01 0xE6 (i.e., 48.6%) and temperature 0x00 0xFC (i.e., 25.2 degrees Celsius). Then, the STM32F103C8T6 MCU sends another query frame 0x02 0x03 0x00 0x00 0x00 0x01 0x84 0x39 via USART3, and soil pH sensor with address 0x02 returns response frame 0x02 0x03 0x02 0x00 0x42 0xE3 0x8E with pH value 0x00 0x42 (i.e., 6.6).
After receiving soil sensors’ response frames, the STM32F103C8T6 MCU generates a data frame 0x00 0x02 0x41 0x05 0x00 0xFC 0x01 0xE6 0x00 0x42 0x05, and transmits it to its LoRa unit via USART2. Using LoRa communication, the gateway server receives data 0x05 0x00 0xFC 0x01 0xE6 0x00 0x42 0x05, where the check bit 0x05 is used to verify the LoRa address 0x00 0x05 of the wireless sensor node, and 0x00 0xFC, 0x01 0xE6 and 0x00 0x42 indicate soil temperature, humidity and pH value, respectively.

4.3. Remote Monitoring Platform

The remote monitoring platform has functions of real-time and historical monitoring of sensor data, and remote configuration of system parameters, which is developed using HTML, CSS, and JavaScript technologies [34].
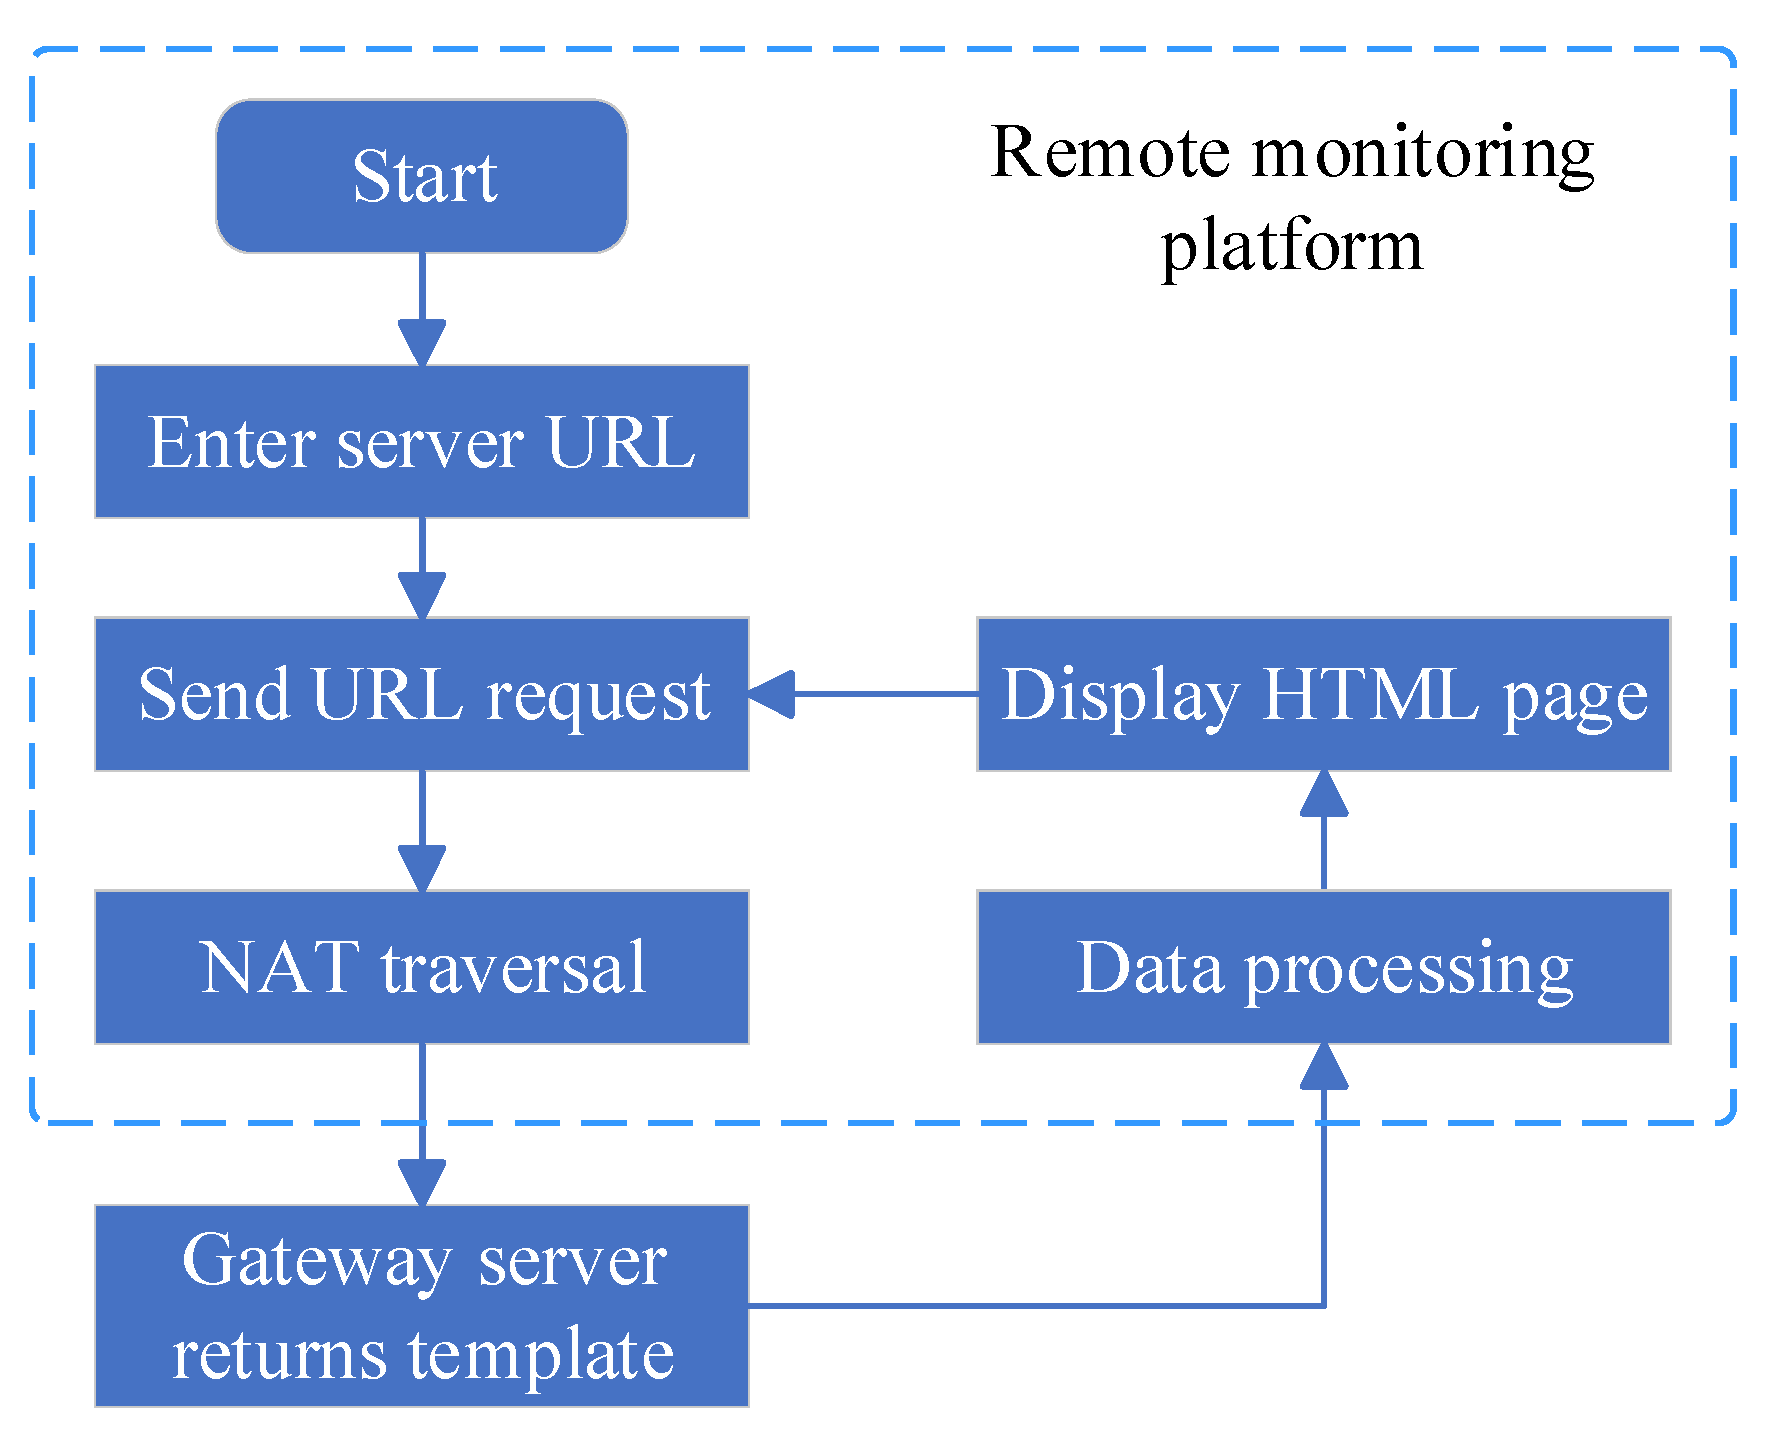
As shown in Figure 10, an Internet user logs in web browser via uniform resource locator (URL). Web requests are sent to the backend API via Ajax, which are then forwarded to the Django-based gateway server via NAT traversal technology. The gateway server returns the HTML template with data in Json format. The browser processes the information received from the gateway server, and generates HTML pages for display.

5. System Test and Performance Analysis

5.1. System Test

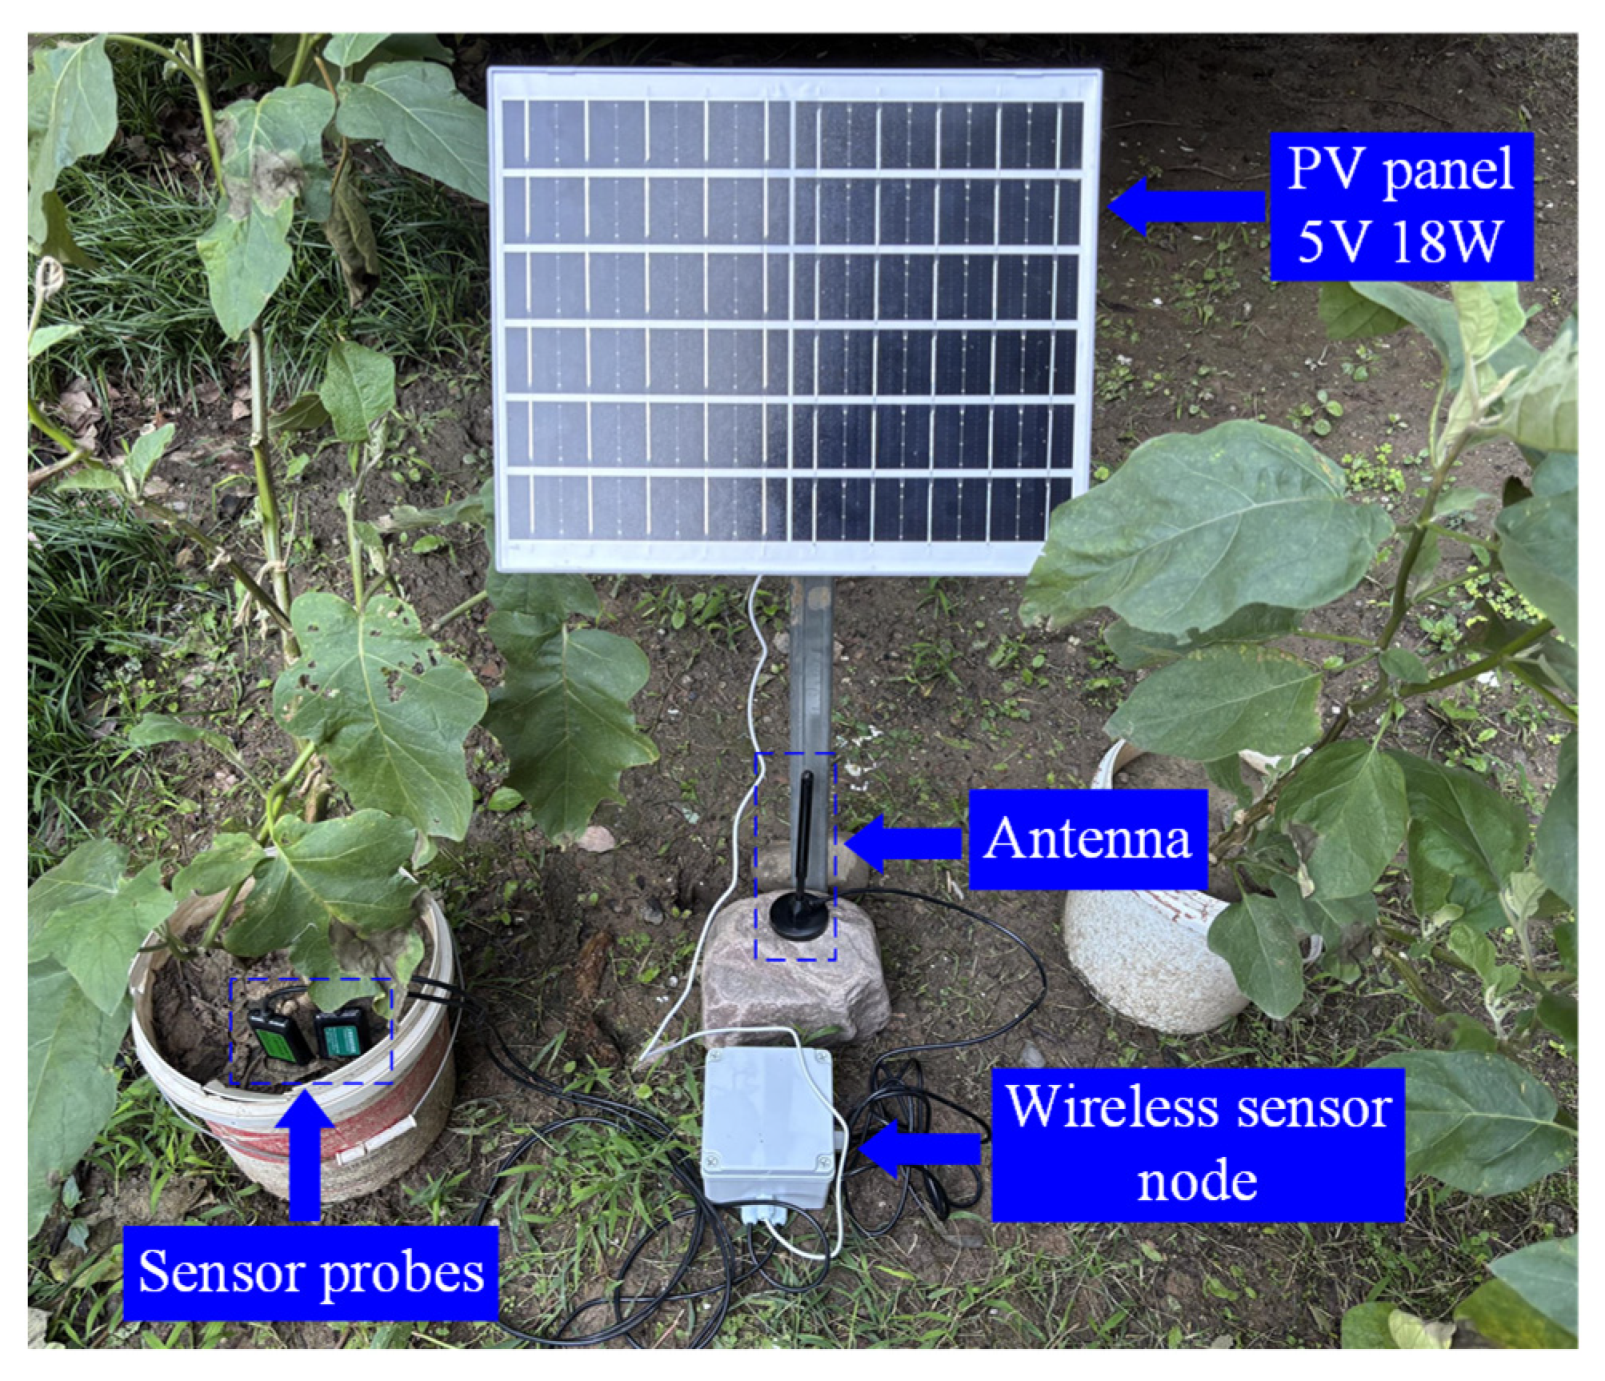
As shown in Figure 11, sensor probes are inserted in the soil to detect soil temperature, humidity, and pH value. Using the LoRa unit with antenna, the sensor node wirelessly sends soil data to the gateway server. To improve the power sustainability, the sensor node is powered by a PV power unit (5 V, 18 W) and a lithium battery (5 V, 30,000 mAh).
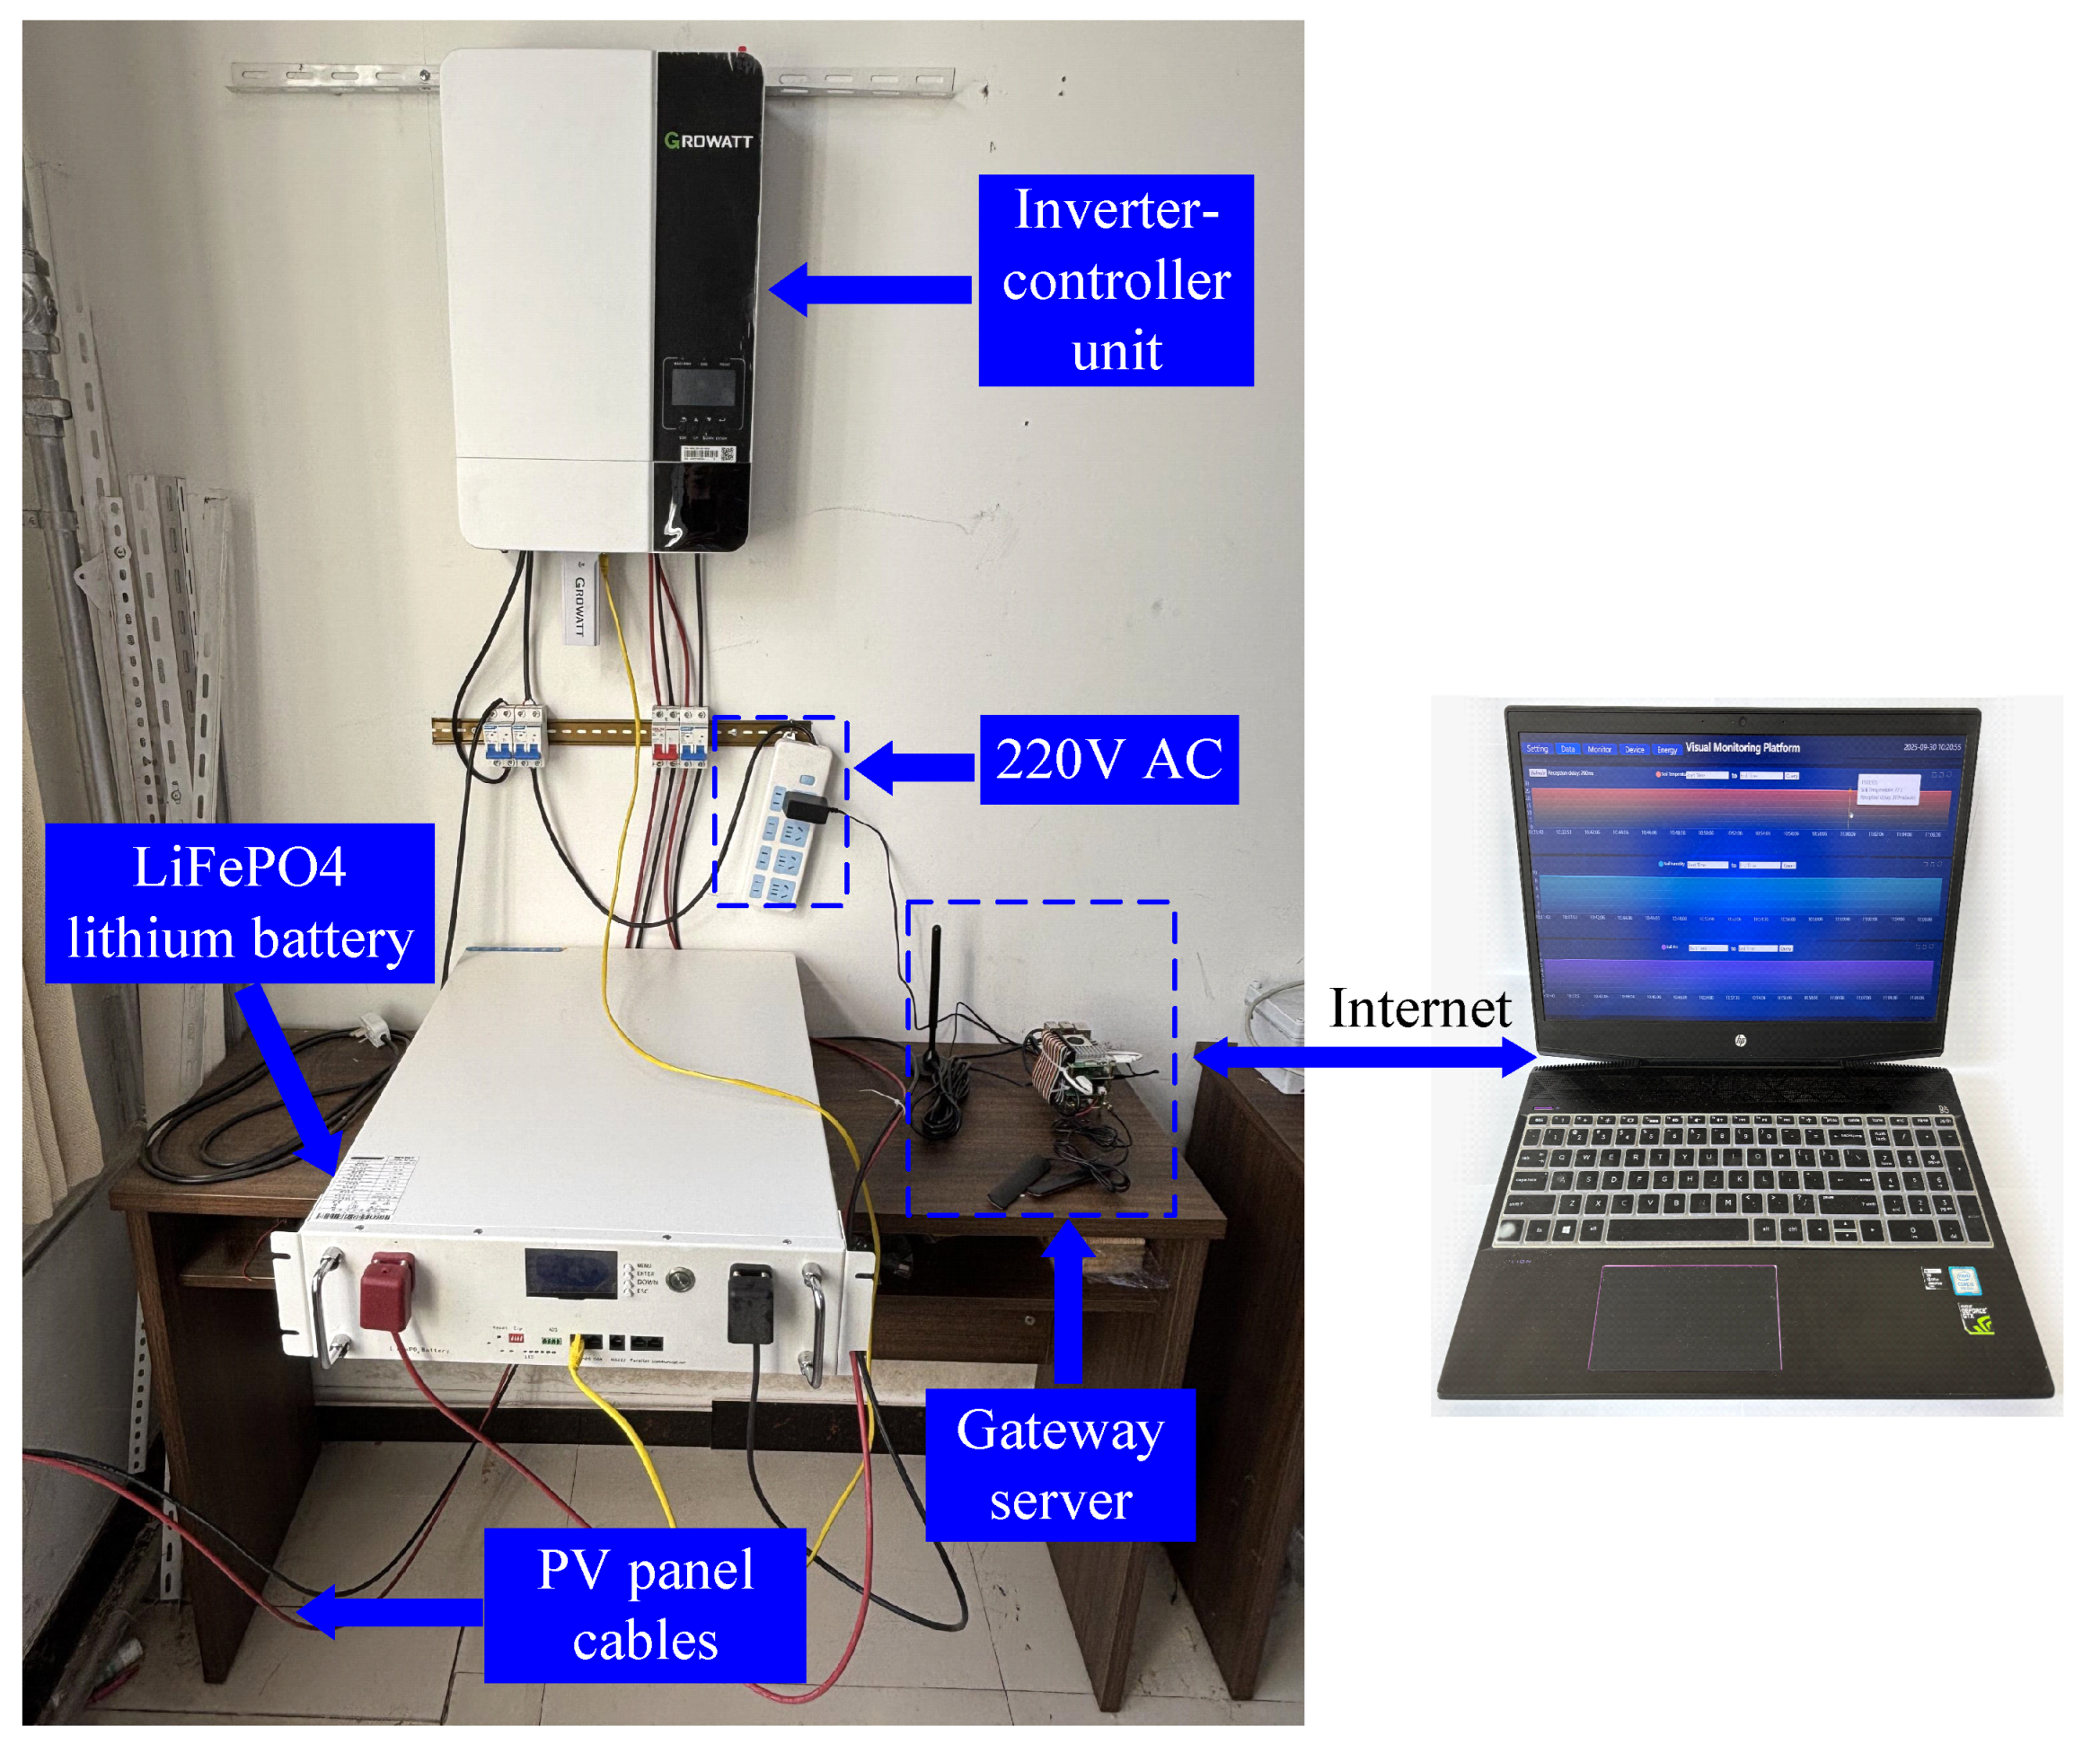
As shown in Figure 12, the gateway server receives soil information from the wireless sensor node via the LoRa unit with antenna, and stores data with timestamp in the MySQL database. Using the remote monitoring platform, Internet users can monitor real-time and historical soil data retrieved from the database in the gateway server.
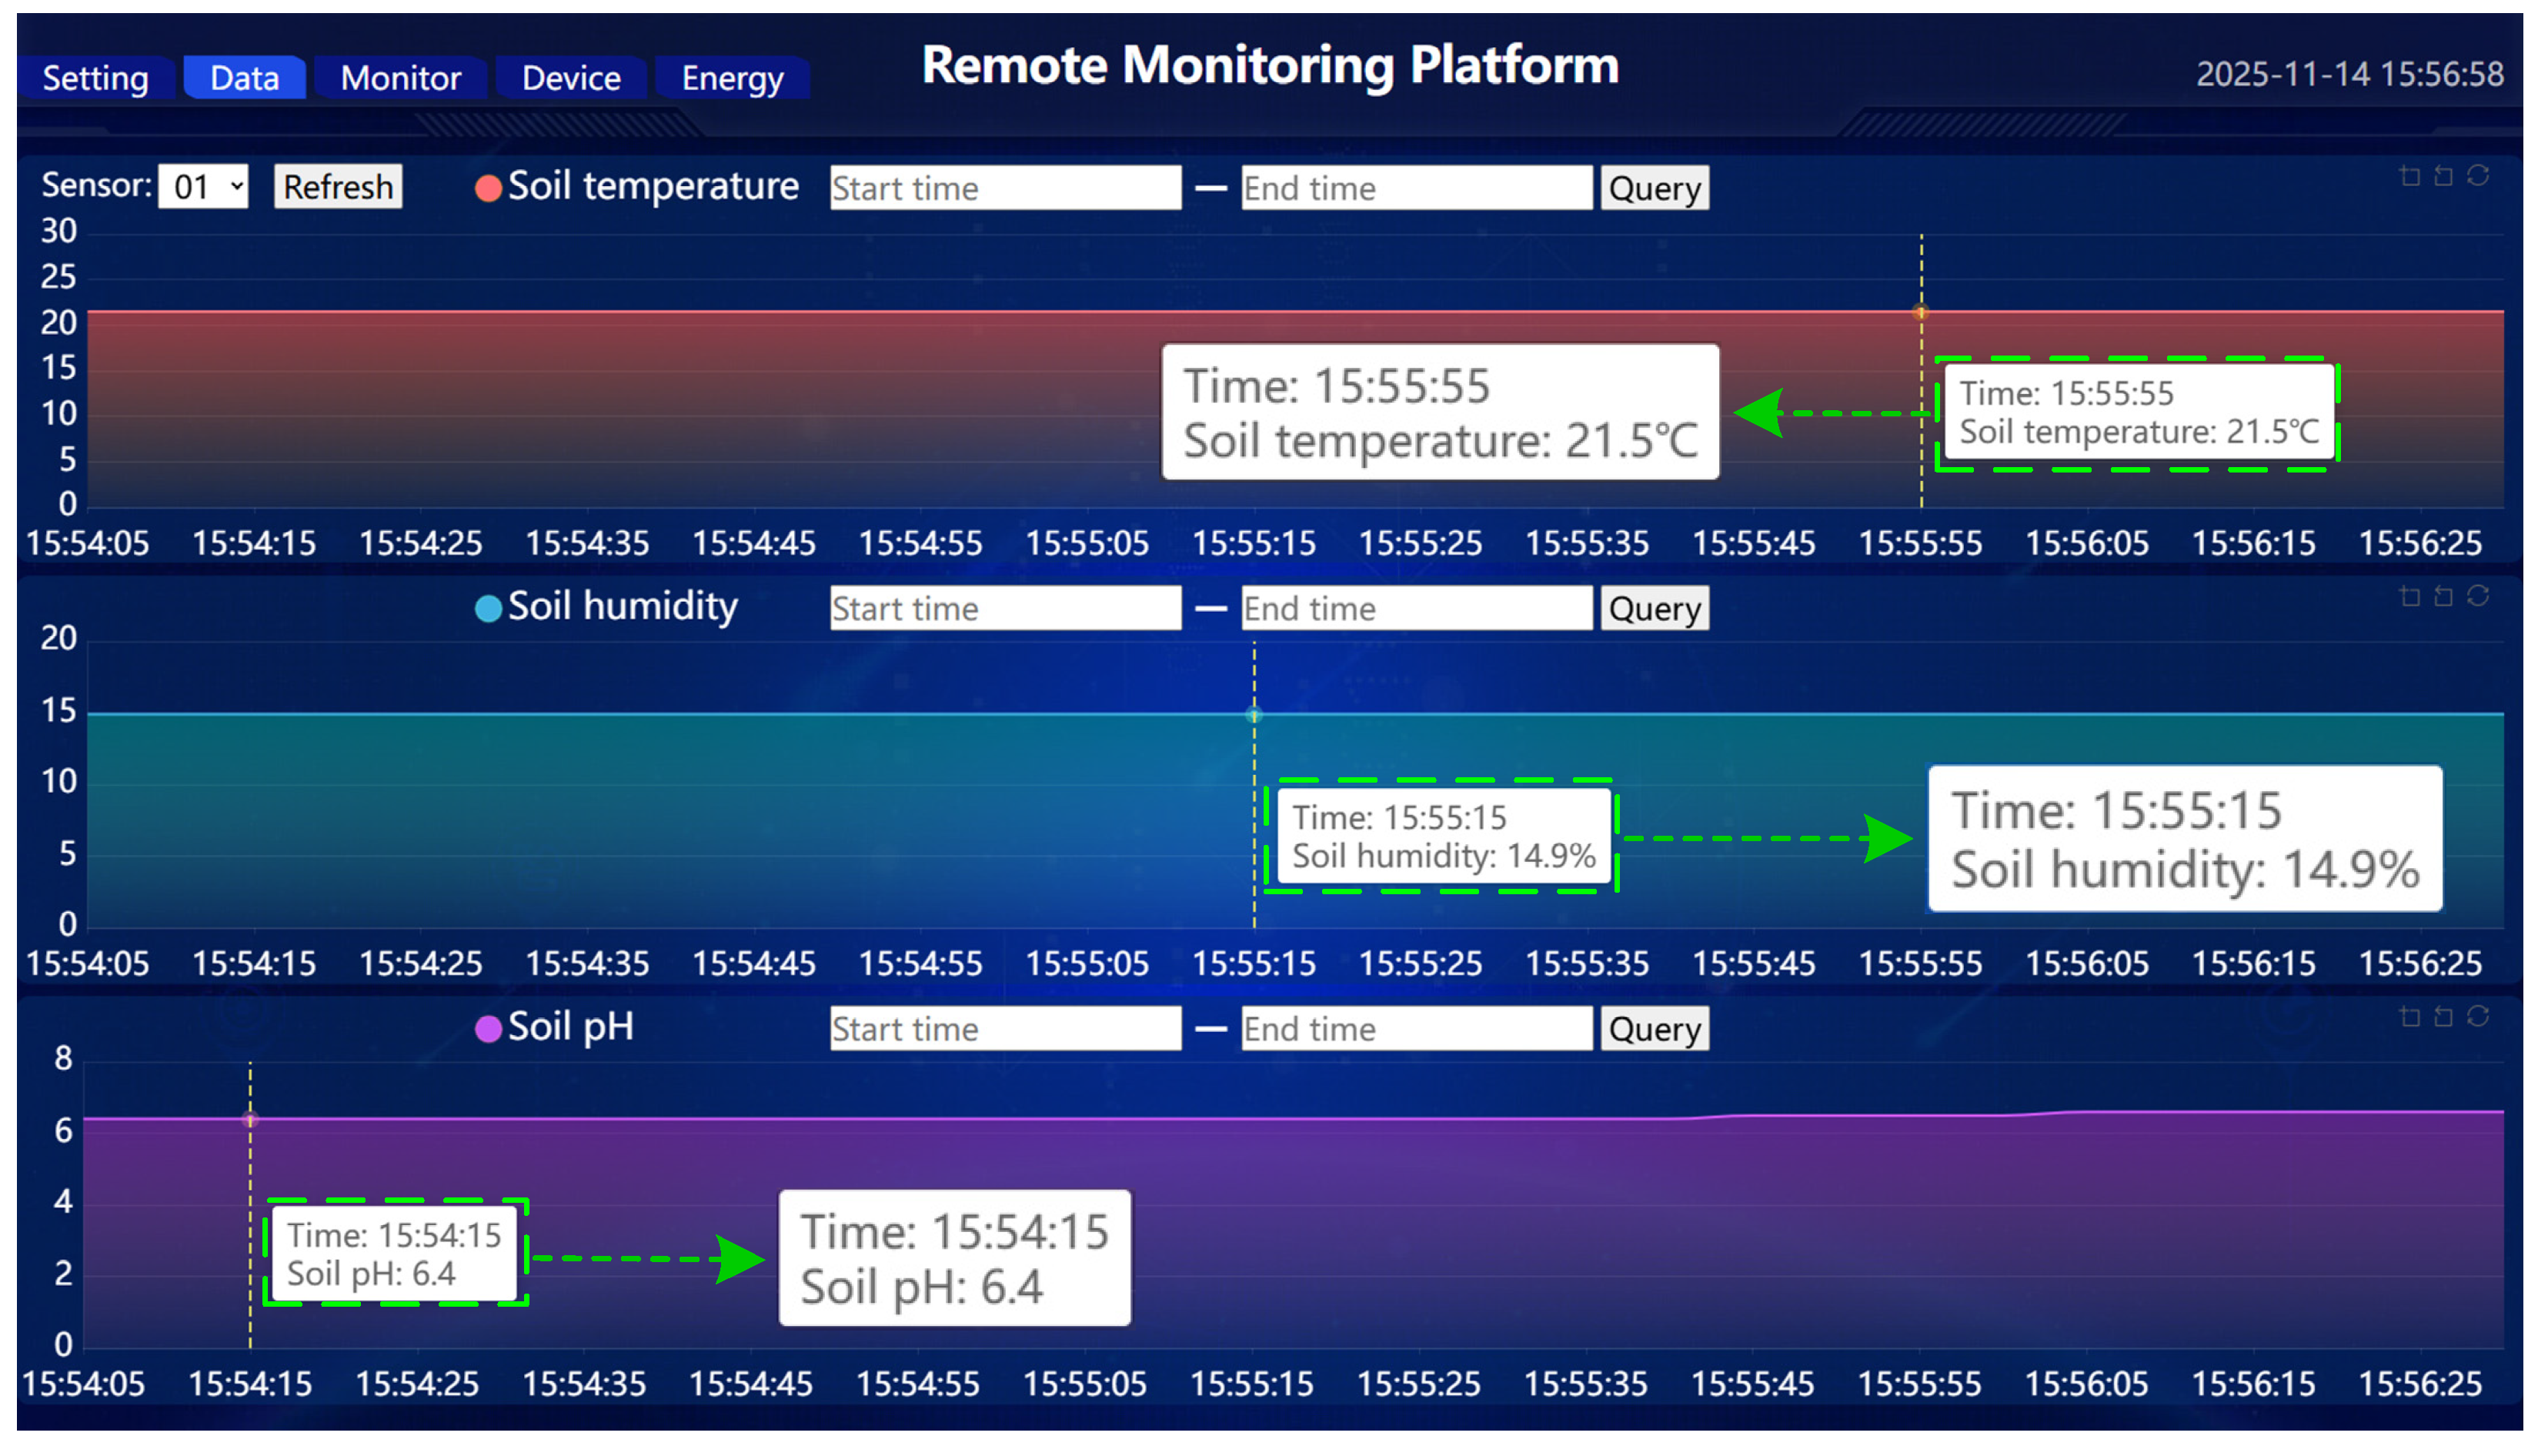
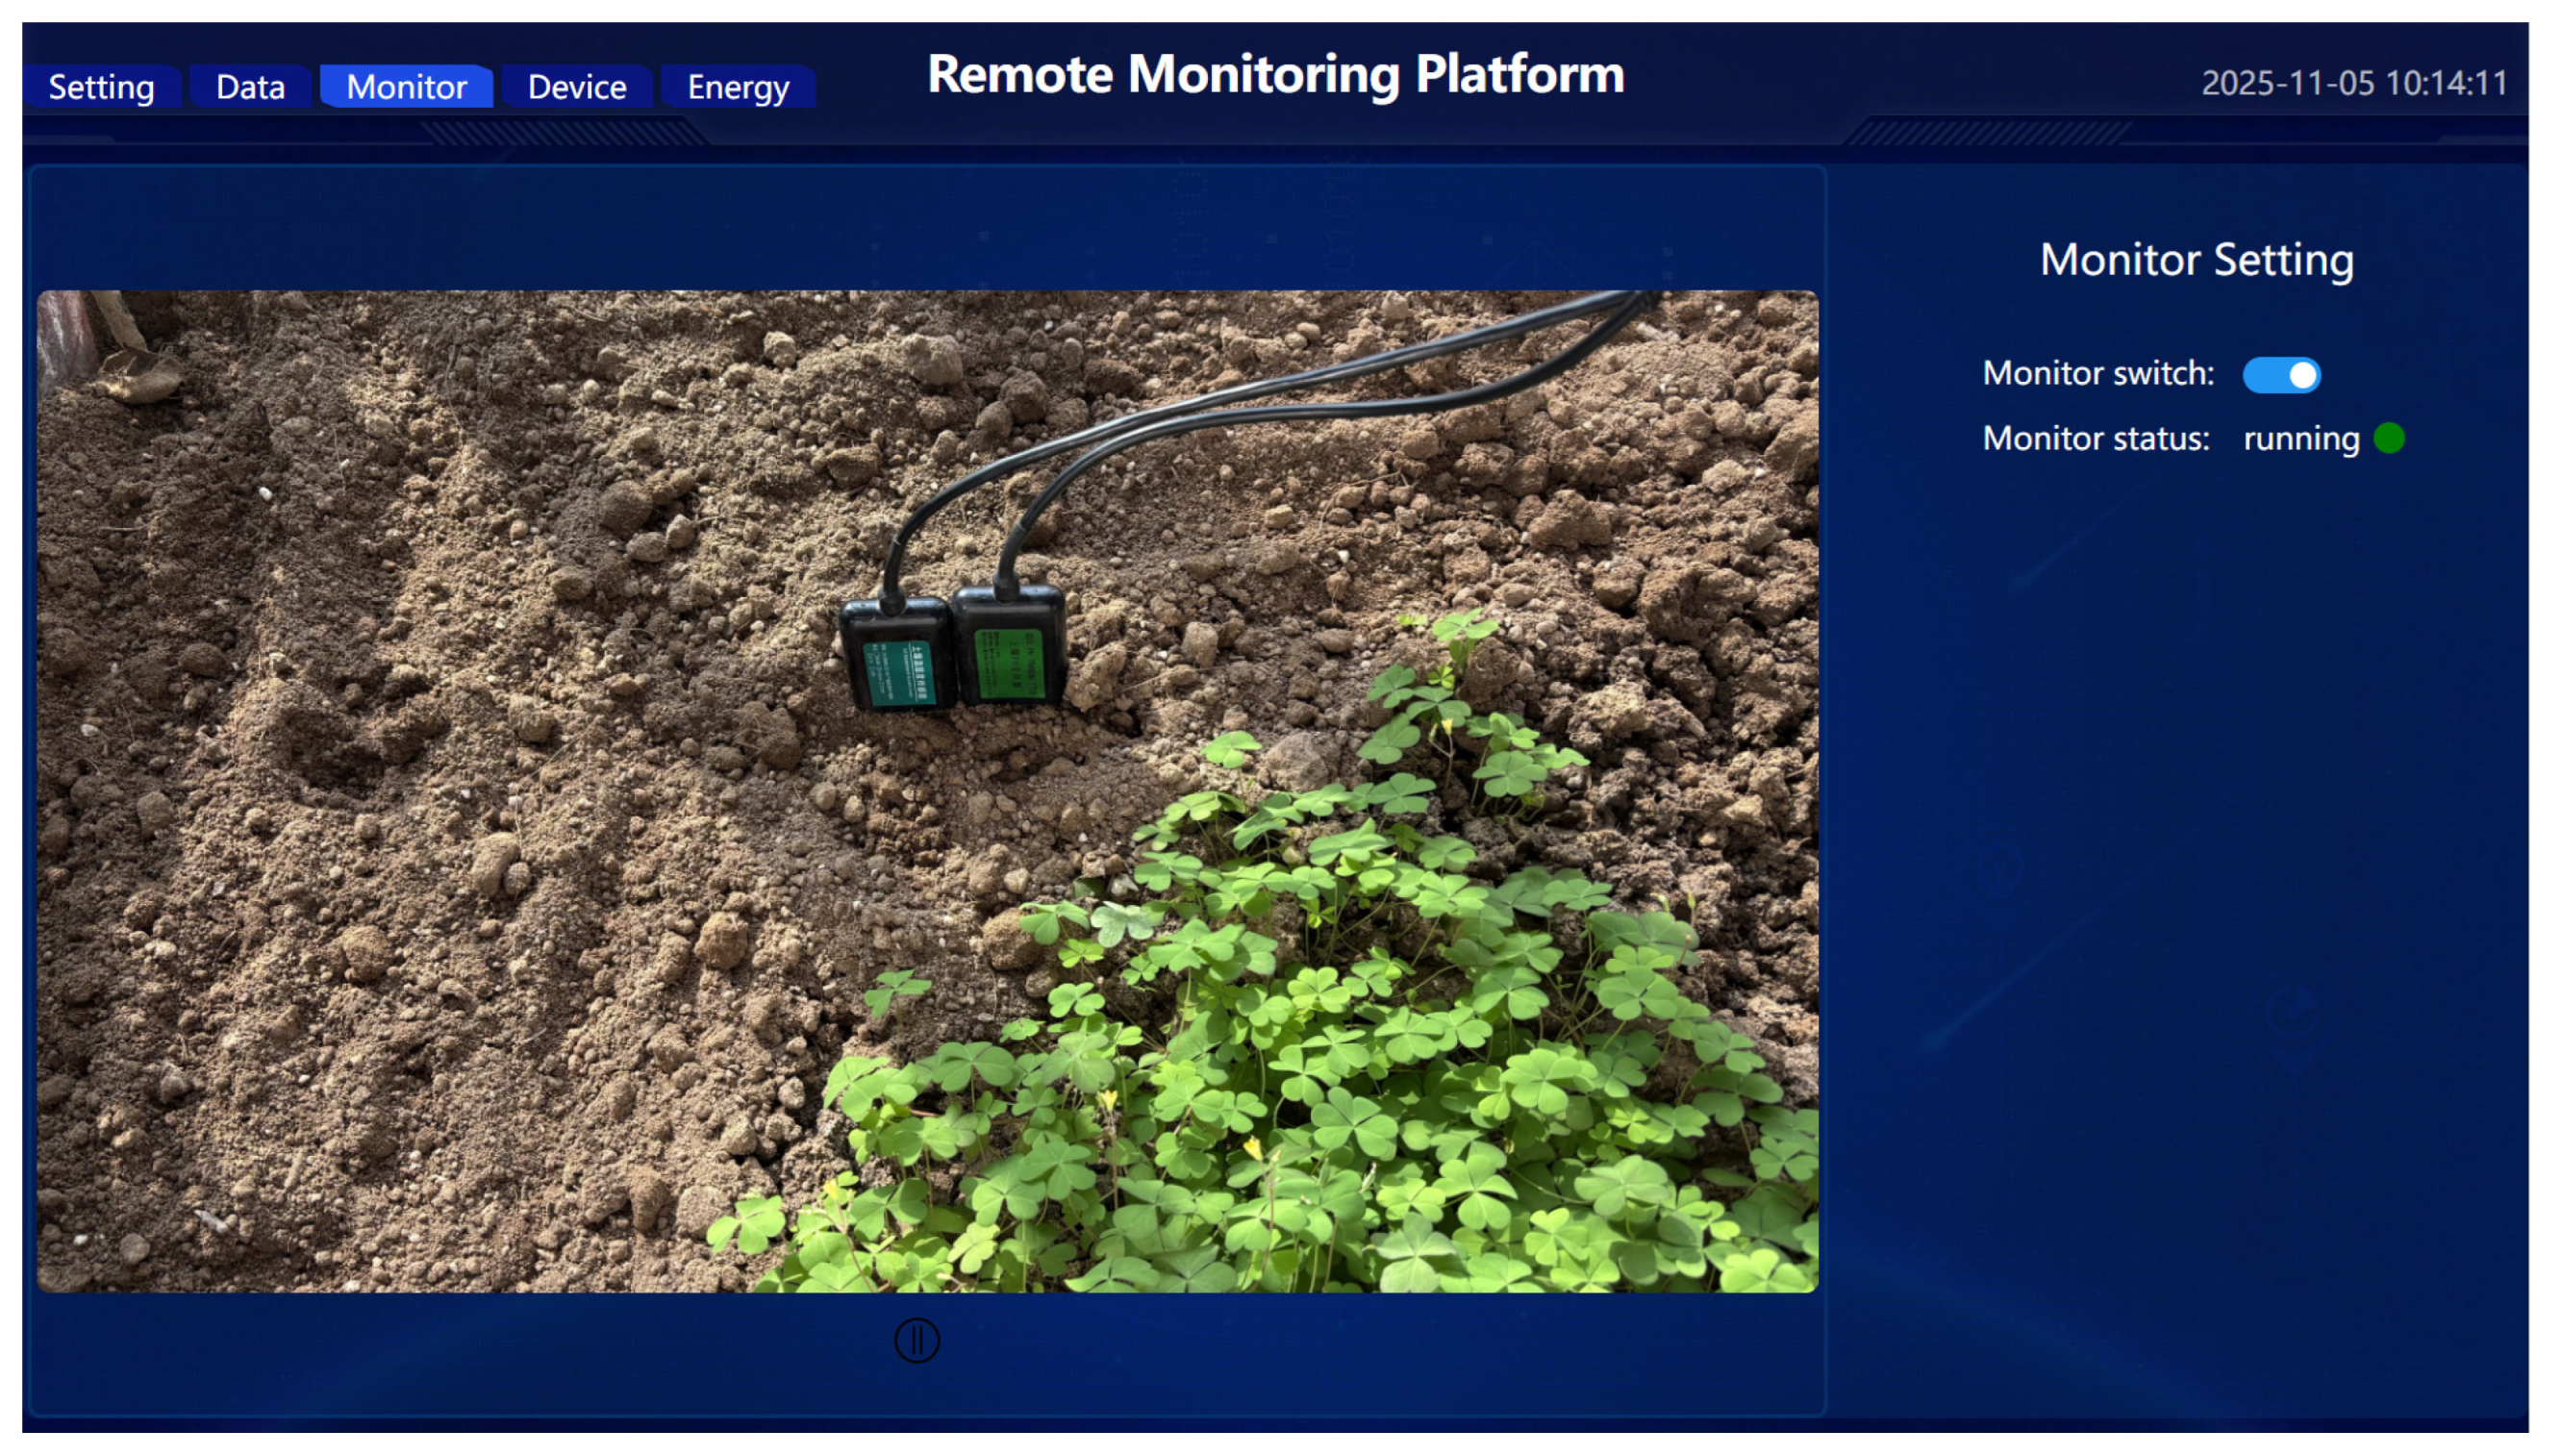
Figure 13 shows the soil information monitoring webpage. The horizontal axis represents time, while the vertical axes represent soil temperature, soil moisture, and soil pH, respectively. By selecting the sensor number and specifying the start and end times for the database query, users can view the soil information detected by that sensor during the selected time period. For example, Figure 13 displays the soil information detected by Sensor 01 between 15:54 and 15:56 on 14 November 2025. As shown in partially enlarged views, the soil temperature at 15:55:55 was 21.5 °C, the soil moisture at 15:55:15 was 14.9%, and the soil pH at 15:54:15 was 6.4. In addition, by clicking the Monitor button in the menu bar, as shown in Figure 14, users can remotely view video information of the agricultural planting environment.

5.2. Data Acquisition Failure Rate

When the wireless sensor node receives a data acquisition command from the gateway server, the STM32F103C8T6 MCU sends a query frame to the soil sensors. If the soil sensors do not return a response frame within the predefined waiting time, the wireless sensor node cannot send sensor data to the gateway server, resulting in data acquisition failure. Data acquisition failure has a negative impact on the performance of networked systems [35].
The data acquisition failure rate r indicates the failure rate of the gateway server acquiring data from the wireless sensor node, which is defined as
r = ( 1 n r n s ) × 100 %
where n s denotes the number of data acquisition commands sent by the gateway server, and n r indicates the number of data packets received by the gateway server from the wireless sensor node.
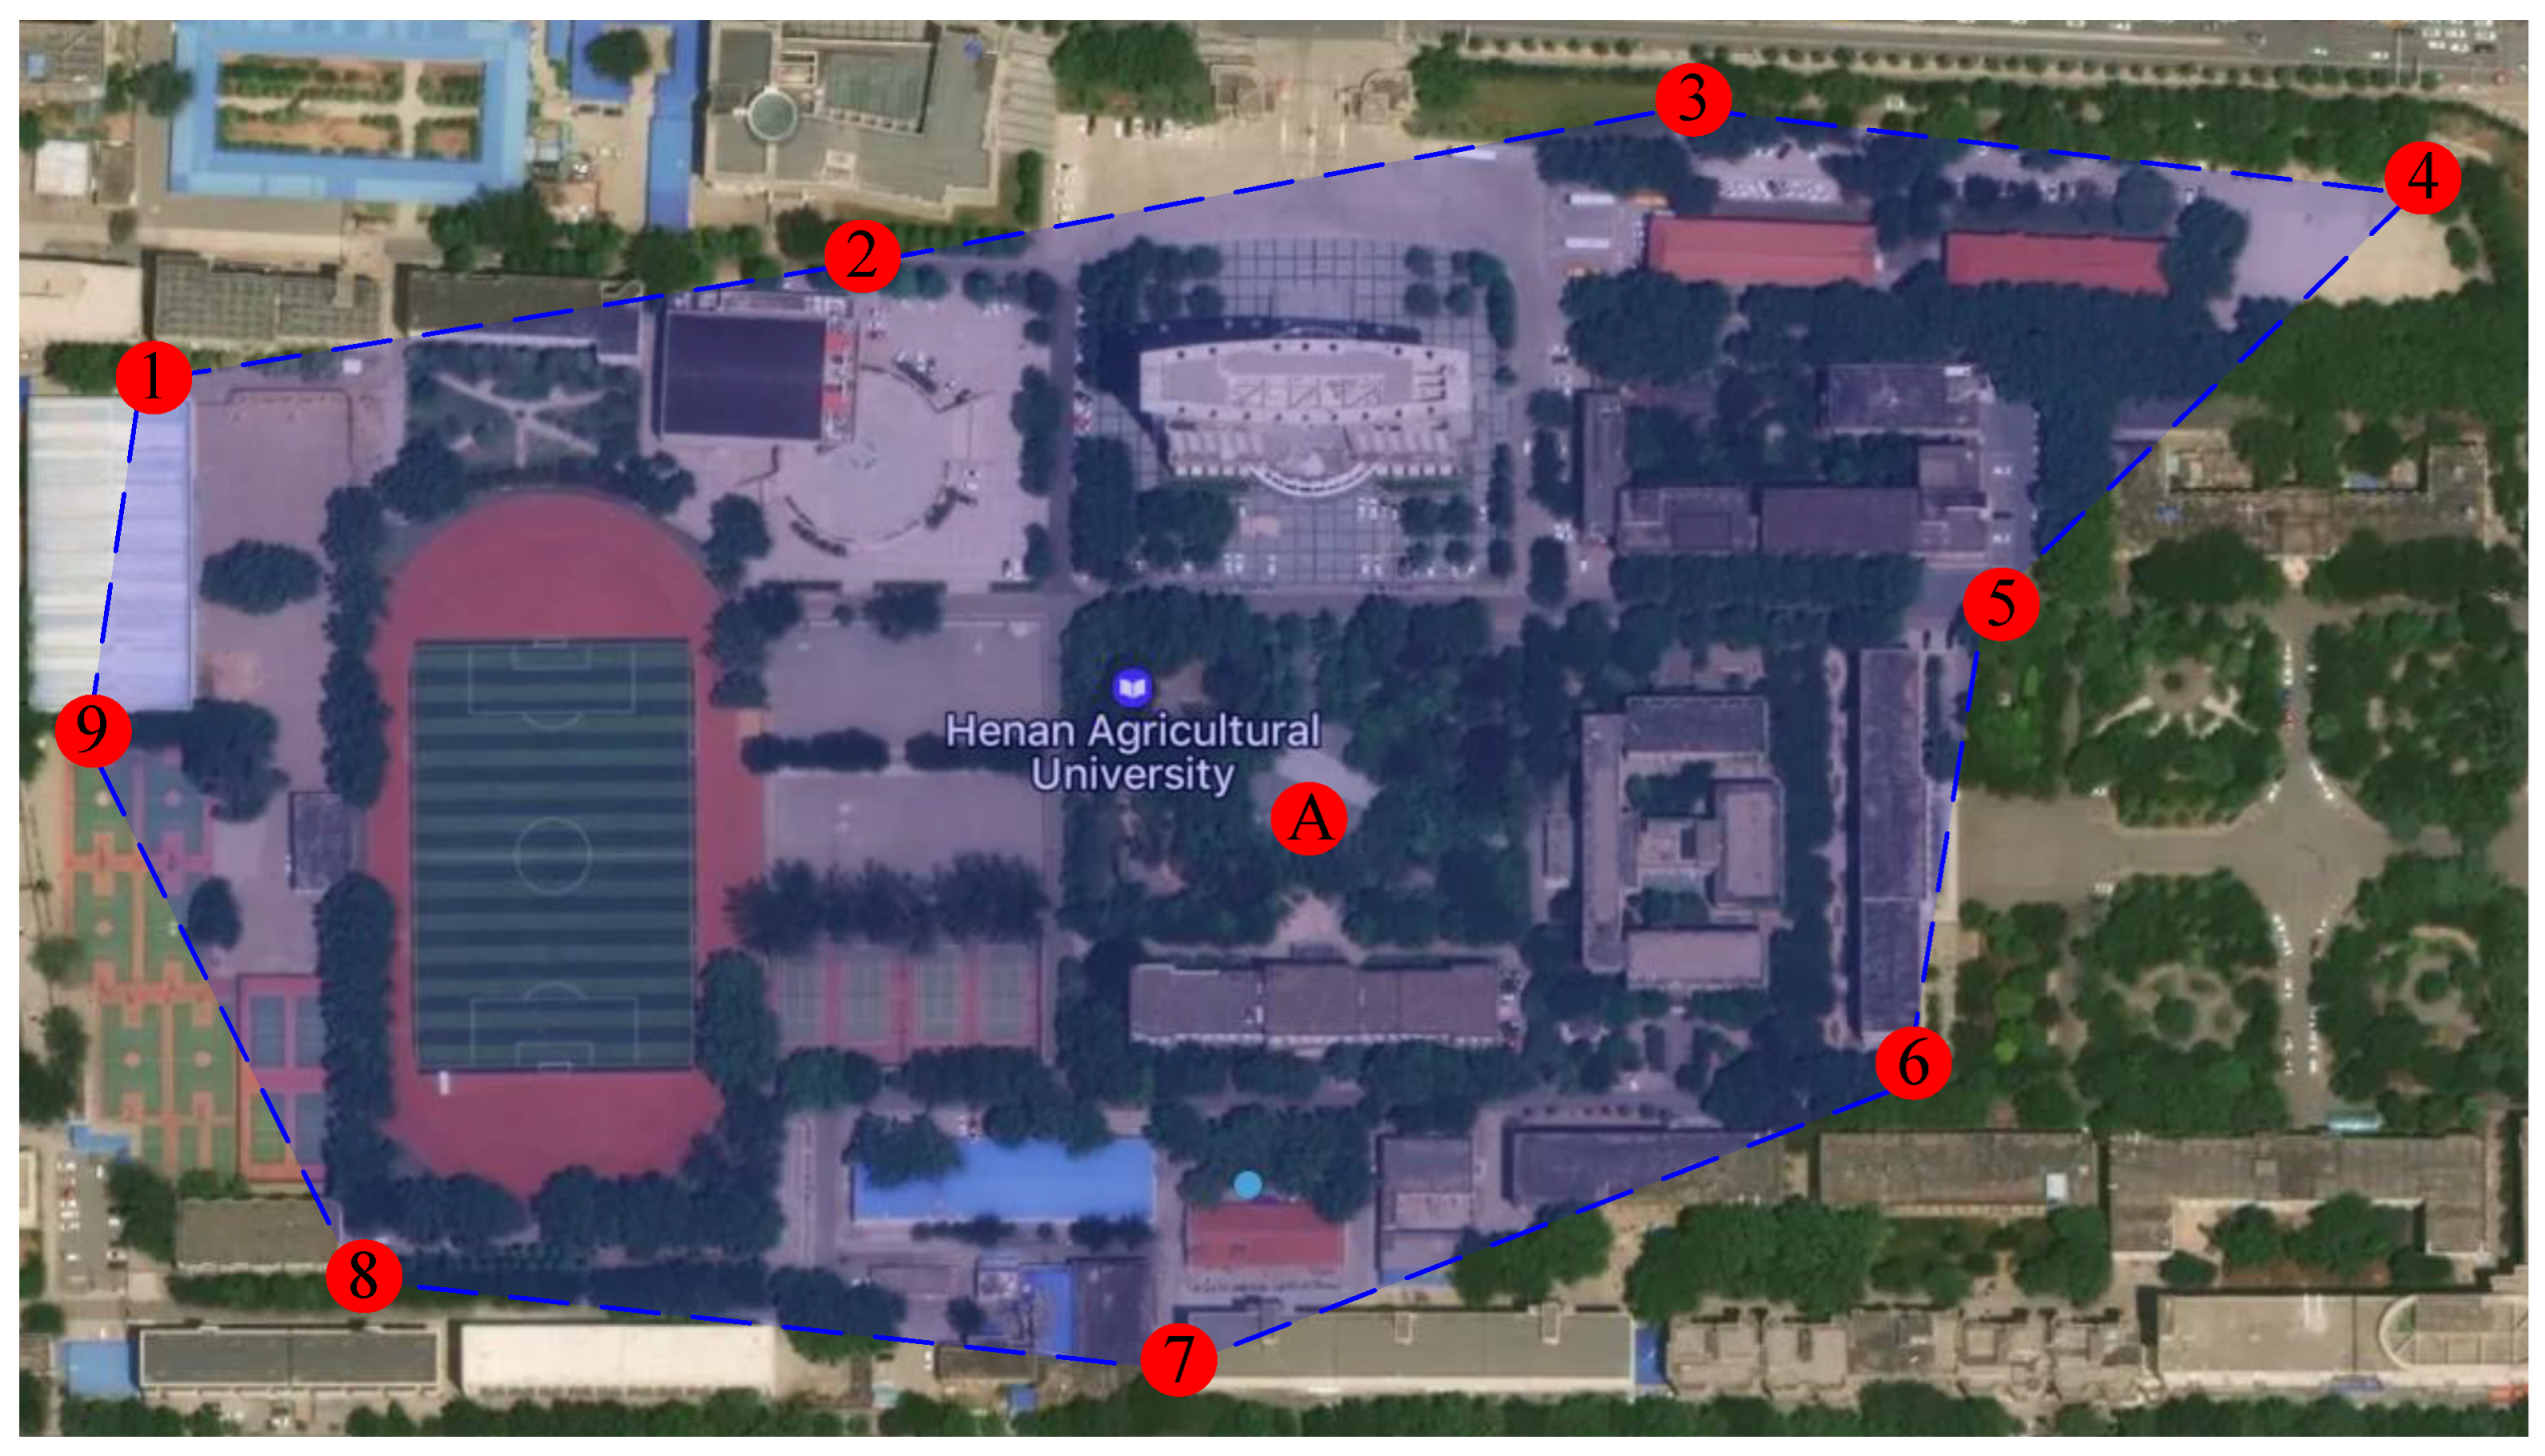
To analyze the data acquisition failure rate, as shown in Figure 15, experiments have been conducted on the Henan Agricultural University (HAU) campus in Zhengzhou, China. The red Point A at the center of the campus represents the location of the gateway server, and this location remains unchanged throughout the experiment. The red Points 1–9, distributed in different directions across the campus, represent the 1st–9th placement locations where the wireless sensor node can effectively communicate with the gateway server at Point A.
During the experiment, the weather was sunny with a gentle breeze, but the numerous buildings and trees on campus introduced interference in system performance testing. Each testing point underwent three repeated tests, with each test lasting 600 s. Using a sampling period of 2 s and a LoRa transfer rate of 62.5 kbps, the data acquisition failure rates are obtained in Table 4. Using the traditional method, the data acquisition failure rate is high, ranging from 21% to 25%. For example, when the wireless sensor node is placed at Point 1, which is 304 m away from Point A (where the gateway server is located), the data acquisition failure rate using the traditional method reaches as high as 24%.
To reduce the data acquisition failure rate, inspired by the time-out retransmission idea of the automatic repeat request (ARQ) scheme [36], a novel QADA method is proposed, which enables the STM32F103C8T6 MCU to dynamically adjust the number of query attempts to the soil sensors. The QADA works as follows: The MCU sends a query frame to the soil sensor and waits for the sensor to return a response frame. If the MCU receives the sensor’s response frame in a timely manner, it will then transmit the sensor data to the gateway server. If the MCU does not receive the sensor’s response frame within a preset time limit, it will initiate a time-out retransmission by sending the query frame to the sensor again. If the MCU receives a response frame from the sensor in this attempt, it discontinues retransmission. Otherwise, it continues retransmission. To avoid the issue of infinite query attempts caused by reasons such as sensor failures, the maximum number of query attempts is set to three. By dynamically changing the amount of query efforts, the QADA method can improve the packet transmission success rate of the wireless sensor node, thereby effectively reducing the data acquisition failure rate of the gateway server. As shown in Table 4, by employing the QADA method, the data acquisition failure rate has been significantly reduced to no more than 0.33%, which demonstrates the effectiveness of the proposed method.
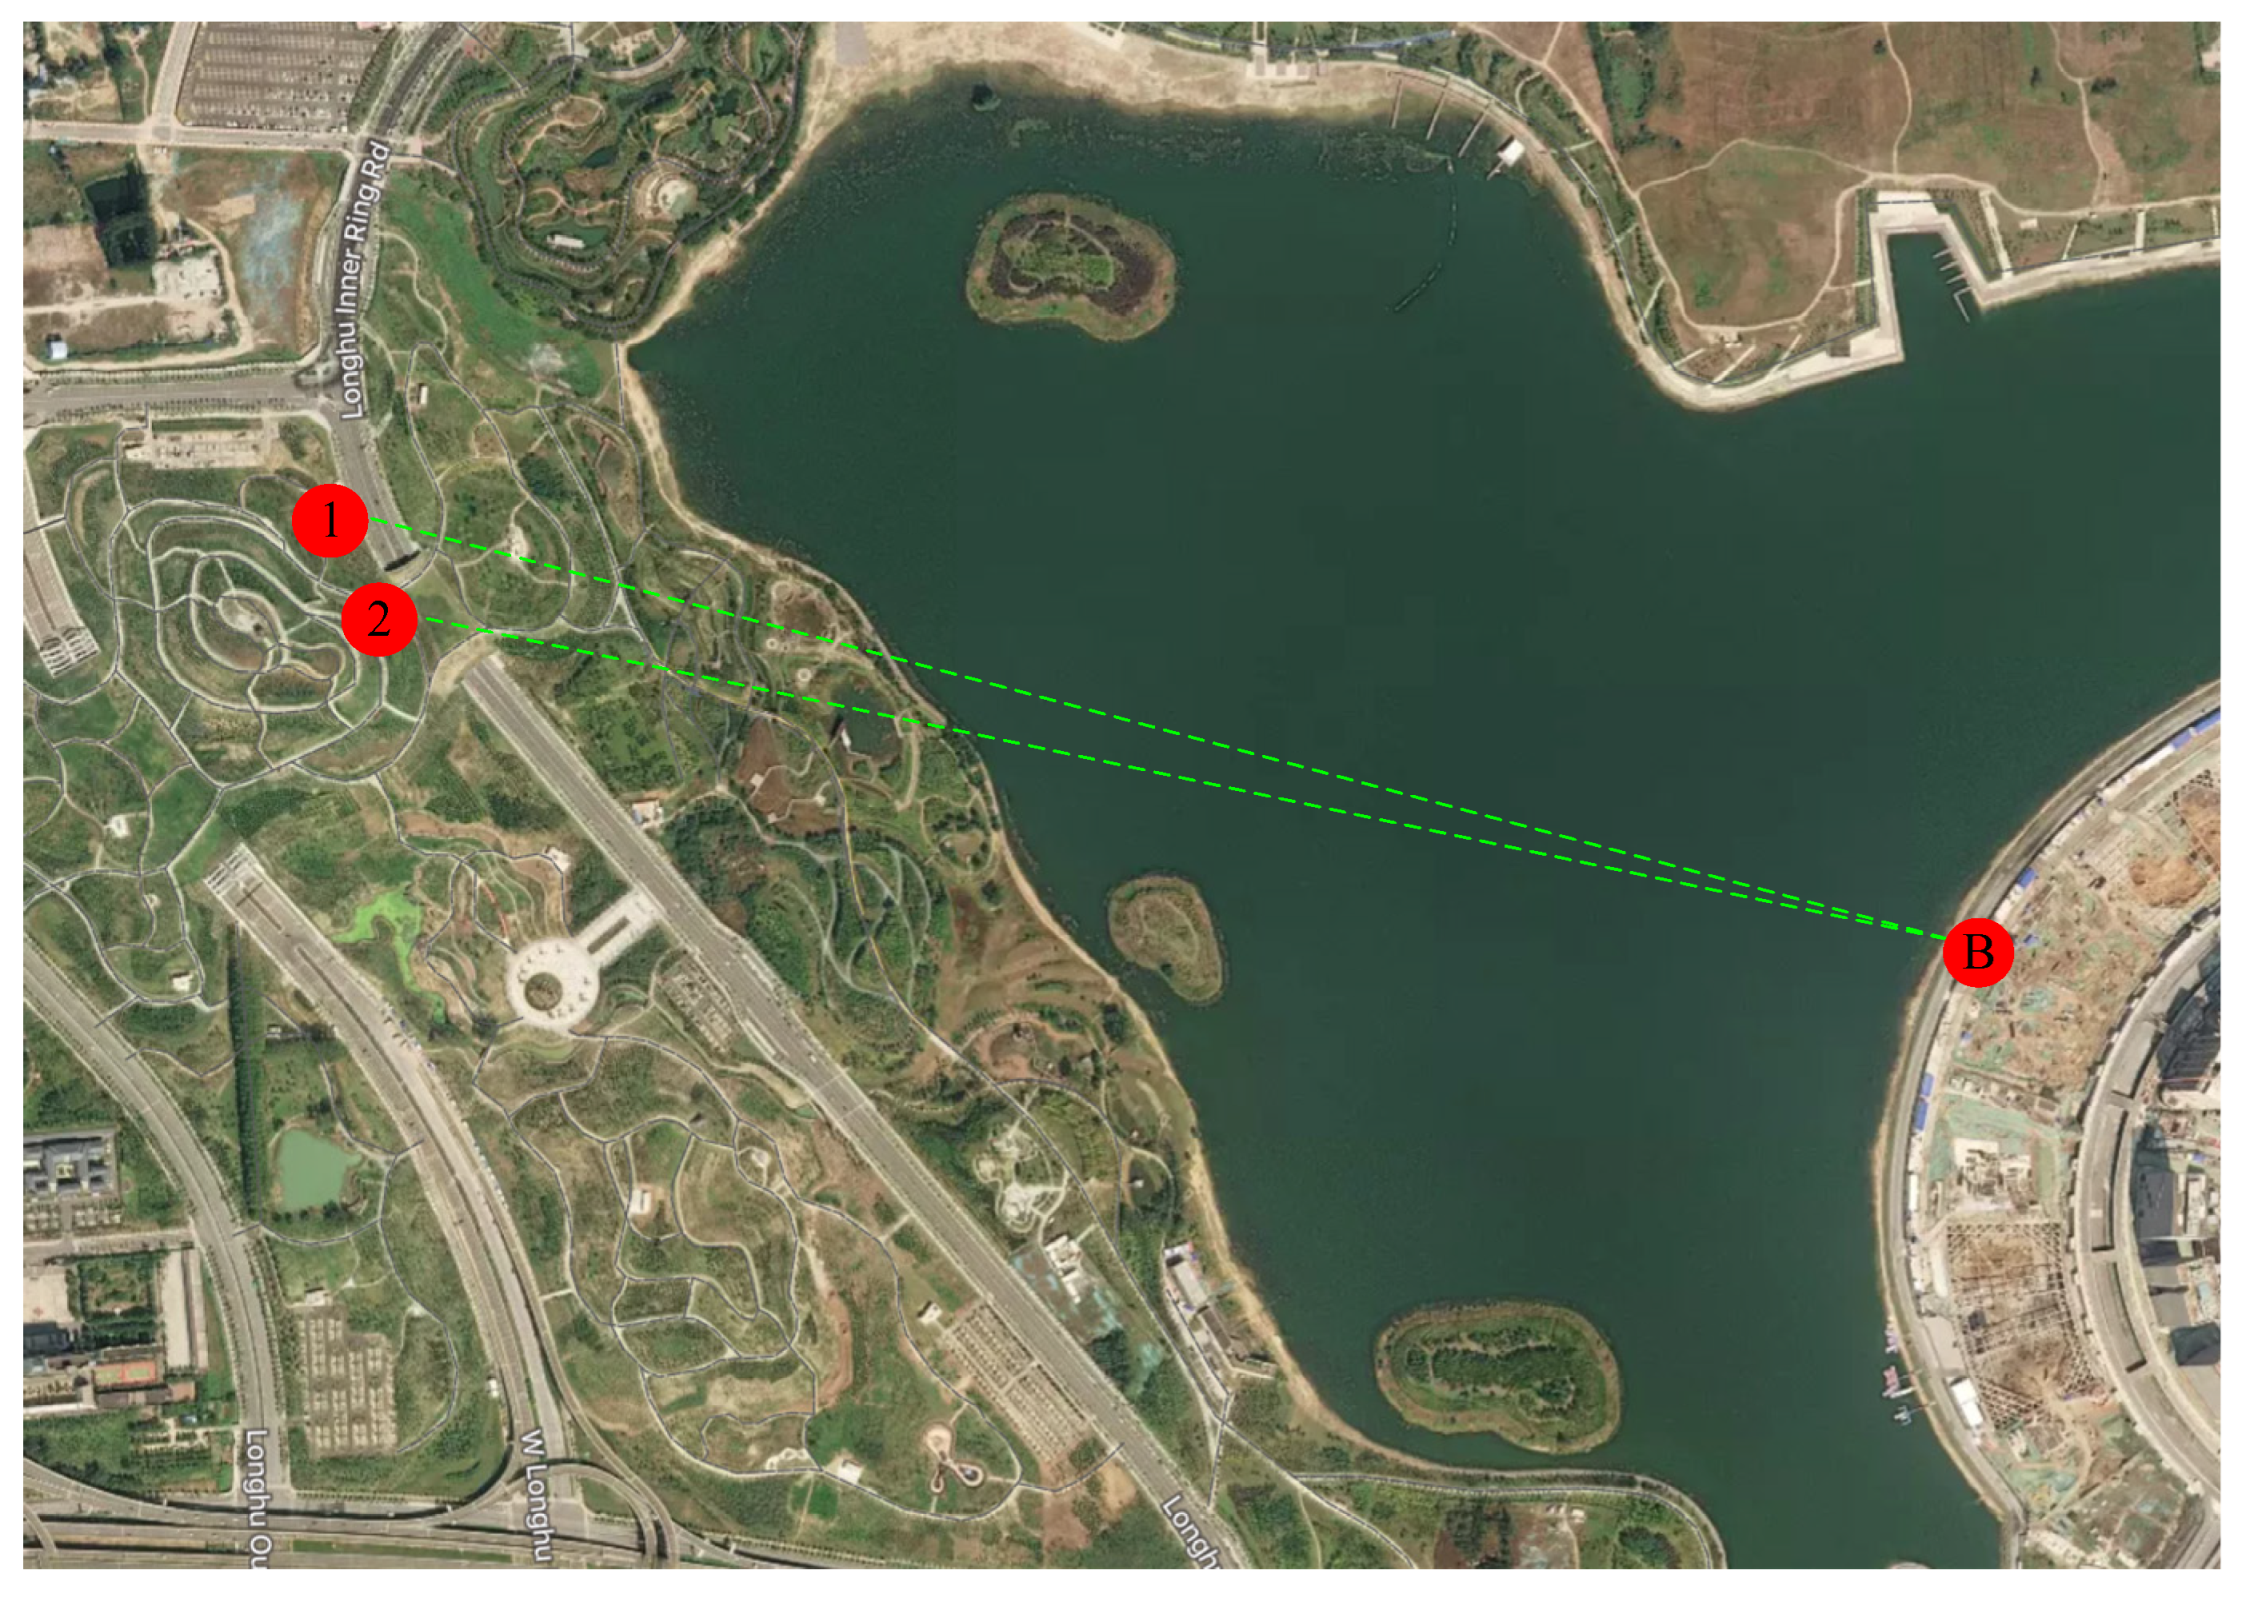
To further assess data acquisition performance in a long-distance scenario, as shown in Figure 16, experiments are conducted in Longhu Park, Zhengzhou City. The red Point B represents the location of the gateway server, and the red Points 1–2 indicate the first and second placement positions of the wireless sensor node, respectively. As shown in Table 5, although the distance between the gateway server and wireless sensor node reaches up to 1696 m, the data acquisition failure rate still does not exceed 0.33%, which demonstrates the effectiveness of the proposed method in a long-distance scenario.

5.3. Data Acquisition Delay

Delay is an important performance metric for networked systems [37]. Data acquisition delay τ is defined as
τ = t r t s
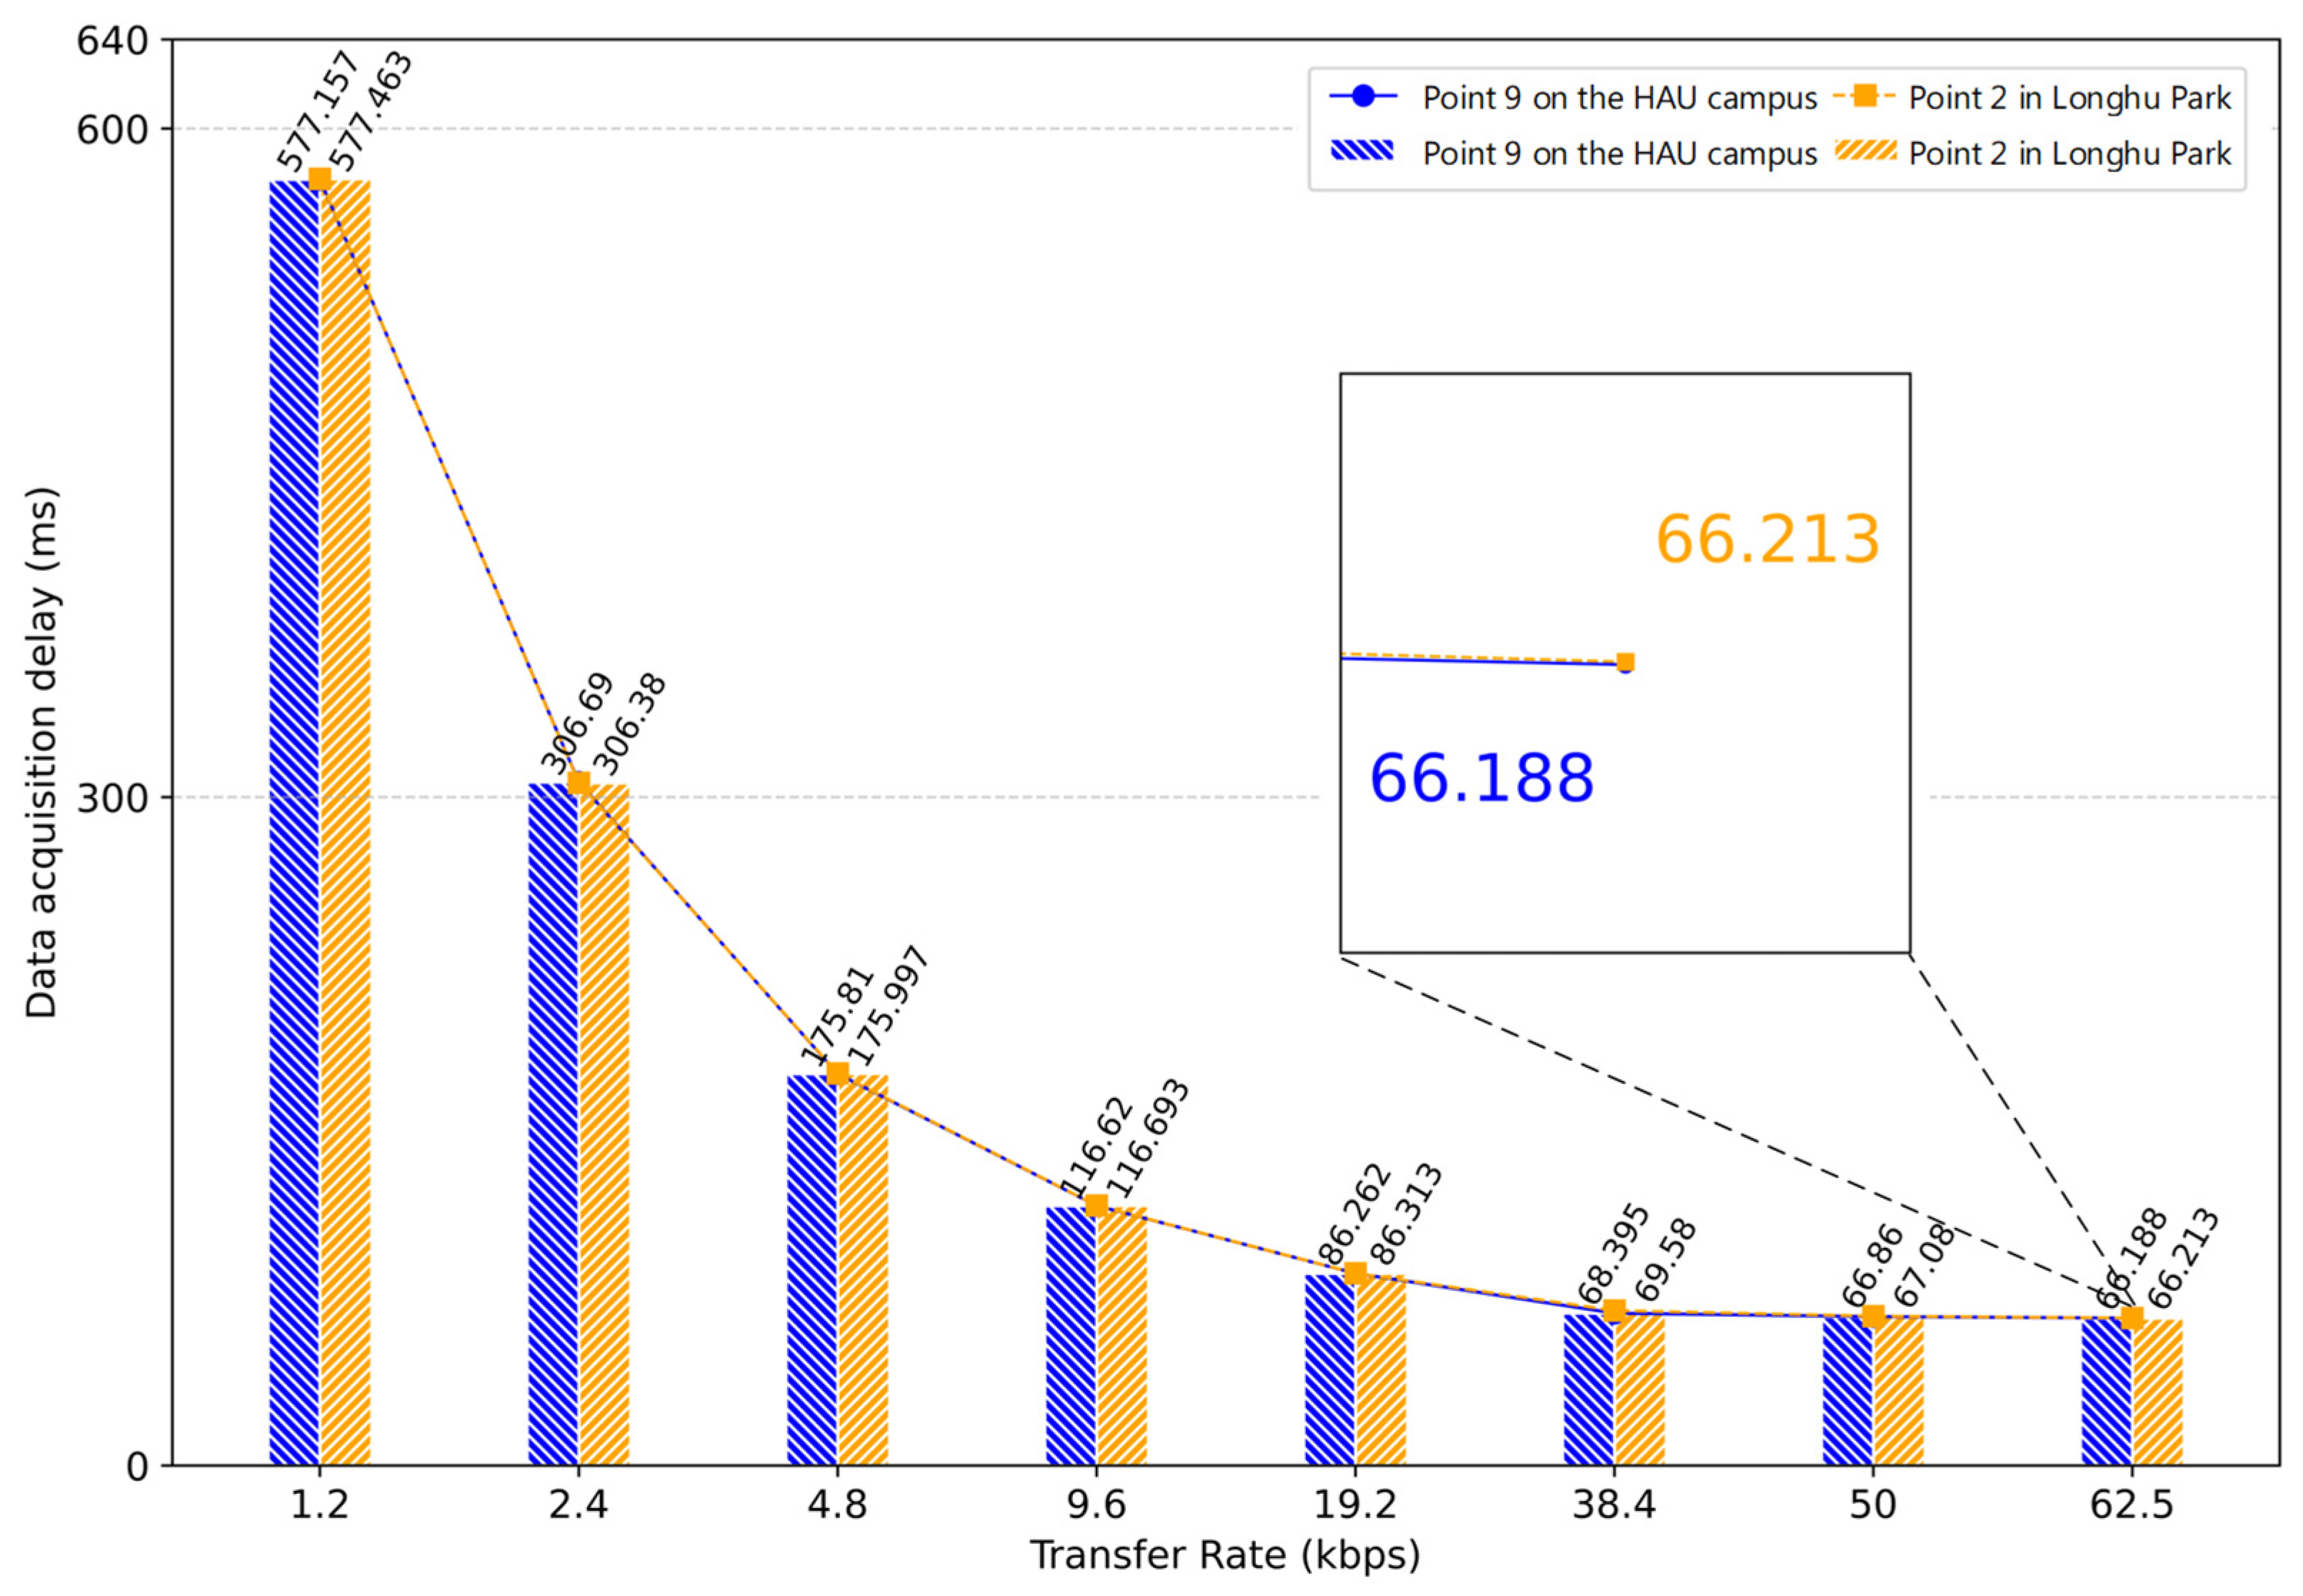
where t s indicates the instant when the gateway server issues a data acquisition command, and t r refers to the instant when the gateway server receives data returned by the wireless sensor node. To analyze data acquisition delay, experiments have been conducted at the HAU campus and Longhu Park. Using a sampling period of 1 s and different LoRa transfer rates, data acquisition delays are obtained in Figure 17.
For the experiment on the HAU campus, as shown in Figure 15, the gateway server is placed at Point A, and the wireless sensor node is placed at Point 9. As shown in Table 4, the distance between Point A and Point 9 is 307 m. As shown in Figure 17, when the LoRa transfer rates (in kbps) are set to 1.2, 2.4, 4.8, 9.6, 19.2, 38.4, 50, and 62.5, respectively, the corresponding data acquisition delays (in ms) are obtained as 577.157, 306.69, 175.81, 116.62, 86.262, 68.395, 66.86, and 66.188, respectively.
For the experiment in Longhu Park, as shown in Figure 16, the gateway server is placed at Point B, and the wireless sensor node is placed at Point 2. As shown in Table 5, the distance between Point B and Point 2 is 1696 m. As shown in Figure 17, when the LoRa transfer rates (in kbps) are set to 1.2, 2.4, 4.8, 9.6, 19.2, 38.4, 50, and 62.5, respectively, the corresponding data acquisition delays (in ms) are obtained as 577.463, 306.38, 175.997, 116.693, 86.313, 69.58, 67.08, and 66.213, respectively.
The experimental results show that when the LoRa transmission rate gradually increases from 1.2 kbps to 62.5 kbps, in the campus experiment, the data acquisition delay gradually decreases from 577.157 ms to 66.188 ms, and in the park experiment, it gradually decreases from 577.463 ms to 66.213 ms. That is to say, the data acquisition delay exhibits an inverse proportional variation relationship with the LoRa transfer rate. In the experiments, when the LoRa transmission rate is set to 62.5 kbps, the data acquisition delay can be reduced to below 67 ms.

5.4. Comparison with the Zigbee Method

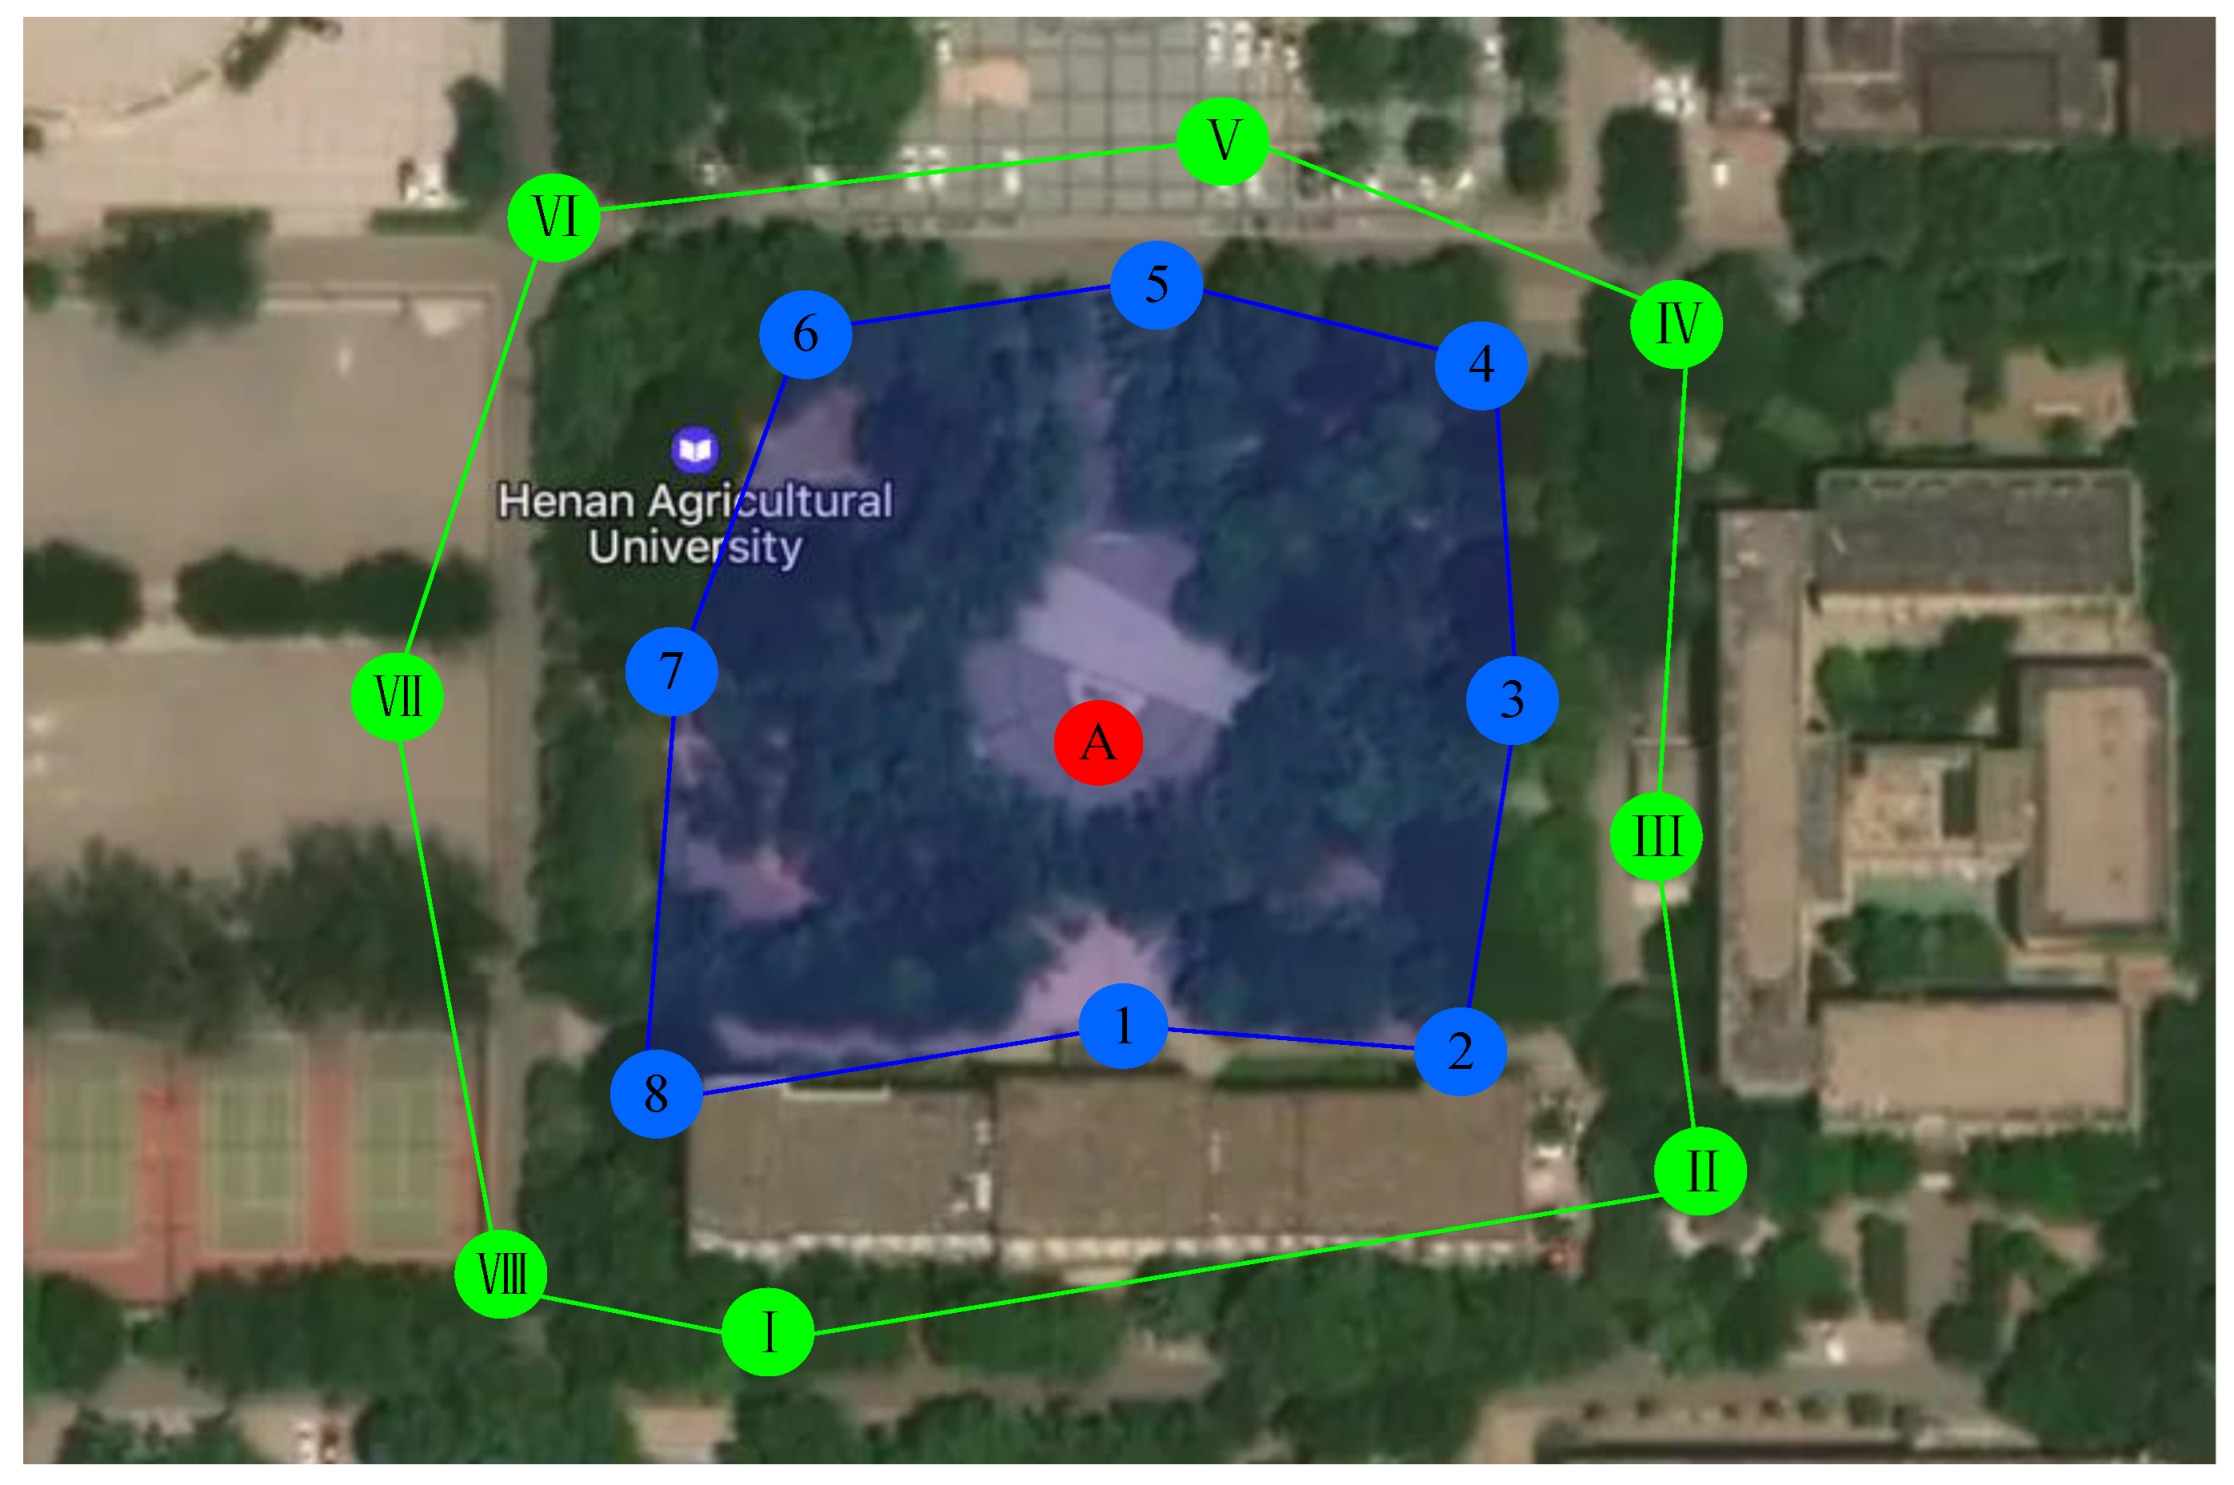
To compare the performance of Zigbee communication in [38,39] with that of LoRa communication in this paper, an experiment has been conducted on the HAU campus. As shown in Figure 18, Point A indicates the location of the gateway server, and Points 1–9 and Points I–VIII represent the placement positions of the wireless sensor nodes, respectively.
Using the Zigbee wireless communication component with chips CC2530 and CC2591, the experimental results regarding communication distance and data acquisition failure rate are shown in Table 6. For example, when the wireless sensor node is placed at Point 1, its distance from the gateway server at Point A is 37 m, and the data acquisition failure rate is 3.5%. Similarly, when the wireless sensor nodes are placed at Points 2–8, the data acquisition failure rates range between 2.0% and 4.0%. When the communication distance is increased, the data acquisition failure rate of the Zigbee method rises rapidly. For example, when the wireless sensor node is placed at Point I, its distance from the gateway server at Point A is 77 m, and the data acquisition failure rate reaches as high as 49.5%. Similarly, when the wireless sensor nodes are placed at Points II–VIII, the data acquisition failure rates increase to a range between 27.0% and 42.0%.
Compared with the aforementioned Zigbee experimental results, the LoRa method adopted in this paper (as depicted in Figure 15 and Table 4) offers a longer communication distance and a lower data acquisition failure rate. For example, when using the Zigbee method, as shown in Table 6, with a communication distance of Points I–VIII ranging from 66 to 87 m, the data acquisition failure rate can be as high as 27.0% to 49.5%. Using the same HAU campus experimental environment, when employing the LoRa method in this paper, as shown in Table 4, with a communication distance ranging from 145 to 315 m, the data acquisition failure rate drops to as low as 0.33% or even less, which verifies the advantages of the LoRa method in this paper in terms of long communication distance and low data acquisition failure rate.

5.5. Multi-Node Soil Detecting System

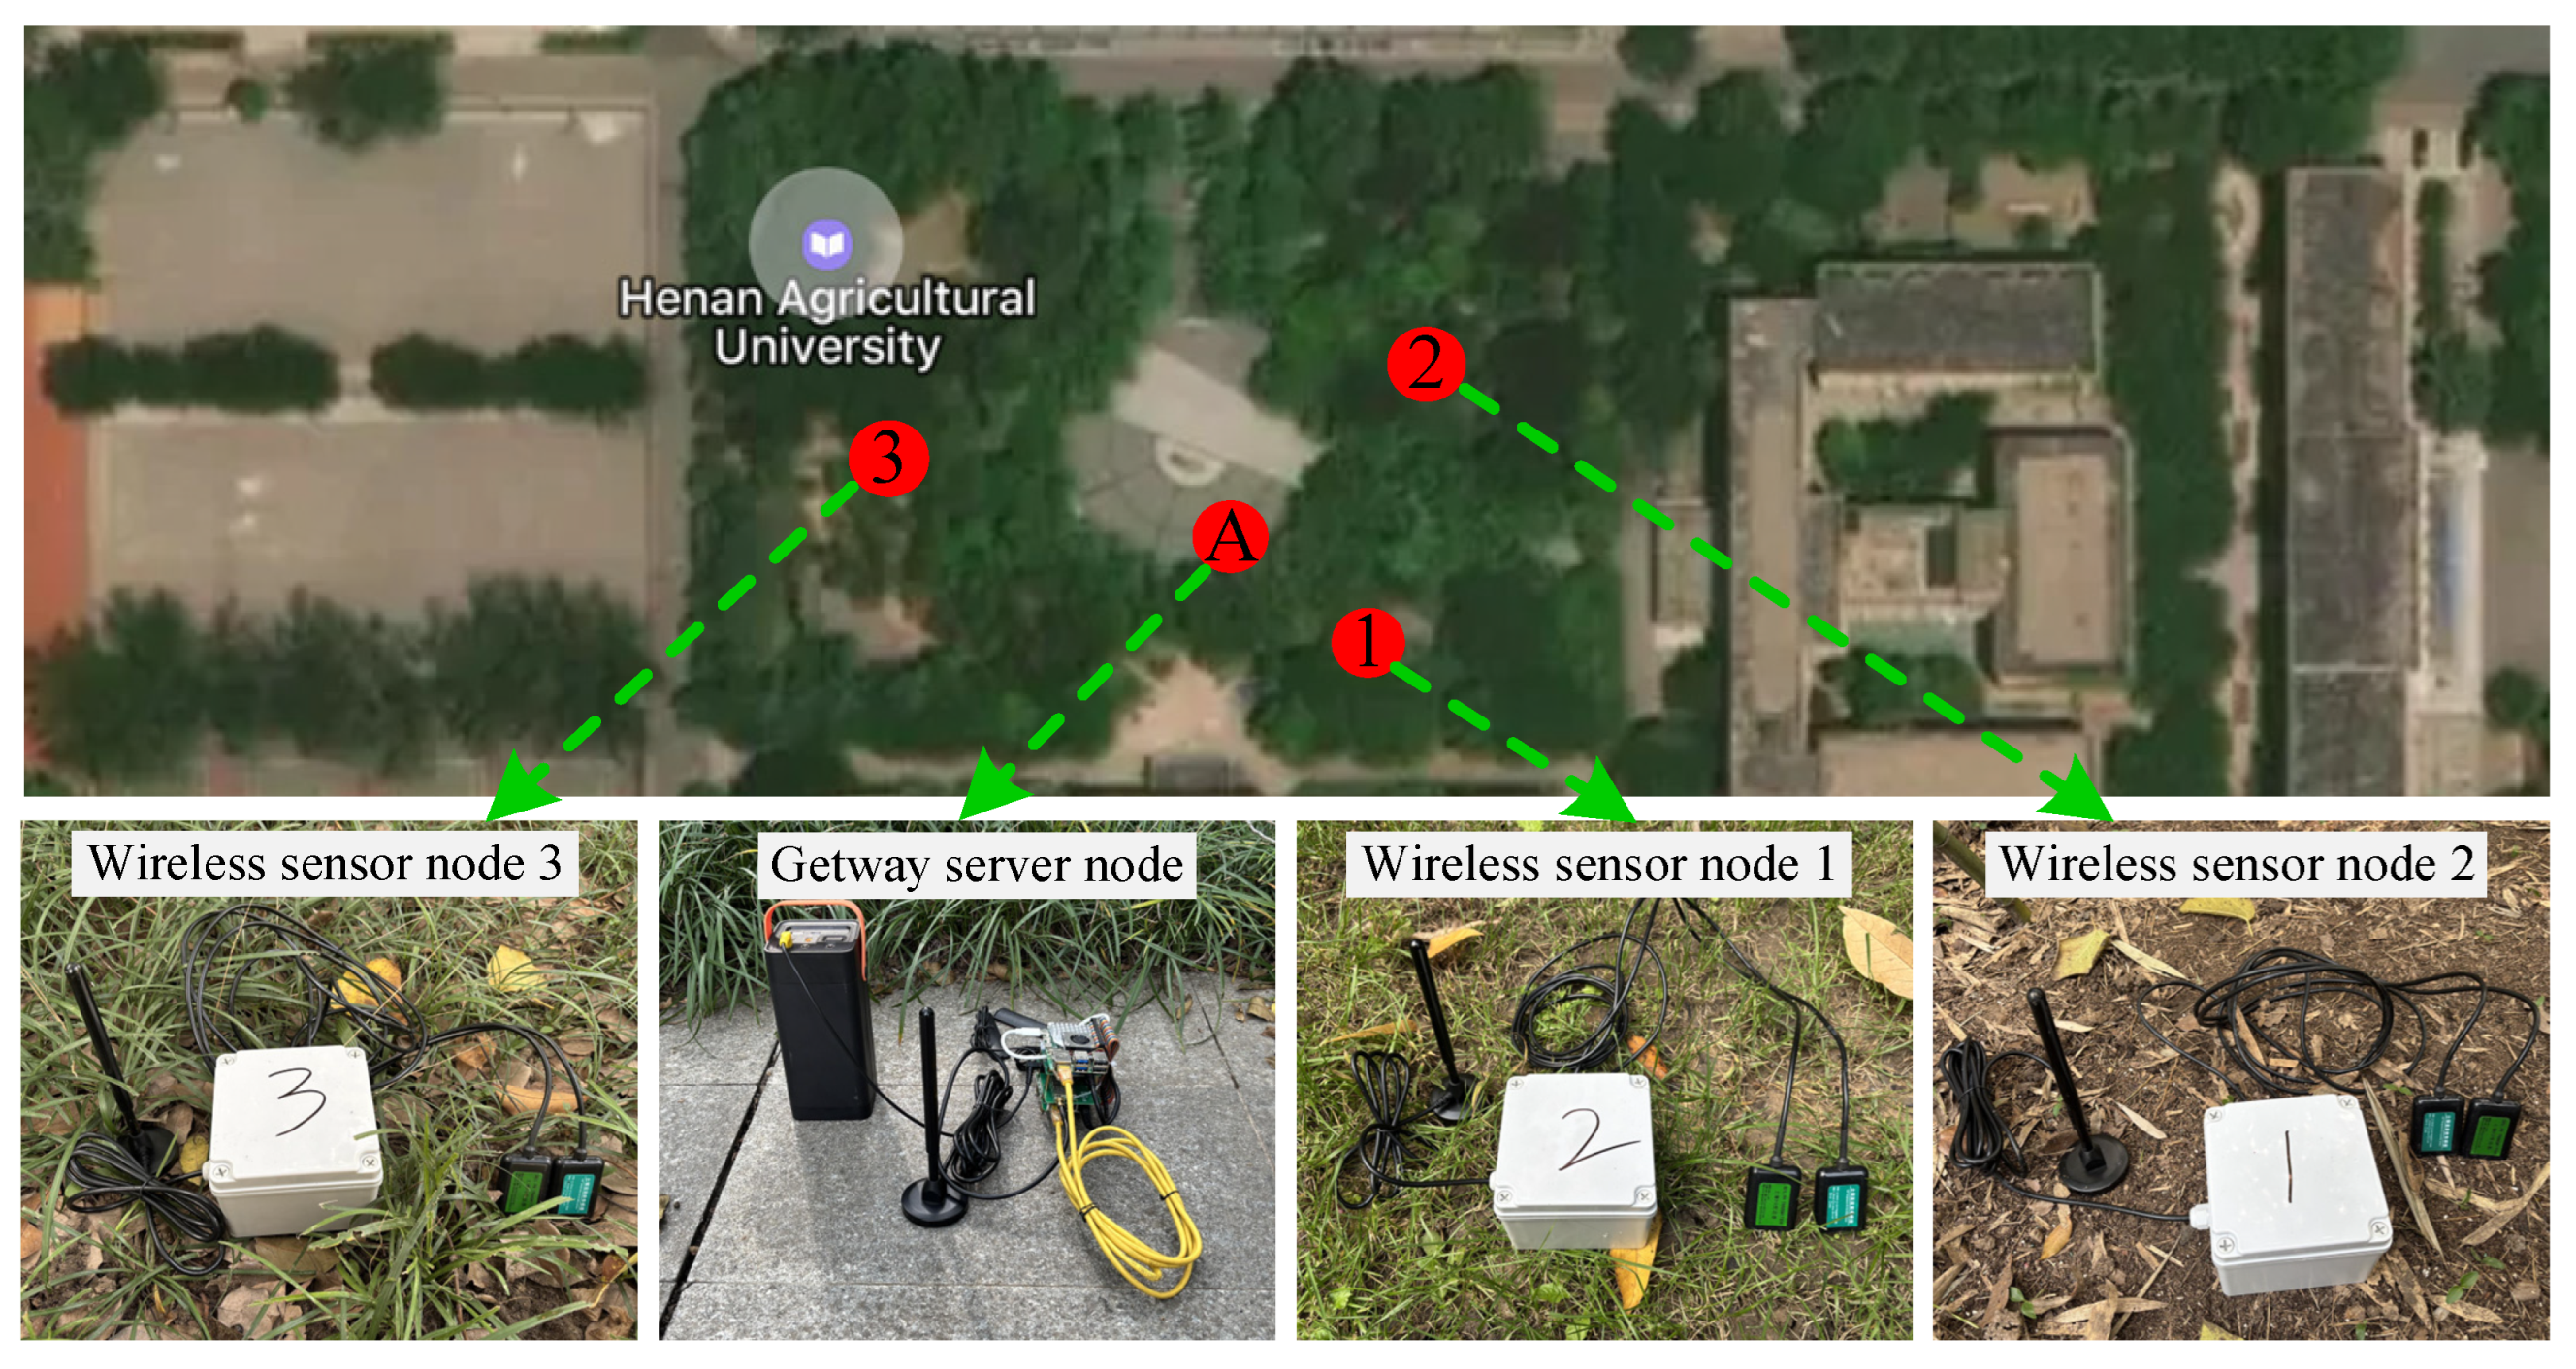
As shown in Figure 19, the experiment of the multi-node soil detecting system has been conducted on the HAU campus, where the gateway server is placed at Point A, and three wireless sensor nodes are positioned at Points 1–3, respectively. The gateway server is capable of communicating with the three wireless sensor nodes via LoRa and addresses 0x05,0x06, and 0x07, collecting and storing the soil information detected by these sensor nodes.
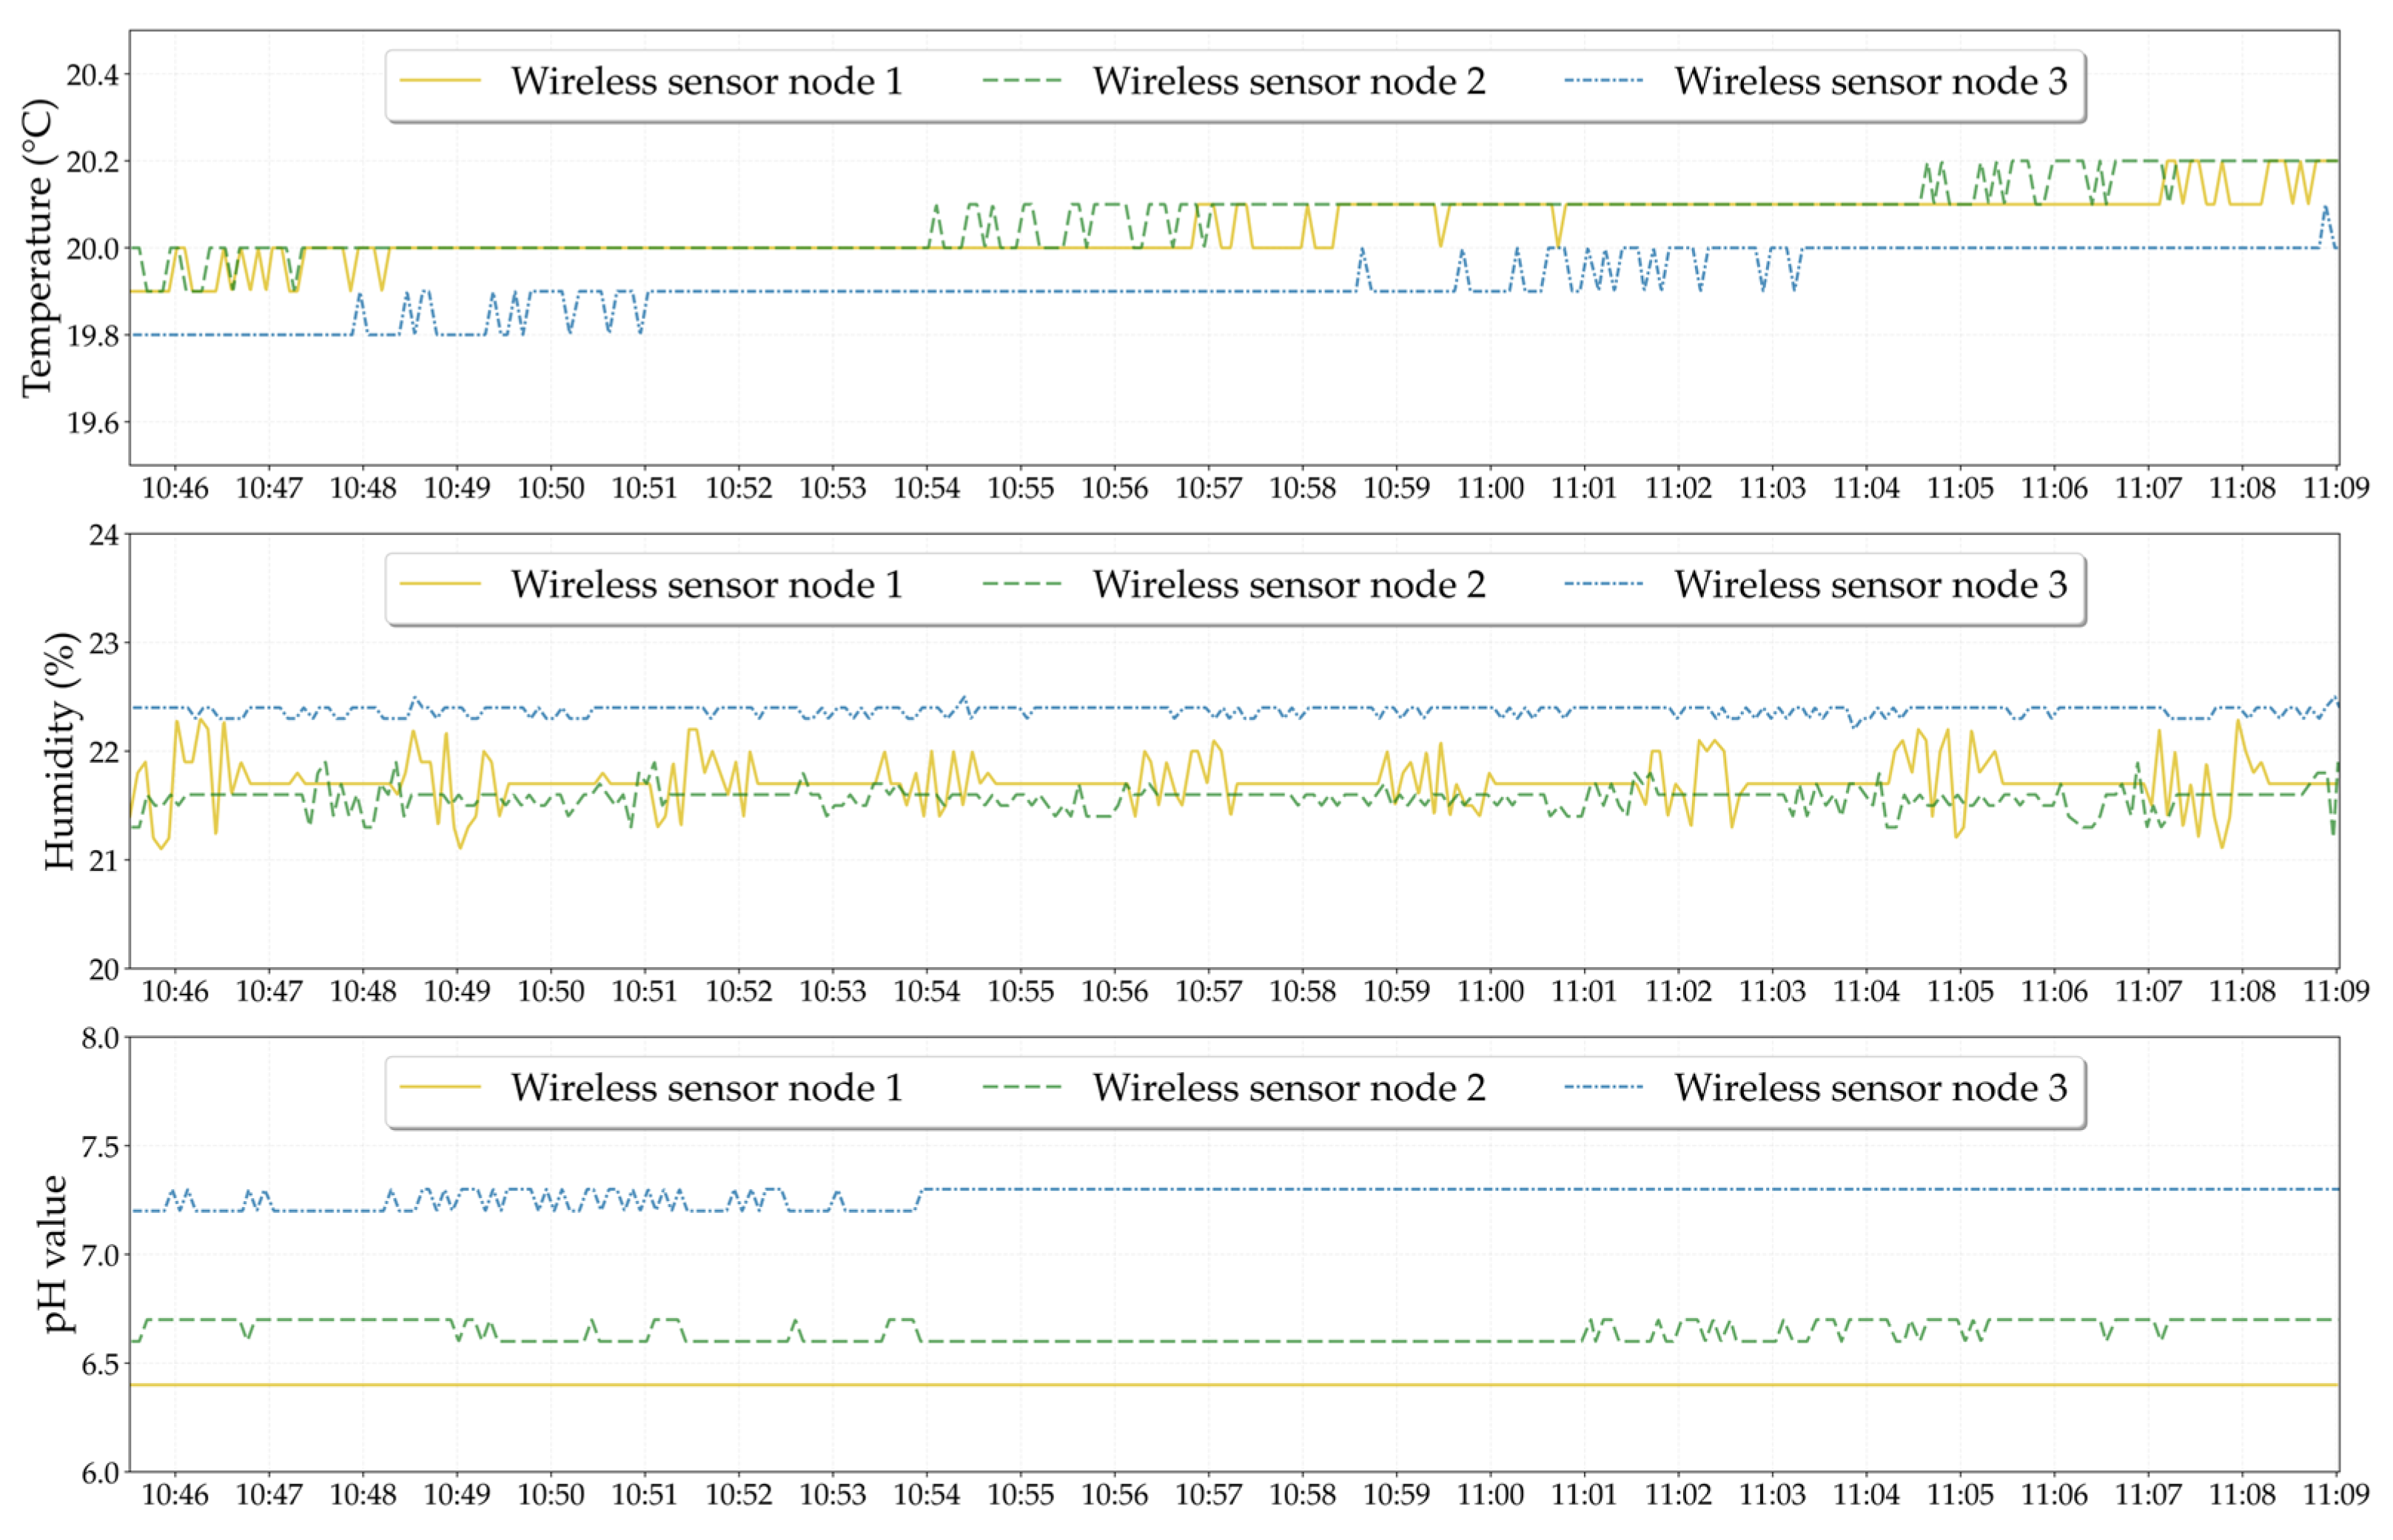
As illustrated in Figure 20, users can view soil temperature, humidity, and pH value information from Points 1–3 in a unified platform. For example, at 11:00 a.m., the soil data detected by the three sensor nodes at Points 1–3 were as follows: soil temperatures were 20.1 °C (at Point 1), 20.1 °C (at Point 2), and 19.9 °C (at Point 3); soil humidity levels were 21.7% (at Point 1), 21.6% (at Point 2), and 22.4% (at Point 3); and soil pH values were 6.4 (at Point 1), 6.6 (at Point 2), and 7.3 (at Point 3). The multi-node soil detecting system offers a multi-point and multi-dimensional measurement platform for gaining a comprehensive understanding of farmland soil information.

6. Conclusions

This paper develops an IoT-based PV-powered soil remote monitoring system with a low data acquisition failure rate and delay, which mainly encompasses the design of the gateway server node, wireless sensor nodes, a remote monitoring platform, and PV power modules. For the gateway server with the Django framework, the Raspberry Pi 5 sends data acquisition commands to the wireless sensor node via LoRa, receives sensor data, and stores them with timestamp in a MySQL database. Using a remote monitoring platform based on HTML, CSS, and JavaScript, together with a 4G/Wi-Fi router unit and a NAT traversal technique, Internet users can remotely monitor soil status. For the wireless sensor node, the STM32F103C8T6 MCU receives data acquisition commands from the gateway server via LoRa, drives sensors to detect soil temperature, humidity, and pH value, and sends them back to the gateway server. The PV power modules are designed to provide energy to the gateway server and wireless sensor nodes, respectively. Experiments have been conducted at the HAU campus and Longhu park, which confirm the advantages of the proposed IoT-based PV-powered soil remote monitoring system as follows. By using the IoT-based system architecture, users can remotely view real-time and historical information on soil temperature, humidity, and pH value via the Internet. By applying the designed improved QADA method, the data acquisition failure rate can be significantly reduced from 21–25% to no more than 0.33%. Based on the obtained inverse relationship between the data acquisition delay and the LoRa transfer rate, by setting a high LoRa transfer rate of 62.5 kbps, the data acquisition delay can be reduced to below 67 ms. By utilizing both a PV new energy system and lithium batteries for power supply, the system significantly enhances its endurance capacity.
Although the proposed monitoring system has the aforementioned advantages, it still has the following limitations: sensing accuracy can be affected by soil environments, the cost for system development and maintenance is relatively high, and data security is not given enough attention. In the future, we will strive to enhance system stability, reduce system cost, and strengthen data security. Based on the soil data acquired by the proposed system, machine learning and deep learning can be applied to soil information prediction and cloud data analysis. In addition, by leveraging distributed collaboration and privacy protection mechanisms, federated learning can effectively address challenges such as data silos and privacy breaches, which exhibits promising application prospects in smart agriculture.

Author Contributions

Conceptualization, F.L. and L.G.; methodology, F.L., Z.L. and L.G.; validation, Z.L. and L.G.; formal analysis, Z.L. and L.G.; writing—original draft preparation, F.L., Z.L. and L.G.; writing—review and editing, F.L., L.G. and C.P.; supervision, F.L., L.G. and C.P.; project administration, F.L., L.G. and C.P. All authors have read and agreed to the published version of the manuscript.

Funding

This research was funded by National Natural Science Foundation of China grant number. 61703146, 62173218; Science and Technology Project in Henan Province grant number 232102110268, 252102211077.

Data Availability Statement

Data are contained within the article.

Conflicts of Interest

The authors declare no conflicts of interest.

References

  1. Qian, M.; Qian, C.; Xu, G.; Tian, P.; Yu, W. Smart irrigation systems from Cyber–Physical perspective: State of art and future directions. Future Internet 2024, 16, 234. [Google Scholar] [CrossRef]
  2. Loukatos, D.; Fragkos, A.; Kargas, G.; Arvanitis, K.G. Implementation and evaluation of a low-cost measurement platform over LoRa and applicability for soil monitoring. Future Internet 2024, 16, 443. [Google Scholar] [CrossRef]
  3. Volosciuc, C.; Bogdan, R.; Blajovan, B.; Stângaciu, C.; Marcu, M. GreenLab, An IoT-based small-scale smart greenhouse. Future Internet 2024, 16, 195. [Google Scholar] [CrossRef]
  4. Chereches, I.A.; Gaspar, F.; Danci, I.A. Designing and calibration of a low-cost multi-point soil moisture monitoring system for precision agriculture. INMATEH Agric. Eng. 2024, 72, 245–254. [Google Scholar] [CrossRef]
  5. Cotrim, R.; Assis, F.; Brito, A.D.S.; Peixouto, Y.S.; Peixouto, L.S. Multi-hop LoRa-based underground network for monitoring soil moisture in agriculture. Comput. Electron. Agric. 2024, 227, 109592. [Google Scholar] [CrossRef]
  6. Rueda-Delgado, D.; Cuellar-Torres, F.; Martinez, D.; Narducci, M.S. Instrumentation system for monitoring of soil variables in precision agriculture applications. IEEE Access 2025, 13, 49777–49787. [Google Scholar] [CrossRef]
  7. Awais, M.; Chen, Y.; Zhang, W.; Naqvi, S.M.Z.A.; Zhang, H.; Raghavan, V.; Hu, J.; Tlili, I. Experimental validation of an automated soil leachate monitoring system for agricultural non-point source pollution and nutrient run-off to water bodies. Ain Shams Eng. J. 2025, 16, 103713. [Google Scholar] [CrossRef]
  8. Gao, Y.; Hu, Q.; Hui, J.; Chang, L.; Zeng, M.; Jiang, Q. Real-time monitoring of soil moisture in cotton fields using electromagnetic induction technology. Agric. Water Manag. 2025, 313, 109466. [Google Scholar] [CrossRef]
  9. Baumbauer, C.L.; Baumbauer, D.A.; Arias, A.C. The effect of soil water content and crop canopy on passive UHF-RFID wireless links. Comput. Electron. Agric. 2025, 237, 110506. [Google Scholar] [CrossRef]
  10. Mashhadany, Y.A.; Alsanad, H.R.; Al-Askari, M.A.; Algburi, S.; Taha, B.A. Irrigation intelligence-enabling a cloud-based Internet of Things approach for enhanced water management in agriculture. Environ. Monit. Assess. 2024, 196, 438. [Google Scholar] [CrossRef]
  11. Nguyen, T.H.; Yu, H.; Muller, E.; Askey, S.; Van Der Markt, M.; Sukkarieh, S. A heterogeneous sensing system for soil moisture mapping in agricultural environments. Comput. Electron. Agric. 2025, 239, 110932. [Google Scholar] [CrossRef]
  12. Kamarianakis, Z.; Perdikakis, S.; Daliakopoulos, I.N.; Papadimitriou, D.M.; Panagiotakis, S. Design and implementation of a low-cost, linear robotic camera system, targeting greenhouse plant growth monitoring. Future Internet 2024, 16, 145. [Google Scholar] [CrossRef]
  13. Akilan, T.; Baalamurugan, K.M. Automated weather forecasting and field monitoring using GRU-CNN model along with IoT to support precision agriculture. Expert Syst. Appl. 2024, 249, 123468. [Google Scholar] [CrossRef]
  14. Sonata, I.; Arifin, Y. Enhancing smart agriculture using Internet of Things and transformer model. Int. J. Innov. Comput. Inf. Control. 2025, 21, 515–531. [Google Scholar]
  15. Kaur, A.; Bhatt, D.P.; Raja, L. Developing a hybrid irrigation system for smart agriculture using IoT sensors and machine learning in Sri Ganganagar, Rajasthan. J. Sens. 2024, 2024, 676907. [Google Scholar] [CrossRef]
  16. Oguz, F.E.; Ekersular, M.N.; Sunnetci, K.M.; Alkan, A. Enabling smart agriculture: An IoT-based framework for real-time monitoring and analysis of agricultural data. Agric. Res. 2024, 13, 574–585. [Google Scholar] [CrossRef]
  17. Gómez-Gijón, S.; Salmerón, J.F.; Falco, A.; Loghin, F.C.; Lugli, P.; Morales, D.P.; Rodríguez, N.; Rivadeneyra, A. Printed RFID sensing system: The cost-effective way to IoT smart agriculture. Comput. Electron. Agric. 2025, 232, 110116. [Google Scholar] [CrossRef]
  18. Maity, T.; Paul, S.; Samanta, J.; Saha, P. Design and development of IoT-based SmartTech-Agri devices for smart agriculture crop field. J. Inst. Eng. Ser. B 2024, 105, 753–762. [Google Scholar] [CrossRef]
  19. Afzal, M.; Saeed, I.A.; Sohail, M.N.; Saad, M.H.M.; Sarker, M.R. IoT-enabled adaptive watering system with ARIMA-based soil moisture prediction for smart agriculture. IEEE Access 2025, 13, 27714–27728. [Google Scholar] [CrossRef]
  20. Manzano, J.M.; Orihuela, L.; Pacheco, E.; Pereira, M. Data-driven spatio-temporal estimation of soil moisture and temperature based on lipschitz interpolation. ISA Trans. 2025, 156, 535–550. [Google Scholar] [CrossRef]
  21. Balasubramanian, A.; Elangeswaran, S.V.J. A novel power aware smart agriculture management system based on RNN-LSTM. Electr. Eng. 2025, 107, 2347–2368. [Google Scholar] [CrossRef]
  22. Malone, B.; Biggins, D.; Sharman, C.; Searle, R.; Glover, M.; Brown, S. An experiential account with recommendations for the design, installation, operation and maintenance of a farm-scale soil moisture sensing and mapping system. Soil Res. 2024, 62, SR24004. [Google Scholar] [CrossRef]
  23. Dafonte, J.; González, M.Á.; Comesaña, E.; Teijeiro, M.T.; Cancela, J.J. Soil water status monitoring system with proximal low-cost sensors and LoRa technology for smart water irrigation in woody crops. Sensors 2024, 24, 8104. [Google Scholar] [CrossRef] [PubMed]
  24. Diaz, F.J.; Ahmad, A.; Parra, L.; Sendra, S.; Lloret, J. Low-cost optical sensors for soil composition monitoring. Sensors 2024, 24, 1140. [Google Scholar] [CrossRef] [PubMed]
  25. Raina, R.; Singh, K.J.; Kumar, S. Power efficient and long range precision agriculture monitoring system. IEEE J. Radio Freq. Identif. 2025, 9, 330–339. [Google Scholar] [CrossRef]
  26. Comegna, A.; Hassan, S.B.M.; Coppola, A. Recent technological upgrades to the SHYPROM IoT-based system for monitoring soil water status. Sensors 2025, 25, 4934. [Google Scholar] [CrossRef]
  27. Mansour, M.; Gamal, A.; Ahmed, A.I.; Said, L.A.; Elbaz, A.; Herencsar, N.; Soltan, A. Internet of Things: A comprehensive overview on protocols, architectures, technologies, simulation tools, and future directions. Energies 2023, 16, 3465. [Google Scholar] [CrossRef]
  28. Abdelwahed, S.H.; Hefny, I.M.; Hegazy, M.; Said, L.A.; Soltan, A. Survey of IoT multi-protocol gateways: Architectures, protocols and cybersecurity. Internet Things 2025, 33, 101703. [Google Scholar] [CrossRef]
  29. Tang, P.; Liang, Q.; Li, H.; Pang, Y. Application of Internet-of-Things Wireless Communication Technology in Agricultural irrigation Management: A review. Sustainability 2024, 16, 3575. [Google Scholar] [CrossRef]
  30. Xu, Z.; Yu, G.; Luo, Y.; Jiang, H. An energy-efficient scheme for waking co-channel TDMA in LoRa networks via the integration of bidirectional timestamp correction and address recognition. Future Internet 2025, 17, 369. [Google Scholar] [CrossRef]
  31. Luo, Y.-Y.; Chiu, Y.-H.; Cheng, C.-H. Detection and mitigation in IoT ecosystems using One M2M architecture and edge-based machine learning. Future Internet 2025, 17, 411. [Google Scholar] [CrossRef]
  32. Salunke, S.V.; Ouda, A. A performance benchmark for the PostgreSQL and MySQL databases. Future Internet 2024, 16, 382. [Google Scholar] [CrossRef]
  33. Zhang, P.; Wang, R.; Shi, N. IgA nephropathy prediction in children with machine learning algorithms. Future Internet 2020, 12, 230. [Google Scholar] [CrossRef]
  34. Fahrudin, T.M.; Funabiki, N.; Brata, K.C.; Naing, I.; Aung, S.T.; Muhaimin, A.; Prasetya, D.A. An improved reference paper collection system using web scraping with three enhancements. Future Internet 2025, 17, 195. [Google Scholar] [CrossRef]
  35. Yang, H.; Peng, C.; Cao, Z. Attack-model-independent stabilization of networked control systems under a jump-like TOD scheduling protocol. Automatica 2023, 152, 110982. [Google Scholar] [CrossRef]
  36. Lin, S.; Costello, D.J.; Miller, M.J. Automatic-repeat-request error-control schemes. IEEE Commun. Mag. 1984, 22, 5–17. [Google Scholar] [CrossRef]
  37. Yang, H.; Peng, C.; Cao, Z.; Zhang, X.-M. A novel semantic-based multi-packet parallel transmission scheme for networked control systems. Automatica 2025, 174, 112120. [Google Scholar] [CrossRef]
  38. Yan, R.; He, X.; Wang, Z.; Wang, Y.; Li, Z.; Li, X. A compact autonomous inspection system for greenhouse environmental information sensing and three-dimensional visualization. Comput. Electron. Agric. 2025, 231, 109976. [Google Scholar] [CrossRef]
  39. Luo, Y.; Pu, L. UAV Remotely-Powered Underground IoT for soil Monitoring. IEEE Trans. Ind. Inform. 2023, 20, 972–983. [Google Scholar] [CrossRef]
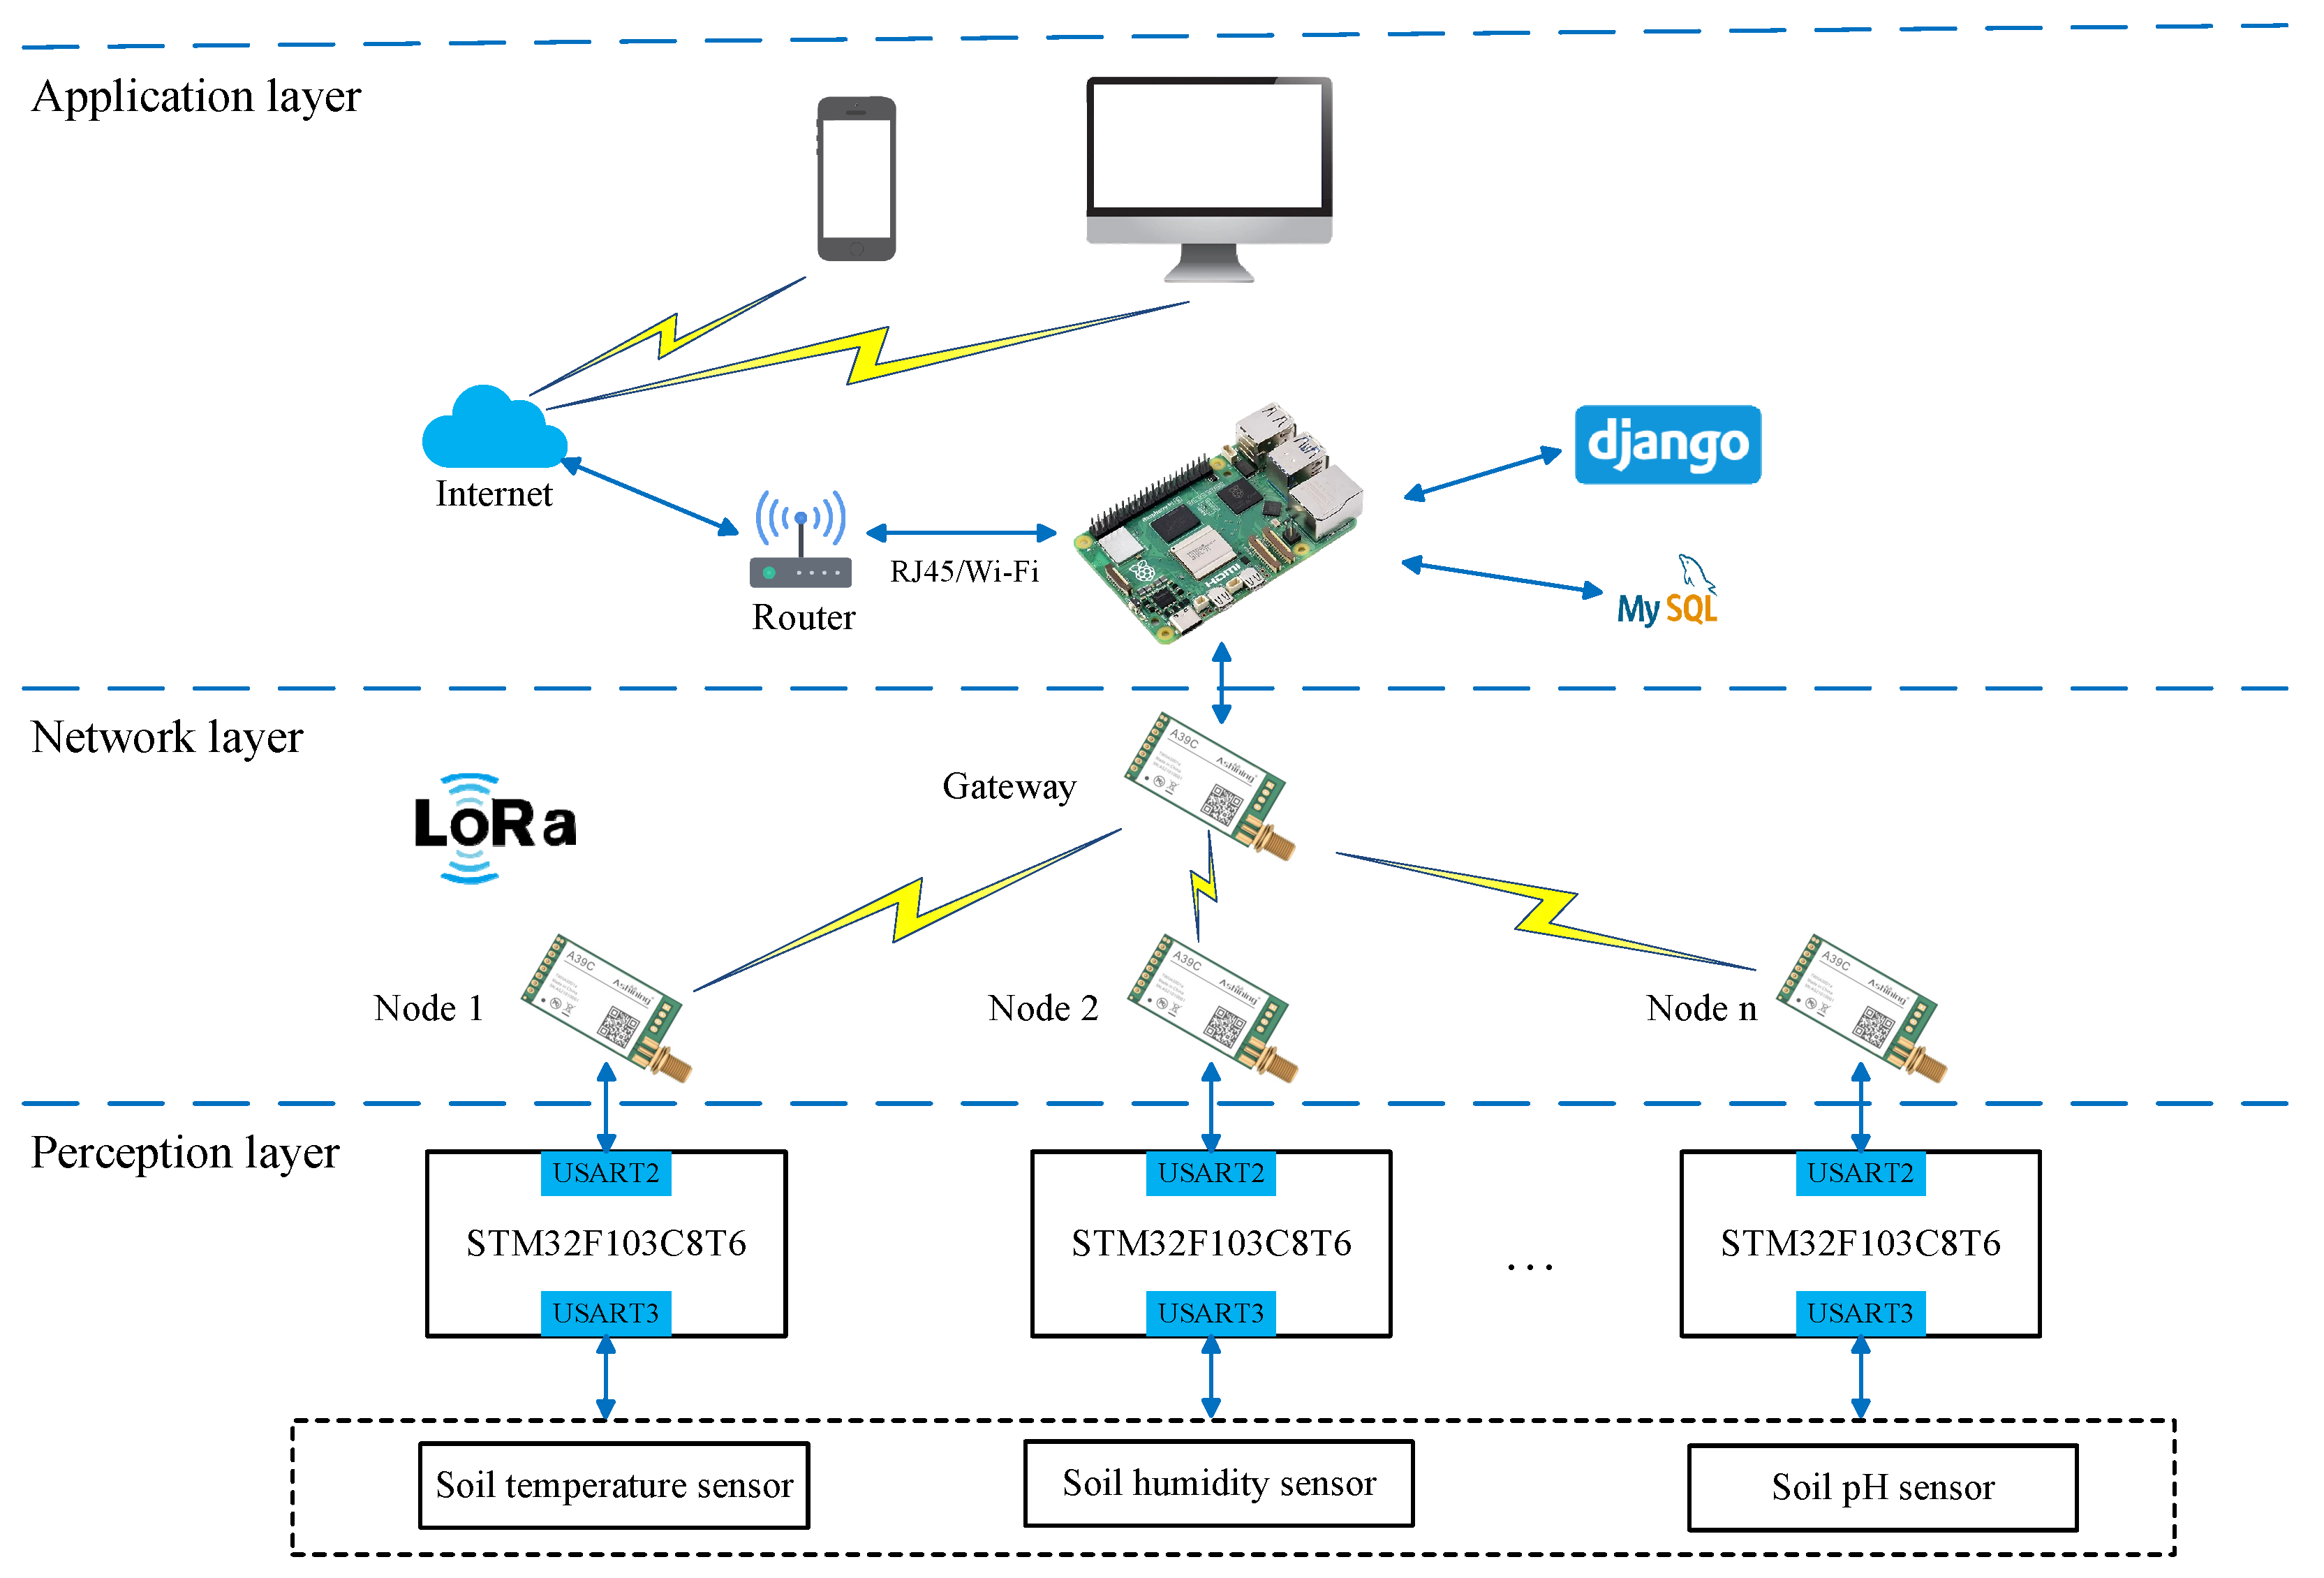
Figure 1. System architecture.
Futureinternet 17 00538 g001
Figure 2. System hardware structure.
Futureinternet 17 00538 g002
Figure 3. Wireless sensor node.
Futureinternet 17 00538 g003
Figure 4. Connection between LoRa and STM32F103C8T6.
Futureinternet 17 00538 g004
Figure 5. Hardware of gateway server node.
Futureinternet 17 00538 g005
Figure 6. PV power module.
Futureinternet 17 00538 g006
Figure 7. Flowchart of system software.
Futureinternet 17 00538 g007
Figure 8. Software flowchart of gateway server.
Futureinternet 17 00538 g008
Figure 9. Software flowchart of the wireless sensor node.
Futureinternet 17 00538 g009
Figure 10. Flowchart of remote monitoring platform.
Futureinternet 17 00538 g010
Figure 11. Test of wireless sensor node.
Futureinternet 17 00538 g011
Figure 12. Test of the gateway server node.
Futureinternet 17 00538 g012
Figure 13. Monitoring webpage of soil information.
Futureinternet 17 00538 g013
Figure 14. Video monitoring webpage.
Futureinternet 17 00538 g014
Figure 15. Experiment on the HAU campus.
Futureinternet 17 00538 g015
Figure 16. Experiment in Longhu Park.
Futureinternet 17 00538 g016
Figure 17. Data acquisition delays under different LoRa transfer rates.
Futureinternet 17 00538 g017
Figure 18. Zigbee-related experiment on the HAU campus.
Futureinternet 17 00538 g018
Figure 19. Multi-node soil detecting system.
Futureinternet 17 00538 g019
Figure 20. Soil information of the multi-node detecting system.
Futureinternet 17 00538 g020
Table 1. Summary of the related works.
ReferencesContributionsOpen Issues or Limits
[5]A wireless underground sensor network is proposed to monitor soil moisture using a multi-hop routing protocol.The maximum round-trip delay was 190 s.
[6]Wireless sensor nodes are used to acquire and transmit georeferenced soil information.It presents high levels of error in measuring nutrients.
[7]A soil leachate monitoring system is designed to evaluate phosphorus and nitrogen in agricultural runoff.Wired signal transmission and on-site analysis are required.
[8]A soil moisture monitoring system for cotton fields is designed using electromagnetic induction technology, and the Kalman filter algorithm is employed to enhance the model precision. The precision of the global model and its applicability across broader areas still require extensive research.
[9]Passive ultra-high frequency (UHF) radio frequency identification (RFID) is used for sensor nodes to enable continuous soil monitoring. The read range only exceeds 2 m, and no external sensors are used.
[10]The work designs a remote monitoring system for agricultural environmental information, including soil, weather and crops, and introduces a fuzzy PID controller to optimize water management.The controller practical implementation faces challenges such as complexity and computing resources.
[11]A heterogeneous sensing system for soil moisture mapping is proposed, which contains wireless sensor networks for large-scale continuous detection, mobile robots for in situ monitoring, and portable probes for flexible sampling. Environmental factors such as soil salinity, greatly affect radio frequency signal transmission.
[12]A cost-efficient linear robotic camera system with one degree of freedom is designed for automatic plant photography utilizing Wi-Fi communication.The wireless communication performance is not investigated.
[13]The work uses sensor nodes to detect agricultural information, including soil moisture and temperature, and send sensor data to the gateway node via Wi-Fi. The communication distance of Wi-Fi limits the coverage range of the monitoring system.
[14]The Internet of Things (IoT) and the Transformer model are employed to monitor agricultural soil moisture, temperature, and air humidity, as well as predict temperature and air humidity data. The application faces the challenge of a lack of communication infrastructure such as the Internet and Wi-Fi.
[15,16]The works use the Arduino-based sensor nodes to acquire agricultural information including soil moisture and send data to a cloud server via Wi-Fi. Soil pH is not monitored [15] and the method [16] is only evaluated in a short period of time.
[17]The work designs printed RFID sensor tags to collect soil parameters, uses a UHF reader on a robot to collect sensor data, and sends data to a web server via Wi-Fi and Bluetooth. The reading distance of the tags buried in the soil is 70 cm, and a longer reading range is expected.
[18]A low-cost agriculture monitoring system is designed to collect information such as soil moisture, which contains Arduino-based hardware using Wi-Fi, and server and phone applications. The communication distance of the used Wi-Fi protocol is limited.
[19]Two monitoring systems are developed based on Wi-Fi and global systems for mobile communication (GSM) to collect crop, soil, and outdoor information. Soil pH is not monitored, and environmental changes are not used to improve prediction accuracy.
[20]The work designs a monitoring system with sensor nodes connecting with the gateway via LoRa, and makes spatio-temporal estimation of soil moisture and temperature. The outliers have a significant impact on the estimated value.
[21]The work designs an agricultural irrigation management system, where sensors transmit data such as soil moisture to the gateway via LoRa. The inconsistent power supply in rural regions can cause disruptions to the system operation.
[22]The work develops a farm monitoring system, where soil moisture probes communicate with a base station via radio link, the base station sends data to the gateway via LoRa, and the gateway connects with the server via GSM. The communication performance, such as data transmission success rate and delays, is not investigated.
[23]The work develops a monitoring system for woody crops, where Arduino-based sensor nodes for soil parameters communicate with the gateway via LoRa, and the gateway sends data to an FTP server via a router. The sensor accuracy for soil water content is low, and the communication between the sensor and the gateway is unidirectional.
[24]An optical wireless sensor network is designed to monitor changes in soil composition, and the gateway nodes forward sensor data to a cloud server. Its limitations lie in the use of artificial samples and the relatively small sample size.
[25]The work studies the power consumption of an agriculture monitoring system, where sensor nodes for soil moisture connect to the gateway via Bluetooth, and the gateway sends data to a cloud server via GSM. The Bluetooth communication range and battery lifetimes are limited.
[26]The work develops sensor nodes to monitor soil moisture, matric potential, and hydraulic conductivity, and sends data to a cloud server via GSM. Wireless communication performance is not given enough attention.
Table 2. Sensor parameters.
Soil Sensor TypeModelOperating VoltageMeasure RangeResolutionAccuracy
temperature sensorSN-3000-TR-N014.5–30 V DC−40~80 °C0.1 °C0.5 °C
humidity sensorSN-3000-TR-N014.5–30 V DC0–100%0.1%3%
pH sensorZTS-3000-TR-pH5–30 V DC3–9 pH0.1 pH0.3 pH
Table 3. Comparison of wireless communication protocols.
ProtocolTransmission RangePower ConsumptionData RateCost
LoRa15 kmUltra-low62 kbpsLow
Zigbee10–100 mLow250 kbpsLow
Wi-Fi100 mMedium11–9600 MbpsLow
Bluetooth15–30 mLow1–2 MbpsLow
Fifth generation100–300 mMedium<1 × 10⁷ kbpsHigh
Table 4. Data acquisition failure rate on the HAU campus.
Sensor
Location
Distance from Point AData Acquisition Failure Rate Under the Traditional MethodData Acquisition Failure Rate Under the Proposed QADA Method
Point 1304 m24%0
Point 2174 m23%0.33%
Point 3198 m25%0
Point 4315 m21%0.33%
Point 5171 m25%0
Point 6164 m25%0
Point 7145 m25%0.33%
Point 8266 m23%0
Point 9307 m22%0
Table 5. Data acquisition failure rate in Longhu Park.
Sensor LocationDistance from Point BData Acquisition Failure Rate
Point 11780 m0
Point 21696 m0.33%
Table 6. Zigbee experimental data on the HAU campus.
Sensor
Location
Distance from Point AData Acquisition Failure RateSensor
Location
Distance from Point AData Acquisition Failure Rate
Point 137 m3.5%Point I77 m49.5%
Point 254 m4.0%Point II81 m33.0%
Point 347 m3.5%Point III66 m39.5%
Point 460 m3.0%Point IV87 m27.0%
Point 547 m2.0%Point V69 m32.0%
Point 656 m3.5%Point VI86 m42.0%
Point 752 m3.5%Point VII85 m33.5%
Point 868 m3.0%Point VIII83 m42.0%
Disclaimer/Publisher’s Note: The statements, opinions and data contained in all publications are solely those of the individual author(s) and contributor(s) and not of MDPI and/or the editor(s). MDPI and/or the editor(s) disclaim responsibility for any injury to people or property resulting from any ideas, methods, instructions or products referred to in the content.