1. Introduction
The repeated, significant failures of traditional election polling to accurately capture voter sentiment have been the subject of intense academic review, particularly following the 2020 U.S. election cycle where polling errors were the largest in decades [
1]. These inaccuracies are not isolated incidents but symptoms of deep, systemic flaws. Key issues like differential nonresponse and flawed likely voter models have created an urgent need to validate alternative tools to analyze elections [
2,
3].
Decentralized Prediction Markets have emerged as a compelling alternative, operating on the classic economic theory of information aggregation proposed by Hayek [
4]. These markets incentivize participants to reveal private information, creating a collective, real-time analysis [
4]. The environment of these novel markets is shaped by a user base that is demonstrably younger and more risk-tolerant than the general population, a crucial context for understanding their dynamics [
4]. While early centralized markets like the Iowa Electronic Markets (IEM) proved the potential of this model, their scope has always been limited by regulatory constraints [
5]. DPMs, built on permissionless blockchain [
6] technology, remove these barriers, creating a more robust and globally accessible ecosystem for information aggregation [
7,
8,
9].
A significant and pressing exists in the direct, empirical comparison of DPM performance against established polling aggregates in a major political election. While the technological foundations of DPMs are well-documented [
10,
11] and their theoretical advantages are clear [
12,
13], their practical application in analysis a high-stakes event like the 2024 U.S. Presidential Election lacks rigorous, large-scale empirical validation. This specific election, where the DPM Polymarket gained unprecedented mainstream media attention, provides a perfect test case. This study is therefore motivated by the need to move beyond theory and provide a robust, data-driven validation of DPMs as a potentially elections analysis instrument. To address this gap, our research constructs and analyzes the Decentralized Prediction Market Voter Framework using a comprehensive dataset of over 11 million on-chain transactions from Polymarket.
This specific issue is part of a broader consensus that while DPMs are theoretically promising, there is limited empirical, scholarly evidence that validates their performance against established benchmarks like polling, especially in high-stakes political elections.
The remainder of this paper is structured to logically build our case. First, we conduct a thorough literature review of prediction markets and polling methodologies, establishing the theoretical foundations and documented limitations of each, which leads to our formal research question and hypotheses. Next, we outline our framework and present the empirical data collected for this study. We then report and analyze this data, including a direct comparative analysis of DPMVF signals against traditional polling aggregates and official election night results. Finally, the paper concludes with a discussion of our findings, the limitations of our approach, and clear avenues for future research.
2. Literature Review
2.1. Prediction Markets as Information Aggregators
Prediction markets are financial instruments designed to analyze future events by aggregating the collective knowledge of their participants. Post-2020 academic inquiry continues to build on the foundational theory that these markets function as practical applications of Hayek’s [
4] information aggregation principle [
14]. The core mechanism is the financial incentive structure: participants risk capital on their beliefs, which theoretically ensures that market prices reflect a weighted average of all available information, updated in real time [
9]. This dynamic nature gives DPMs a significant structural advantage over traditional survey-based methods which are often static and conducted days or weeks apart. In addition, some participants in traditional polling mechanisms may purposedly repeat false data as they have nothing to lose or they prefer to keep their geopolitical differences for themselves.
The evolution from centralized platforms like the IEM to DPMs marks a significant technological and structural shift. While the IEM has been a valuable research tool for decades, its operation is inherently limited by its centralized nature, which imposes regulatory caps on investment and restricts participation, thus limiting its predictive power [
5]. DPMs leverage blockchain technology to create a permissionless and global infrastructure, removing these barriers [
8,
12]. Smart contracts automate trading and settlement, which in theory reduces manipulation risk and removes the need for a trusted intermediary [
15,
16]. However, this decentralization is not a panacea. It introduces new and complex challenges, including ensuring sufficient market liquidity to absorb large trades without price distortion and navigating an uncertain regulatory landscape in jurisdictions like the U.S. [
17,
18].
Recent scholarship has moved beyond pure theory to empirically analyze the complex internal dynamics of these markets. Studies are now examining the specific political leanings and profit-driven motives of participants, revealing that user behavior is not monolithic and can be influenced by factors beyond pure informational accuracy [
17]. Further research is dissecting the technical designs of DPMs, including the role of automated market makers, which can impact price discovery, and the presence of market biases and volatility [
18,
19]. This growing body of post-2020 literature indicates a move from purely theoretical discussions to empirical analysis of how these markets function in practice [
20,
21].
2.2. Systemic Failures in Traditional Election Polling
The academic consensus following the 2020 U.S. election is that traditional polling suffers from systemic flaws that go beyond simple margins of error. The American Association for Public Opinion Research [
1] concluded that the national-level polling error was the largest in 40 years, a finding that confirmed a worrying trend from previous election cycles [
22]. The primary cause identified by multiple analyses is differential nonresponse along educational and partisan lines; essentially, certain groups of voters are systematically less likely to respond to polls, and statistical weighting is failing to correct for this bias adequately [
1,
23].
This core problem is magnified by the persistent challenge of accurately modeling voter turnout. Predicting who will vote is a major source of polling error, and mistakes in this modeling can significantly skew results [
24,
25]. While the “shy voter” hypothesis remains a popular explanation in media narratives, rigorous academic studies have found little evidence to support it as a primary driver of polling misses [
26]. The issues are more fundamental and methodological in nature [
2,
3]. The consistent underestimation of support for one party over multiple cycles suggests a durable, systemic problem that the polling industry has yet to solve, making the search for alternatives a matter of scientific necessity [
27,
28].
2.3. The Research Gap
This review of recent literature reveals a critical research opportunity born from two converging trends. On one side, the traditional polling industry is facing a well-documented crisis of confidence. Its systemic failures in recent, high-stakes elections have been thoroughly dissected by academic and industry task forces, creating an urgent need for reliable alternatives. On the other side, decentralized prediction markets (DPMs) have evolved from a theoretical concept into a robust, active ecosystem, with a new wave of post-2020 research beginning to explore their unique internal dynamics. This situation, a failing incumbent method and a rapidly maturing challenger, creates a clear and pressing need to empirically evaluate whether DPMs can fill the void left by traditional polling’s decline.
Wu’s [
29] thesis fundamentally challenges the “wisdom of crowds” and efficient market hypotheses as explanations for prediction market accuracy. Her work reconceptualizes these platforms as “sociotechnical assemblages” where forecasting accuracy emerges not from democratic aggregation but from “specialized competition” within a “structured trader ecology.” She provides compelling evidence that prediction markets are characterized by systematic inefficiencies and extreme concentrations of trading activity, where a small elite of traders, or “whales,” exert disproportionate influence on price formation. This creates a hierarchical information flow, a departure from the idealized model of markets as simple aggregators of dispersed knowledge. Wu’s focus is on the sociological and microstructural reasons why these markets work despite their apparent inefficiencies, a crucial insight for the field [
29].
While Wu’s analysis provides a new theoretical framework for understanding the internal dynamics of DPMs, our study is positioned to empirically test the external validity of these complex systems against established benchmarks. Wu demonstrates how DPMs function internally, but our DPMVF is designed to quantify their performance against the very systems they seek to replace, traditional election polling. Where Wu identifies “systematic inefficiencies” and “hierarchical information flows” as core features, our research can investigate whether these very characteristics are the source of the DPMs’ potential advantage in speed and accuracy over polling. Thus, the research gaps our paper fills is the critical next step: a rigorous, comparative analysis that moves from describing the internal mechanics of these sociotechnical assemblages to validating their practical forecasting utility in a real-world, high-stakes context. We are, in essence, bridging the gap between Wu’s microstructural insights and the macrosocial question of their predictive power [
29].
While individual studies have examined aspects of DPMs or the failures of polling, this paper provides a direct comparative analysis in the context of the 2024 U.S. Presidential Election. It seeks to answer a critical question: Does the theoretical promise of decentralized, financially incentivized information aggregation translate into a practically superior analysis tool? By constructing and analyzing DPMVF, this study provides a novel, data-driven contribution to the urgent, ongoing debate about the future of election analysis.
As outlined in
Table 1, the aspects of Speed and Transparency represent the most profound distinctions between these analytical tools and are central to the premise of our study. Traditional polling is inherently latent; its process of data collection, weighting, and analysis unfold over several days, meaning its findings are always a retrospective snapshot of public opinion. This latency is paired with limited transparency, where published top-lines often obscure the proprietary models used to generate them. In stark contrast, prediction markets offer a continuous, real-time signal, as their prices adjust instantly to new information and trading activity. While both centralized and decentralized markets provide transparent prices, DPMs built on blockchain technology offer a far deeper level of verifiability. Every transaction is recorded on a public, immutable ledger, a feature noted in
Table 1 as “High transparency due to blockchain.” This allows for an analysis that goes beyond the surface-level price to examine the underlying market dynamics. It is this unique combination of immediate price discovery and granular, on-chain transparency that creates the theoretical possibility of a measurable temporal precedence, which this paper’s framework is designed to investigate.
3. Conceptualization
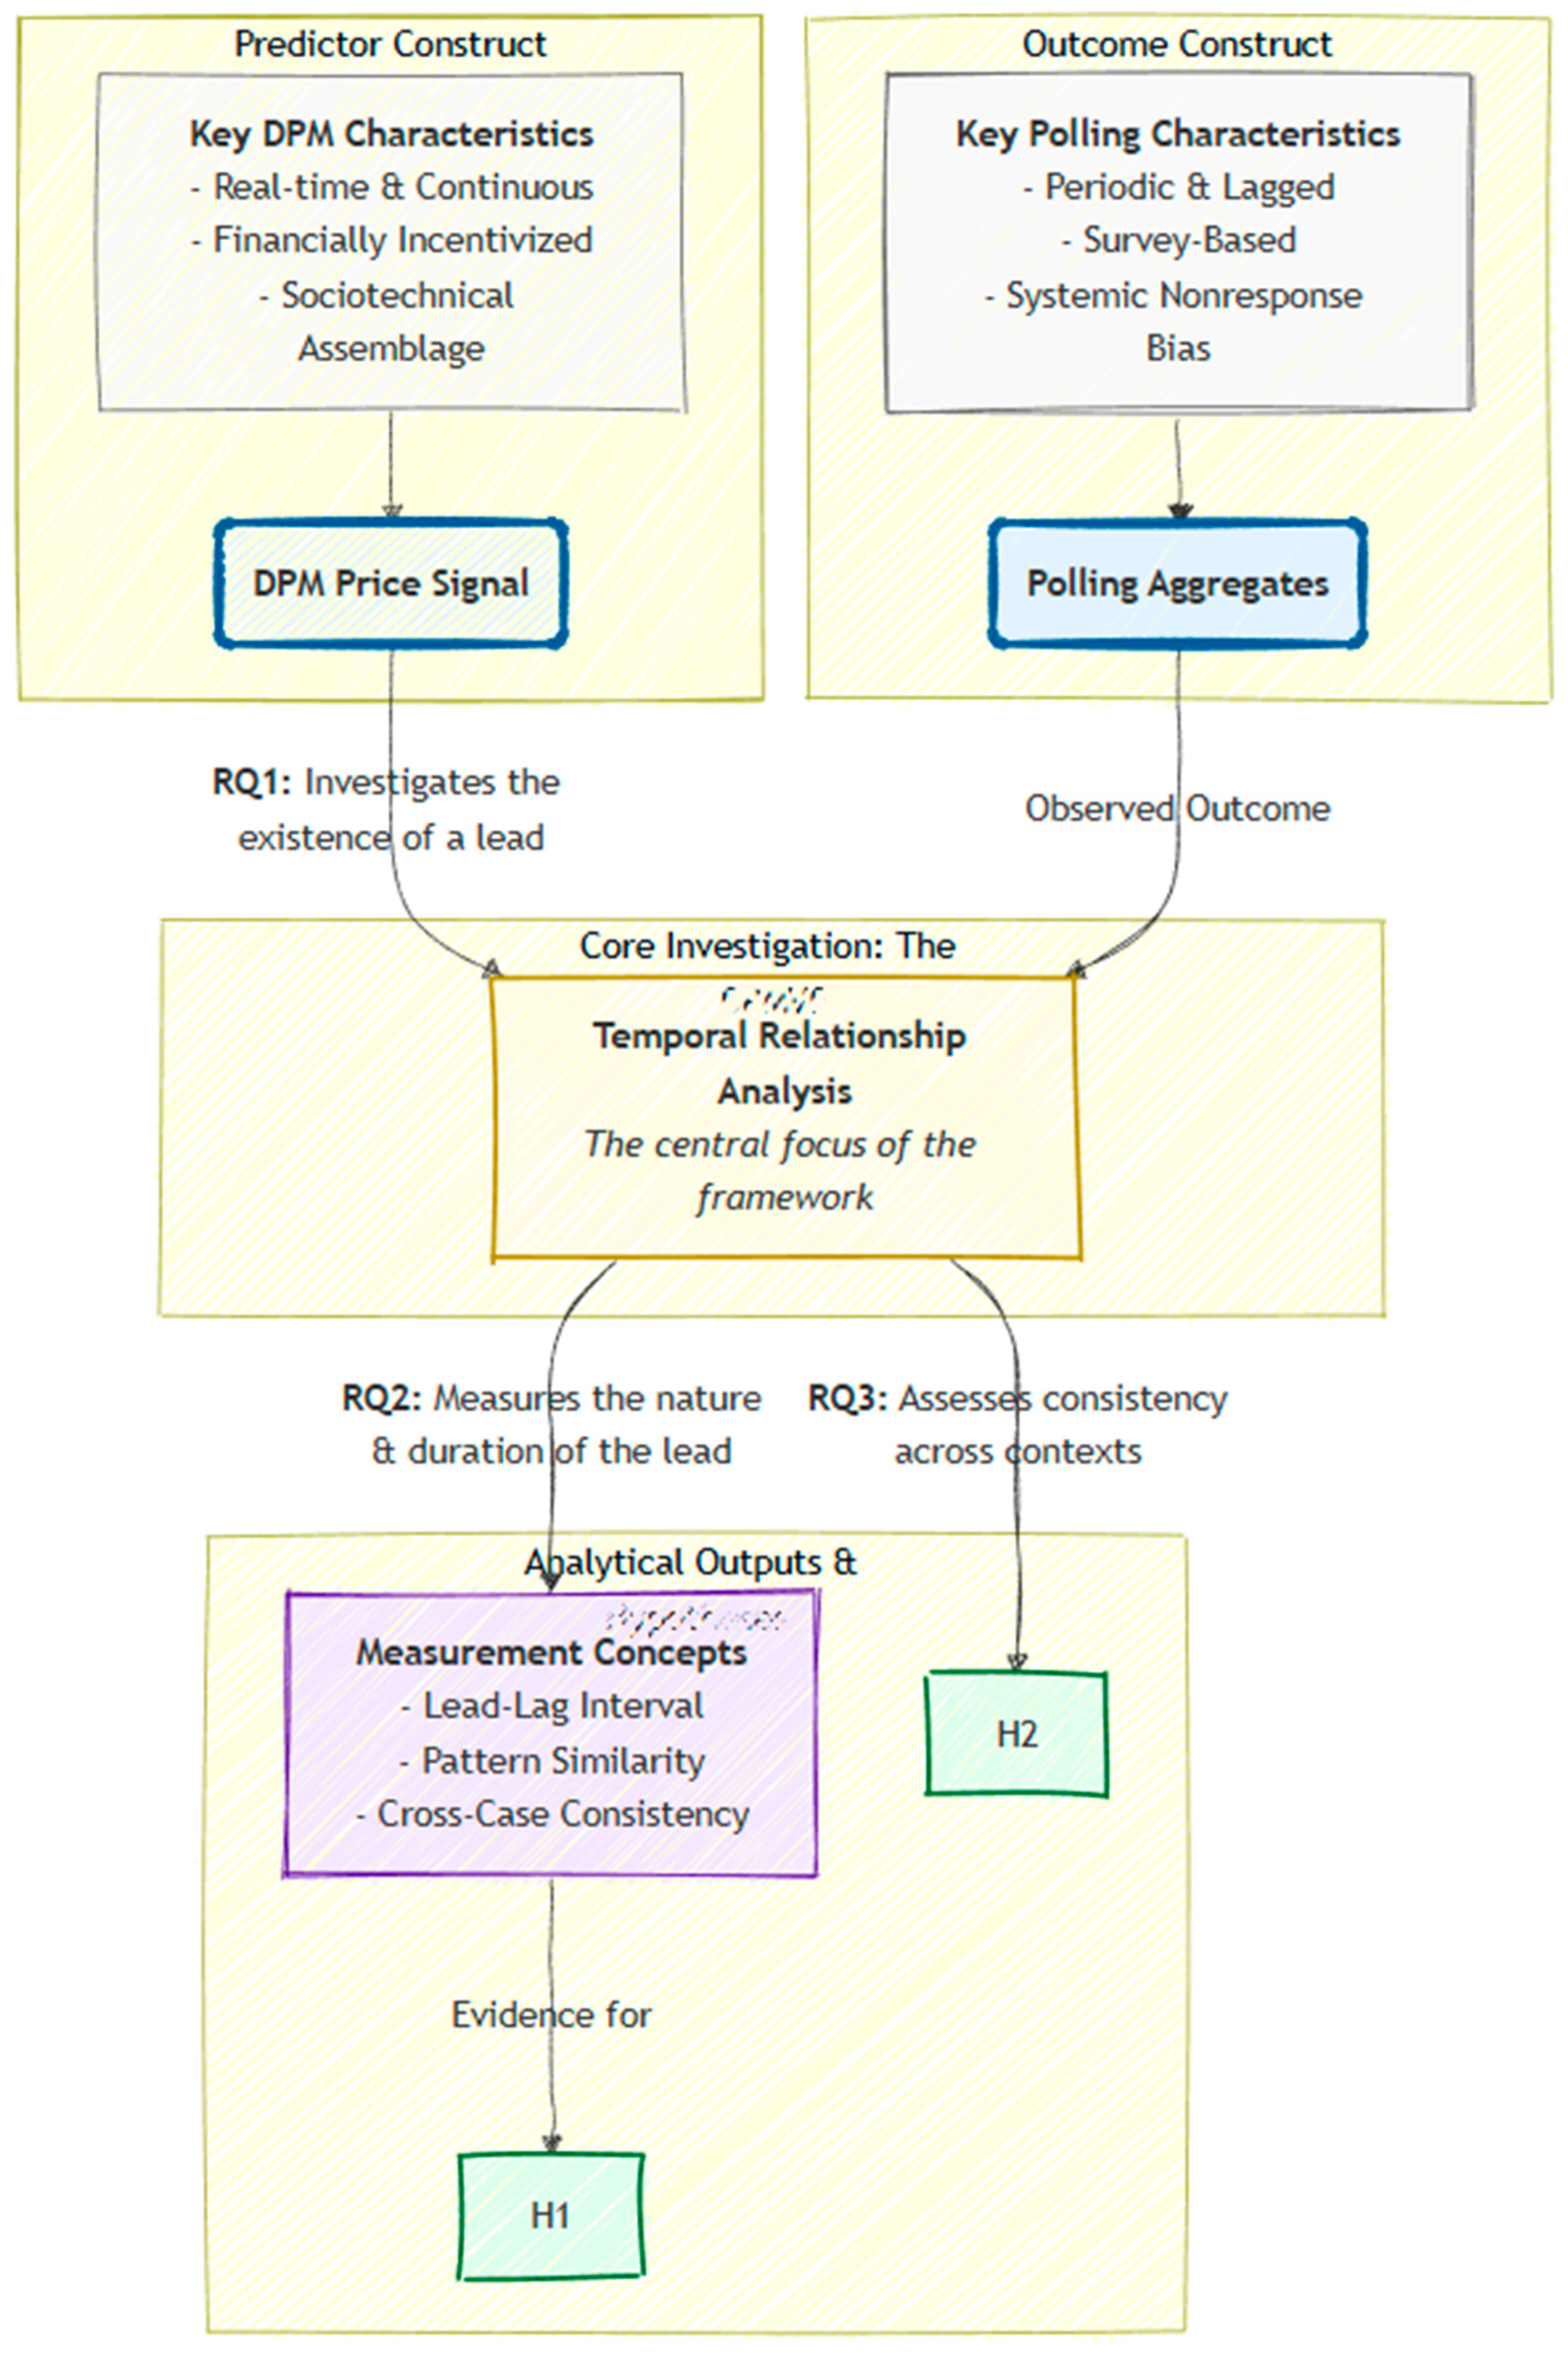
This paper conceptualizes DPMs not merely as alternatives to polling, but as fundamentally different mechanisms for capturing public sentiment. Drawing from recent microstructural analyses that frame DPMs as ‘sociotechnical assemblages’ driven by specialized competition rather than a democratic ‘wisdom of crowds,’ we posit that their primary advantage may lie in the speed and dynamism of their price signals. Our framework, therefore, does not assume market efficiency or egalitarian participation. Instead, it treats the DPM price as the real-time, emergent output of a complex, hierarchical, and financially incentivized system. The central aim of our conceptualization is to investigate whether this unique internal structure produces an externally valid signal that can systematically precede and align with shifts in traditional voter sentiment as measured by polling aggregates. This approach directly informs the guiding questions of our study:
By leveraging real-time, financially incentivized data, we aim to establish an innovative framework for identifying and validating voting pattern shifts ahead of formal polling. The Research Questions (RQs) guiding this study are:
RQ1 : To what extent do the price signals from decentralized prediction markets like Polymarket function as leading indicators of shifts in voter sentiment?
RQ2: What is the nature and duration of the lead-lag relationship between Polymarket price trends and traditional polling aggregates in the 2024 U.S. Presidential Election?
RQ3: How consistent are these lead-lag dynamics across different electoral contexts, specifically in key swing states?
To investigate these questions, we formulate the following research hypotheses (H):
H1: The time series of Polymarket’s price signals for the 2024 U.S. Presidential Election will show a statistically significant lead over the time series of aggregated polling data.
H2: Across key swing states, Polymarket price trends will consistently precede shifts in polling averages by a measurable and statistically significant time interval.
Construction of the Decentralized Prediction Market Voter Framework (DPMVF)
To systematically investigate our research questions, we introduce the Decentralized Prediction Market Voter Framework. The DPMVF is not merely a single index but a comprehensive framework for analyzing DPM data to identify and validate early shifts in voter sentiment. It provides a structured approach that can be replicated in future electoral contests as presented in
Figure 1. The DPMVF consists of three key components:
(a) Real-time Transaction Data Analysis: The framework’s foundation is the analysis of real-time, on-chain transaction data. Unlike periodic polling, this allows for the continuous tracking of voter expectations as they evolve.
(b) Comparative Visual Analysis: The framework first involves a direct visual comparison of price trends from the DPM against polling aggregates. This serves to identify observable patterns and generate initial hypotheses about the market’s predictive power, as demonstrated in the charts for key swing states.
(c) Advanced Time-Series Analysis: The framework’s final and most critical component is the application of advanced time-series techniques, such as Dynamic Time Warping, to quantify pattern similarity and temporal alignment between the DPM and polling data, thereby providing robust descriptive evidence of lead-lag relationships.
4. Methodology
This study employs a multi-stage quantitative approach designed to first identify and then statistically validate the predictive power of DPMs. Our choice to use DTW is validated by its application in analyzing real-world, asynchronous social phenomena where identifying underlying pattern similarity is paramount. For instance, a 2023 study by Cassão et al. [
30] utilized DTW to compare the evolution of the COVID-19 pandemic across different Brazilian states. The authors faced the challenge that pandemic waves occurred at different times and with varying durations in each state, making direct point-to-point comparison ineffective. This situation is directly analogous to our research context, where the continuous, high-frequency DPM price signal and the periodic, lagged polling data are related but not temporally synchronized. DTW allowed the researchers to bypass these timing differences and instead measure the similarity in the overall
shape of the pandemic trajectories, enabling them to cluster states with similar pandemic experiences. Their successful application confirms our selection of DTW as a robust method for identifying and quantifying the underlying pattern congruence between DPM trends and polling shifts, providing a more accurate measure of their lead-lag relationship than traditional correlation metrics could offer [
30].
4.1. Data Collection
The focus of our study was the U.S. 2024 Presidential Election, a high-stakes event that provided a rich context for exploring decentralized prediction markets. Polymarket, identified as the largest DPM by transaction volume, served as the primary source for on-chain data. We collected data from Polymarket spanning 1 September to 5 November 2024, capturing over 11 million transactions involving 304,374 unique wallets [
31]. This dataset included detailed information such as transaction details, timestamps, and other relevant parameters, offering a comprehensive view of market activity during the election cycle.
To complement the on-chain data, we also gathered aggregate poll data from reputable sources, including Nate Silver’s FiveThirtyEight and other established polling organizations. This dataset covered the same period and comprised 1606 polls [
32]. By combining these two data streams, we created a robust foundation for comparing decentralized prediction markets with traditional polling methods, enabling a deeper understanding of their respective roles in predicting electoral outcomes.
4.2. Establishing the Parameters to Compare the Data
The analysis is conducted in two stages, aligning with the DPMVF. We first conducted comparative analysis and pattern identification and then we ran an advanced time series analysis as explained below:
Stage 1: Comparative Analysis and Pattern Identification: We compare the time series of Polymarket contract prices against the aggregated polling data for crucial swing states. By plotting these two series on the same timeline, we identify clear, observable patterns where Polymarket’s trends appear to precede shifts in the polls. This visual evidence forms the basis for our primary hypothesis that DPMs provide an “early signal”.
Stage 2: Advanced Time-Series Analysis: This stage employs DTW as the primary method for quantifying the similarity and temporal alignment between the Polymarket and polling data. DTW is particularly suited for this analysis due to its ability to:
Handle Non-Linear Alignment: Unlike traditional correlation methods, DTW can find optimal alignments between two time series that may vary in speed or have non-linear shifts, providing a more flexible measure of lead-lag.
Measure Shape Similarity: DTW focuses on the overall shape similarity of the series, which is crucial for identifying consistent patterns even if exact timing is not perfectly linear
Robustness to Data Limitations: DTW is generally more robust to smaller sample sizes and noise compared to traditional econometric causality tests, which often require more extensive data for reliable inference.
To quantify the lead-lag relationships and assess pattern similarity between the Polymarket price margin (the calculated difference between Trump and Harris contract prices) and the polling average margin, our model employs two distinct yet complementary time-series analysis techniques: the Cross-Correlation Function and DTW. This methodological choice is driven by the specific characteristics of our dataset, particularly the limited number of daily observations within a single election cycle, which renders traditional econometric causality tests, such as Granger causality, computationally problematic or statistically unreliable. CCF offers a foundational approach to identify linear lead-lag relationships, while DTW provides a more flexible and robust measure of shape similarity, particularly well-suited for shorter, potentially noisy time series. This dual approach allows for a comprehensive understanding of how Polymarket’s trends precede and aligned with polling data, even in the absence of conditions suitable for formal causality testing.
Our primary goal is to identify and quantify the descriptive evidence of early signals from decentralized prediction markets in election analysis. Given the inherent limitations of real-world election data, specifically, the relatively short time series available within a single election cycle and the potential for non-linear temporal distortions, traditional causality tests often fail to yield reliable results. CCF is selected for its ability to clearly identify linear temporal precedence and the strength of such relationships, a widely accepted method in financial time series analysis [
33]. DTW is chosen for its superior capability to capture non-linear shape similarity and optimal alignment between time series, making it exceptionally robust to the very data characteristics that challenge other methods [
33,
34]. This combination allows us to robustly quantify the “early signal” phenomenon by measuring both linear lead-lag and the overall pattern congruence, providing compelling descriptive evidence of DPMVF’s effectiveness where formal causality might be elusive.
Our model calculates the CCF to identify the linear relationship and temporal shift between the two-time series. This method is widely applied in financial time series analysis for understanding relationships and identifying leading indicators [
1]. For two discrete time series,
(Polymarket price margin) and
(polling average margin), the sample cross-correlation
at lag k is computed as
Here, and denote the values of series X and Y at time t, respectively. and represent the sample meaning of series X and Y, while N and M are their respective lengths. The lag k indicates the temporal shift, with positive k signifying that Y lags X, and negative k signifying that X lags Y. The peak correlation value and its corresponding lag are extracted to quantify the strength and duration of the linear lead-lag relationship.
Our model employs DTW to assess the overall shape similarity and optimal alignment between the Polymarket and polling time series. DTW is particularly effective for time series that may vary in speed or have non-linear shifts, making it robust to the inherent dynamics of real-world data [
35]. The DTW distance between two time series,
and
is computed by finding the optimal warping path that minimizes the sum of local distances between aligned points. The core of the DTW algorithm is a dynamic programming approach that calculates a cumulative distance matrix
using the recurrence relation:
In this formula, represents the local distance between points and from series Y (typically Euclidean distance). is the cumulative minimum distance up to these points. The final DTW distance is which is then normalized by the length of the optimal warping path to yield a DTW Normalized Distance. This normalized value allows for fair comparison of shape similarity across different series, regardless of minor variations in series length.
4.3. Assessing Statistical Significance Using Non-Parametric Permutation Testing
To formally verify the statistical significance of the observed lead-lag relationships and pattern similarity without relying on parametric assumptions (which may be violated by financial and political time series), we implemented a Permutation Test for both CCF and DTW results. This test provides a robust, empirical value by establishing a null distribution of the metrics under the assumption of no true relationship. The procedure was executed as follows: (1). The time series representing the polling average margin was randomly shuffled 1000 times to decouple its temporal structure from the Polymarket price margin series, creating 1000 null datasets. (2). For each shuffled iteration, the Cross-Correlation Function and Dynamic Time Warping distance were recomputed. (3). The resulting 1000 metrics established null distribution for both peak correlation and DTW distance. Finally, the observed peak CCF value and the observed DTW distance were compared against their respective null distributions. The -value is defined as the proportion of permutations that yielded a metric as extreme as (or more extreme than) the observed metric, formally validating that the strong alignment is not attributable to random chance.
4.4. Swing State Analysis
Our research focuses on the 2024 U.S. election swing states due to their critical impact on the electoral outcome and significant voter demographic shifts. States like Georgia, North Carolina, Pennsylvania, Michigan, and Wisconsin were identified as battlegrounds because they featured narrow vote margins and showed notable reversals compared to prior election results. Arizona and Nevada were included to analyze shifts within Latino communities, which played an essential role in Republican gains [
36]. These states reflect broader trends influencing national political dynamics.
With these states identified, we then focused on the extensive data available to us. On-chain data from decentralized prediction markets and traditional polling data became our tools for uncovering patterns and trends in voter perceptions. By analyzing this dual dataset, we gained insights into the evolving narratives that shaped these pivotal states in the months leading up to the election.
The final phase of our study compared the predictive accuracy of DPMs with traditional polling methods. We tracked the outcomes by each approach and evaluated their alignment with the eventual election results. This comparative analysis not only highlighted the relative strengths and limitations of these tools but also underscored the growing significance of decentralized platforms in capturing the pulse of voter sentiment in real time.
In this study, we chose to focus on Polymarket as the DPM for analysis due to its dominant position in the market during the US 2024 Presidential Election. On election night, Polymarket accounted for an impressive 74% of all transactions related to the election, making it the largest and most influential PDPM at the time [
37]. This prominence in the market underscores the significance of our findings and ensures that our analysis is based on the most comprehensive and representative data set available. To facilitate the analysis of the on-chain data from Polymarket, we utilized their API, which allowed us to efficiently and accurately extract, process, and examine the relevant transaction information. By focusing on the largest market and leveraging their API, we ensure that our study provides a robust and reliable assessment of the potential of decentralized prediction markets in identifying voting patterns in US elections before polls. The procedure for DTW Analysis is as follows:
Step 1—Data Preparation: For each state, the Polymarket price margin (Trump—Harris) and the polling average margin (Trump—Harris) are extracted. Both series are then normalized to a 0–1 range to ensure they are on a comparable scale, which is important for DTW distance calculation.
Step 2—DTW Computation: The DTW algorithm is applied to the normalized Polymarket and polling margin series. This computes the optimal alignment path and the DTW distance, which quantifies the dissimilarity between the two series (lower distance indicates higher similarity).
Step 3—Interpretation: The DTW distance and normalized distance provide a quantitative measure of pattern similarity. The generated warping path visually illustrates how points in one series align with points in the other, offering insights into the nature and consistency of the lead-lag relationship.
Cross-Correlation Function is used as a complementary tool in this stage to provide an initial linear lead-lag estimate and peak correlation value, which DTW then further explores for shape similarity and flexible alignment.
5. Data Analysis
For this purpose, our study utilizes the polling aggregate from FiveThirtyEight (538). The 538 model is widely regarded as an industry gold standard, not merely presenting poll results but synthesizing them into a sophisticated forecast. It evaluates and weights numerous polls based on their historical accuracy, sample size, and methodological rigor, effectively filtering out noise and providing a more accurate and stable signal of true voter sentiment over time. By choosing the 538 aggregate, we are not just comparing the Polymarket signal to “the polls”; we are testing it against one of the most respected and methodologically sound benchmarks for election forecasting available. The process involves the collection and analysis of on-chain data from the selected decentralized prediction market and aggregate poll data from Nate Silver 538 during the month before the election. The study also analyses reports from the prediction market during election night and compares them with the Associated Press reports for calling the winner in each swing state. This approach enables the evaluation of the effectiveness of the DPMVF in predicting election outcomes and its potential implications for the use of decentralized prediction markets in future elections
5.1. Comparative Analysis
5.1.1. The Anatomy of a Comparative Analysis: Signal vs. Benchmark
In this study, we analyzed more than 11 million transactions on the Polymarket platform during the period 1 September to 5 November 2024. The on-chain data provided valuable insights into the real-time dynamics of the DPM and the trading patterns of participants.
Table 2 presents the total number of unique wallets active on Polymarket between 1 September to 5 November 2024, that participated in betting on the US 2024 Presidential Election. From the data above, we observe that a single trader can place more than one trade. This indicates that a person can bet multiple times. It also highlights a key difference between traditional polling methods, where participants answer only once, and DPMs, where participants can place multiple bets. A key distinction of DPMs is that participants can engage in multiple trades, a stark contrast to the single-response nature of traditional polling. The observation of over 30 times more trades than unique wallets give rise to complex trading phenomena. Analysis of on-chain data revealed distinct user strategies that are not possible in conventional survey environments. For instance, some users were observed consistently purchasing the same position over several days, a strategy aimed at lowering their average cost per token and strengthening their position over time. In other cases, traders reacted to market movements by purchasing tokens for an opposing outcome in a different but related market, effectively creating a hedge to mitigate risk. These sophisticated financial behaviours, driven by the ability to trade continuously, contribute to the dynamic nature of DPMs and underscore the depth of information embedded within their price signals, which reflects not just static opinion but active, strategic financial positioning.
5.1.2. Establishing the Ground Truth: The Role of Aggregated Polling Data
The on-chain data from Polymarket provides the first half of our analytical equation: a high-frequency, real-time signal of market sentiment. The analysis of over 11 million transactions offers a granular view into the economic expectations of thousands of participants, revealing how capital flows in response to evolving political narratives. This data, with its rich detail on volume, wallet activity, and trade frequency, is the source of our potential “early signal.” However, this signal exists in a vacuum. While it tells a compelling story of market dynamics, it cannot, on its own, validate our primary hypothesis. To test whether the market is a true leading indicator of voter sentiment, its signal must be measured against a credible, established benchmark of public opinion.
This brings us to the second, indispensable half of our analysis: the public opinion benchmark. To validate the DPM signal, we require a reliable representation of the very voter sentiment we hypothesize the market is predicting. A simple, one-to-one comparison against individual polls would be insufficient and scientifically unsound, as single polls are prone to significant noise, methodological biases, and outlier results. Therefore, a robust, aggregated benchmark is necessary to provide a stable and comprehensive overview of the public opinion landscape. This ensures that DPMVF’s findings are based on a rigorous and credible comparison, allowing us to confidently assess whether the DPM signal precedes shifts in the established ground truth of public opinion [
32].
5.2. Initial Pattern Identification
By comparing the on-chain data from the decentralized prediction market with the aggregate poll data, we identified patterns in the swing states that eventually resulted in the victory of candidate Trump. In return this supports the hypothesis that Decentralized prediction markets, such as Polymarket, accurately predict the winner of the US Presidential Election (H1). This initial stage involves a direct visual comparison of the time series of Polymarket contract prices against the aggregated polling data for crucial swing states. By plotting these two series on the same timeline, we identify clear, observable patterns where Polymarket’s trends appear to precede shifts in the polls. This visual evidence forms the basis for our primary hypothesis that DPMs provide an “early signal.”
Our analysis revealed that the DPM was able to identify trends in voter sentiment, demonstrating the potential of this method in providing earlier insights into voter perceptions. These results suggest that the decentralized prediction market captured changes in voter sentiment more quickly than traditional polling methods, which may be attributed to the real-time nature and free market dynamics of the former. This finding supports the hypothesis that decentralized prediction markets can show changes in voters’ perception earlier than polls due to their real-time nature and free market dynamics. due to their real-time nature and free market dynamics. The true test of this “early signal” hypothesis, however, lies not in the aggregate but in the granular data from individual swing states. The following state-specific observations provide compelling visual evidence of this lead-lag relationship in action.
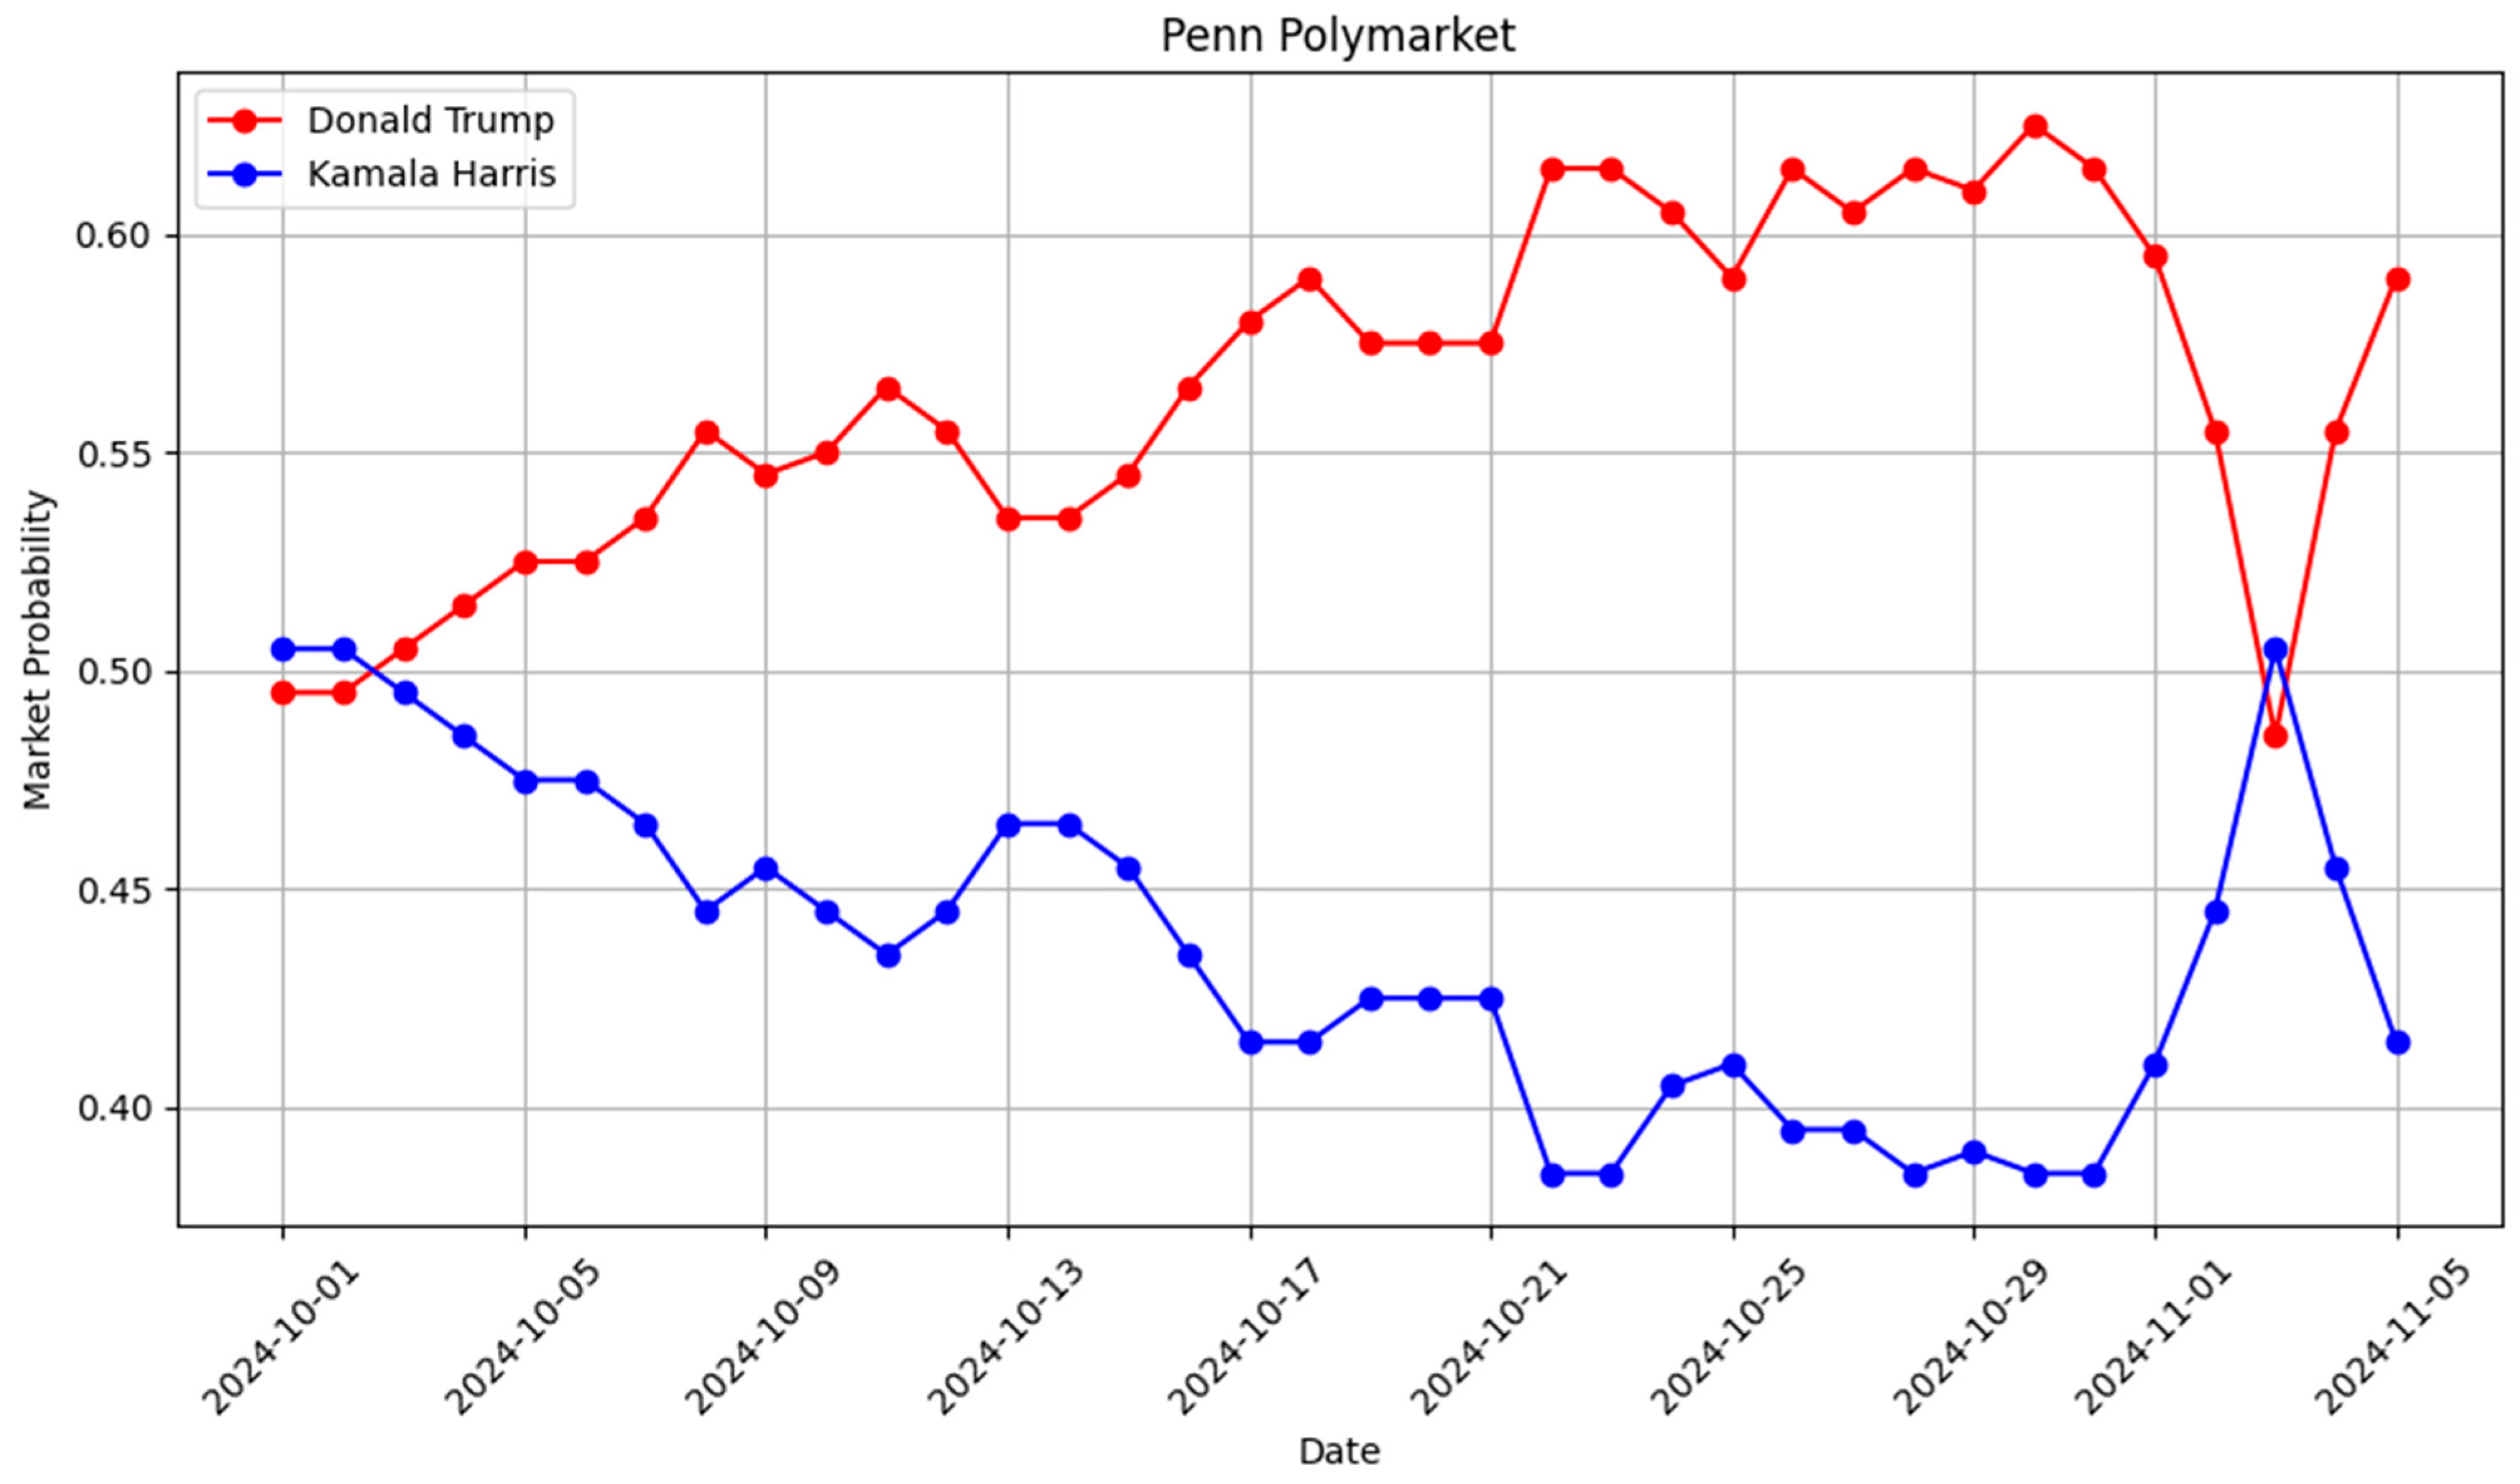
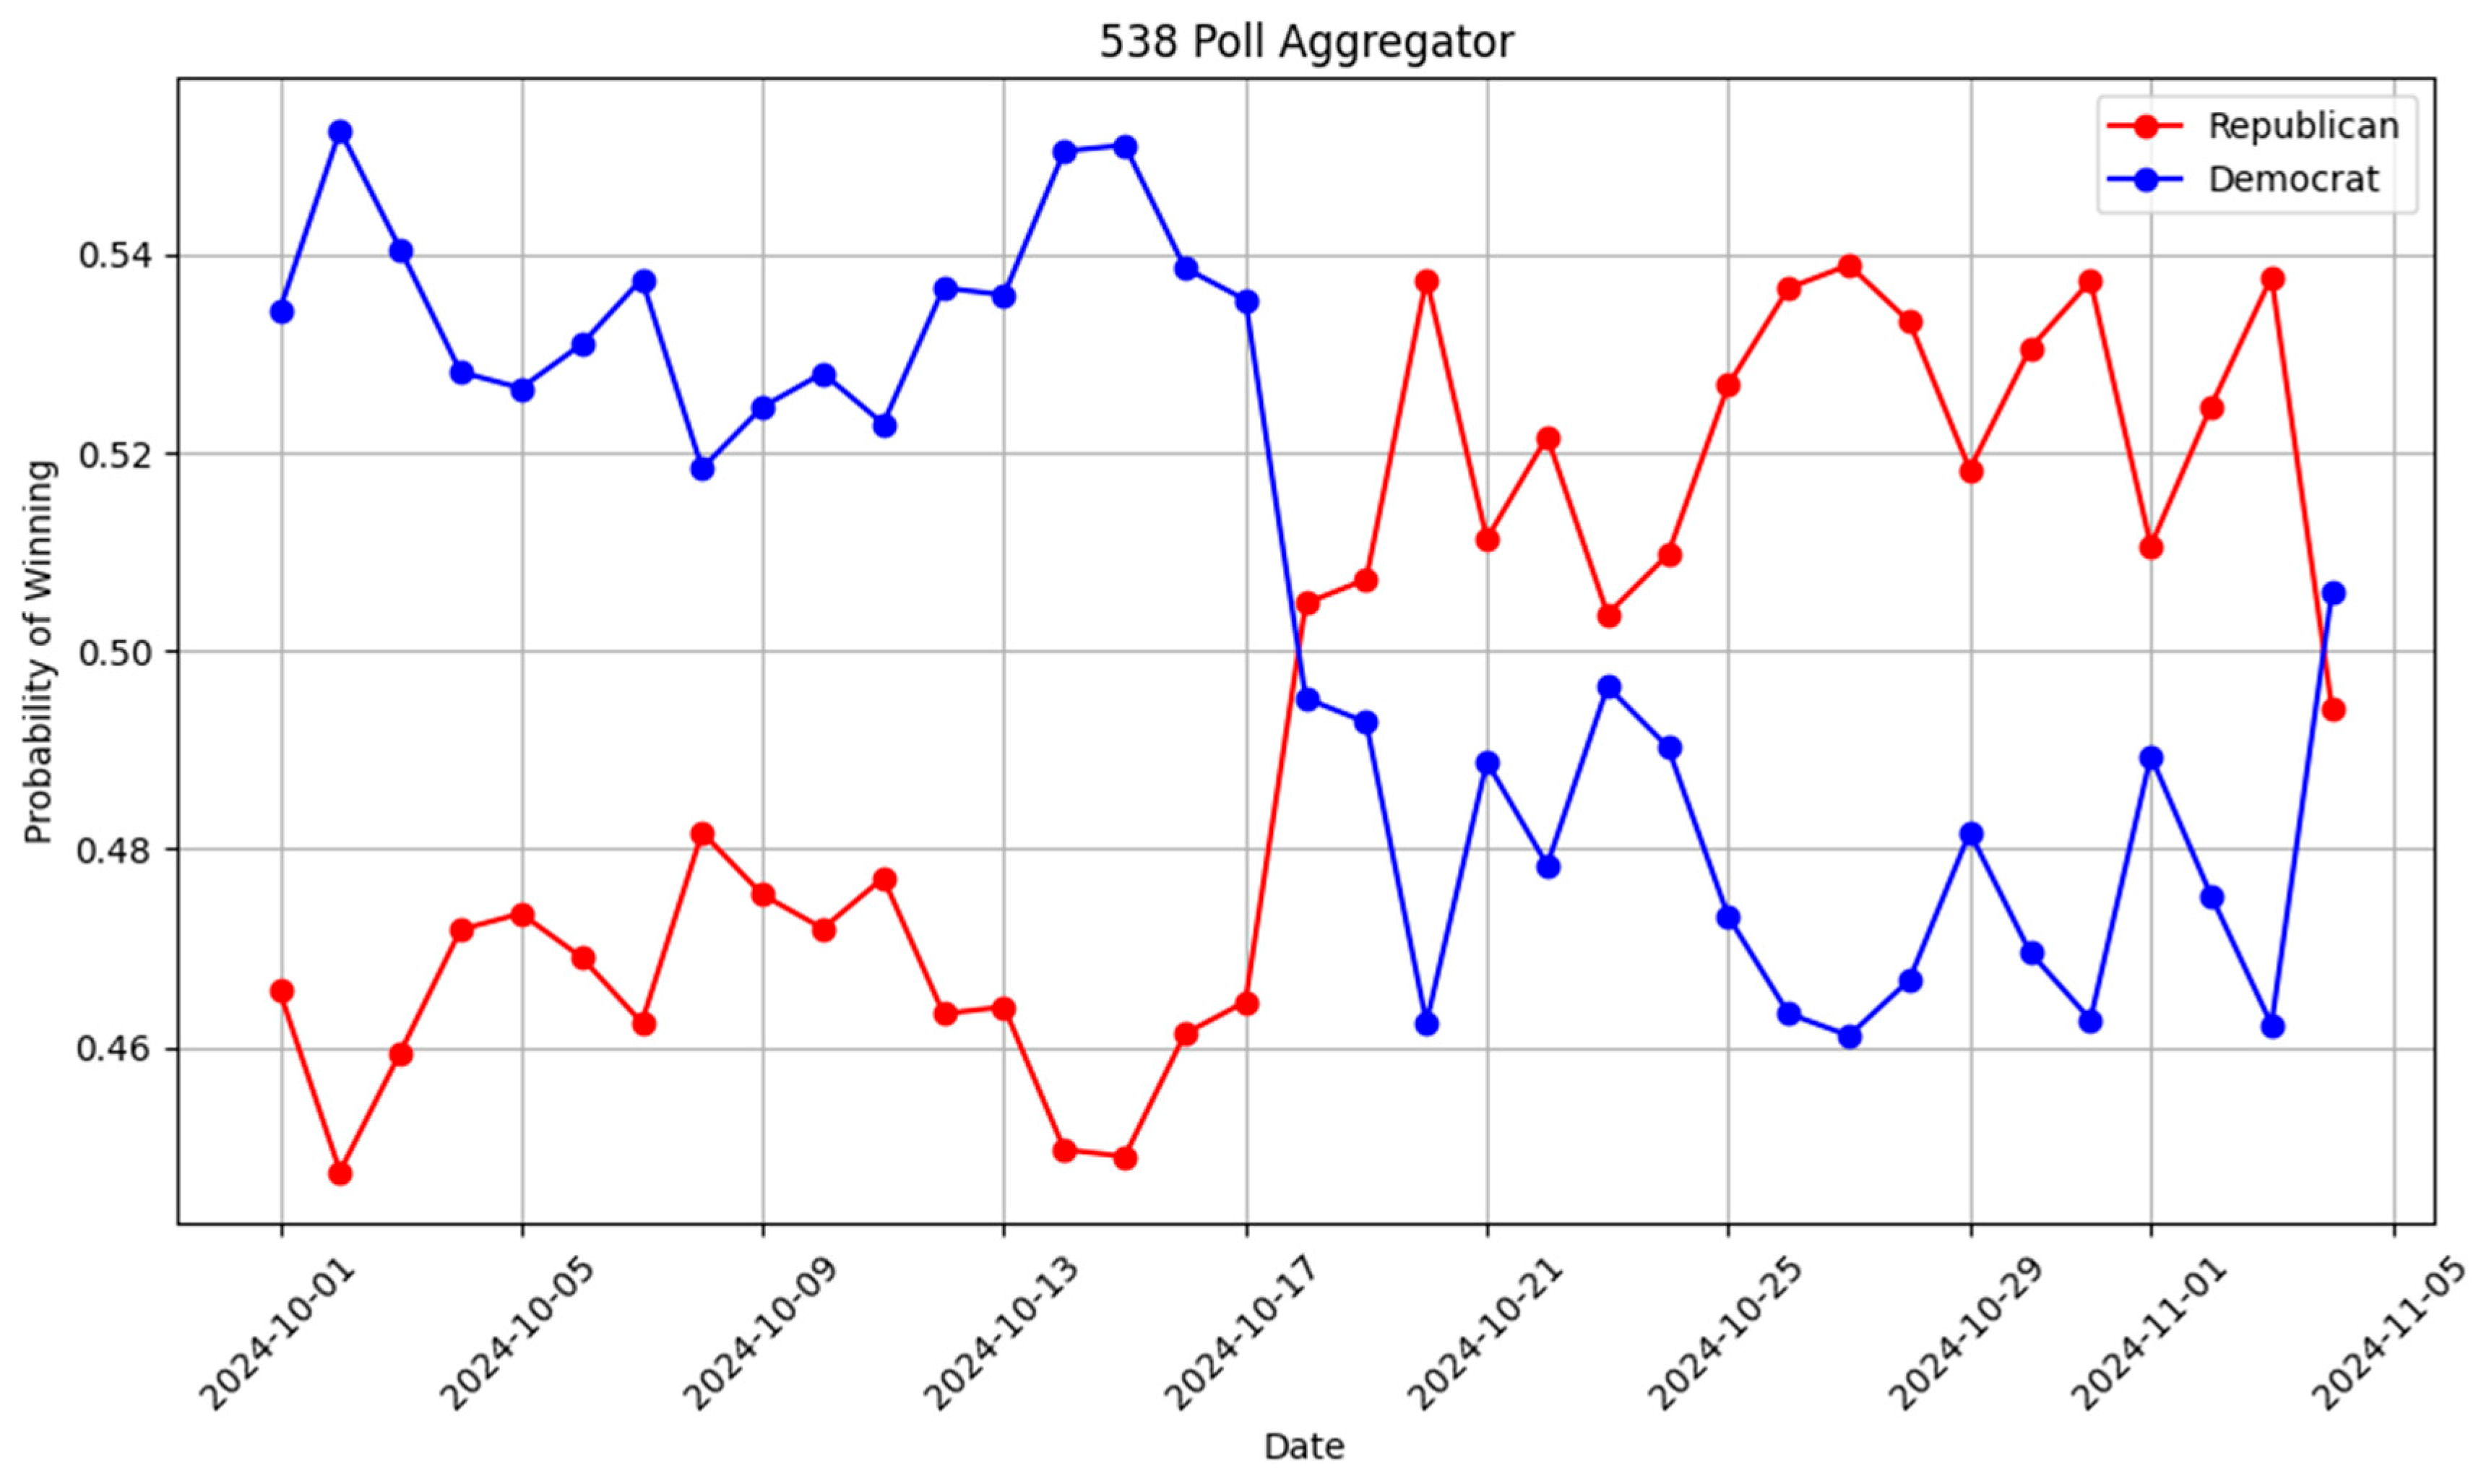
Observations for Pennsylvania: A comparison of the Polymarket betting trends and 538 polls for Pennsylvania reveals a clear divergence. On Polymarket, the trend favoring Donald Trump’s victory began and persisted throughout the analyzed period, reflecting a consistent pro-Trump trajectory. In contrast, an analysis of the 538 polls aggregation shows that the pro-Trump trend only emerged on 17 October, indicating a 16-day lag compared to Polymarket. Notably, on 2 November, the polls briefly shifted back in favor of Kamala Harris, but by 3 November, the trend evened out to a 50/50 split. On election night, the results reflected this shift, with Trump securing 50.4% of the vote and Kamala 48.5%, resulting in a vote margin of approximately 170,000 votes. This suggests that Polymarket identified a pro-Trump trend significantly earlier than traditional polling aggregations. You can see the difference between Polymarket and the polls in
Figure 2 and
Figure 3.
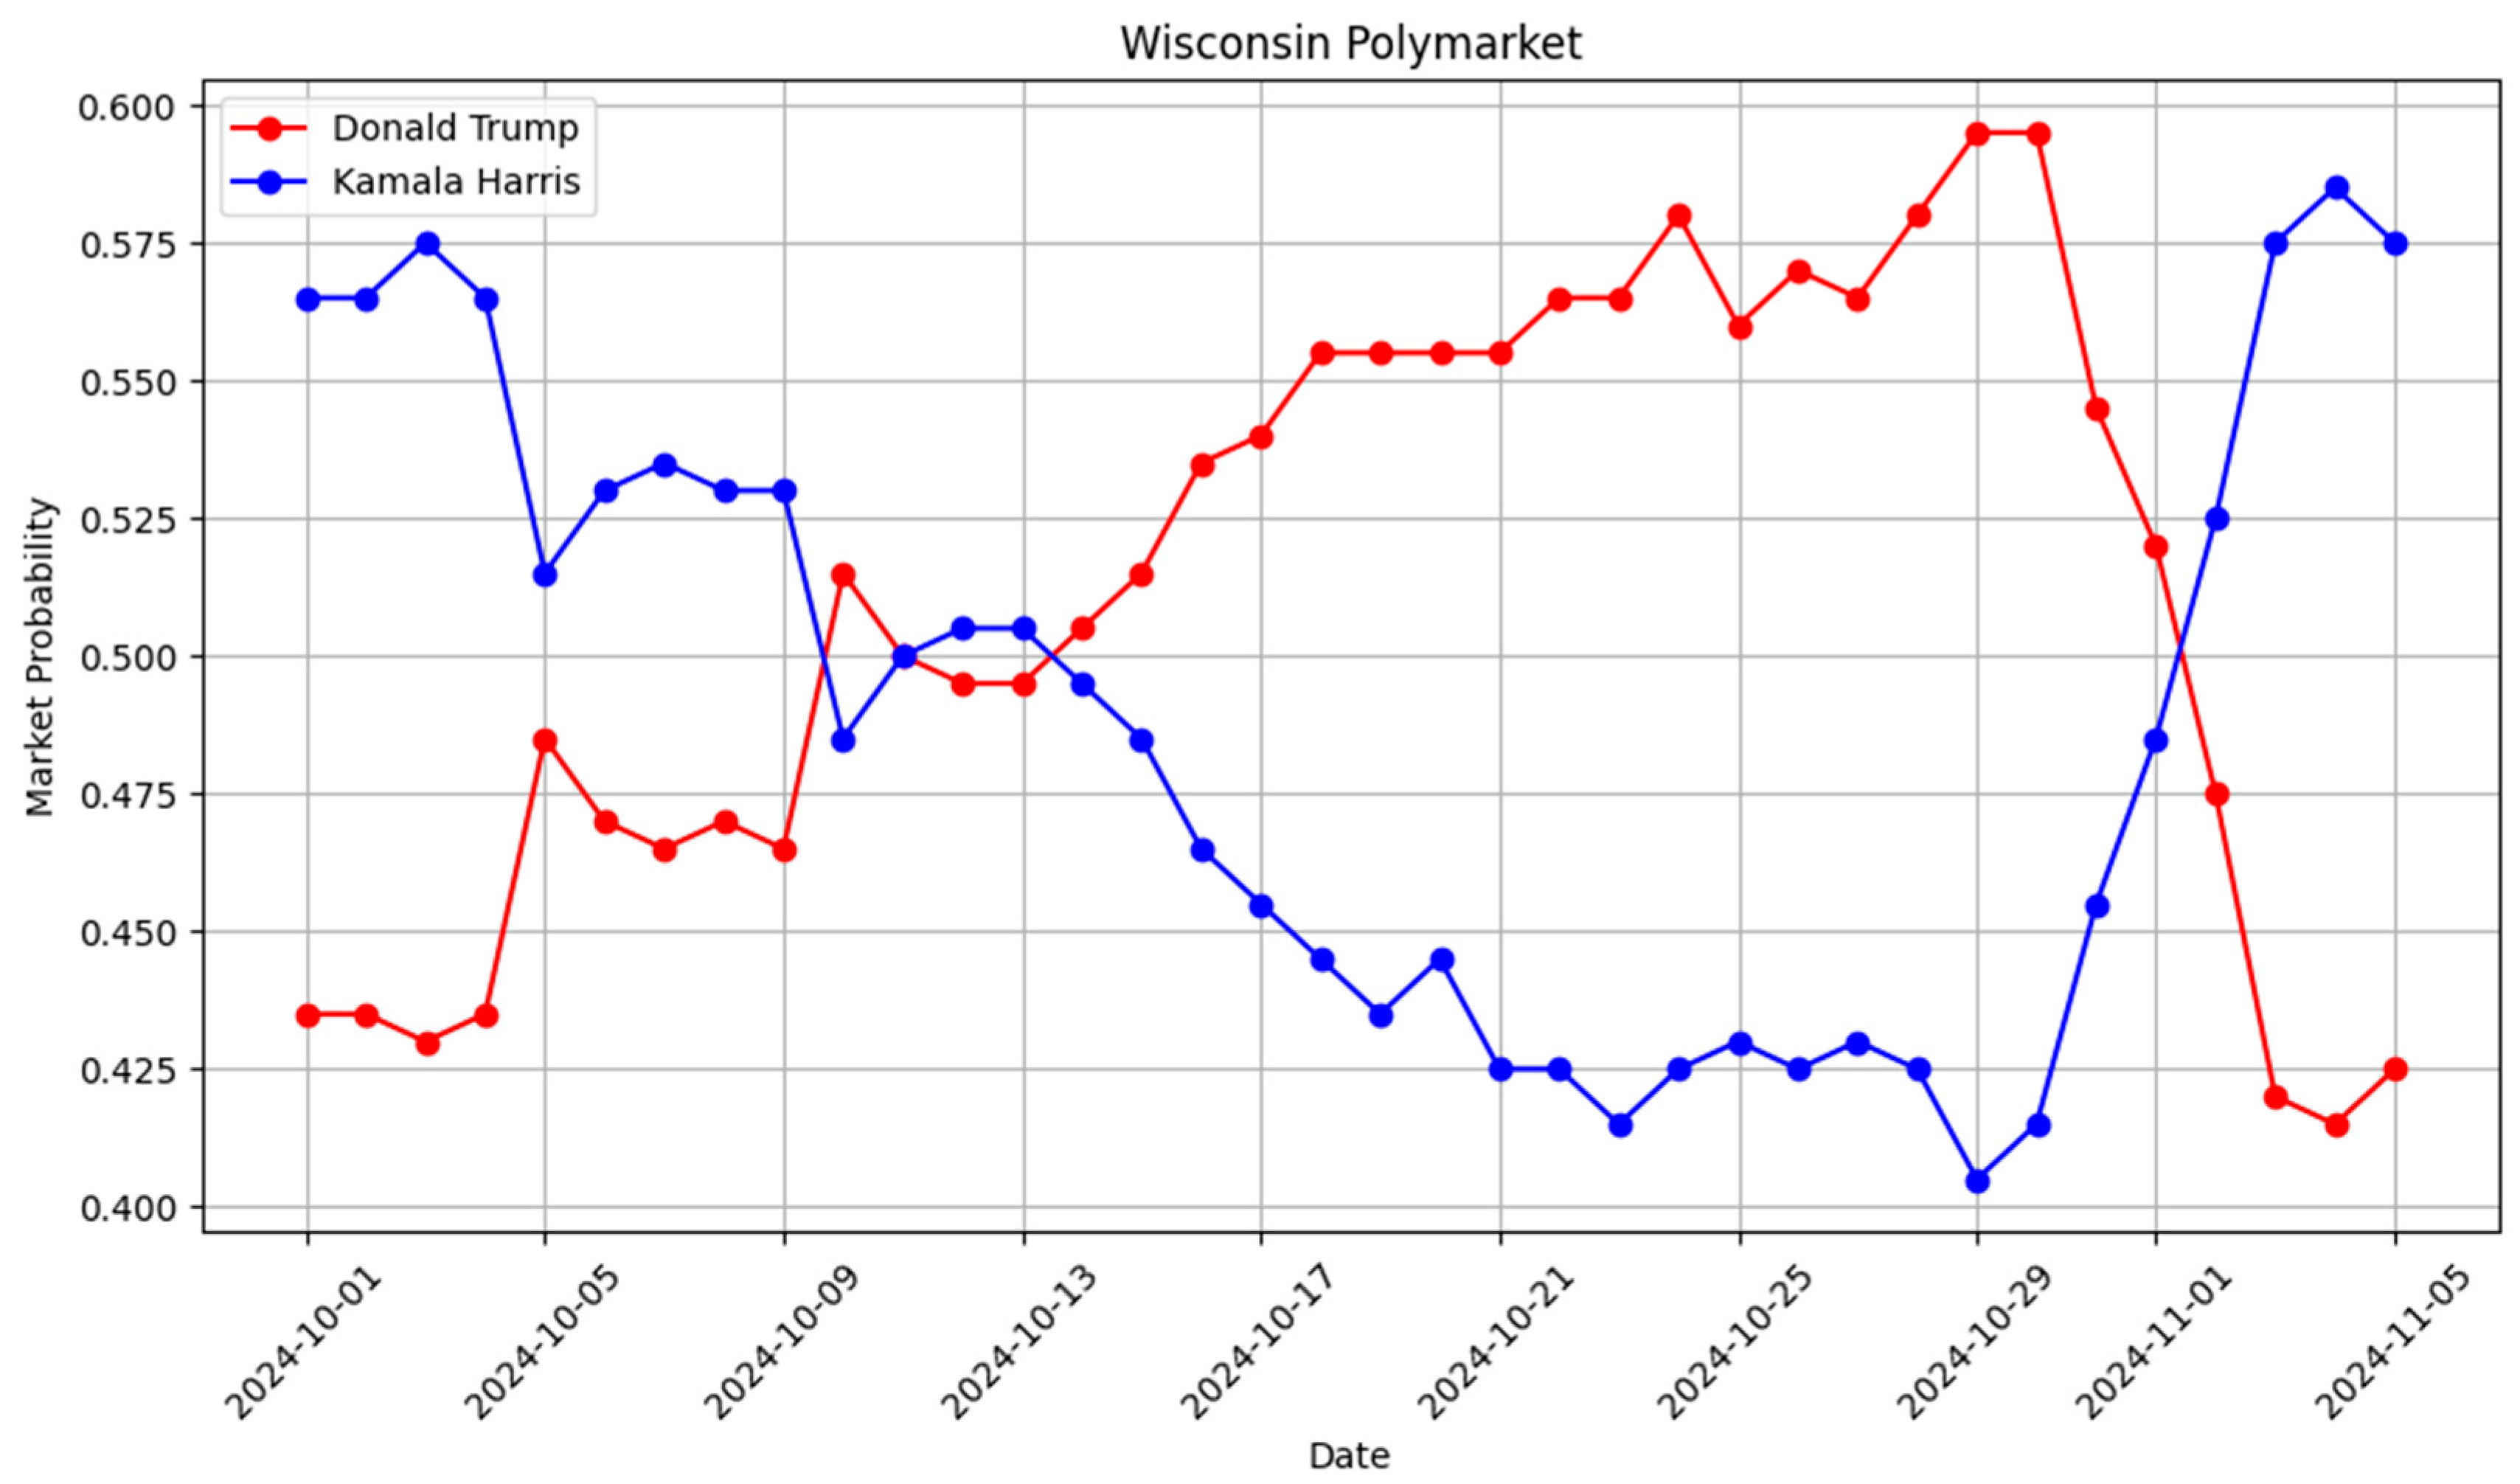
Observations for Wisconsin: When comparing the state of Wisconsin, Polymarket betting trends indicated a higher likelihood of victory for Donald Trump starting on 13 October, maintaining this lead consistently through election night. In contrast, traditional polls indicated only two brief moments, on 19 October and 23 October, where Trump and Harris were shown to have equal chances. The actual election results revealed that Trump secured Wisconsin by a margin of over 30,000 votes, highlighting the effectiveness of Polymarket in anticipating electoral outcomes more accurately than traditional polling methods. The betting markets showed a near parity between Trump and Harris, indicating a highly competitive dynamic that was not as apparent in traditional polling. You can see the difference between Polymarket and the polls in
Figure 4 and
Figure 5.
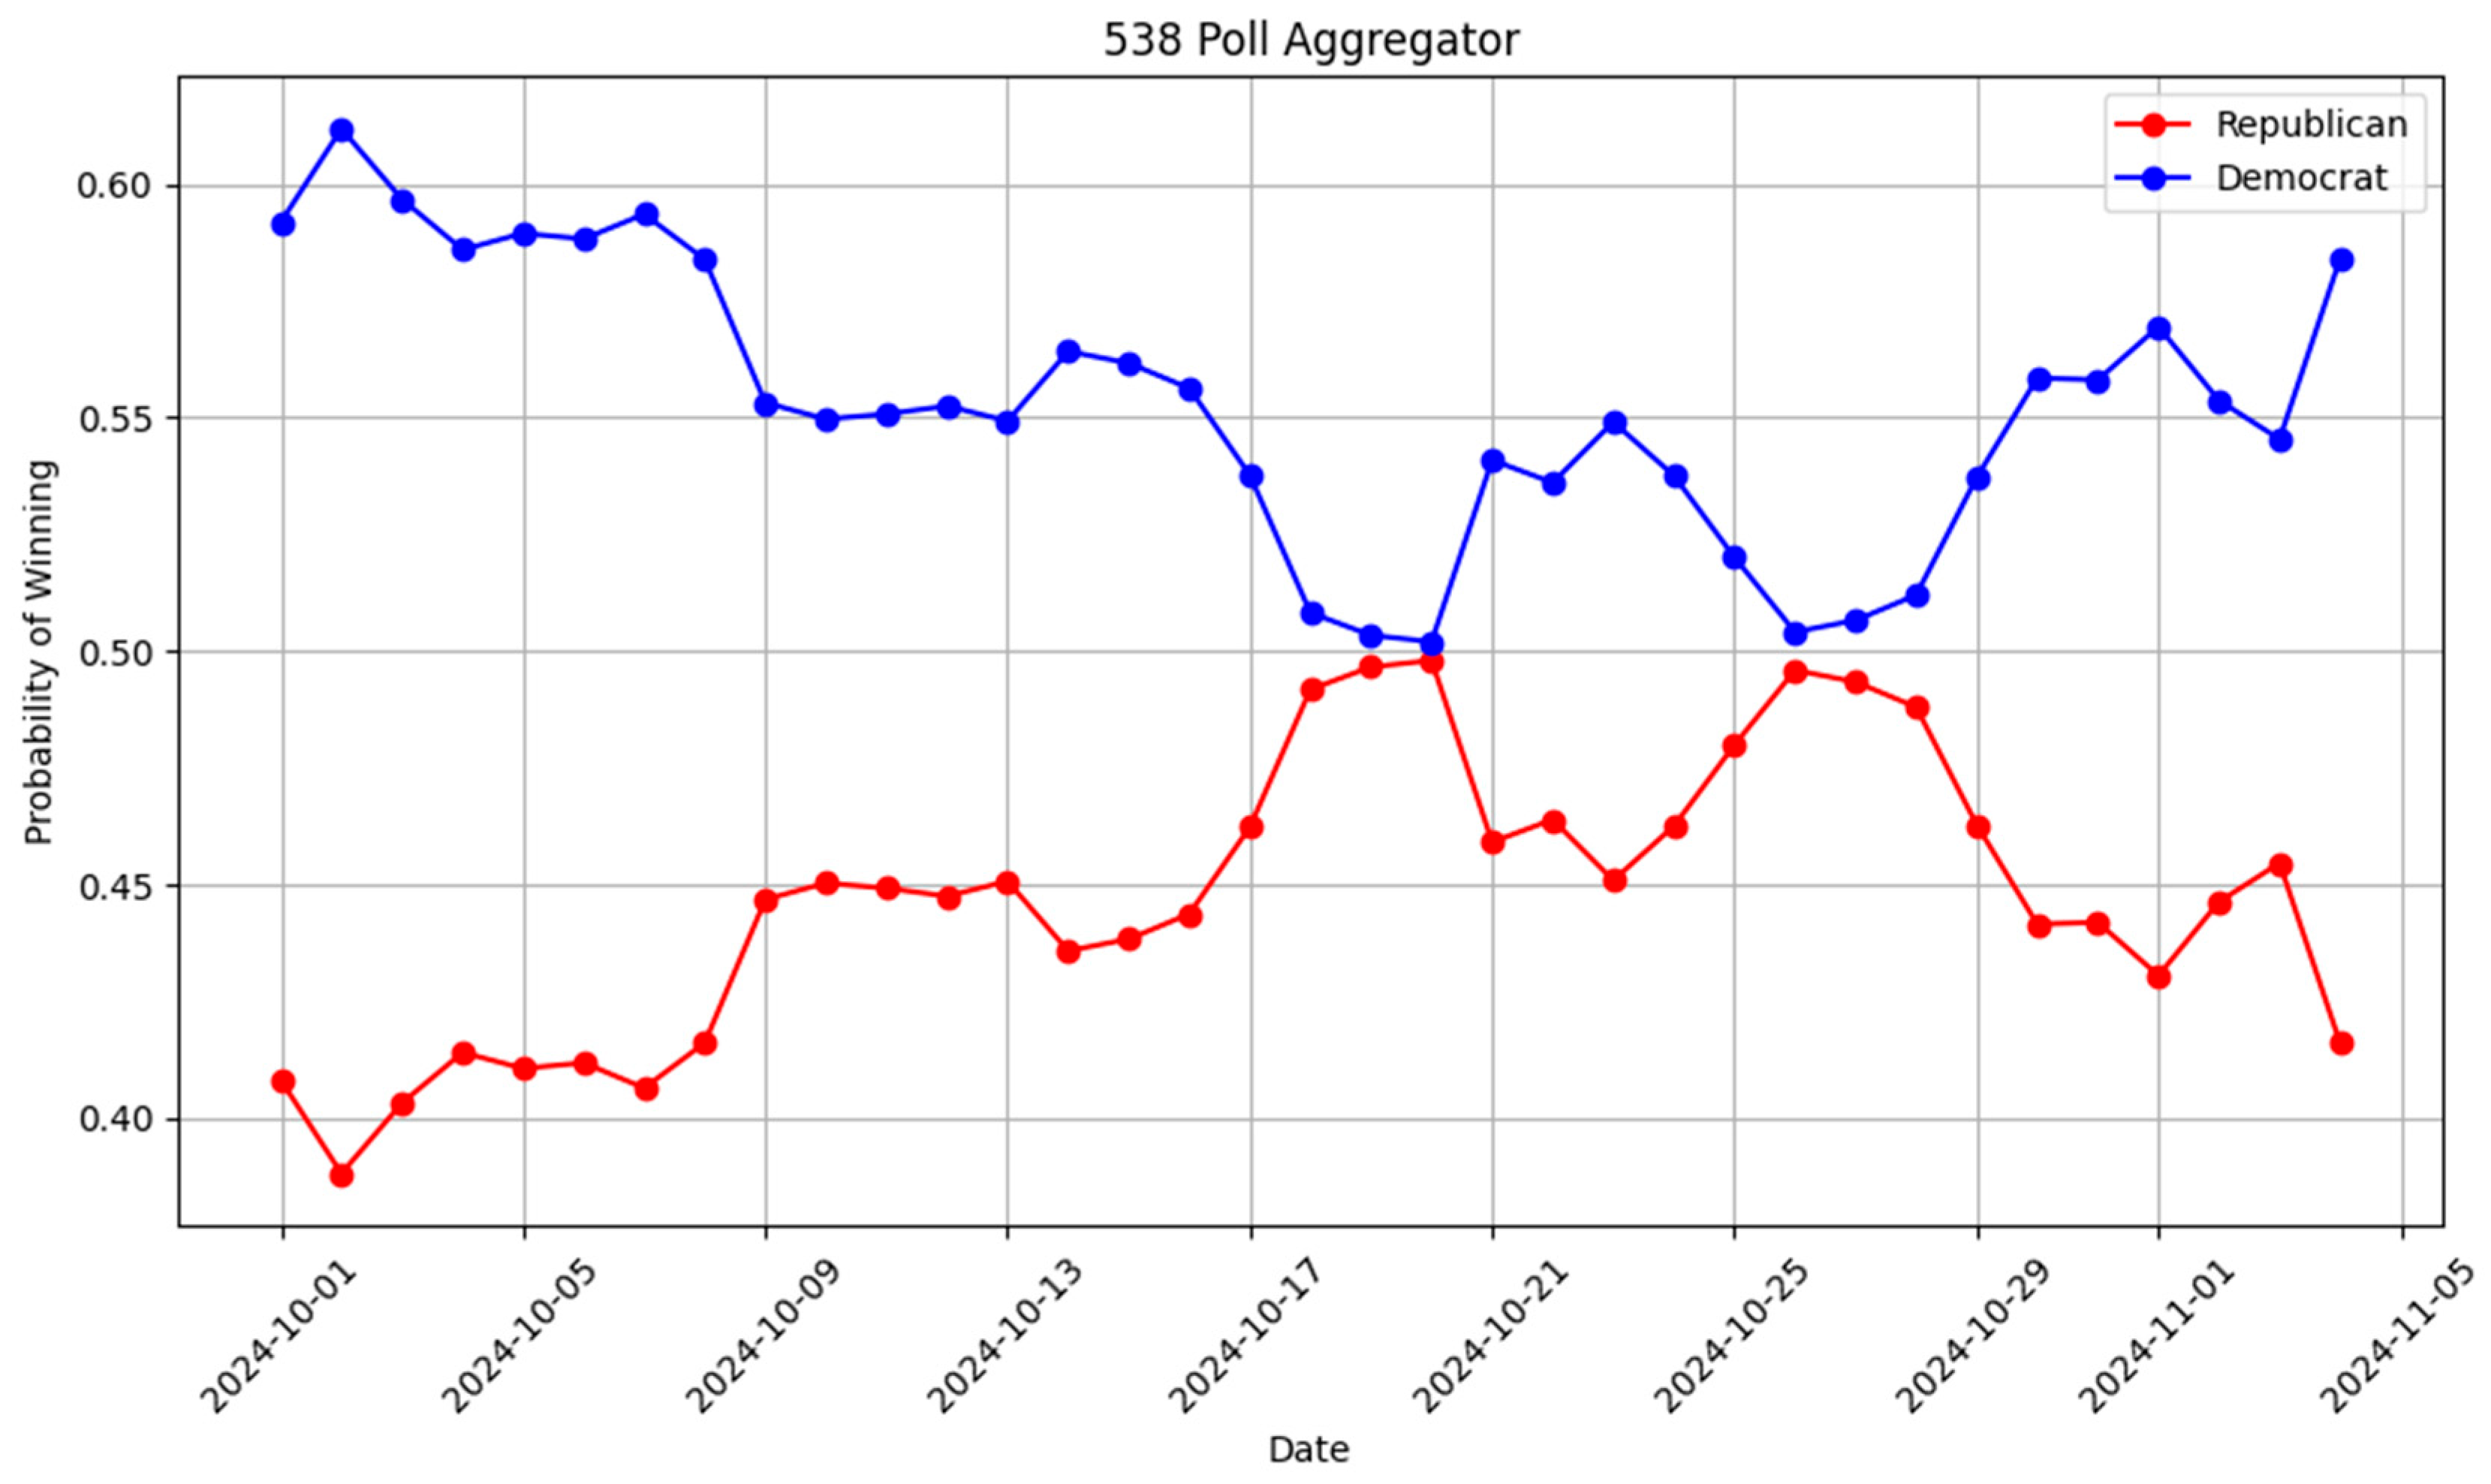
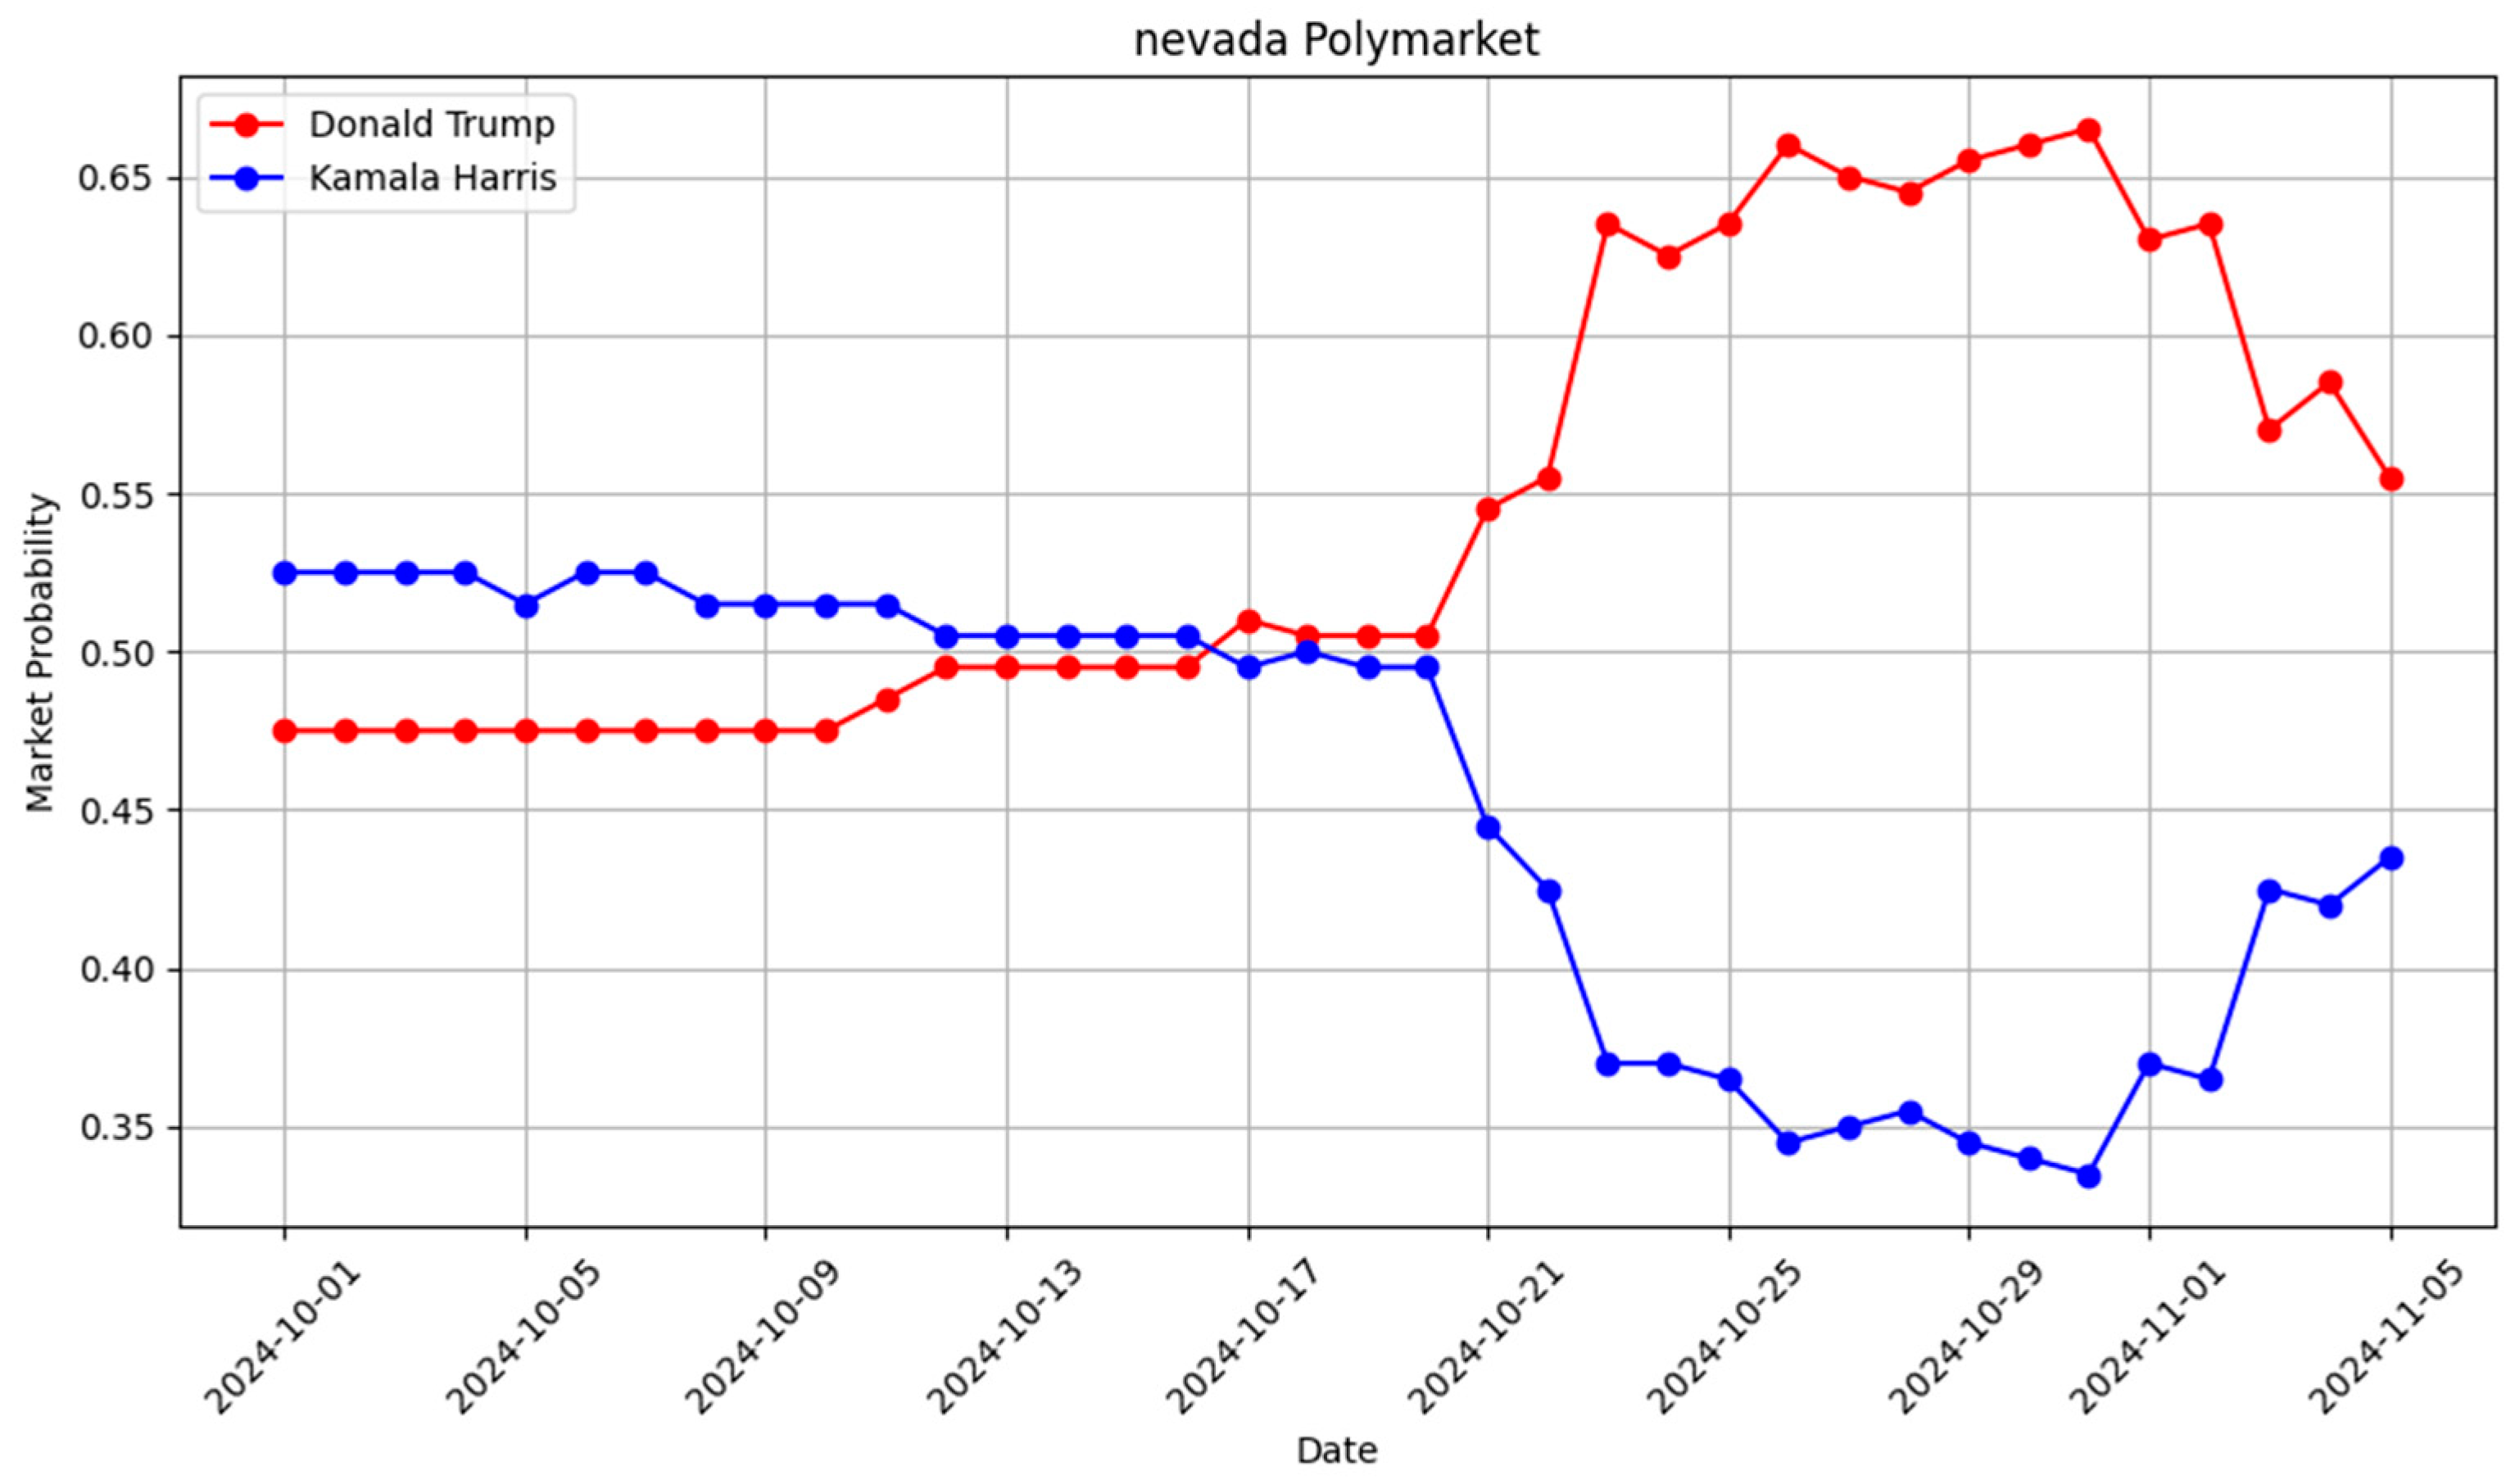
Observations for Nevada: Polymarket betting markets began favoring Donald Trump on 16 October, maintaining this pro-Trump trend consistently until election day. In contrast, the polls showed only two brief moments, on 24 October and 28 October, where Trump held a lead, with the overall projection remaining close. Ultimately, Trump won Nevada by over 78,000 votes, marking the first Republican victory in the state since 2004. While the polls suggested a tight race, the betting markets consistently indicated a clear pro-Trump trend, contrasting sharply with the dynamics observed in Wisconsin. In the states of North Carolina, Arizona, and Georgia, candidate Trump held a steady advantage starting from 8 March 2024, which persisted throughout the year until election night. On average, Polymarket bets indicated a majority support for Trump for approximately 195 days in these three states, signaling a sustained advantage for a specific candidate well before the election. You can see the difference between Polymarket and the polls in
Figure 6 and
Figure 7.
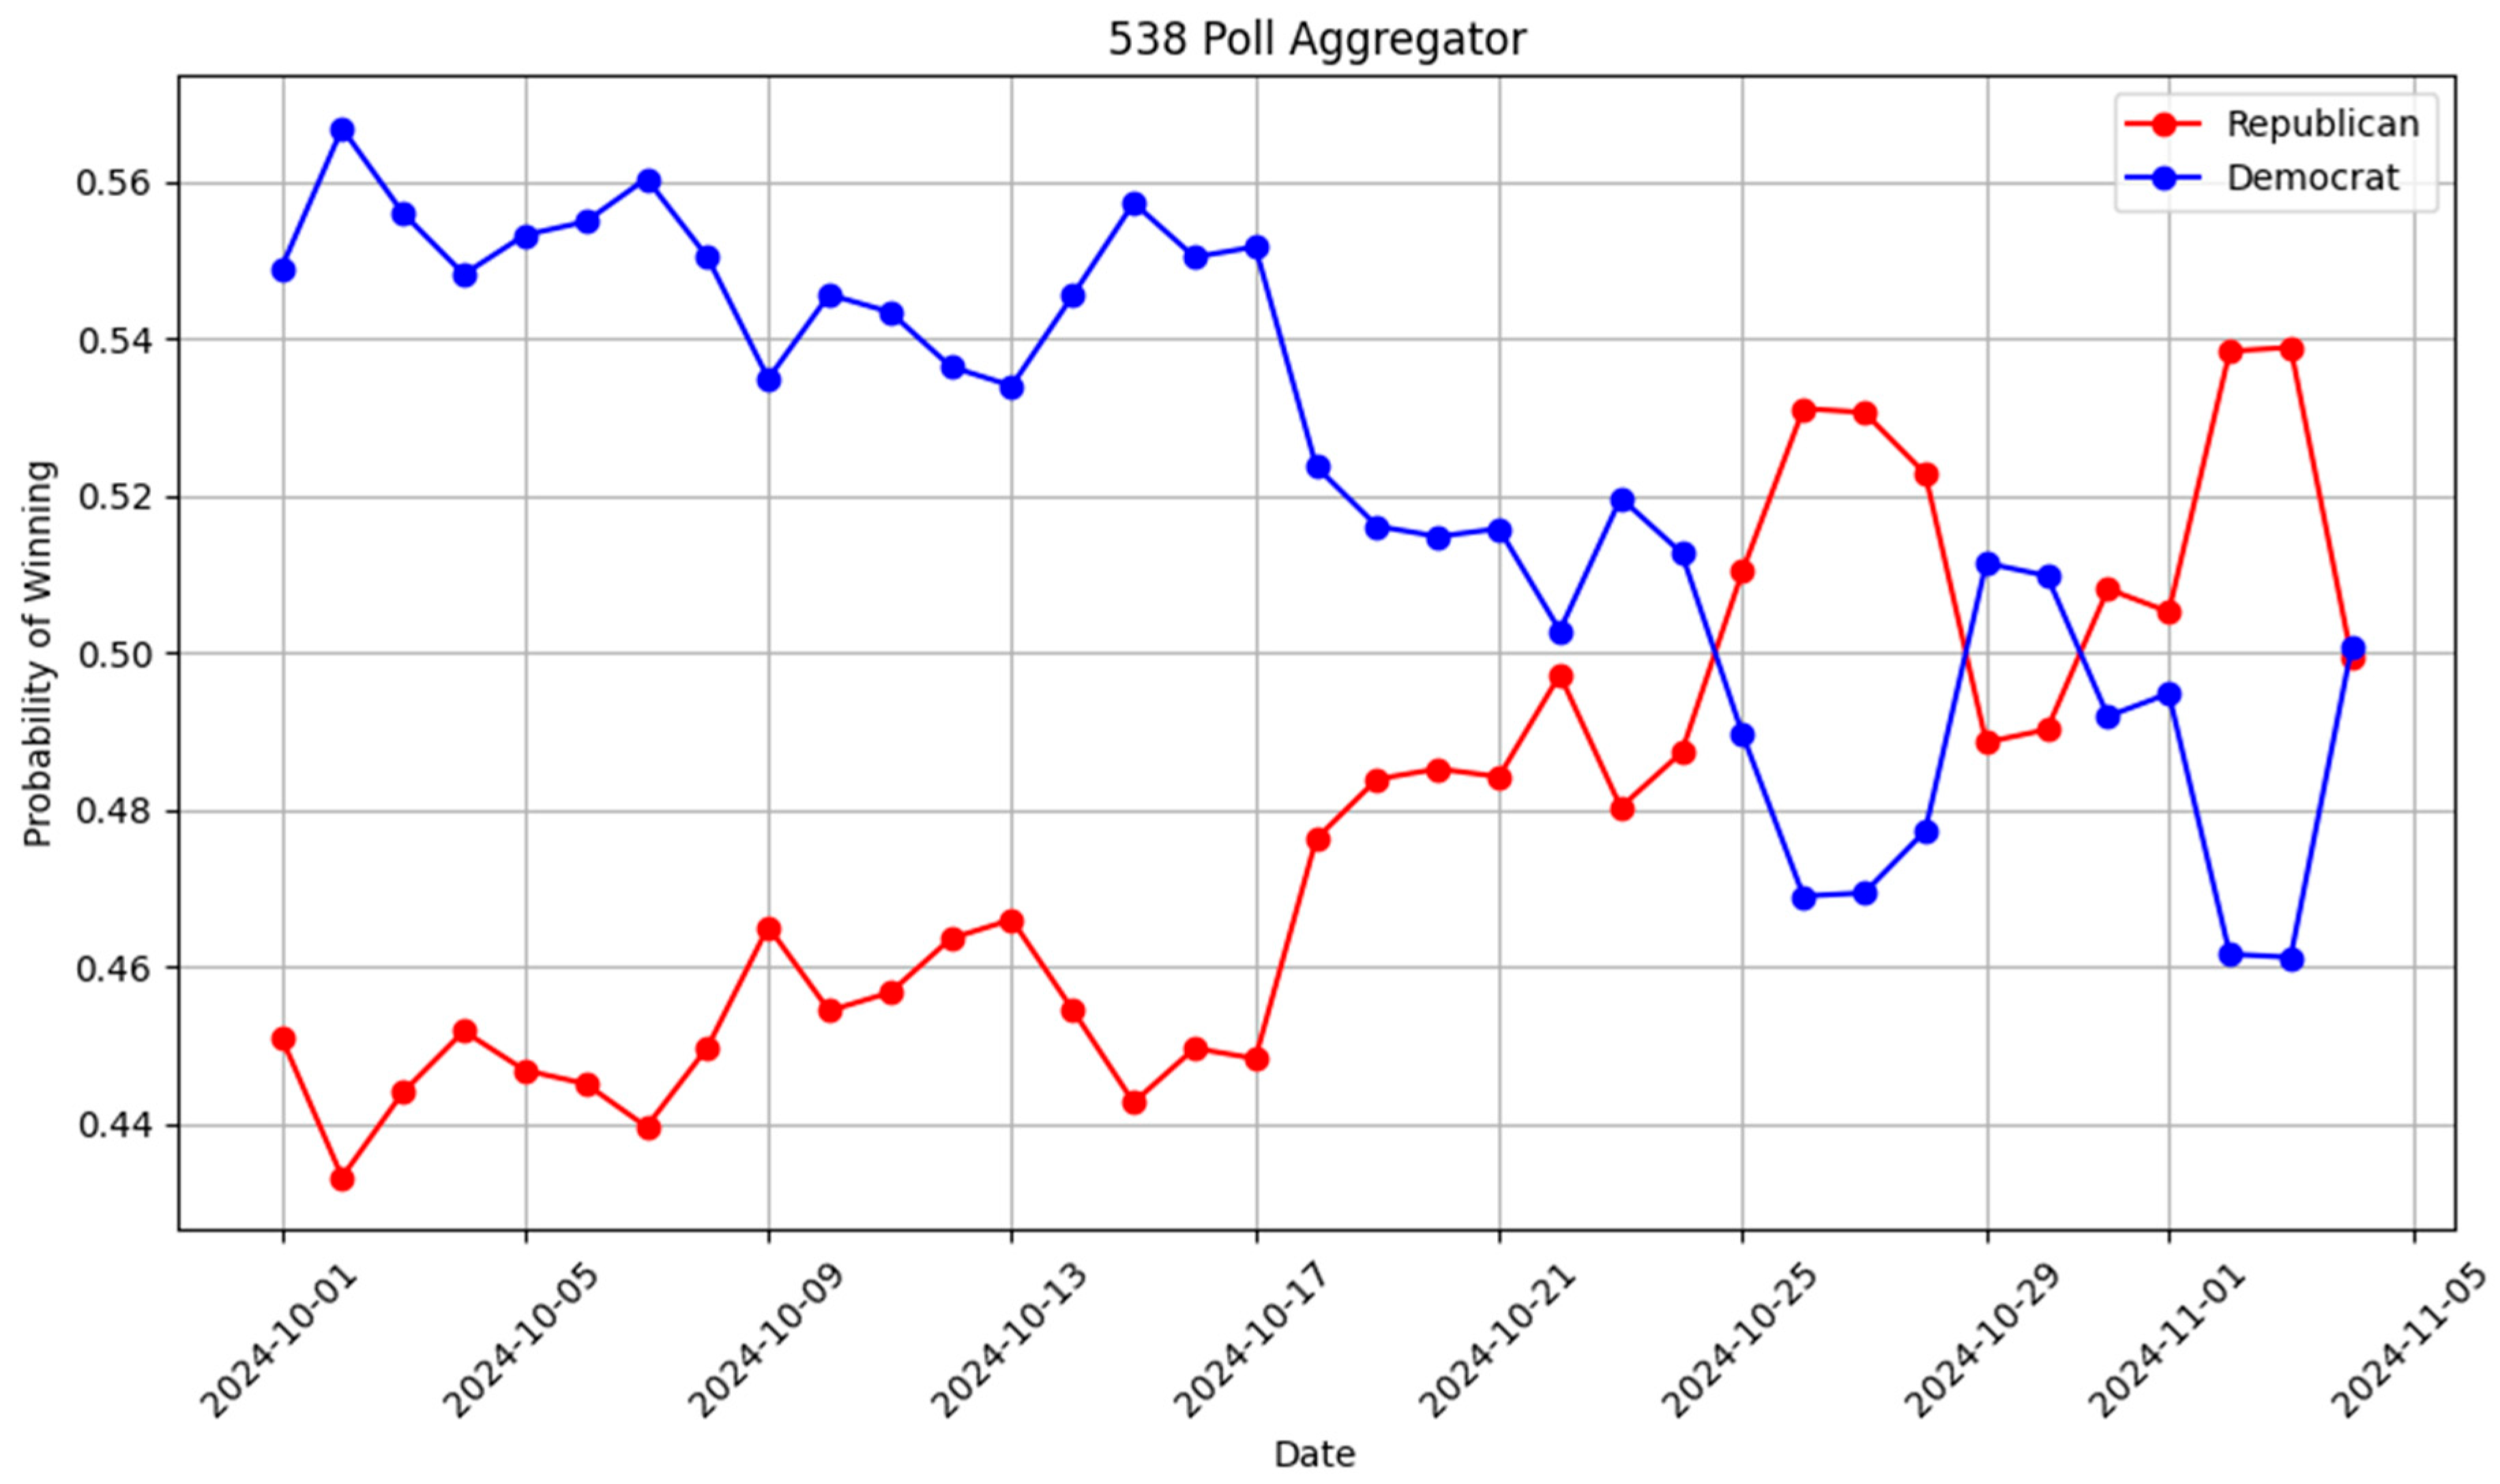
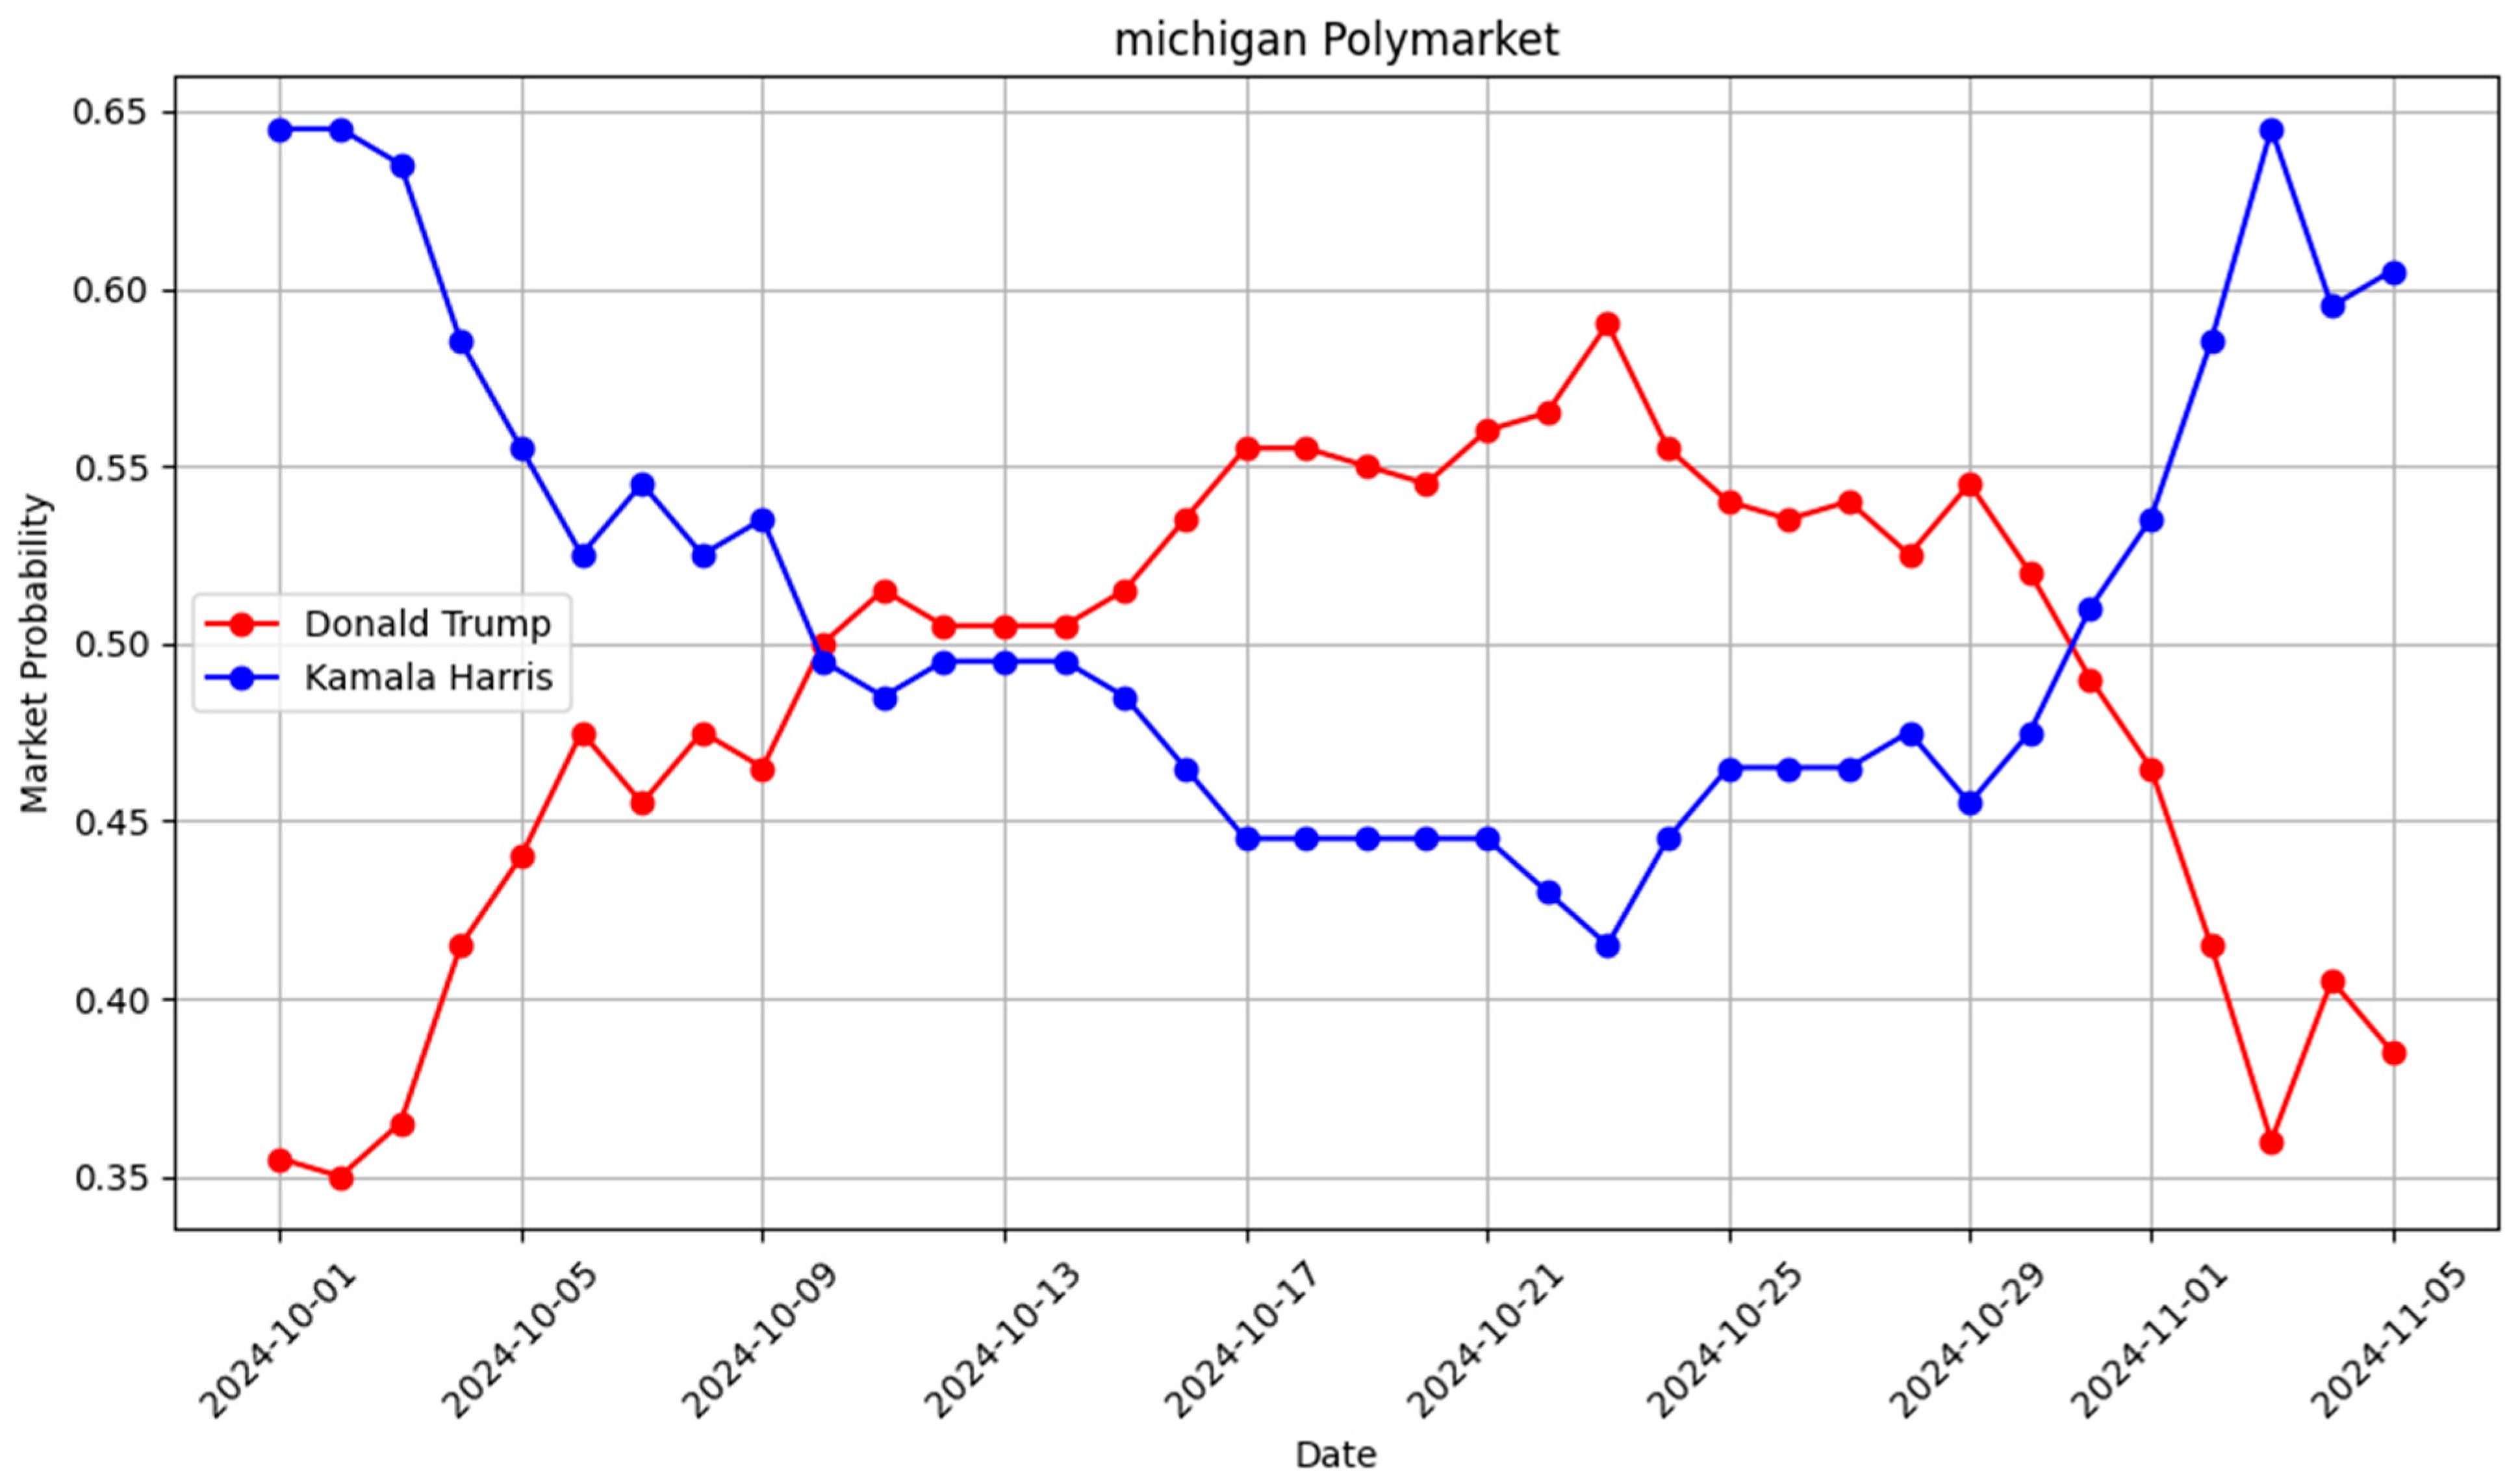
Observations for Michigan: For most of the analyzed period, Donald Trump held a lead in the betting markets; however, this shifted on 30 October, when Kamala Harris began to gain favor. Similarly, in the poll’s aggregation, Kamala first showed an advantage on 19 October. The actual election result saw Trump winning Michigan by over 83,000 votes. This outcome visually suggests that while betting markets can offer valuable insights, they are not infallible, underscoring the dynamic nature of these predictive tools. You can see the difference between Polymarket and the polls in
Figure 8 and
Figure 9.
5.3. Election Night Analysis
During election night, we closely monitored the decentralized prediction market activity and compared it with the Associated Press (AP) reports for calling the winner in each swing state as described in
Table 3. Our analysis revealed that the decentralized prediction market favored Trump as the winner, with more than 95% of participants betting on his victory in the swing states, with an average 157 min before the AP officially called the state for Trump (Without counting Arizona and Nevada due to how long it took for AP to call that election).
In most states, Polymarket’s signal preceded the official race call by several hours. Michigan was a notable exception, where the Associated Press called the race 8 min before Polymarket’s consensus reached the 95% threshold. This finding further demonstrates the potential of DPMs in providing timely and accurate insights into voting patterns, as they were able to predict the outcome of the swing states significantly earlier than traditional media outlets. This result reinforces the value of the Decentralized Prediction Market Voter Index in analysis of the US Presidential Election outcomes and highlights the potential advantages of DPMs over conventional polling methods.
6. Results
This section presents a comprehensive analysis of DPMVF’s performance across the seven key swing states, drawing insights from both cross-correlation and DTW results. The aim is to identify which states exhibited stronger early signals from Polymarket and which proved more challenging to predict.
The peak correlation values in
Table 4 are a direct output of our Cross-Correlation Function analysis, a standard method in time-series analysis for measuring the similarity between two discrete time series as a function of the time lag applied to one of them. For each state, we calculated the CCF between two specific daily time series: the Polymarket price margin (the difference between the daily average prices of the Trump and Harris contracts) and the aggregated polling margin (the difference between the daily polling averages for the same candidates). The “peak correlation” represents the maximum correlation coefficient found across all possible time lags, which quantifies the strongest linear relationship between the prediction market and polling data and is used to determine the lead time.
The application of the DPMVF reveals a diverse landscape of predictive signals across the analyzed swing states. Some states consistently demonstrated Polymarket’s capacity as a robust early indicator, while others presented a more ambiguous or absent signal.
States with Strong Early Signals: Arizona, Nevada, and Pennsylvania emerged as prime examples where Polymarket provided a clear and early signal. These states consistently exhibited substantial lead times, ranging from 11 to 14 days, indicating that Polymarket’s price movements anticipated shifts in polling data well in advance. The accompanying peak correlation values were exceptionally high, ranging from 0.943 to 0.988, signifying a very strong linear relationship between the market and polling trends. Furthermore, the DTW analysis for these states yielded low normalized distances, confirming a high degree of shape similarity and consistent temporal alignment between the Polymarket and polling series. This robust convergence of evidence from both cross-correlation and DTW strongly validates the DPMVF’s effectiveness in identifying clear, early predictive patterns in these crucial electoral battlegrounds.
6.1. Statistical Validation via Permutation Testing
To formally validate the predictive power of the DPMVF, we implemented a non-parametric Permutation Test. This method evaluates whether the observed lead-lag relationships and pattern similarities between Polymarket price signals and polling aggregates are statistically significant or could arise by chance. We randomly permuted the polling time series 1000 times and recalculated both the CCF and DTW metrics for each iteration. This generated null distributions for each metric, against which the observed values were compared.
As illustrated in
Table 5 across high-signal states such as Arizona, Nevada, and Pennsylvania, the observed CCF peaks and DTW distances consistently fell in the extreme tails of the null distributions, yielding empirical
p values below 0.01. For example, Arizona showed a lead of 14 days with a CCF peak of 0.975 (
p < 0.01), confirming that the alignment was not spurious. In contrast, states like North Carolina exhibited weak or non-significant signals (
p > 0.1), validating the framework’s ability to correctly identify low-signal environments. These results confirm that the early signals detected by the DPMVF are statistically robust and not artifacts of random variation.
6.2. Arizona: A Case of Strong Early Signal
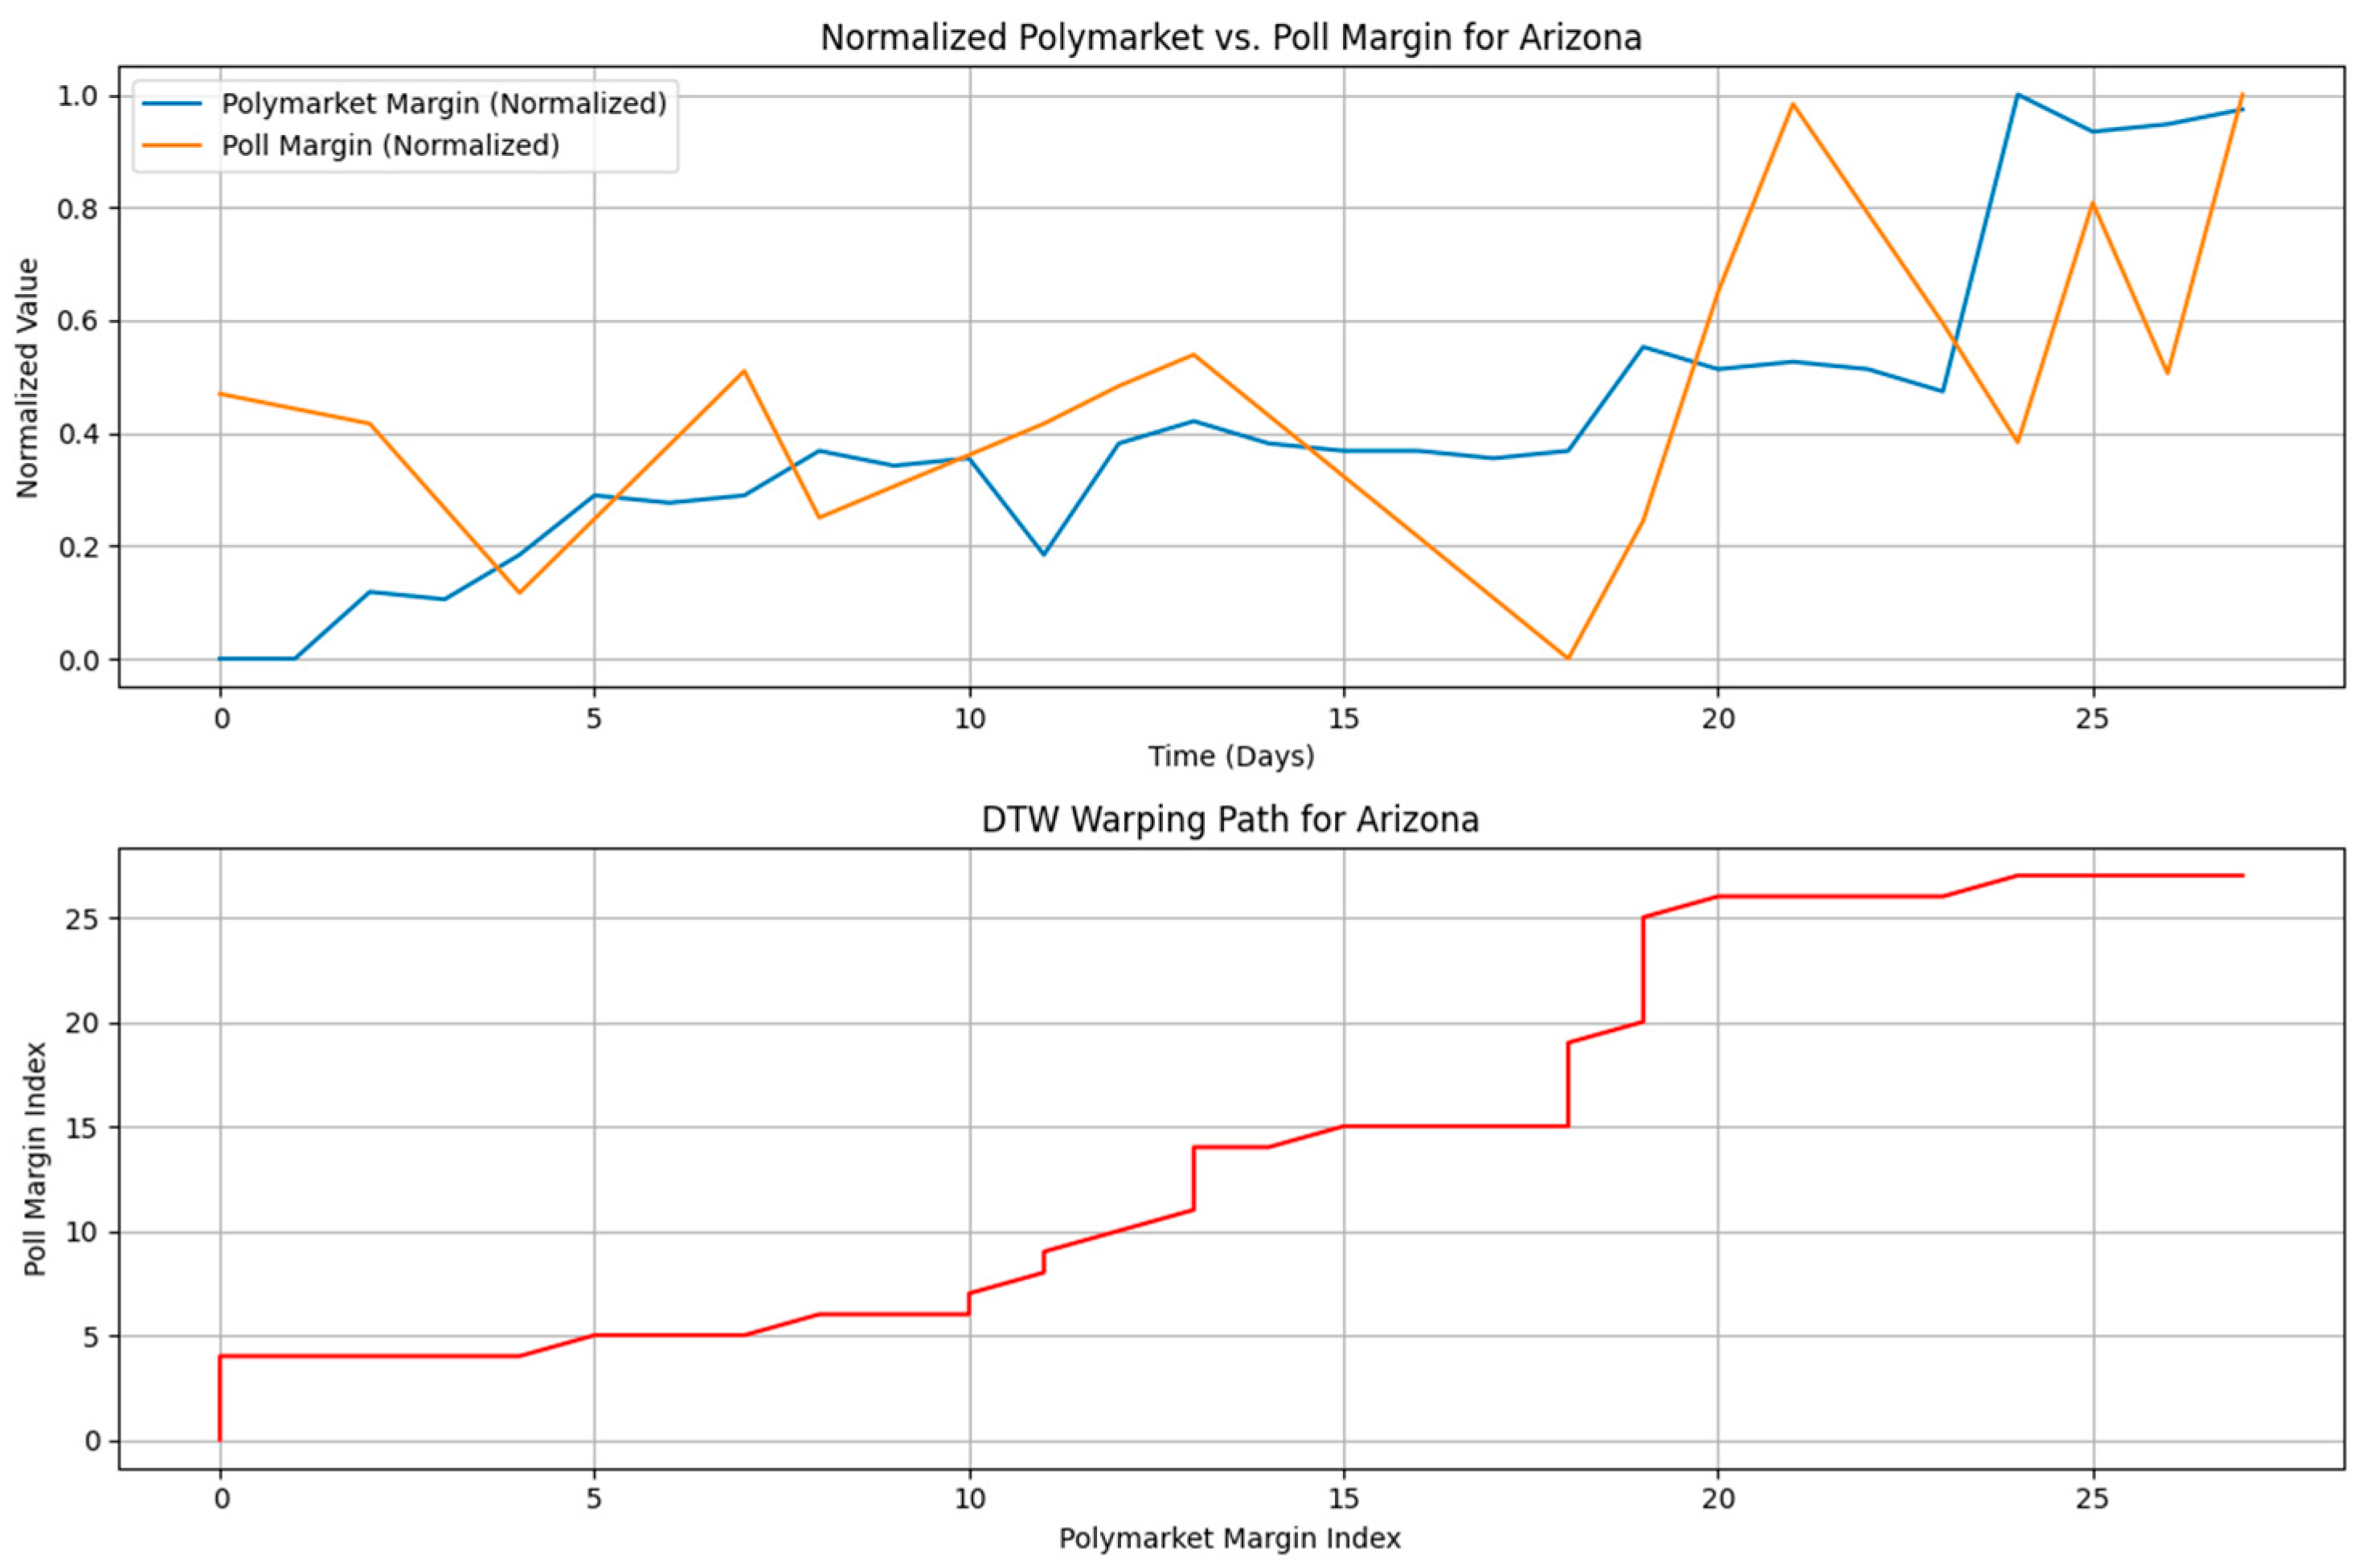
Arizona serves as a compelling illustration of the DPMVF’s capacity to identify a robust early signal. The cross-correlation analysis for Arizona revealed a significant 14-day lead time for Polymarket’s price margin over the aggregated polling averages. This temporal precedence was accompanied by an exceptionally high Peak Correlation of 0.975, indicating a near-perfect linear relationship between the two series with Polymarket consistently moving ahead of the polls. The CCF analysis for Arizona revealed a maximum cross-correlation of 0.988 at a 14−daylag (Polymarket leading). The Permutation Test confirmed this finding is statistically significant with the observed correlation falling outside the 99% confidence interval of the null distribution. This formally validates the predictive signal detected by the DPMVF.
Further corroborating these findings, the DTW analysis for Arizona yielded a remarkably low DTW normalized distance of 0.0984. This low distance signifies a profound degree of shape similarity and consistent temporal alignment between the Polymarket and polling trends. The optimal warping path (as visually represented in
Figure 10: Arizona DTW Analysis) demonstrates how points in the Polymarket series consistently align with future points in the polling series, providing clear evidence of a leading pattern. Collectively, these metrics position Arizona as a strong case where the DPMVF effectively captured a clear and early predictive signal from the decentralized prediction market.
States with Moderate Signals: Georgia represents a state with a moderate, yet discernible, early signal. While its lead time of 12 days was significant, the peak correlation of 0.500 suggests a less pronounced linear relationship compared to the strong signal states. The DTW normalized distance of 0.1967, while not as low as in Arizona or Nevada, still indicates a degree of shape similarity. This suggests that while Polymarket did provide an early indication in Georgia, the relationship was perhaps less consistent or more influenced by other factors, leading to a less robust signal than observed in the top-performing states.
States with Weak or No Signals: North Carolina, Michigan, and Wisconsin proved to be the most challenging states for the DPMVF to identify a clear early signal. These states exhibited very low lead times (0–1 day) and weak, negative, or near-zero peak correlations (−0.188 to 0.007). The DTW normalized distances for these states were comparatively higher, ranging from 0.1142 to 0.1315, further confirming a lack of strong shape similarity or consistent temporal alignment. For North Carolina, specifically, the analysis revealed that the polling data itself had extremely low variance, making it inherently difficult for any predictive model to identify significant shifts. In these instances, the DPMVF accurately indicated the absence of a clear, early signal from Polymarket, highlighting the framework’s ability to discern both strong and weak predictive contexts.
6.3. North Carolina: A Case of Weak or Absent Signal
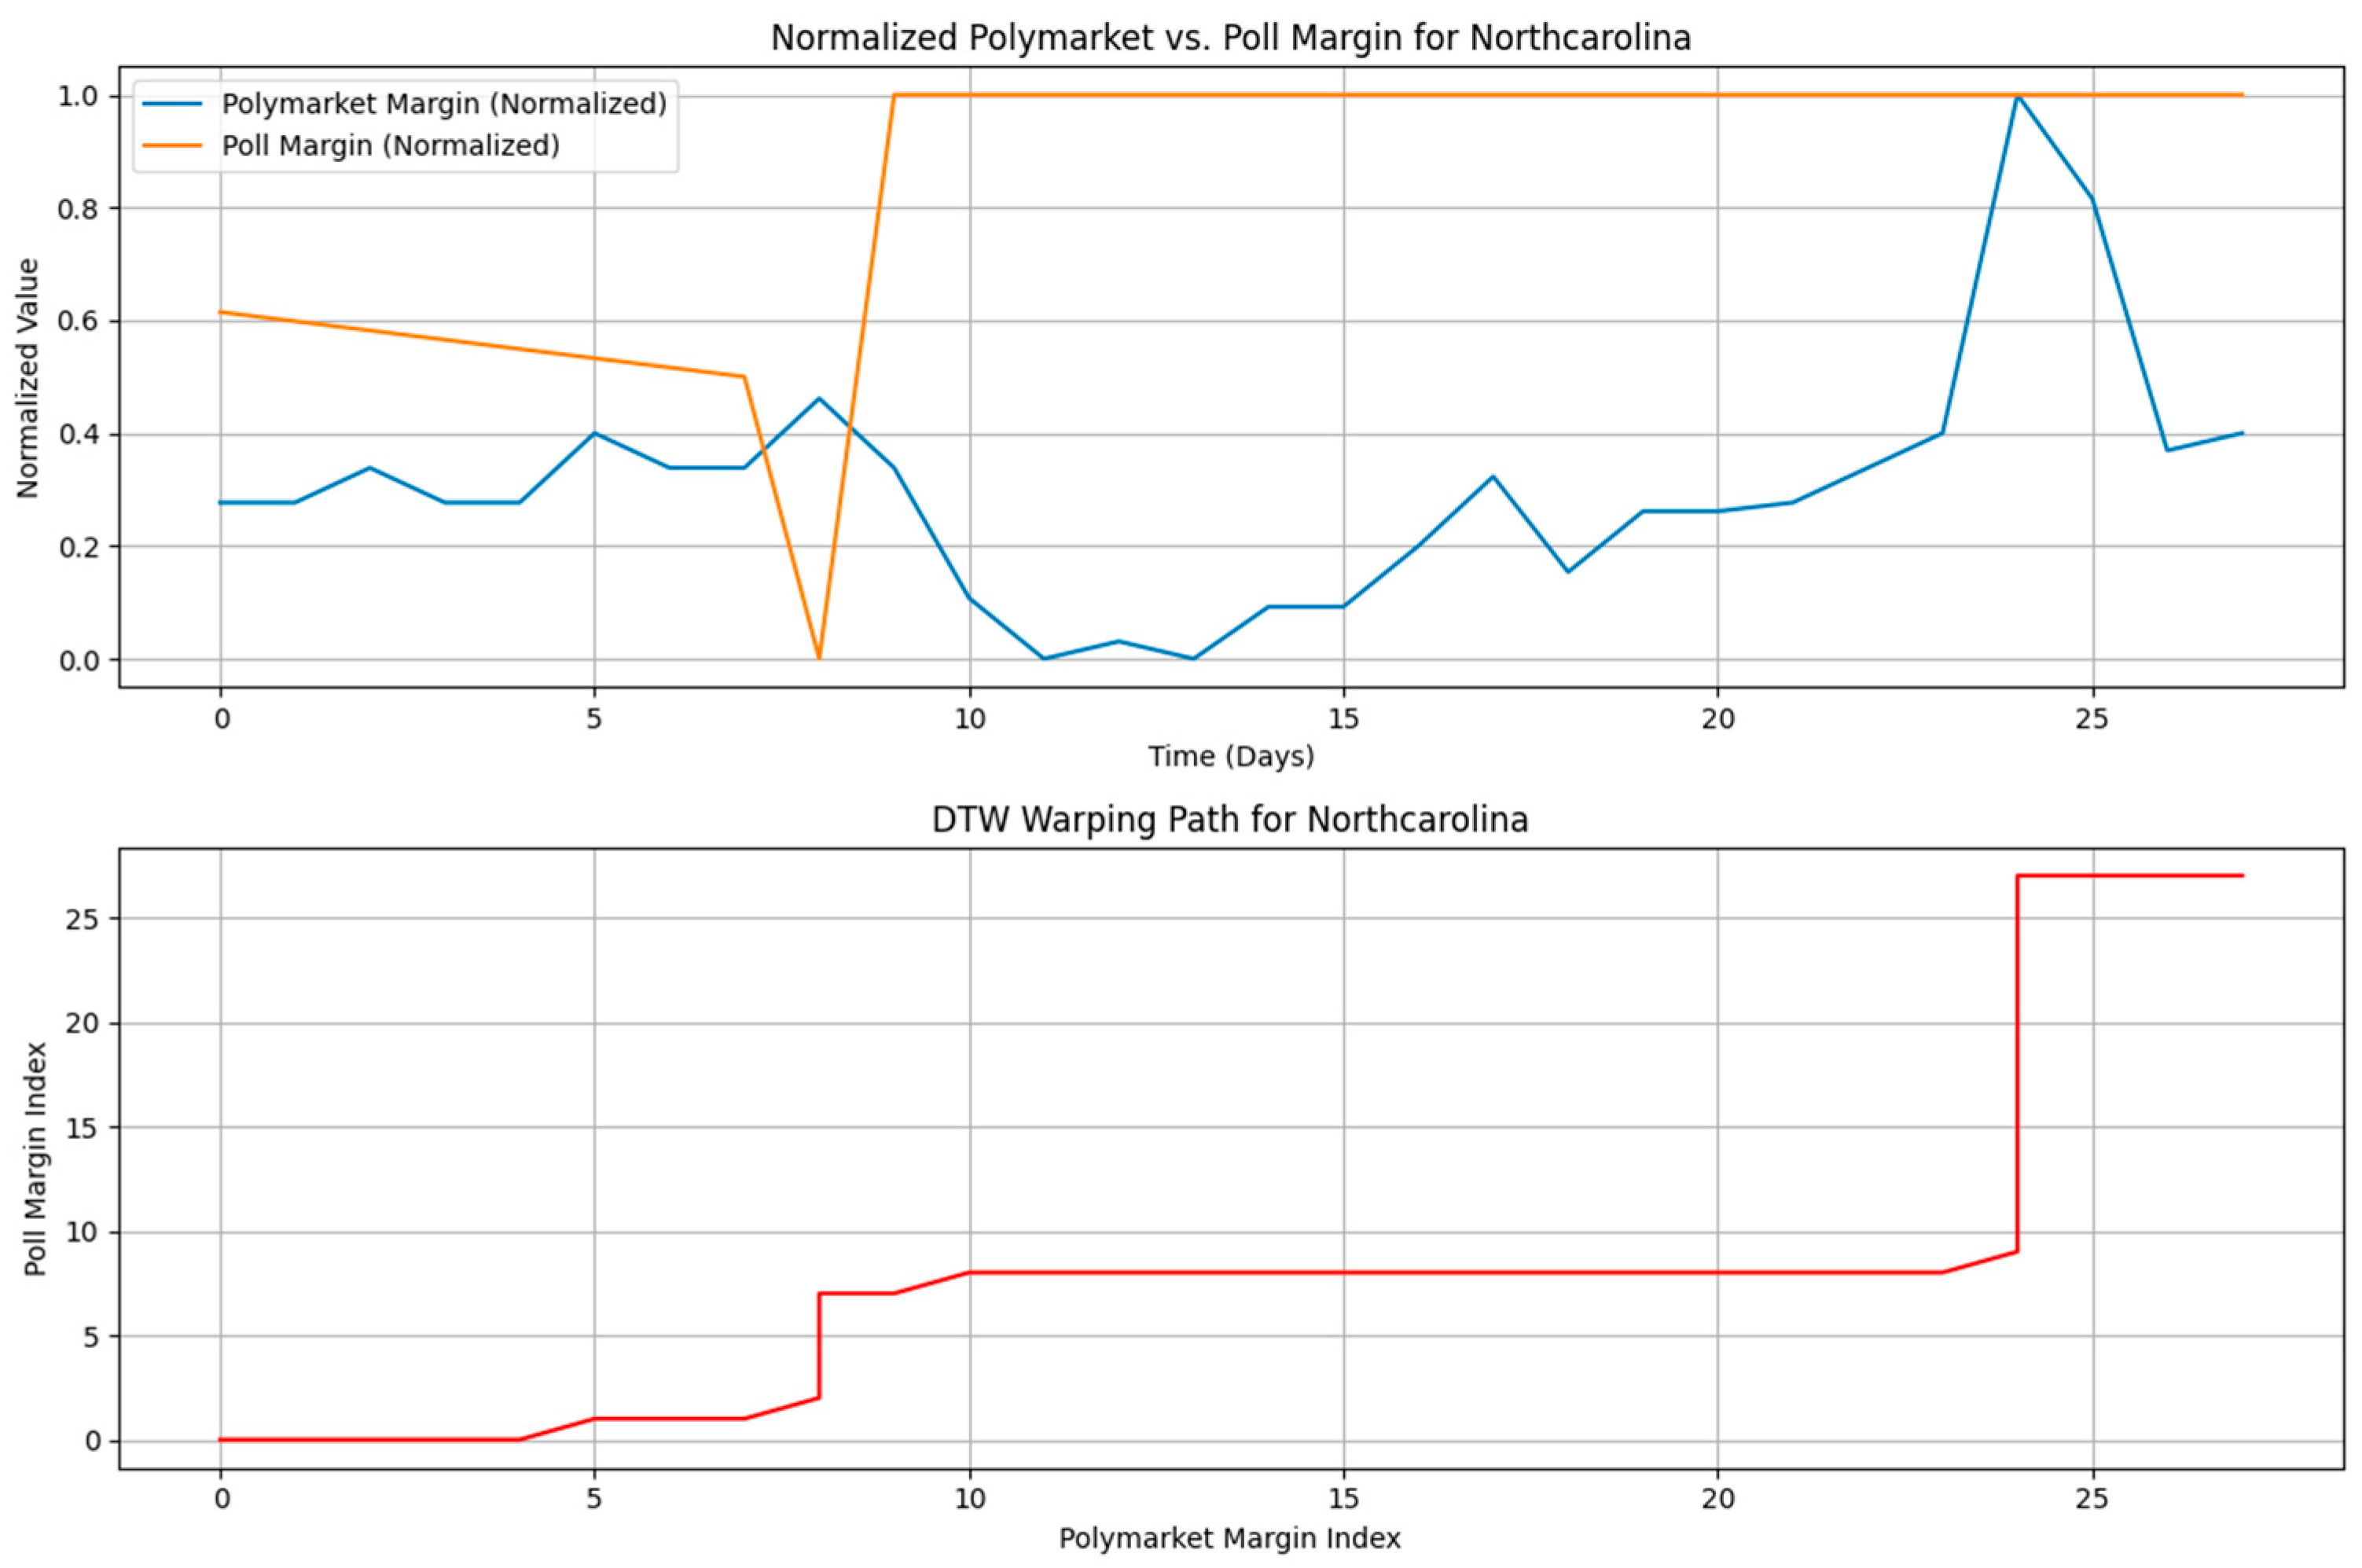
In contrast to Arizona, North Carolina exemplifies a scenario where the DPMVF did not identify a clear or robust early signal, highlighting the framework’s ability to discern the absence of a strong predictive relationship. The cross-correlation analysis for North Carolina showed a minimal 1-day lead time for Polymarket’s price margin, coupled with a weak and inverse Peak Correlation of −0.188.
Figure 11 suggests a negligible linear relationship, with market movements not consistently preceding or aligning with polling trends.
Reinforcing this observation, the DTW analysis for North Carolina resulted in a comparatively higher DTW Normalized Distance of 0.1315. This higher distance indicates a lower degree of shape similarity and less consistent temporal alignment between the Polymarket and polling series. The visual representation of the warping path (as seen in
Figure 10: North Carolina DTW Analysis) would show a less coherent alignment, reflecting the lack of a strong, consistent leading pattern. This outcome aligns with our previous diagnostic findings that the North Carolina polling data itself exhibited very low variance, limiting the potential for any predictive model to identify significant shifts. North Carolina thus serves as an important example of the DPMVF accurately indicating contexts where a clear early signal is not present.
The case of North Carolina warrants a deeper methodological explanation, as it reveals a key boundary condition of the DPMVF. Our framework is designed to measure the temporal precedence of one signal over another. However, for a lead-lag relationship to be measurable, both series must contain a “signal” that is, a discernible pattern of variance and change. In North Carolina, the aggregated polling data was exceptionally static, showing almost no significant movement for months. This effectively created a “low-signal environment” where the ground-truth data was analogous to a flat line. While the Polymarket data contained ample dynamic activity, our comparative methods (CCF and DTW) had no corresponding pattern in the polls to align with. This is not necessarily a failure of Polymarket’s predictive capacity but rather a reflection that there were no major shifts in public opinion for it to predict ahead of time. The DPMVF’s output of a weak or absent signal is therefore a correct and important finding: it accurately identified a state where the public opinion landscape was, according to the polls, fundamentally stable.
The contrasting results from Arizona and North Carolina underscore DPMVF’s capacity to differentiate between strong and weak early signals. While Arizona demonstrates the framework’s ability to identify robust temporal precedence and shape similarity, North Carolina illustrates its utility in diagnosing the absence of such clear predictive patterns. This comparative analysis reinforces DPMVF’s comprehensive approach to evaluating the efficacy of decentralized prediction markets in election analysis.
Overall, the data analysis underscores the variability in DPMVF’s performance across different states. While Polymarket demonstrated compelling early signals in several key battlegrounds, its predictive clarity was not universal. This variability can be attributed to factors such as the inherent stability of polling data, the liquidity and activity within the prediction market for a given state, and the influence of external events. The DPMVF, through its multi-faceted approach combining cross-correlation and DTW, effectively captures this spectrum of performance, providing valuable descriptive insights into the complex dynamics of decentralized prediction markets in election analysis
7. Discussion
Our study utilized two distinct time series spanning from 1 September to 5 November 2024. The first was a high-frequency, intraday dataset from Polymarket, capturing over 11 million transactions with precise timestamps. The second was a lower-frequency dataset of aggregated polling data, which is typically updated on a daily or weekly basis. To enable a direct comparison between these two disparate data sources, we transformed the granular, hourly Polymarket transaction data into a daily time series by taking the daily average of the contract prices. This conversion was a crucial step in our methodology, as it allowed us to synchronize the two-time series and apply our comparative analysis techniques, Cross-Correlation Function and Dynamic Time Warping, on a consistent daily frequency to identify lead-lag relationships between market sentiment and polling trends.
The Decentralized Prediction Market Voter Framework (DPMVF) was developed to investigate whether decentralized prediction markets (DPMs) like Polymarket act as leading indicators for shifts in voter sentiment compared to traditional polling. The first research question (RQ1) and its corresponding hypothesis (H1) were validated in specific, highly contested contexts. In states such as Arizona, Nevada, and Pennsylvania, the framework identified a significant lead time, with Polymarket price trends preceding polling shifts by as much as 14 days. The analysis, employing Cross-Correlation and Dynamic Time Warping, answered the second research question (RQ2) by quantifying this relationship, revealing not only a temporal lead but also a high degree of correlation (up to 0.988) and shape similarity between the market trends and subsequent polling data. This confirms that in these “strong signal” environments, the DPMVF effectively validated the hypothesis that DPMs can function as a robust early warning system for changes in voter sentiment.
The framework’s investigation into the consistency of these predictive signals across different states (RQ3) revealed that the predictive power of DPMs is not universal, leading to the invalidation of the second hypothesis (H2). H2 posited that Polymarket trends would consistently precede polling averages across all key swing states, but the results showed a stark divergence. In states like North Carolina and Wisconsin, the DPMVF diagnosed a “weak” or “absent” signal, with negligible lead times and low correlation. The framework demonstrated that this was not a failure of the prediction market itself, but rather a correct identification of a “low-signal environment” where the underlying polling data was exceptionally static. Therefore, the DPMVF invalidated the hypothesis of consistent predictive leads, showing that the effectiveness of DPMs is highly dependent on the electoral context and the volatility of public opinion.
Ultimately, the DPMVF proved to be a successful analytical tool, not by offering a simple “pass/fail” judgment on DPMs, but by providing a nuanced, contextual understanding of their predictive capabilities. The framework successfully validated its core premise: it can empirically measure the lead-lag relationship between DPMs and polling, confirming a strong predictive signal in some states while also correctly diagnosing the absence of such a signal in others. By differentiating between environments where DPMs are effective leading indicators and those where they are not, the DPMVF provides a crucial methodology for researchers, journalists, and political analysts to interpret the complex signals emerging from decentralized prediction markets with greater accuracy and context-awareness.
This study successfully demonstrated that decentralized prediction markets can serve as powerful leading indicators of voter sentiment, though their predictive clarity is highly context dependent. By applying the Decentralized Prediction Market Voter Framework (DPMVF), we identified significant lead times of up to 14 days in key swing states like Arizona, Nevada, and Pennsylvania, with both high cross-correlations and strong shape similarity. The framework correctly diagnosed a weak or absent signal in states such as North Carolina and Wisconsin. This variability is the most important finding of our research, as it suggests that DPMs are not a monolithic or universally infallible tool, but a complex signal whose effectiveness is tied to specific market and data environment conditions.
The strong performance in states like Arizona and Pennsylvania can be interpreted through the theoretical lens of “sociotechnical assemblages” proposed by Wu. We interpret that the markets for these highly contested states developed a more mature and efficient “structured trader ecology.” This maturity was likely driven by a confluence of factors: higher market liquidity due to intense national media focus, a greater number of engaged and financially motivated traders, and, critically, a more volatile polling landscape. In essence, the visible fluctuations in the polling data provided a discernible “signal” for the financially incentivized market participants to anticipate and trade against, allowing the DPM to function as an effective early warning system.
In the other side, the weak signal in North Carolina reveals a crucial boundary condition for the DPMVF and for prediction markets in general. As our analysis noted, the aggregated polling data in this state was exceptionally static, creating a “low-signal environment” analogous to a flat line. In such a context, even a highly liquid prediction market has no significant shifts in public opinion to predict. Therefore, DPMVF’s finding of a weak signal should not be seen as a failure of the prediction market itself, but rather as a correct and vital diagnostic output. It demonstrates the framework’s ability to identify contexts where the underlying phenomenon (voter sentiment) is stable, thereby preventing misinterpretation of market noise as a meaningful leading indicator.
Blockchain-based systems that allow for 24/7 trading enhance market efficiency. Platforms such as Polymarket have become consolidated as the largest decentralized prediction markets in the world, leveraging the full potential of asset tokenization [
38,
39,
40,
41]. Unlike traditional systems, where participants simply place a wager or select an outcome (e.g., supporting Trump or Kamala Harris in an election) and can later withdraw their position with certain penalties, blockchain systems such as Polymarket or Kalshi operate differently. In these platforms, participants purchase tokens that represent specific positions. This means they are not only betting on the outcome but also trading on the fluctuating probability of that outcome over time. For example, if the probability of Trump winning is priced at 0.55 on a given day, purchasing one Trump token at that price locks in that position. If, a week later, the odds increase and the token price rises to 0.75, the participant can sell and make a profit. Conversely, if Kamala Harris tokens are valued at 0.80 in California and later fall to 0.40, selling at that moment would crystallize a loss. However, if Harris ultimately wins, the token value returns to 1.00, whereas a loss in the election would drive the token value to zero. Another scenario illustrates how averaging positions work. Suppose a participant buys a Trump token in Nevada at 0.45 and then another at 0.50 the following day. Their average entry price is 0.475. Depending on subsequent price changes, they may decide to sell before the election to manage risk or avoid further losses. The advantage of using tokens as tradable outcomes lies in the flexibility and efficiency they bring to prediction markets. Moreover, platforms such as PumpfdotFun extend the concept of tokens to new business models. This may help explain why blockchain-native prediction markets behave differently from traditional ones. Polymarket could emerge as a valuable tool for analyzing elections and providing early signals of political outcomes [
38,
39].
On social media, people can express support for a candidate without any financial consequence, as posting or sharing content in favor of a candidate costs nothing. In contrast, in a DPM, participants risk their own money when placing bets. If they bet on a candidate they believe is unlikely to win, they stand to lose their money if that candidate loses. The only exception to this is whether there is a stakeholder who intentionally places such bets, perhaps as part of a strategy to influence the market or manipulate the outcome.
Beyond the academic contributions, these findings have significant practical implications for pollsters, political campaigns, and the media. The results suggest that stakeholders should not treat DPMs as a replacement for traditional polling, but rather as a complementary, high-frequency analytical tool. In highly contested and dynamic races like Arizona’s, DPMs can act as a “canary in the coal mine,” flagging shifts in sentiment weeks before they are captured by polls. However, in stable races like North Carolina’s, DPMs may offer little predictive advantage. For practitioners, the key is context: the DPMVF demonstrates that the value of a prediction market’s signal is not absolute but must be interpreted in relation to the dynamics of the specific electoral environment.
This study’s primary theoretical contribution is bridging the gap between the microstructural analysis of DPMs and their macrosocial predictive utility. While Wu’s work explains the internal mechanics of how these markets function despite their inefficiencies, our DPMVF provides the first robust, comparative framework to empirically test the external validity of that output. Our findings demonstrate that the internal characteristics of the “sociotechnical assemblage”—its liquidity, trader dynamics, and responsiveness—have a direct and measurable impact on the market’s external performance as a leading indicator. We have moved from theorizing the internal engine of DPMs to quantifying the quality of the predictive signal it produces in the real world.
Instead of forcing a traditional causality test, we opted for a more robust descriptive approach using Cross-Correlation Function (CCF) and Dynamic Time Warping (DTW). These methods are specifically well-suited for shorter time series and are designed to quantify the strength and consistency of lead-lag relationships and pattern similarities, even when they are non-linear. The CCF provides a clear measure of the linear correlation and lead time, while DTW offers a robust measure of shape similarity. Our aim was to provide strong descriptive evidence of the “early signal” phenomenon in a context where formal significance testing is not appropriate. We believe this approach provides a more transparent and methodologically sound analysis given the data constraints, while still offering compelling evidence of the predictive value of decentralized prediction markets.
In conclusion, the DPMVF offers a foundational framework for the empirical analysis and validation of decentralized prediction markets as a novel tool in election analysis. While this study confirms their immense potential, it also highlights the critical importance of understanding their contextual limitations. Future research should build upon this framework by incorporating on-chain metrics—such as trading volume, wallet concentration, and the behaviour of elite “whale” traders—to further explain the state-level variability we observed. By quantitatively linking the internal market dynamics to the external signal strength, we can move towards a more comprehensive and predictive theory of when and why these sociotechnical assemblages succeed in forecasting the future.
8. Conclusions
These findings contribute to the ongoing debate on the effectiveness of decentralized prediction markets in providing early and accurate insights into voter perceptions. The study demonstrates that decentralized prediction markets may offer advantages over traditional polling methods, such as real-time updates and the ability to capture sudden shifts in voter sentiment. The implementation of the non-parametric Permutation Test provides the necessary statistical rigor to confirm that these observed lead-lag relationships and pattern similarities are highly significant and are not artifacts of random alignment. The proposed DPMVF may serve as a valuable tool for understanding election outcomes and informing various stakeholders, including political campaigns, media, and the public.
Decentralized prediction markets have garnered significant scholarly interest as instruments for the analysis of pivotal political occurrences, including the electoral processes in the United States, owing to their capacity to synthesize a variety of information sources and embody real-time public sentiment [
40,
41]. Nevertheless, apprehensions have been articulated regarding the propensity for bias within these markets, especially concerning candidates who advocate strongly for cryptocurrency, such as Donald Trump. Notwithstanding this concern, our model exhibits impartiality in its predictive performance, accurately analysing outcomes that favored both Donald Trump in critical states and Kamala Harris in alternative contexts.
The precision of our framework across these instances challenges the premise that decentralized prediction markets intrinsically exhibit a bias towards candidates who are favorable to cryptocurrency. The consistent efficacy of the model implies that these markets possess the capability to effectively mitigate individual participant biases through the aggregation of extensive information reservoirs.
An interesting finding from the 2024 U.S. election was the divergence in predictions between decentralized and traditional prediction markets. Polymarket analyzed Donald Trump as the likely winner with a 65% probability, while the Iowa Electronic Market, a traditional centralized platform, predicted Kamala Harris as the winner with a 54% probability. Ultimately, the decentralized prediction market proved to be accurate in its analysis.
This outcome underscores the potential advantages of decentralized prediction markets in capturing real-time, global sentiment and integrating diverse sources of information. Unlike the IEM, which is constrained by limited participation and financial caps, Polymarket’s decentralized nature may have enabled a more representative aggregation of data, contributing to its superior predictive accuracy in this instance. This finding highlights the need for further research into the mechanisms and dynamics that differentiate decentralized prediction markets from their traditional counterparts, particularly in politically significant contexts. Despite the promising results, further research is needed to validate the findings and assess the generalizability of the proposed DPMVF.
The Decentralized Prediction Market Voter Framework (DPMVF) offers a valuable and robust approach for descriptively identifying early signals in voter sentiment from decentralized prediction markets. The compelling evidence from DTW and cross-correlation analyses demonstrates Polymarket’s significant role as a leading indicator in several key swing states. While the formal statistical validation of predictive power using traditional causality tests is constrained by data limitations, this study successfully navigates these challenges by employing advanced descriptive techniques. The DPMVF serves as a foundational framework, clearly outlining both the potential of prediction markets and the methodological advancements needed to fully unlock the analytical power of decentralized prediction markets in election analysis.
Despite the promising results, this study has several limitations that should be acknowledged. First, the study focused on a single election (US 2024 Presidential Election) and a specific DPM (Polymarket). Future research should examine the effectiveness of decentralized prediction markets in other elections and contexts to further validate the findings and assess the generalizability of the proposed Decentralized Prediction Market Framework. Second, the study did not account for potential external factors that may have influenced the accuracy of the decentralized prediction market, such as media coverage, campaign events, or other political developments. Future research should consider these factors and their potential impact on the performance of decentralized prediction markets [
41].
Finally, the study did not compare the cost-effectiveness of DPMs and traditional polling methods. Future research should investigate the costs associated with each method and assess their relative efficiency in providing accurate and timely predictions of election outcomes.
