Abstract
Smart cities, leveraging advanced data analytics, predictive models, and digital twin techniques, offer a transformative model for sustainable urban development. Predictive analytics is critical to proactive planning, enabling cities to adapt to evolving challenges. Concurrently, digital twin techniques provide a virtual replica of the urban environment, fostering real-time monitoring, simulation, and analysis of urban systems. This study underscores the significance of real-time monitoring, simulation, and analysis of urban systems to support test scenarios that identify bottlenecks and enhance smart city efficiency. This paper delves into the crucial roles of citizen report analytics, prediction, and digital twin technologies at the neighborhood level. The study integrates extract, transform, load (ETL) processes, artificial intelligence (AI) techniques, and a digital twin methodology to process and interpret urban data streams derived from citizen interactions with the city’s coordinate-based problem mapping platform. Using an interactive GeoDataFrame within the digital twin methodology, dynamic entities facilitate simulations based on various scenarios, allowing users to visualize, analyze, and predict the response of the urban system at the neighborhood level. This approach reveals antecedent and predictive patterns, trends, and correlations at the physical level of each city area, leading to improvements in urban functionality, resilience, and resident quality of life.
1. Introduction
Urban environments are dynamic, intricate ecosystems with challenges that necessitate innovative solutions. In response to the complexities of contemporary city management, the implementation of digital technologies has emerged as a transformative force. The discourse surrounding urban development has evolved significantly, with the emergence of smart cities as a pivotal concept. The objective is clear: to cultivate urban environments that are sustainable, resilient, and centered around the needs of citizens. This transformative paradigm relies on cutting-edge technologies to elevate diverse aspects of urban life, spanning from infrastructure to public services. At the heart of smart city development lies the integration of data analyses, forecasting models, and digital twin techniques, particularly at the neighborhood level. This paper delves into the critical dimensions of these technologies, aspiring to optimize urban functionality, fortify resilience, and enhance the overall quality of life for residents [1,2].
The multifaceted concept of urban resilience encapsulates a city’s capacity to adapt, recover, and prosper in the face of myriad challenges—be they demographic shifts, environmental transformations, or unforeseen crises. Smart city initiatives emerge as strategic approaches to fortify urban resilience, capitalizing on the symbiosis of data and technology. These initiatives prioritize the meticulous collection, analysis, and application of extensive urban data to guide decision-making, improve resource allocation, and facilitate proactive planning [2,3].
In this direction, predictive models are keystones for predicting and preparing for future urban scenarios. Leveraging both historical and real-time data, these models predict trends and potential challenges, empowering cities to adopt a proactive stance in addressing issues before they escalate. The integration of predictive analytics into smart city frameworks allows decision-makers to make informed choices regarding infrastructure development, resource distribution, and policy implementation—a critical foresight for cities aiming not only to survive but to thrive in an ever-evolving urban landscape [1,3,4,5].
This prospect introduces smart cities to digital twin techniques that provide a virtual replica of the urban environment, offering a dynamic and comprehensive simulation of various urban systems such as transportation networks, energy grids, and public services. This digital twin serves as a potent tool for real-time monitoring, scenario testing, and optimization. By crafting a detailed virtual counterpart of the city, decision-makers gain the ability to identify potential bottlenecks, optimize resource utilization, and enhance overall efficiency. This staggered progression through smart city concepts underscores the interconnectedness of these transformative technologies in shaping sustainable urban development [2,4].
This study delves into the realm of urban innovation, focusing on the development and application of a digital twin in the city of Patras. Comprising a combination of analysis, citizen feedback data, and advanced technologies, this digital twin project offers a comprehensive approach to urban management and decision-making. Section 2 navigates the intricate materials and methods, providing a detailed blueprint of the digital twin’s creation. A custom Python solution, utilizing the Flask web framework, lays the foundation for a simulation and modeling platform. The incorporation of a development server and the utilization of web technologies, exemplified by the interactive map interface, create a robust infrastructure for data handling and communication between the back end and the front end. The next section (Section 3) unfolds the results, presenting the tangible outcomes of the digital twin’s implementation. Through dynamic predictive visualizations and interactive features, the digital twin embodies the multifaceted nature of urban issues. The insightful forecasted presentation of clusters, markers, and layers, paint a vivid picture of the city’s pulse. The application’s evolution, as showcased in various updates, culminates in an enriched user experience equipped with layers, filters, and charts for enhanced exploration.
Moving beyond the technical intricacies, Section 4 initiates the discussion, engaging in an extended analysis of the results. Drawing key lines from the contemporary literature, the study positions the digital twin in Patras within the broader context of global urban management initiatives. A comparative discussion with studies analyzing citizen feedback data elucidates the project’s resonance with existing trends, emphasizing the project’s analysis and machine learning integration. The last section, Section 5, encapsulates the essence of this exploration in the conclusions. Beyond a mere technological endeavor, the Patras digital twin emerges as a paradigm shift in urban planning and management. Informed by insights from the literature, the project’s potential for optimizing infrastructure, improving public services, and facilitating data-driven decision-making positions it in the core realm of smart city initiatives.
Together, these sections provide a comprehensive narrative of the digital twin ecosystem in Patras, unraveling the intricacies of its creation, presenting tangible outcomes, engaging in critical discourse, and ultimately envisioning a future where cities are not just managed but dynamically understood and optimized through the lens of digital novelty.
Related Work
A digital twin is in a constant state of learning and self-updating, drawing knowledge from various data sources to mirror the physical object. Data sources are diverse and can include data from citizens, devices, and assets scattered across the urban landscape, enhancing the city’s overall situational awareness. To this end, Ref. [6] introduces an openly accessible digital twin smart city model for the Docklands area in Dublin, Ireland, using the commercial software Unity3D for visualization and interaction. The authors emphasize that this approach contributes to the open and transparent development of smart city infrastructure, promoting collaboration and understanding of urban dynamics. Simulations in the digital twin rely on data from Dublin’s open data source, Dublinked, covering the population, transportation, infrastructure, environmental conditions, and energy consumption. However, a gap exists in fine-grained citizens’ interaction data, limiting the depth of simulations related to citizens’ concerns. Addressing this gap is crucial for a more comprehensive understanding of urban dynamics and can enhance the fidelity of smart city simulations.
In Ref. [7], the researchers focus on developing a digital twin for community design and policy decision-making, emphasizing the crucial role of citizen participation in creating a human-centered digital replica of the city. The article highlights the limited existing research on citizen involvement and integration into city information digital twin models. Focused on the Malvalaan urban neighborhood in the Netherlands, the study integrates tangible and intangible data to empower local stakeholders in optimizing community design and policy decisions. The Malvalaan City Information Model (CIM) is created using a geo blueprint through aerial LiDAR scanning and commercial software. The study assesses ease of use and usability through a questionnaire, revealing that the Malvalaan digital twin successfully facilitates a user-friendly community design exercise, demonstrating the potential of the digital twin to enhance community support, engagement, and decision-making processes.
The findings of the researchers in Ref. [8] reveal that the concept of citizen-centric digital twins has been steadily gaining traction owing to its predictive, simulative, and visualizing capabilities. The research methodology of this study is based on a systematic literature review of 210 relevant articles based on digital twins and smart cities from 2011 to 2022. The researchers highlight digital twins’ potential to address various issues at the city level by actively involving citizens in infrastructure governance. The researchers emphasize that although most of the projects use data from open-source data platforms, data derived from volunteered geographic information and social sensing are two prominent methods for central digital twin platforms. The researchers propose machine learning classifiers for digital twin capabilities, such as incorporating sparse data and using change detection algorithms for infrastructure dispersion analysis. The study also identifies application processing interfaces for CCDT that facilitate interactive visualization for informed decision-making during citizen participation in infrastructure governance. CesiumJS is highlighted as a significant API, particularly in digital city twin applications in capital cities like Victoria and Sydney. However, it is a commercial platform, and the free version is only for personal and not public projects, exploratory development, or educational activities.
Ref. [9] highlights the growing interest in digital twins in urban and geospatial domains, particularly at the city-scale level. The study aims to bridge the gap between conceptual understanding and current realizations of digital twins for cities by analyzing the literature and survey results. The study collects and refines definitions of digital twins for cities from a corpus of 26 papers, focusing on computer science, urban planning, and city-level geospatial fields. A key finding underscores the importance of clearly defining concepts and approaches to understand the practical input layer of digital twins for cities. Current implementations often confuse the concept with other notions, sometimes treating it as a technological evolution of 3D urban modeling. The study suggests that considering digital twins for cities as systems of systems is a prominent approach, with 15 papers defining it as a digital representation of city elements functioning as an ecosystem of twin systems without limiting the scope to 3D components. The analysis reveals that the city information model (CIM) is primarily regarded as the input layer of digital twins for cities. Additionally, the establishment of spatial data infrastructure (SDI) is considered crucial for creating a robust geospatial digital twin, serving as the cornerstone for ensuring seamless access to the data hub and efficient, standardized data integration.
Through an in-depth examination of 184 pertinent articles that were carefully selected and analyzed, Ref. [10] synthesizes the various disciplinary classifications associated with the functional integration of geographic information systems (GIS) and building information models (BIMs). The study distills the importance of data and argues that while smart city platform application cases have taken initial steps to achieve analytical computing through GIS and BIM techniques, ongoing research is dedicated to improving interoperability. The researchers stress that the improvement of interoperability in digital twin technology, coupled with the integration of richer data formats and factoring in the importance of time management cycles, is key to developing a more coherent system of smart city applications. Therefore, this holistic approach not only streamlines the processes but also helps to reduce the corresponding costs throughout the life cycle of a smart city project by seamlessly transitioning through various stages, spanning from surveying, planning, and design to construction, operation, and maintenance.
The researchers in Ref. [11] highlight the evolving role of the digital twin concept in extracting value from data and its increasing importance in designing and managing diverse systems. They discuss the prevalence of proprietary digital twin software solutions and introduce an open-source software framework for digital twins, known as the Digital Twin Operational Platform (DTOP). This framework, implemented through a browser-based platform using Python and Flask, aims to enhance connectivity between users and data from the physical twin, including Internet of Things (IoT) devices. Python is chosen for its versatility in web-based and scientific applications, and Flask serves as a crucial server tool, enabling remote hosting and access. The authors emphasize the vast potential for future research in open-source digital twin software with network connectivity. The web interface, designed using HTML5, CSS, and JavaScript, ensures a responsive, interactive, and animated browser-based graphical user interface. Flask, along with Python, enables seamless connectivity among various components, empowering users to interact with the digital twin through a web browser without specific programming knowledge. Back-end users can download the open-source project, making customized modifications to align with project-specific requirements.
The authors of Ref. [12] conducted a scoping review of 162 papers, spanning from 2014 to 2021, across various urban fields to address gaps in urban sustainability and spatial data analysis. The overview reveals insights into studies utilizing artificial intelligence and machine learning with geospatial data for analyzing urban areas. Concentrated cases are found in China, the US, and the UK, with regional breakdowns indicating significant studies in Europe, Asia, and North America. Focused on leveraging geospatial data for urban sustainability, the study emphasizes effective algorithms like random forests and support vector machines. The study highlights the importance of comparing different machine learning algorithms within specific topics and calls for new methodological frameworks that go beyond the application of machine learning to explain, translate, and transfer results to urban sciences, practice, and decision policies. While machine learning and artificial intelligence gain momentum, the authors advocate for standardizing the selection of data, algorithms, and parameters to provide concrete reasoning for sustainable urban planning decisions and policies. The review also acknowledges limitations in developing spatial machine learning studies in data-sparse areas, particularly in the Global South.
In connection to this, the main goal of Ref. [13] is to develop a data-driven prediction model for water main failures in the City of Kitchener, Ontario, Canada, with the goal of reducing field inspections through proactive interventions. By limiting field inspections to pipes more likely to fail in the future, the study contributes to preventive maintenance practices and cost-effective updates of asset management plans. The results indicate that over 72% of issues could potentially have been prevented by monitoring and upgrading only 8% of the network. Random forest models outperformed other algorithms in terms of accuracy. The study emphasizes the use of city condition indicators for better predictability and insights into root causes, enhancing the reliability and resilience of city infrastructure.
In a comprehensive analysis of 312 abstracts, along with a detailed examination of 72 full papers, Ref. [14] explores the intersection of digital twins and smart cities in the context of disaster risk management. The review assesses the evolution of digital twins, explores smart technologies used in disaster risk management, and assesses the state-of-the-art and technical feasibility of smart city-based approaches in this area. The article highlights the need for enhanced techniques to capture the spatial aspects of disruptions to the built environment. The authors suggest the need to develop a real-time resilience mapping system using geoparsing techniques to extract named entities at the street level. Moreover, the article underlines the potential of artificial intelligence as a forecasting system to predict natural disasters using high-quality datasets for a deeper understanding of large-scale social phenomena. They stress the contribution of digital twins to strengthening the socio-economic fabric of society and its capacity to enhance resilience by assisting adaptation efforts to meet the challenges of risk management in a dynamically changing environment.
The utilization of location-based data for city analysis has garnered significant attention as a promising method for applied research [15]. Ref. [15] explores challenges, opportunities, and limitations in collecting geodata from various platforms for diverse cities in urban phenomena research. It outlines a comprehensive method for requesting and retrieving data from APIs, emphasizing the need for meticulous review and verification steps to capture nuances in geolocated user-generated data. The study highlights the ongoing trend of using geodata in city studies, offering qualitative insights more promptly than traditional sources. At the same time, the article addresses challenges such as reliance on third-party platforms, emphasizing the importance of validating geo-location-based data across large datasets for representative sampling. Proper handling of API requirements is critical to the reliability and validity of data in urban research.
The methodology introduced in Ref. [16] provides a holistic perspective on urban spaces, surpassing conventional constraints. Using geodata processing and semantic segmentation models, the approach assesses longitudinal and cross-sectional aspects, deriving key metrics like the green coverage rate and green view index. Osaka City in Japan serves as the exemplar, revealing an uneven distribution of green spaces and variations in quality. The study calls for a multidimensional approach rooted in the geographical context and relevant characteristics, emphasizing the opportunities presented by these technological advancements and street view data for informed urban planning.
The literature review in Ref. [17] delves into mobility-oriented urban studies, analyzing 400 papers to underscore the dynamic nature of mobility data. It emphasizes the crucial role of mobility data in understanding human mobility patterns and intricate interactions between individuals and urban environments. Highlighting big geodata’s significance, the paper emphasizes its potential as a valuable resource, empowering researchers to unravel complex knowledge and innovate applications. Mobility data allows tracing movement trajectories, characterizing daily activities, and gaining holistic insights into human mobility across diverse urban scenarios, emphasizing a cyber–physical–social perspective.
Ref. [18] addresses the limited exploration of citizens’ perspectives on the impact of smart city development on their quality of life. Adopting a citizen-centric approach, the study examines attitudes, perceptions, and support for smart city development. Through a quantitative approach involving a questionnaire survey with 848 Macao citizens, the study identifies domains affecting citizens’ attitudes and support for citizen-centric smart city development. Factor analysis, multiple linear regression, and cluster analysis reveal the need for greater focus on smart services that enhance livelihoods and mobility. The researchers emphasize reconsidering citizens’ lifestyles and promoting a transition to smarter support by leveraging smart technologies to streamline and enhance public services. Recognizing the importance of citizens’ quality of life in a smart city, the study suggests adjusting strategies based on citizen feedback for more effective citizen engagement.
The researchers in Ref. [19] emphasize the early stage of exploring smart city user preferences. The study, involving 105 participants in a German public administration post-graduate program, identifies them as the ‘creative class’ and potential lead users for smart services due to their digital experience. Respondents prioritize addressing citywide mobility challenges, emphasizing the importance of a comprehensive smart strategy. The study suggests integrating various online platforms to meet diverse user needs and underscores key success factors, including comprehensive services, responsiveness, transparency, and data security. Limitations, including potential oversimplification of future user behaviors, are acknowledged. Extending their study in Ref. [20], researchers conducted a web survey in a mid-sized German city to explore citizen preferences for smart city digital services. With 906 valid questionnaires, respondents favored “Smart Social Services” and “Smart Mobility and Smart Infrastructure”. Comparing preferences with smart city executives’ estimations revealed significant differences, particularly in the “Smart Mobility and Smart Infrastructure” unit. The study emphasizes understanding citizens’ expectations, addressing disparities in preferences, and effective communication and adaptation efforts for SC services to align with citizen concerns.
In Ref. [21], researchers explored the link between motivation and public participation in urban planning in Wuhan, China. The study, which involved 502 respondents, revealed the positive effects of factors such as citizen interest on the intention to participate, highlighting the need to encourage and address constraints for optimal participation. The research in Ref. [22] investigated the relationship between e-participation and service performance in Jakarta’s smart city. Using Qlue MyCity app data, the study found that citizen e-participation enhances problem resolution, particularly for complex issues. While the study emphasizes the potential of smart city platforms, it suggests further research for generalization. Ref. [23] delves into digital projects in South Korean cities, exploring citizens’ preferences for smart city initiatives. The study, involving 624 residents, highlighted citizens’ prioritization of projects improving daily life, emphasizing the importance of addressing practical issues in smart city planning.
The primary objective of Ref. [24] is to assess the current status of smart mobility in Milan, analyzing citizen reviews. The study, using the social, technological, economic, environmental, and political (STEEP) method and strengths, weaknesses, opportunities, and threats (SWOT) analysis, underscored the importance of effective communication and understanding user concerns for managing modern municipal smart mobility systems. Ref. [25] underscores the significance of a structured and stepwise framework for smart city policy transformation, using Helmond, a Dutch city, as a case study. The study stresses the importance of feedback loops, underestimated readiness, and a tailor-made approach, highlighting the need for knowledge management and commitment in smart city initiatives.
2. Materials and Methods
Smart cities represent a paradigm shift in sustainable urban development, tackling the intricacies of dynamic urban environments. At the core of our methodology lies a fusion of advanced data analytics, predictive modeling, and digital twin techniques. Predictive analytics stands as the linchpin, empowering cities to proactively plan for evolving challenges. Simultaneously, digital twin methodologies provide a virtual mirror of the urban landscape, enabling real-time monitoring, simulation, and analysis. Our research emphasizes the criticality of real-time monitoring, simulation, and analysis for supporting test scenarios, revealing bottlenecks, and optimizing smart city efficiency.
This work uses a dataset of 144 text files that include 93,053 citizen reports retrieved through the API from the Sense City platform, a service launched by the Municipality of Patras, available to the public since 2018. This platform enables citizens to report various issues based on geographic graphical coordinates, offering a direct channel for community feedback on issues such as infrastructure, services, and various aspects of urban life.
Structured in JSON format, each report includes key details like a unique report identifier (_id), a bug identifier (bug_id), the current status of the reported issue (status), geographic coordinates (loc), the reported issue’s type (issue), a bilingual description in Greek and English (value_desc), and the timestamp of the report submission (reported). These details provide a comprehensive understanding of reported incidents, encompassing their nature, location, and reporting status. Figure 1 shows a sample of a single report.
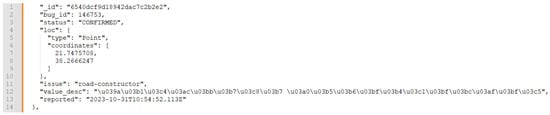
Figure 1.
The sample report of a unique citizen in JSON format.
The report consists of:_id: “6540dcf9d18942dac7c2b2e2” (the unique identifier for the report), bug_id: 146753 (the bug identifier associated with the report), status: “CONFIRMED” (the current status of the reported issue, indicating that it has been confirmed), loc: {“type”: “Point”, “coordinates”: [21.7475708, 38.2666247]} (the location information for the reported issue, specifying that it is a point on the Earth’s surface with latitude 38.2666247 and longitude 21.7475708), issue: “road-constructor” (the type or category of the reported issue, indicating a problem related to road construction), value_desc: “Κατάληψη Πεζοδρομίου” (this is encoded using Unicode escape sequences specifically in Greek. When decoded, it represents the text “Κατάληψη Πεζοδρομίου”, which translates to “Occupation of the Sidewalk” in English. This is a common method of representing non-ASCII characters in a Unicode string using escape sequences.), reported: “2023-10-31T10:54:52.113Z” (the date and time when the issue was reported, which is 31 October 2023 at 10:54:52 UTC).
This report provides details about a confirmed issue related to road construction. The reported problem is the occupation of the sidewalk, and the report includes the location coordinates, status, and a timestamp of when it was reported. The bug_id and _id serve as unique identifiers for tracking and referencing the report.
Geographically, the reports span various locations within Patras, reflecting the broad coverage of citizen concerns across the city. The spatial distribution offers insights into localized challenges and aids in understanding the dynamics of urban issues. The ‘issue’ field, categorizing reported problems, showcases the diversity of concerns raised by citizens, ranging from road construction to public space-related matters.
In terms of anonymity, the provided JSON seems to be structured in a way that focuses on the details of the reported issue and its location rather than revealing personal information about the citizen making the report. More specifically, the “bug_id” and “_id” fields serve as unique identifiers for the reported issue. These identifiers are important for tracking and managing reports, and they don’t reveal personal information about the individual making the report. The “loc” field provides coordinates (latitude and longitude) indicating the location of the reported issue. This information points to a specific geographic location, and it doesn’t directly reveal the identity of the person making the report. The “issue” field specifies the type of problem reported, in the sample, “road-constructor”. This field, along with the “value_desc” (description) field, provides information about the nature of the issue but does not reveal personal details. The “reported” field indicates the date and time when the issue was reported. This information can be used for tracking and managing reports, and it does not compromise the anonymity of the individual making the report.
In our exploration of the intricate urban fabric, we focus on the neighborhood level, recognizing the pivotal roles of citizen report analytics, prediction, and digital twin technologies. This study integrates extract, transform, load/extract, load, transform (ETL/ELT) processes, artificial intelligence (AI) techniques, and a digital twin methodology [6,7,8,9,10,11,12,13,26,27,28] to interpret urban data streams emanating from citizen interactions with the city’s coordinate-based problem mapping platform. The synergy of an interactive GeoDataFrame within the digital twin methodology creates dynamic entities, facilitating simulations across diverse scenarios.
Our approach transcends theoretical frameworks, inviting users to actively engage with urban data through an interactive Flask application. This meticulously designed methodology empowers users to navigate urban probabilities, filter narratives, and visualize insights, thanks to the creation of an interactive map (map.html). This dynamic interface provides a tangible platform for users to explore, analyze, and predict the urban system’s response at the neighborhood level. The visualization reveals antecedent and predictive patterns, trends, and correlations, laying the groundwork for tangible enhancements in urban functionality, resilience, and resident quality of life.
As we unfold the specific steps of our methodology, each stage is connected, reflecting a holistic approach to unraveling the complexities of urban dynamics. These steps are not static; rather, they form a continuous loop that can be automated to create a system that perpetually checks and downloads new data from the API, performs necessary data manipulations, updates the machine learning model, and refreshes the digital twin framework. This automation ensures a seamless and real-time experience for users, providing consistently updated maps, charts, scenarios, and probabilities through the Flask app.
The benefits of such automation are manifold. Users experience continuous monitoring, gaining real-time insights into the city’s dynamics while fostering a deeper understanding of urban complexities. Proactive planning becomes a reality, empowering city planners and residents to address emerging challenges with up-to-date predictive capabilities. The user interface evolves dynamically, enhancing engagement and satisfaction. The system proves scalable, accommodating growing data volumes while maintaining responsiveness, and efficiency is optimized through regular automation, minimizing manual intervention.
With these automated processes in place, the system transforms into a powerful tool for urban management. Residents, planners, and decision-makers gain access to a holistic and real-time view of the city’s dynamics, enhancing their ability to make informed decisions. The automated digital twin framework can become a keystone in the evolution of smart cities, paving the way for a more resilient, responsive, and livable urban environment. Here are the steps involved in this effort:
Step 1: Data Retrieval (ApiFetch.py).
Initiating the study, the researchers started a data retrieval process using the Sense City API, laying the groundwork for subsequent analyses. Serving as the starting point, this phase ensured the acquisition of high-quality data. Leveraging the Python ‘requests’ library, they seamlessly interfaced with the API, extracting meaningful statistics regarding confirmed urban issues within a specified timeframe and geographic location.
Step 2: Check Data (.py).
The researchers embarked on a comprehensive examination, integrating the extract, transform, load (ETL)/extract, load, transform (ELT) methodology. Employing the Pandas library, they systematically scrutinized the dataset’s structure and intrinsic attributes. This ETL/ELT-driven exploratory analysis yielded valuable insights into data types, forming a basis for subsequent processing and enhancement within the sophisticated data lake infrastructure. ETL involves extracting data from the source system, transforming it into a format that can be used by the digital twin, and then loading it into the digital twin. The ELT approach involves extracting data from the source system, loading it into the digital twin, and then transforming it as needed.
Step 3: Convert the ‘Reported’ Column to Datetime Format (.py).
Recognizing the importance of temporal precision in urban analytics, the researchers transformed the ‘reported’ column into a datetime format. This not only established a standardized temporal reference but enriched the features of the data set.
Step 4: Correct a Row of Coordinates (.py).
Addressing the imperative of spatial accuracy in urban studies, the methodical approach to coordinate correction played a pivotal role in ensuring data integrity. This step validated each entry in the ‘loc’ column for adherence to the expected format, contributing to the spatial reliability of our dataset.
Step 5: Coordinates to Area and New Column (.py).
Delving into the geospatial context, this work executed a precise conversion of coordinates to human-readable area names, further enhancing the spatial granularity of the dataset. OpenLayers, the chosen open-source mapping library, facilitated reverse geocoding, attributing each citizen report to its corresponding urban area, a crucial step for robust spatial analyses within the data lake environment.
Step 6: Weird Characters to Greek (.py).
Addressing encoding intricacies is vital for uniform linguistic representation. The application of ‘utf-8-sig’ encoding has harmonized character encoding complexities, resulting in a linguistically coherent dataset. This linguistic clarity is integral for diverse analyses within the data lake.
Step 7: Columns Need Intervention for Predictions (.py).
A meticulous assessment of data types revealed nuanced characteristics, necessitating thoughtful consideration. Identification of non-numeric columns, requiring specialized intervention for predictive modeling, set the stage for subsequent machine learning endeavors within our data framework.
Step 8: Count the Different Categories Issue_Area (.py).
An enumeration of urban issues and associated areas unfolded, providing a comprehensive understanding of the dataset’s categorical composition.
Step 9: Check the Data (.py).
An examination of the dataset unfolded, encompassing essential checks for integrity, completeness, and overall structure. This step, executed within the data lake environment, ensured that subsequent analyses were founded upon a robust and reliable dataset.
Step 10: Converting Non-Numeric Columns (.py).
In preparation for machine learning endeavors, the researchers encoded non-numeric columns. This step involved the precise conversion of categorical variables into a format suitable for predictive modeling, fostering an optimal representation of features within our data lake infrastructure.
Step 11: Train RandomForest and Save the Model (.py).
In the pursuit of predictive modeling, we employed AI techniques, specifically machine learning, the RandomForest Classifier, as the vehicle for understanding complex patterns within the data. Trained with precision, this model serves as an analytical instrument, capable of discerning intricate relationships among various features. The selection of the classifier was a result of a thorough performance comparison among various models tailored to the specific dataset. Specifically, we approached the urban issues in the city as a multiclass classification problem, given the presence of eight categories of issues (garbage, lighting, road constructor, green, protection policy, environment, plumbing, and parking). Recognizing the intricacies of this multiclass classification task, we initially assessed the data distribution to address the imbalance, scrutinizing the class distribution within the target variable. Figure 2 shows the distribution of the issue classes.
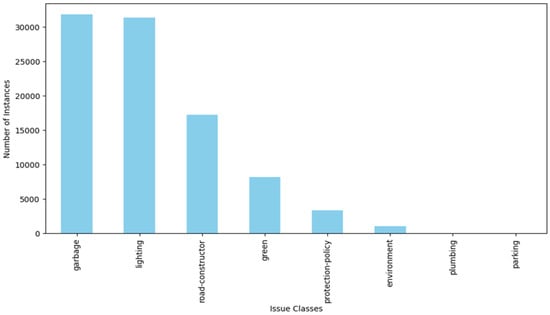
Figure 2.
The distribution of the classes.
Confronted with data imbalance, the researchers proceeded to employ resampling techniques, combining oversampling and undersampling to effectively manage class imbalances, and trained several classifiers capable of handling unbalanced data, including random forests, gradient boosting, KNN, SVM, and neural networks, on the designated training set [28]. The random forest classifier emerged as the top performer based on accuracy, achieving a very good score of 79.04%. This accuracy metric denotes the proportion of correctly predicted cases within the test set, showcasing the model’s effectiveness in discerning and categorizing urban issues. Figure 3 illustrates the accuracy of the trained classifiers. Regarding ROC, AUC is a commonly used metric for binary classification problems.
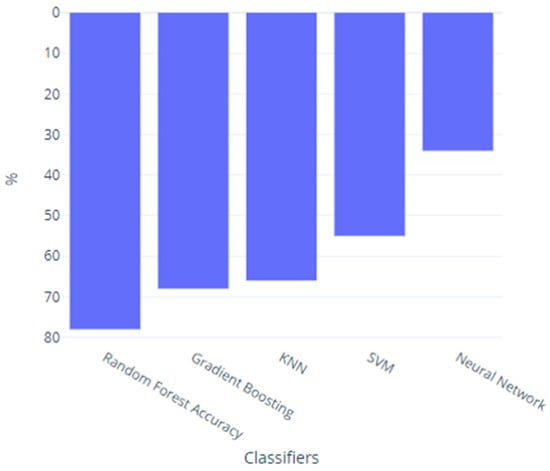
Figure 3.
The performance of the trained classifiers.
Step 12: Pretrain Model and Predict 6 Months Later (.py).
With the trained model at the disposal of this work, the researchers projected the analyses into the future, specifically a six-month horizon. This step not only showcases the predictive capabilities of the model but also places the research in a long-term time frame, laying the groundwork for future urban insights.
Step 13: Flask Filters Probability (.py).
The deployment of a Flask application marked an interactive phase, allowing end-users to navigate through intricate probabilities and filter urban narratives with ease. This immersive approach fosters user engagement, turning abstract data into tangible urban narratives through an intuitive and visually appealing interface.
The Flask application [11], in combination with Leaflet and Chart.js, leverages digital twin concepts and technologies to model and visualize urban data. Digital twins, in the context of smart cities, refer to virtual replicas of physical objects, processes, or systems. The framework facilitates the integration of various data sources and provides tools for visualization, prediction analysis, and interaction. Here is why the provided approach aligns with a digital city framework:
Data Integration and Processing: The Flask application loads urban data from the output of the data lake, representing a digital twin of the city. This data includes information about reported issues, areas, years, and issue probabilities. The data is processed to enhance its quality and to provide additional insights. For example, a ‘year’ column is added based on the ‘reported_date_time’ field.
Visualization: The framework uses Leaflet, a popular JavaScript library for interactive maps, to visualize spatial data. The map displays markers and clusters representing different issues and their locations in the city. Chart.js is utilized to create visualizations such as charts representing issue counts, area counts, and average issue probabilities. These visualizations enhance the understanding of urban data trends.
Interactivity and User Engagement: The application provides an interactive user interface with filters for issues, years, areas, and issue probabilities. Users can dynamically explore and analyze the digital twin data based on their preferences. Users can choose specific filters to update the displayed data on the map and charts, allowing for a more personalized and insightful exploration of the city’s digital twin.
Real-Time Updates and Monitoring: The framework can be extended to support real-time updates from various sensors and IoT devices in the city. This would enable monitoring and analysis of the city’s state in near real-time.
Scalability and Extensibility: The architecture of the Flask application allows for scalability and extensibility. Additional features, data sources, or visualization components can be integrated to enhance the overall framework.
Appendix A provides details on the comprehensive structure of both the backend (Flask) and the frontend (HTML and JavaScript) components.
Before the next section, the paper illustrates the data distribution and statistical analysis so that the reader can derive additional information and seamlessly delve into the body of results. Figure 4 presents the percentage of issues by area. The visualization is divided into three horizontal bar graphs, each representing 54 different regions out of the 162 unique regions in total. Areas are sorted by number and bar graphs use different colors for a visually appealing representation.
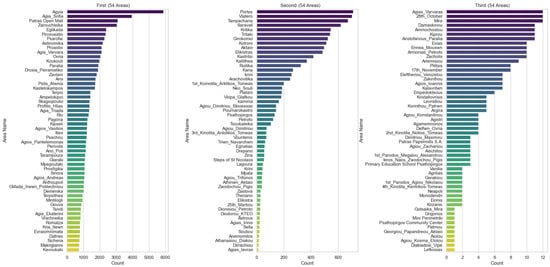
Figure 4.
Areas with higher counts are shown in darker shades of color.
Figure 5 is the output of the Python code that creates a stacked bar chart for three different parts (First Half, Second Half, and Third Half) based on the data lake output. The image attempts to present the information in a clear and visually appealing way, taking into account the fact that there are 162 unique areas in total, and the population of regions increases the difficulty of a valuable visualization. Each segment consists of a subplot with regions represented by stacked bars, where the height of each bar segment corresponds to the percentage of a particular issue within the region, with region names appearing on each line. The legend is included in the upper right corner of the first subplot, providing information about the issues represented by different colors in the graph.
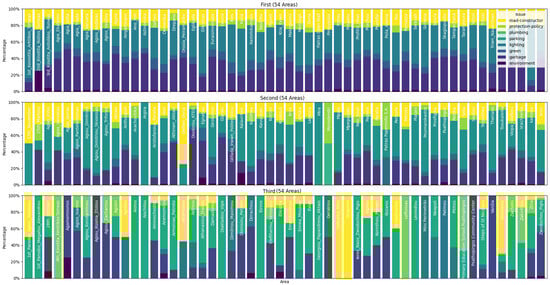
Figure 5.
The percentage of issues by region.
Figure 6 is an attempt to show the overall distribution of subjects in each region over time. The color dimensions categorize regions based on the total number of releases from 2018 to the date of this article’s writing, and a sample of the region color groupings is shown on the right side of the chart.
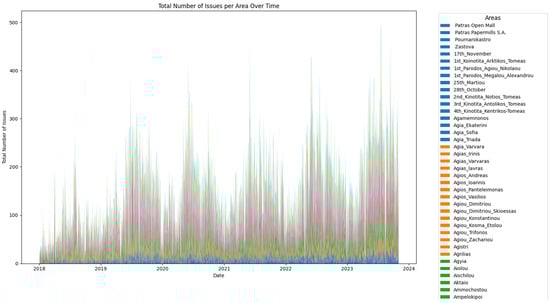
Figure 6.
The total number of issues in each area over time.
Table 1 is the statistical summary of the lake data output that provides a comprehensive overview of the entities as a whole, including the distribution, central tendency, and variability of the numerical column. The terminal output provides a statistical summary of the data generated. Here is a detailed explanation of each segment:

Table 1.
The statistical summary of the generated data.
Count: Latitude, longitude, areas, Areas_int, issue, issue_int, reported_date_time, year, month, day, hour, minute, issue_Probability: These columns represent the number of non-null entries in the dataset. For instance, there are 93,053 entries for each of these columns, indicating the total number of records in the dataset.
Unique: Latitude, longitude, areas, Areas_int, issue, issue_int, reported_date_time, year, month, day, hour, minute, issue_Probability: This shows the number of unique values in each column. For example, there are 162 unique areas, eight unique issue categories, and 89,003 unique reported date and time entries.
Top: Areas, issue, reported_date_time: Indicates the most frequently occurring value in each column. For instance, “Agyia” is the most common area, “garbage” is the most common issue, and “2019-10-14 07:32:00” is the most common reported date and time.
Freq: Areas, issue, reported_date_time: Represents the frequency of the top value. For example, “Agyia” appears 5881 times in the “Areas” column.
Mean: Latitude, longitude, Areas_int, issue_int, year, month, day, hour, minute, issue_Probability: Represents the mean (average) value for each numeric column.
Std: Latitude, longitude, Areas_int, issue_int, year, month, day, hour, minute, issue_Probability: Represents the standard deviation, a measure of the amount of variation or dispersion in each numeric column.
Min: Latitude, longitude, Areas_int, issue_int, year, month, day, hour, minute, issue_Probability: Represents the minimum value in each numeric column.
25%, 50%, 75%: Latitude, longitude, Areas_int, issue_int, year, month, day, hour, minute, issue_Probability: These values represent the quartiles, indicating the distribution of the data. For example, 25% of the reported dates and times fall on or before the 57th minute.
Max: Latitude, longitude, Areas_int, issue_int, year, month, day, hour, minute, issue_Probability: Represents the maximum value in each numeric column.
From this summary, someone can identify patterns such as the common areas and issues and can also observe the distribution and variability of numeric columns. However, identifying outliers might require additional visualization techniques, like box plots or scatter plots. The summary provides a good overview, but further exploration through data visualization and more advanced statistical techniques may be needed for a deeper understanding.
Figure 7 provides boxplots for the “Latitude”, “Longitude”, “Areas_int”, and “issue_int” columns. The boxplots, which show the distribution of the number of citizen reports received on each day, are very useful in highlighting some observations: The boxes are relatively wide, which indicates that there is a lot of variation in the data. The medians of the boxes are all above the first quartile, which indicates that the data is positively skewed. There are a few outliers in the data, as indicated by the whiskers of the boxplots. The overall trend of the data is increasing, as indicated by the upward slope of the center lines of the boxes.
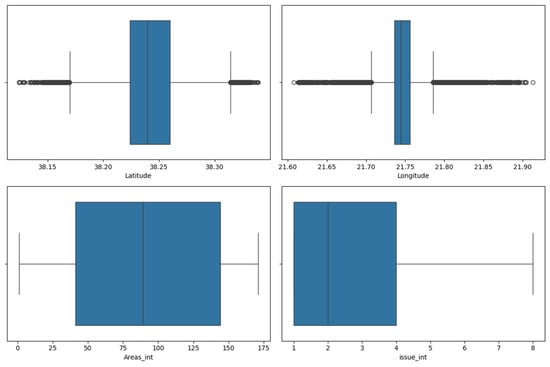
Figure 7.
Boxplots for the “Latitude”, “Longitude”, “Areas_int”, and “issue_int” columns.
Based on these observations, somebody can conclude that the data is likely to represent a large number of citizen reports, with a significant amount of variation in the number of reports received each day. The data is also positively skewed, which means that there are more days with a high number of reports than days with a low number of reports. There are a few outliers in the data, which could be due to unusual events or data entry errors. Finally, the overall trend of the data is increasing, which suggests that the number of citizen reports is increasing over time.
Figure 8 shows a scatterplot for “Latitude” versus “Longitude”, with “Areas_int” as hue and “issue_int” as size. The points are concentrated in the city of Patras, with a few outlying suburbs scattered around the city. The largest concentrations of reports are in the city center and in the areas to the north and south of the city. The size of the points in the scatter plot suggests that there is a significant variation in the number of reports received at different locations in the city. Some areas, such as the city center and the north and south areas, receive a high number of reports, while other areas receive a relatively low number of reports. This variation in the number of reports could be due to a number of factors, such as:
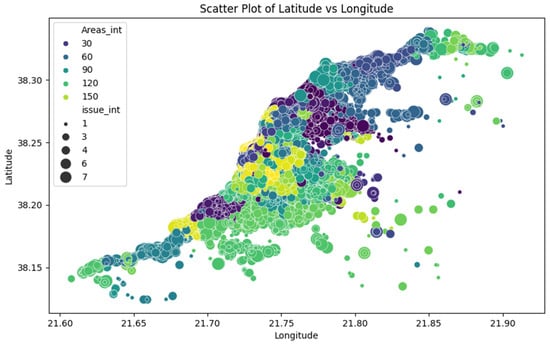
Figure 8.
This scatterplot for “Latitude” versus “Longitude” with “Areas_int” and “issue_int”.
Population density: Areas with a higher population density are likely to receive more citizen reports.
Land use: Areas with a mix of land uses, such as residential, commercial, and industrial land uses, are likely to receive more citizen reports than areas with a single land use.
Socioeconomic status: Areas with a lower socioeconomic status are more likely to receive more citizen reports.
Crime rates: Areas with higher crime rates are more likely to receive more citizen reports.
This information highlights that the citizen reports are distributed throughout the city of Patras, with a few outliers in the surrounding areas. The number of reports received on each day varies widely, with more reports being received on some days than others.
Finally, an analysis follows for each of the Figure 9 data histograms based on visualizations.
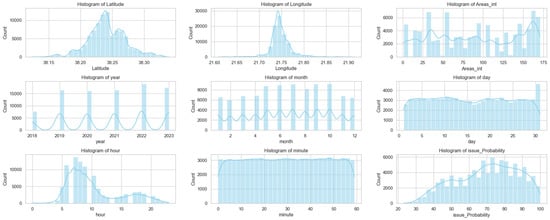
Figure 9.
Histograms of data.
Histogram 1: Latitude. The histogram of latitude shows that the majority of citizen reports are located in the central part of Patras. There is also a smaller concentration of reports in the western and northern parts of the city. The histogram is relatively symmetrical, with a slightly longer tail on the left side.
Histogram 2: Longitude. The histogram of longitude shows that the majority of citizen reports are located in the eastern part of Patras. There is also a smaller concentration of reports in the central and southern parts of the city. The histogram is relatively symmetrical, with a slightly longer tail on the right side.
Histogram 3: Areas_int. The histogram of Areas_int, which is the numerical representation of the areas, shows that the majority of citizen reports come from areas with a medium to high population density. There are also a smaller number of reports from areas with a low population density. The histogram is positively skewed, with a longer tail on the right side. This suggests that there are more citizen reports from areas with a high population density than from areas with a low population density.
Histogram 4: Year. This histogram shows that the number of citizen reports has increased steadily over time. The histogram is positively skewed, with a longer tail on the right side. This suggests that there have been more citizen reports in recent years than in previous years.
Histogram 5: Month. This histogram shows that the number of citizen reports is highest in the summer months and lowest in the winter months. The histogram is slightly skewed to the right, with a longer tail on the right side. This suggests that there are more citizen reports in the summer months than in the winter months.
Histogram 6: Day. This histogram shows that the number of citizen reports is highest on weekdays and lowest on weekends. The histogram is slightly skewed to the right, with a longer tail on the right side. This suggests that there are more citizen reports on weekdays than on weekends.
Histogram 7: Hour. This histogram shows that the number of citizen reports is highest during the day and lowest at night. The histogram is slightly skewed to the right, with a longer tail on the right side. This suggests that there are more citizen reports during the day than at night.
Histogram 8: Minute. This histogram is relatively uniform, with a slight peak at the beginning of each hour. This suggests that citizen reports are distributed evenly throughout the hour.
Histogram 9: issue_Probability. This histogram shows that the majority of citizen reports have a low to medium probability of being resolved. There are also a smaller number of reports with a high probability of being resolved. The histogram is slightly skewed to the left, with a longer tail on the left side. This suggests that there are more citizen reports with a low probability of being resolved than with a high probability of being resolved. Overall, the histograms of citizen reports show that the majority of reports are located in the central part of Patras, come from areas with a medium to high population density, and are highest in the summer months and on weekdays. The histograms also show that the number of citizen reports has increased steadily over time.
In essence, this section has examined the methodological roadmap employed in this study to create a digital twin application. It encompasses various components, including features, user interactions, data interactions, rules, and predictions related to neighborhood issues based on citizen reports of problems across different city areas. A comprehensive presentation of the data’s nature and distribution has been provided, facilitating the reader’s exploration as they further explore the subsequent section to understand the outcomes.
3. Results
The section presents the results of the previous methodologies to analyze data derived from citizen interaction with the coordinate-based problem mapping platform of the Municipality of Patras.
Within the realm of urban innovation, our digital twin application, powered by Flask, not only presents a dynamic snapshot of the city’s current state but also delves into the future through predictive modeling. At the heart of this endeavor is a web of artificial intelligence (AI) techniques, predominantly machine learning, employing the randomforest classifier as a vehicle for unraveling the complexities embedded in our urban data.
Trained with accuracy, this machine learning model stands as an analytical technique, adept at deciphering intricate relationships among diverse features within the city’s landscape. What sets the digital twin apart is its ability to project these analyses into the future, providing a futuristic gaze into the urban landscape—a gaze extending six months ahead. These services enrich the predictive capability of the city stakeholders and position them within a long-term time frame, serving as a roadmap for future urban insights.
The synergy between the Flask application and the machine learning model offers a new possibility to the leadership of the city of Patras, which before this project did not exist. In addition to visualizing the current state of the city, this application now extends its capabilities to display predictions regarding the likelihood of each reported issue occurring in specific neighborhoods. This forward-looking feature enhances the utility of the digital twin, transforming it into a valuable tool for not just understanding the present but also anticipating and preparing for the challenges that lie ahead.
As the research progresses in the following paragraphs of the application presentation, it becomes clear that the digital twin, in addition to being a dynamic observer of the urban core, is also a proactive assistant in the resilience of the city. The finalization of the application unfolded through a gradual and evolutionary process, a narrative worth sharing as it underscores the evident requirement for a holistic digital twin of the city’s physical layer. Preceding the development of the updated application version, incremental efforts were undertaken to address the needs stemming from the reports. These requirements center on gaining complete control over historical data and enhancing predictive capabilities for requests and areas within the city.
To provide readers with a quick insight into the spatial distribution of citizen requests related to city issues based on specific coordinates, Figure 10 delineates the city’s dimensions on the map, while Figure 11 elucidates the distribution of issues. It is observed that a multitude of issues have arisen from these reports, spanning a wide range of city areas where authorities are called upon to promptly manage, prioritize, and intervene to resolve the problems. For the swift resolution of these issues, a key element is the clustering of the reported issues, as illustrated by the clusters in Figure 12. The user is informed about the number of problems per area through the respective clusters. Additionally, the interactive map is enhanced by the development of a pop-up window at the final points, displaying information about the issue, the area, and the reporting date. Simultaneously, the map’s functionalities are enriched through the implementation of a filter linked to the frequency of citizen-reported issues and the utilization of color-coded clusters for a more straightforward identification of each particular issue within an area (Figure 13). Users receive ongoing updates on the number of problems per region prior to the full expansion of the respective cluster.
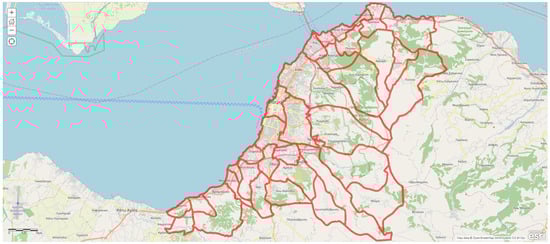
Figure 10.
The city of Patras in Greece.
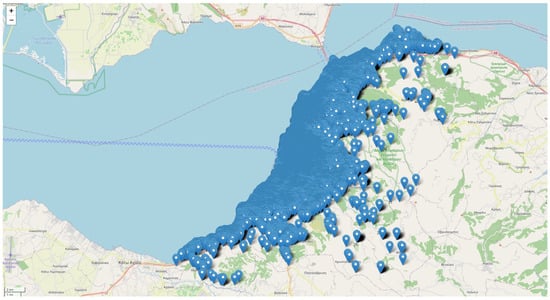
Figure 11.
The spread of the reported issues in the city in the last 5 years.
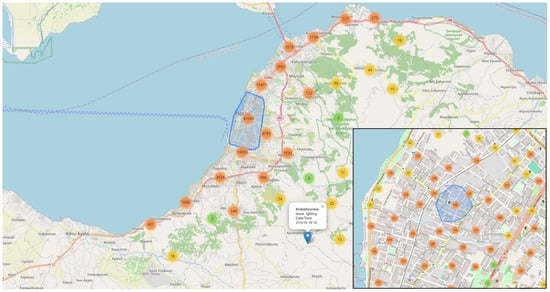
Figure 12.
Issue clustering and information pop-up tag.
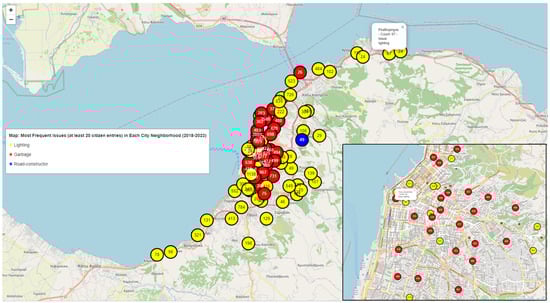
Figure 13.
Filtering the frequency of issues and color clustering.
Subsequently, the trained machine learning model was employed to predict the likelihood of each issue reoccurring in every neighborhood for the next six months. Figure 14 illustrates the probabilities of issue-by-area occurrences on the interactive map for the upcoming three months. Using the mean values in this context is a way to aggregate or summarize the data. By calculating the mean probability for each combination of ‘Areas’ and ‘issue’, the analysis indicates a central tendency for the probabilities associated with each issue in each area. This summary provides a high-level view of the data, enabling identification of areas where certain issues have a higher or lower mean probability. The choice to use mean values might be based on the assumption that a single value can represent the overall probability for a specific issue in a particular area, smoothing out potential variations or outliers in the data. This approach can simplify the visualization and highlight general patterns in the dataset. In this iteration, users can now conveniently stay informed about the predominant issue in each area through the color-coded clustering on the map. Furthermore, they have the ability to assess the likelihood percentage of the most prevalent issue reoccurring in the upcoming 6 months. The map has undergone enhancements in terms of the information presented in each pop-up window, providing insights into the probability of the most common issue resurfacing in the respective area.
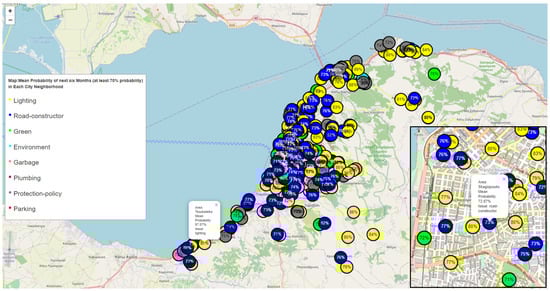
Figure 14.
Issue probability for the next six months in each city neighborhood.
With these refined features on the map and recognizing the growing need for expanded user services, expected to include more than a single user, the pilot implementation of the local deployment of the digital twin’s web application has been executed.
The execution of the digital twin project in Patras involves a custom Python solution designed to construct a simulation platform for modeling neighborhood issues within the city. Employing the Flask micro web framework as the Python web framework, a local development server was created at http://127.0.0.1:5000/. This server is well-suited for building a core digital twin platform, serving as the backend for data management and communication with the frontend environment. This gave rise to the duality of the physical layer with clusters displaying different colors and numbers within them, grouping nearby markers at higher levels of focus, while the numbers indicate the count of indices in each cluster (Figure 15). Upon zooming in, the clusters break down into lower levels, revealing individual markers with more detailed information (Figure 16 and Figure 17). Clicking on a marker will trigger a pop-up window with additional details about the issue in that specific area of the city.
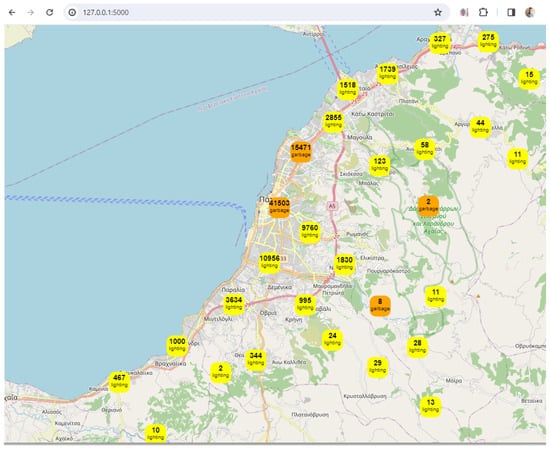
Figure 15.
The digital twin app numbers the issues and colors the most frequent issue in region.
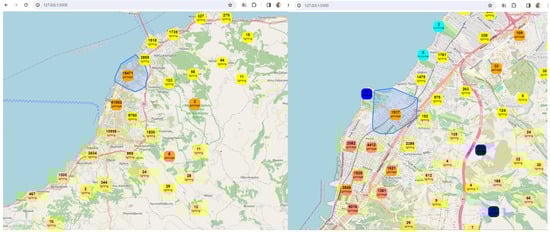
Figure 16.
The digital twin app, an interactive service.
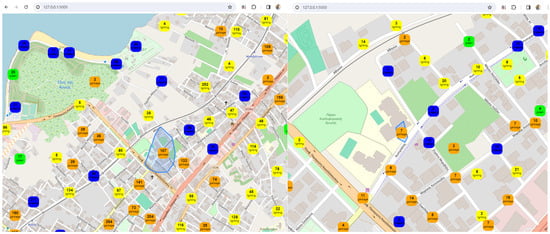
Figure 17.
The digital twin app zooms to the lowest level of the neighborhood.
Within the digital twin project framework, each marker represents a data point related to an issue in a specific area. The color and number within the marker provide a visual summary of how many issues have been reported by the city residents in that particular area. This categorization aids in maintaining a clear and organized map appearance, especially in the case of the project, which involves a large number of markers. This approach to visualizing and interacting with data related to a physical or virtual environment is common in digital twin projects. In the case of this current work, the map serves as a representation of different areas, and the markers highlight issues reported in these areas. Users can explore the map, zoom in for more details, and click on markers to obtain specific information about each issue.
All the aforementioned steps led to a stable yet dynamic understanding of the needs of the digital twin operator. These transformations contributed to the development of the platform, with a focus on capturing the unique characteristics of the physical layer in a digital twin environment. The continuous vigilance of the work through ongoing additions and improvements for a more representative presentation of the city’s pulse in its digital twin version led to the further enrichment of the web application with new features (Figure 18).
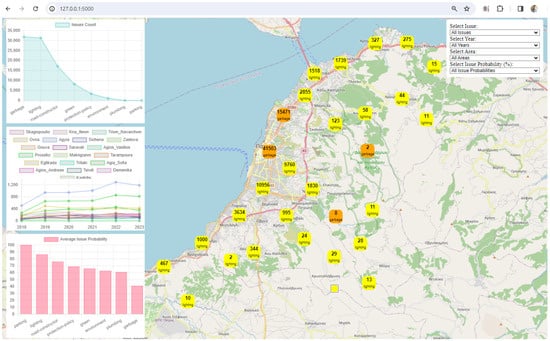
Figure 18.
The digital twin app’s updated version includes layers, filters, and charts.
In addition to the dynamic layers introduced in earlier versions, which included data on the number of issues per area, cluster and marker coloring based on the most prevalent issue per area for quick identification, and the individual depiction of issue forecasts, four additional dynamic filters (issue, year, area, issue probability) and three dynamic charts (issue count, area count per year, issue probability per area) were implemented. Selecting each filter alters the map’s associations to clusters, issues, marker issues, and areas, enabling seamless interaction among the various elements. The Flask application loads, processes, and ultimately provides endpoints to serve the main HTML template, which encompasses containers for the map, charts, and filters, along with the introduction of necessary libraries. Meanwhile, the JavaScript code embedded within the template takes charge of map preparation, charts, and filters, as well as updating data based on user interactions. The implementation incorporates Flask, Leaflet, and Chart.js, enabling the creation of a dynamic web app for exploring the data of the digital twin through interactive maps and charts, where users can filter data based on issues, years, areas, and issue probabilities. The architecture of the Flask application allows for scalability, where additional features, data sources, or visualization elements can be integrated to enhance the overall framework. This flexibility enables the framework to expand to support real-time updates from various sensors and IoT devices in the city, facilitating the monitoring and analysis of the city’s status in real-time through its digital twin. The digital twin application, as depicted in Figure 19, can illustrate predictions, identify issues, and provide area metrics associated with each reported problem categorized by region. Additional visual representations showcasing the enhanced capabilities of the updated digital twin platform can be found in Appendix B.
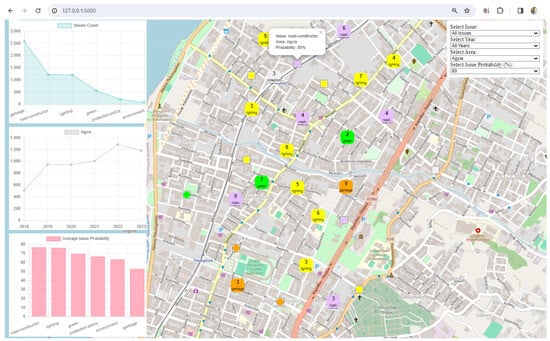
Figure 19.
The digital twin app can display forecasts, issues, and area counts for each reported issue by area.
4. Discussion
The digital twin project in the city of Patras, as outlined in the previous sections, introduces a sophisticated approach to urban management and is able to learn from historical data and real-time data to make informed decisions. The significance of this research lies in its potential to provide city planners, policymakers, and administrators with a valuable tool for understanding and addressing the diverse challenges that characterize smart cities. By harnessing the power of multiclass classification, cities can streamline their decision-making processes, allocate resources judiciously, and work towards creating more resilient and adaptive urban spaces. Building upon the digital twin applications, this paper explores the synergies between the developed multiclass classification model and the digital twin. By integrating the insights garnered from the analysis with the real-time capabilities of the digital twin, the work demonstrates a holistic approach to smart city issue resolution. This integrated framework holds the potential to enhance the accuracy and efficiency of the multiclass classification model by incorporating real-time data and simulations.
The proposed analysis and the utilization of a custom Python solution with open-source technologies, including Flask as the web framework, produce a commitment to tailoring the technology to the specific needs of the city. The literature review provides a foundation for interpreting the digital twin results [6,7,8,9,10,11,12,13,14]. These studies underline the potential of citizen feedback data to inform urban planning and decision-making. The digital twin in Patras aligns with this literature, utilizing similar methodologies to analyze and visualize citizen-reported issues. Here is a more extensive analysis of the various elements of this work:
Custom Python Solution: The decision to employ a custom Python solution for the digital twin project is strategic, providing flexibility and customization. Python’s versatility, coupled with the Flask micro web framework, allows for the seamless integration of back-end functionalities. The implementation of a local intranet development server, as detailed in section materials and methods, ensures an efficient and localized environment, contributing to the creation of a robust digital twin platform. The paper on Flask-based digital twin applications contributes to understanding the technical architecture of the digital twin in Patras. The proposed frameworks in these papers highlight the versatility of Flask for developing smart city digital twins [6,7,8,9,10,11,12,13,14,15,16,17]. The integration of machine learning models in these frameworks mirrors the approach taken in the Patras digital twin, emphasizing the role of Flask in building scalable and intelligent urban management platforms.
Interactive Visualization: The heart of the digital twin project lies in its ability to present complex urban data through interactive visualization. The incorporation of Leaflet and Chart.js in the web application enhances the user experience, offering dynamic maps and charts. The dynamic filters and charts, as discussed in the results, empower users to interact with the data, tailoring their exploration to specific issues, areas, and timeframes. This not only facilitates a deeper understanding of the urban landscape but also ensures that stakeholders can derive meaningful insights from the vast dataset.
Predictive Modeling and Machine Learning: The integration of machine learning models, specifically the random forest classifier, adds a predictive dimension to the digital twin. The models, trained on historical data, contribute to forecasting potential issues in different neighborhoods over the next six months. This forward-looking capability positions the digital twin as a proactive tool for urban planning, allowing city officials to anticipate and mitigate challenges before they escalate. The studies on machine learning applications in urban settings offer a parallel to the digital twin’s use of machine learning models. The application of machine learning algorithms allows for a more sophisticated analysis of the vast dataset, enabling the identification of patterns that might not be immediately apparent. This resonates with the digital twin’s use of a random forest classifier for predictive modeling. The literature showcases a combination of digital twin technology and machine learning for enhancing public services [5,8,12,13,14,22]. In a similar vein, the digital twin in Patras leverages machine learning within a Flask-based framework to optimize urban planning. This integration signifies a synergy between the dynamic representation of the city (digital twin) and advanced analytical tools (machine learning) to improve public services.
Spatial Clustering: The spatial clustering of reported issues on the interactive map is a pivotal feature. Clusters serve as a visual aid, quickly highlighting areas with a higher concentration of problems. This functionality streamlines decision-making processes, enabling city officials to prioritize interventions and allocate resources efficiently.
Continuous Development and Adaptability: The commitment to continuous development, as evident in the frequent updates and additional features, underscores the adaptability of the digital twin. The inclusion of new filters and charts, as showcased in Figure 19, ensures that the platform remains responsive to the evolving needs of its operators. This adaptability positions the digital twin as a scalable solution capable of incorporating additional functionalities and datasets in the future.
User Empowerment: The emphasis on user interaction and empowerment through the application’s features is noteworthy. By providing users with the ability to filter issues, years, areas, forecasts and visualize data based on their preferences, the digital twin becomes a versatile tool for diverse stakeholders. This user-centric approach enhances engagement and ensures that the platform is accessible and beneficial to a wide range of users, from city officials to residents. The literature on the potential of digital twins for urban planning aligns with the broader implications of the digital twin project in Patras. The ability to simulate different urban planning scenarios corresponds to the digital twin’s capability to predict and simulate future issues based on historical data. This reinforces the transformative potential of digital twins in revolutionizing urban planning methodologies.
Potential for Real-Time Integration: The architecture’s extensibility, particularly the incorporation of Flask, opens doors to future enhancements. The suggestion of integrating real-time data from various sensors and IoT devices positions the digital twin as a platform that can evolve to incorporate emerging technologies. This potential for real-time data integration holds promise for creating a more dynamic and responsive urban management system.
5. Conclusions
In conclusion, the digital twin project in Patras stands as a modern and comprehensive urban management solution, leveraging citizen feedback data and advanced technologies. The proposed analysis adds a crucial dimension to issue tracking, enabling city officials to discern evolving patterns and make informed decisions. This aligns seamlessly with findings from studies on citizen feedback data, emphasizing the importance of trends in understanding urban challenges. The comparison with the literature, particularly studies analyzing citizen feedback data from various cities worldwide, provides a robust context for interpreting the results. The digital twin’s capacity to identify and visualize urban issues resonates with similar findings in the literature, reinforcing the efficacy of citizen-reported data in shaping urban policies. The integration of machine learning within the digital twin aligns with the broader trends identified in the literature. Studies showcasing the power of machine learning algorithms to analyze vast datasets and improve urban planning find practical applications in the digital twin’s predictive modeling and issue forecasting. The Flask-based framework, as demonstrated in the literature, proves to be a versatile and scalable solution for developing intelligent urban management platforms.
Furthermore, the digital twin’s combination of machine learning and a dynamic representation of the city echoes successful models discussed in the literature. This synergy, as seen in studies on improving public transportation and assessing the potential of digital twins for urban planning, positions the Patras digital twin at the core of smart city initiatives. In essence, the digital twin in Patras represents a technological advancement and embodies a paradigm shift in urban planning and management. By drawing on insights from literature and implementing cutting-edge technologies, the project addresses current urban challenges and strengthens the foundation for future advancements in smart city initiatives. The potential for informed decision-making, infrastructure optimization, and enhanced public services positions the digital twin in Patras as an additional force in transforming the cities of tomorrow.
In summary, this paper offers a comprehensive investigation into the amalgamation of data analytics, predictive forecasting, and digital twin technologies. Through an in-depth exploration of these elements, the paper seeks to unravel the transformative potential of these innovations in sculpting the urban landscapes of tomorrow, where cities not only respond intelligently to current challenges but also proactively shape a sustainable and resilient future for their residents.
The study identifies a limitation related to the absence of standardized protocols and formats for digital twins, posing challenges to interoperability. Different systems and platforms may struggle to communicate and share data seamlessly. Integrating various digital twin models and datasets from different domains, such as transportation, energy, and healthcare is complex. Another noteworthy limitation highlighted by the study pertains to machine learning algorithms, which heavily rely on historical data that may inherently contain biases. If not addressed, this can result in unfair or discriminatory outcomes, especially in areas such as public services and law enforcement. Understanding and explaining the decisions made by machine learning models is crucial for accountability and building trust.
To address these challenges, future initiatives may include exploring and promoting the creation of standardized protocols and formats for digital twins. This effort aims to enhance interoperability and facilitate seamless communication between different systems and datasets. Encouraging collaboration across sectors, such as transportation, energy, and healthcare, to integrate different digital twin models and datasets presents an interdisciplinary approach that could enhance the overall effectiveness and scope of urban management solutions. This requires continuous improvement of analytical methods and tools in line with developments in data analysis, predictive modeling, and digital twin technologies. It includes adopting emerging best practices and strengthening methodologies based on ongoing research discoveries. In addition, active participation in ongoing research and discourse on ethical issues in machine learning, with an emphasis on mitigating biases, ensuring fairness, and promoting transparency, can help shape guidelines for responsible machine learning practices.
Author Contributions
A.F.G. and V.S.V., methodology; A.F.G., software; A.F.G., validation; A.F.G., S.K., G.F. and V.S.V., formal analysis; A.F.G., investigation; A.F.G. and S.K., resources; A.F.G., data curation; A.F.G., S.K., G.F. and V.S.V., writing—original draft preparation; A.F.G. and V.S.V., visualization; A.F.G. and V.S.V., supervision; A.F.G., project administration. All authors have read and agreed to the published version of the manuscript.
Funding
This research received no external funding.
Data Availability Statement
The data is not publicly available due to municipal policies.
Conflicts of Interest
The authors declare no conflict of interest.
Appendix A
This appendix provides details on the comprehensive structure of both the backend (Flask) and the frontend (HTML and JavaScript) components. Below is a more general structure for Flask code that separates the backend (Flask) from the front end (HTML and JavaScript) and serves as a web page that includes a map, graphs, and filters. Further implementation of map preparation, graphs, manipulation filters, and data updates in JavaScript will depend on each specific requirement.
          # Simplified Flask Code with Data Lake Processing and Output
          from flask import Flask, render_template, jsonify
          import pandas as pd
          import json
          app = Flask(__name__)
          # Function to load processed data from an output CSV
          def load_data_from_processed_csv(csv_path):
              try:
                  # Load data from the CSV file
                  data = pd.read_csv(csv_path)
                  return data
              except Exception as e:
                  print(f"Error loading data from CSV: {str(e)}")
                  return pd.DataFrame()
          # Extract unique values for filters
          def get_unique_values(data):
              unique_years = data['year'].unique().tolist()
              unique_areas = data['Areas'].unique().tolist()
              unique_issues = data['issue'].unique().tolist()
              unique_issue_Probability = data['issue_Probability'].unique().tolist()
              return unique_years, unique_areas, unique_issues, unique_issue_Probability
          # Route to serve the main page
          @app.route('/')
          def index():
              try:
                  # Set the path to the processed CSV file from the data lake
                  csv_path = r"G:\DataLake\processed_data_output.csv"
                  # Load data from the processed CSV file
                  digital_twin_data = load_data_from_processed_csv(csv_path)
                  # Check if data is empty
                  if digital_twin_data.empty:
                      return render_template('index.html', issues='[]', unique_issue_Probability='[]')
                  # Get unique values for filters
                  unique_years, unique_areas, unique_issues, unique_issue_Probability = get_unique_values(digital_twin_data)
                  # Convert DataFrame to a list of dictionaries and handle NaN values
                  data_list = digital_twin_data.replace({pd.NaT: None}).to_dict(orient='records')
                  # Pass data to the HTML template
                  return render_template('index.html', issues=json.dumps(data_list), unique_issue_Probability=list(map(int, unique_issue_Probability)))
              except Exception as e:
                  print(f"Error processing data: {str(e)}")
                  # Pass empty arrays if an error occurs
                  return render_template('index.html', issues='[]', unique_issue_Probability='[]')
          # Run the Flask app
          if __name__ == '__main__':
              app.run(debug=True)
Key points about the general structure of the Flask code:
Load Data from Data Lake Output: The load_data_from_processed_csv function is responsible for loading processed data from the output csv file specified by the csv_path variable. This function handles exceptions and returns an empty DataFrame if there is an error loading the data.
Error Handling: The code includes try-except blocks for loading data from the csv file. If an error occurs during data loading, it prints an error message to the console, and an empty DataFrame is returned.
Data Processing: The code assumes that the processed data is stored in the specified csv file. The csv_path variable appends to the correct path of the csv file of the processed data.
Unique Values Extraction: The get_unique_values function extracts unique values for years, areas, issues, and issue probability according to the data of the current work. This information is likely used for setting up filters on the frontend.
HTML Template Rendering: The code renders the HTML template (‘index.html’) and passes the processed data to it. If the data is empty, it passes empty arrays to ensure that the frontend gracefully handles the absence of data.
Run the Flask App: The script runs the Flask app when executed directly. The if __name__ == ‘__main__’: block ensures that the app starts only when the script is executed directly, not when it’s imported as a module.
The following code is a general template of the templates/index.html structure based on the placeholders used in the previous Flask code and can be replaced with the appropriate HTML and JavaScript code according to the needs of each project.
        <!DOCTYPE html>
        <html lang="en">
        <head>
            <!-- Head content including title, CSS, and scripts -->
            <title>The Title</title>
            <!-- Include CSS styles -->
            <!-- Include Leaflet and Chart.js libraries -->
            <script src="https://unpkg.com/leaflet@1.7.1/dist/leaflet.js"></script>
            <script src="https://unpkg.com/leaflet.markercluster@1.4.1/dist/leaflet.markercluster.js"></script>
            <script src="https://cdn.jsdelivr.net/npm/chart.js"></script>
        </head>
        <body>
            <div id="map"></div>
            <div id="chartContainer1">
                <!-- Chart container for Issue Count -->
            </div>
            <div id="chartContainer2">
                <!-- Chart container for Area Count -->
            </div>
            <div id="filters">
                <!-- Filters container including Issue, Year, Area, and Issue Probability filters -->
            </div>
            <div id="chartContainer3">
                <!-- Chart container for Average Issue Probability -->
            </div>
            <!-- Include the custom JavaScript code for initializing the map and charts, handling filters, and updating data -->
            <script>
                // JavaScript code for initializing the map and charts, handling filters, and updating data
                var issues = {{ issues|safe }};
                var uniqueIssueProbability = {{ unique_issue_Probability|safe }};
                        // Use the 'issues' and 'uniqueIssueProbability' variables to initialize your charts and map
                // Example: Initialize a chart using Chart.js
                var ctx = document.getElementById('chartContainer1').getContext('2d');
                var myChart = new Chart(ctx, {
                    type: 'bar',
                    data: {
                        labels: ['Label1', 'Label2', 'Label3'],
                        datasets: [{
                            label: 'Issues Count',
                            data: [10, 20, 30],
                            backgroundColor: 'rgba(75, 192, 192, 0.2)',
                            borderColor: 'rgba(75, 192, 192, 1)',
                            borderWidth: 1
                        }]
                    }
                });
                // Example: Initialize a map using Leaflet
                var map = L.map('map').setView([51.505, -0.09], 13);
         L.tileLayer('https://{s}.tile.openstreetmap.org/{z}/{x}/{y}.png', {
                    attribution: '© OpenStreetMap contributors'
                }).addTo(map);
                // Add markers to the map based on 'issues' data
                // The additional JavaScript code for handling filters and updating data
            </script>
        </body>
        </html>
Key points about the general structure of templates/index.html code:
Dynamic Data: The Flask variables {{ issues|safe }} and {{ unique_issue_Probability|safe }} are used to dynamically inject data into the HTML template. The structure of these variables must align with the expected data format in the project’s JavaScript code.
Leaflet and Chart.js: The HTML file includes the necessary scripts for Leaflet and Chart.js. and using the provided placeholders, the initialization of the map and charts can be customized.
Custom JavaScript: The <script> tag includes a placeholder for your custom JavaScript code. Replace this with the actual code needed to initialize the map and charts, handle filters, and update data based on your application’s requirements.
CSS Styling: You may want to include CSS styles for styling your HTML elements. Add a <link> tag in the <head> section to link your CSS file if needed.
The provision of the Flask and HTML code frameworks serves the purpose of offering readers an overview of the project’s development structure without delving into the extensive details inherent in the Python programming language code. This framework allows readers to grasp the project’s rationale and development flow efficiently. Regarding the specific elements used in Flask and the HTML code of the work, it is necessary to note the following aspects:
The highlighted aspects of this work’s detailed Flask application code
Efficient Data Loading: The code efficiently loads data from the data lake output in csv format, demonstrating a seamless pandas integration for data manipulation.
Data Processing for Enhanced Analysis: The addition of the ‘year’ column based on the ‘reported_date_time’ field demonstrates thoughtful data processing, enabling users to analyze data over time.
Dynamic Filtering Options: The collection of unique years, areas, issues, and issue probabilities allows users to dynamically filter and explore the dataset. This feature enhances the user’s ability to derive insights based on specific criteria.
Error Handling and Graceful Degradation: The code includes error-handling mechanisms that print informative messages. In case of an error, the application gracefully provides default values for filters, ensuring a smooth user experience even in unexpected situations.
Interactive HTML Rendering: The render_template function dynamically renders the ‘map.html’ template, passing data to the front end for display. This approach supports an interactive and responsive user interface.
Conversion to JSON for Frontend Integration: The conversion of the DataFrame to a list of dictionaries and subsequent conversion to JSON ensures seamless integration with the frontend. This is a key aspect of rendering dynamic content.
User-Friendly Display of Data: The application provides a user-friendly display, passing empty arrays if no data is available. This thoughtful consideration contributes to a positive user experience.
Debugging Information: The use of print statements for debugging purposes during data loading ensures that developers can quickly identify and address any issues.
Conditional Execution: The if __name__ == ‘__main__’: block ensures that the Flask app is only run when the script is executed directly, promoting modular and reusable code.
Support for Future Enhancements: The modular structure and integration with a frontend template suggest a codebase that is extensible and open to future enhancements. This is crucial for the longevity and adaptability of the application.
The highlighted aspects of this work’s detailed maps.html code
Integration of Maps and Charts: The seamless integration of Leaflet for interactive maps and Chart.js for dynamic charts creates an engaging user experience. This combination allows users to visually explore spatial and statistical aspects of the data.
User-Friendly Filters: The inclusion of user-friendly filters for issues, years, areas, and issue probabilities empowers users to tailor their data exploration. This level of interactivity is crucial for a meaningful and personalized user experience.
Clustered Marker Representation: The use of clustered markers on the map, each representing the most frequent issue in that cluster, adds a layer of sophistication. It condenses information while providing insights into prevalent issues in specific geographical areas.
Dynamic Data Loading: The code demonstrates flexibility by allowing data to be loaded from the data lake output. This adaptability showcases a robust system capable of handling different data sources, increasing its applicability in various scenarios.
Real-Time Data Updates: The real-time update functionality, triggered by filter changes, ensures that users receive instant feedback. This feature facilitates a dynamic and responsive data exploration experience.
Appealing Visual Design: The use of custom styles, including vibrant colors, clear typography, and strategic layout, contributes to an aesthetically pleasing design. A visually appealing interface can captivate users and make the exploration process more enjoyable.
Chart Variety: The inclusion of different chart types (line and bar charts) adds diversity to data representation. This variety not only caters to different learning styles but also provides a comprehensive view of the dataset.
Random Color Generation: The inclusion of a function to generate random colors for chart elements adds a playful and dynamic element to the visual representation. It enhances the overall visual appeal and contributes to a lively user interface.
Responsive Design: The implementation of responsive design principles ensures that the application remains accessible and functional across various devices and screen sizes. This adaptability reflects a commitment to user convenience.
Potential for Further Customization: The code structure and modular design suggest a foundation that can be easily extended or customized. This feature encourages further development, allowing users to adapt the application to their specific needs or integrate additional functionalities.
Appendix B
This appendix provides further visual representations highlighting the enhanced capabilities of the updated digital twin application.
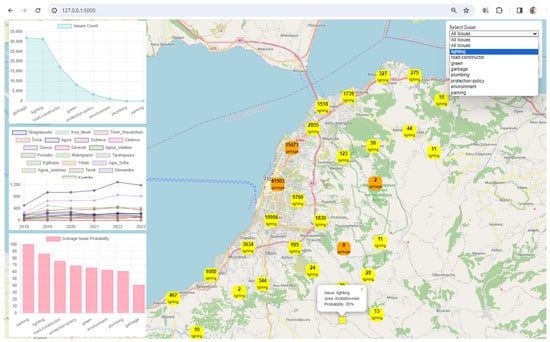
Figure A1.
The digital twin app, update charts, issue clusters, and areas (filter issue: lighting).
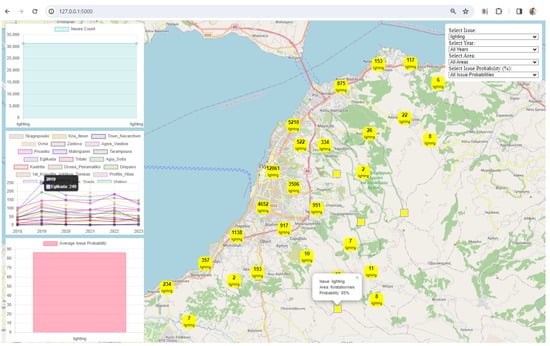
Figure A2.
The digital twin app, update charts, issue clusters, and areas (filter issue: lighting).
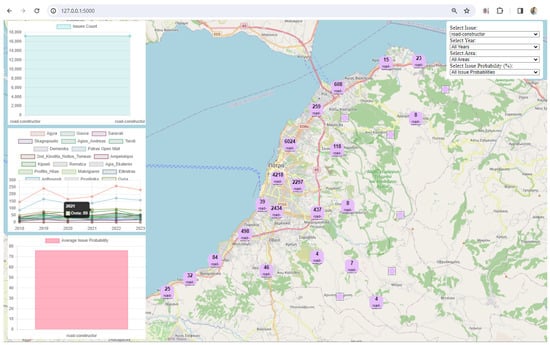
Figure A3.
Digital twin app, update charts, issue clusters, and areas (filter issue: road-constructor).
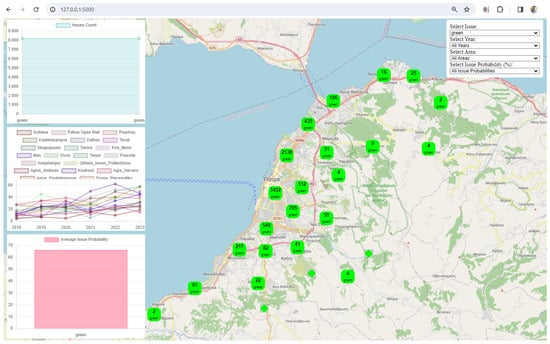
Figure A4.
The digital twin app, update charts, issue clusters, and areas (filter issue: green).
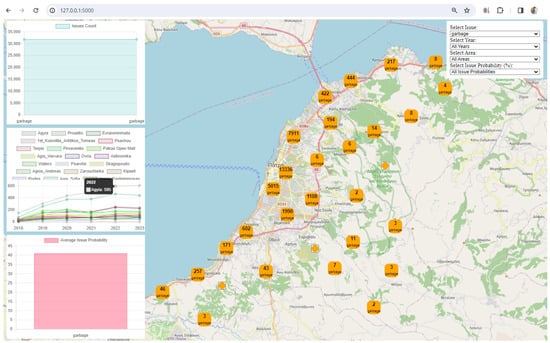
Figure A5.
Digital twin app, update charts, issue clusters, and areas (filter issue: garbage).
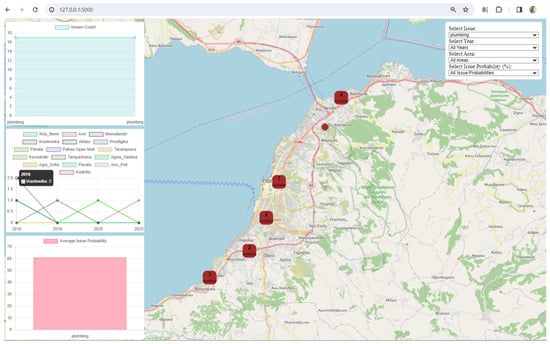
Figure A6.
The digital twin app, update charts, issue clusters, and areas (filter issue: plumbing).
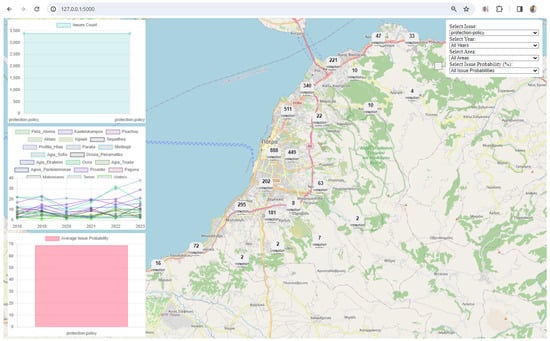
Figure A7.
Digital twin app, update charts, issue clusters, and areas (filter issue: protection policy).
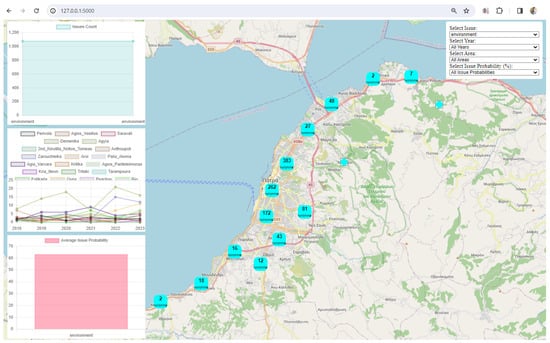
Figure A8.
Digital twin app, update charts, issue clusters, and areas (filter issue: environment).
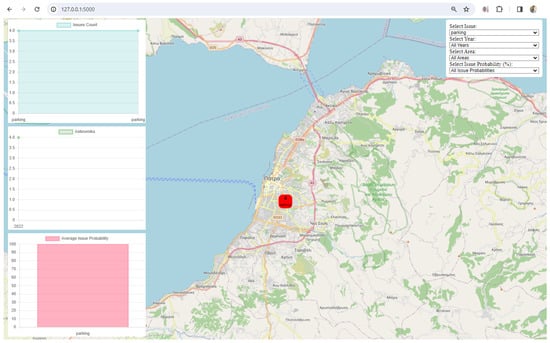
Figure A9.
Digital twin app, update charts, issue clusters, and areas (filter issue: parking).
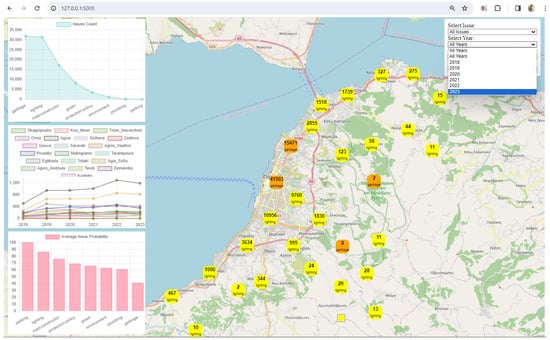
Figure A10.
Digital twin app, update charts, issue clusters, and areas (filter: years).
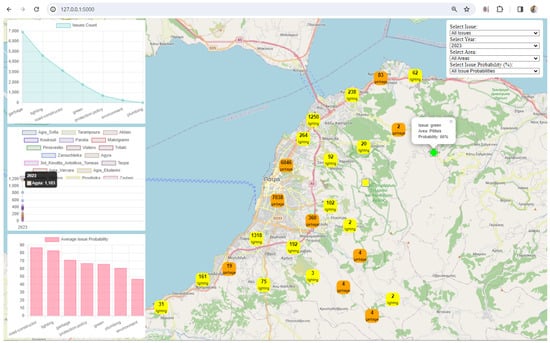
Figure A11.
Digital twin app, update charts, issue clusters, and areas (filter years: 2023).
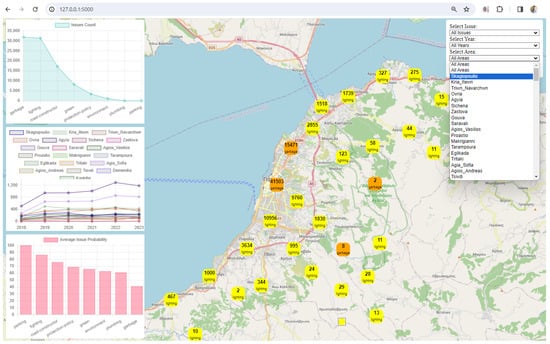
Figure A12.
The digital twin app, update charts, issue clusters, and areas (filter: areas).
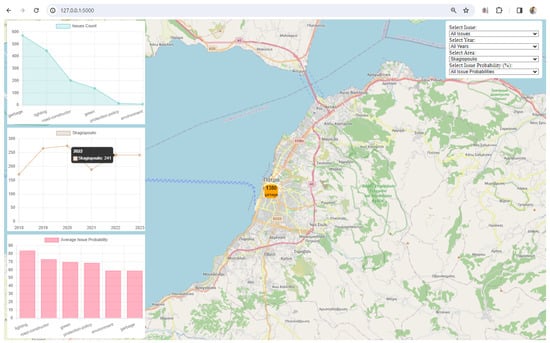
Figure A13.
Digital twin app, update charts, issue clusters, and areas (filter areas: Skagiopoulio).
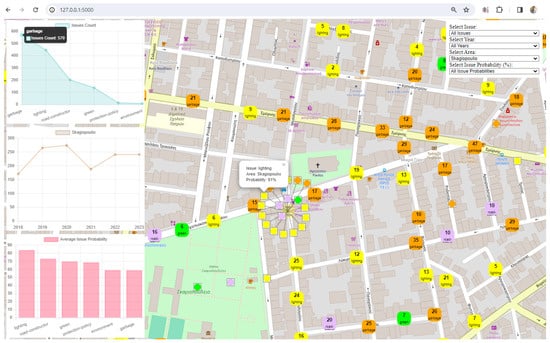
Figure A14.
Digital twin app, update charts, issue clusters, and areas (filter areas: Skagiopoulio).
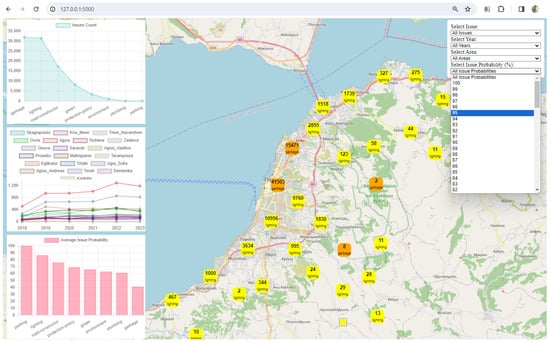
Figure A15.
The digital twin app, update charts, issue clusters, and areas (filter: probabilities).
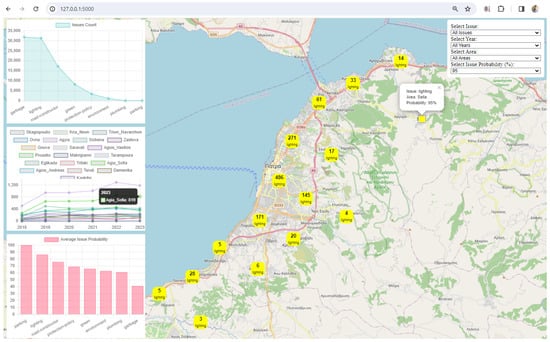
Figure A16.
Digital twin app, update charts, issue clusters, and areas (filter probabilities: 95%).
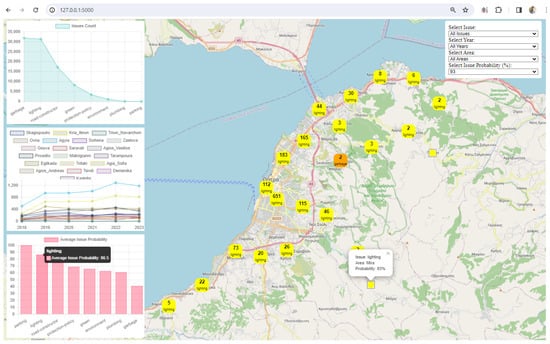
Figure A17.
Digital twin app, update charts, issue clusters, and areas (filter probabilities: 93%).
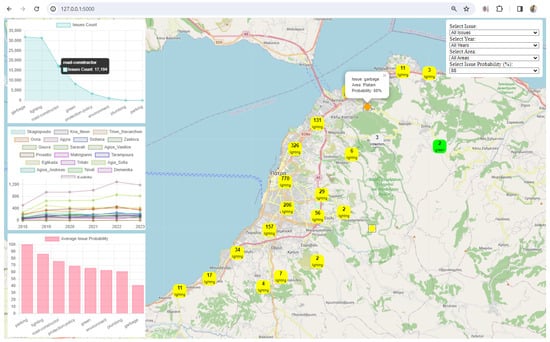
Figure A18.
Digital twin app, update charts, issue clusters, and areas (filter probabilities: 88%).
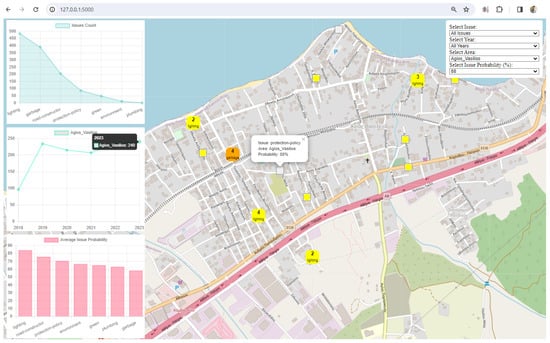
Figure A19.
Digital Twin app, update charts, issue clusters, and areas (two filters: area, probabilities).
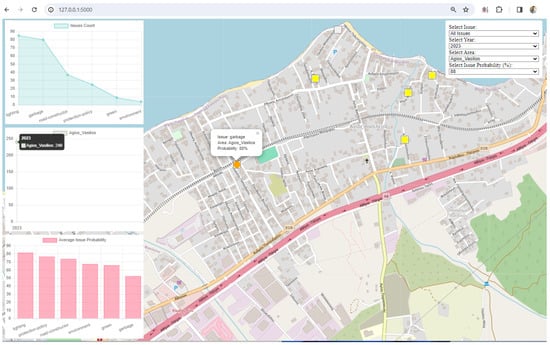
Figure A20.
The digital twin app, update charts, issue clusters, and areas (three filters: year, area, and probabilities).
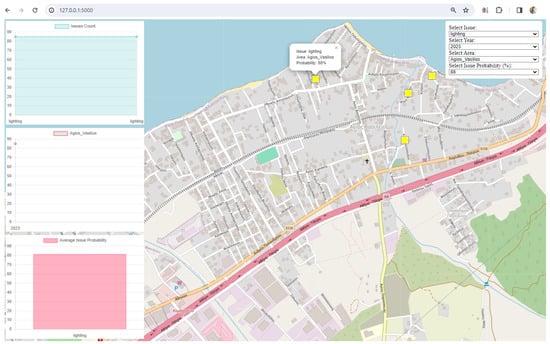
Figure A21.
The digital twin app, update charts, issue clusters, and areas (four filters: issue, year area, probabilities).
References
- Weil, C.; Bibri, S.E.; Longchamp, R.; Golay, F.; Alahi, A. Urban Digital Twin Challenges: A Systematic Review and Perspectives for Sustainable Smart Cities. Sustain. Cities Soc. 2023, 99, 104862. [Google Scholar] [CrossRef]
- Deng, T.; Zhang, K.; Shen, Z.-J. A systematic review of a digital twin city: A new pattern of urban governance toward smart cities. J. Manag. Sci. Eng. 2021, 6, 125–134. [Google Scholar] [CrossRef]
- Wolf, K.; Dawson, R.J.; Mills, J.P.; Blythe, P.; Morley, J. Towards a digital twin for supporting multi-agency incident management in a smart city. Sci. Rep. 2022, 12, 16221. [Google Scholar] [CrossRef]
- Gkontzis, A.F.; Kalles, D.; Paxinou, E.; Tsoni, R.; Verykios, V.S. A Big Data Analytics Conceptual Framework for a Smart City: A Case Study. In Building on Smart Cities Skills and Competences; Internet of Things; Fitsilis, P., Ed.; Springer: Cham, Swizterland, 2022. [Google Scholar] [CrossRef]
- Salamanis, A.I.; Gravvanis, G.A.; Kotsiantis, S.B.; Vrahatis, M.N. Novel Sparse Feature Regression Method for Traffic Forecasting. Int. J. Artif. Intell. Tools 2023, 32, 2350008. [Google Scholar] [CrossRef]
- White, G.; Zink, A.; Codecá, L.; Clarke, S. A digital twin smart city for citizen feedback. Cities 2021, 110, 103064. [Google Scholar] [CrossRef]
- Najafi, P.; Mohammadi, M.; Wesemael, P.; Le Blanc, P.M. A user-centred virtual city information model for inclusive community design: State-of-art. Cities 2023, 134, 104203. [Google Scholar] [CrossRef]
- Abdeen, F.N.; Shirowzhan, S.; Sepasgozar, S.M.E. Citizen-centric digital twin development with machine learning and interfaces for maintaining urban infrastructure. Telemat. Inform. 2023, 84, 102032. [Google Scholar] [CrossRef]
- Jeddoub, I.; Nys, G.-A.; Hajji, R.; Billen, R. Digital Twins for cities: Analyzing the gap between concepts and current implementations with a specific focus on data integration. Int. J. Appl. Earth Obs. Geoinf. 2023, 122, 103440. [Google Scholar] [CrossRef]
- Xia, H.; Liu, Z.; Efremochkina, M.; Liu, X.; Lin, C. Study on city digital twin technologies for sustainable smart city design: A review and bibliometric analysis of geographic information system and building information modeling integration. Sustain. Cities Soc. 2022, 84, 104009. [Google Scholar] [CrossRef]
- Bonney, M.S.; de Angelis, M.; Dal Borgo, M.; Andrade, L.; Beregi, S.; Jamia, N.; Wagg, D.J. Development of a digital twin operational platform using Python Flask. Data-Centric Eng. 2022, 3, e1. [Google Scholar] [CrossRef]
- Casali, Y.; Aydin, N.Y.; Comes, T. Machine learning for spatial analyses in urban areas: A scoping review. Sustain. Cities Soc. 2022, 85, 104050. [Google Scholar] [CrossRef]
- Omar, A.; Delnaz, A.; Nik-Bakht, M. Comparative analysis of machine learning techniques for predicting water main failures in the City of Kitchener. J. Infrastruct. Intell. Resil. 2023, 2, 100044. [Google Scholar] [CrossRef]
- Ariyachandra, M.F.; Wedawatta, G. Digital Twin Smart Cities for Disaster Risk Management: A Review of Evolving Concepts. Sustainability 2023, 15, 11910. [Google Scholar] [CrossRef]
- Martí, P.; Serrano-Estrada, L.; Nolasco-Cirugeda, A. Social Media data: Challenges, opportunities and limitations in urban studies. Comput. Environ. Urban Syst. 2019, 74, 161–177. [Google Scholar] [CrossRef]
- Hu, A.; Yabuki, N.; Fukuda, T.; Kaga, H.; Takeda, S.; Matsuo, K. Harnessing multiple data sources and emerging technologies for comprehensive urban green space evaluation. Cities 2023, 143, 104562. [Google Scholar] [CrossRef]
- Wang, R.; Zhang, X.; Li, N. Zooming into mobility to understand cities: A review of mobility-driven urban studies. Cities 2022, 130, 103939. [Google Scholar] [CrossRef]
- Chen, Z.; Chan, I.C.C. Smart cities and quality of life: A quantitative analysis of citizens’ support for smart city development. Inf. Technol. People 2023, 36, 263–285. [Google Scholar] [CrossRef]
- Wirtz, B.W.; Müller, W.M.; Schmidt, F.W. Digital Public Services in Smart Cities—An Empirical Analysis of Lead User Preferences. Public Organ. Rev. 2021, 21, 299–315. [Google Scholar] [CrossRef]
- Wirtz, B.W.; Becker, M.; Schmidt, F.W. Smart city services: An empirical analysis of citizen preferences. Public Organ. Rev. 2022, 22, 1063–1080. [Google Scholar] [CrossRef]
- Li, W.; Feng, T.; Timmermans, H.J.P.; Li, Z.; Zhang, M.; Li, B. Analysis of citizens’ motivation and participation intention in urban planning. Cities 2020, 106, 102921. [Google Scholar] [CrossRef]
- Allen, B.; Tamindael, L.E.; Bickerton, S.H.; Cho, W. Does citizen coproduction lead to better urban services in smart cities projects? An empirical study on e-participation in a mobile big data platform. Gov. Inf. Q. 2020, 37, 101412. [Google Scholar] [CrossRef]
- Oh, J. Smart City as a Tool of Citizen-Oriented Urban Regeneration: Framework of Prelim-inary Evaluation and Its Application. Sustainability 2020, 12, 6874. [Google Scholar] [CrossRef]
- Savastano, M.; Suciu, M.-C.; Gorelova, I.; Stativă, G.A. How smart is mobility in smart cities? An analysis of citizens’ value perceptions through ICT applications. Cities 2023, 132, 104071. [Google Scholar] [CrossRef]
- Noori, N.; Hoppe, T.; Jong, M.D.; Stamhuis, E. Transplanting good practices in Smart City development: A step-wise approach. Gov. Inf. Q. 2023, 40, 101802. [Google Scholar] [CrossRef]
- Bala, M.; Boussaid, O.; Alimazighi, Z. A Fine-Grained Distribution Approach for ETL Processes in Big Data Environments. Data Knowl. Eng. 2017, 111, 114–136. [Google Scholar] [CrossRef]
- Alexandropoulos, S.-A.N.; Kotsiantis, S.B.; Vrahatis, M.N. Data preprocessing in predictive data mining. Knowl. Eng. Rev. 2019, 34, e1. [Google Scholar] [CrossRef]
- Gkontzis, A.F.; Kontsiantis, S.; Kalles, D.; Panagiotakopoulos, C.T.; Verykios, V.S. Polarity, Emotions, and Online Activity of Students and Tutors as Features in Predicting Grades. Int. J. Intell. Decis. Technol. 2020, 14, 409–436. [Google Scholar] [CrossRef]
Disclaimer/Publisher’s Note: The statements, opinions and data contained in all publications are solely those of the individual author(s) and contributor(s) and not of MDPI and/or the editor(s). MDPI and/or the editor(s) disclaim responsibility for any injury to people or property resulting from any ideas, methods, instructions or products referred to in the content. |
© 2024 by the authors. Licensee MDPI, Basel, Switzerland. This article is an open access article distributed under the terms and conditions of the Creative Commons Attribution (CC BY) license (https://creativecommons.org/licenses/by/4.0/).