Computer Vision and Machine Learning-Based Predictive Analysis for Urban Agricultural Systems


Abstract
1. Introduction
2. Related Work and Research Gaps
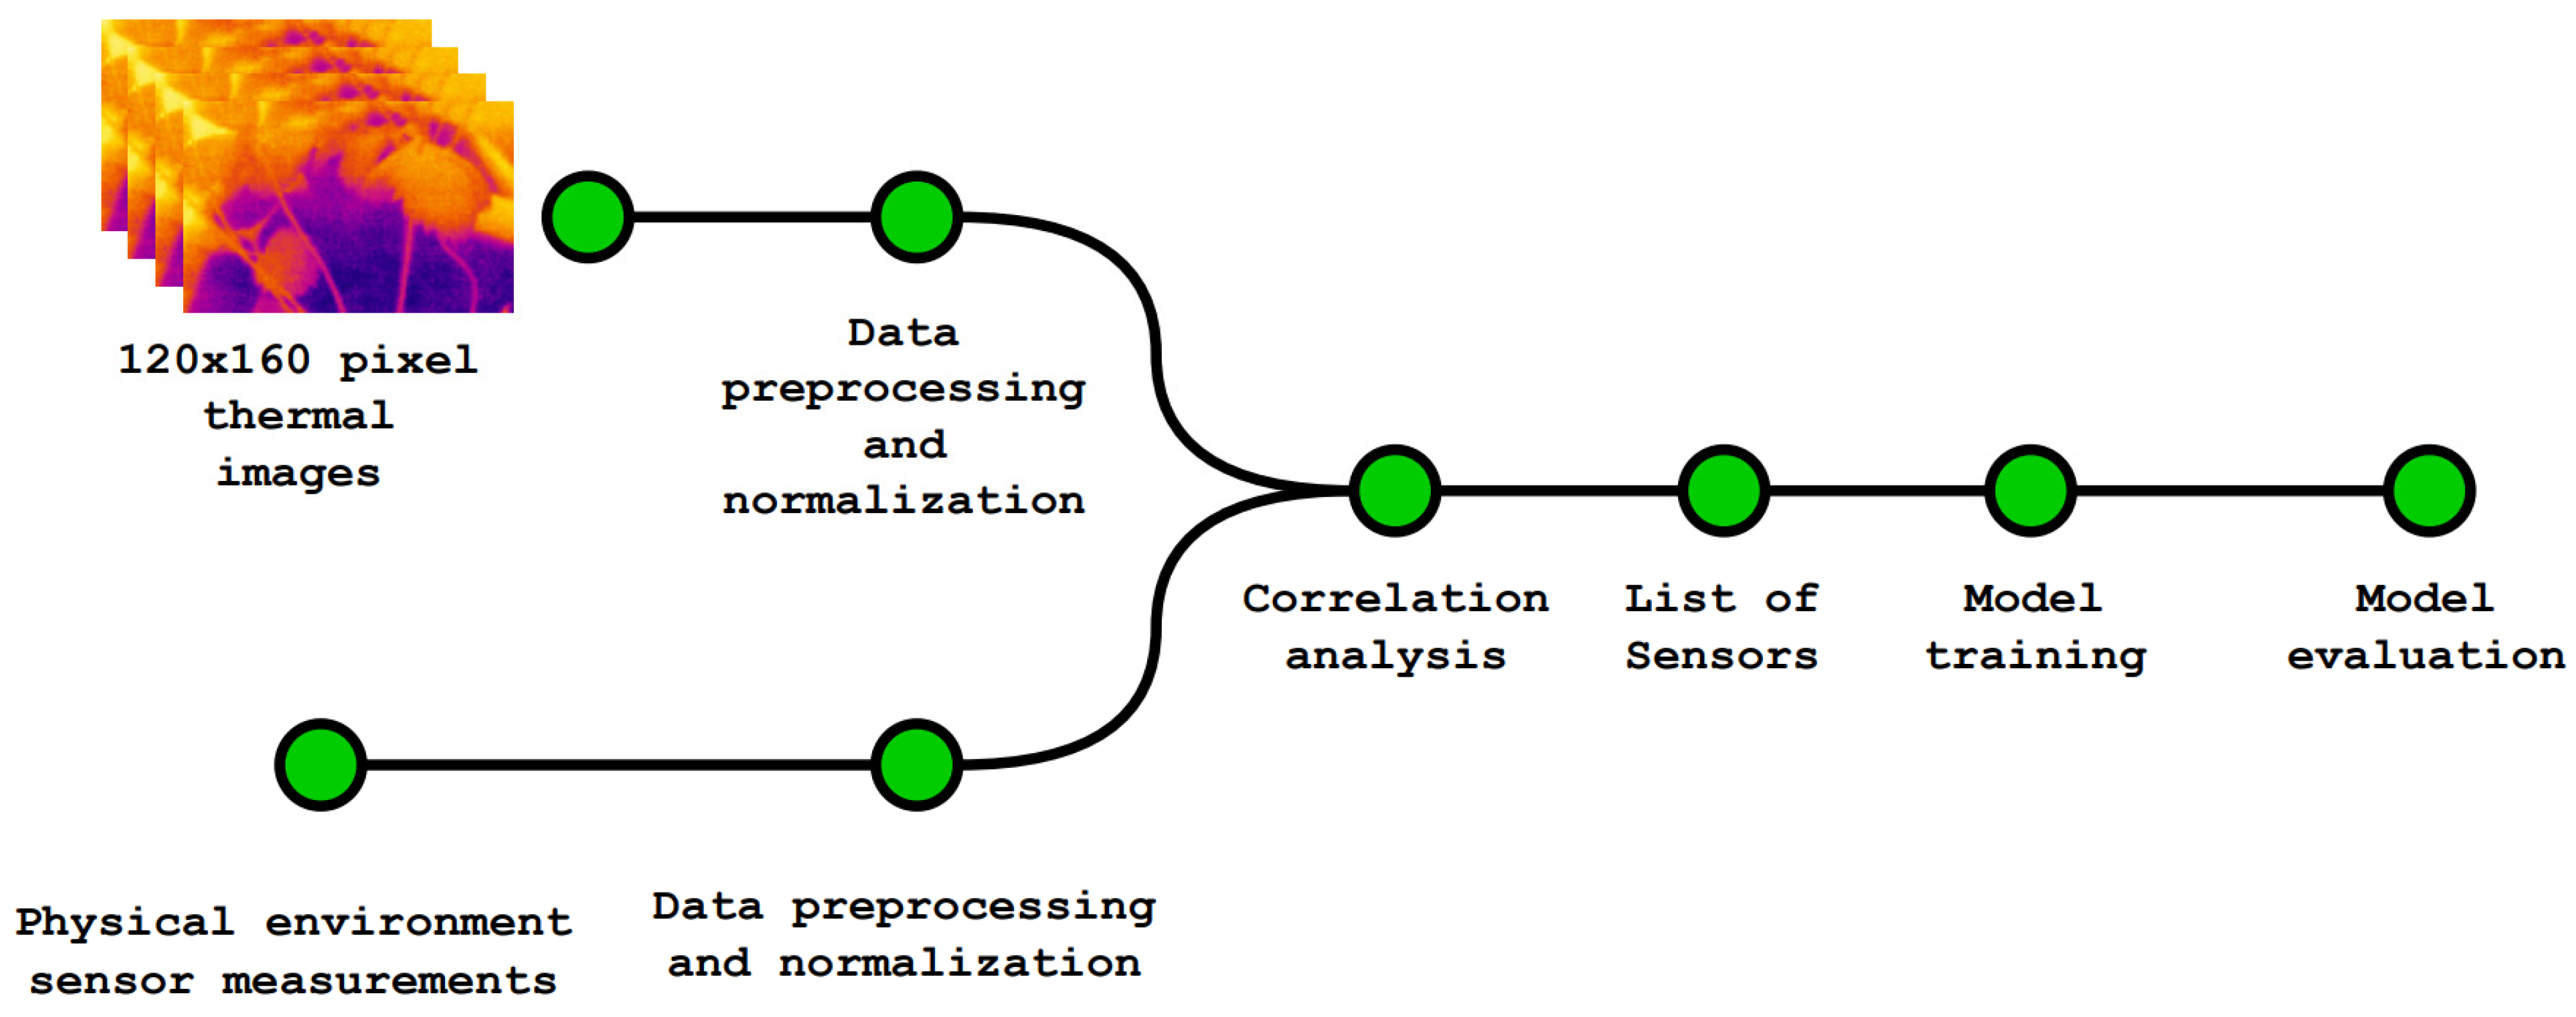
3. Methodology
4. Model Development and Training
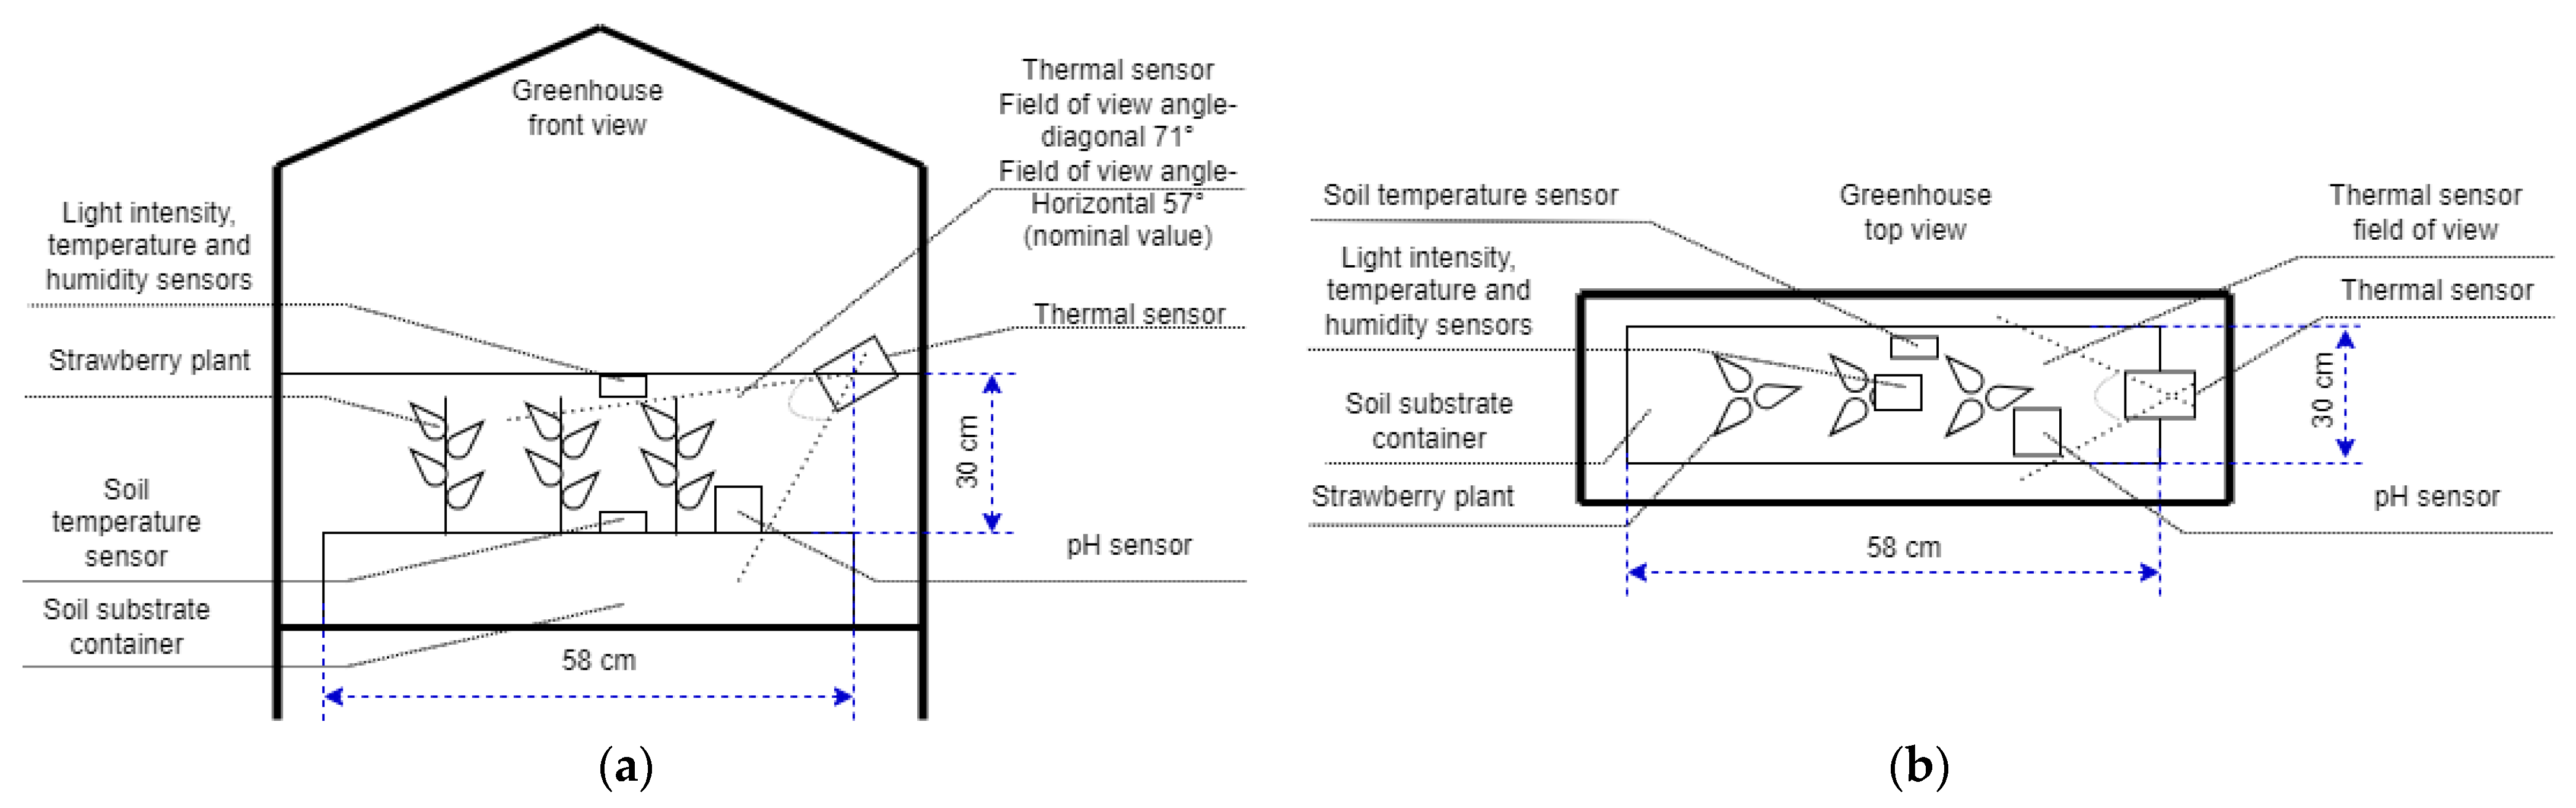
4.1. Data Gathering
- Thermal Camera (Flir Lepton 3.5): Captured images of strawberry plants at 15 min intervals (Figure 3). Each image was saved as an array of size 120 × 160 (which matches the camera resolution) in a CSV file format. Each pixel measurement has a precision of 0.05 °C and can measure temperatures between −40 °C and +400 °C. This approach provided a comprehensive dataset capturing the temperature variations of the plants.
- Light Sensor (BH1750): Measured the intensity of light in the plant environment (with accuracy of ±20% and measurement range of 0.11–65,535 lux). The collected light intensity data were crucial for understanding the photosynthetic activity and growth patterns of the strawberry plants.
- Temperature and Humidity Sensor (DHT11): Provided ambient temperature (with accuracy of ±2 °C and measurement range of 0–50 °C) and relative humidity data (with accuracy of ±5% RH and measurement range of 0–100% RH). This information was essential for understanding the microclimate conditions surrounding the strawberry plants.
- Capacitive Soil Water Content Sensor: Collected analog value data (with accuracy of ±2% measurement range of 0–100% RH) on the soil moisture levels, a critical factor affecting plant growth and nutrient uptake.
4.2. Data Preprocessing
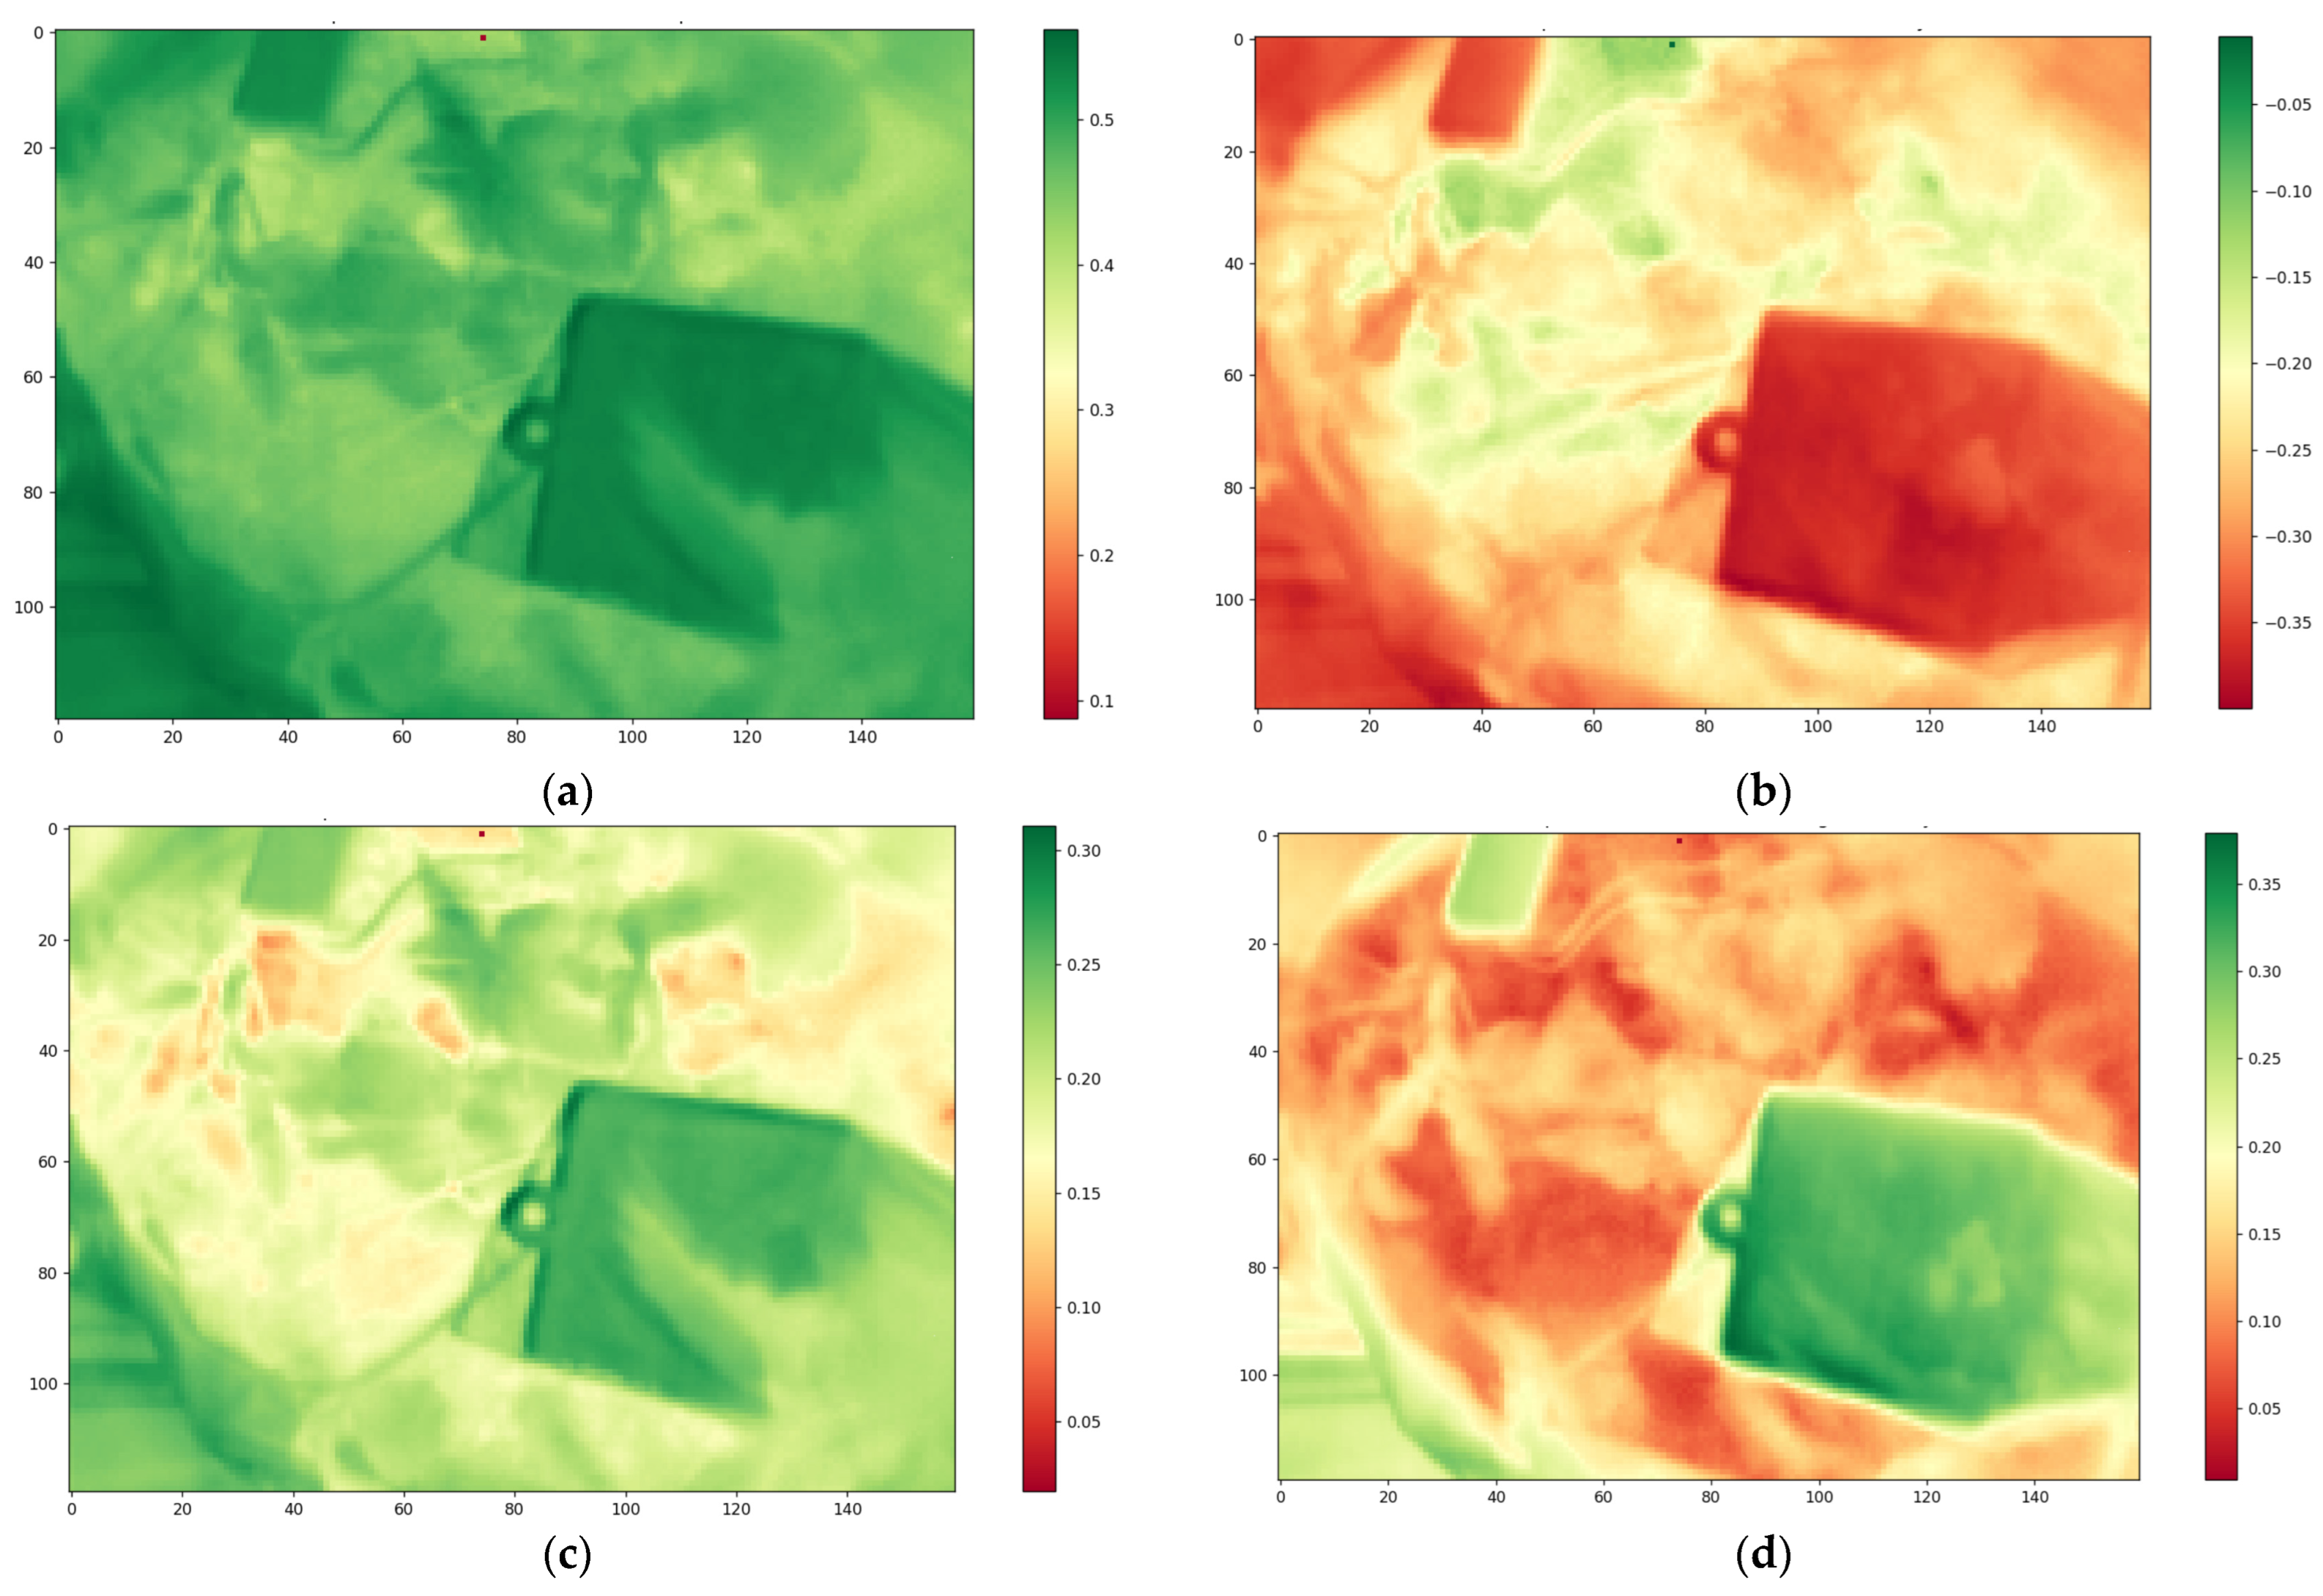
4.3. Data Pre-Analysis
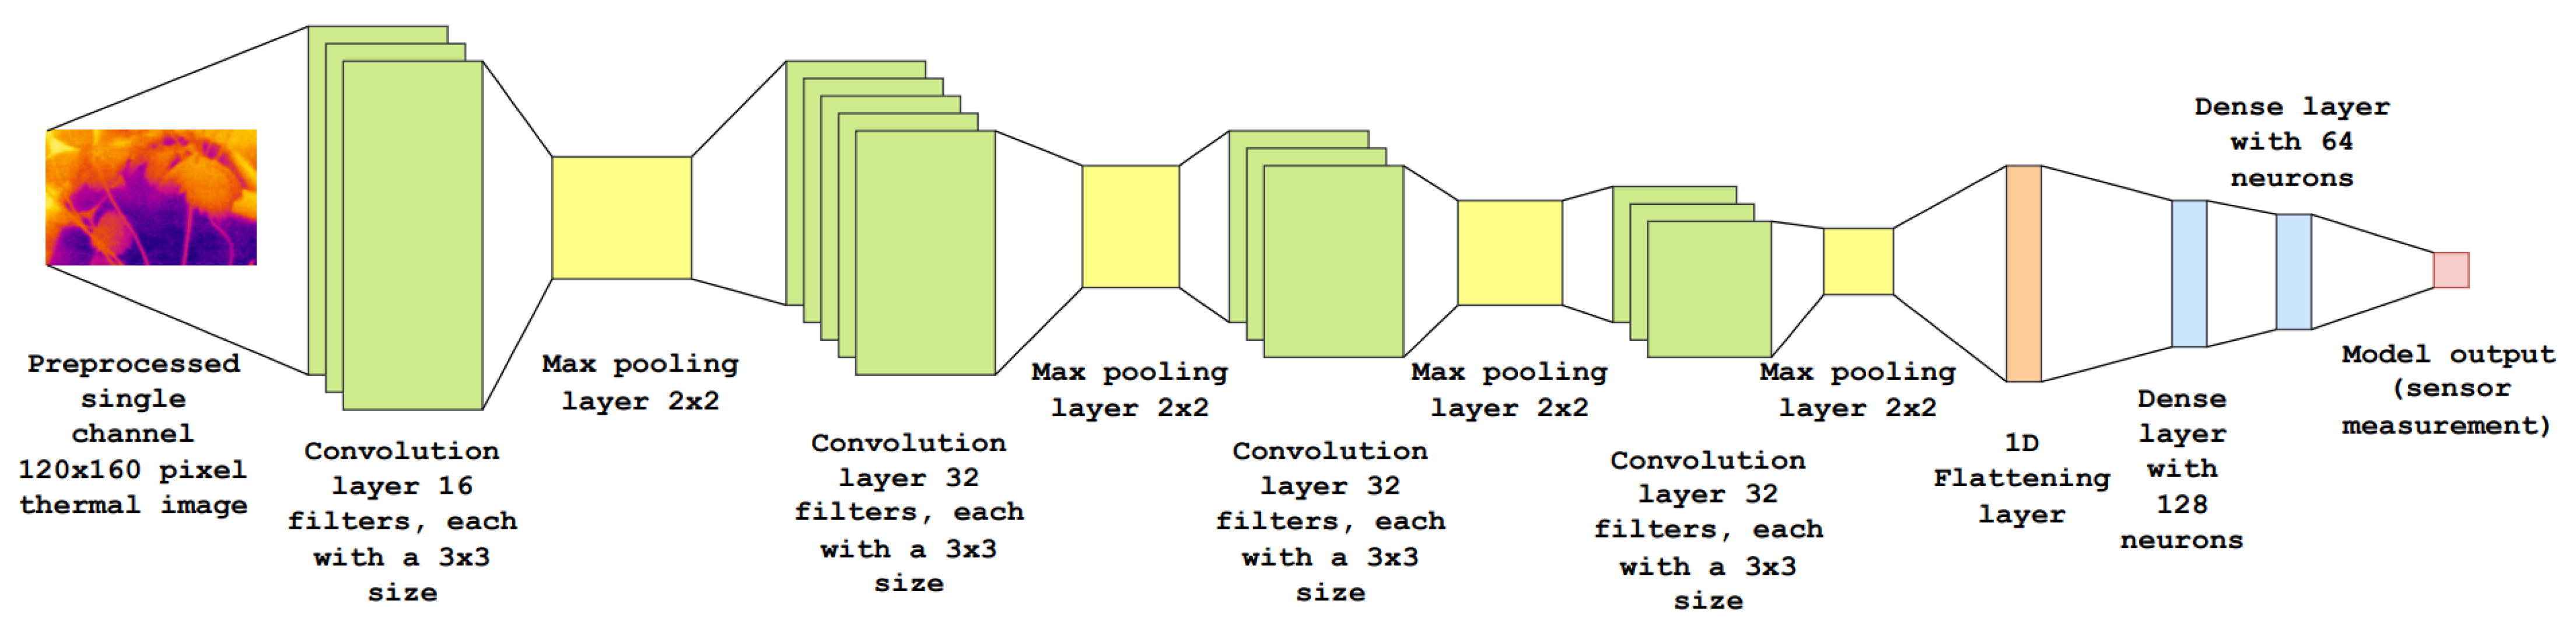
4.4. Model Development
4.5. Model Initial Tests and Adjustments
5. Results Evaluation and Discussion
6. Conclusions
Author Contributions
Funding
Data Availability Statement
Conflicts of Interest
Abbreviations
References
- Juárez, K.R.C.; Agudelo, L.B. Towards the development of homemade urban agriculture products using the internet of things: A scalable and low-cost solution. In Proceedings of the 2021 2nd Sustainable Cities Latin America Conference (SCLA), Medellin, Colombia, 25–27 August 2021; pp. 1–6. [Google Scholar] [CrossRef]
- Tharani Pavithra, P.; Baranidharan, B. An analysis on application of deep learning techniques for precision agriculture. In Proceedings of the 2021 Third International Conference on Inventive Research in Computing Applications (ICIRCA), Coimbatore, India, 2–4 September 2021; pp. 1538–1545. [Google Scholar] [CrossRef]
- Teoh, K.; Ng, S. Smart planter: A controlled environment agriculture system prioritizing usability for urban home owner. In Proceedings of the 2021 3rd International Conference on Robotics and Computer Vision (ICRCV), Beijing, China, 6–8 August 2021; pp. 86–90. [Google Scholar] [CrossRef]
- Khaleefah, R.M.; Al-Isawi, N.A.M.; Hussein, M.K.; Alduais, N.A.M. Optimizing IoT data transmission in smart agriculture: A comparative study of reduction techniques. In Proceedings of the 2023 5th International Congress on Human-Computer Interaction, Optimization and Robotic Applications (HORA), Istanbul, Turkiye, 8–10 June 2023; pp. 1–5. [Google Scholar] [CrossRef]
- Mudholkar, M.; Mudholkar, P.; Dornadula, V.H.R.; Sreenivasulu, K.; Joshi, K.; Pant, B. A novel approach to IoT based plant health monitoring system in smart agriculture. In Proceedings of the 2022 5th International Conference on Contemporary Computing and Informatics (IC3I), Uttar Pradesh, India, 14–16 December 2022; pp. 113–116. [Google Scholar] [CrossRef]
- Habib, T.; Raza, D.M.; Islam, M.; Victor, D.B.; Arif, A.I. Applications of computer vision and machine learning in agriculture: A state-of-the-art glimpse. In Proceedings of the 2022 International Conference on Innovative Trends in Information Technology (ICITIIT), Kottayam, India, 12–13 February 2022; pp. 1–5. [Google Scholar] [CrossRef]
- Badidi, E. Edge AI for Early Detection of Chronic Diseases and the Spread of Infectious Diseases: Opportunities, Challenges, and Future Directions. Future Internet 2023, 15, 370. [Google Scholar] [CrossRef]
- Kempelis, A.; Romanovs, A.; Patlins, A. Using computer vision and machine learning based methods for plant monitoring in agriculture: A systematic literature review. In Proceedings of the 2022 63rd International Scientific Conference on Information Technology and Management Science of Riga Technical University (ITMS), Riga, Latvia, 6–7 October 2022; pp. 1–6. [Google Scholar] [CrossRef]
- Liu, J.; Jiang, W.; Han, H.; He, M.; Gu, W. Satellite internet of things for smart agriculture applications: A case study of computer vision. In Proceedings of the 2023 20th Annual IEEE International Conference on Sensing, Communication, and Networking (SECON), Madrid, Spain, 11–14 September 2023; pp. 66–71. [Google Scholar] [CrossRef]
- Adeogun, R.; Rodriguez, I.; Razzaghpour, M.; Berardinelli, G.; Christensen, P.H.; Mogensen, P.E. Indoor occupancy detection and estimation using machine learning and measurements from an IoT LoRa-based monitoring system. In Proceedings of the 2019 Global IoT Summit (GIoTS), Aarhus, Denmark, 17–21 June 2019; pp. 1–5. [Google Scholar] [CrossRef]
- Han, K.A.M.; Watchareeruetai, U. Black gram plant nutrient deficiency classification in combined images using convolutional neural network. In Proceedings of the 2020 8th International Electrical Engineering Congress (iEECON), Chiang Mai, Thailand, 4–6 March 2020; pp. 1–4. [Google Scholar] [CrossRef]
- Zhao, W.; Dong, X.; Wu, Z.; Wei, C.; Li, L.; Yu, D.; Fan, X.; Ma, Y. Using infrared thermal imaging technology to estimate the transpiration rate of citrus trees and evaluate plant water status. J. Hydrol. 2022, 615 Pt A, 128671. [Google Scholar] [CrossRef]
- Catalbas, M.C.; Kobav, M.B. Measurement of correlated color temperature from RGB images by deep regression model. Measurement 2022, 195, 111053. [Google Scholar] [CrossRef]
- Almutawa, N.; Eid, W. Soil moisture content estimation using active infrared thermography technique: An exploratory laboratory study. Kuwait J. Sci. 2023, 50, 399–404. [Google Scholar] [CrossRef]
- Vieira, G.H.S.; Ferrarezi, R.S. Use of Thermal Imaging to Assess Water Status in Citrus Plants in Greenhouses. Horticulturae 2021, 7, 249. [Google Scholar] [CrossRef]
- Maskey, M.; Ramachandran, R.; Ramasubramanian, M.; Gurung, I.; Freitag, B.; Kaulfus, A.; Bollinger, D.; Cecil, D.J.; Miller, J. Deepti: Deep-Learning-Based Tropical Cyclone Intensity Estimation System. IEEE J. Sel. Top. Appl. Earth Obs. Remote Sens. 2020, 13, 4271–4281. [Google Scholar] [CrossRef]
- Ham, Y.-G.; Kim, J.-H.; Luo, J.-J. Deep learning for multi-year ENSO forecasts. Nature 2019, 573, 568–572. [Google Scholar] [CrossRef] [PubMed]
- Chandrapu, R.R.; Pal, C.; Nimbekar, A.T.; Acharyya, A. SqueezeVGGNet: A methodology for designing low complexity VGG architecture for resource constraint edge applications. In Proceedings of the 2022 20th IEEE Interregional NEWCAS Conference (NEWCAS), Quebec City, QC, Canada, 9–22 June 2022; pp. 109–113. [Google Scholar] [CrossRef]
- Nirthika, R.; Manivannan, S.; Ramanan, A. An experimental study on convolutional neural network-based pooling techniques for the classification of HEp-2 cell images. In Proceedings of the 2021 10th International Conference on Information and Automation for Sustainability (ICIAfS), Negambo, Sri Lanka, 11–13 August 2021; pp. 281–286. [Google Scholar] [CrossRef]
- Hsieh, C.-T. Development of a Low Cost and Raspberry-based Thermal Imaging System for Monitoring Human Body Temperature. In Proceedings of the 2021 16th International Microsystems, Packaging, Assembly and Circuits Technology Conference (IMPACT), Taipei, Taiwan, 21–23 December 2021; pp. 248–251. [Google Scholar] [CrossRef]
- Dewi, A.L.; Suseno, J.E.; Soesanto, Q.M.B. Measurement Device of Nondestructive Testing (NDT) of Metanil Yellow Dye Waste Concentration Using Artificial Neural Network Based on Microcontroller. IEEE Sens. Lett. 2022, 6, 7500804. [Google Scholar] [CrossRef]
- Priya, V.; Balambica, V. IoT based agriculture robot using neural networks. In Proceedings of the 2023 3rd International Conference on Advance Computing and Innovative Technologies in Engineering (ICACITE), Greater Noida, India, 12–13 May 2023; pp. 251–255. [Google Scholar] [CrossRef]
- Radi; Murtiningrum; Ngadisih; Muzdrikah, F.S.; Nuha, M.S.; Rizqi, F.A. Calibration of capacitive soil moisture sensor (SKU:SEN0193). In Proceedings of the 2018 4th International Conference on Science and Technology (ICST), Yogyakarta, Indonesia, 7–8 August 2018; pp. 1–6. [Google Scholar] [CrossRef]
- Nuraisha, S.; Shidik, G.F. Evaluation of normalization in fake fingerprint detection with heterogeneous sensor. In Proceedings of the 2018 International Seminar on Application for Technology of Information and Communication, Semarang, Indonesia, 21–22 September 2018; pp. 83–86. [Google Scholar] [CrossRef]
- Rauf, N.A.A.; Zaid, A.M.; Saon, S.; Mahamad, A.K.; Bin Ahmadon, M.A.; Yamaguchi, S. Malaysian food recognition and calories estimation using CNN with TensorFlow. In Proceedings of the 2023 IEEE 12th Global Conference on Consumer Electronics (GCCE), Nara, Japan, 10–13 October 2023; pp. 493–497. [Google Scholar] [CrossRef]
- Alkaff, A.K.; Prasetiyo, B. Hyperparameter Optimization on CNN Using Hyperband on Tomato Leaf Disease Classification. In Proceedings of the 2022 IEEE International Conference on Cybernetics and Computational Intelligence (CyberneticsCom), Malang, Indonesia, 16–18 June 2022; pp. 479–483. [Google Scholar] [CrossRef]
- Wang, Y.; Wang, Y.; Li, H.; Cai, Z.; Tang, X.; Yang, Y. CNN hyperparameter optimization based on CNN visualization and perception hash algorithm. In Proceedings of the 2020 19th International Symposium on Distributed Computing and Applications for Business Engineering and Science (DCABES), Xuzhou, China, 16–19 October 2020; pp. 78–82. [Google Scholar] [CrossRef]
- Nurhopipah, A.; Larasati, N.A. CNN Hyperparameter Optimization using Random Grid Coarse-to-fine Search for Face Classification. Kinet. Game Technol. Inf. Syst. Comput. Netw. Comput. Electron. Control. 2021, 6, 19–26. [Google Scholar] [CrossRef]
- El Hachimi, C.; Belaqziz, S.; Khabba, S.; Chehbouni, A. Towards precision agriculture in Morocco: A machine learning approach for recommending crops and forecasting weather. In Proceedings of the 2021 International Conference on Digital Age & Technological Advances for Sustainable Development (ICDATA), Marrakech, Morocco, 29–30 June 2021; pp. 88–95. [Google Scholar] [CrossRef]
- Kempelis, A.; Narigina, M.; Osadcijs, E.; Patlins, A.; Romanovs, A. machine learning-based sensor data forecasting for precision evaluation of environmental sensing. In Proceedings of the 2023 IEEE 10th Jubilee Workshop on Advances in Information, Electronic and Electrical Engineering (AIEEE), Vilnius, Lithuania, 27–29 April 2023; pp. 1–6. [Google Scholar] [CrossRef]
- Xing, D.; Wang, Y.; Sun, P.; Huang, H.; Lin, E. A CNN-LSTM-att hybrid model for classification and evaluation of growth status under drought and heat stress in chinese fir (Cunninghamia lanceolata). Plant Methods 2023, 19, 66. [Google Scholar] [CrossRef] [PubMed]
- Kazanasmaz, T.; Günaydin, M.; Binol, S. Artificial neural networks to predict daylight illuminance in office buildings. Build. Environ. 2009, 44, 1751–1757. [Google Scholar] [CrossRef]
- Martell, M.; Castilla, M.; Rodríguez, F.; Berenguel, M. An indoor illuminance prediction model based on neural networks for visual comfort and energy efficiency optimization purposes. In International Work-Conference on the Interplay Between Natural and Artificial Computation; Springer International Publishing: Cham, Switzerland, 2019; pp. 146–156. [Google Scholar] [CrossRef]


| Model #1 Scale: Min Value: 0 Max Value: 65,535 | Model #2 Scale: Min Value: 0% Max Value: 100% | Model #3 Scale: Min Value: 0 Max Value: 4095 | |
|---|---|---|---|
| Input | Thermal image matrix 120 × 160 (°C) | Thermal image matrix 120 × 160 (°C) | Thermal image matrix 120 × 160 (°C) |
| Output | Light Intensity (Lux) (0–65,535) | Relative Air Humidity (%) | Soil Water Content (0–4095, where 0 represents the highest and 4095 lowest water content) |
| Training Parameters | Learning rate: 0.001 Batch size: 15 Epochs: 35 | Learning rate: 0.001 Batch size: 10 Epochs: 40 | Learning rate: 0.001 Batch size: 15 Epochs: 30 |
| Model #1 Scale: Min Value: 0 Max Value: 65,535 | Model #2 Scale: Min Value: 0% Max Value: 100% | Model #3 Scale: Min Value: 0 Max Value: 4095 | |
|---|---|---|---|
| MAE | 332.38 | 4.35 | 40.37 |
| MAPE | 100% | 11.22% | 10.35% |
| RMSE | 781.05 | 7.09 | 68.71 |
| R2 | 0.719 | 0.497 | 0.633 |
Disclaimer/Publisher’s Note: The statements, opinions and data contained in all publications are solely those of the individual author(s) and contributor(s) and not of MDPI and/or the editor(s). MDPI and/or the editor(s) disclaim responsibility for any injury to people or property resulting from any ideas, methods, instructions or products referred to in the content. |
© 2024 by the authors. Licensee MDPI, Basel, Switzerland. This article is an open access article distributed under the terms and conditions of the Creative Commons Attribution (CC BY) license (https://creativecommons.org/licenses/by/4.0/).
Share and Cite
Kempelis, A.; Polaka, I.; Romanovs, A.; Patlins, A. Computer Vision and Machine Learning-Based Predictive Analysis for Urban Agricultural Systems. Future Internet 2024, 16, 44. https://doi.org/10.3390/fi16020044
Kempelis A, Polaka I, Romanovs A, Patlins A. Computer Vision and Machine Learning-Based Predictive Analysis for Urban Agricultural Systems. Future Internet. 2024; 16(2):44. https://doi.org/10.3390/fi16020044
Chicago/Turabian StyleKempelis, Arturs, Inese Polaka, Andrejs Romanovs, and Antons Patlins. 2024. "Computer Vision and Machine Learning-Based Predictive Analysis for Urban Agricultural Systems" Future Internet 16, no. 2: 44. https://doi.org/10.3390/fi16020044
APA StyleKempelis, A., Polaka, I., Romanovs, A., & Patlins, A. (2024). Computer Vision and Machine Learning-Based Predictive Analysis for Urban Agricultural Systems. Future Internet, 16(2), 44. https://doi.org/10.3390/fi16020044