1. Introduction
Cloud computing has transformed how people and businesses access and utilize computing resources. Over time, the cloud market has become more competitive, and technological innovation is keeping the growth stable [
1]. Numerous cloud providers are offering an even larger number of services. Service pricing strategy has an impact on practically every aspect of cloud providers, including cash flow, profit margins, operational expenditures, and market share [
2]. Cloud providers are offering “as-a-service” products with different pricing strategies. These include access to cloud-hosted application software, which constitutes software as a service (SaaS); platform as a service (PaaS), where access is provided to cloud platforms for developing and maintaining applications; and IaaS, where access is provided to virtual servers, storage, and networking appliances. According to Gartner [
3], infrastructure-as-a-service (IaaS) was expected to have the largest end-user expenditure increase of 29.8% in 2023. Amazon Elastic Compute Cloud (EC2) [
4] is one of the leading providers of IaaS [
5], providing underlying virtual resources, including CPU, network, memory, and storage. Amazon EC2 offers various instance types: reserved instances, on-demand instances, and spot instances. Reserved Instances (RI) are typically acquired for long-term production deployments at a reduced rate. On-demand instances are generally more expensive than RI, but customers may acquire them for shorter-term applications [
6]. A cloud provider must set aside redundant resources to cope with peak user demand, yet most of the time, these resources remain inactive. To enhance resource reuse, Amazon also offers the potential to sell unwanted reserved instances to other users using a biting mechanism, utilized by Amazon. Such resources are called spot instances and are suitable for tasks that can be interrupted (background jobs, etc.).
Pricing strategy for reserved and on-demand instances changes dynamically based on current market trends, and its evolution becomes a significant consideration for service deployment for the end-user designing a cloud solution. End-users need to carefully plan their cloud service deployments [
1] and forecasting price evolution can play a crucial role in long-term strategic planning but is a challenging task due to the various factors and actors involved. Price forecasting usually uses historical data to predict future trends [
7]. For cloud services, the value of data-driven prediction is twofold. First, it captures price trends, patterns, and seasonality. It is possible to identify recurring patterns and correlations that can shape future price predictions [
8]. Second, the data can be fed to machine-learning models capable of encompassing complicated patterns and making accurate predictions [
9]. Current work focuses on how to use machine-learning techniques to predict spot instances prices to enhance the biting process [
10,
11,
12,
13]. In this case, prediction is based on data collected a few hours earlier. Different ML algorithms have been tested with encouraging results.
Based on the aforementioned results, we were encouraged to explore the application of ML methods to predict the evolution of standard product prices offered by the provider, as, for example, a reserved instance, on a longer-term basis. Such products are offered on a fixed price by the provider, with no biting allowed. Since consultants [
5] usually study the market on a yearly basis, we decided to explore prediction properties on a yearly basis as well. We explore AWS EC2 price historical data [
4], available from 2016 to 2022, to predict market dynamics and trends. The cloud service price-prediction model is based on the CatBoost algorithm. Training is carried out using data from different periods. Standard metrics are used to evaluate the model’s accuracy, while results for different products with different price evolution dynamics are explored.
Our work contributes to cloud price forecasting, which can assist decision makers in optimizing cloud service deployment and managing cost. Ultimately, this research seeks to empower businesses and organizations with the tools and insights needed to navigate the rapidly evolving cloud service market and make informed decisions regarding their cloud infrastructure. Furthermore, we analyze how historical data may impact the accuracy of the ML price-prediction model and whether disruptive changes in the pricing policies may be captivated by such a model. As a first step, we used a specific ML algorithm to better understand the dynamics and limitations of historical data in price prediction, as in many cases price increase or decrease is a business decision, related to the introduction of a new product or service region, not directly related to the product characteristics. As results are encouraging, the exploration of alternative ML algorithms should also be considered. The rest of the paper is organized as follows:
Section 2 presents the related literature, whereas
Section 3 analyzes the cloud market based on historical data.
Section 4 introduces the proposed ML approach, and
Section 5 presents the results of the model. Finally,
Section 6 concludes the paper.
2. Related Work
Demand and price evolution prediction is a ubiquitous research topic prevalent in many domains such as retail [
14], supply chain [
15], market and stock prices [
16], cryptocurrency [
17], and the energy market [
18]. Prediction techniques fall in the categories of statistical modeling and machine learning, discussed further below.
2.1. Statistical-Driven Approach
Statistical methods have been adopted for predicting the future amount of computing resources or future prices.
In [
19] short- and long-term CPU usage is predicted based on seasonal ARIMA (SARIMA) and long short-term memory (LSTM) models based on Azure data. The hedonic price index was adopted in [
20] in pricing policy based on the Amazon dataset, highlighting the importance of non-functional features, which resulted in estimated prices being lower. In [
21], various algorithms are applied to Amazon’s spot instance prices, with SARIMA delivering the highest prediction accuracy. In [
22] the authors tested linear autoregressive (AR), the ARIMA model, exponential smoothing (ETS), and generalized autoregressive conditional heteroskedasticity (GARCH) for predicting the upcoming graphics-processing unit (GPU) spot instance price. Based on the results, the GARCH model delivered better results for dynamic short-term and middle-term GPU instance pricing prediction, whereas for variance-based middle-term and long-term GPU instance pricing prediction, the AR model provided the best results. In addition, the ETS model produced superior results for long-term GPU spot pricing prediction based on smoothness, and the ARIMA model offered the best results for long-term GPU spot price prediction based on variations. In [
23], a hybrid of ARIMA and fuzzy regression, known as fuzzy autoregressive predicted traffic in cloud computing, was used. In addition, the proposed model determined models with higher accuracy. Based on the results, the root mean square error and coefficient of determination indicated that the proposed model was a suitable model for the prediction.
2.2. ML-Driven Approach
Several works focus on ML-driven cloud service characteristics prediction. Many of them focus on cloud service prices. In [
24], the extreme gradient boosting (XGBoost) model was applied to forecast energy-related costs in data centers based on Canadian operator data. Several papers have also addressed resource prediction using ML [
25]. In [
26], computing resource demand was predicted through various ML algorithms, and tests were performed reflecting the system’s yearly performance using AWS data. An innovative sliding window method was adopted to preprocess the data. Spot instance price prediction was carried out using k-nearest neighbors (KNN) in [
11]. In [
12,
13], the authors adopted several machine-learning approaches to forecast the future pricing of EC2 spot instances, such as linear, ridge, and lasso regressions, multilayer perceptrons, k-nearest neighbors, extra trees, and random forests. Based on the results, machine learning is an encouraging approach for predicting spot prices. In [
10], the authors presented a regression random forests model to predict spot prices on an hourly, daily and weekly basis. Low-end instances had better prediction accuracy than high-end instances, indicating that this is a rapidly changing market.
Table 1 summarizes existing work on price prediction for cloud services. ML algorithms have been recently utilized for spot instance price prediction, with encouraging results.
2.3. Aim and Contribution of This Work
Based on the aforementioned results, we were encouraged to explore the application of ML methods to predict the evolution of standard product prices offered by the provider, as, for example, a reserved instance, on a longer-term basis. Such products are offered on a fixed price by the provider, with no biting allowed. In this case, prediction on an hourly or daily basis as in spot instance is not useful. Prediction should scale on a monthly or yearly basis to provide meaningful information to end-users.
For this effort, we decided to utilize the CatBoost algorithm. CatBoost is a popular algorithm applied in several fields such as electricity [
27], financial markets [
28], and healthcare [
29]. Regarding the cloud industry, CatBoost was already used to explore cloud security on a dataset based on reserved instance features [
30].
The CatBoost algorithm works with a broad variety of data types and addresses a wide range of data challenges. In addition, CatBoost can support numerical and categorical variables and has an effective method for dealing with categorical data. Finally, CatBoost is a robust machine-learning algorithm that serves efficiently for forecasting cases. As a result, it is seen to be a suitable fit for our suggested ML technique [
31].
One should have in mind that the accuracy of the explored ML algorithms utilized for spot instance price prediction varies significantly, based on the evidence of existing work. Thus, the selection of one of the explored or proposed algorithms was not a straightforward solution in our case. Furthermore, the prediction period and the sample variance in our case was much different than that in the cases of the spot instance price prediction studied in the literature.
In addition, we focus on how the selection of time periods and corresponding datasets can improve the accuracy of the ML price prediction. Based on existing work [
10], longer time periods do not necessarily improve accuracy. We wanted to explore this assumption in our case.
Furthermore, we wanted to explore whether significant changes in the pricing policies may be captivated by such a model. As a first step, we used a specific ML algorithm, to better understand the dynamics and limitations of historical data in price prediction, as in many cases price increase or decrease is a business decision, related to the introduction of a new product or service region, not directly related to the product characteristics. As the results are encouraging, the exploration of alternative ML algorithms should also be considered.
Concluding the current section, it is evident that cloud price prediction has been discussed in several papers. However, to the best of our knowledge, it is the first attempt to predict RI prices using machine learning in contrast to spot instances. The current paper can be considered the initial phase of this exploration since the proposed models based on CatBoost are trained on datasets from diverse time periods, in order to achieve an acceptable predicted accuracy. Finally, a comparison of actual and predicted prices is shown, underscoring the models’ dependability as well as potential challenges.
3. IaaS Pricing Historical Data and Analysis
3.1. Dataset Description
AWS data from 2016 onwards will be used to study the industry’s historical trends and to forecast future pricing. In 2022, Amazon was the major IaaS provider with more than half of the market share [
5]. The pricing dataset (
https://docs.aws.amazon.com/awsaccountbilling/latest/aboutv2/using-ppslong.html (accessed on 5 January 2023)), which spans over the last 7 years, is a useful resource for understanding broader market trends in IaaS and provide prediction models for market trends in the future.
The Amazon EC2 dataset consists of table rows, each describing an offer for a RI type, the corresponding date, and the offered characteristics, which include a wide selection of instance types optimized to fit different use cases. Instance types are different combinations of CPU, memory, storage, and networking capabilities and are categorized into instance families, described below:
General purpose instances provide an adequate combination of computing, memory, and networking capabilities, and may be utilized for a wide range of tasks. These instances are appropriate for applications such as web servers and code repositories that require these resources in equal portions.
Memory-optimized instances are intended to provide rapid performance for tasks that handle huge quantities of data in memory.
Compute-optimized instances are suited for compute-intensive applications that benefit from powerful CPUs. Media trans-coding, high-performance web servers, high-performance computing (HPC), scientific modeling, dedicated gaming servers, ad server engines, machine-learning inference, and other compute-intensive applications are well suited for instances in this category.
Storage-optimized instances are designed for applications that need high-throughput, sequential read/write access to large datasets on local storage. They are designed to provide applications with tens of thousands of low-latency, random I/O operations per second (IOPS).
GPU-optimized instances are VMs with enhanced graphics acceleration capabilities.
Field-programmable gate array (FPGA) instances, offering customizable hardware acceleration with FPGAs.
ML-application-specific integrated circuit (ASIC) instances delivering high-performance ML inference. End-users can use them to run large-scale machine-learning inference applications such as search, recommendation engines, computer vision, speech recognition, natural language processing, and fraud detection.
Table 2 summarizes the number of offers per family in the dataset in the 7-year time period. Memory-optimized instances are the most popular family followed by storage-optimized and general purpose. ML/ASIC appears to have the lowest number of offers as they were announced in late 2022 [
32]. Since FPGA and ML/ASIC instances had few offers, we decided not to include them in the price-prediction models.
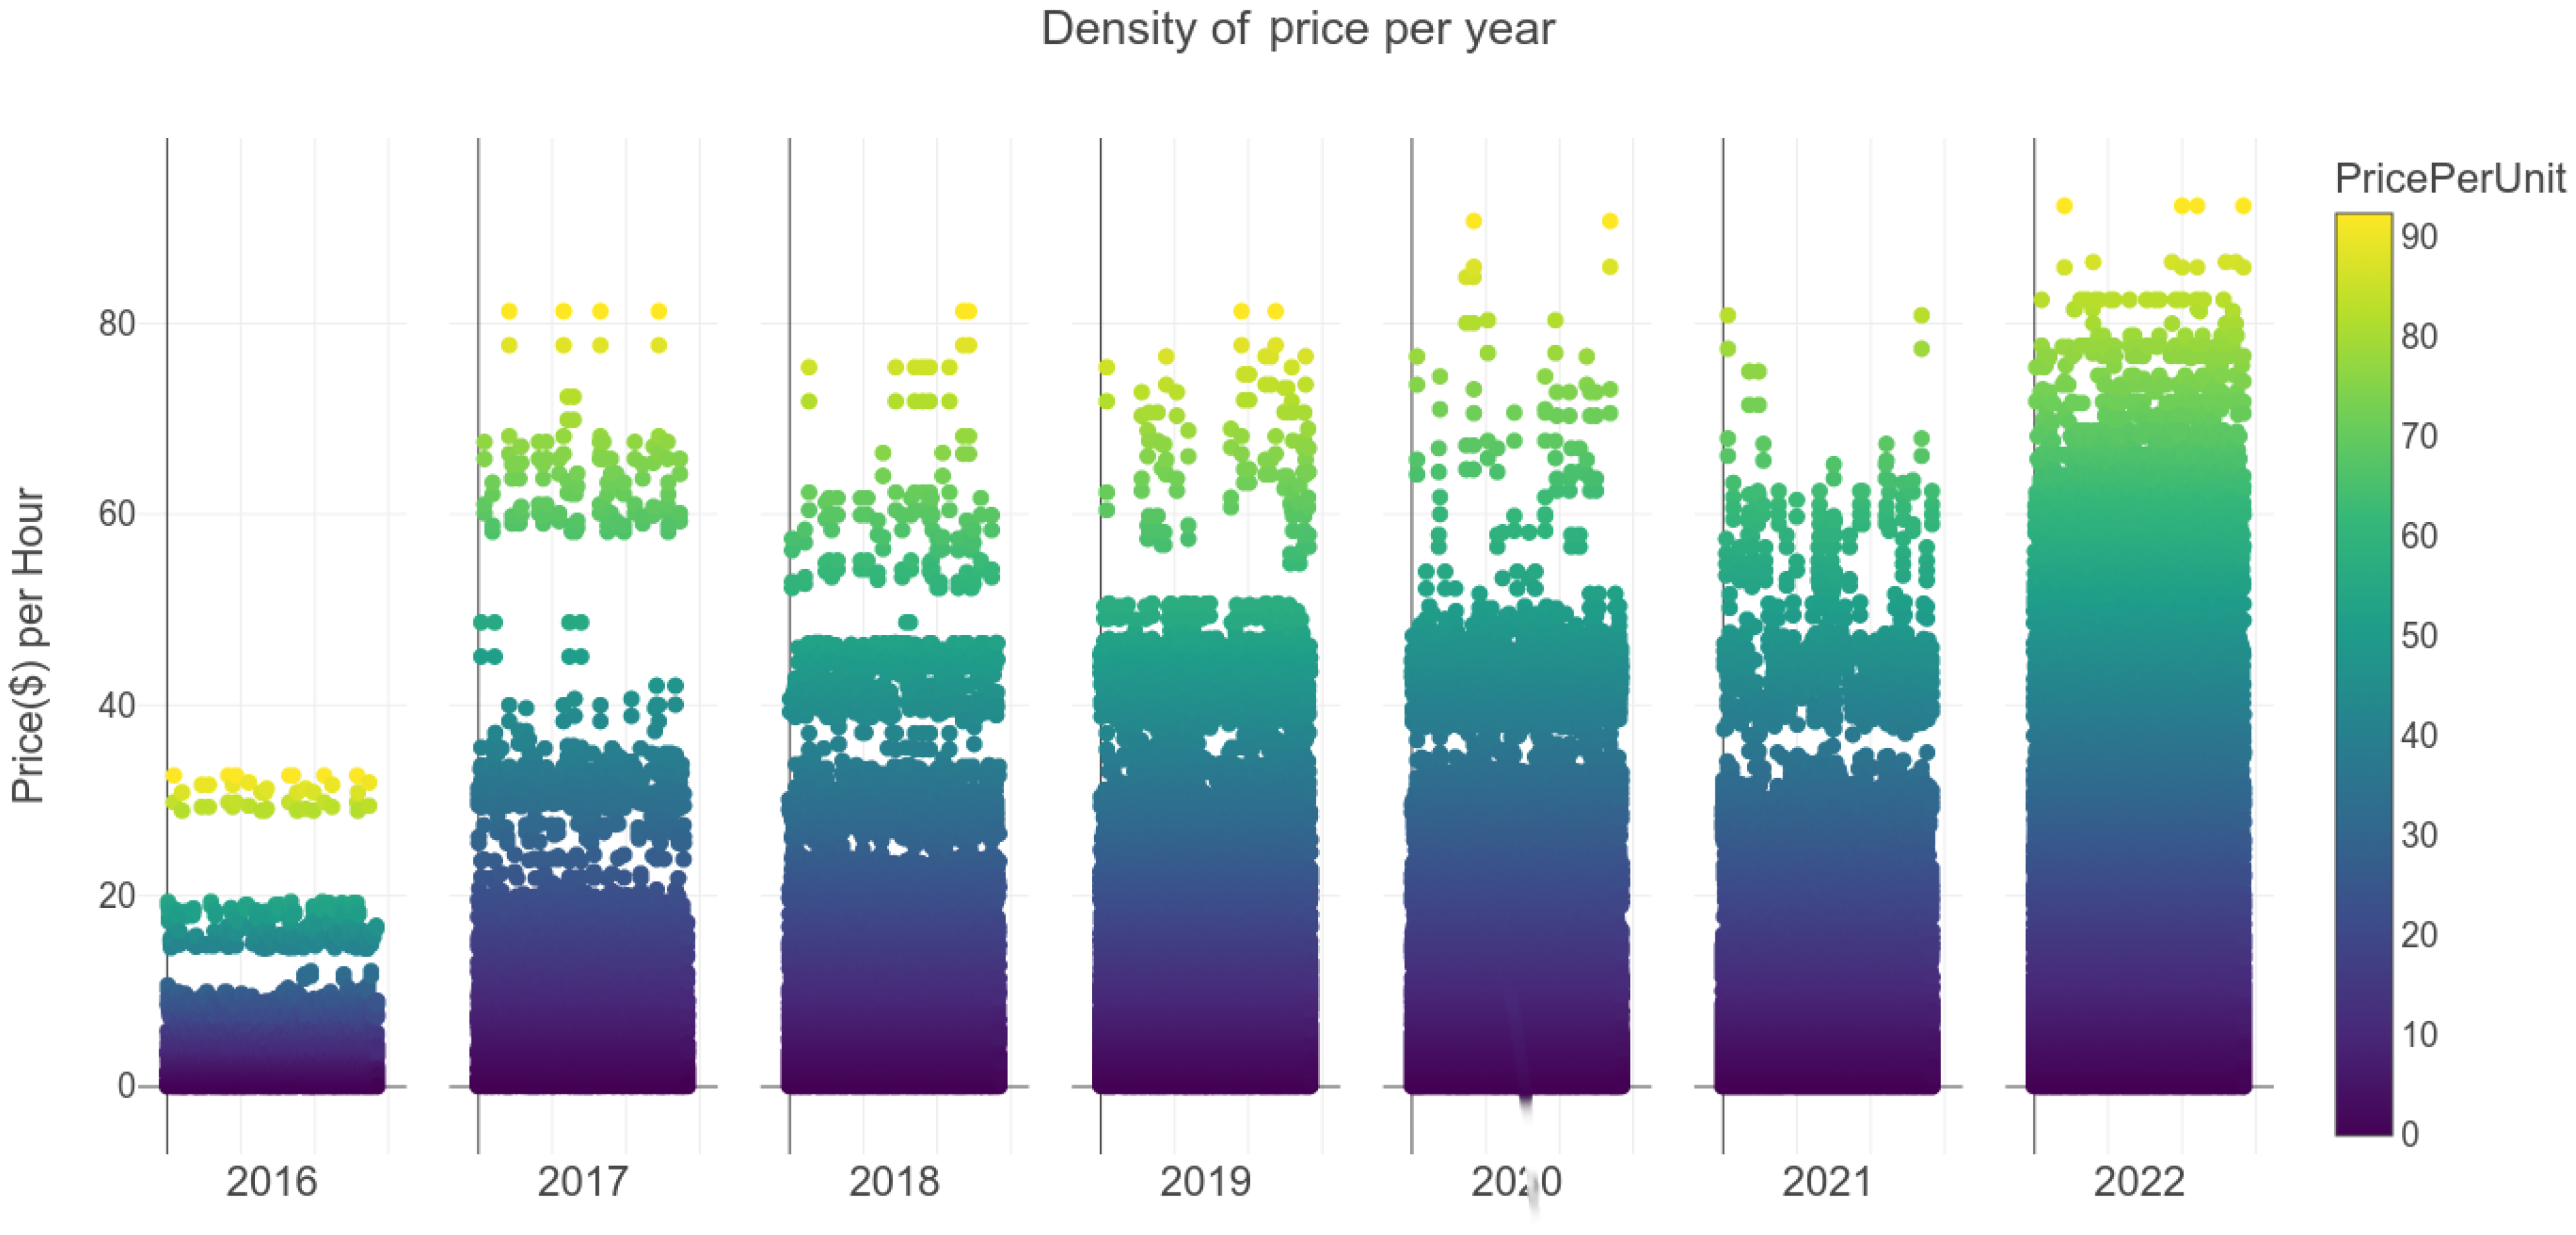
Figure 1 provides further insight in the price distribution for each year in the dataset. For each year, the corresponding subplot contains a plot of the instance price per hour in United States dollars (USD) with respect to the offer index.
Figure 1 reflects how the number of offered bundles has increased over time. In years prior to 2019, it was significantly lower than in 2022, and one can distinguish some price clustering before 2019. In later years, the range of instance offerings has increased in response to the evolving needs and demands of end-users. The Figure illustrates a trend for continuously expanding the selection of services while raising prices on high-end appliances made available to accommodate new end-user requirements.
The prevalence of the
memory-optimized instance family, as shown in
Table 2, highlights the significance of delivering cloud services with robust memory capabilities. This instance family satisfies the expanding demand for memory-intensive tasks, such as data processing and analytics, to be performed by computational resources that are particularly designed for such tasks. Likewise, the prevalence of the
storage-optimized instance family demonstrates the growing significance of storage capacity and efficiency in cloud services. With the rise of data-intensive applications and the ever-increasing volume of data produced, the demand for efficient storage solutions has increased significantly [
33]. On the other hand, the emergence of the
GPU instance family suggests a niche market within the larger landscape of cloud services. GPUs (graphics-processing units) are highly specialized hardware components that excel at graphics-intensive tasks and accelerated computation, such as machine learning and artificial intelligence programs. The relatively smaller number of GPU instances compared to other families suggests that these resources appeal to a subset of users with specialized needs and duties.
3.2. Price Evolution
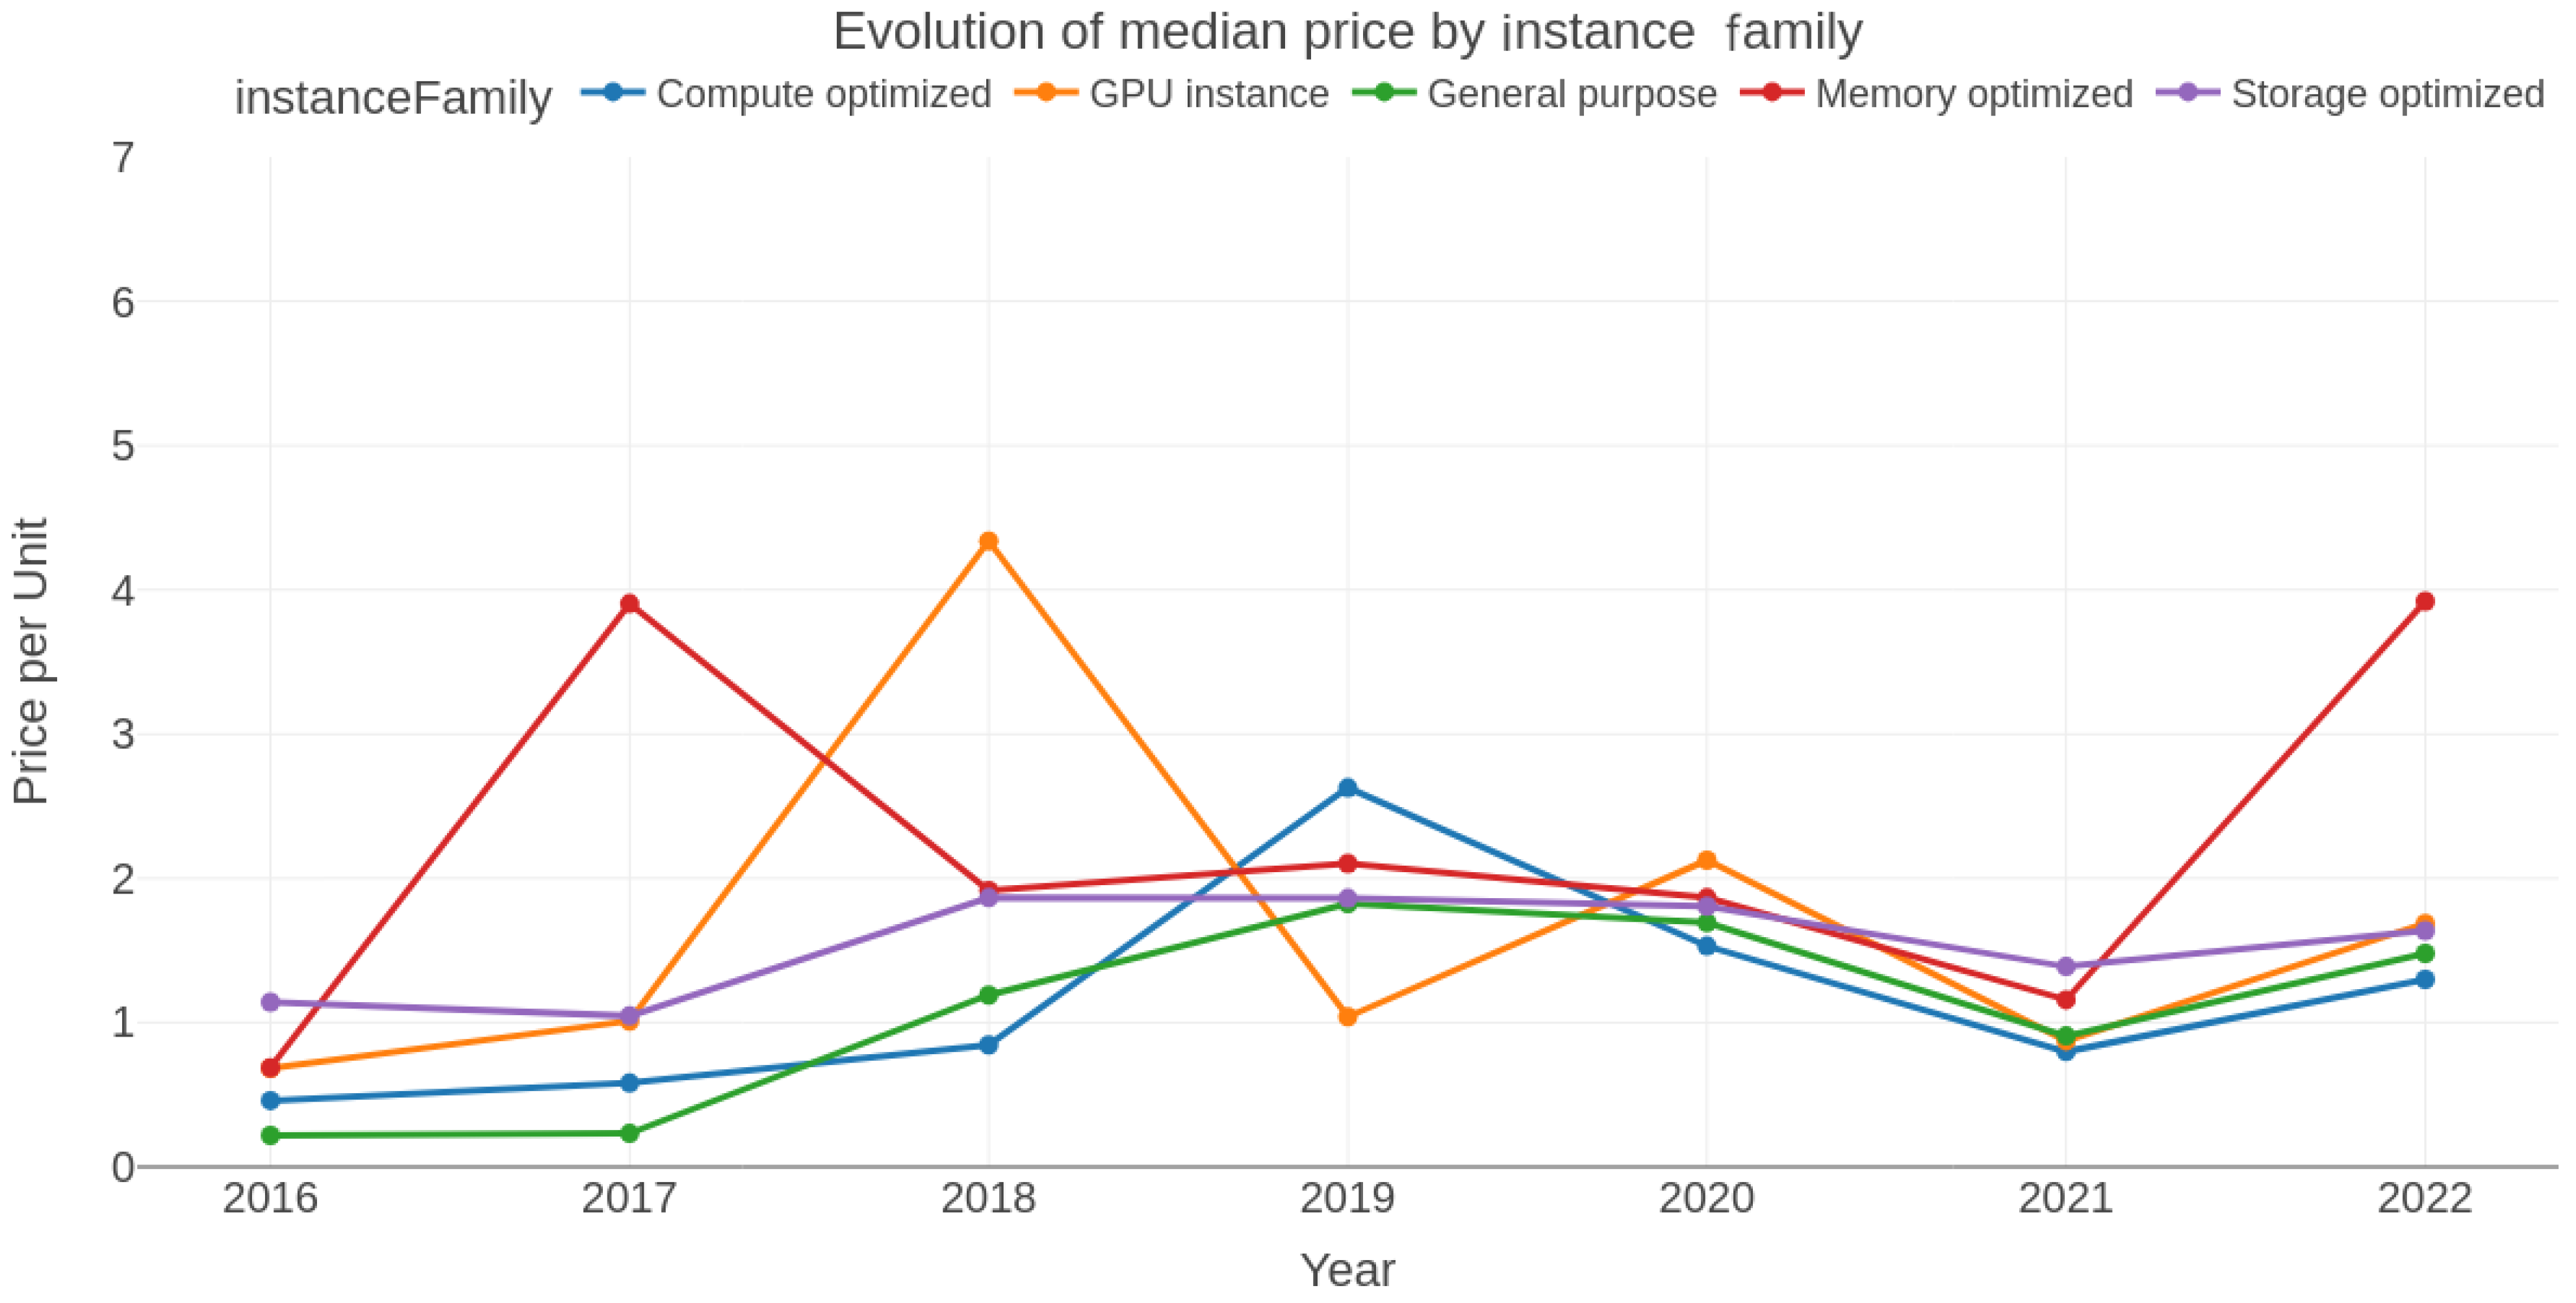
To gain further insight into the price evolution, we plot the yearly median offer price for each family in
Figure 2. We have chosen the median rather than the mean price because mean values are significantly affected by extreme values and outliers. Median values are more resistant to such effects and are considered a more accurate measure for evaluating tendencies in general statistical data that can be asymmetrical and non-normally distributed [
34]. The evolution of the median price value provides valuable insights into the dynamics of the cloud service market and its relationship to the larger global and social environment during that time period. With respect to
Figure 1, we note that, in 2016, the prices for all families ranged from
$0.21 to
$1.14 per hour, the lowest being the general-purpose category and the highest being the storage-optimized category. This reflects the fact that, back in 2016, the market was still emerging with a limited range of specialized products. Following that, in 2017 and 2018, the median prices of some instance families fluctuated, and for memory-optimized instances, they increased by five times, reaching
$3.9 per hour in 2017, indicating an increase in demand or a change in the market dynamics for memory-intensive applications. In 2018, GPU instances experienced a significant price increase to
$4.30 per hour, indicating an increasing demand for specialized computational duties requiring high-performance graphics processing capabilities.
In 2019, the median hourly costs of GPU instances experienced a significant decline, dropping from $4.33 to $1.04, which represents a more than fourfold reduction. On the other hand, compute-optimized instances saw a 70% price increase, indicating a higher demand for computational capacity and high-performance computing resources. This suggests that users were opting for more cost-effective GPU instances while seeking greater computing power. In 2020, the median prices of GPU instances aligned with those of other instance families, ranging from $1.5 to $2.1 per hour. This convergence implies a potential stabilization of market forces, increased adoption of GPU instances, or the emergence of more competitive pricing strategies within the industry.
Furthermore, there was a general decline in median prices across all instance families of 10% compared to the previous year, likely due to intensified competition, economies of scale, and improvements in infrastructure efficiency. However, in 2022, median prices experienced a significant increase of approximately 35% across all instance families. Memory-optimized instances stood out with a substantial 70% price increase, indicating a growing demand for memory-intensive applications and potentially reflecting increased costs associated with memory resources. These price trends demonstrate the influence of various factors on cloud service providers’ pricing strategies, including inflation, market dynamics, resource requirements, and technological advancements. The popularity of specialized instance families underscores the widespread adoption of cloud services across different industries. Additionally, a combination of technological advancements, market competition, customer preferences, and resource availability affect the observed price patterns.
It is crucial to consider the broader socioeconomic factors that may have influenced the cloud services market during this period. Economic fluctuations, geopolitical events, and advancements in related industries such as artificial intelligence, big data analytics, and machine learning can impact pricing strategies and market dynamics. Changes in user preferences, emerging industry trends, and regulatory adjustments may also contribute to the observed price patterns. These multifaceted interactions highlight the dynamic nature of the cloud services market and emphasize the importance of ongoing monitoring and analysis.
4. Machine-Learning Algorithm
The CatBoost algorithm was chosen due to its ability to effectively manage categorical variables [
31,
35], which is essential for describing the diverse characteristics of cloud service instances. The algorithm is resistant to over-fitting and can deal with absent values [
36,
37] in real-world datasets.
The input data are preprocessed from the rows of the Amazon EC2 dataset. The target parameter for the algorithm is the offered price per unit, which is the predicted variable. In this work, we also seek the optimal historical period for the pricing forecast, taking into account factors such as the existence of sufficient historical data to identify significant patterns and trends, and accommodate multiple price cycles due to changing market conditions.
The model’s performance will be evaluated using metrics such as the mean absolute error (MAE), root mean squared error (RMSE), and mean absolute percentage error (MAPE). If
are the predicted variables and
the actual variable inside a data subset with
n values (typically not included in the training), then these are given by [
24]:
Note that both the MAE and RMSE measure the absolute error. In the RMSE, differences are squared, and, hence, larger errors have a more significant impact. The MAPE, on the other hand, measures the relative error, which is often useful but is undermined in the case of small denominator values.
4.1. Data-Driven Approach
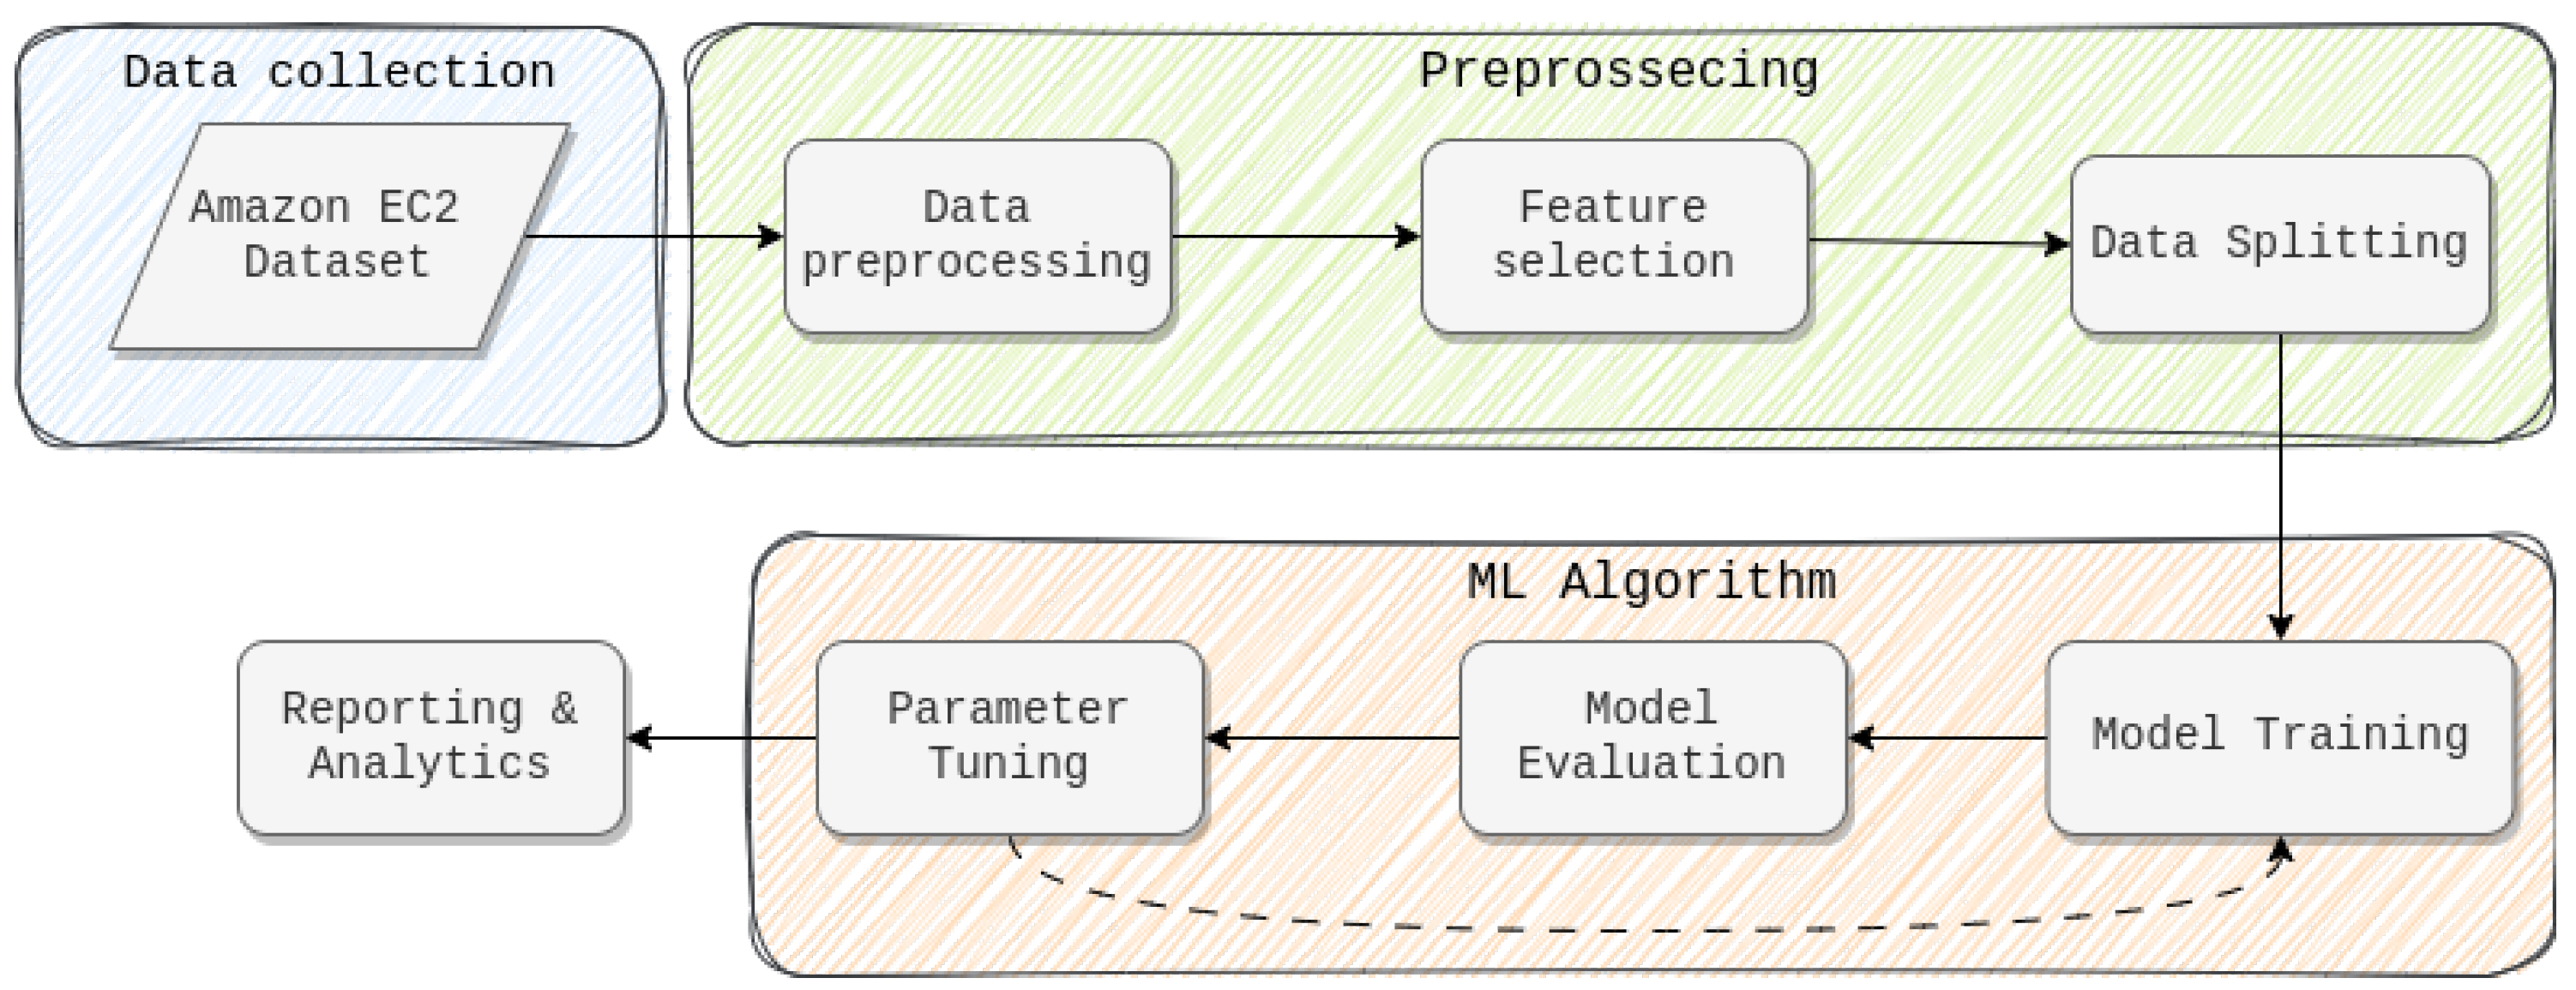
Figure 3 presents an overview of the data-driven approach adopted in this work. After the collection of the dataset, the next step involves preprocessing related to data cleansing and handling missing values. We then choose the features to be taken into account when training the algorithm. The set is then split into training and test subsets used to train and validate the algorithm, respectively. The training set is fed to the Catboost algorithm, which, using gradient boosting, builds an ensemble of prediction trees to reduce the prediction errors in terms of the metrics mentioned above. We then further fine-tune the algorithm and repeat the training to obtain better results. Finally, the obtained results are visualized and analyzed to ascertain the model’s accuracy. We further highlight some key aspects of the data-driven approach in the subsections that follow.
4.2. Data Collection
The AWS EC2 historical data repository serves as a source of pricing data for various instance categories. It contains about 1.5 million rows, each representing a specific instance, whose characteristics are described in the dataset columns. Null cells are present and need to be removed in the preprocessing stage. In addition, some instance families are relatively new and do not appear throughout the dataset. As discussed in
Section 3, we only considered families with sufficient historical data. The structure of the dataset considered is depicted in
Table 3 for the GPU instance. It includes various attributes related to cloud service instances, such as the price per hour, lease contract length, purchase option, virtual CPU (i.e., number of cores), memory [GB], storage size [GB], network performance [Mb/s], effective date, disk type, and operating system, as well as the year and relevant quarter. It contains multiple instances representing different configurations within each instance family, allowing for a comprehensive analysis of the pricing variations based on the features. This dataset serves as the foundation for the subsequent analysis and modeling conducted in the study.
4.3. Data Preprocessing
The input features consist of specific characteristics of IaaS services considered of importance for determining the price of a specific service. The selection is based on previous studies by the authors [
38,
39] when linear regression models are used. The features reflect the basic characteristics, functional and not functional, of reserved and on-demand instances and are presented in in
Table 4. They all have significant bearing on the price of the instances.
To reduce numerical errors due to variable scale, normalization techniques were applied to the numerical variables. Normalization scales the data to a specific range, such as between 0 and 1. These techniques eliminate any biases caused by varying scales or units of measurement, allowing for fair comparisons and accurate analysis. We also introduced a new variable to replace the effective date, reflecting the quarter in which the offer was made. This approach was adopted to reduce the fine-grained nature of the data in terms of the dates of the offers; we are rather interested in quarterly rather than daily predictions.
Table 5 summarizes the location of the offers contained in the dataset. The majority of offers are concentrated in the Asia–Pacific, United States, and Europe regions, and offers in these regions span the entire dataset from 2016 to 2022, unlike other regions. We have, therefore, decided to assume offers only from these three regions in the training and remove the location area as a feature.
The model’s accuracy may also be affected by outliers. To address this problem, we have chosen a common method for detecting outliers, which is the z-score, which measures the number of standard deviations a data point deviates from the dataset’s mean. The z-score method was chosen for outlier detection due to its statistical robustness and usability. The z-score indicates, in terms of standard deviation, the distance of a particular data point from the mean. This enables a standardized evaluation of data point abnormalities, which is essential for large datasets with diverse ranges of values [
40], such as the one utilized in this study. Extreme value sensitivity is one of the primary advantages of the z-score method. By setting a threshold of 0.75, this method allows us to eliminate data points that substantially deviate from the mean, thereby enhancing the consistency and reliability of our analysis. The removal of these anomalies strengthens our model by preventing extreme values from skewing the overall results. It is essential to observe, however, that the selection of the z-score method and the particular threshold was not arbitrary but rather based on the particular characteristics of our dataset. Before deciding on the z-score method, we examined our data in detail, taking into account its size, structure, and inherent variability. This procedure confirmed that the z-score method was the best option for our particular situation.
4.4. Parameter Tuning
Table 6 summarizes the algorithm parameters used in the training. These parameter selections were made to optimize the efficacy of the model in predicting the prices of cloud services. The high number of iterations enables the model to discover complicated data relationships, while the low learning rate ensures a delayed but more accurate convergence. The depth of 16 enables the model to capture more complex interactions between features, but it also increases the likelihood of overfitting. The bagged temperature of 0.2 regulates the regularization technique’s strength and prevents overfitting. The iterative outlier-detection strategy and the waiting period contribute to an early termination if the evaluation metric remains unchanged.
By utilizing the GPU for training, the model can process data faster and more effectively manage larger datasets. Experimentation and domain knowledge were used to select these parameter settings for optimal performance in predicting cloud service prices.
4.5. Implementation
The five predictive models developed in this research are publicly available and can be accessed on the project’s GitHub repository (
https://dagshub.com/gfragi/CatboostPredictionModels.git (accessed on 10 August 2023)), providing a valuable resource for researchers and practitioners in the field of cloud pricing prediction.
Computational Cost
It is vital to note that our proposed models are highly efficient in terms of computational cost. On average, each model required 15 min of training time on a configuration of hardware outfitted with an NVIDIA GeForce GTX 1660 Super. Despite the fact that this duration may vary based on the specifics of the dataset and model configurations, GPU-accelerated processing substantially accelerated our training process in comparison to CPU-based methods.
Once the model has been trained, generating predictions becomes an immediate procedure that is frequently completed within seconds. Our model is optimal for applications that require real-time or near-real-time predictions due to its rapid response. In addition, our model’s storage requirements are typically in the order of a few megabytes, allowing for simple deployment in a variety of environments, from high-capacity servers to resource-constrained peripheral devices.
5. Results
In this section, we analyze the results of our experiments. Our target was to use the dataset for prices for the year 2022 as the basis to explore generated predictions using the CatBoost algorithm. We predicted prices for the year 2022 using data for 1 to 6 years back in time, utilizing the data available from Amazon. In the following, we explore the efficiency of the CatBoost algorithm, the impact of historical data on prediction efficiency, and also compare predicted vs. real prices for all instances of the year 2022. The metrics discussed in Equations (1)–(3) are used.
5.1. Impact of Historical Data
Table 7,
Table 8,
Table 9,
Table 10 and
Table 11 exhibit the results of the metrics (MAE, MAPE, and RMSE) for each timeframe utilized for prediction. These tables provide an evaluation of the efficacy of the prediction models over various time periods. The Mean Absolute Percentage Error (MAPE) values indicate a small percentage of error in the model’s predictions, highlighting the precision of the forecasts. The Root Mean Squared Error (RMSE) values display a similar pattern, emphasizing the close proximity between the predicted and actual prices.
The analysis of the impact of historical data on the accuracy of the prediction models reveals interesting insights as shown. The results indicate that using historical data from a shortened time period improves prediction accuracy. This observation suggests that more recent data points have a greater impact on pricing patterns and trends in the market for cloud services. Incorporating an excessive amount of historical data may introduce noise and obsolete information that hinders the models’ ability to accurately capture the current dynamics.
Comparing the prediction accuracy of GPU instances to that of other instance families reveals that GPU instances have, on average, greater prediction accuracy. This suggests that GPU instances may have more distinct and predictable pricing patterns than other instance types. Over multiple time intervals, the precision of GPU instances is consistently higher, indicating a relatively stable and predictable pricing behavior.
Another interesting finding is that the decrease in the metrics (MAE, MAPE, and RMSE) when using the previous year as the timeframe for prediction, especially in the general purpose and memory-optimized instance families, shows that the model’s accuracy improves significantly with more recent data. Examining thoroughly the aforementioned results, it is obvious that there is a strong correlation between the length of the historical data and the accuracy of the prediction models. Data play a crucial role in capturing the pricing trends and dynamics of cloud service instances. By focusing on more recent information, the models can better adapt to evolving market conditions and make more accurate predictions.
Pricing for cloud services is a dynamic and evolving market. The factors that affect pricing may change over time, and including older years in the analysis may introduce obsolete data that no longer reflect the current market dynamics. By focusing on more recent years, the prediction models are able to capture the most pertinent and up-to-date pricing patterns, resulting in increased precision.
The presence of substantial peaks (
Figure 2) in the median price evolution of various instance families over time is an intriguing discovery of the analysis. These summits represent price fluctuations or anomalies within the cloud pricing market. Curiously, these price fluctuations do not appear to have a significant effect on the evaluation metrics utilized in this study.
As shown in
Table 11, when analyzing the GPU instance family, the results demonstrate consistent and robust metrics across various subsets of years. This indicates that the method utilized in this study is effective at capturing the underlying patterns and dynamics of the data, particularly in terms of feature selection, model training, and outlier detection. Despite the observed price fluctuations, the model maintains accurate and consistent GPU instance family predictions.A similar pattern is observed in the memory-optimized family, where the median price reached its apex in 2017. Comparing relative metrics between years (
Table 7) reveals, however, that there has been no significant change. This finding strengthens the method’s robustness and its capacity to make consistent predictions even in the presence of price anomalies or fluctuations.
In the cloud market, technological advances frequently result in a shift in pricing strategies. As newer and more effective technologies become available, providers may revise their pricing structures to reflect their value and capabilities [
41]. The introduction of faster CPUs, larger memory capacities, or more scalable storage solutions, for instance, can enable providers to offer cloud instances with superior performance at competitive prices. On the other hand, as outmoded technologies become less prevalent, they may be priced higher due to diminished availability or increased maintenance costs.
5.2. Price Comparison: Actual vs. Predicted
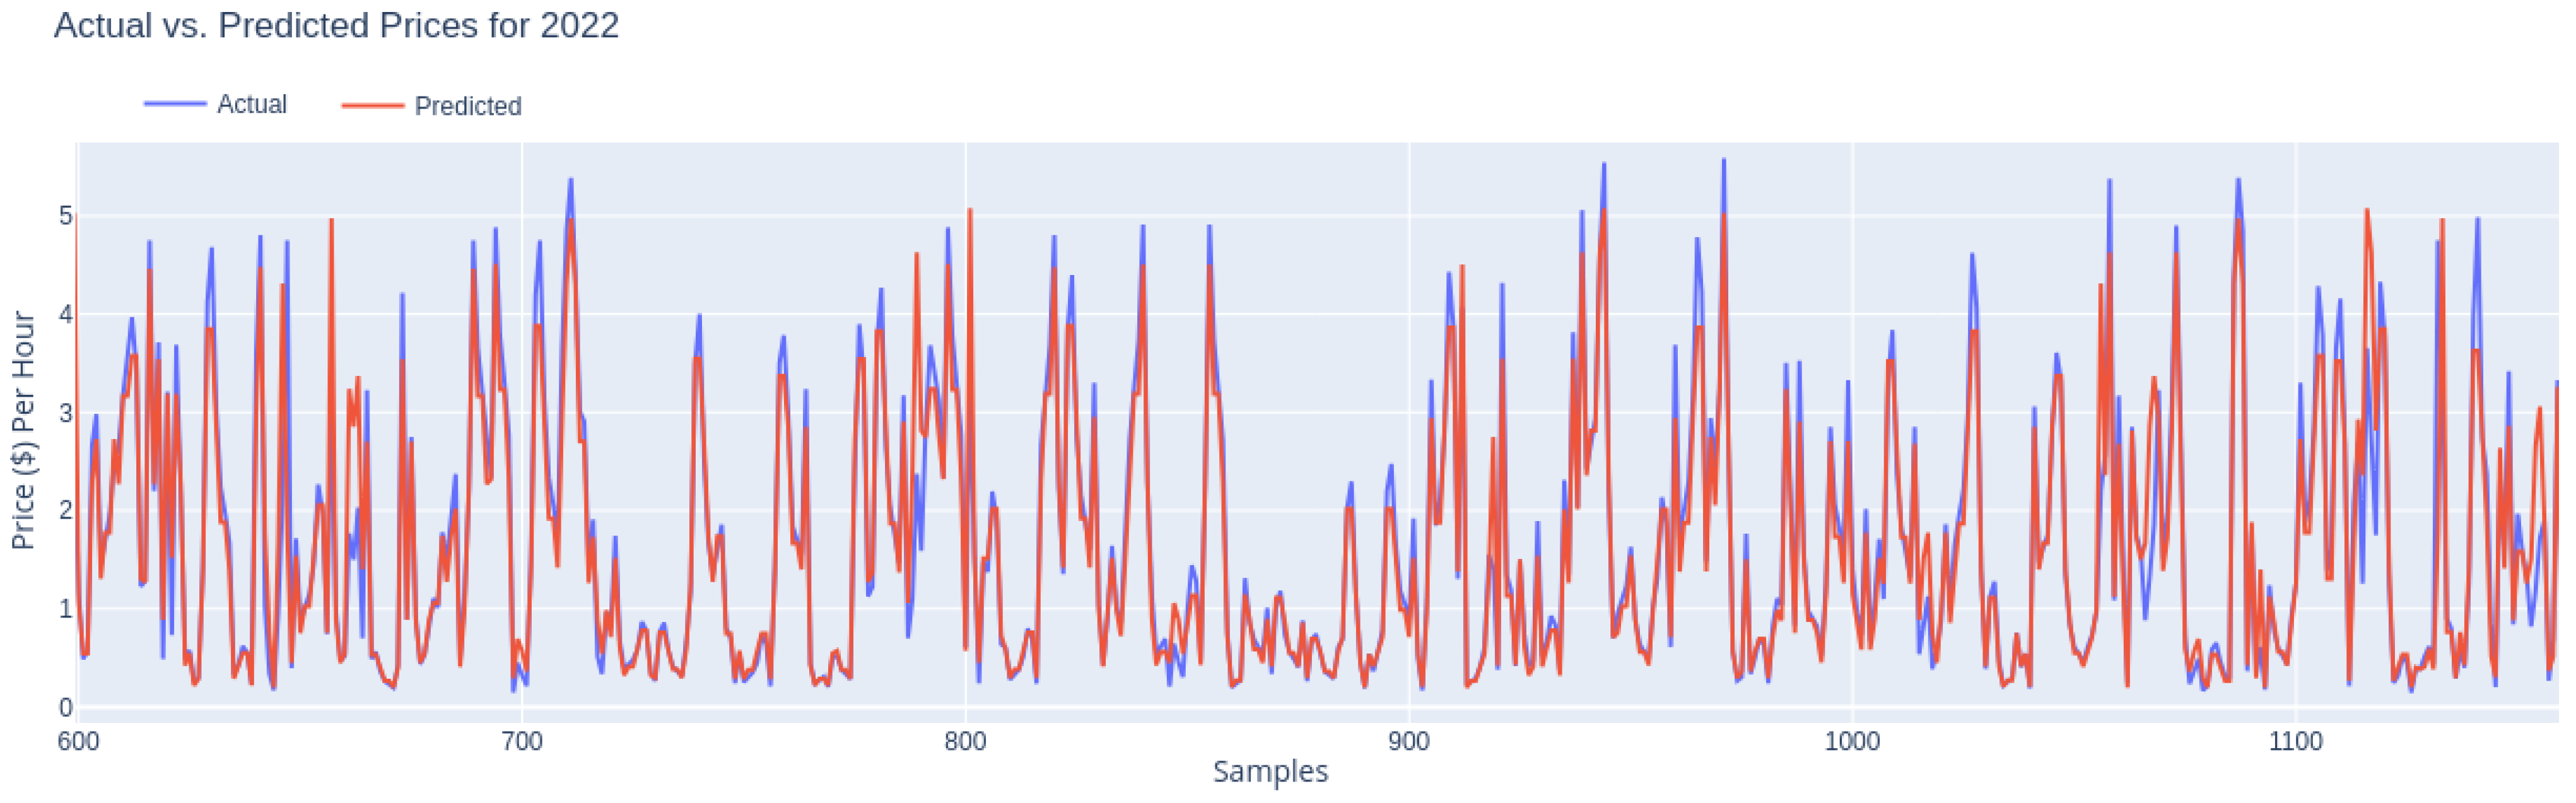
Figure 4 compares the actual and predicted pricing for the GPU instance subset using the model built in the earlier step. The model was developed using historical data from 2021, and it was used to forecast prices for 2022. The illustration shows a line plot, with the x-axis representing time and the y-axis representing price. The plot depicts the actual prices in blue, while the expected values are indicated in red. According to the comparison, the anticipated prices are quite similar to the actual prices.
This implies that the model’s projections for the GPU instance subset are correct and match the prices observed in 2022. The proximity of the actual and expected prices indicates that the model grasped the underlying patterns and trends in the data, allowing it to generate trustworthy forecasts. Overall, this graph indicates the model’s efficacy in projecting pricing for the GPU instance subset, offering useful insights for decision making and cost management in cloud computing settings.
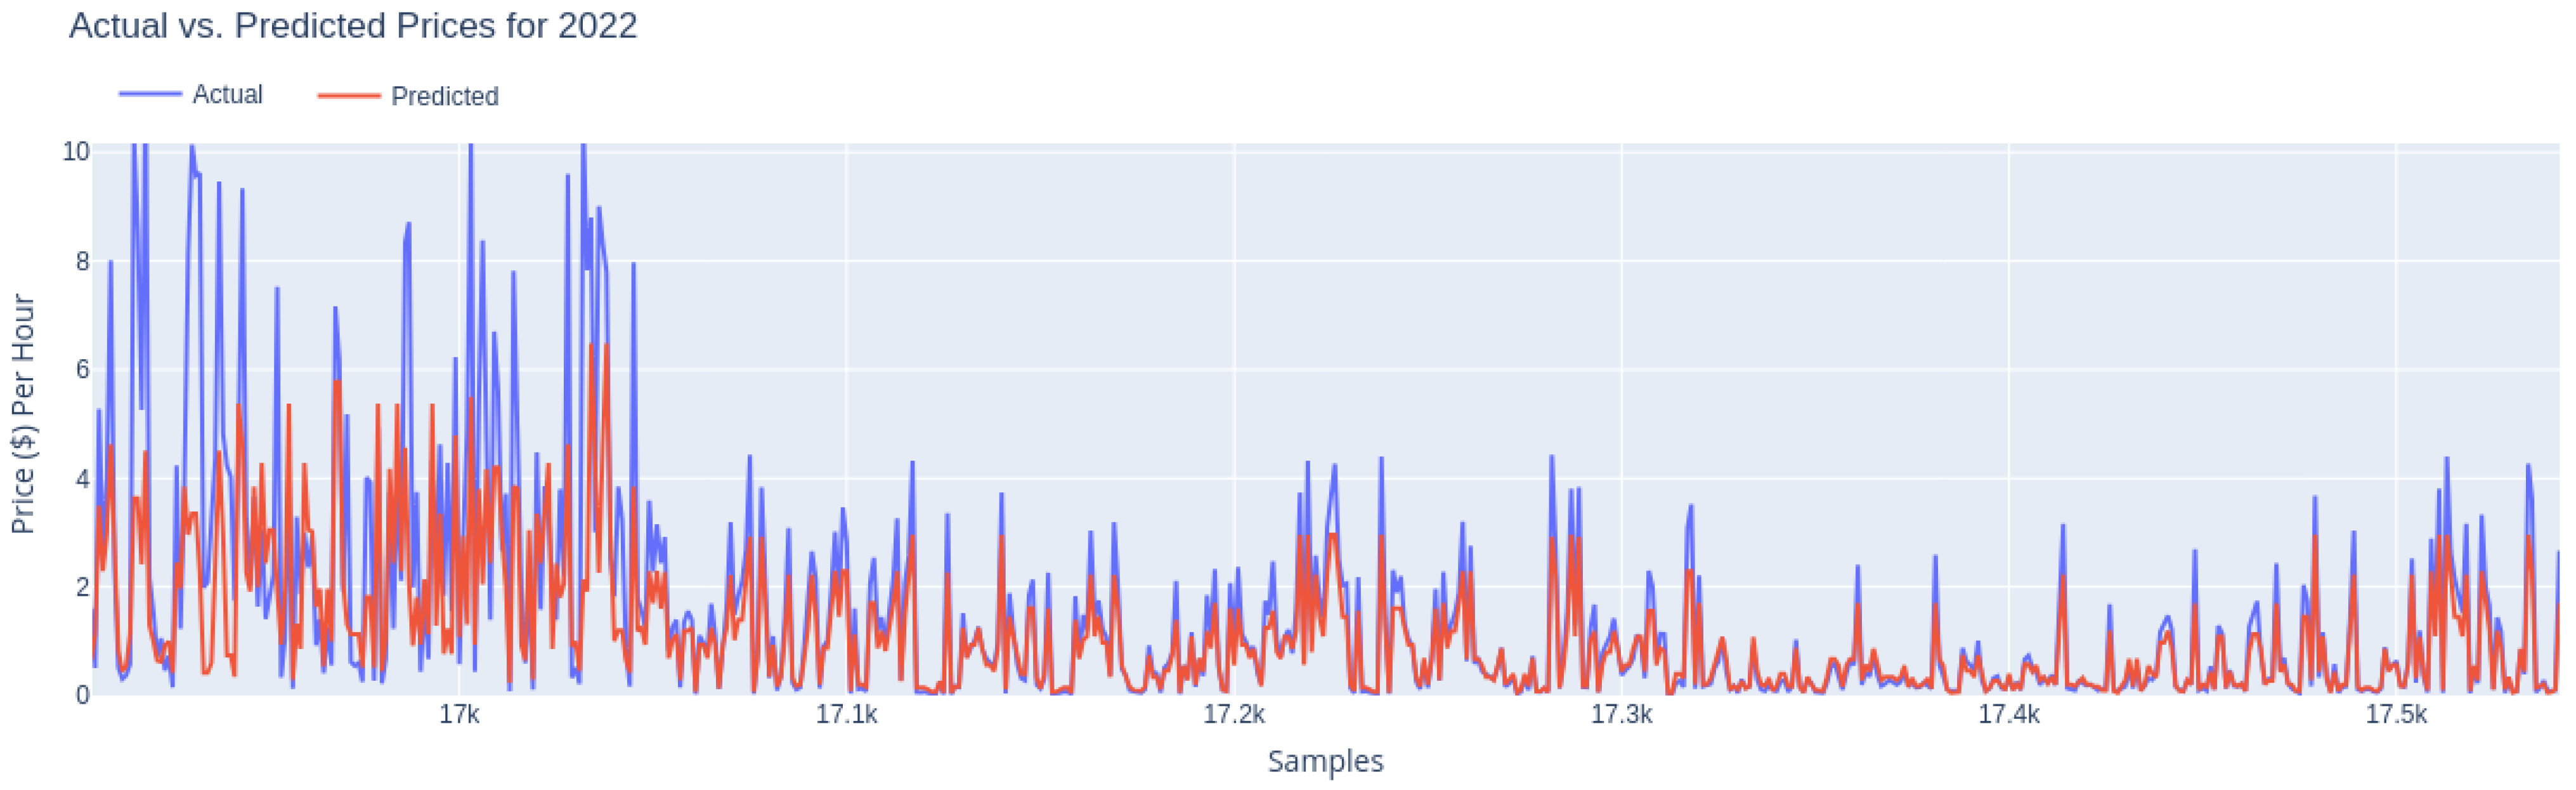
On the other hand, there is the Memory-optimized instance family. As observed in
Figure 2, the median price increase between 2021 and 2022 reaches 70%. This is an unusually significant change in price evolution over time that may be characterised as disruptive. The potential to predict such a change is explored.
Examining the
Figure 5 reveals a noticeable disparity between the predicted and actual values. This difference suggests that the predictions of the model for the memory-optimized instance family can not be as accurate. The discrepancy between predicted and actual prices could be attributable to the presence of external factors not adequately accounted for by the model.
In practice, even though the properties of memory-optimized instances are similar between the years 2021–2022, there is a significant increase in the price, especially for high-end instances. A detailed look at the results reveals that the Memory-optimized instance family has a broader price range than the GPU instance family. As shown in
Figure 5, the model struggles to accurately predict prices for instances with higher prices while performing relatively well for instances with lower prices. These higher price instances are the ones subjected to a disruptive price increase. Even so, the model correctly predicted the price increase in all cases; however, the percentage increase was not predicted, especially in cases that exceeded 50% of a corresponding price in 2021.
6. Discussion
Within this particular section, we will explore the constraints that arose during our analysis of the findings, providing insight into the aspects where our study could potentially benefit from additional improvement and investigation. In acknowledging these constraints, our aim is to foster a more profound comprehension of the variables that impact the pricing of cloud computing as well as stimulate further inquiries in this field.
In addition, we offer contemplation on prospective directions for future research with the intention of expanding upon the knowledge acquired from this study. Through the exploration of novel methodologies, the integration of supplementary functionalities, and the evaluation of alternative machine-learning algorithms, it is posited that further progress can be made in the realm of cloud service price prediction.
6.1. Discrepancy in the Predictions
Further investigation is necessary to enhance prediction in cases of disruptive changes in prices, as observed in the memory-optimized instance family. Considering the complex and multifaceted nature of the issue, it is hypothesized that several potential factors may be contributing to the observed trend. Furthermore, since the efficiency of prediction is not the same in all instance families, though the properties of instances serving as input parameters in the ML model are the same, further investigation on this issue is also useful.
It is essential to note that the identification and correction of such discrepancies will improve the model’s robustness. It is this process of continual refinement that makes machine-learning models effective. By iterating on the model based on findings from real-world data, we can improve its predictive precision, not just for the memory-optimized instance family, but also for other families demonstrating similar complexity. Potential factors to explore consist of:
External factors: Our current model does not fully incorporate the impact of external market dynamics, such as industry trends, policy changes, or technological advancements. These elements, although external to AWS’s pricing strategy, can significantly influence it. One could explore the inclusion of additional data sources that capture these external influences, though this is not an easy task. By integrating variables such as global technological shifts, regional demand patterns, or even provider policy observations, our model may provide a more comprehensive prediction of price trends, which is beyond the scope of the current study.
Instance family’s heterogeneity: The GPU instance family is a coherent sample. Other larger instance families encompass a diverse range of instances that possess unique capacities and specifications. Hence, it is plausible that the observed disparity could be attributed to the inherent heterogeneity present within this particular group of instances. One potential approach to addressing this issue involves the clustering of similar instances within the family and the subsequent development of individualized models for each cluster.
6.2. Sensitivity to Historical Data
The decision to utilize the CatBoost algorithm was motivated by its strong ability to effectively handle categorical data and missing values. Nevertheless, it is imperative to acknowledge that alternative algorithms may exhibit different levels of sensitivity when it comes to older historical data. The analysis conducted indicates that the incorporation of these data has the potential to introduce additional interference into our model, which could potentially impede the accuracy of our predictions. The aforementioned discovery is consistent with observations made in the field of time-series forecasting, where the significance and practicality of past data play a crucial role in making precise predictions for the future [
42].
The phenomenon known as “concept drift” brings attention to the difficulties posed by dynamic and rapidly evolving systems, such as cloud computing. The phenomenon being discussed pertains to alterations in the processes that generate data over a period of time. This suggests that models that are trained on older data may exhibit suboptimal performance when attempting to predict more recent or future observations [
43]. The utilization of up-to-date historical data that accurately represents the present condition of the system may result in advantages in dynamic systems such as cloud pricing [
44].
In domains such as cloud computing, which are marked by continuous technological progress, competitive dynamics, and evolving market demands, the relevance of older data may diminish over time. The cost structure for providing these services can be subject to change due to the continuous introduction of new instance types and the phase-out of older ones. These changes can be influenced by factors such as technological advancements, economies of scale, and fluctuations in energy costs.
Therefore, our research proposes that the utilization of recent data could potentially offer a more accurate basis for making predictions about future prices. The utilization of outdated data has the potential to introduce extraneous information and diminish the precision of predictions, thereby reflecting circumstances that are no longer applicable.
Further research could entail conducting comparative analyses using various machine-learning algorithms. The CatBoost algorithm was chosen based on its unique strengths. However, it is important to note that alternative models may exhibit different performance characteristics and varying sensitivity to the influence of older data.
6.3. Comparison with the Existing Literature
The comparison of our findings with previous research on spot instance pricing holds significance, regardless of the inherent disparities between the two pricing models that necessitate consideration. Furthermore, it is imperative to emphasize that our research represents one of the initial attempts to specifically investigate price forecasting for reserved instances. Consequently, the scope for direct comparisons with prior studies is constrained.
Spot instances and reserved instances exhibit distinct characteristics in relation to their pricing dynamics and utilization patterns. Spot instances are subject to real-time pricing that is determined by current supply and demand conditions. Consequently, spot instances can experience significant fluctuations in price. In contrast, reserved instances are acquired at a predetermined cost for a specified duration, providing a consistent pricing structure but limited adaptability.
In order to provide a comprehensive comparison, several studies have examined spot instance pricing and reported MAPE values. These studies [
11,
12,
13] have found that short-term forecasts, typically ranging from 1 to 3 hours ahead, exhibit MAPE values between 10% and 20%. Conversely, longer-term forecasts, specifically those made 24 h in advance, demonstrate MAPE values ranging from 20% to 40%. The observed values for spot instance pricing generally exhibit higher values compared to those obtained for reserved instance pricing, indicating the greater price volatility associated with spot instances.
Although previous research has extensively examined the prediction of spot instance prices, our study distinguishes itself by encompassing a diverse array of offers within each instance family. The prevailing body of literature has primarily focused its examination on a limited number of case types, potentially neglecting the complex and multifaceted aspects of pricing dynamics in cloud services. The comprehensive methodology employed in our study enables a deeper understanding of pricing trends among various instance families, thereby offering a more holistic perspective of the pricing environment in cloud computing. The extensive range of services offered is especially advantageous for consumers who aim to maximize their utilization of cloud resources and minimize costs across various services, rather than concentrating solely on a specific instance type.
6.4. Implications for Cloud-Usage Strategies and Planning
The primary objective of forecasting cloud pricing does not solely revolve around achieving cost reduction, but rather focuses on empowering users to make better-informed decisions. The determination of cloud service pricing is a complex matter that is impacted by a range of factors, such as the types of instances available, the geographical regions in which the service is offered, and the various payment options that customers can choose from. Nevertheless, the task of price prediction constitutes only a fraction of the overall equation. This tool serves as a valuable resource for users to enhance their cloud utilization strategies and planning.
This assumes that a user makes a decision to reserve instances in a particular region and selects an upfront payment option, taking into consideration our projected prices. Subsequently, the user discovers the presence of idle reserved instances in their possession, prompting their desire to engage in the process of selling said instances. In this scenario, our predictive model can assist the user in determining the most advantageous moment to sell these instances by forecasting future prices. By strategically selling assets during periods of predicted price increases, users have the potential to recover a greater portion of their initial investment.
Moreover, the inclusion of regional price predictions in our model would enable users to make informed decisions regarding both the timing and location of their sales. The variation in demand levels and pricing fluctuations across different regions underscores the importance of accurately predicting prices on a regional basis. Such predictive capabilities would yield significant benefits.
7. Conclusions
In this paper, we examined the potential of machine-learning techniques for predicting future prices for IaaS services. ML price-prediction models were built for Amazon’s instance families using the CatBoost algorithm. Amazon is the leading provider in the IaaS market, while RI is the most mature pricing option; thus, we focused on it as a first step in our exploration.
The models’ close correlation with actual prices showed that they were capable of capturing and interpreting the fundamental pricing trends and patterns. Evaluation results show that shorter time periods provided lower MAE values, suggesting more accuracy in projecting cloud service pricing. This means that current data, independent of instance family, has a greater effect on pricing patterns and market trends in the cloud services business. In addition, the analysis of ML algorithm performance over different instance families demonstrated that a disruptive change in pricing policy, not related to a corresponding change in instance properties, as in the case of memory-optimized instances, may be predicted as a trend, though accurate results are difficult to obtain. This could only be achieved if related external factors, as resource cost, could be provided as input parameters into the model.
This study focuses on the task of forecasting the complex and constantly shifting pricing structures of cloud services. Our research stands out due to its broad examination of various offers within each instance family, distinguishing it from previous studies that primarily concentrated on specific instance types in the spot instance market. The all-encompassing nature of our methodology enables an expanded understanding of the pricing dynamics among various instance families, offering valuable insights for cloud consumers who employ a wide range of services.
It is essential to recognize the limitations of this research. The precision of the forecasts is highly dependent on the availability and quality of historical data. Incomplete or skewed data can induce uncertainty and have an effect on the efficacy of the models. In addition, the models presume that the factors influencing cloud pricing will remain relatively stable over time; however, external factors such as market dynamics or changes in the competitive landscape may impact the accuracy of the predictions.
To further improve the precision and generalizability of the models, future research may investigate multiple paths. First, the incorporation of more diverse datasets from multiple sources would broaden the perspective and enhance the performance of the models. In addition, investigating sophisticated machine-learning algorithms and techniques, such as ensemble methods or deep learning, could result in further enhancements to the accuracy of predictions. In addition, considering the wide variety of pricing patterns observed in certain instance families, a clustering strategy could be investigated. By organizing instances according to their specific characteristics and pricing dynamics, models can account for the heterogeneity within families, resulting in more accurate predictions.
This study contributes to the expanding corpus of knowledge concerning machine-learning applications in cloud computing pricing. The developed models provide businesses with valuable insights for optimizing cloud resource utilization, making informed decisions, and managing IT budgets effectively. Recognizing the limitations, the findings pave the way for future research and the refinement of predictive models in cloud computing pricing, which will ultimately benefit organizations attempting to navigate the dynamic cloud services landscape.
Author Contributions
Conceptualization, M.N. and G.F.; methodology, G.F.; software, G.F.; validation, C.M., T.K. and M.N.; formal analysis, G.F., M.N. and E.F.; investigation, E.F.; resources, E.F.; data curation, G.F.; writing—original draft preparation, G.F.; writing—review and editing, T.K., C.M. and M.N.; visualization, G.F.; supervision, C.M.; project administration, M.N.; funding acquisition, G.F. All authors have read and agreed to the published version of the manuscript.
Funding
This research was funded by State Scholarships Foundation Greece (IKY) grant number 2022-050-0502-52245.
Data Availability Statement
Conflicts of Interest
The authors declare no conflict of interest. The funders had no role in the design of the study; in the collection, analyses, or interpretation of data; in the writing of the manuscript; or in the decision to publish the results.
Abbreviations
The following abbreviations are used in this manuscript:
| RI | Reserved Instances |
| IaaS | infrastructure-as-a-service |
| AWS | Amazon Web Services |
| EC2 | Elastic Compute Cloud |
| ML | Machine Learning |
| GPU | Graphical Process Unit |
| MAE | Mean Absolute Error |
| MAPE | Mean Absolute Percentage Error |
| RMSE | Root Mean Squared Error |
| FPGA | Field Programmable Gate Arrays |
| ASIC | Application-Specific Integrated Circuit |
| ARIMA | AutoRegressive Integrated Moving Average |
| SARIMA | Seasonal AutoRegressive Integrated Moving Average |
| AR | Autoregressive |
| GARCH | Generalized AutoRegressive Conditional Heteroskedasticity |
| XGBoost | Extreme Gradient Boosting |
| IESO | Independent Electricity System Operator |
| CLI | Command-line interface |
| kNN | k-nearest neighbors |
References
- Kash, I.A.; Key, P.B. Pricing the cloud. IEEE Internet Comput. 2016, 20, 36–43. [Google Scholar] [CrossRef]
- Mazrekaj, A.; Shabani, I.; Sejdiu, B. Pricing schemes in cloud computing: An overview. Int. J. Adv. Comput. Sci. Appl. 2016, 7, 2. [Google Scholar] [CrossRef]
- Gartner. Available online: https://www.gartner.com/en/newsroom/press-releases/2022-10-31-gartner-forecasts-worldwide-public-cloud-end-user-spending-to-reach-nearly-600-billion-in-2023 (accessed on 20 April 2023).
- Amazon. Amazon EC2. Available online: https://aws.amazon.com/ec2/ (accessed on 25 April 2023).
- Statista. Infrastructure As a Service (IaaS) Software Market Share Worldwide 2022, by Vendor. Available online: https://www.statista.com/statistics/1258463/infrastructure-as-a-service-software-market-share-vendor-worldwide/ (accessed on 30 June 2023).
- Amazon. Amazon Elastic Container Service. Available online: https://aws.amazon.com/ecs/ (accessed on 25 May 2023).
- Fabra, J.; Ezpeleta, J.; Álvarez, P. Reducing the price of resource provisioning using EC2 spot instances with prediction models. Future Gener. Comput. Syst. 2019, 96, 348–367. [Google Scholar] [CrossRef]
- Lancon, J.; Kunwar, Y.; Stroud, D.; McGee, M.; Slater, R. AWS EC2 instance spot price forecasting using LSTM networks. SMU Data Sci. Rev. 2019, 2, 8. [Google Scholar]
- Portella, G.; Rodrigues, G.N.; Nakano, E.; Melo, A.C. Statistical analysis of Amazon EC2 cloud pricing models. Concurr. Comput. Pract. Exp. 2019, 31, e4451. [Google Scholar] [CrossRef]
- Khandelwal, V.; Chaturvedi, A.K.; Gupta, C.P. Amazon EC2 spot price prediction using regression random forests. IEEE Trans. Cloud Comput. 2017, 8, 59–72. [Google Scholar] [CrossRef]
- Liu, W.; Wang, P.; Meng, Y.; Zhao, C.; Zhang, Z. Cloud spot instance price prediction using kNN regression. Hum.-Centric Comput. Inf. Sci. 2020, 10, 34. [Google Scholar] [CrossRef]
- Baldominos Gómez, A.; Saez, Y.; Quintana, D.; Isasi, P. AWS PredSpot: Machine Learning for Predicting the Price of Spot Instances in AWS Cloud. Int. J. Interact. Multimed. Artif. Intell. 2022, 7, 65–74. [Google Scholar] [CrossRef]
- Nezamdoust, S.S.; Pourmina, M.A.; Razzazi, F. Optimal prediction of cloud spot instance price utilizing deep learning. J. Supercomput. 2023, 79, 7626–7647. [Google Scholar] [CrossRef]
- Alon, I.; Qi, M.; Sadowski, R.J. Forecasting aggregate retail sales: A comparison of artificial neural networks and traditional methods. J. Retail. Consum. Serv. 2001, 8, 147–156. [Google Scholar] [CrossRef]
- Abolghasemi, M.; Beh, E.; Tarr, G.; Gerlach, R. Demand forecasting in supply chain: The impact of demand volatility in the presence of promotion. Comput. Ind. Eng. 2020, 142, 106380. [Google Scholar] [CrossRef]
- Mintarya, L.N.; Halim, J.N.; Angie, C.; Achmad, S.; Kurniawan, A. Machine learning approaches in stock market prediction: A systematic literature review. Procedia Comput. Sci. 2023, 216, 96–102. [Google Scholar] [CrossRef]
- Mudassir, M.; Bennbaia, S.; Unal, D.; Hammoudeh, M. Time-series forecasting of Bitcoin prices using high-dimensional features: A machine learning approach. Neural Comput. Appl. 2020. [Google Scholar] [CrossRef] [PubMed]
- Hong, T.; Pinson, P.; Wang, Y.; Weron, R.; Yang, D.; Zareipour, H. Energy forecasting: A review and outlook. IEEE Open Access J. Power Energy 2020, 7, 376–388. [Google Scholar] [CrossRef]
- Nashold, L.; Krishnan, R. Using LSTM and SARIMA models to forecast cluster CPU usage. arXiv 2020, arXiv:2007.08092. [Google Scholar]
- Wu, C.; Toosi, A.N.; Buyya, R.; Ramamohanarao, K. Hedonic pricing of cloud computing services. IEEE Trans. Cloud Comput. 2018, 9, 182–196. [Google Scholar] [CrossRef]
- Alkharif, S.; Lee, K.; Kim, H. Time-series analysis for price prediction of opportunistic cloud computing resources. In Proceedings of the 7th International Conference on Emerging Databases: Technologies, Applications, and Theory, Busan, Republic of Korea, 7–9 August 2017; Springer: Berlin/Heidelberg, Germany, 2018; pp. 221–229. [Google Scholar]
- Khan, M.; Jehangiri, A.I.; Ahmad, Z.; Ala’anzy, M.A.; Umer, A. An exploration to graphics processing unit spot price prediction. Clust. Comput. 2022, 25, 3499–3515. [Google Scholar] [CrossRef]
- Mehdi, H.; Pooranian, Z.; Vinueza Naranjo, P.G. Cloud traffic prediction based on fuzzy ARIMA model with low dependence on historical data. Trans. Emerg. Telecommun. Technol. 2022, 33, e3731. [Google Scholar] [CrossRef]
- Albahli, S.; Shiraz, M.; Ayub, N. Electricity Price Forecasting for Cloud Computing Using an Enhanced Machine Learning Model. IEEE Access 2020, 8, 200971–200981. [Google Scholar] [CrossRef]
- Devi, K.L.; Valli, S. Time series-based workload prediction using the statistical hybrid model for the cloud environment. Computing 2023, 105, 353–374. [Google Scholar] [CrossRef]
- Nawrocki, P.; Osypanka, P. Cloud resource demand prediction using machine learning in the context of qos parameters. J. Grid Comput. 2021, 19, 20. [Google Scholar] [CrossRef]
- Zhang, F.; Fleyeh, H.; Bales, C. A hybrid model based on bidirectional long short-term memory neural network and Catboost for short-term electricity spot price forecasting. J. Oper. Res. Soc. 2022, 73, 301–325. [Google Scholar] [CrossRef]
- Jabeur, S.B.; Khalfaoui, R.; Arfi, W.B. The effect of green energy, global environmental indexes, and stock markets in predicting oil price crashes: Evidence from explainable machine learning. J. Environ. Manag. 2021, 298, 113511. [Google Scholar] [CrossRef]
- Zhang, C.; Chen, X.; Wang, S.; Hu, J.; Wang, C.; Liu, X. Using CatBoost algorithm to identify middle-aged and elderly depression, national health and nutrition examination survey 2011–2018. Psychiatry Res. 2021, 306, 114261. [Google Scholar] [CrossRef]
- Pandey, S.; Lahoti, S. Intrusion Detection System Analysis Using Cat boost Technique Intended for Cloud Communication Network. In Proceedings of the 2023 IEEE International Conference on Integrated Circuits and Communication Systems (ICICACS), Raichur, India, 24–25 February 2023; pp. 1–5. [Google Scholar]
- Dorogush, A.V.; Ershov, V.; Gulin, A. CatBoost: Gradient boosting with categorical features support. arXiv 2018, arXiv:1810.11363. [Google Scholar]
- Amazon. Scale Your Machine Learning Workloads on Amazon ECS Powered by AWS Trainium Instances. Available online: https://aws.amazon.com/blogs/machine-learning/scale-your-machine-learning-workloads-on-amazon-ecs-powered-by-aws-trainium-instances/ (accessed on 25 May 2023).
- Gaffoor, Z.; Pietersen, K.; Bagula, A.; Jovanovic, N.; Kanyerere, T.; Wanangwa, G. Big Data Analytics and Modelling. J. Softw. Eng. Appl. 2021, 843, 20. [Google Scholar]
- Pham-Gia, T.; Hung, T.L. The mean and median absolute deviations. Math. Comput. Model. 2001, 34, 921–936. [Google Scholar] [CrossRef]
- Al Daoud, E. Comparison between XGBoost, LightGBM and CatBoost using a home credit dataset. Int. J. Comput. Inf. Eng. 2019, 13, 6–10. [Google Scholar]
- Prokhorenkova, L.; Gusev, G.; Vorobev, A.; Dorogush, A.V.; Gulin, A. CatBoost: Unbiased boosting with categorical features. In Proceedings of the Advances in Neural Information Processing Systems, Montreal, QC, Canada, 3–8 December 2018; Bengio, S., Wallach, H., Larochelle, H., Grauman, K., Cesa-Bianchi, N., Garnett, R., Eds.; Curran Associates, Inc.: Nice, France, 2018; Volume 31. [Google Scholar]
- Hancock, J.T.; Khoshgoftaar, T.M. CatBoost for big data: An interdisciplinary review. J. Big Data 2020, 7, 94. [Google Scholar] [CrossRef] [PubMed]
- Liagkou, V.; Fragiadakis, G.; Filiopoulou, E.; Michalakelis, C.; Kamalakis, T.; Nikolaidou, M. A pricing model for Container-as-a-Service, based on hedonic indices. Simul. Model. Pract. Theory 2022, 115, 102441. [Google Scholar] [CrossRef]
- Fragiadakis, G.; Liagkou, V.; Filiopoulou, E.; Fragkakis, D.; Michalakelis, C.; Nikolaidou, M. Cloud services cost comparison: A clustering analysis framework. Computing 2023, 1–28. [Google Scholar] [CrossRef]
- Shiffler, R.E. Maximum Z Scores and Outliers. Am. Stat. 1988, 42, 79–80. [Google Scholar] [CrossRef]
- Chun, S.H. Cloud services and pricing strategies for sustainable business models: Analytical and numerical approaches. Sustainability 2019, 12, 49. [Google Scholar] [CrossRef]
- Ahmed, N.K.; Atiya, A.F.; Gayar, N.E.; El-Shishiny, H. An empirical comparison of machine learning models for time series forecasting. Econom. Rev. 2010, 29, 594–621. [Google Scholar] [CrossRef]
- Prado, R.; West, M. Time Series: Modeling, Computation, and Inference; Chapman and Hall/CRC: Boca Raton, FL, USA, 2010. [Google Scholar]
- Hyndman, R.J.; Athanasopoulos, G. Forecasting: Principles and Practice; OTexts: Online, 2018. [Google Scholar]
| Disclaimer/Publisher’s Note: The statements, opinions and data contained in all publications are solely those of the individual author(s) and contributor(s) and not of MDPI and/or the editor(s). MDPI and/or the editor(s) disclaim responsibility for any injury to people or property resulting from any ideas, methods, instructions or products referred to in the content. |
© 2023 by the authors. Licensee MDPI, Basel, Switzerland. This article is an open access article distributed under the terms and conditions of the Creative Commons Attribution (CC BY) license (https://creativecommons.org/licenses/by/4.0/).


 ,
, 


