
A Carrying Method for 5G Network Slicing in Smart Grid Communication Services Based on Neural Network


Abstract
1. Introduction
- (1)
- The hierarchical classification matching scheme was designed by matching the different communication demand for smart grid communication services, such as bandwidth, latency, and connectivity, with the characteristics of the 5G sliced network, where the traditional 5G network slices are divided into critical and general.
- (2)
- A scheme is proposed for combining edge computing in 5G slices in order to carry smart grid communication services. Different types of data generated by electric power terminal devices are received into the edge data centre for classification and matching, while the edge data centre performs dynamic prediction of the service traffic data in the network slice.
- (3)
- In order to adapt to the development trend of intelligence, the neural network model is used for classification matching and traffic prediction. The 1D CNN is used to extract the data features of traffic services and encode the data in order to achieve classification and matching of smart grid communication services. At the same time, with the proliferation of grid communication network traffic, the complexity of the services carried by the network has increased greatly. If a fixed rationing model is adopted, excessive network resources are often required, which is not conducive to improving network efficiency and expanding the network scale. This paper also uses BILSTM work for dynamic traffic prediction and adjustment.
- (4)
- The experimental results show that the neural network model used can show better results in classifying the power communication network and in predicting the network traffic, which is suitable for the 5G slicing network carrying the electric power communication network.
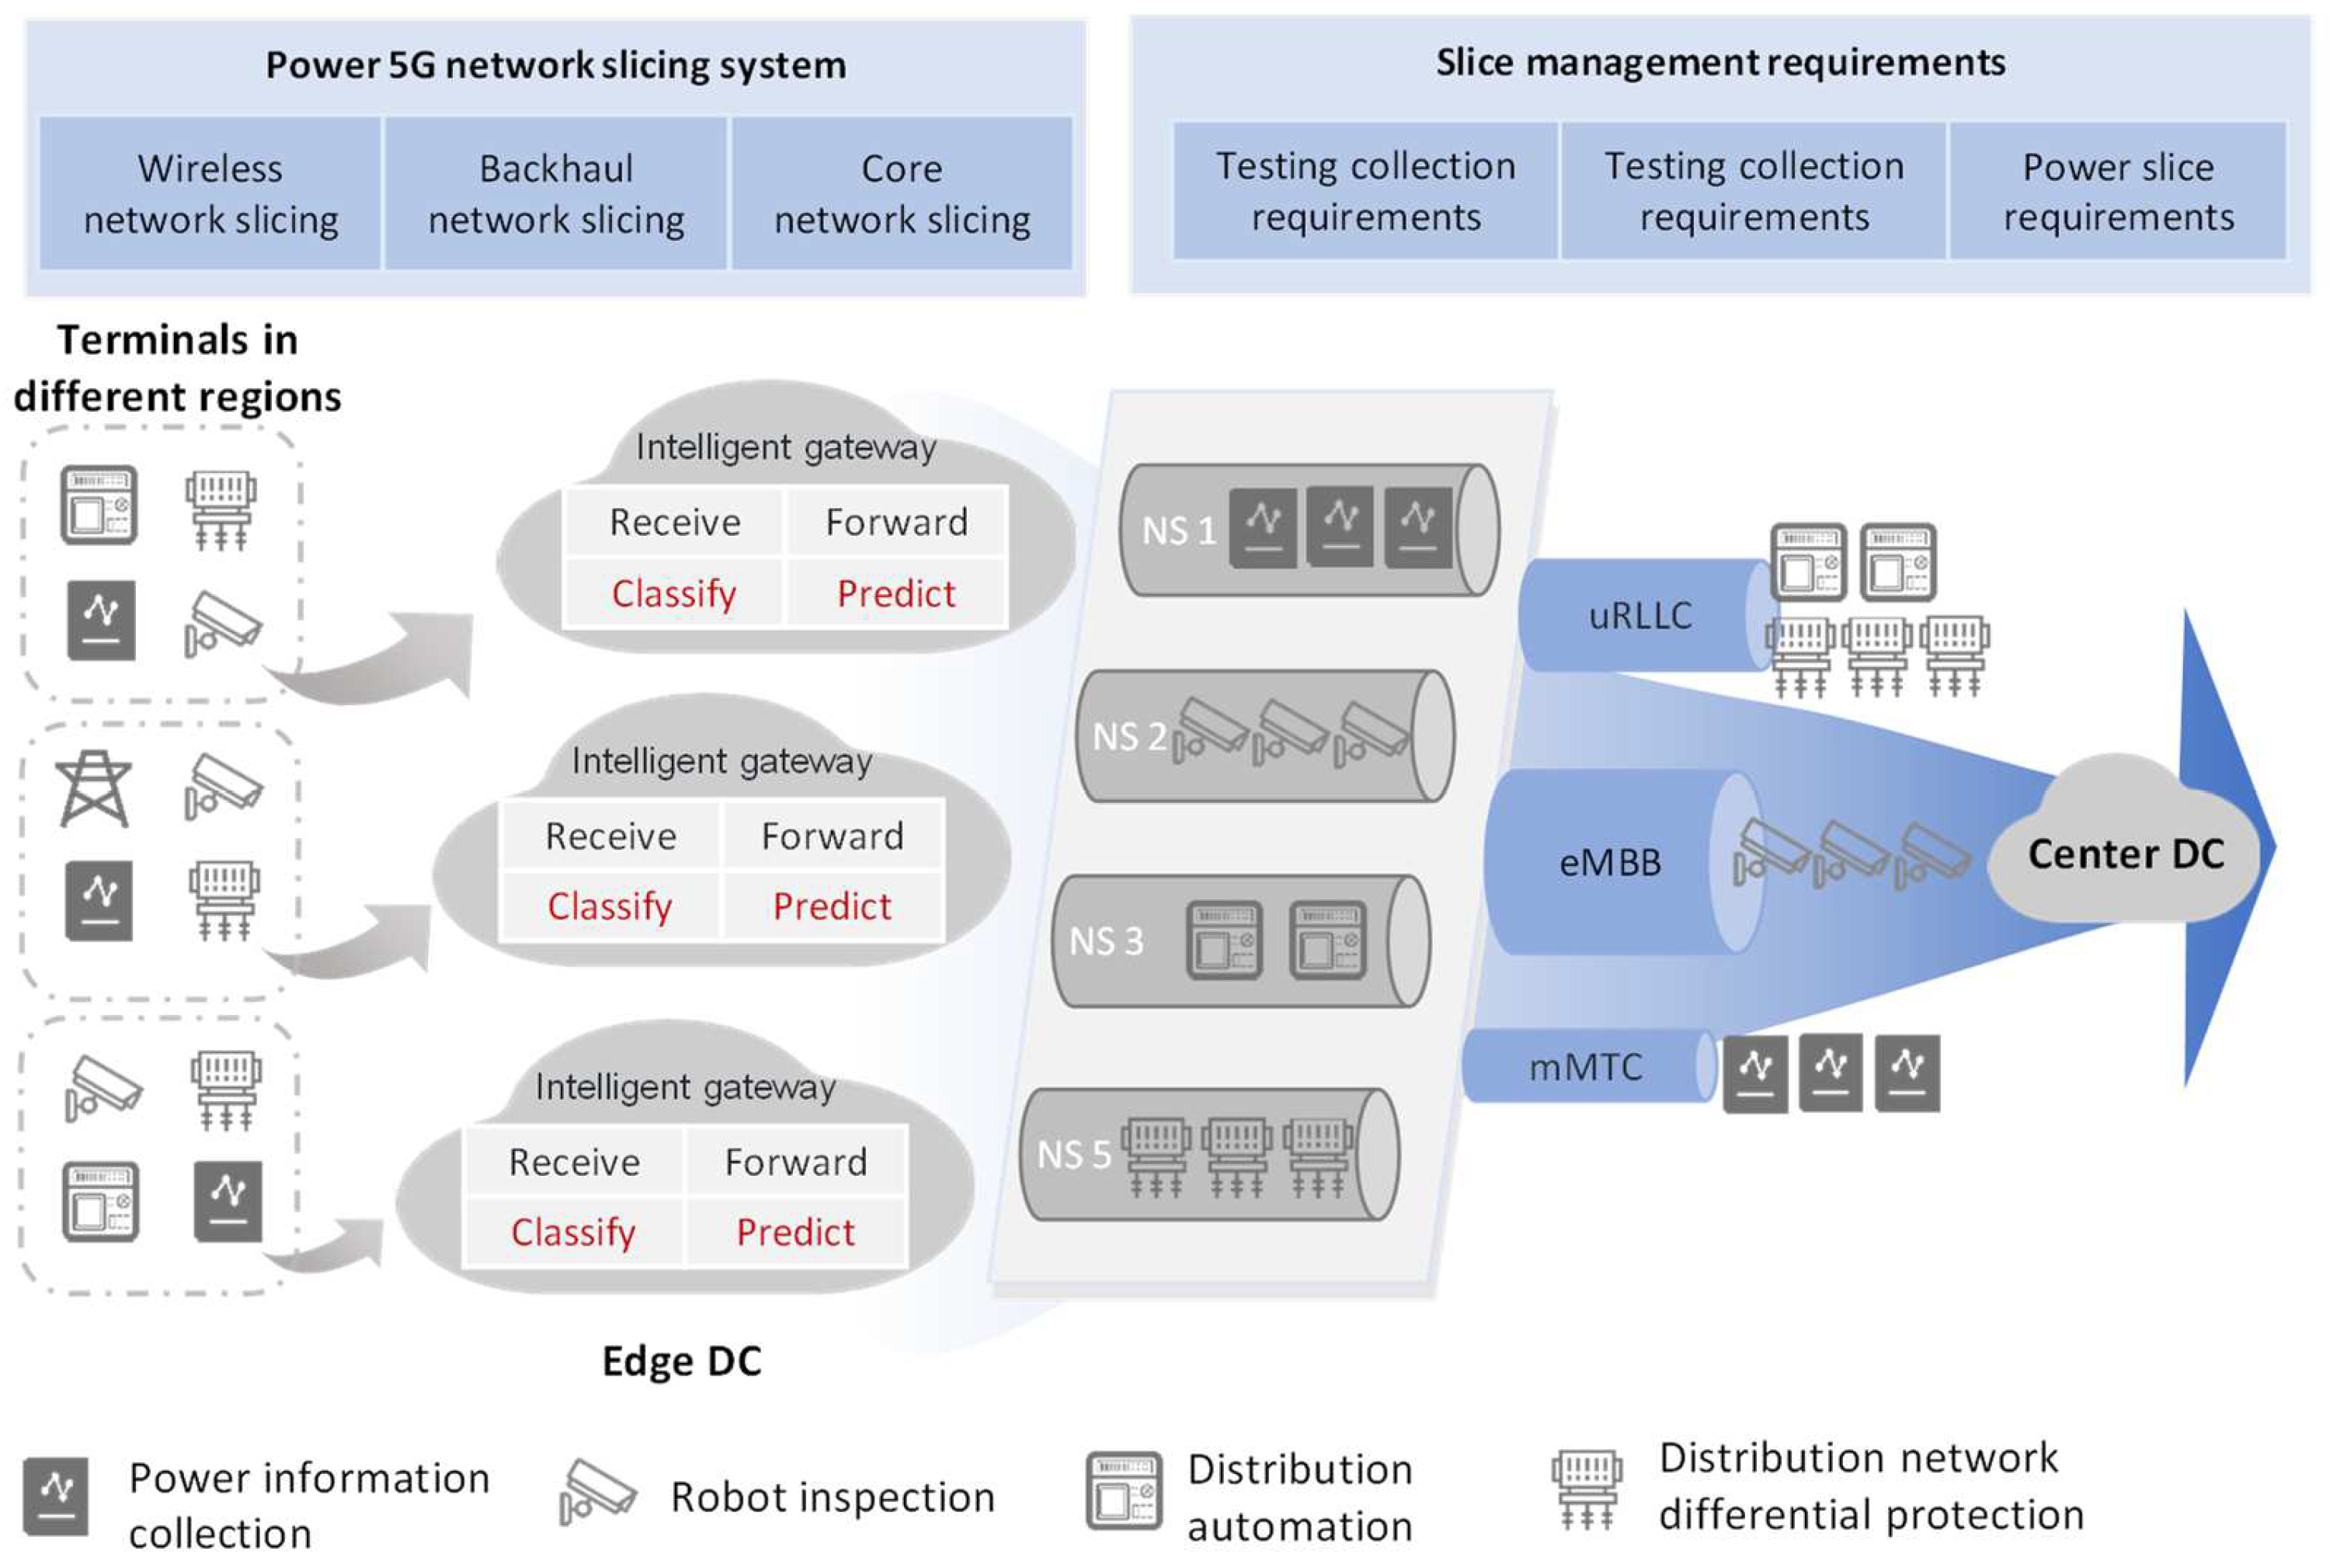
2. Hierarchical Dispatch Carrying Mechanism
2.1. Characteristics of Smart Grid Communication Services
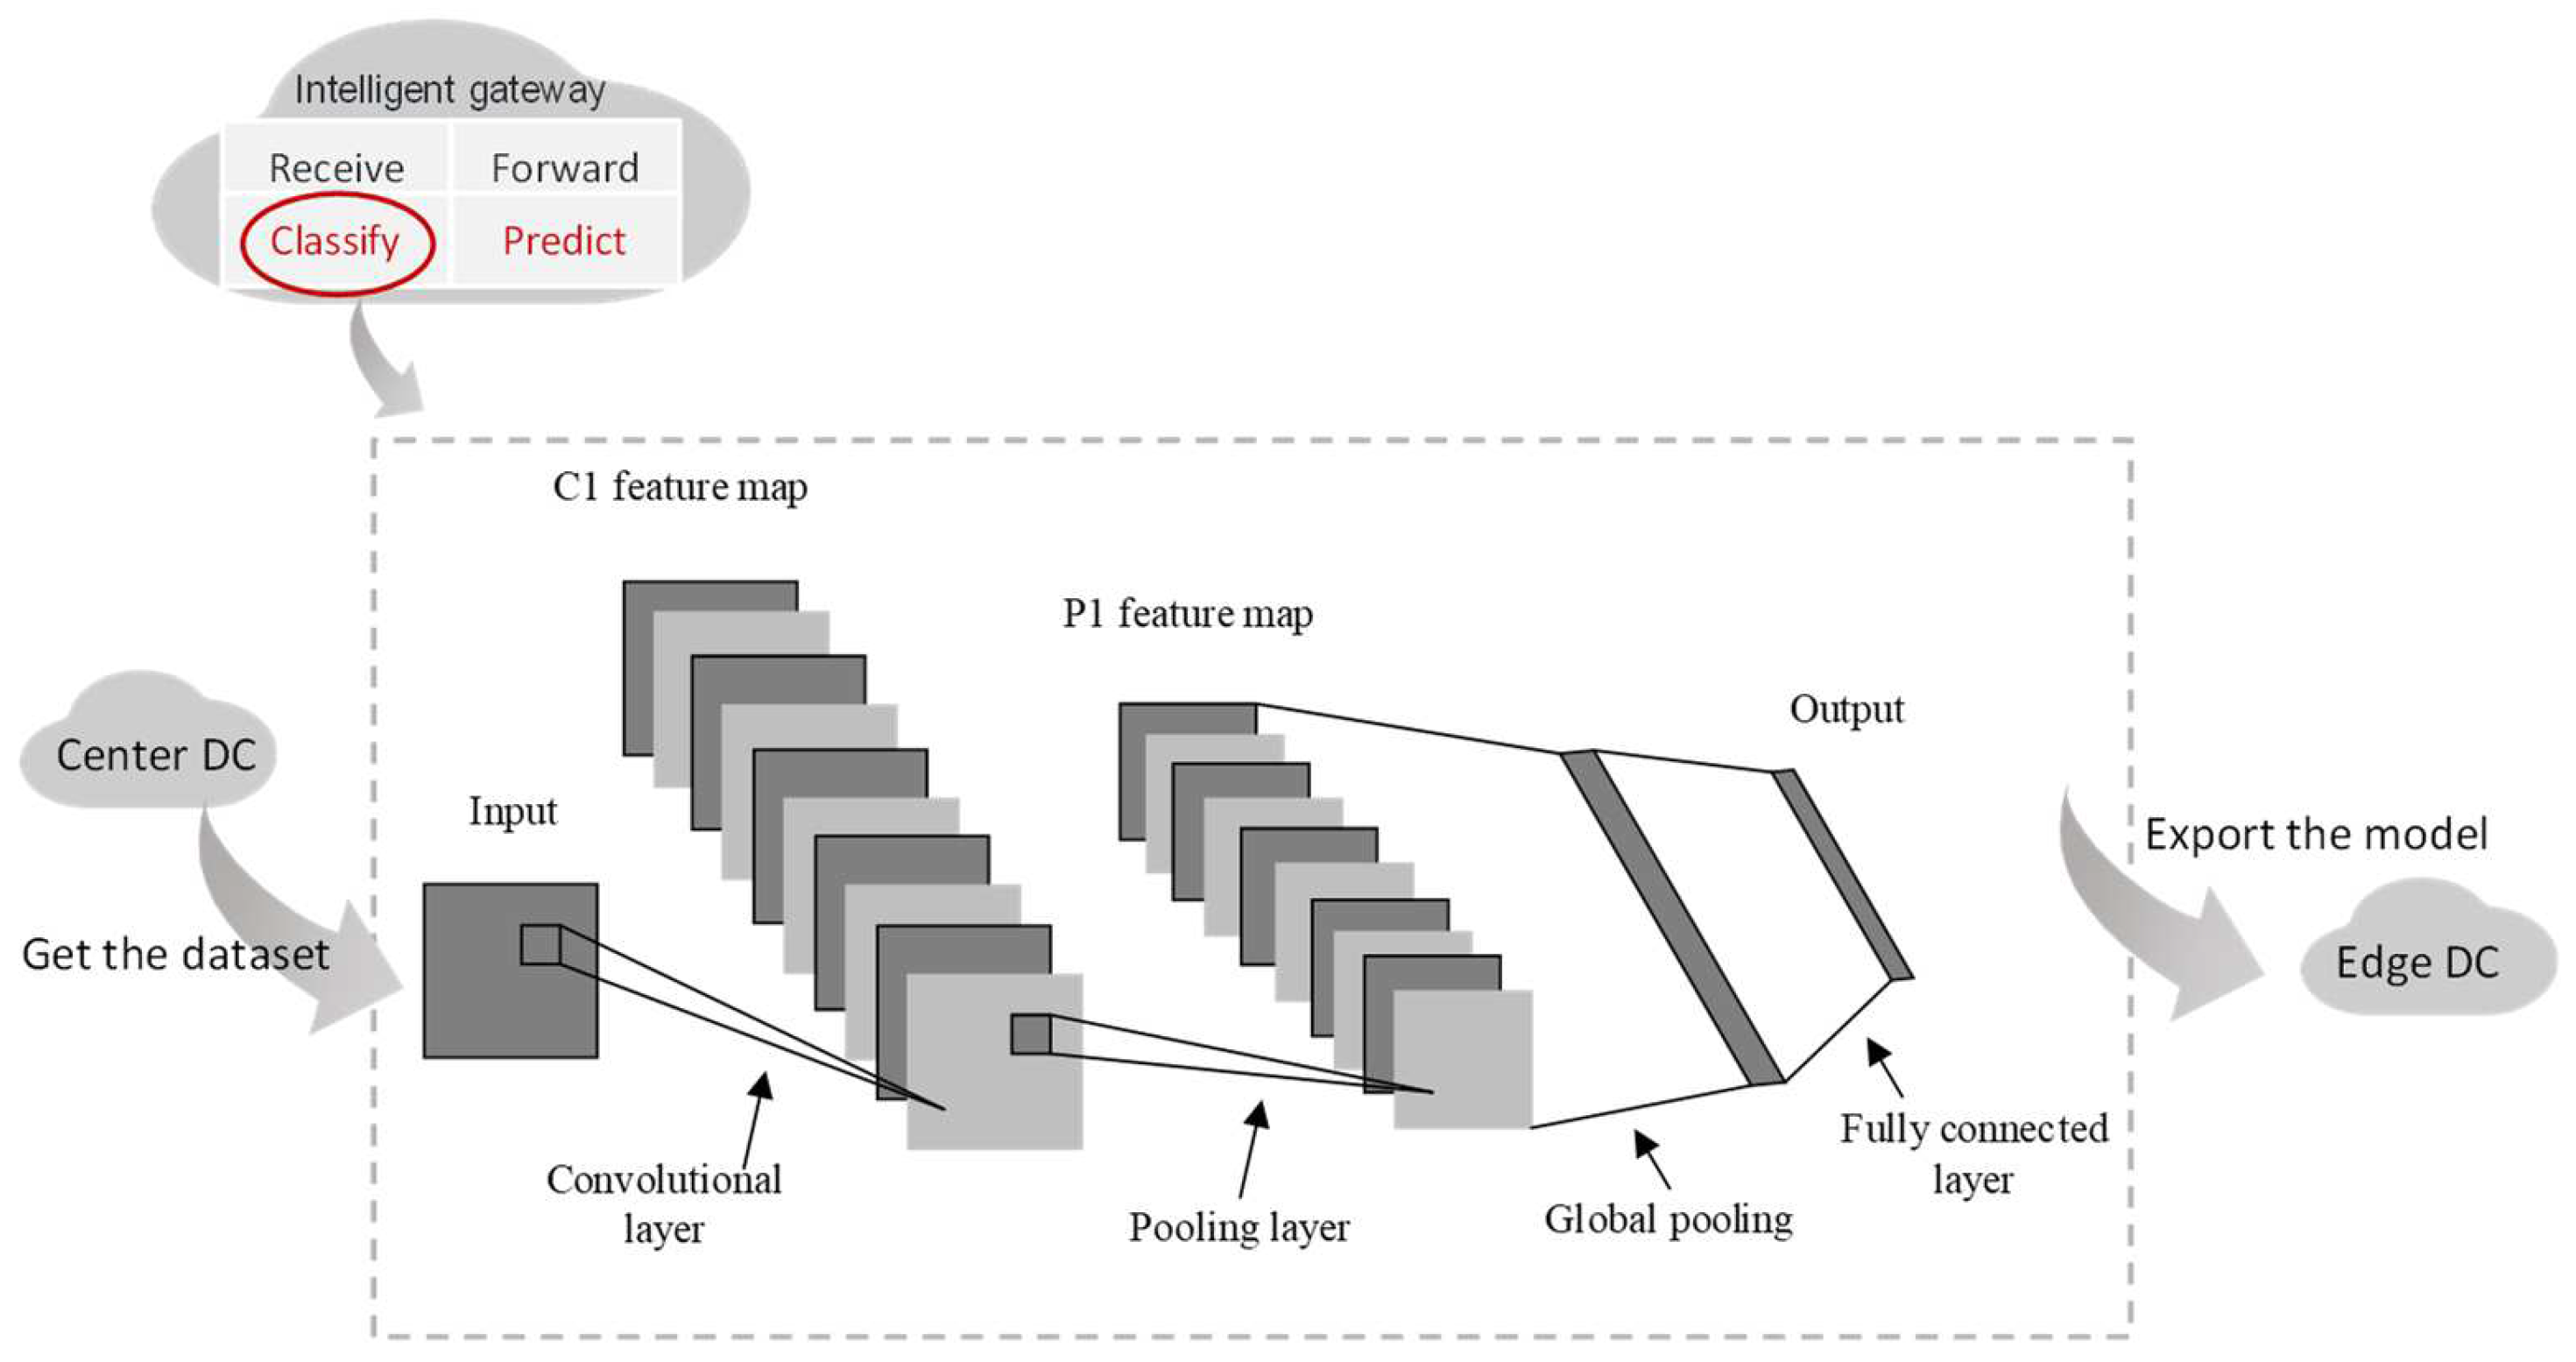
2.2. Neural Network-Based Hierarchical Scheduling Carrying Mechanism
3. Neural Network Algorithm Model
3.1. CNN Model
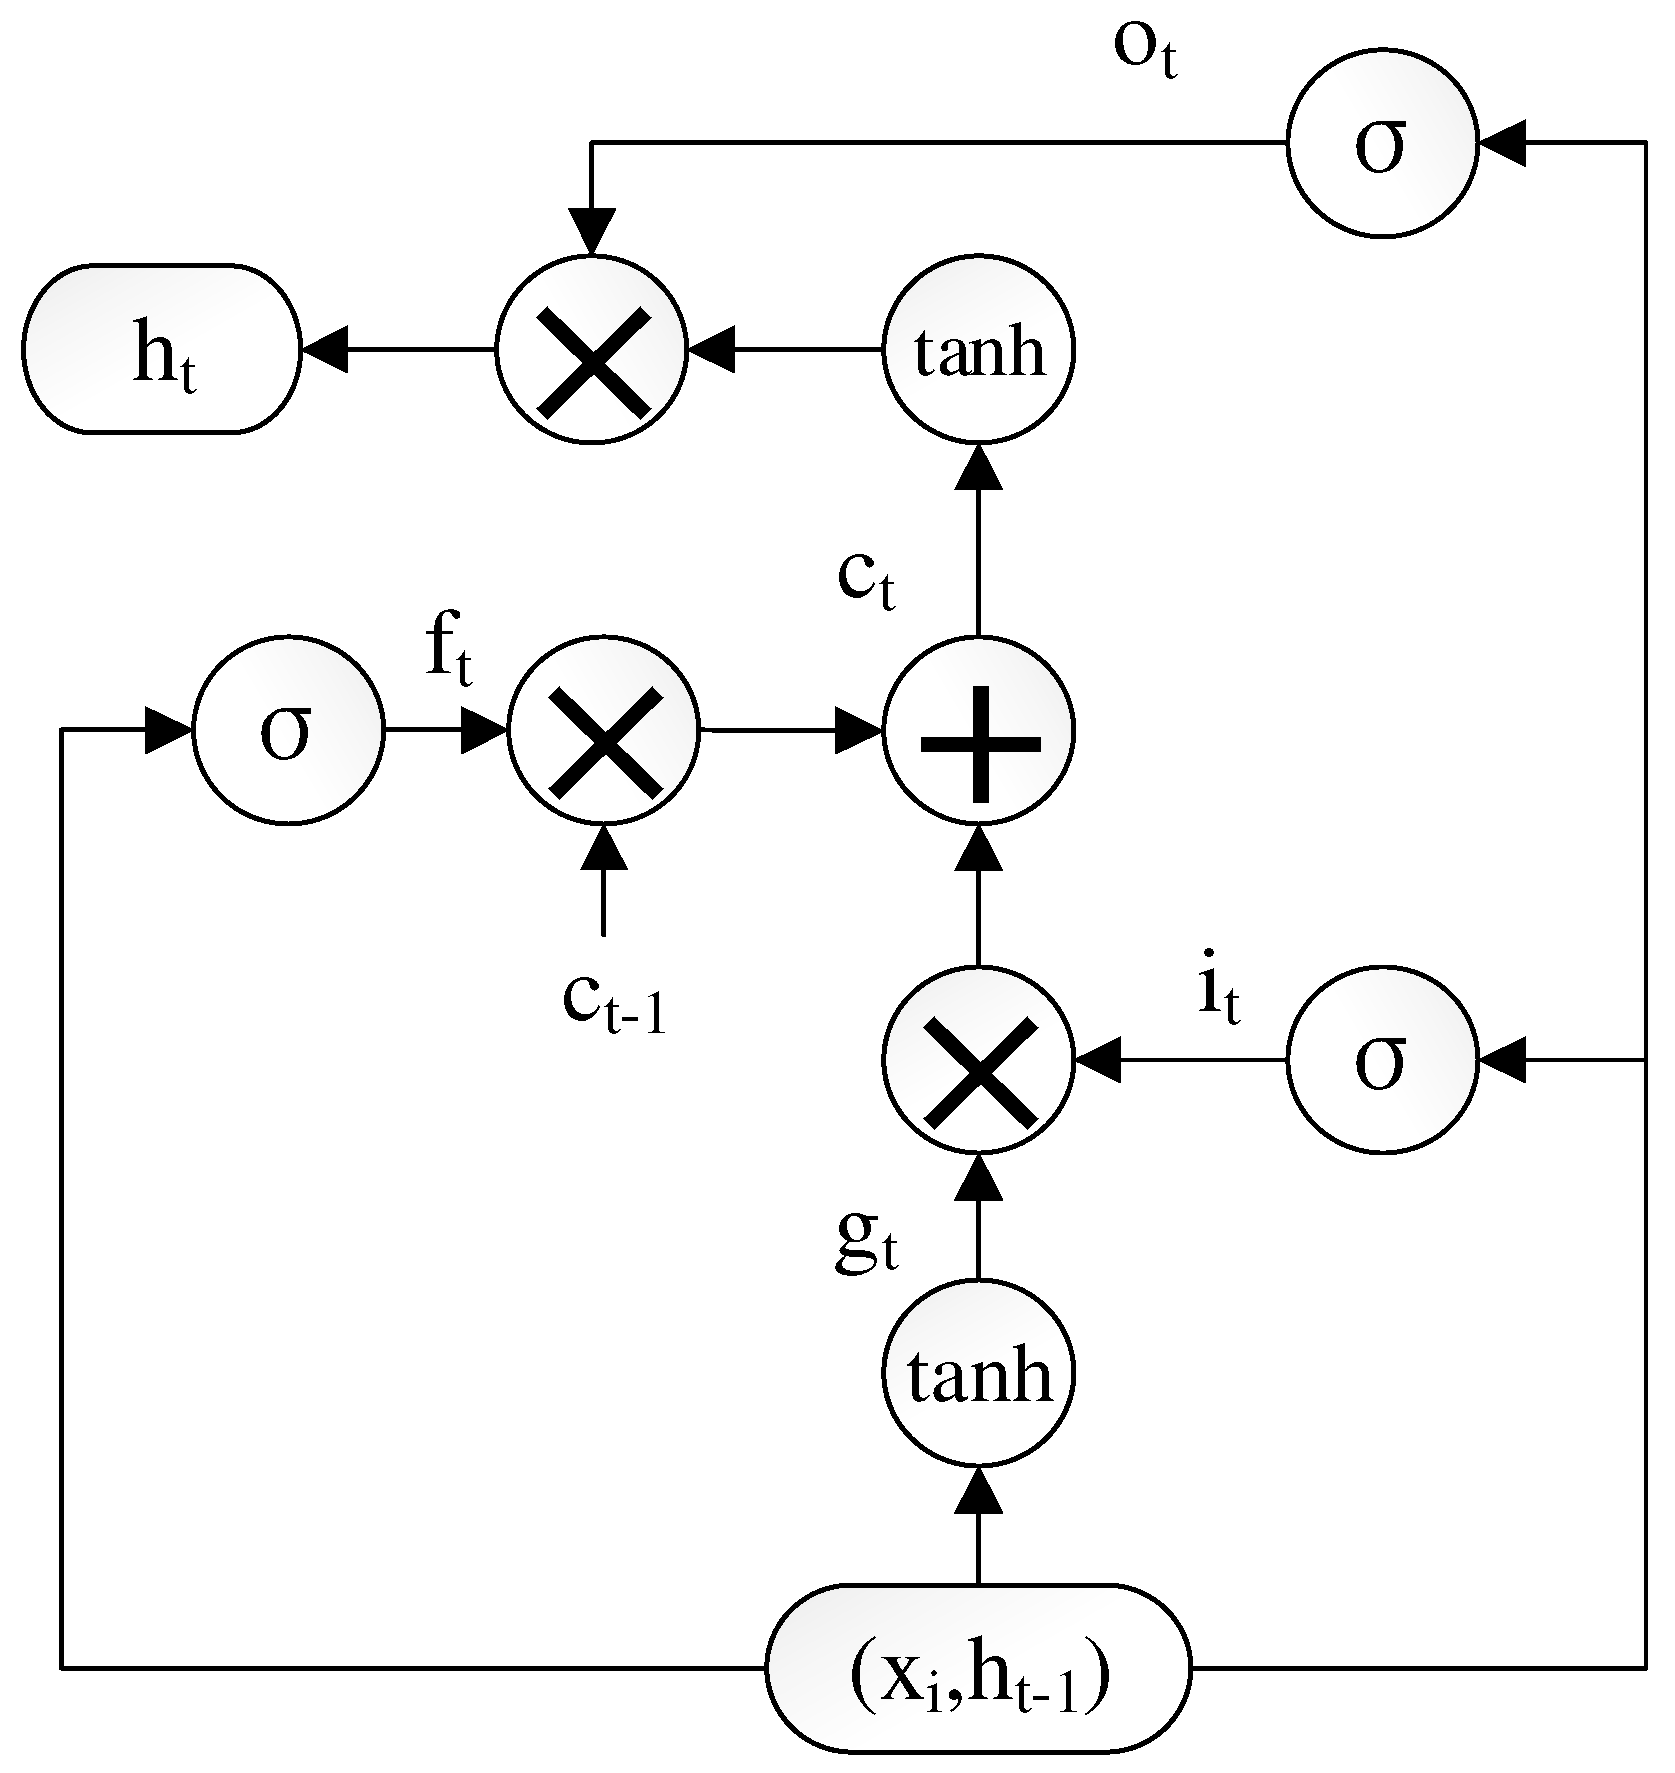
3.2. LSTM Model
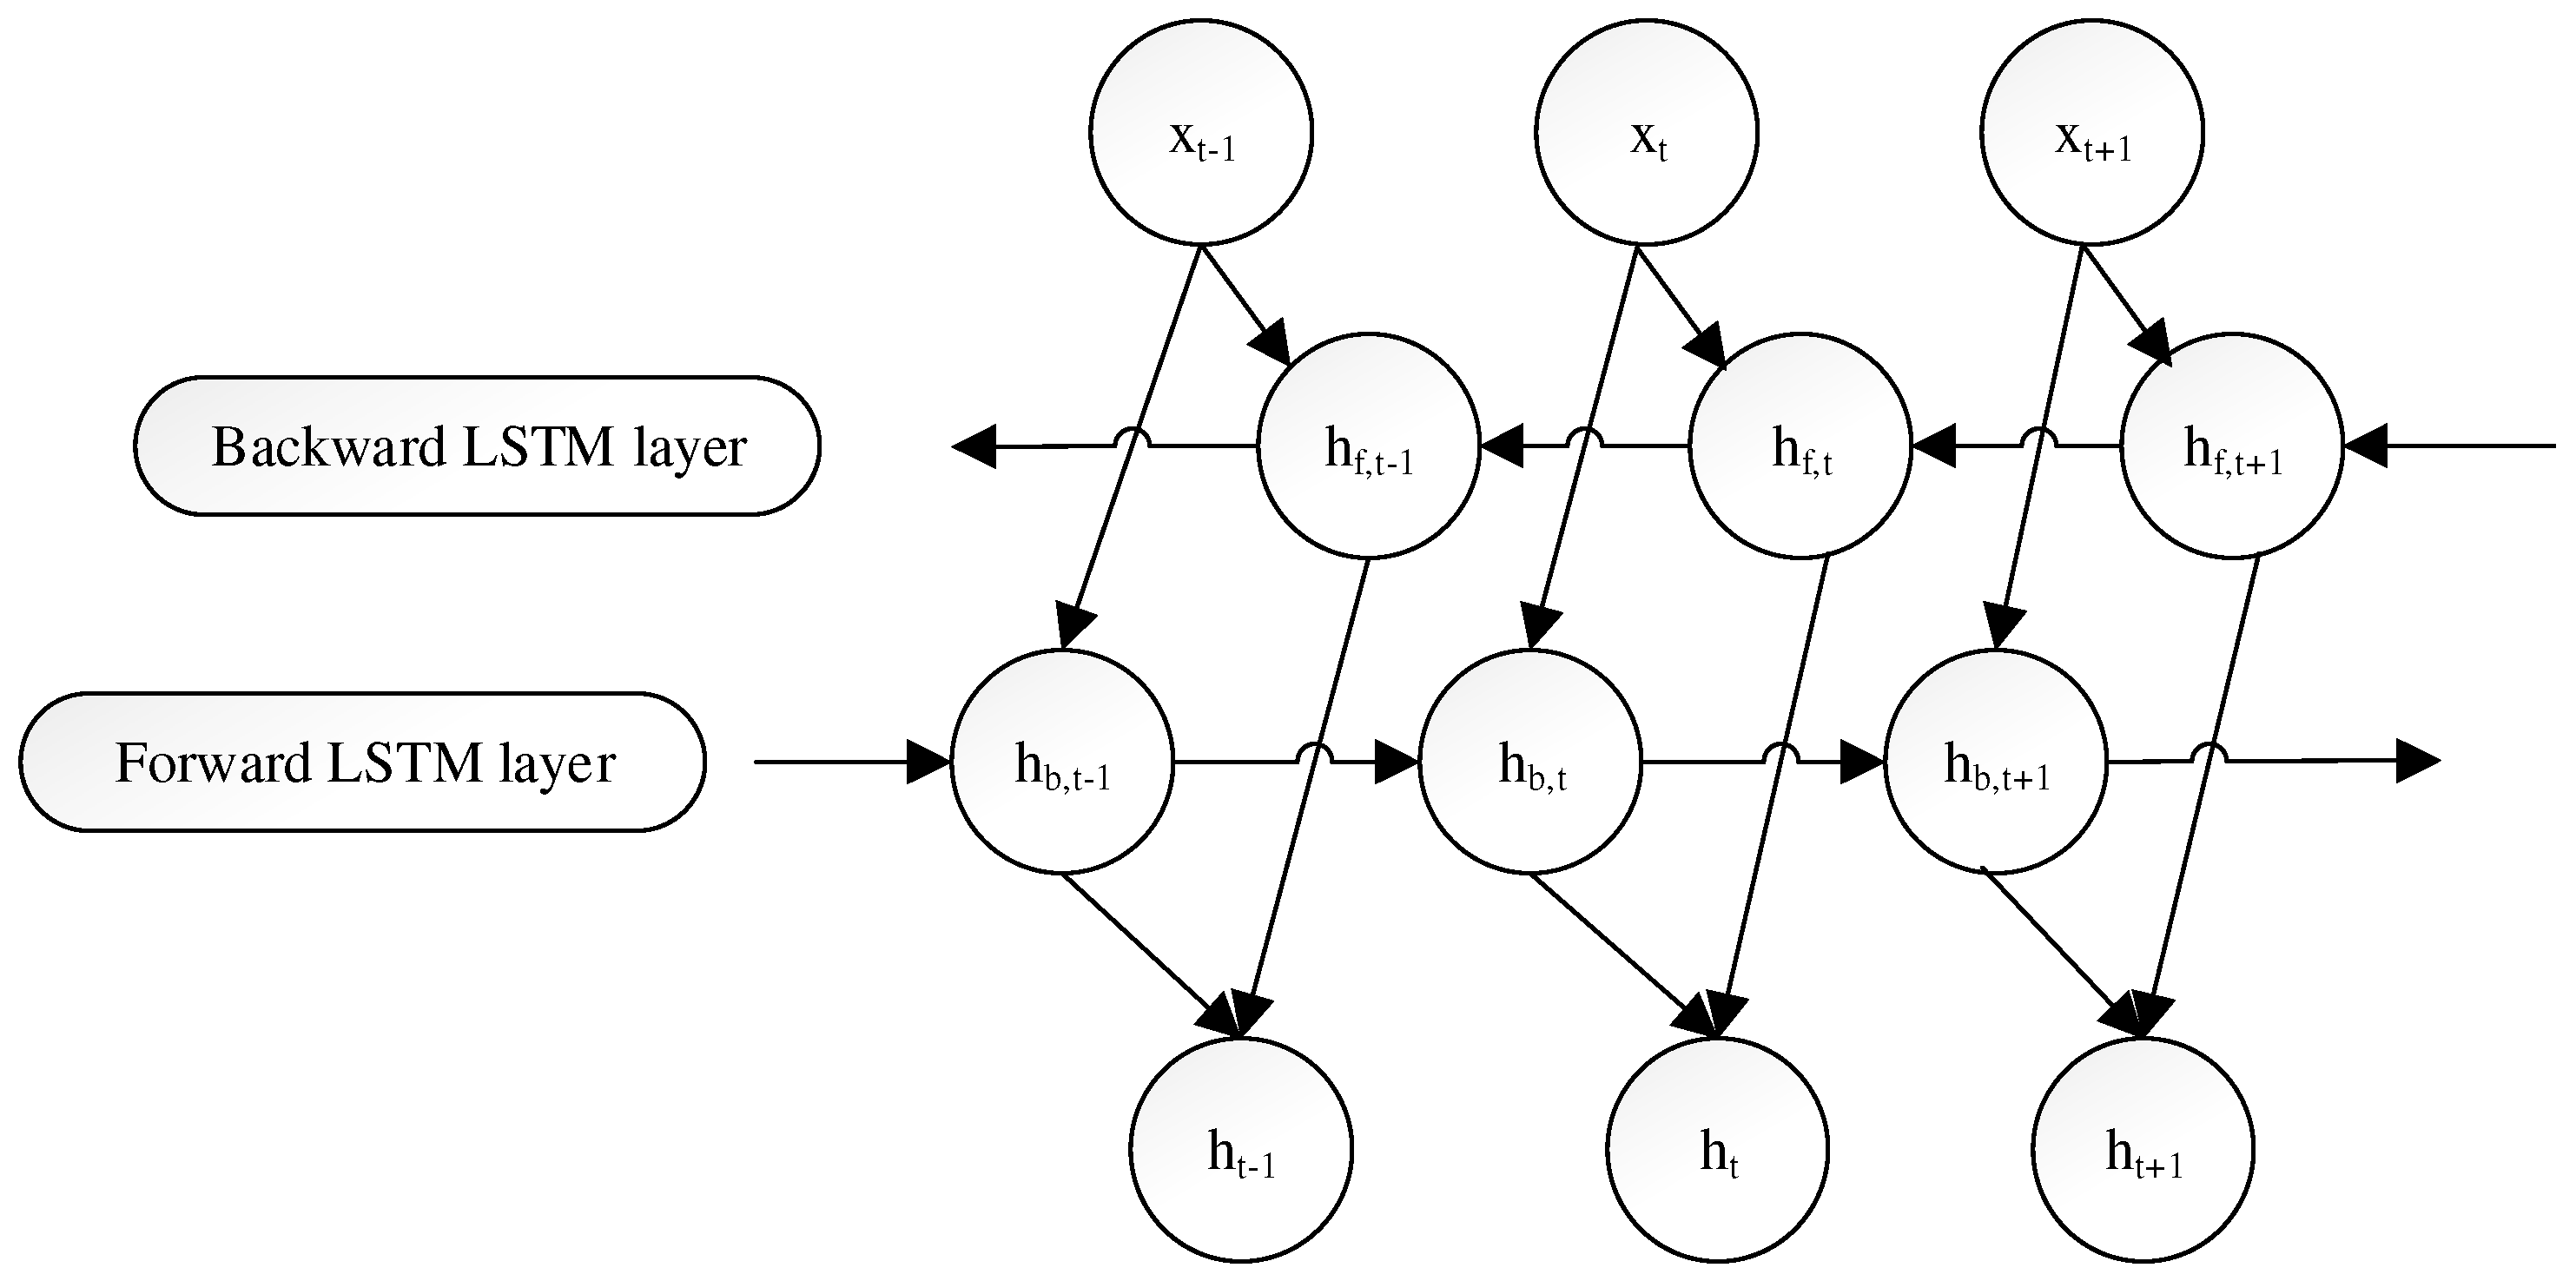
3.2.1. Structure of the LSTM and BILSTM Models
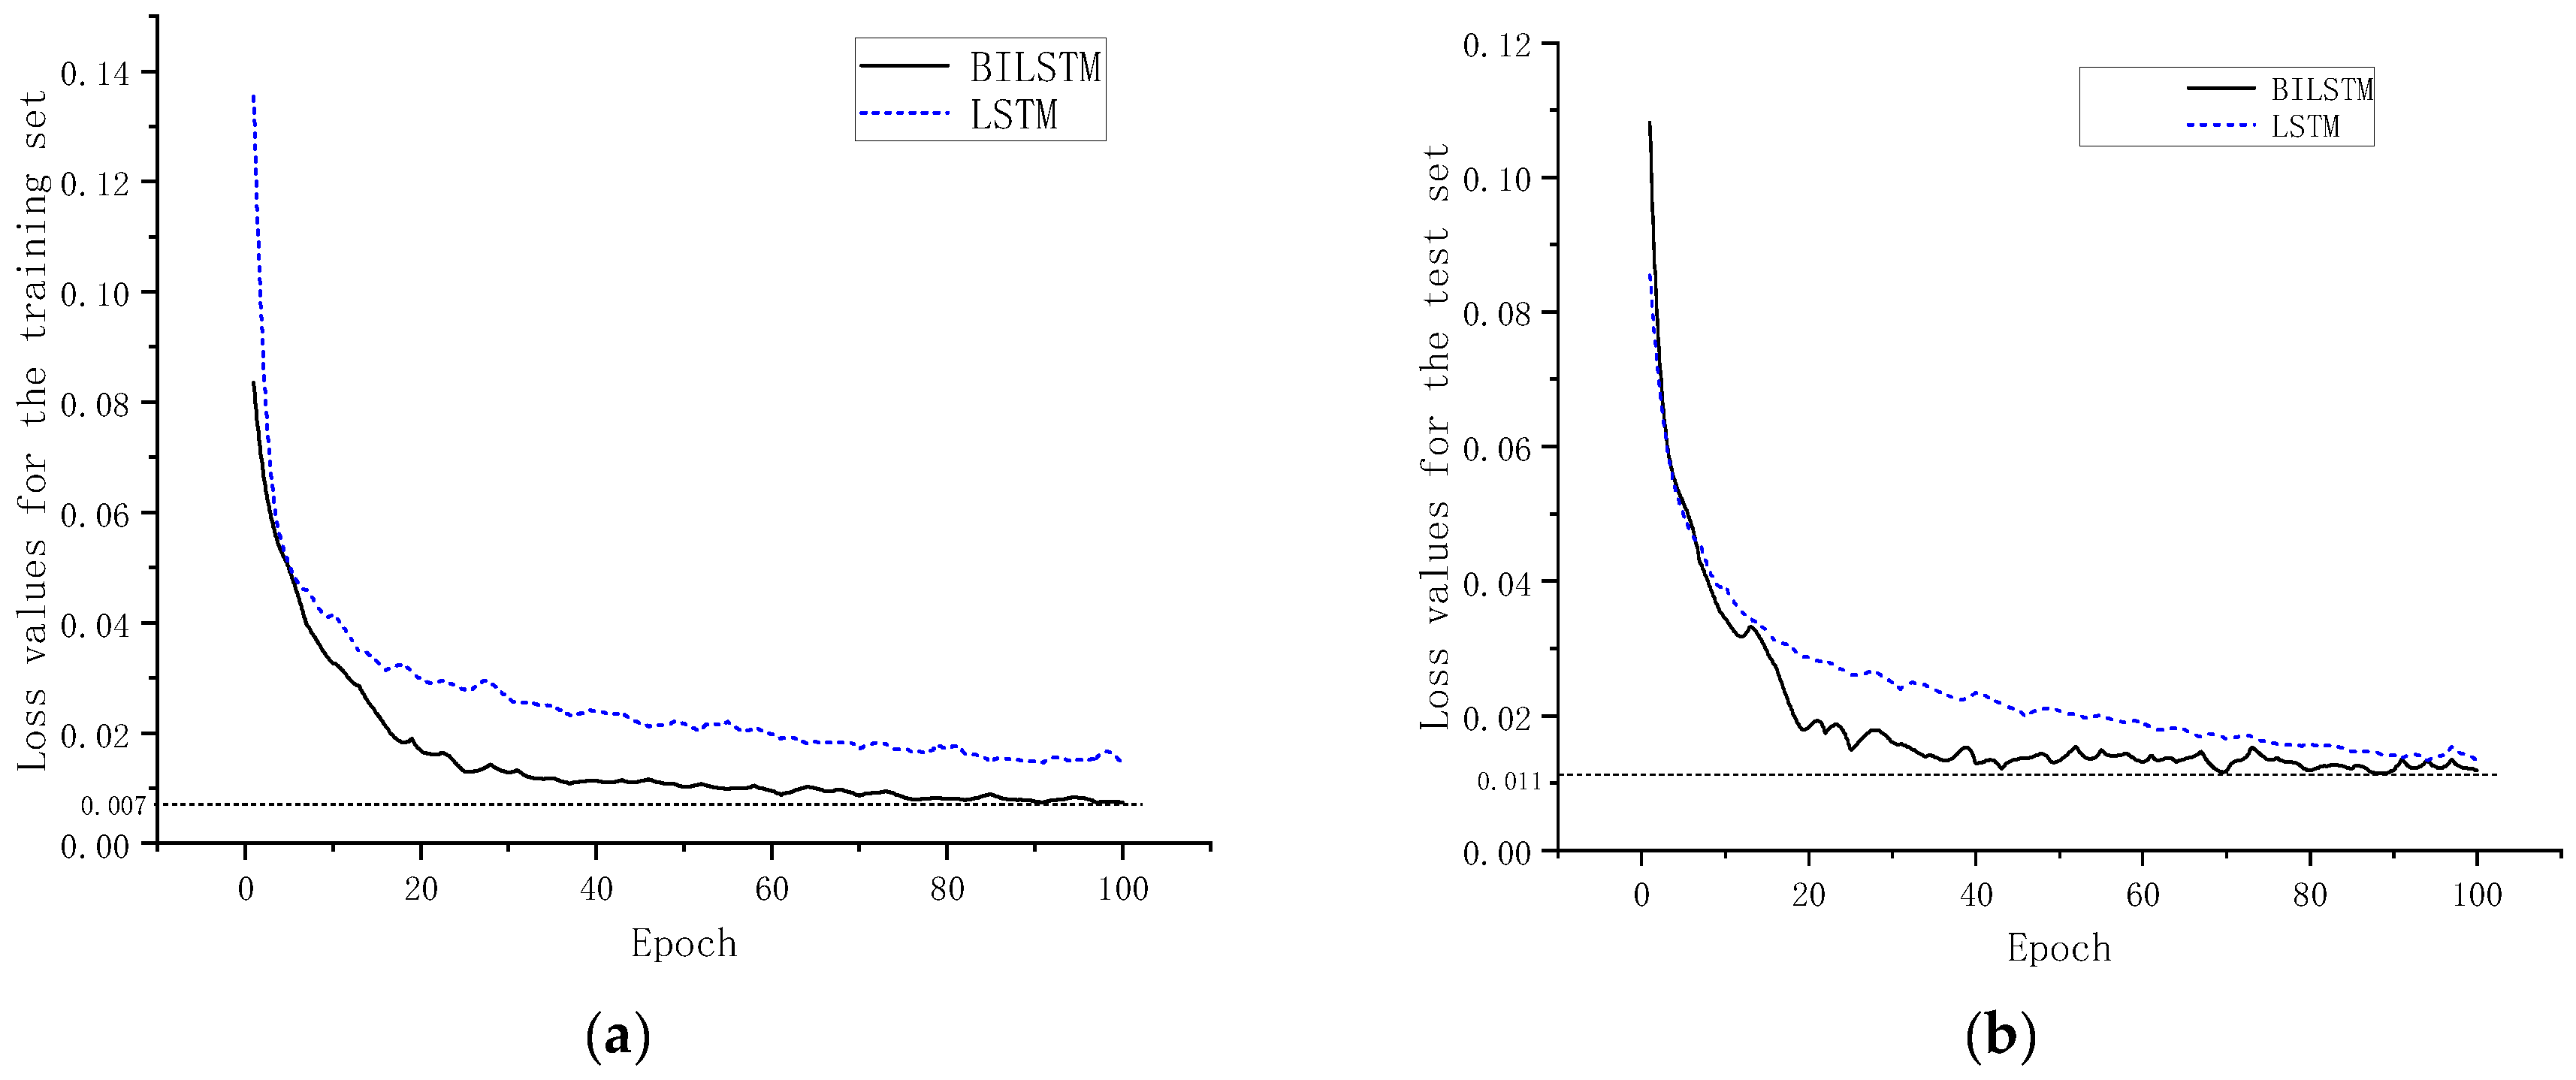
3.2.2. Evaluation of the LSTM and BILSTM Models
4. Results and Discussion
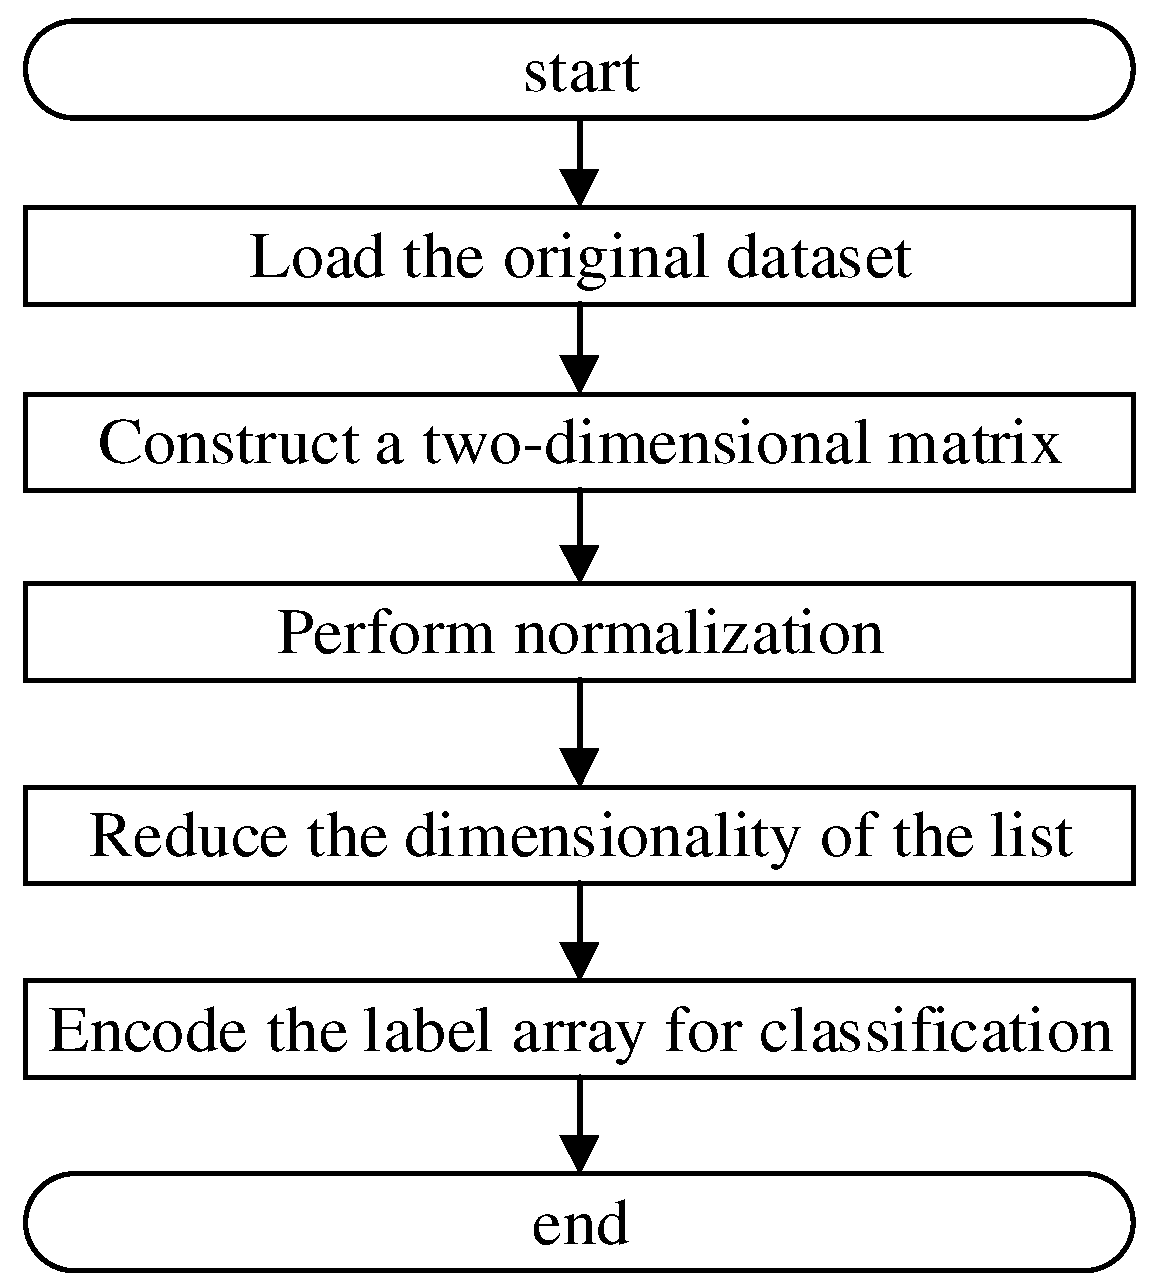
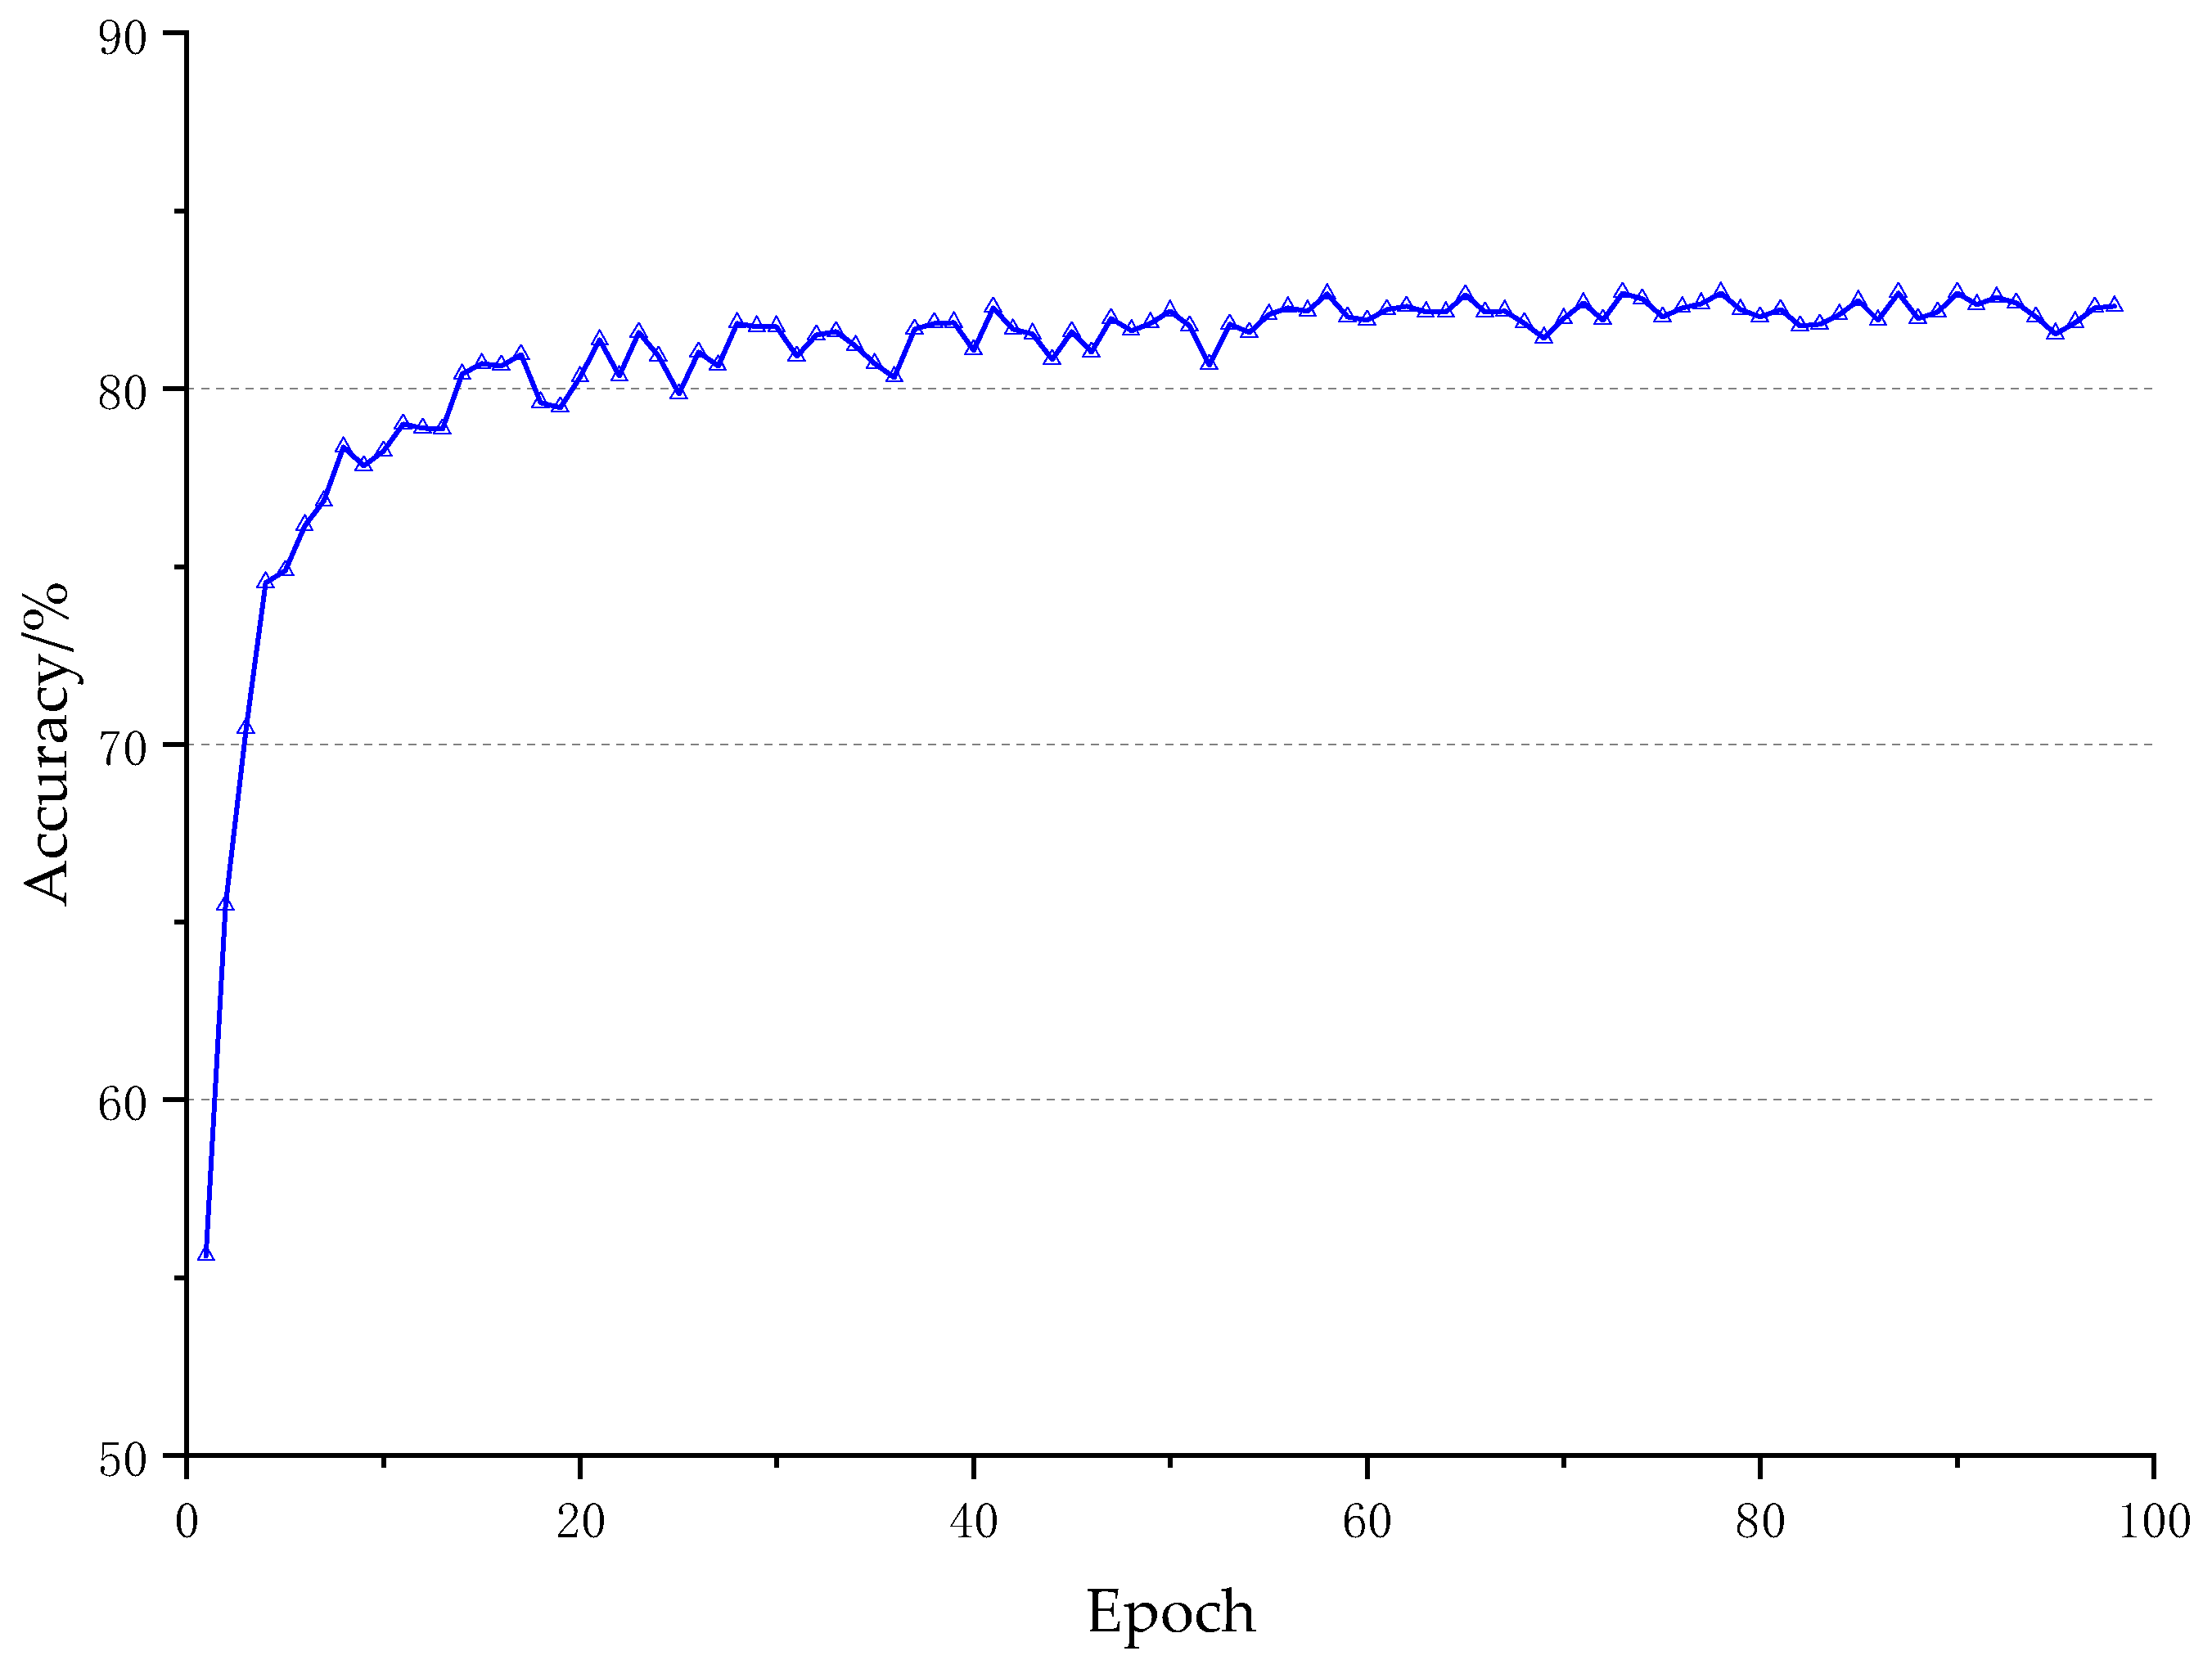
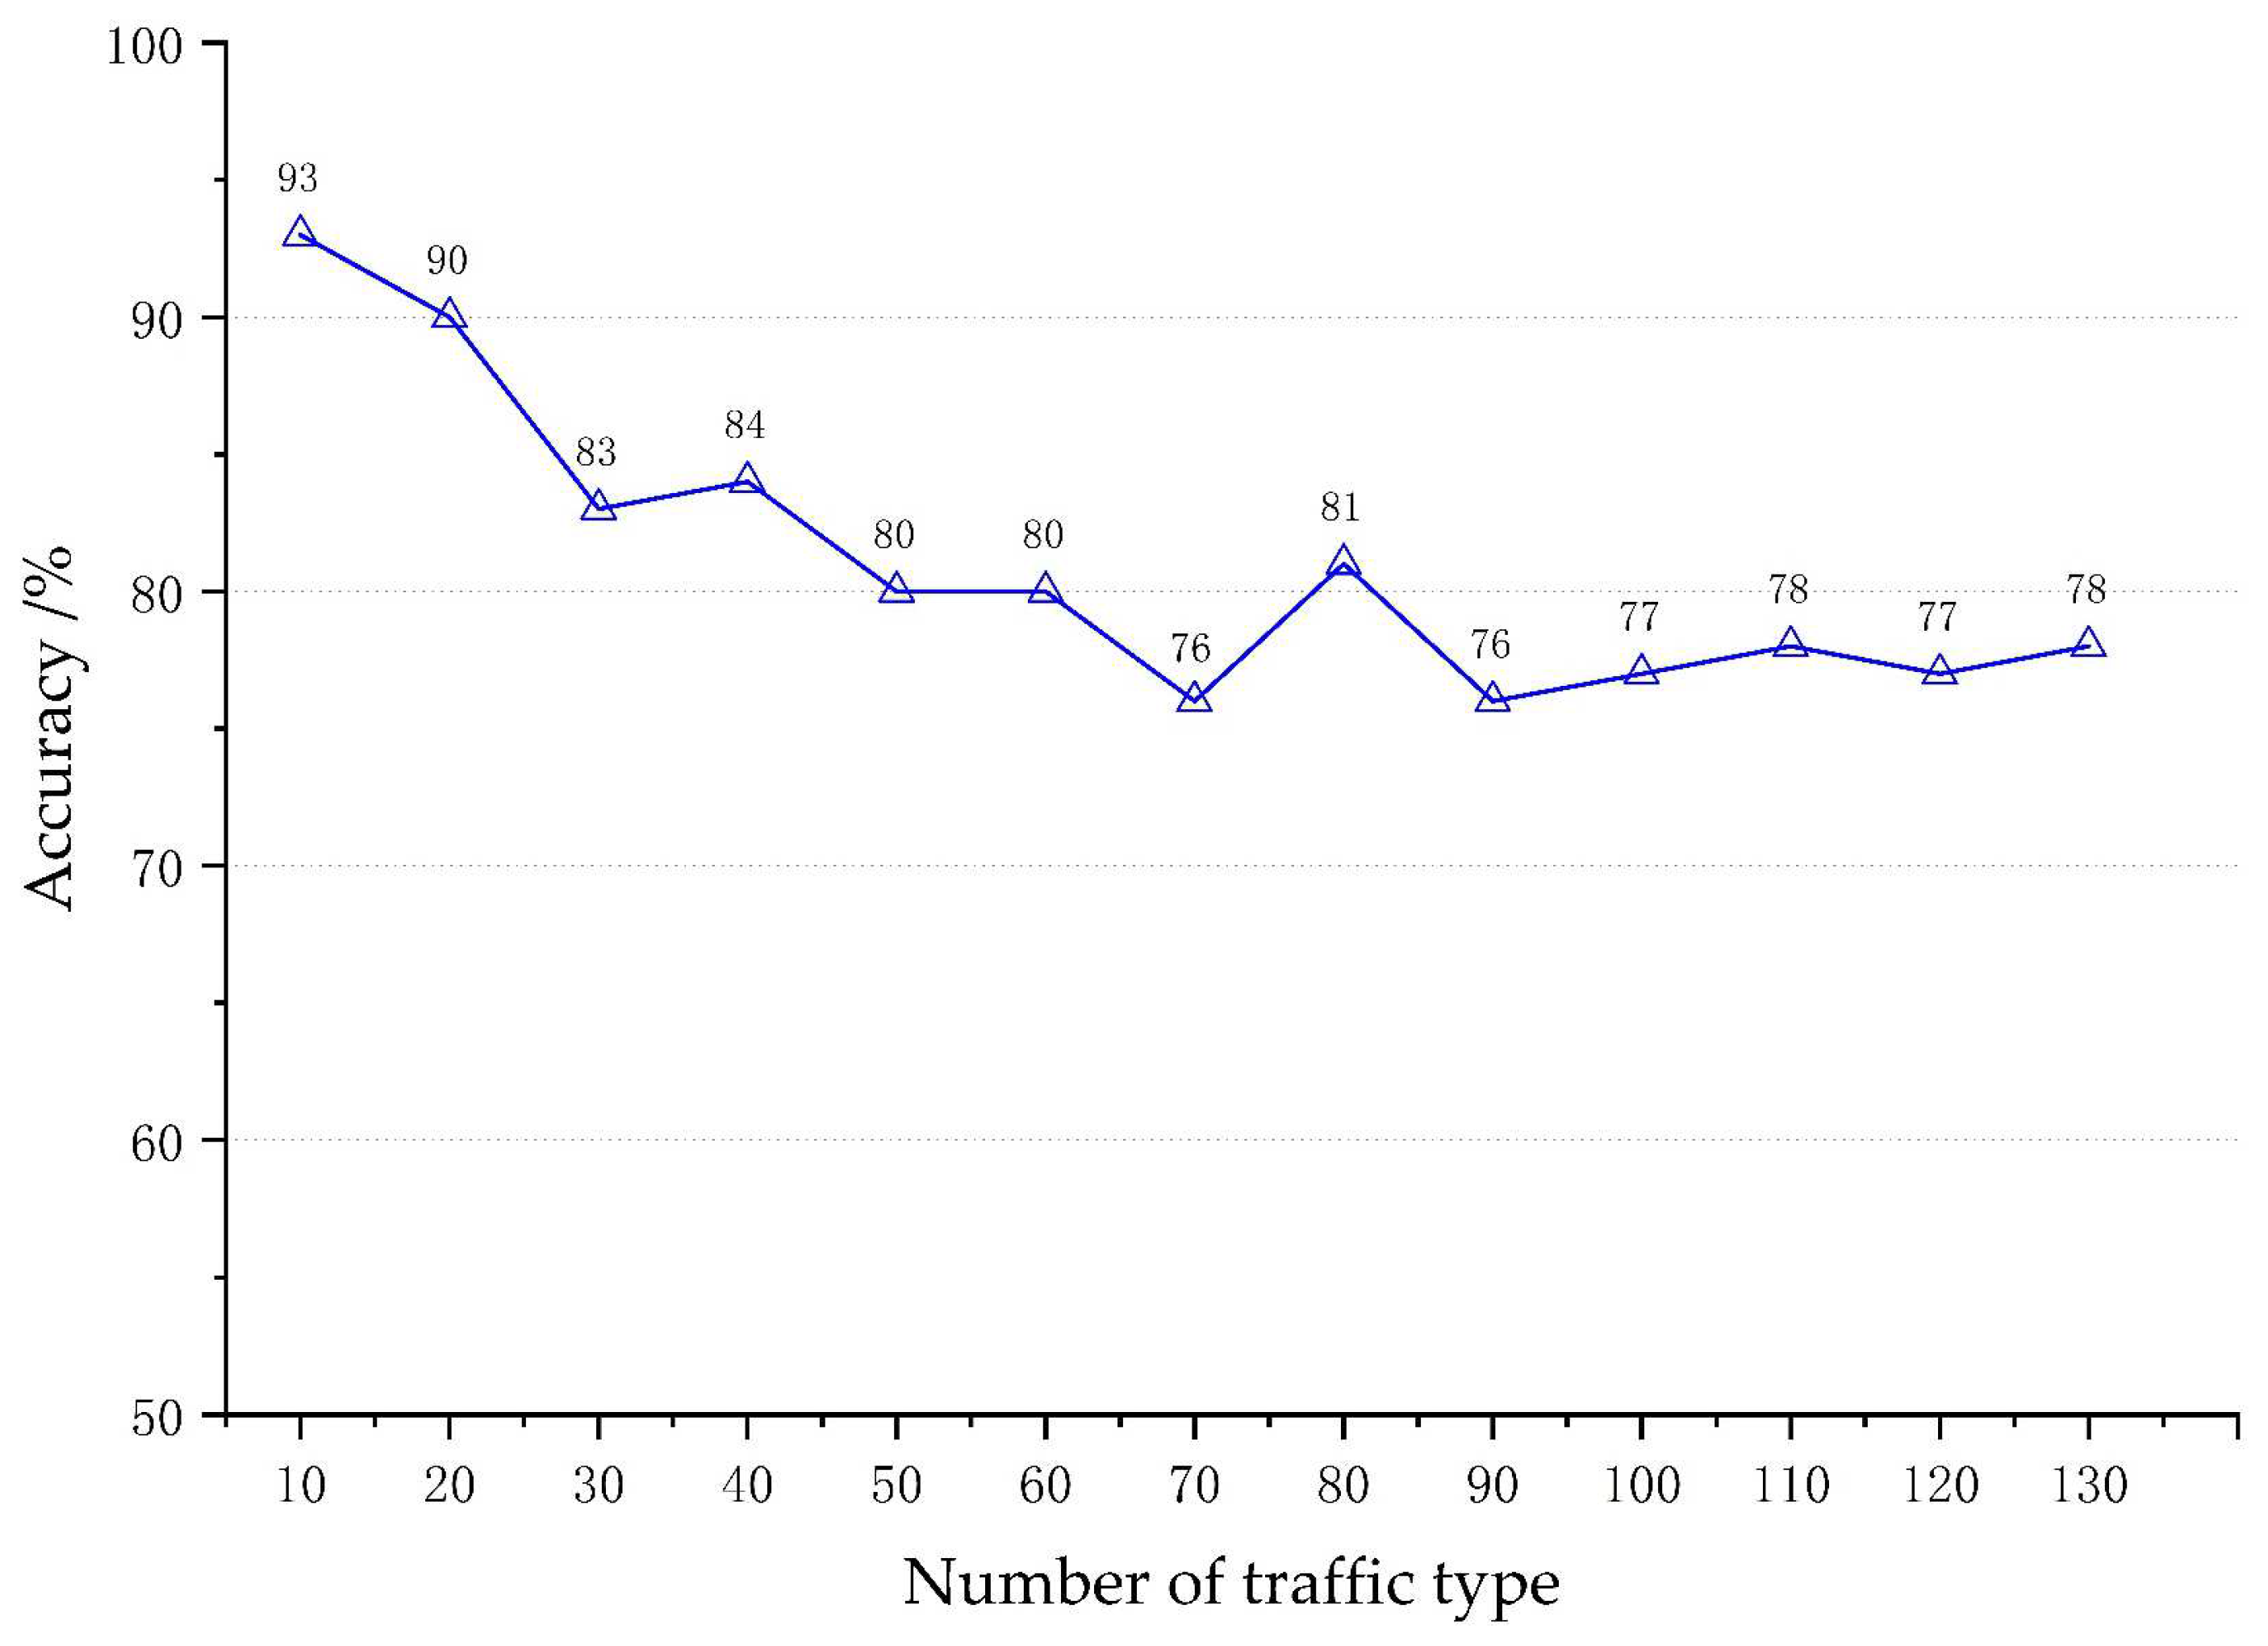
4.1. Classification of Grid Services Based on 1D CNN
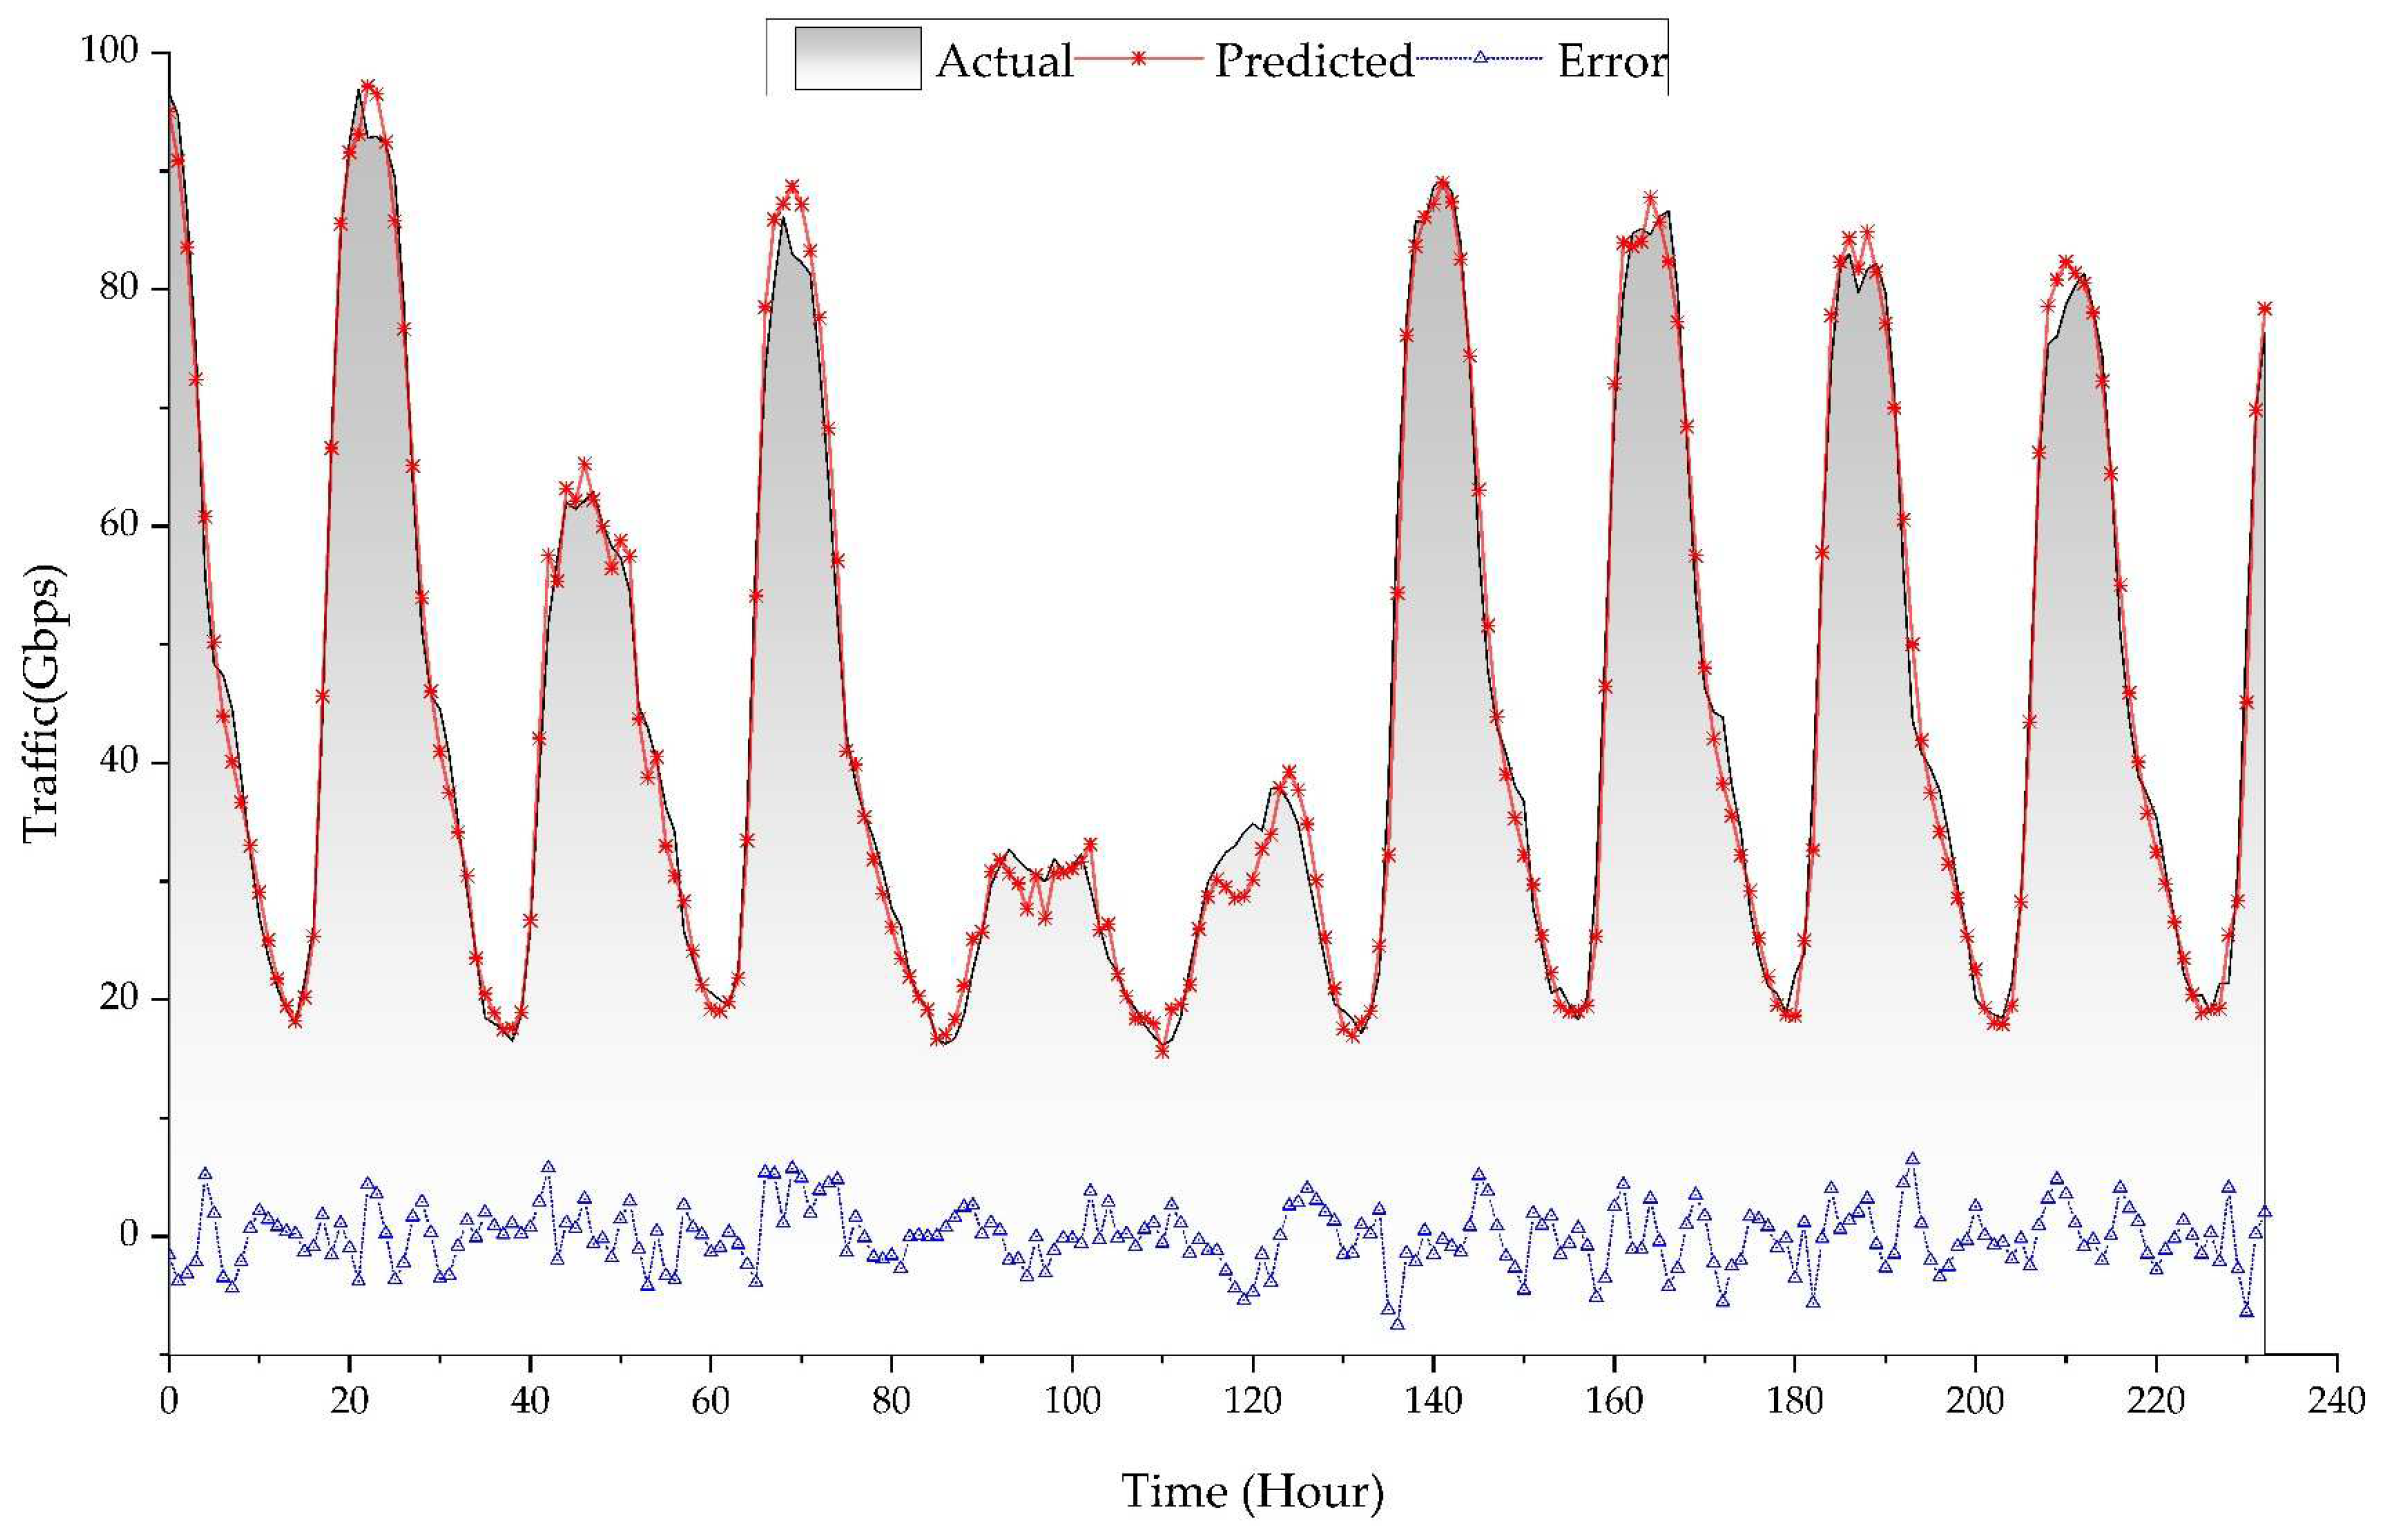
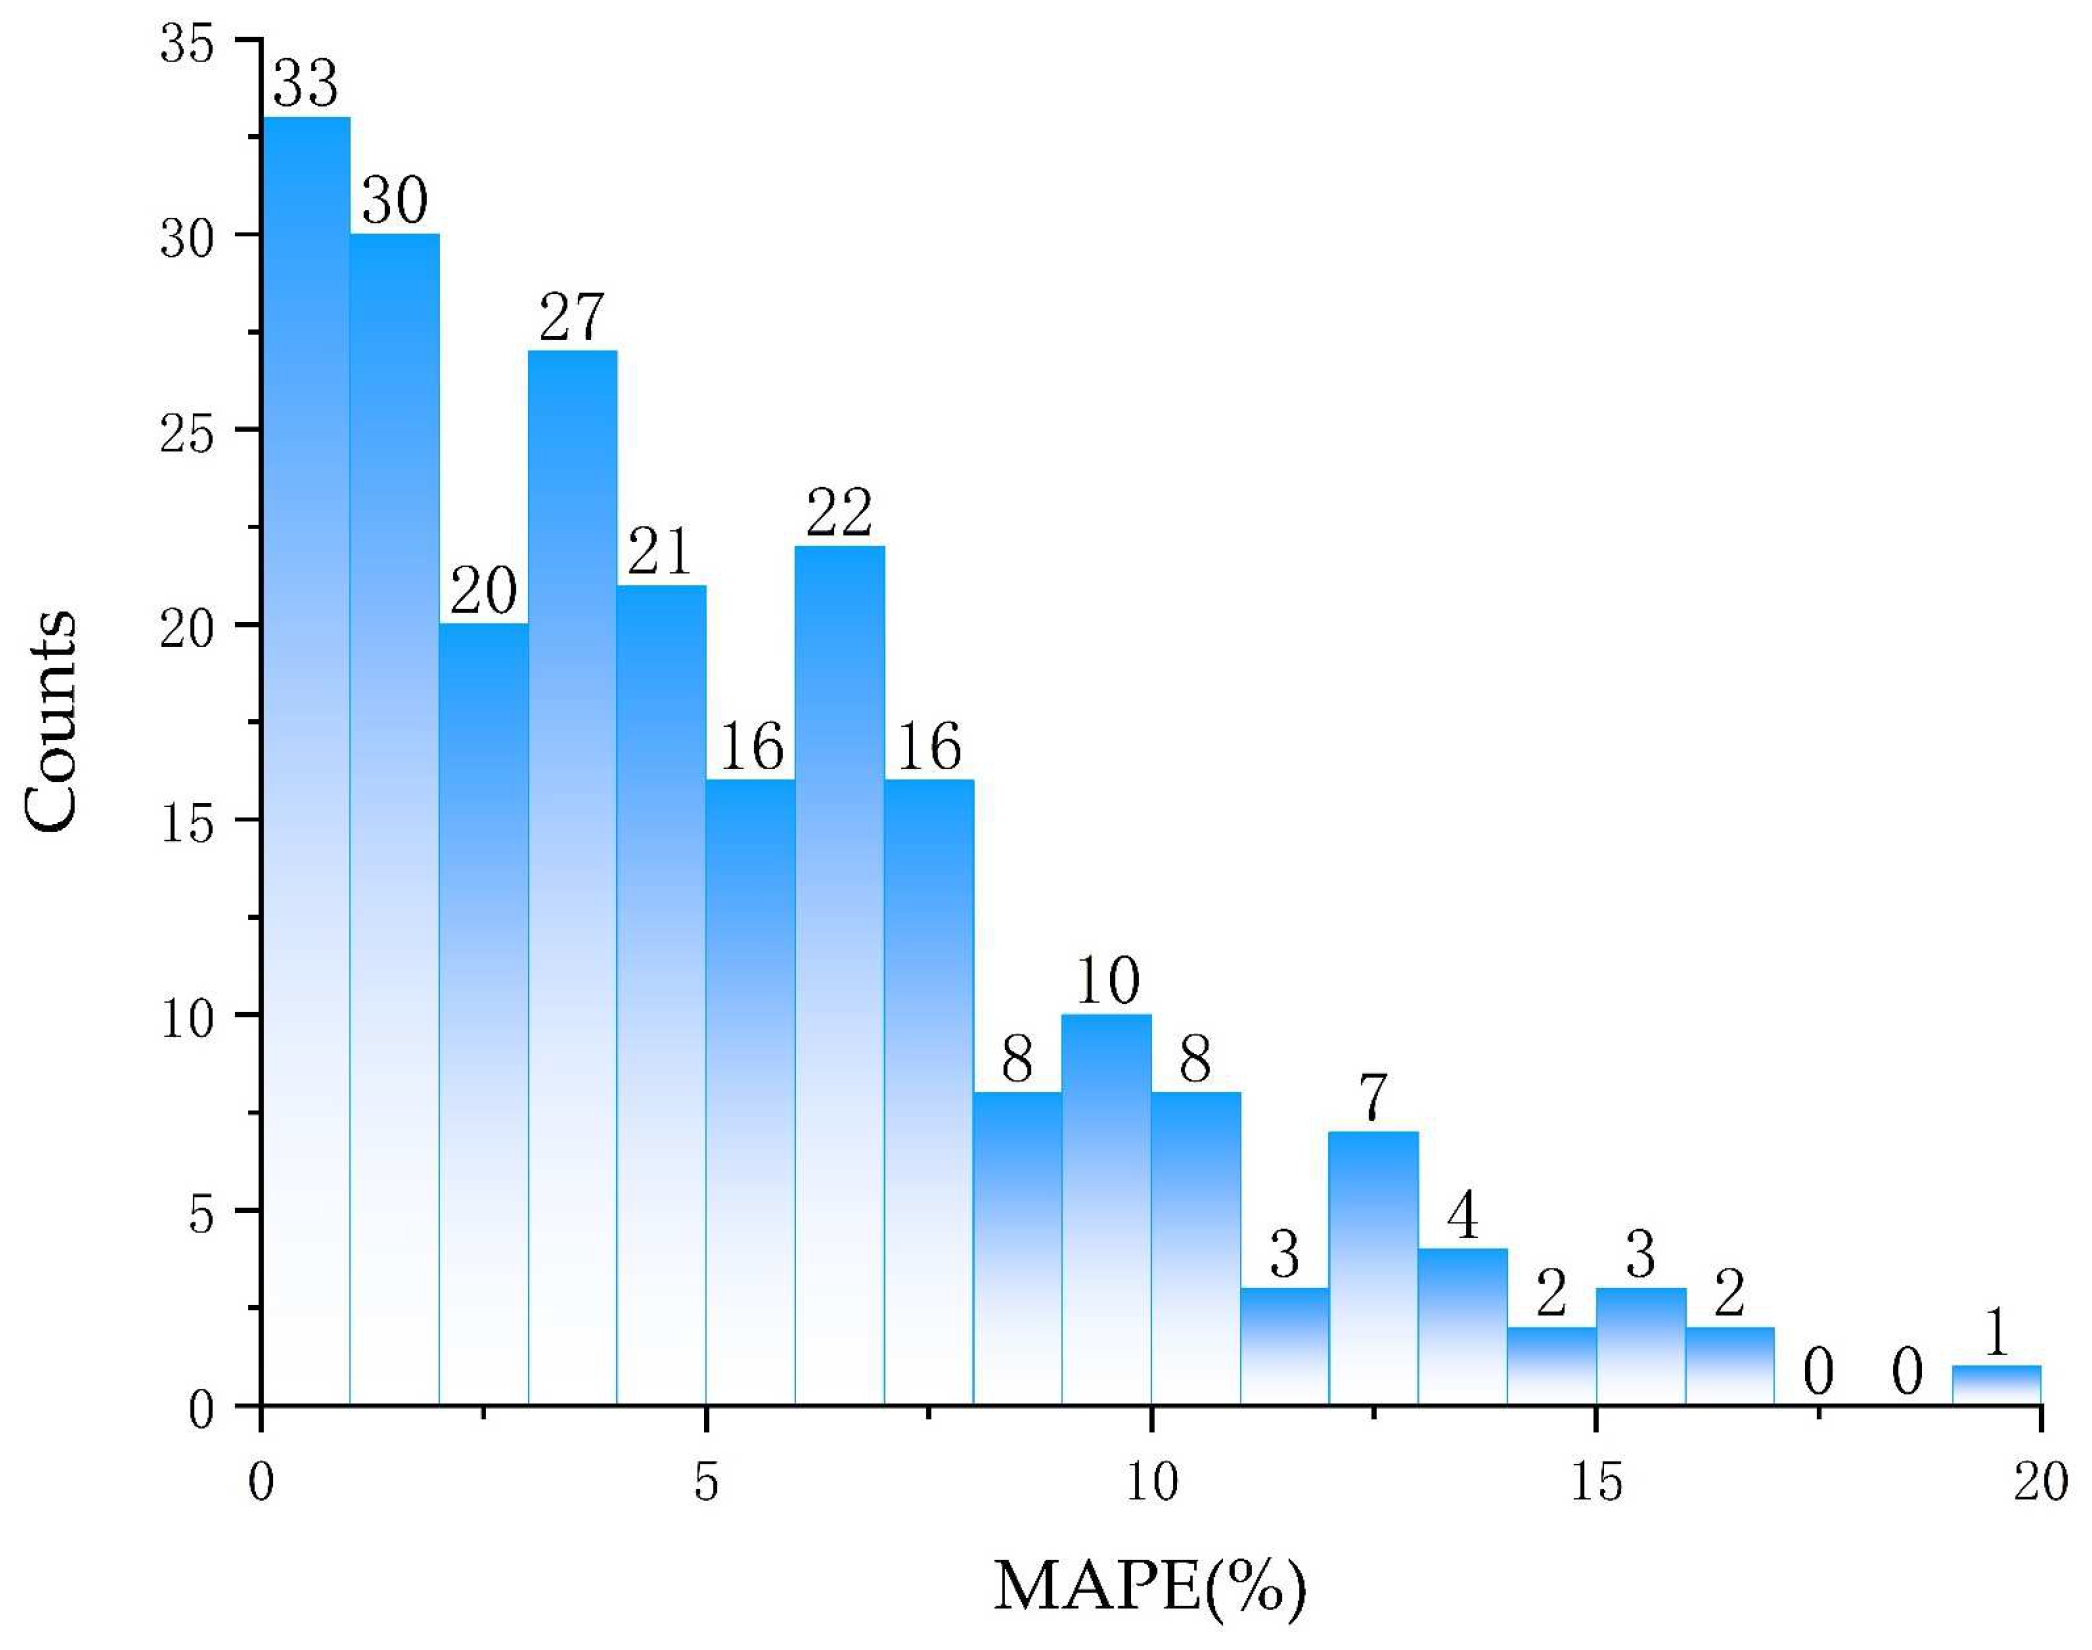
4.2. Grid Service Traffic Prediction Based on LSTM
5. Conclusions
Author Contributions
Funding
Data Availability Statement
Conflicts of Interest
Abbreviations
| Acronym | Definition |
| 1D CNN | One-Dimensional Convolutional Neural Network |
| 5G | 5th Generation Mobile Networks |
| BILSTM | Bidirectional Long Short-Term Memory Neural Network |
| CNN | Convolutional Neural Network |
| DC | Data Centre |
| eMBB | Enhanced Mobile Broadband |
| FA | Feeder Automation |
| ISP | Internet Source Providers |
| LSTM | Long Short-Term Memory Neural Network |
| MAPE | Mean Absolute Percentage Error |
| mMTC | Massive Machine Type Communication |
| NFV | Network Functions Virtualization |
| SDN | Software Defined Network |
| SLA | Service level Agreement |
| uRLLC | Ultra-Reliable and Low-Latency Communication |
References
- Zhang, S. An Overview of Network Slicing for 5G. IEEE Wirel. Commun. 2019, 26, 111–117. [Google Scholar] [CrossRef]
- Ordonez-Lucena, J.; Ameigeiras, P.; Lopez, D.; Ramos-Munoz, J.J.; Lorca, J.; Folgueira, J. Network Slicing for 5G with SDN/NFV: Concepts, Architectures, and Challenges. IEEE Commun. Mag. 2017, 55, 80–87. [Google Scholar] [CrossRef]
- Zhang, Q.; Li, Y.; Zhang, Z.; Xie, P.; Guo, Q.; Guo, X. Exploration and application of 5G network slice in electric power. In Proceedings of the 2021 IEEE 4th Advanced Information Management, Communicates, Electronic and Automation Control Conference (IMCEC), Chongqing, China, 18–20 June 2021. [Google Scholar]
- Hegde, P.; Meena, S.M. A survey on 5G Network Slicing-Epitome and opportunities for a novice. In Proceedings of the 2021 12th International Conference on Computing Communication and Networking Technologies (ICCCNT), Kharagpur, India, 6–8 July 2021. [Google Scholar]
- Li, W.; Wu, Z.; Zhang, P. Research on 5G Network Slicing for Digital Power Grid. In Proceedings of the 2020 IEEE 3rd International Conference on Electronic Information and Communication Technology (ICEICT), Shenzhen, China, 13–15 November 2020. [Google Scholar]
- Bera, S.; Misra, S.; Rodrigues, J.J.P.C. Cloud Computing Applications for Smart Grid: A Survey. IEEE Trans. Parallel Distrib. Syst. 2015, 26, 1477–1494. [Google Scholar] [CrossRef]
- Minh, Q.N.; Nguyen, V.-H.; Quy, V.K.; Ngoc, L.A.; Chehri, A.; Jeon, G. Edge Computing for IoT-Enabled Smart Grid: The Future of Energy. Energies 2022, 15, 6140. [Google Scholar] [CrossRef]
- Shi, W.; Cao, J.; Zhang, Q.; Li, Y.; Xu, L. Edge computing: Vision and challenges. IEEE Internet Things J. 2016, 3, 637–646. [Google Scholar] [CrossRef]
- Pan, J.; McElhannon, J. Future edge cloud and edge computing for Internet of Things applications. IEEE Internet Things J. 2018, 5, 439–449. [Google Scholar] [CrossRef]
- Peng, D.; Yuying, X.; Yun, S.; Huibin, D. Research on the Application of 5G Cloud-network-edge-device Convergence and Intelligent Video Technology in Smart Grid. In Proceedings of the 2021 International Wireless Communications and Mobile Computing (IWCMC), Harbin, China, 28 June–2 July 2021. [Google Scholar]
- Cárdenas, R.; Arroba, P.; Risco-Martín, J.L.; Moya, J.M. Modeling and simulation of smart grid-aware edge computing federations. Clust. Comput. 2023, 26, 719–743. [Google Scholar] [CrossRef]
- Bouzidi, E.H.; Outtagarts, A.; Hebbar, A.; Langar, R.; Boutaba, R. Online based learning for predictive end-to-end network slicing in 5G networks. In Proceedings of the ICC 2020—2020 IEEE International Conference on Communications (ICC), Dublin, Ireland, 7–11 June 2020. [Google Scholar]
- Liu, R.; Hai, X.; Du, S.; Zeng, L.; Bai, J.; Liu, J. Application of 5G network slicing technology in smart grid. In Proceedings of the 2021 IEEE 2nd International Conference on Big Data, Artificial Intelligence and Internet of Things Engineering (ICBAIE), Nanchang, China, 26–28 March 2020. [Google Scholar]
- Su, R.; Zhang, D.; Venkatesan, R.; Gong, Z.; Li, C.; Ding, F.; Jiang, F.; Zhu, Z. Resource Allocation for Network Slicing in 5G Telecommunication Networks: A Survey of Principles and Models. IEEE Netw. 2019, 33, 172–179. [Google Scholar] [CrossRef]
- Wang, Q.; Hou, W.; Zhou, J.; Du, J.; Shao, W.; Zheng, W. Research on Layout Strategy of 5G Network Slice in Power Scenarios. In Proceedings of the 2021 IEEE 4th Advanced Information Management, Communicates, Electronic and Automation Control Conference (IMCEC), Chongqing, China, 18–20 June 2021. [Google Scholar]
- Kaur, K.; Garg, S.; Kaddoum, G.; Ahmed, S.H.; Gagnon, F.; Atiquzzaman, M. Demand-Response Management Using a Fleet of Electric Vehicles: An Opportunistic-SDN-Based Edge-Cloud Framework for Smart Grids. IEEE Netw. 2019, 33, 46–53. [Google Scholar] [CrossRef]
- Fu, Y.; Wang, S.; Wang, C.X.; Hong, X.; McLaughlin, S. Artificial Intelligence to Manage Network Traffic of 5G Wireless Networks. IEEE Netw. 2018, 32, 58–64. [Google Scholar] [CrossRef]
- Tahaei, H.; Afifi, F.; Asemi, A.; Zaki, F.; Anuar, N.B. The rise of traffic classification in IoT networks: A survey. J. Netw. Comput. Appl. 2020, 154, 102538. [Google Scholar] [CrossRef]
- Nuaimi, M.; Fourati, L.C.; Hamed, B.B. Intelligent approaches toward intrusion detection systems for Industrial Internet of Things: A systematic comprehensive review. J. Netw. Comput. Appl. 2023, 215, 103637. [Google Scholar] [CrossRef]
- Sun, R.; Li, D.; Liang, S.; Ding, T.; Srikant, R. The Global Landscape of Neural Networks: An Overview. IEEE Signal Proc. Mag. 2020, 37, 95–108. [Google Scholar] [CrossRef]
- Mahmood, A.; Beltramelli, L.; Abedin, S.F.; Zeb, S. Industrial IoT in 5G-and-Beyond Networks: Vision, Architecture, and Design Trends. IEEE Trans. Ind. Inform. 2022, 18, 4122–4137. [Google Scholar] [CrossRef]
- Elaydi, H. Review of Control Technology on Smart Grid. In Proceedings of the International Conference on Electric Power Engineering—Palestine (ICEPE-P), Gaza, Palestine, 23–24 March 2021. [Google Scholar]
- Mollah, M.B.; Zhao, J.; Niyato, D.; Lam, K.Y. Blockchain for Future Smart Grid: A Comprehensive Survey. IEEE Internet Things J. 2021, 8, 18–43. [Google Scholar] [CrossRef]
- Chen, J.; Chen, W.; Tao, F.; Lin, C. Industrial IoT in 5G environment towards smart manufacturing. J. Ind. Inf. Integr. 2018, 10, 10–19. [Google Scholar]
- Chergui, H.; Verikoukis, C. Big Data for 5G Intelligent Network Slicing Management. IEEE Netw. 2020, 34, 56–61. [Google Scholar] [CrossRef]
- Kaloxylos, A. A Survey and an Analysis of Network Slicing in 5G Networks. IEEE Commun. Stand. Mag. 2018, 2, 60–65. [Google Scholar] [CrossRef]
- Wen, J.; Sheng, M.; Li, J.; Huang, K. Assisting Intelligent Wireless Networks with Traffic Prediction: Exploring and Exploiting Predictive Causality in Wireless Traffic. IEEE Commun. Mag. 2020, 58, 26–31. [Google Scholar] [CrossRef]
- Hermawan, A.P.; Ginanjar, R.R.; Kim, D.S.; Lee, J.M. CNN-Based Automatic Modulation Classification for Beyond 5G Communications. IEEE Commun. Lett. 2020, 24, 1038–1041. [Google Scholar] [CrossRef]
- Selvaraju, R.R.; Cogswell, M.; Das, A.; Vedantam, R.; Parikh, D.; Batra, D. Grad-CAM: Visual Explanations from Deep Networks via Gradient-Based Localization. In Proceedings of the 2017 IEEE International Conference on Computer Vision (ICCV), Venice, Italy, 22–29 October 2017; pp. 618–626. [Google Scholar]
- Wan, L.; Zeiler, M.; Zhang, S.; LeCun, Y.; Fergus, R. Regularization of Neural Networks Using Dropconnect. In Proceedings of the 30th International Conference on International Conference on Machine Learning, Atlanta, GA, USA, 16–21 June 2013; Volume 28, pp. 1058–1066. [Google Scholar]
- Sun, Q.K.; Wang, X.J.; Zhang, Y.Z.; Zhang, F.; Zhang, P.; Gao, W. Multiple load prediction of integrated energy system based on long short-term memory and multitask learning. Autom. Electr. Power Syst. 2021, 45, 63–70. [Google Scholar]
- Cortez, P.; Rio, M.; Rocha, M.; Sousa, P. Multi-scale internet traffic forecasting using neural networks and time series methods. Expert Syst. 2012, 29, 143–155. [Google Scholar] [CrossRef]
- Arzo, S.T.; Akhavan, Z.; Esmaeili, M.; Devetsikiotis, M.; Granelli, F. Multi-Agent-Based Traffic Prediction and Traffic Classification for Autonomic Network Management Systems for Future Networks. Future Internet 2022, 14, 230. [Google Scholar] [CrossRef]


| Production Region | Traffic Category | Electric Power Service | Communication Requirements | NS | Hierarchical Classification | |
|---|---|---|---|---|---|---|
| Delay | Bandwidth | |||||
| I | Control category | Distribution network differential protection | ≤10 ms | <2 Mbps | uRLLC | Delay-critical |
| Distribution automation | ≤100 ms | <10 Mbps | Delay-general | |||
| II | Collection category | Power information collection | <3 s | 10 kbps | mMTC | Connection- critical |
| Application category | Mobile operation | ≤300 ms | ≥4 Mbps | eMBB | Bandwidth- general | |
| Robot inspection | ≤300 ms | 20~100 Mbps | Bandwidth- critical | |||
| FILTER | Accuracy/% | |
|---|---|---|
| 128 | 256 | 82.72 |
| 512 | 1024 | 82.68 |
| 256 | 512 | 82.34 |
| 64 | 128 | 81.42 |
| 128 | 128 | 79.09 |
| 256 | 256 | 77.93 |
| 32 | 64 | 78.49 |
| 64 | 64 | 77.32 |
| Number of Training Sets | Number of Test Sets | Average Accuracy/% |
|---|---|---|
| 10 | 20 | 44.71 |
| 20 | 20 | 58.88 |
| 30 | 20 | 66.31 |
| 40 | 20 | 68.67 |
| 50 | 20 | 73.19 |
| 60 | 20 | 75.26 |
| 70 | 20 | 75.35 |
| 80 | 20 | 77.86 |
| Length/h | MAPE/% |
|---|---|
| 5 | 9.18 |
| 10 | 6.32 |
| 30 | 8.58 |
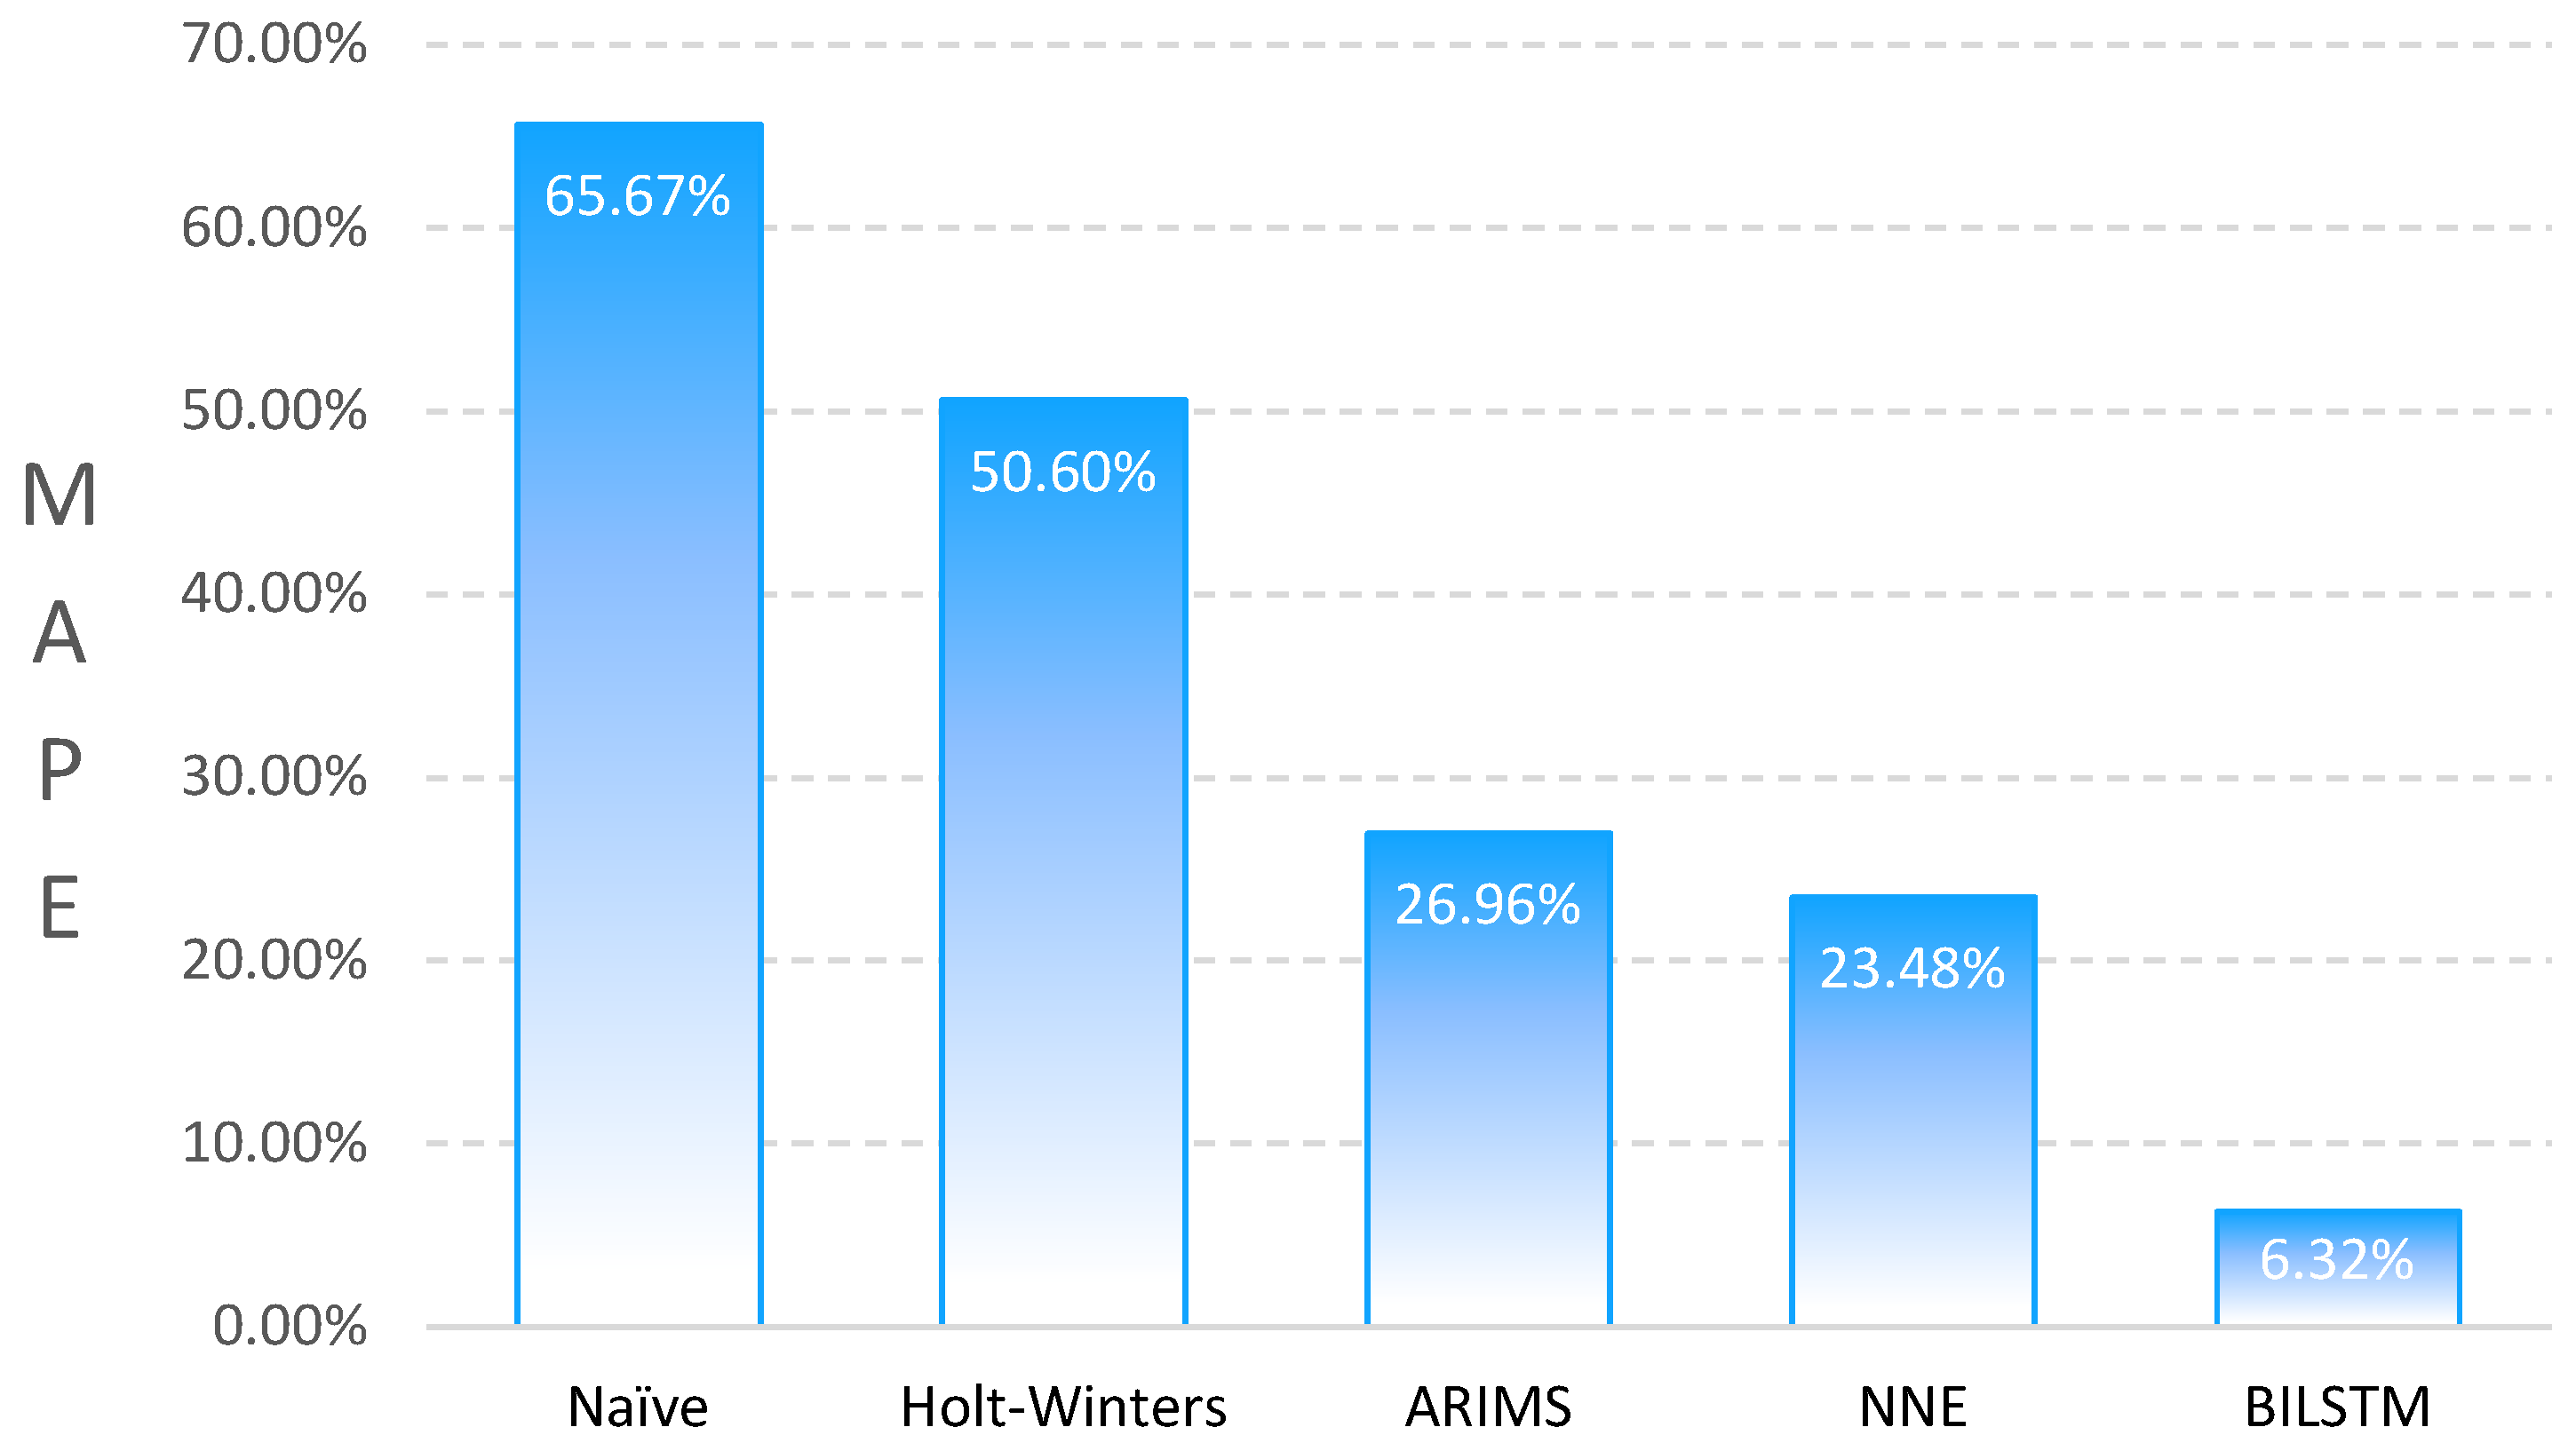
| Method | Naïve | Holt-Winters | ARIMS | NNE | BILSTM |
|---|---|---|---|---|---|
| MAPE | 65.67% | 50.60% | 26.96% | 23.48 ± 0.49% | 6.32% |
Disclaimer/Publisher’s Note: The statements, opinions and data contained in all publications are solely those of the individual author(s) and contributor(s) and not of MDPI and/or the editor(s). MDPI and/or the editor(s) disclaim responsibility for any injury to people or property resulting from any ideas, methods, instructions or products referred to in the content. |
© 2023 by the authors. Licensee MDPI, Basel, Switzerland. This article is an open access article distributed under the terms and conditions of the Creative Commons Attribution (CC BY) license (https://creativecommons.org/licenses/by/4.0/).
Share and Cite
Hu, Y.; Gong, L.; Li, X.; Li, H.; Zhang, R.; Gu, R. A Carrying Method for 5G Network Slicing in Smart Grid Communication Services Based on Neural Network. Future Internet 2023, 15, 247. https://doi.org/10.3390/fi15070247
Hu Y, Gong L, Li X, Li H, Zhang R, Gu R. A Carrying Method for 5G Network Slicing in Smart Grid Communication Services Based on Neural Network. Future Internet. 2023; 15(7):247. https://doi.org/10.3390/fi15070247
Chicago/Turabian StyleHu, Yang, Liangliang Gong, Xinyang Li, Hui Li, Ruoxin Zhang, and Rentao Gu. 2023. "A Carrying Method for 5G Network Slicing in Smart Grid Communication Services Based on Neural Network" Future Internet 15, no. 7: 247. https://doi.org/10.3390/fi15070247
APA StyleHu, Y., Gong, L., Li, X., Li, H., Zhang, R., & Gu, R. (2023). A Carrying Method for 5G Network Slicing in Smart Grid Communication Services Based on Neural Network. Future Internet, 15(7), 247. https://doi.org/10.3390/fi15070247