You are currently viewing a new version of our website. To view the old version click .
Future Internet
  • Editor’s Choice
  • Article
  • Open Access

16 July 2023

Machine Learning for Network Intrusion Detection—A Comparative Study

,
and
School of Engineering, Texas A&M International University, Laredo, TX 78041, USA
*
Author to whom correspondence should be addressed.
This article belongs to the Special Issue Anomaly Detection in Modern Networks

Abstract

Modern society has quickly evolved to utilize communication and data-sharing media with the advent of the internet and electronic technologies. However, these technologies have created new opportunities for attackers to gain access to confidential electronic resources. As a result, data breaches have significantly impacted our society in multiple ways. To mitigate this situation, researchers have developed multiple security countermeasure techniques known as Network Intrusion Detection Systems (NIDS). Despite these techniques, attackers have developed new strategies to gain unauthorized access to resources. In this work, we propose using machine learning (ML) to develop a NIDS system capable of detecting modern attack types with a very high detection rate. To this end, we implement and evaluate several ML algorithms and compare their effectiveness using a state-of-the-art dataset containing modern attack types. The results show that the random forest model outperforms other models, with a detection rate of modern network attacks of 97 percent. This study shows that not only is accurate prediction possible but also a high detection rate of attacks can be achieved. These results indicate that ML has the potential to create very effective NIDS systems.

1. Introduction

Modern network systems face a substantial cybersecurity problem in the form of malicious intruders [1]. Intruders can be real users or software that break into the resources of organizations. Intruders can gain access to resources via several strategies, such as unauthorized logins or illegally obtaining access rights, while software intruders can exist in the form of viruses, worms, or ransomware. Many other types of attacks also exist. Undetected intrusion can have significant impacts on governments and businesses. As such, malicious intrusion can jeopardize national security, cause financial losses and data breaches, and damage businesses’ reputations. These consequences pose a significant challenge to society.
A Network Intrusion Detection System (NIDS) is a software program or device that monitors network traffic and categorizes it as normal or malicious [2]. It then alerts users or invokes appropriate security measures. Cybersecurity researchers have proposed and used many NIDS systems in the past couple of decades [2,3,4]. The two main types of NIDSs that exist are anomaly detection and misuse detection [5]. Commercial IDSs use misuse detection when an intruder gains access to resources but misuses their privileges. Anomaly detection involves collecting data on the behavior of legitimate users over time. Statistical tests are then applied to the observed behavior to determine, with a high level of confidence, whether this behavior is illegitimate user behavior. Anomaly detection approaches to intrusion detection have been subjected to extensive research but have not gained popularity yet.
Despite the scientific advances in NIDS, attackers have developed more advanced and sophisticated attack types to bypass NIDS countermeasures. The significant increase in the number and variety of attacks has pushed security scientists to create better NIDS systems. Recently, many researchers have investigated a new NIDS approach based on machine learning (ML) (e.g., [6,7,8,9,10,11,12]). ML techniques use data and algorithms to simulate human learning. Many ML approaches use datasets such as DARPA, KDD CUP ’99, and NSL-KDD. However, these datasets are relatively old and do not represent modern attack types. Consequently, the approaches that use such datasets cannot be relied on to detect modern attack types.
This paper discusses the results of a research project that aims to develop a robust and effective NIDS system capable of detecting modern types of attacks using ML techniques. To achieve this goal, we take the following steps.
  • We use the CICIDS-2017 dataset, which contains frequent attacks that resemble real-world network traffic.
  • We then implement four ML algorithms (random forest (RF), linear support vector machine (LSVM), Gaussian Naive Bayes (GNB), and logistic regression (LG)) to classify and predict abnormal activities.
  • We perform a comparative study to evaluate the performance of these ML algorithms and evaluate their models using state-of-the-art methods based on different evaluation criteria.
The CICIDS-2017 dataset suffers from the class imbalance problem, which causes ML models to be biased towards majority classes [13]. To tackle the class imbalance problem of the CICIDS-2017 dataset, we utilized an attack grouping technique and the Synthetic Minority Oversampling Technique (SMOTE) [14]. The results showed that the RF model with SMOTE outperformed other models in its ability to predict most types of modern network attacks accurately and precisely, with a recall macro score of 97 percent. This number indicates that the RF model is highly capable of accurately categorizing normal traffic while also very rarely missing any actual intrusions. This is what NIDS systems strive to achieve.
The paper is structured as follows. Section 3 discusses the related work and how it differs from our work. Section 4 provides background information and an overview of the ML techniques and the dataset used in this study. Section 5 describes the methodology followed to implement and evaluate the different ML algorithms. Section 6 presents the results of the study and compares the algorithms based on different evaluation criteria. Finally, Section 7 concludes the paper and points out some future work.

2. The CICIDS-2017 Dataset

The Canadian Institute of Cybersecurity’s data are used in this research to train ML models to detect different attacks, specifically the CICIDS-2017 dataset [15]. The dataset consists of eight files that contain simulated network traffic captured over five days. Table 1 shows the different files and the types of traffic (benign or security attacks) captured during this period. The dataset contains 3,119,345 samples with 78 features that belong to 15 classes.
Table 1. The CICIDS-2017 dataset files and their traffic content.
The 15 different classes and the number of samples belonging to each are listed in Table 2. This dataset was chosen because it contains information on up-to-date attacks that are common in modern networks, unlike the outdated datasets used in other studies. The attacks in this dataset are classified into brute force FTP, brute force SSH, DoS, heartbleed, web, infiltration, botnet, and DDoS attacks based on the 2016 McAfee Report. These attacks are not found in any of the previously published datasets [16]. Furthermore, the dataset fulfills all the criteria of a true intrusion detection dataset [15,17], including a complete network configuration, complete traffic, a labeled dataset, complete interaction, complete capture, available protocols, attack diversity, heterogeneity, a feature set, and metadata. Table 3 provides a complete list of features that meet these criteria.
Table 2. The classes of the CICIDS-2017 dataset and their distributions.
Table 3. The features and the network parameters of the CICIDS-2017 dataset.
The uneven distribution of classes in the CICIDS-2017 dataset shows the class imbalance problem [13], which is common in many machine learning problems, such as network intrusion detection, medical diagnosis, and fraud detection. In datasets with class imbalance, most samples are classified as one class, while fewer samples are classified as other classes whose accurate detection by machine learning is more significant. The training of machine learning algorithms using datasets suffering from the class imbalance problem creates models that are biased towards majority classes. This is because the classifiers tend to place less emphasis on learning minority classes and become overwhelmed by majority classes.
The class imbalance problem in the CICIDS-2017 dataset is one of the main problems when using this dataset. There is a tendency for models to become biased towards benign traffic, since there are significantly more benign traffic samples (over 2 million) compared to attacks (e.g., Bot and Heartbleed attacks are only seen in 36 and 11 samples, respectively). However, an IDS requires attack detection not to be biased towards detecting benign traffic. Consequently, any machine learning approach using the CICIDS-2017 dataset should address the class imbalance problem to detect attacks precisely.

4. Background

4.1. Machine Learning

In traditional computer programming, the computer takes data and produces an output. In machine learning (ML), this process is reversed. The computer learns from already known input and output data to create a model (program) that can subsequently predict the output based on new input. ML is a rapidly growing industry that has found its way into everyday life. For example, ML is used when online websites personalize advertisements or on social media sites such as Facebook to detect people in images. ML algorithms work by generalizing known data in a process known as supervised learning. There are two types of ML algorithms: supervised learning and unsupervised learning. This paper focuses on the use of supervised learning.

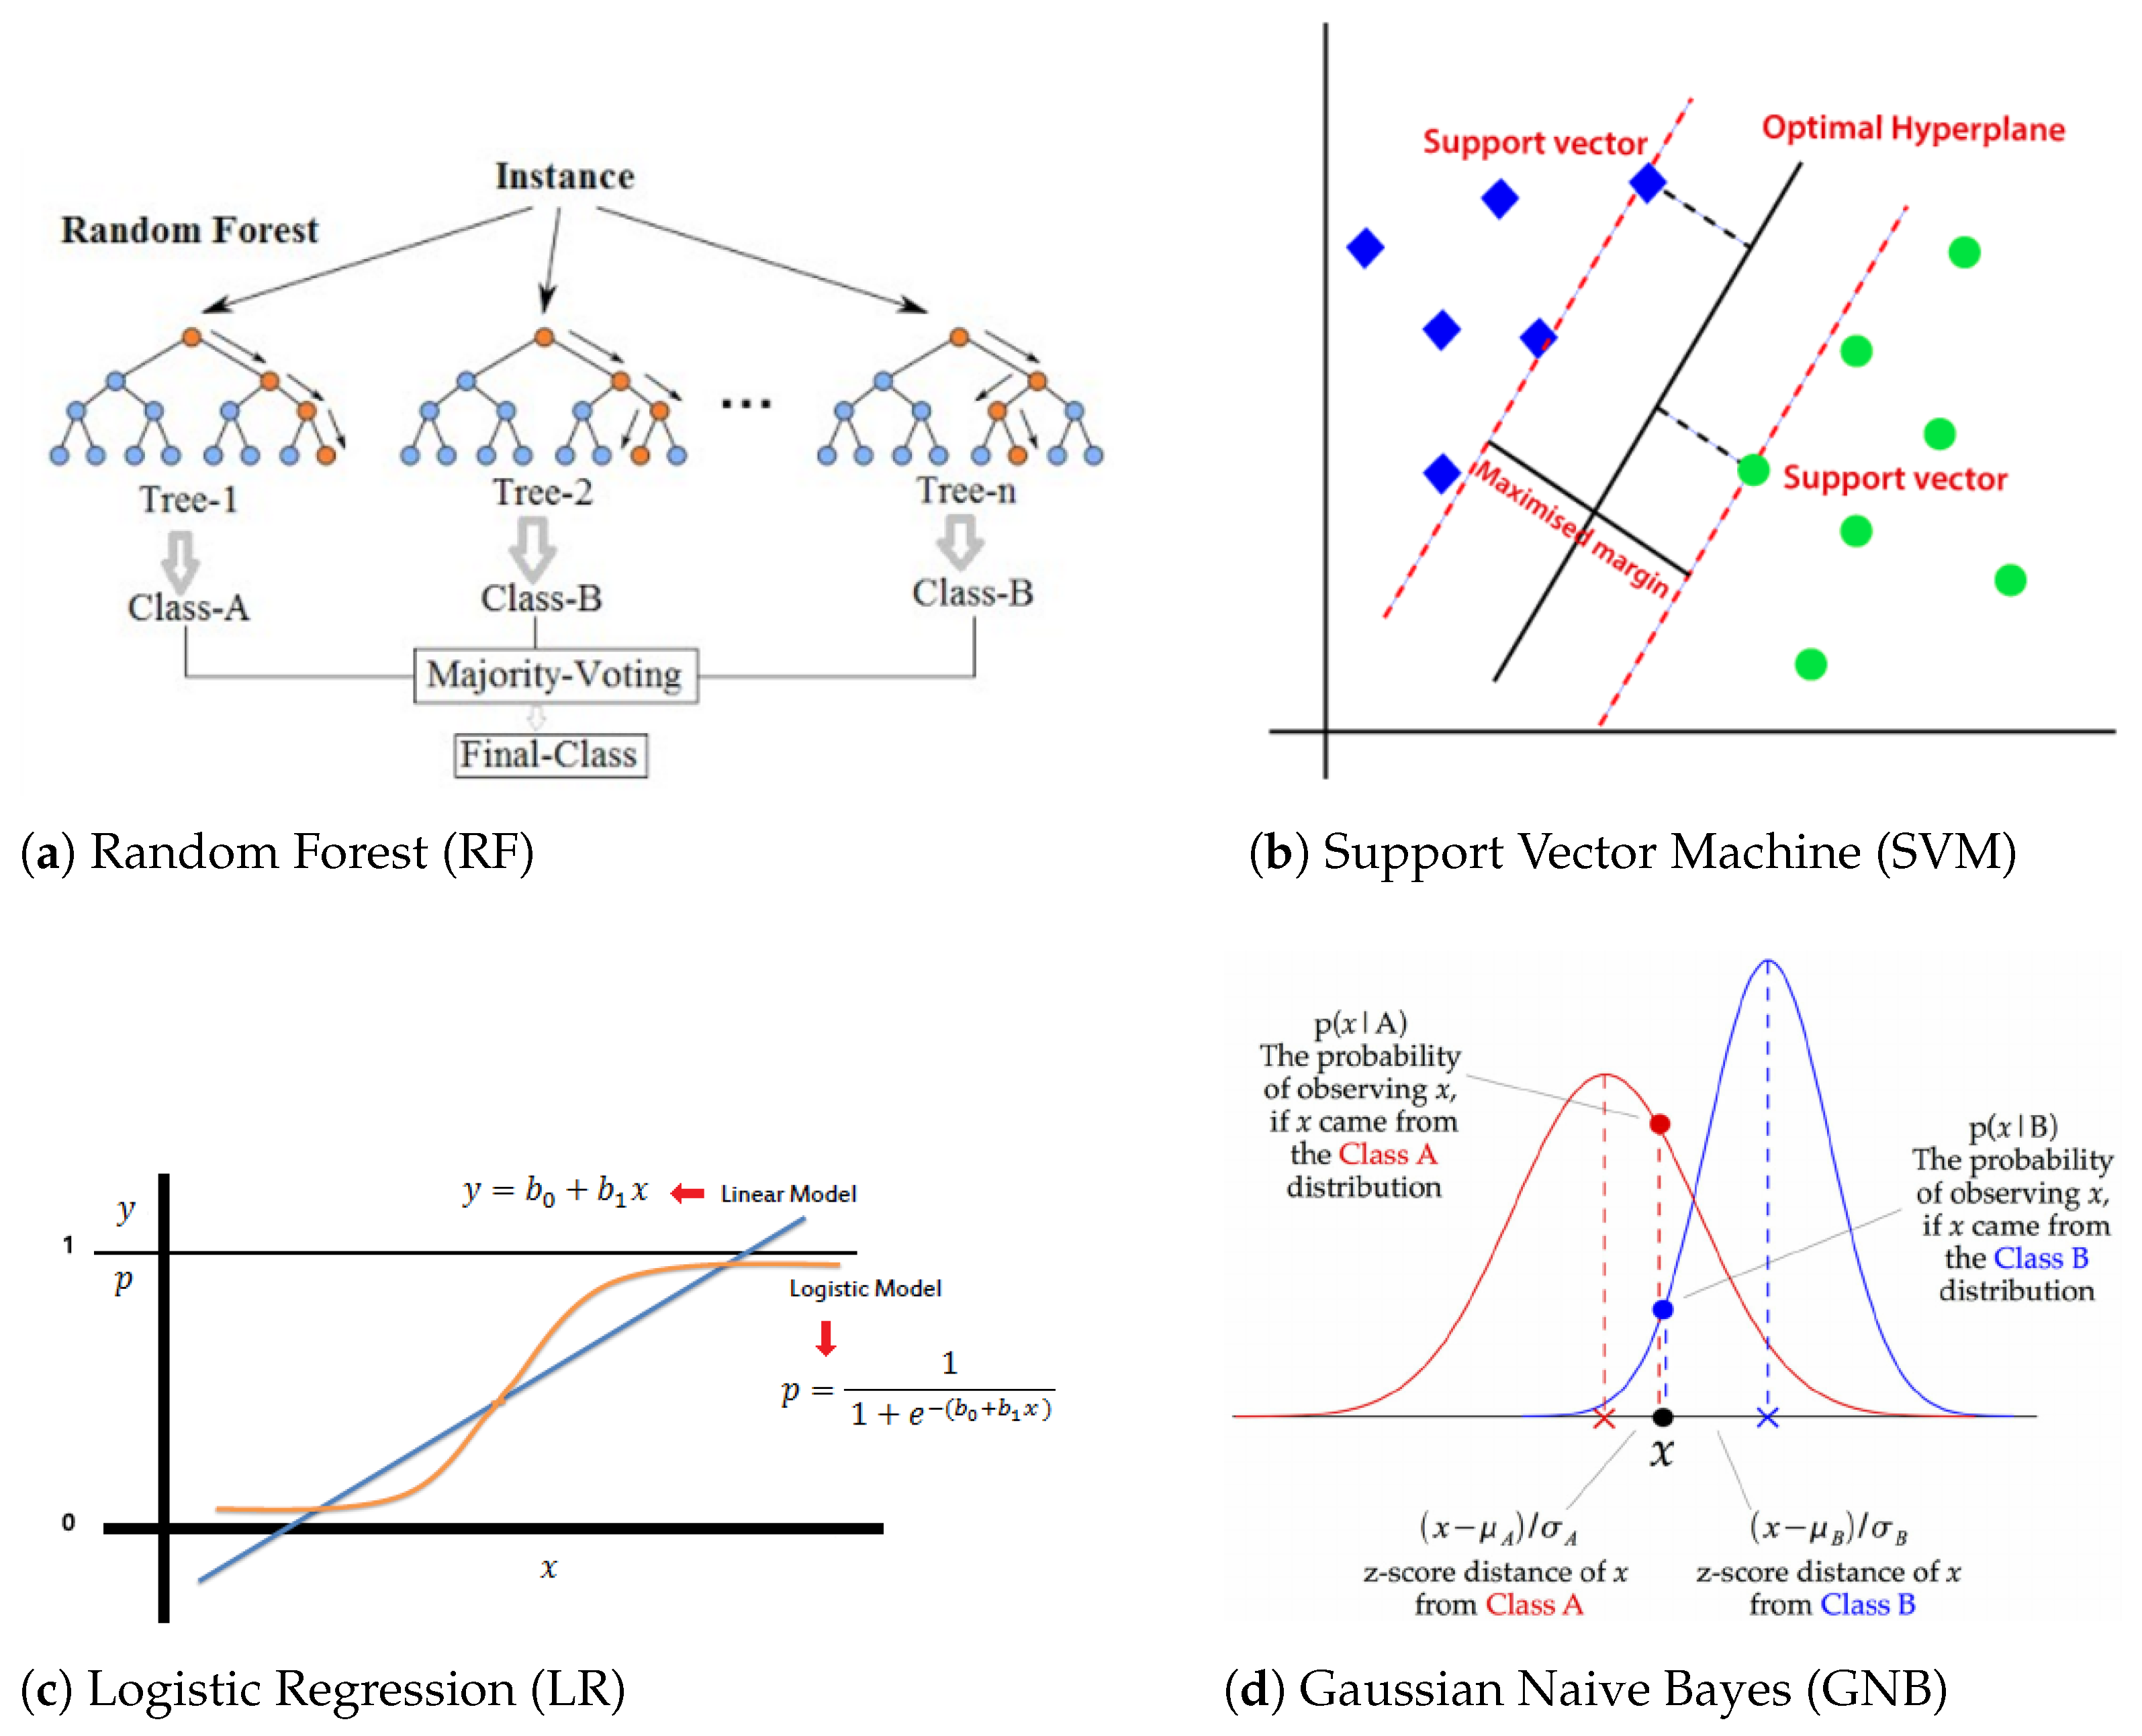
4.2. Algorithms and Techniques

This section gives brief overviews of the four ML algorithms used in this work (see Figure 1 for their graphical representations).
Figure 1. Graphical representations of used ML algorithms.

4.2.1. Random Forest

The random forest (RF) algorithm consists of multiple decision trees. Each of these trees generates a prediction. Then, the algorithm uses these predictions to develop a decision based on the majority of the predicted values. The advantages of RF include its ability to be used for both classification and regression problems, not requiring scaling, and the ability to handle outliers. Disadvantages include that this algorithm requires a lot of computational power because it deals with many decision trees, and subsequently, they take longer to train models.

4.2.2. Linear Support Vector Machine

Linear support vector machine (LSVM) is one of the most used supervised ML algorithms. It can be used for regression, binary classification, and multi-class classification problems. An LSVM algorithm works by using the proximity between samples. In a high-dimensional space, LSVM divides the samples by class and then creates a line between them (hyperplane). The algorithm determines how far each sample is from the line; these points are called support vectors. They help to create a model of the line, which is the prediction. The distance between the samples and the hyperplane is called the margin. The goal is to obtain the best hyperbola with the largest margin between the hyperplane and the support vectors. LSVM is a good algorithm in terms of memory efficiency, but it has some drawbacks. One of its disadvantages is that it does not perform well in large and noisy datasets; only small and clean data frames benefit from this algorithm.

4.2.3. Gaussian Naive Bayes

Bayesian classifiers are statistical classifiers. They are able to forecast the probability that the given model fits a particular class. Gaussian Naive Bayes (GNB) is a type of Naive Bayes algorithm that is based on Bayes’s theorem. The hypothesis that these algorithms are based on is that, for a given class, the attribute value is independent of the values of the attributes. This theory is called class-conditional independence.
It is mostly used for datasets with continuous data. This algorithm assumes that classes follow a Gaussian distribution. A Gaussian distribution, or normal distribution, can be analyzed by the following formula. Some of the advantages of using GNB are that it is a quick algorithm to train, is suitable for datasets with many classes, and is primarily used for categorical problems. The main disadvantage is that this algorithm treats every feature independently, which does not always happen in real life. This makes the algorithm less suitable for real-world cases.

4.2.4. Logistic Regression

Logistic regression (LR) is a binary classification method that uses a probability function to measure the probability of an event taking place. It uses the following formula to calculate the probability. Some of the advantages include that can perform rapid classification and is easy to extend to a multi-class problem. The main disadvantage is that nonlinear problems cannot be solved using LR.

4.2.5. Synthetic Minority Oversampling

The Synthetic Minority Oversampling Technique (SMOTE) is a technique for oversampling [14]. For datasets with imbalance problems, oversampling is used to increase the number of samples. SMOTE selects samples from a specific class and draws a line between them. Then, by selecting a location along the line generated by the preceding samples, a new sample is created.

4.2.6. Bayesian Optimization
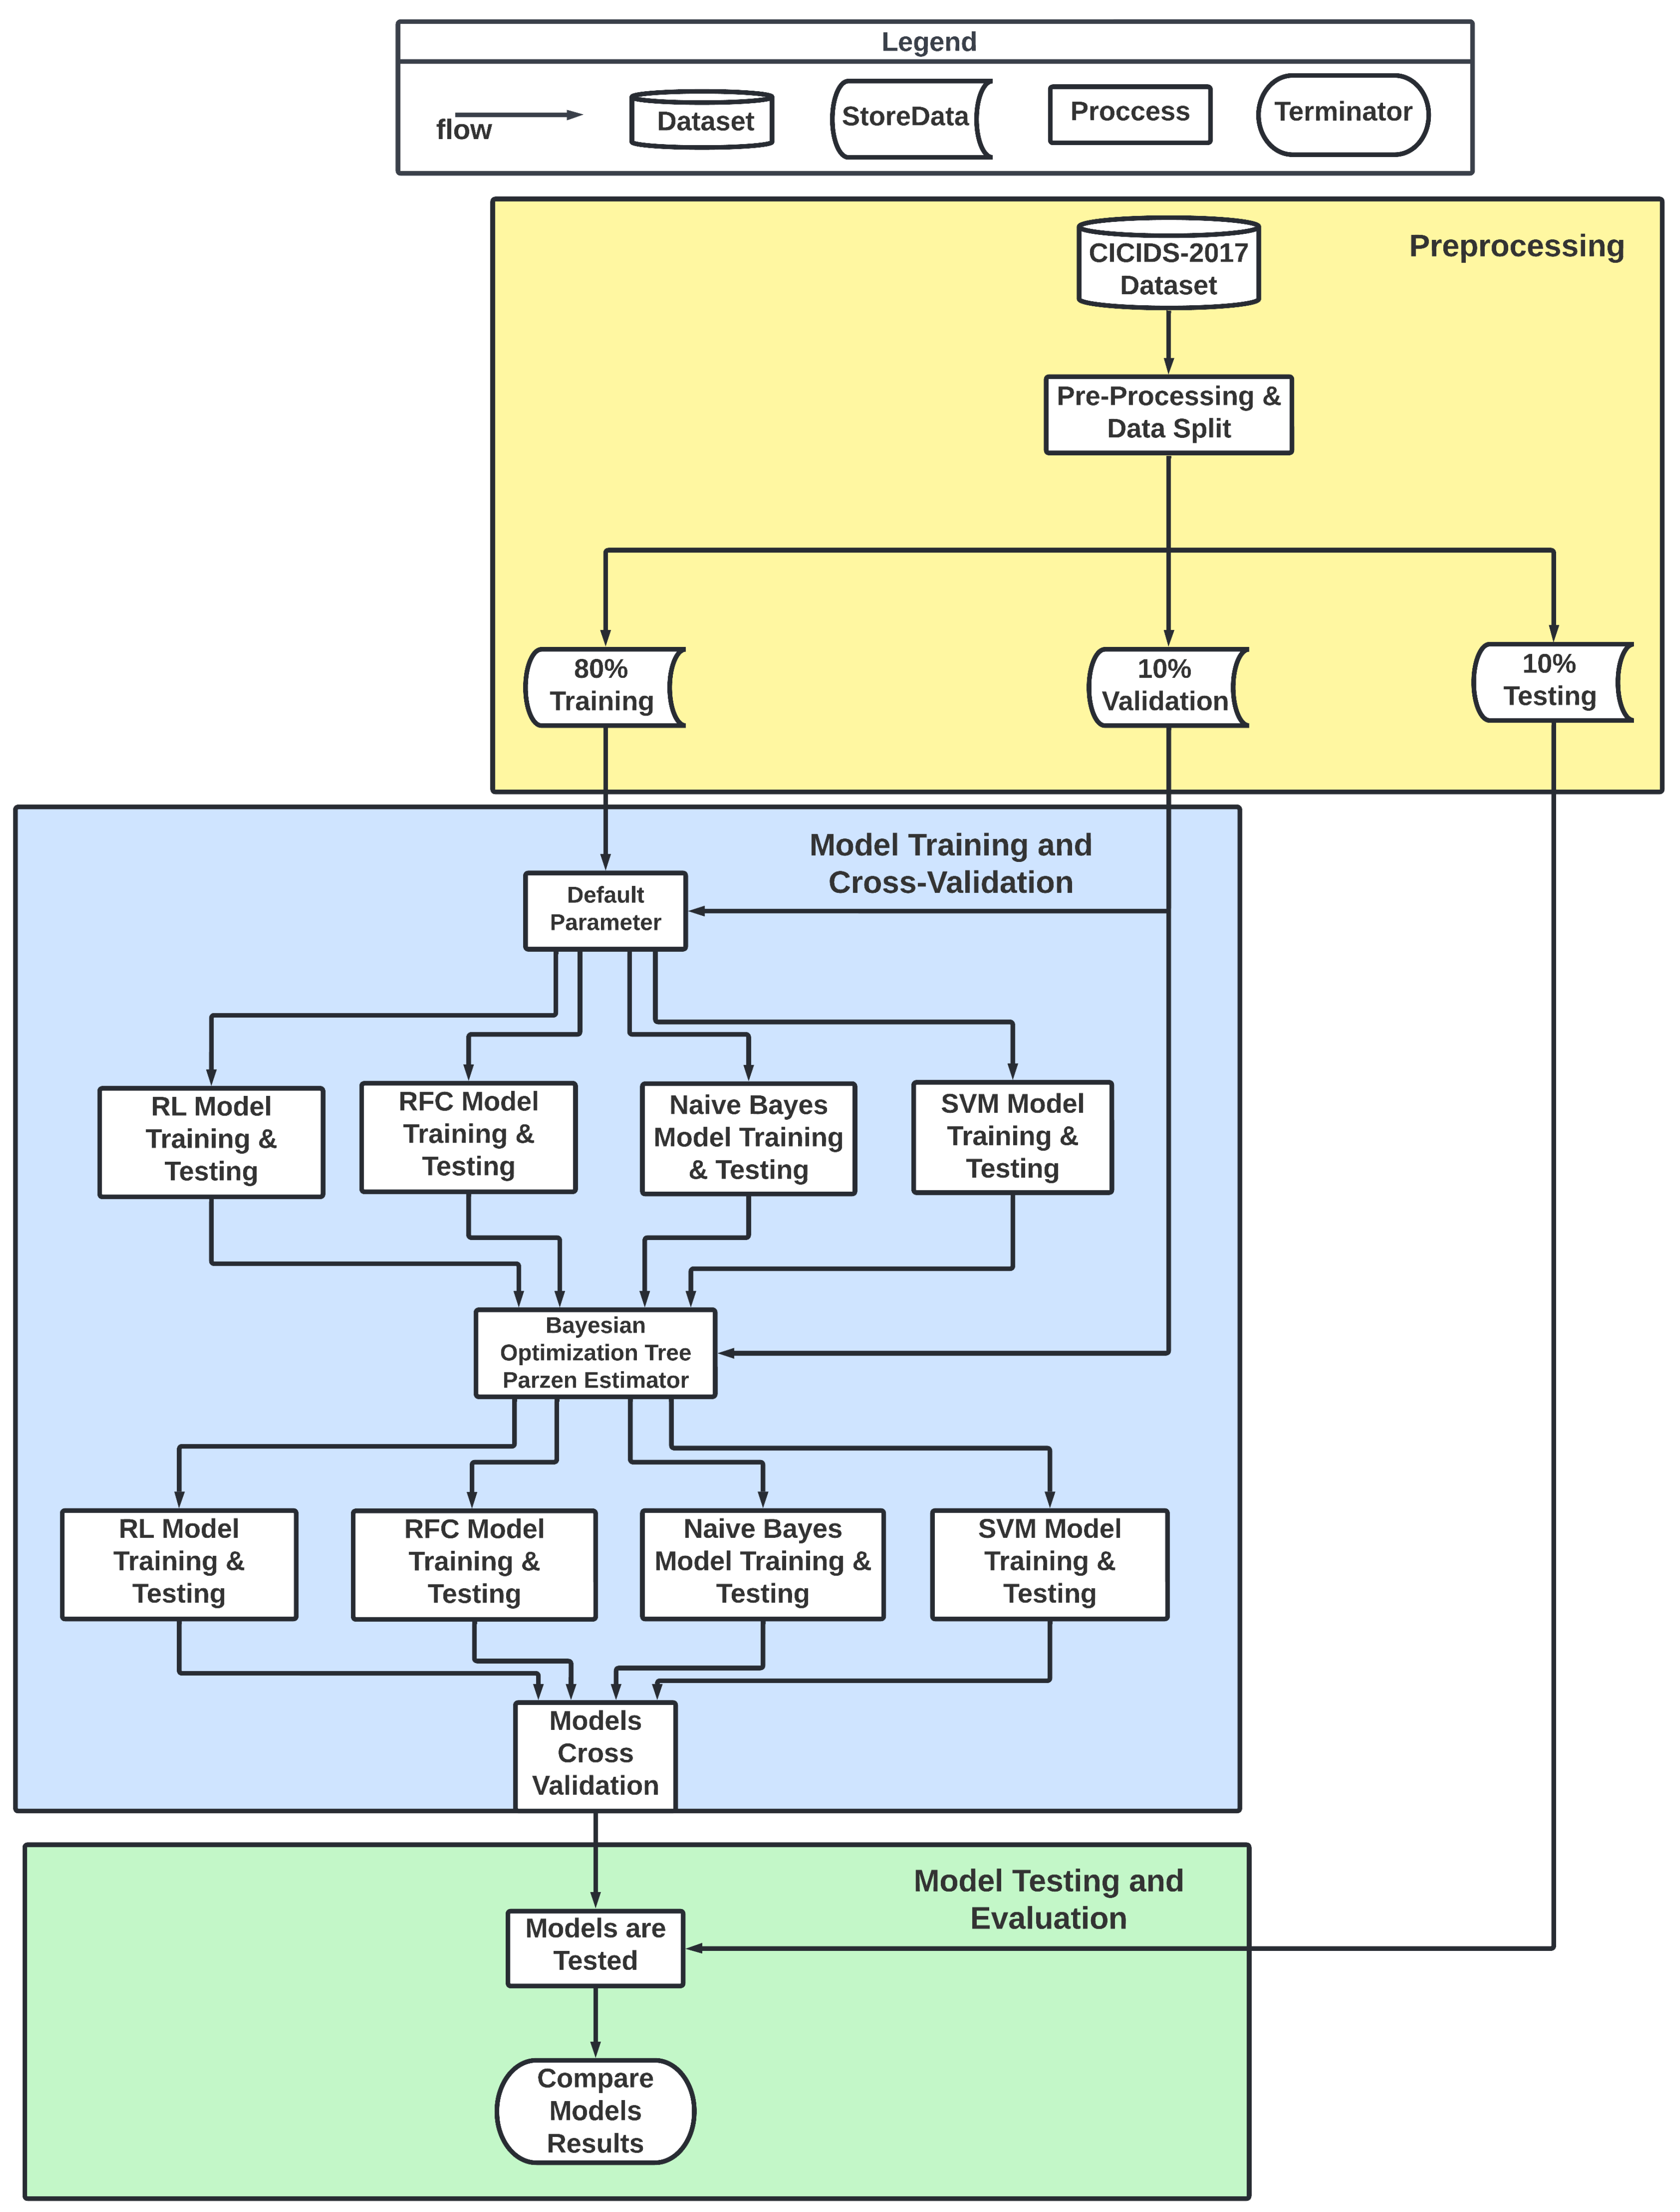
The Bayesian Optimization with Tree-Structured Parzen Estimator is an algorithm used to find the best hyperparameters of a model [36]. The algorithm builds a probability model of the goal and uses it to obtain the parameters that would work best to achieve this goal. It keeps track of all the probabilities to create a probability map that can then be used to continue predicting recursively. The main idea of this algorithm is to spend more time obtaining an educated answer, rather than using a grid search technique that makes predictions from random searches.

5. Methodology

Figure 2 shows our methodology. The methodology includes three main phases: (1) preprocessing, (2) training and cross-validation, and (3) testing. We give more details of these phases in the following subsections.
Figure 2. Methodology.

5.1. Preprocessing

The main goal of preprocessing in machine learning is to facilitate the training/testing process by appropriately transforming and scaling the entire dataset. The preprocessing of data before applying them to an ML algorithm is a crucial step in the ML workflow. Preprocessing removes outliers and scales the features to an equivalent range. It helps to improve the accuracy, reduce the time and resources required to train the model, prevent overfitting, and improve the interpretability of the model.
In the preprocessing phase, we first merge the eight files into one containing all samples. The process starts by loading the CICIDS-2017 merged file containing 3,119,345 rows and 79 columns. An important step in preprocessing is cleaning the dataset. The cleaning of the data involves finding incomplete, incorrect, inaccurate, or unnecessary data, followed by replacing, modifying, or deleting these data from the dataset. Rows with null values, duplicates, and empty cells, such as infinity (Inf) and not a number (NaN), are dropped. The initial CICIDS-2017 dataset contains categorical features (e.g., labels) that need to be converted into numerical values to prepare them for the ML algorithms.
Machine learning algorithms assume an even distribution among classes, and class imbalance is a frequent problem, especially in datasets used for network intrusion detection. Handling imbalance is important in real-world applications, where it is crucial to detect minority classes reliably—in our case, attacks. Different solutions to tackle this problem exist, including random undersampling and oversampling. As stated above, a major issue with the CICIDS-2017 dataset is the class imbalance problem. To tackle this problem, we implement a technique that combines different classes to minimize biasing towards the majority classes [14]. This technique considers the characteristics of the attacks and combines similar attacks. The implementation of this technique reduces the number of classes from 15 to 7. We also apply the SMOTE technique to increase the number of samples in the minority classes to 1000 samples each. After this, MinMaxScaler is used to scale the data for the algorithms that are sensitive to the magnitudes of different features (i.e., SVM and LR). Without scaling features, the algorithm may be biased towards the features with values higher in magnitude. The scaling of the data therefore enables these models to learn better and improves their performance. We use the MinMaxScaler technique to transform all feature values in the cleaned CICIDS-2017 data to a range between zero and one.
The resulting models have to be tested against unseen data to produce reliable outputs. To finalize the preprocessing section, therefore, the dataset is split into three sub-datasets: training (80%), validation (10%), and testing (10%). The split is performed randomly and stratified, meaning that the class distribution percentage of the initial dataset is retained in the training, validation, and testing sets. The split is created in this way to ensure that there are sufficient samples to train the models, while also ensuring sufficient samples for the testing and validation of the results. The training and validation sub-datasets are used for model training and cross-validation, while the testing dataset is used for the final evaluation of the models.

5.2. Model Training and Cross-Validation

After the dataset has been processed and converted into an appropriate format to fit the supervised machine learning models, the actual learning process starts. In this study, the training and validation datasets were used to train the chosen algorithms. In the beginning, the default parameters of the algorithms were used to create the models. The model training and cross-validation phases were designed as parallel processes. The reason for this is that these steps can be performed independently for each model. Different machine learning algorithms allow the use of a set of varying parameters to maximize the performance of the models. Once the models are created, the search for the best-performing hyperparameters of the models needs to be carried out. To find the best parameters, we employed randomization followed by a grid search combined with stratified k-fold cross-validation (CV) and the Bayesian Optimization with Tree-Structured Parzen Estimator. Grid search is an exhaustive method where multiple models are trained with different given sets of parameters before it returns the best-performing ones. To reliably identify the best-performing ones, we used stratified k-fold cross-validation (CV). K-fold CV ensures that each data instance is used for training and testing. This technique allows the comparison of the performance of models trained with different parameters as each one predicts every data point. Moreover, we stratified the folds to ensure that every fold had the same class distribution as the entire dataset, so that every class was relatively as often represented as in the whole dataset. The number of folds was set to 5, which meant that one fifth of the data served as the validation set, while a total of five models were trained per parameter set. The grid search method returns the best parameters based on the selected scoring methods. As our research aimed to achieve high recall rate for attack classes while maintaining high precision for benign traffic, we used the recall macro measure for this purpose, instead of the default accuracy method. At the end of this phase, we found the best combination of parameters for each model, which were then used to test them.

5.3. Model Testing and Evaluation

After finding the best parameters for each model, the models were refitted with all of the training and validation data, since no validation was required. After this, the performance was evaluated with adequate methods. All the models were evaluated using the testing data. These testing data contained samples that had never been seen before, so this served as a test to determine how the model predicted new attacks. Recall that the goal of our research was to find a model that has a low false-positive rate while detecting attacks reliably. In terms of performance evaluation metrics, this means that we need high recall (i.e., a low false-negative rate) for every attack class, as well as high precision (i.e., a low false-positive rate) for normal traffic. To obtain deeper insights into our model’s performance, we utilized the following visualization techniques: a confusion matrix, classification report, precision–recall curve, and receiver operating characteristic curve. The combination of these methods and the use of the recall macro scoring measure enabled us to deeply analyze the true-/false-positive as well as true-/false-negative performance.

6. Results and Discussion

We evaluated the performance of four machine learning algorithms: random forest (RF), linear support vector machine (LSVM), Gaussian Naive Bayes (GNB), and logistic regression (LG). The evaluation was conducted on two different computers. The RF and LSVM algorithms were evaluated on a Dell Inspiron 3880 with an Intel Core i7 processor and 12 GB RAM. The GNB and LG algorithms were evaluated on an HP Envy ×360 with an AMD Ryzen 5 processor and 8 GB RAM. We used Jupyter Notebook, which is an IDE included in Anaconda, Python, and the scikit-learn library, to implement and evaluate these algorithms.

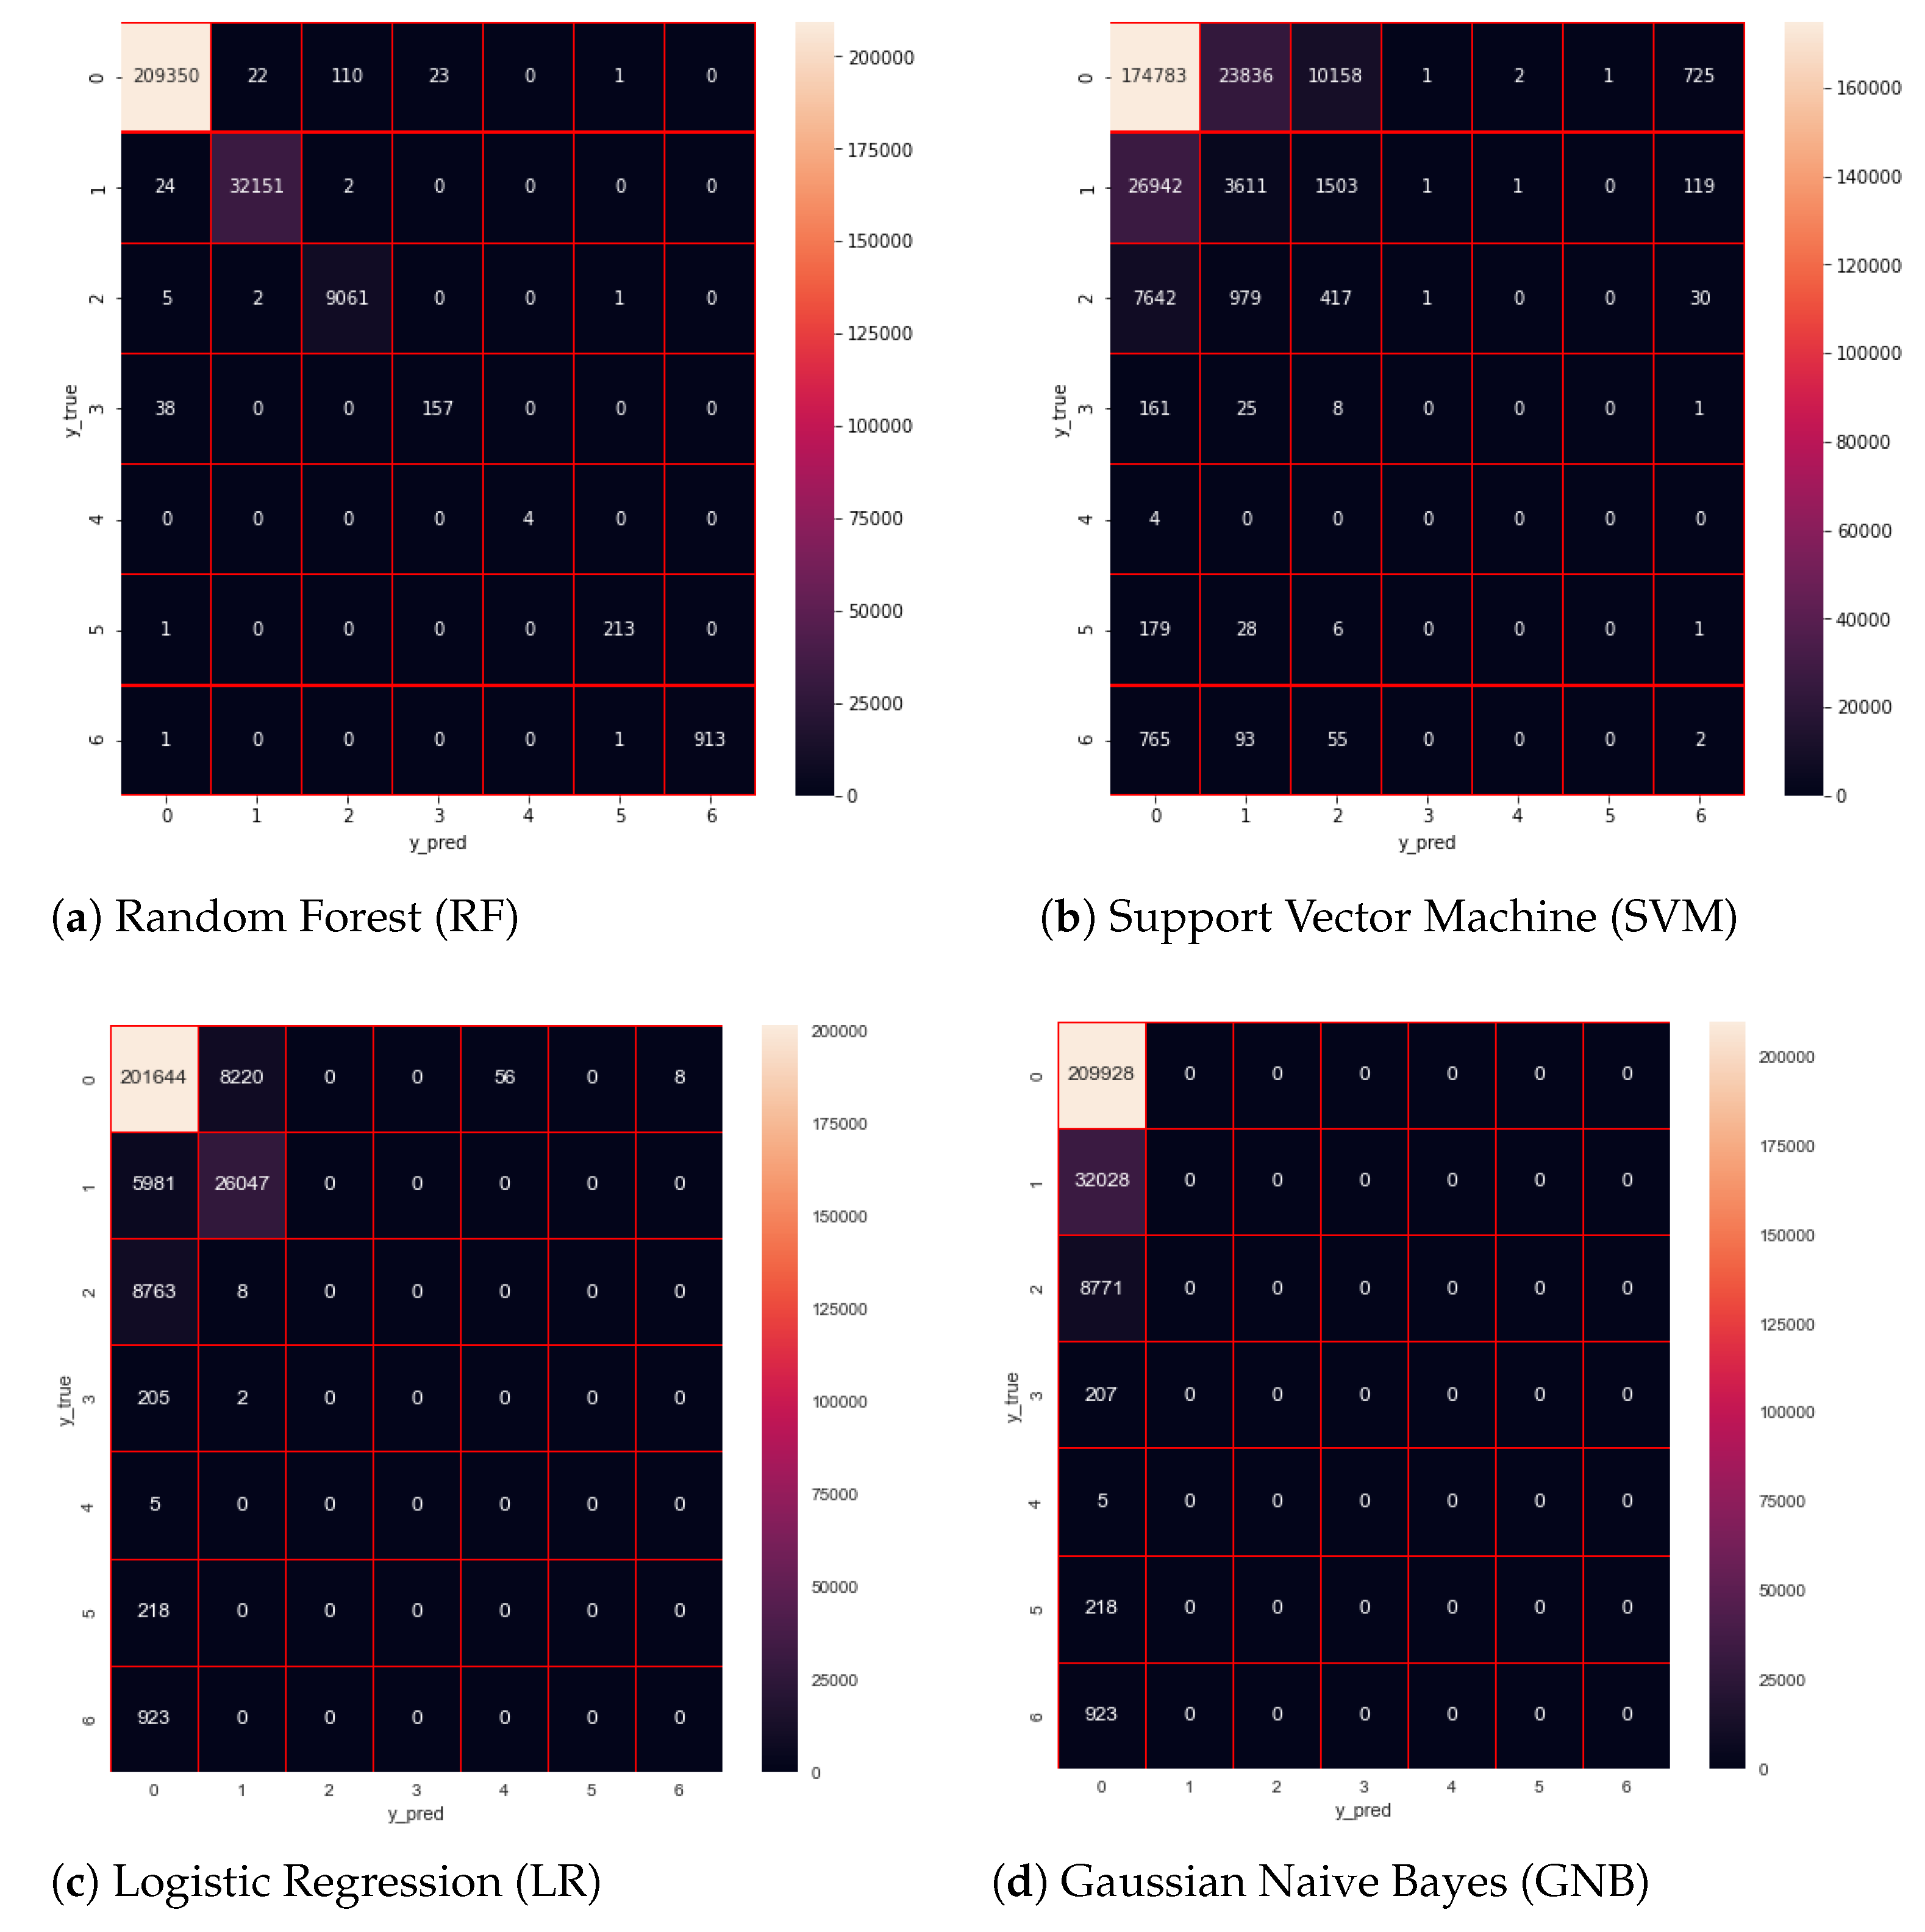
6.1. Confusion Matrix

A confusion matrix is a powerful tool for the investigation of incorrect classifications (Figure 3). Unlike other evaluation techniques, the confusion matrix highlights the number of correct and incorrect predictions. It reveals classes that the model considers similar or distinguishes well. In the obtained figures, we can analyze the true values versus the predicted values. An ideal model shows a confusion matrix with most of the predictions in a diagonal line from top left to bottom right. This means that the prediction made by the model correlates with the actual answer. Each number in the diagonal compared to the numbers in the corresponding horizontal line is of interest. This allows the analysis of the predictions per actual class. The number on the diagonal shows the correct classifications, while the other numbers on the left and right denote the numbers of incorrect predictions per class.
Figure 3. Models’ performance as confusion matrices. The classes are denoted as follows: Benign → 0, DoS → 1, Port Scan → 2, Bot → 3, Infiltration → 4, Web Attack → 5, Brute Force → 6.
The confusion matrix of the random forest (RF) model shows its high accuracy as most numbers are diagonal. This means that the RF model correctly predicted most of the attacks. On the other hand, other models were only able to detect benign attacks or one type of attack. The results of confusion matrices are critical because they highlight what is predicted by each model for every given sample. By examining the confusion matrix for Gaussian Naive Bayes (GNB), we were able to deduce that the model categorized each attack as a benign attack. In some instances, a confusion matrix could also be helpful to understand what influences a model’s decisions. For instance, if a model detects many Heartbleed attacks as infiltration attacks, it might mean that these two attacks have many similarities.

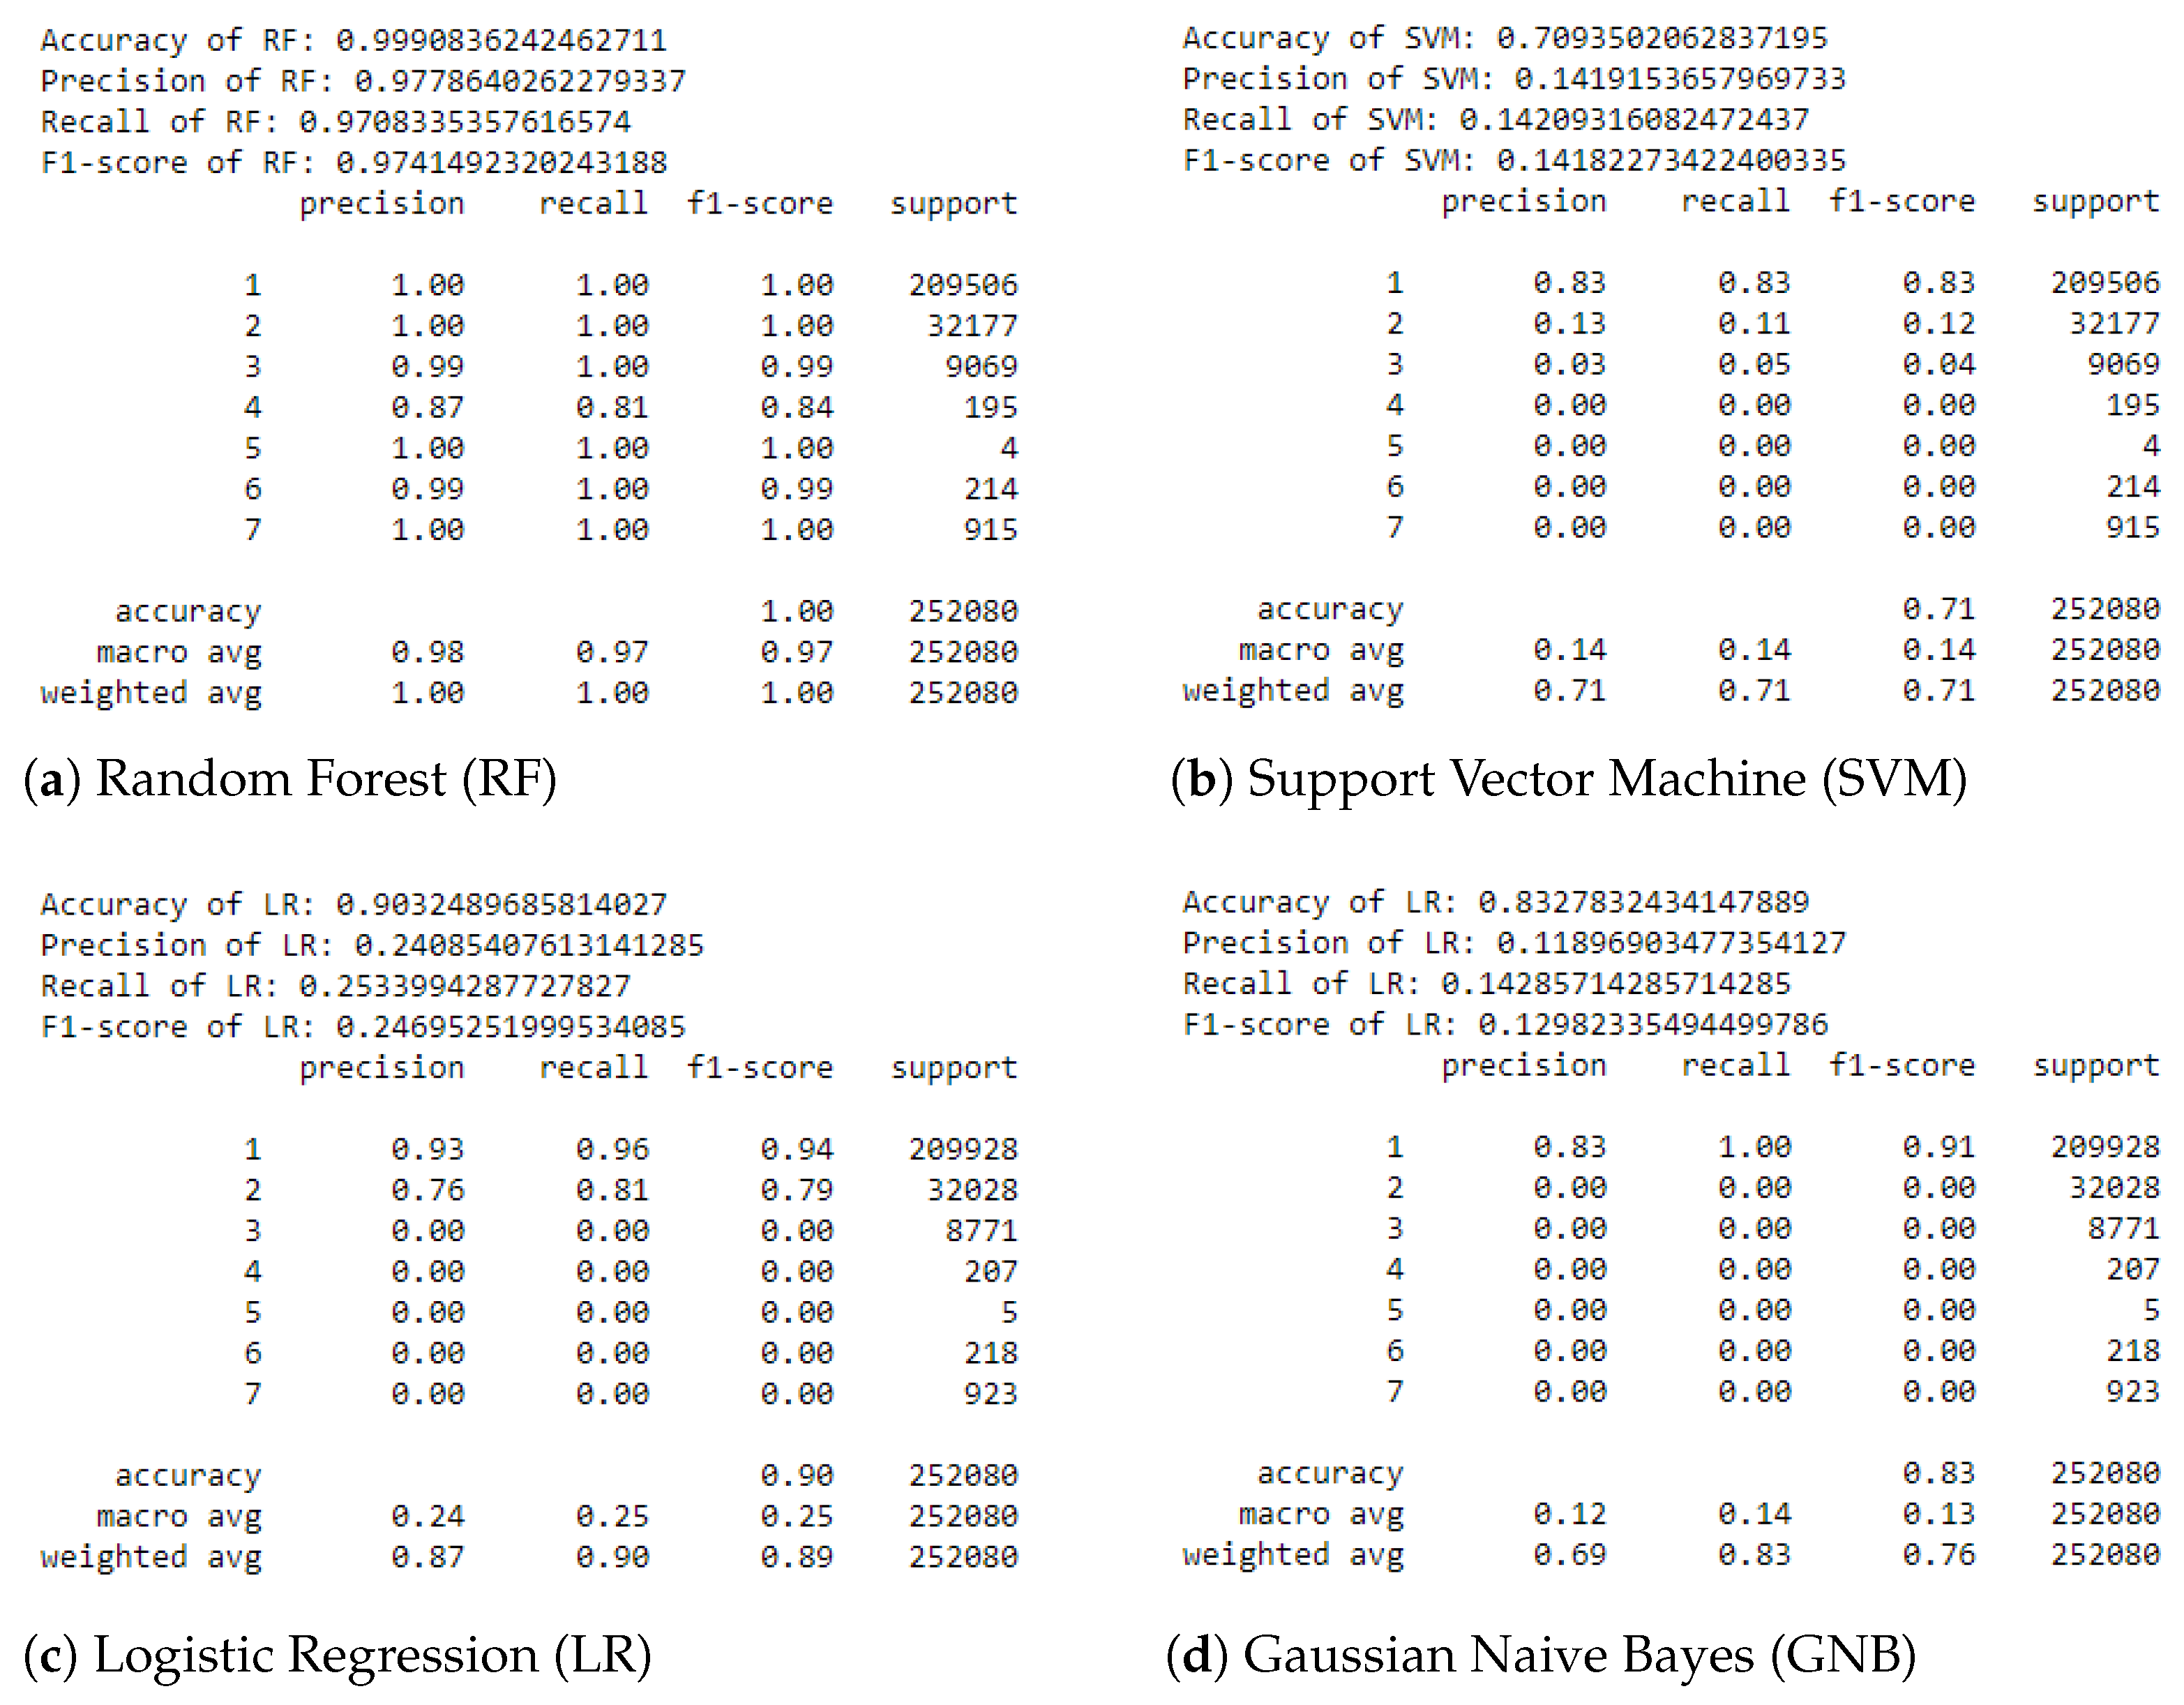
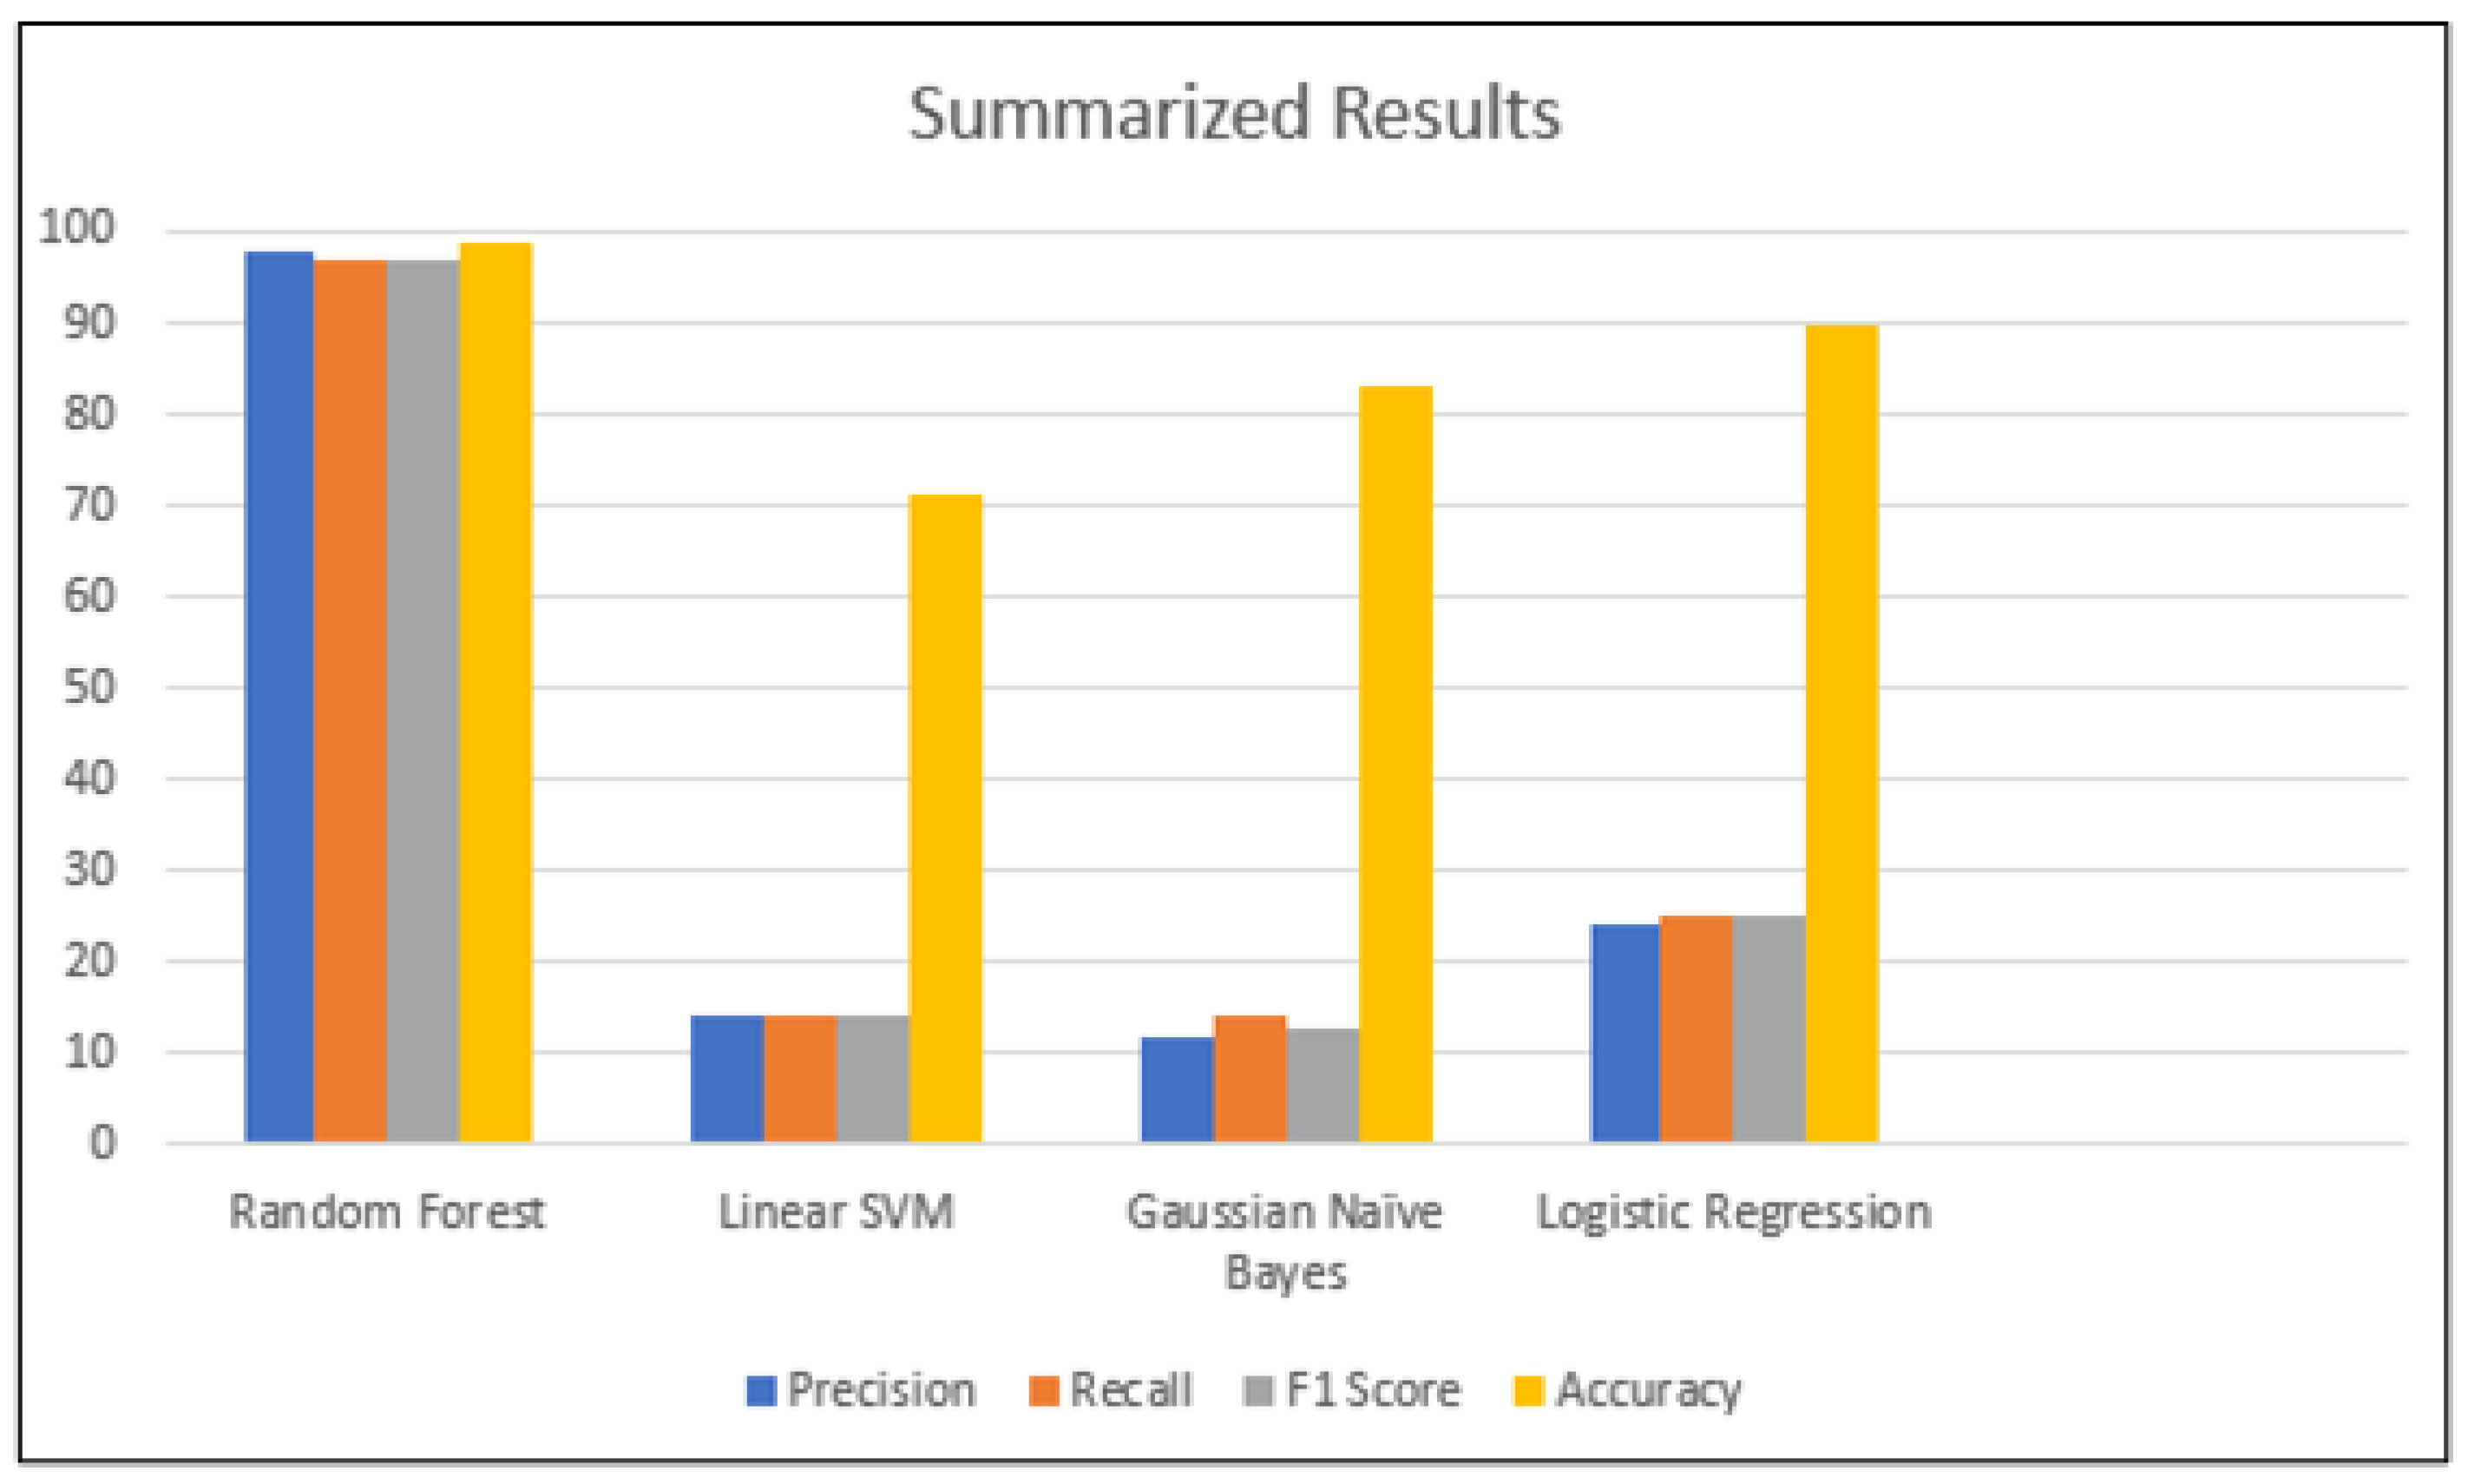
6.2. Classification Report

The evaluation results of the models in the form of classification reports are shown in Figure 4. A classification report shows the precision, recall, and F-1 score for every class, as well as the macro-average and weighted average of these metrics across the classes. The overall accuracy of the predictions on the test data is also part of the report. These are defined as follows.
Figure 4. Results as classification reports. The classes are denoted as follows: Benign → 1, DoS → 2, Port Scan → 3, Bot → 4, Infiltration → 5, Web Attack → 6, Brute Force → 7.
  • Accuracy = T P + T N T P + T N + F P + F N , the percentage of the total number of correct classifications.
  • Precision = T P T P + F P , the proportion of positives that are correctly identified.
  • Recall (sensitivity) = T P T P + F N , the percentage of actual positives that are classified as attacks.
  • F1-score= 2 p r e c i s i o n r e c a l l p r e c i s i o n + r e c a l l , the harmonic mean of the precision and recall.
Here, TP = true positives, TN = true negatives, FP = false positives, and FN = false negatives. A high F1-score means that the precision and recall are both high, while a low F1-score indicates that one or both of the precision and recall are low. A high precision value means that the model can correctly identify most of the positive cases, while a high recall value means that the model can correctly identify most of the actual positive cases.
Once again, using the classification reports, the RF model clearly emerges as the best-performing model, with a macro-average F1-score of 97%. The macro-average is calculated by taking the average of the F1-scores of each class. Therefore, it is a good measure to express the model’s performance in a single number. As can be seen by examining the classification reports, for the other models, the macro-average is significantly lower than that of the RF model, indicating the superiority of the RF model in predicting different attacks.

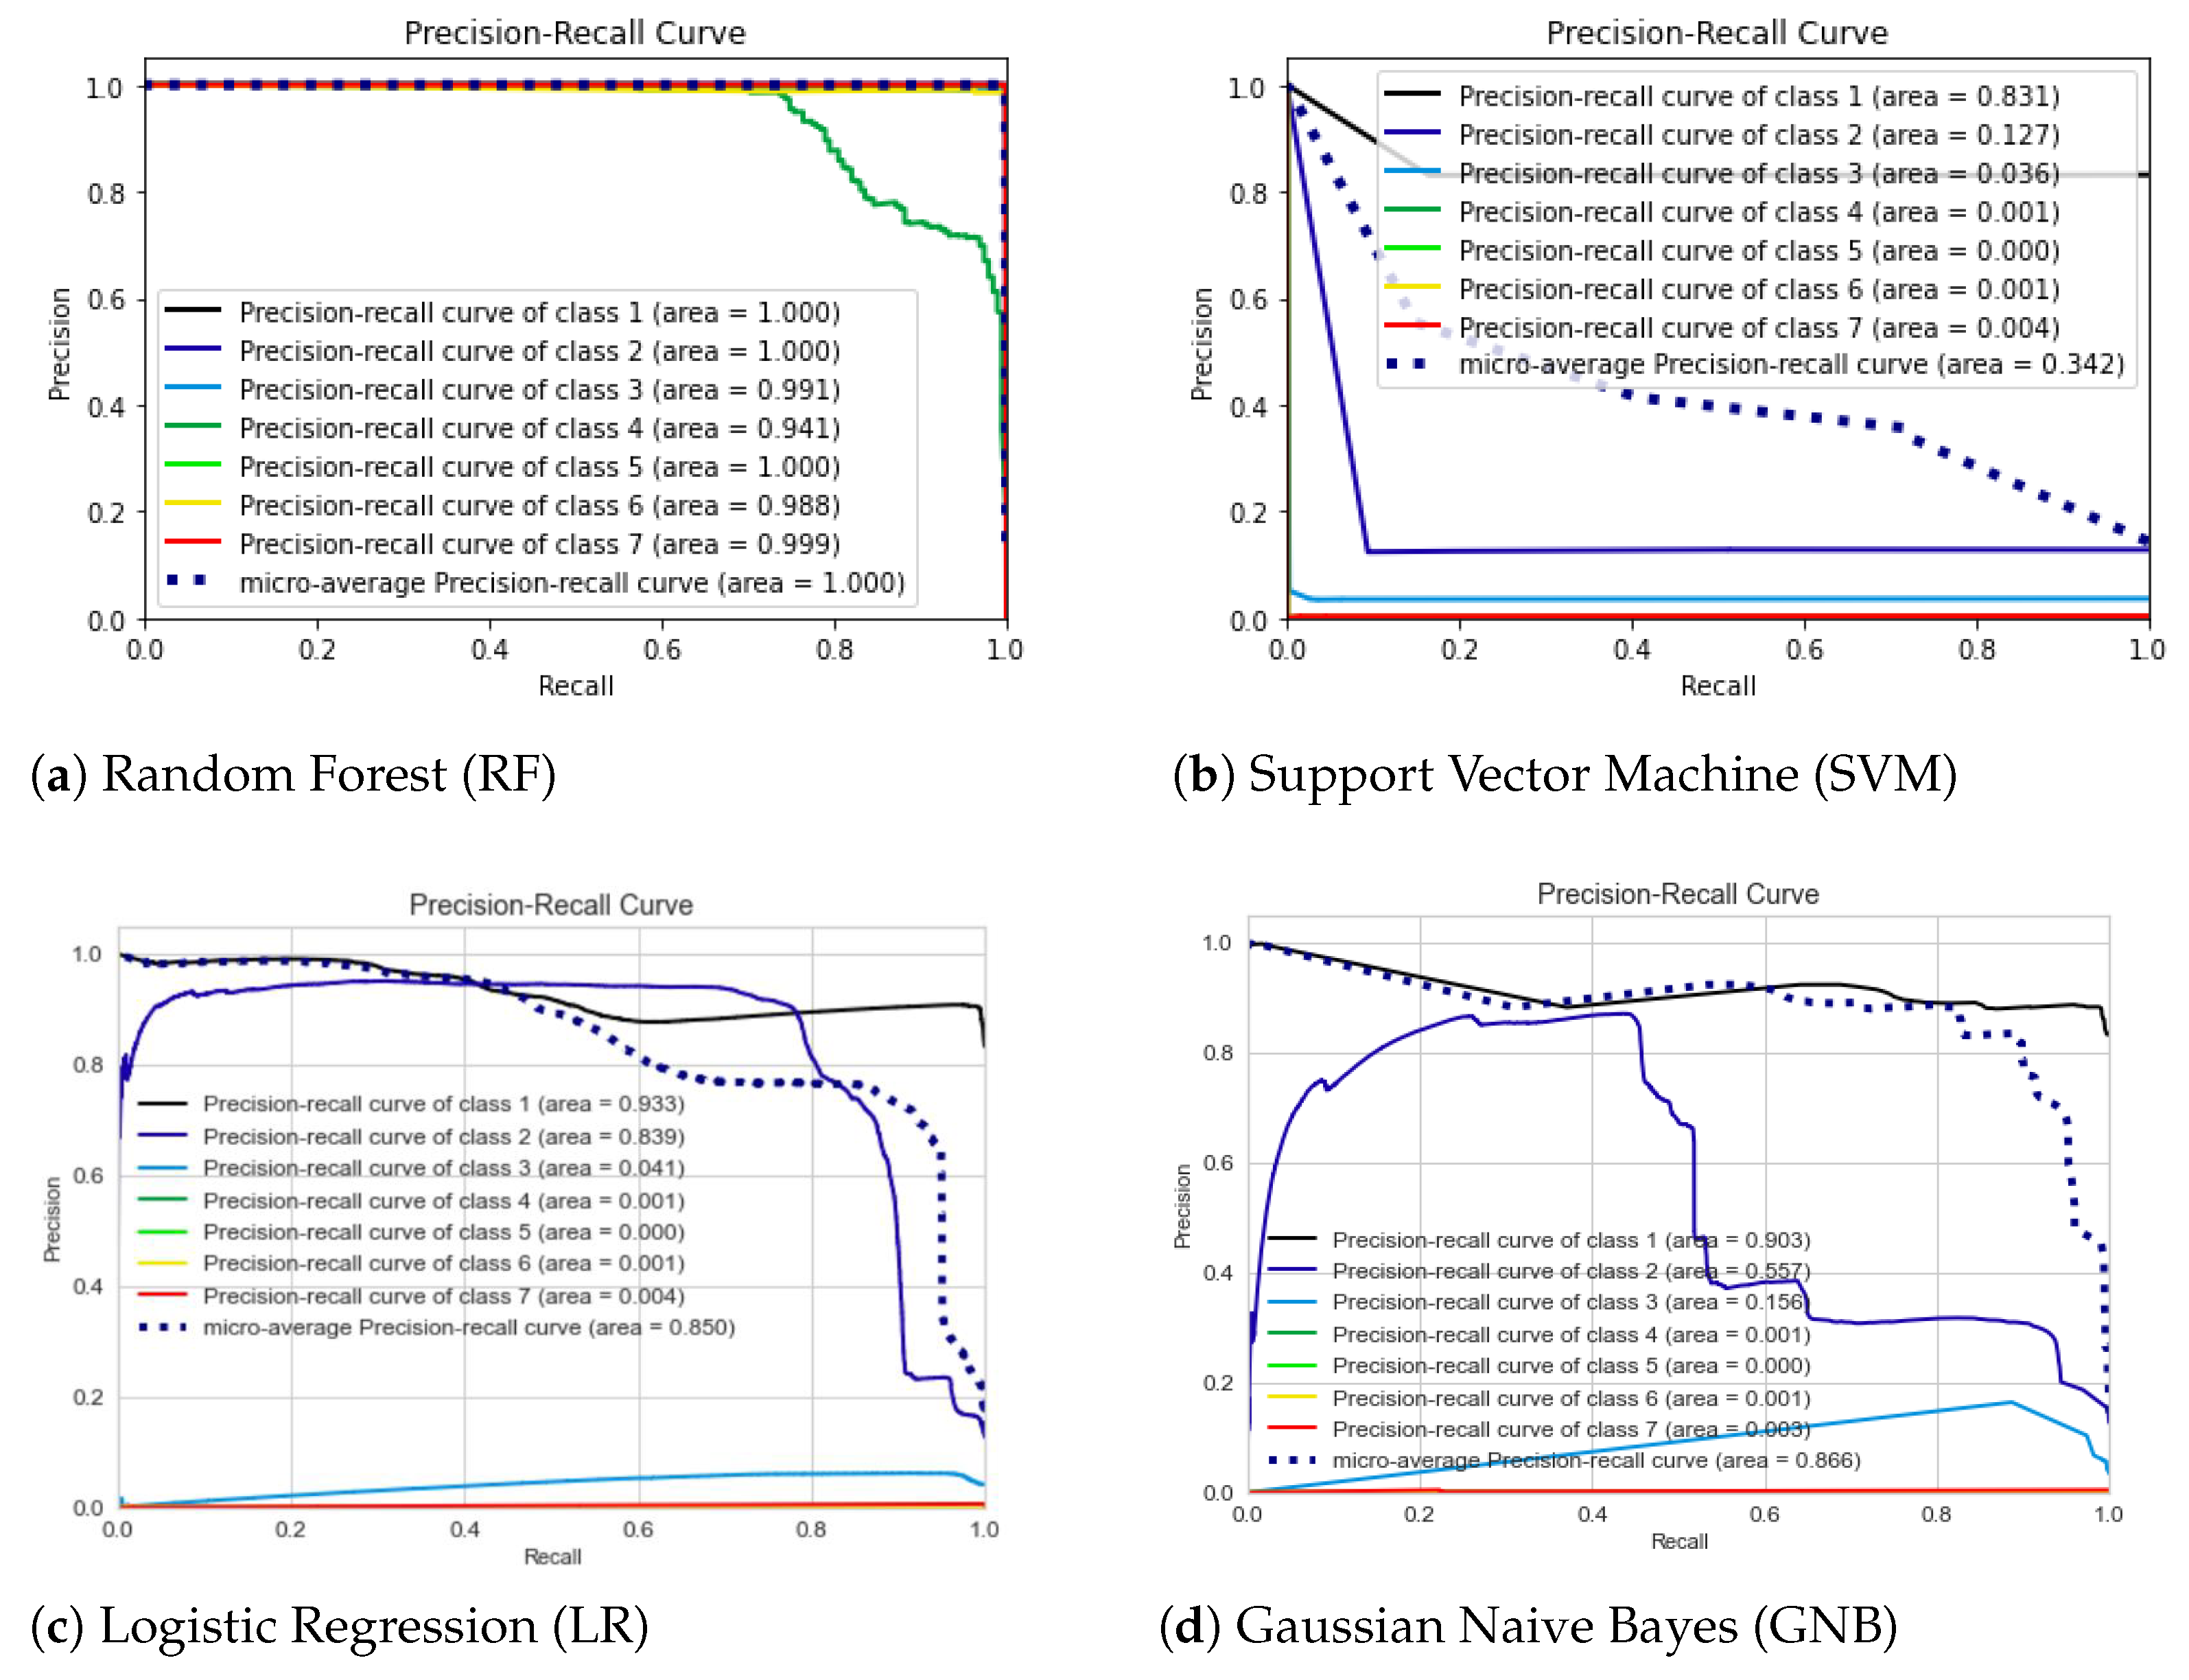
6.3. Precision–Recall Curve (PRC)

Precision–recall curves (PRC) are visual indicators of which classes the model can detect with high precision while the recall increases. Perfect performance for a class (precision 100%; recall 100%) is shown as a horizontal line along Y-axis 1.0 connected with a vertical line at X-axis 1.0. This means that an ideal PRC should pass from the top-left corner to the top-right corner and then straight down. If a model has ideal or close to ideal results, this means that the model has good precision and recall scores. As can be seen in Figure 5, the PRC is different for each algorithm. The closest to an ideal PRC is Figure 5a for the random forest model. This figure shows an overlap of six classes as an ideal curve, but it has one class that has a lower rate, as seen in green (class 5). This means that the RF model was able to correctly predict all types of traffic (benign or attacks) except for one class, which has an 81 percent recall score, as seen in the classification report. Despite the less impressive performance in class 5, the result for the overall precision–recall relation in the total model is close to a perfect score.
Figure 5. Models’ performance as precision–recall curves (PRC). The classes are denoted as follows: Benign → 1, DoS → 2, Port Scan → 3, Bot → 4, Infiltration → 5, Web Attack → 6, Brute Force → 7.
The PRC figures for other models are unsatisfactory, as they are not close to the top in most cases. This indicates the poor performance of these models. For example, the SVM graph in Figure 5 is a representation of a poorly performing model (most of the classes in this graph are below the diagonal line, which represents low recall and precision scores).

6.4. Results Summary

After evaluating the different algorithms using various criteria, the results indicate that the RF model has superiority over the other models. This finding was expected (and consistent with other studies that evaluated ML models) when considering the advantages and disadvantages of each of the evaluated ML algorithms. Specifically, the LR and LSVM algorithms are more suitable for binary classification, while intrusion detection is a multi-class classification problem. Additionally, based on theory, the GNB algorithm does not perform well in real-world scenarios, which was confirmed by this research’s results.
Our findings demonstrate that RF, in combination with the Synthetic Minority Oversampling Technique (SMOTE) and grouping techniques, is a good solution when dealing with the imbalance problem and subsequently predicting attacks. The precision, recall, F1, and accuracy scores of all algorithms can be seen in the summarized results shown in Figure 6. The figure shows that there is a large difference in all four categories between the RF model and the other three models. This figure also shows that the LSVM model has the worst results. It is also worth highlighting that the accuracy of all four models is rather high, which is consistent with the results of the related studies that we surveyed in Section 3. However, the high accuracy of some models does not guarantee their overall good performance. Interestingly, our RF model performs very well in terms of all used metrics over all classes.
Figure 6. Summary of the results.

7. Conclusions

In this research, we studied the suitability of four different supervised machine learning algorithms to build an anomaly-based Network Intrusion Detection System (NIDS). A NIDS checks network data for abnormal behavior; it provides a layer of protection against security threats. Since attackers are continually developing new attack strategies, NIDSs must continue to evolve. Companies are constantly seeking solutions to improve NIDSs, because attacks can lead to consequences such as financial losses and a poor business reputation.
To tackle this problem, we implemented four supervised machine learning algorithms to create a model that can detect and categorize real-world and up-to-date attacks. These supervised algorithms were random forest (RF), Gaussian Naive Bayes (GNB), linear support vector machine (LSVM), and logistic regression (LR). We used a grouping technique for the attacks and the Synthetic Minority Oversampling Technique (SMOTE) to address the class imbalance problem. Additionally, the Bayesian Optimization with the Tree-Structured Parzen Estimator technique was utilized to find the best possible parameters for each algorithm.
The models were created and compared based on their accuracy, recall, precision, F1-score, and precision–recall curve. One of the best methods to check the reliability of a model created from a dataset with many classes is to use the recall macro-measure. Recall indicates how frequently the model detects a harmful attack, while the macro ensures that all classes are evaluated equally, independently of their size. The best-performing algorithm was RF, with a 97 percent recall macro score. This means that our RF model can detect harmful attacks 97 out of 100 times.
One limitation of the work presented in this paper is that we have not addressed the class imbalance problem completely. We attempted to address the class imbalance problem by using SMOTE and grouping similar attacks to improve the uneven distribution of classes. Although we improved the distribution of the different classes to improve the detection rates of significant and similar attacks, the distribution of the attacks was ultimately not even. This limitation should be addressed using other techniques.
Future work will consider implementing a feature selection technique to find the features that correlate the most with the target. Feature selection is useful to remove redundant and irrelevant features. Additionally, new algorithms can be analyzed for better performance with the CICIDS-2017 dataset. In this research, we worked with some algorithms that performed poorly with our dataset; therefore, an investigation will be needed to find other algorithms that best fit the dataset and that compete with RF algorithms. Another potential future direction is to investigate the performance of deep learning algorithms. Lastly, it is necessary to consider creating a NIDS system using the best model. This NIDS system can then be tested by applying it in a network and analyzing its predictions.

Author Contributions

Conceptualization, M.A.L.; Methodology, M.A.L.; Project Administration, M.A.L.; Software, M.A.L., A.G. and S.O.; Formal Analysis, M.A.L. and A.G.; Funding Aquisition, M.A.L.; Investigation, M.A.L.; Data Curation, M.A.L.; Supervision, M.A.L.; Validation, M.A.L.; Visualization, A.G. and S.O.; Writing—original draft, M.A.L.; Writing—review & editing, M.A.L.; Resources, M.A.L. All authors have read and agreed to the published version of the manuscript.

Funding

This research was partially supported by the University Research Grant (URG) at Texas A&M International University and the National Science Foundation under grant award HRD-1911375.

Data Availability Statement

Data in this research paper will be shared upon request made to the corresponding author.

Acknowledgments

We express our sincere thanks to the anonymous reviewers for their suggestions, which resulted in a substantially improved manuscript.

Conflicts of Interest

The authors declare no conflict of interest.

References

  1. Scarfone, K.; Mell, P. Guide to intrusion detection and prevention systems (IDPS). NIST Spec. Publ. 2007, 800, 94. [Google Scholar]
  2. Kemmerer, R.A.; Vigna, G. Intrusion detection: A brief history and overview. Computer 2002, 35, 1012428. [Google Scholar] [CrossRef]
  3. Cardoso, L.S. Intrusion detection versus intrusion protection. In Network Security: Current Status and Future Directions; IEEE Press: Hoboken, NJ, USA, 2007; pp. 99–115. [Google Scholar]
  4. Khraisat, A.; Gondal, I.; Vamplew, P.; Kamruzzaman, J. Survey of intrusion detection systems: Techniques, datasets and challenges. Cybersecurity 2019, 2, 1–22. [Google Scholar] [CrossRef]
  5. Tavallaee, M.; Bagheri, E.; Lu, W.; Ghorbani, A.A. A detailed analysis of the KDD CUP 99 data set. In Proceedings of the 2009 IEEE Symposium on Computational Intelligence for Security and Defense Applications, Ottawa, ON, Canada, 8–10 July 2009; pp. 1–6. [Google Scholar]
  6. Belavagi, M.C.; Muniyal, B. Performance evaluation of supervised machine learning algorithms for intrusion detection. Procedia Comput. Sci. 2016, 89, 117–123. [Google Scholar] [CrossRef]
  7. Yin, C.; Zhu, Y.; Fei, J.; He, X. A deep learning approach for intrusion detection using recurrent neural networks. IEEE Access 2017, 5, 21954–21961. [Google Scholar] [CrossRef]
  8. Javaid, A.; Niyaz, Q.; Sun, W.; Alam, M. A deep learning approach for network intrusion detection system. In Proceedings of the 9th EAI International Conference on Bio-Inspired Information and Communications Technologies (formerly BIONETICS), New York, NY, USA, 3–5 December 2016; pp. 21–26. [Google Scholar]
  9. Saranya, T.; Sridevi, S.; Deisy, C.; Chung, T.D.; Khan, M.A. Performance analysis of machine learning algorithms in intrusion detection system: A review. Procedia Comput. Sci. 2020, 171, 1251–1260. [Google Scholar] [CrossRef]
  10. Yang, L.; Moubayed, A.; Hamieh, I.; Shami, A. Tree-based intelligent intrusion detection system in internet of vehicles. In Proceedings of the 2019 IEEE Global Communications Conference (GLOBECOM), Waikoloa, HI, USA, 9–13 December 2019; pp. 1–6. [Google Scholar]
  11. Bertoli, G.D.C.; Júnior, L.A.P.; Saotome, O.; Dos Santos, A.L.; Verri, F.A.N.; Marcondes, C.A.C.; Barbieri, S.; Rodrigues, M.S.; De Oliveira, J.M.P. An end-to-end framework for machine learning-based network intrusion detection system. IEEE Access 2021, 9, 106790–106805. [Google Scholar] [CrossRef]
  12. Elmrabit, N.; Zhou, F.; Li, F.; Zhou, H. Evaluation of machine learning algorithms for anomaly detection. In Proceedings of the 2020 International Conference on Cyber Security and Protection of Digital Services (Cyber Security), Dublin, Ireland, 15–19 June 2020; pp. 1–8. [Google Scholar]
  13. Guo, X.; Yin, Y.; Dong, C.; Yang, G.; Zhou, G. On the class imbalance problem. In Proceedings of the 2008 Fourth international conference on natural computation, Jinan, China, 18–20 October 2008; Volume 4, pp. 192–201. [Google Scholar]
  14. Panigrahi, R.; Borah, S. A detailed analysis of CICIDS2017 dataset for designing Intrusion Detection Systems. Int. J. Eng. Technol. 2018, 7, 479–482. [Google Scholar]
  15. Sharafaldin, I.; Lashkari, A.H.; Ghorbani, A.A. Toward generating a new intrusion detection dataset and intrusion traffic characterization. ICISSp 2018, 1, 108–116. [Google Scholar]
  16. Sharafaldin, I.; Habibi Lashkari, A.; Ghorbani, A.A. A detailed analysis of the cicids2017 data set. In Proceedings of the Information Systems Security and Privacy: 4th International Conference, ICISSP 2018, Funchal-Madeira, Portugal, 22–24 January 2018; Revised Selected Papers 4. Springer: Berlin, Germany, 2019; pp. 172–188. [Google Scholar]
  17. Gharib, A.; Sharafaldin, I.; Lashkari, A.H.; Ghorbani, A.A. An evaluation framework for intrusion detection dataset. In Proceedings of the 2016 International Conference on Information Science and Security (ICISS), Pattaya, Thailand, 19–22 December 2016; pp. 1–6. [Google Scholar]
  18. Gogoi, P.; Bhattacharyya, D.; Borah, B.; Kalita, J.K. MLH-IDS: A multi-level hybrid intrusion detection method. Comput. J. 2014, 57, 602–623. [Google Scholar] [CrossRef]
  19. Panwar, S.S.; Raiwani, Y. Data reduction techniques to analyze NSL-KDD Dataset. Int. J. Comput. Eng. Technol. 2014, 5, 21–31. [Google Scholar]
  20. Ambusaidi, M.A.; He, X.; Nanda, P.; Tan, Z. Building an intrusion detection system using a filter-based feature selection algorithm. IEEE Trans. Comput. 2016, 65, 2986–2998. [Google Scholar] [CrossRef]
  21. Zhao, G.; Zhang, C.; Zheng, L. Intrusion detection using deep belief network and probabilistic neural network. In Proceedings of the 2017 IEEE International Conference on Computational Science and Engineering (CSE) and IEEE International Conference on Embedded and Ubiquitous Computing (EUC), Guangzhou, China, 21–24 July 2017; Volume 1, pp. 639–642. [Google Scholar]
  22. Roy, S.S.; Mallik, A.; Gulati, R.; Obaidat, M.S.; Krishna, P.V. A deep learning based artificial neural network approach for intrusion detection. In Proceedings of the Mathematics and Computing: Third International Conference, ICMC 2017, Haldia, India, 17–21 January 2017; Proceedings 3. Springer: Berlin, Germany, 2017; pp. 44–53. [Google Scholar]
  23. Kamarudin, M.H.; Maple, C.; Watson, T.; Safa, N.S. A logitboost-based algorithm for detecting known and unknown web attacks. IEEE Access 2017, 5, 26190–26200. [Google Scholar] [CrossRef]
  24. Al-Zewairi, M.; Almajali, S.; Awajan, A. Experimental evaluation of a multi-layer feed-forward artificial neural network classifier for network intrusion detection system. In Proceedings of the 2017 International Conference on New Trends in Computing Sciences (ICTCS), Amman, Jordan, 11–13 October 2017; pp. 167–172. [Google Scholar]
  25. Xu, C.; Shen, J.; Du, X.; Zhang, F. An Intrusion Detection System Using a Deep Neural Network With Gated Recurrent Units. IEEE Access 2018, 6, 48697–48707. [Google Scholar] [CrossRef]
  26. Belouch, M.; El Hadaj, S.; Idhammad, M. Performance evaluation of intrusion detection based on machine learning using Apache Spark. Procedia Comput. Sci. 2018, 127, 1–6. [Google Scholar] [CrossRef]
  27. Jia, Y.; Wang, M.; Wang, Y. Network intrusion detection algorithm based on deep neural network. IET Inf. Secur. 2019, 13, 48–53. [Google Scholar] [CrossRef]
  28. Halimaa, A.; Sundarakantham, K. Machine learning based intrusion detection system. In Proceedings of the 2019 3rd International Conference on Trends in Electronics and Informatics (ICOEI), Tirunelveli, India, 23–25 April 2019; pp. 916–920. [Google Scholar]
  29. Faker, O.; Dogdu, E. Intrusion detection using big data and deep learning techniques. In Proceedings of the 2019 ACM Southeast Conference, Kennesaw, GA, USA, 18–20 April 2019; pp. 86–93. [Google Scholar]
  30. Vinayakumar, R.; Alazab, M.; Soman, K.; Poornachandran, P.; Al-Nemrat, A.; Venkatraman, S. Deep learning approach for intelligent intrusion detection system. IEEE Access 2019, 7, 41525–41550. [Google Scholar] [CrossRef]
  31. Zhang, X.; Chen, J.; Zhou, Y.; Han, L.; Lin, J. A multiple-layer representation learning model for network-based attack detection. IEEE Access 2019, 7, 91992–92008. [Google Scholar] [CrossRef]
  32. Stiawan, D.; Idris, M.Y.B.; Bamhdi, A.M.; Budiarto, R. CICIDS-2017 dataset feature analysis with information gain for anomaly detection. IEEE Access 2020, 8, 132911–132921. [Google Scholar]
  33. Panwar, S.S.; Negi, P.S.; Panwar, L.S.; Raiwani, Y. Implementation of machine learning algorithms on CICIDS-2017 dataset for intrusion detection using WEKA. Int. J. Recent Technol. Eng. Regul. Issue 2019, 8, 2195–2207. [Google Scholar] [CrossRef]
  34. Maseer, Z.K.; Yusof, R.; Bahaman, N.; Mostafa, S.A.; Foozy, C.F.M. Benchmarking of machine learning for anomaly based intrusion detection systems in the CICIDS2017 dataset. IEEE Access 2021, 9, 22351–22370. [Google Scholar] [CrossRef]
  35. Singh Panwar, S.; Raiwani, Y.; Panwar, L.S. Evaluation of Network Intrusion Detection with Features Selection and Machine Learning Algorithms on CICIDS-2017 Dataset. In Proceedings of the International Conference on Advances in Engineering Science Management & Technology (ICAESMT)-2019, Uttaranchal University, Dehradun, India, 14–15 March 2019. [Google Scholar]
  36. Bergstra, J.; Bardenet, R.; Bengio, Y.; Kégl, B. Algorithms for hyper-parameter optimization. Adv. Neural Inf. Process. Syst. 2011, 24, 2546–2554. [Google Scholar]
Disclaimer/Publisher’s Note: The statements, opinions and data contained in all publications are solely those of the individual author(s) and contributor(s) and not of MDPI and/or the editor(s). MDPI and/or the editor(s) disclaim responsibility for any injury to people or property resulting from any ideas, methods, instructions or products referred to in the content.

Article Metrics

Citations

Article Access Statistics

Multiple requests from the same IP address are counted as one view.