Abstract
There has been a great deal of research in the area of using graph engines and graph databases to model network traffic and network attacks, but the novelty of this research lies in visually or graphically representing the Reconnaissance Tactic (TA0043) of the MITRE ATT&CK framework. Using the newly created dataset, UWF-Zeekdata22, based on the MITRE ATT&CK framework, patterns involving network connectivity, connection duration, and data volume were found and loaded into a graph environment. Patterns were also found in the graphed data that matched the Reconnaissance as well as other tactics captured by UWF-Zeekdata22. The star motif was particularly useful in mapping the Reconnaissance Tactic. The results of this paper show that graph databases/graph engines can be essential tools for understanding network traffic and trying to detect network intrusions before they happen. Finally, an analysis of the runtime performance of the reduced dataset used to create the graph databases showed that the reduced datasets performed better than the full dataset.
1. Introduction
In the past decade, the number of IoT (internet of things) devices connected to the internet has significantly increased. It is expected that 43 billion IoT devices will be connected by the end of 2023 [1]. As the number of connected devices grows, so will the network traffic and the amount of data transmitted. Because IoT devices are used in industries that use sensitive data (for example, healthcare and the financial sector), not only is it imperative that the data maintain their integrity and are uncompromised during transit and at rest, but it is also important that we try to prevent network attacks before they happen. To do this properly, not only do we need to possess the ability to distinguish between regular network traffic and attack traffic, but we also need to possess the ability to detect attacks before they happen.
Many studies have been performed on identifying attack network traffic after the attacks have happened [2,3,4,5], but in this work we are trying to study the step before that—that is, identifying who is trying to gather information about our system so that they can perform an attack. Hence, our aim in this work is to analyze the Reconnaissance Tactic (TA0043) of the MITRE ATT&CK framework. The Reconnaissance Tactic of the MITRE ATT&CK framework is used to gather information about vulnerabilities in a system [6], mostly by active scanning. Understanding the nature of reconnaissance being performed in a system is very important to be able to prevent future attacks before they happen. In this work, we use a graph engine or graph database to present visual representations of the Reconnaissance Tactic. Although the focus is on the Reconnaissance Tactic, we also present visual representations of regular network traffic and other attack traffic labeled as per the MITRE ATT&CK framework.
Graph databases, by definition, are no-SQL databases based on a network structure and on mathematical graph theory. Graphs are composed of three different types of objects: vertices, edges, and properties. Vertices, or points, are used to represent entities of data that correspond to some object. Edges, or lines, represent relationships between various vertices; these connections may be unidirectional or bidirectional [7]. Properties are attributes of the objects. In this work, vertices correspond to different machine IPs that are communicating, edges represent the connections between different machines, and properties are different attributes that correspond to the edges, such as connection duration.
Graphs and graph databases can be utilized to generate graph models to represent relationships. In addition to visualizations representing attack/non-attack data, graph data models can be extremely useful, especially in cybersecurity, because these models can be utilized for pattern recognition, machine learning, and other analysis. Graph databases can be used to generate predictions to distinguish between regular network traffic patterns and attack patterns [8].
Although there has been a great deal of research in the area of using graph engines and graph databases to model network traffic and network attacks, the novelty of this research lies in visually or graphically representing the Reconnaissance Tactic (TA0043) of the MITRE ATT&CK framework. Using the newly created dataset, UWF-ZeekData22 [9,10], labeled based on the MITRE ATT&CK framework, patterns involving network connectivity, connection duration, and data volume were found from the Conn Log files of UWF-ZeekData22 [9,10] and loaded into a graph environment. Hence, to elaborate on the novelty of this research, the following can be stated:
- To date, tactics from the MITRE ATT&CK framework have not been visualized graphically. This work focuses on presenting graphical visualizations of the MITRE ATT&CK Reconnaissance Tactic (TA0043) using graph representation.
- Essential feature selection was performed so that this work generated a graph data model using only a very limited set of network connection features. Feature generation was also performed using the limited set of network connection features.
Although this is beyond the scope of this work, the benefits of this graphical representation could be realized as follows in the future:
- The graph models could be effectively used to train machine learning models, especially in the big data environment, in order to accurately predict when network traffic is nefarious.
- The reduction of the network data to only a few features (feature selection) that could be used to identify the Reconnaissance Tactic would be computationally beneficial in machine learning analysis, especially in the big data environment.
- Above all, these graph models can be used to develop a more robust threat intelligence platform (TIP) that would be able to visually detect the attacks before they happen, by recognizing the attack patterns in the data. A TIP is a technology solution that collects, aggregates, and organizes threat intelligence.
Finally, in this work, we conducted an analysis of the runtime performance in creating the graph representations with the reduced set of data.
The rest of this paper is organized as follows: Section 2 presents previous works related to graph databases; Section 3 presents the dataset and the software used to process the data; Section 4 presents the preprocessing that was used on this dataset; Section 5 presents the algorithmic approach to creating the graphs; Section 6 presents data visualizations using graph databases; Section 7 presents the runtime performance for creating the graph databases; Section 8 presents the conclusions; and Section 9 presents prospects for future works.
2. Related Works
Although there are quite a few papers on graph databases, no papers have approached graph databases from the angle of visualizing the Reconnaissance Tactic, labeled as per the MITRE ATT&CK framework. The authors of [7,11,12,13,14] utilized graphs to represent network connectivity for the purpose of identifying anomalies. Interpretation of the graph data to detect anomalies has been a challenging task in relation to summarizing normal data while retaining enough information to detect anomalies [11]. Identifying motifs and comparing multiple graphs for similarity using various motifs becomes challenging as the graph size increases [12].
A named-entity recognizer (NER) was proposed by one group of authors, allowing for the training of an extractor to obtain useful information from the MITRE ATT&CK framework. The multistep approach to building a knowledge base included collection and analysis, construction of an ontology from the information gathered and, finally, generation of a cybersecurity knowledge deduction engine [7].
Another group of researchers approached the problem through an abstracted graph approach, where flexible attack profiles were created and used to detect simulated attacks. Utilizing a graph database, the team proposed the possibility of not only identifying the attacker but also detecting other impacted system components [13], but this group used log data of a simulated computer network for graphical analysis to successfully detect simulated attacks. Also, this group looked at advanced persistent threats.
Ref. [14] compared similarities between graphs using a novel neural network approach. Important vertices would be identified by a specific similar metric, and a pairwise vertex comparison would be utilized to identify similarity. The group concluded that the first steps were made at bridging the gap between graph deep learning and the graph search problem.
Ref. [15] considered temporal aspects associated with vulnerabilities, such as the availability of exploits and patches, and how these vulnerabilities are interconnected and leveraged to comprise the system. They used a vulnerability lifecycle model to measure the total vulnerability.
Ref. [16] presented a distributed algorithm for detecting cycles in large-scale directed graphs. This algorithm also found strong components in directed graphs. Ref. [11] looked at finding the most anomalous nodes from node-labeled directed weighted graphs.
Quite a few papers have looked at graph similarity measures [17,18,19], which could be used to detect anomalous patterns, although these papers did not directly address the issue of cybersecurity data.
From the related works, it is apparent that the work in this paper is unique. First, this paper uses data from the MITRE ATT&CK framework, which has not previously been used. Second, the idea in our work is to get away from solely using edges in creating the graphs. That is, this paper presents network hops between the source and destination, which result in detecting the MITRE ATT&CK technique. Our work also demonstrates the successful utilization of motifs to visually identify behavior patterns representing an attack tactic. Finally, an analysis is conducted of the runtime performance for creating the graph representations and databases with the reduced set of data.
3. The Dataset: UWF-ZeekData22
Since graph data models depend on the connections between data points, the Conn Log files of UWF-ZeekData22 [9,10] were used for generating the graphs. UWF-ZeekData22 [9,10] was generated by the Cyberrange group associated with the University of West Florida, and the full dataset is available at [10]. This dataset has 9,280,869 attack records and 9,281,599 benign records, for a total of 18,562,468 records.
The data schema of the Conn Log files is presented in Table 1. To generate the graphs, only four fields from the Conn Log files were used in addition to count: id.orig_h (the source IP, referred to as srcIP in this paper), id.resp_h (the destination IP, referred to as dstIP in this paper), duration, and orig_bytes (referred to as bytes).
Table 1.
UWF-ZeekData22: schema of the Conn Log files [9,10].
3.1. Distribution of UWF-ZeekData22 by Tactics
Table 2 presents tactics available in UWF-ZeekData22. For this analysis, initially, the data was divided into four categories by attack tactic: Reconnaissance, Discovery, No Attack, and All Attack Tactics. Reconnaissance and Discovery were selected because they had more data. No Attack was selected to visualize how normal network traffic would appear without abnormal traffic included. The All Attack Tactics dataset was selected to visualize how normal and abnormal network traffic would appear. Since the volume of data for Discovery was eventually not considered to be enough for a robust analysis, this category was also not further analyzed in this work. Hence, ultimately, a full analysis is presented of only the Reconnaissance Tactic, non-attack data, and all data (which also include the Reconnaissance and Discovery). The other categories were also not analyzed individually, due to the minimal occurrences of the other tactics.
Table 2.
UWF-ZeekData22 tactics [10].
3.2. Software Utilized to Process Data
Python and PySpark were utilized, as GraphFrames is readily available in this environment. In order to visualize the graph data, GraphStreams [20] was used, since it has a feature-rich library. GraphStreams [20] was implemented in the Java environment.
4. Preprocessing
Using the Conn dataset from UWF-Zeekdata22 [9,10], a unique list of source and destination IP addresses was generated using a simple hash map. A graph was created using the unique list as graph vertices, naming the vertices based on whether they were a source IP or destination IP. Once the graph vertices were created, edges were established and weighted based on the following dominant attributes:
- Destination ip (id.resp_h) and originating bytes (orig_bytes), used as per [21].
- Total number of connections between the unique source and destination.
- Total duration of the connection(s) between the vertices.
- Total number of bytes of the connections between vertices.
- The attack tactic.
First, this information was used to generate a PySpark vertex and edge list. Then, this information was used to create a GraphFrame in order to determine vertex and edge relationships and graph shapes. The objective was to look for two primary structures in the graphs: star motifs and clique motifs. Star motifs are where a single vertex connects to multiple vertices, while clique motifs are where the largest set of interconnected vertices is identified. Stars in a graph are defined as having n-1 vertices with a degree of 1 and a single vertex having a degree of n − 1 [22]. The Bron–Kerbosch algorithm [23] was utilized to find maximal cliques. This algorithm finds the largest connected vertices that produce the unique clique.
Additional effort was taken to scan the vertices and edges to find and eliminate intermediate vertices, revealing true endpoints in the graph. In order to do this, cycles had to be identified and eliminated. The approach taken initially was to use depth-first search (DFS), but due to the number of vertices in the graph a dynamic algorithmic approach was taken to minimize recursive code. The dataset was reduced to tables of unique source and destination addresses and accumulated connections, durations, and bytes transmitted. These vertices were then used to construct a graph, eliminating any edges that would result in a cycle. Eliminating cycles provided for a minimally connected graph that was easier and faster to traverse when connecting the source of an attack to its destination. Elimination of the cycles did not impact the underlying graph, as all vertices were still reachable by other adjacent vertices [24]. Elimination of the cycles reduced the edges needed to create the graph and thus produced a more concise graph. This allowed for identifying motifs of interest, as they stood out from the background of random interconnections that were not of interest [25].
Binning
Binning allowed for continuous data to be represented in various discrete categories or bins. In order to best characterize the data, the following attributes of the edge connections were binned: number of connections, average duration, and average bytes. In order to bin the data, the methodology outlined by the authors of [21] was utilized; however, a stationary mean was implemented instead of a moving mean. The standard deviation was first calculated by using the following formula:
where x is the attribute that is being binned, is the average of the attribute, and n is the number of data points. Six bins were then constructed using the calculated standard deviation, as follows:
Each of the three edge attributes was assigned a bin, determined by which bin the attribute’s value landed in. Because the data had a large variance, and thus a large deviation, the first two bins were negative for some of the attributes.
After using Equation (1) to calculate the standard deviation for the count attribute for the full Reconnaissance dataset, Equations (2)–(7) were used to calculate the bins for the count attribute as follows:
To find which bin a value is in, the bin that overlaps the value is found. As an example, the value 1280 is between the values −248,084.578 and 16,963.973; therefore, this value resides in .
5. Algorithmic Approach to Creating the Graphs
5.1. Overview of Approach
UWF-ZeekData22 [9,10] was reduced to the source and destination IPs only, by removing intermediary vertices and cycles in an effort to remove network noise. To remove the intermediary vertices, a depth-first search (DFS) algorithm approach was taken, adding only edges that did not result in a cyclic graph. Due to the number of vertices in the graph, a dynamic algorithmic approach was taken to minimize recursive code. The dataset was reduced to tables of unique source and destination addresses and accumulated connections, durations, and bytes transmitted. These vertices were then used to construct graphs, eliminating any edges resulting in cycles. Graphical representations are presented of the Reconnaissance Tactic, as well as all attack and non-attack traffic.
5.2. Workflow
Figure 1 presents an overview of the process that was used in this work, from preprocessing and reducing the data to generating the graph visualizations.
Figure 1.
Process for generating graph visualizations from UWF-ZeekData22.
5.2.1. Reducing the Data
Since UWF-ZeekData22 [9,10] is a large dataset, one of the first objectives was to see if any kind of feature reduction could be applied. Hence, only the connection counts, bytes transferred, and connection data were aggregated to reduce the number of data points that would feed into the next graphing phase. Specifically, the duration and orig_bytes features from the Conn Log files of UWF-ZeekData22 [9,10] were aggregated by the unique source-to-destination key. These features were totaled and, additionally, new features were generated using duration and orig_bytes. The additional new features were average duration and average bytes.
5.2.2. Producing a Non-Cyclic Graph
Graphs were created using the IP addresses obtained in the previous phase, populating the edges with the aggregated counts, bytes, and duration values. As each edge was added to the graph, a check was performed to determine whether the new edge produced a cycle. If a cycle was created, the edge was removed from the graph. The final graph data were then written out as a CSV file for the next phase.
5.2.3. Binning
The CSV file from the previous phase was analyzed and binned as explained in the preprocessing section. The resulting bins replaced the original graph data, and a new CSV file was produced for the next phase.
5.2.4. Generating Visual Graph
The resulting graph data, now binned on count, bytes, and duration, were loaded into the GraphStream application, and visualization of the graphs was produced and used in this work.
5.3. Algorithmic Approach to Creating the Graphs
Each unique source-to-destination edge was identified and mapped. With each unique edge between the source and destination, a summation of attributes that were to be tracked was stored. A graph G of unique vertices was created. Iterating through all source vertices, an edge was added to the graph from source to destination and tested for the creation of a cycle in the graph. If a cycle was detected, then the last edge was removed. The final resulting graph produced the longest path between a given source vertex and its furthest destination vertex that did not result in a cycle. This allowed for the elimination of intermediate vertices and the detection of the final destination of an attack from a source.
If calling isCyclic method (Algorithm 1) for the Graph results in true, then a cycle has been encountered and the last vertex must be removed to remove the cycle. Analysis was performed to determine whether any meaningful correlation could be attributed to the attack tactic port numbers used by the source or destination. It was found that this information did not add any value to the graph; therefore, port was eliminated as a possible attribute of interest.
| Algorithm 1: isCyclic |
| Input: Graph G, vertex V to add Output: Boolean true if after adding V, the graph is cyclic, updated G, with vertex V added Add V to G Create and initialize visited array, recursionStack array Mark all vertices as unvisited in both visited and recursionStack forall vertex v in G Return isCyclicUtil (v, visited, recursionStack) isCyclicUtil (vertex, visited array, recurssionStack) if vertex visited before return false if vertex is in recursionStack return true Mark vertex as visited for vertex Mark recursionStack as visited for vertex forall children of vertex if isCyclic (childVertex, visited array, recursionStack) Return true Set recursionStack for vertex to false Return false |
6. Resulting Graph Visualizations
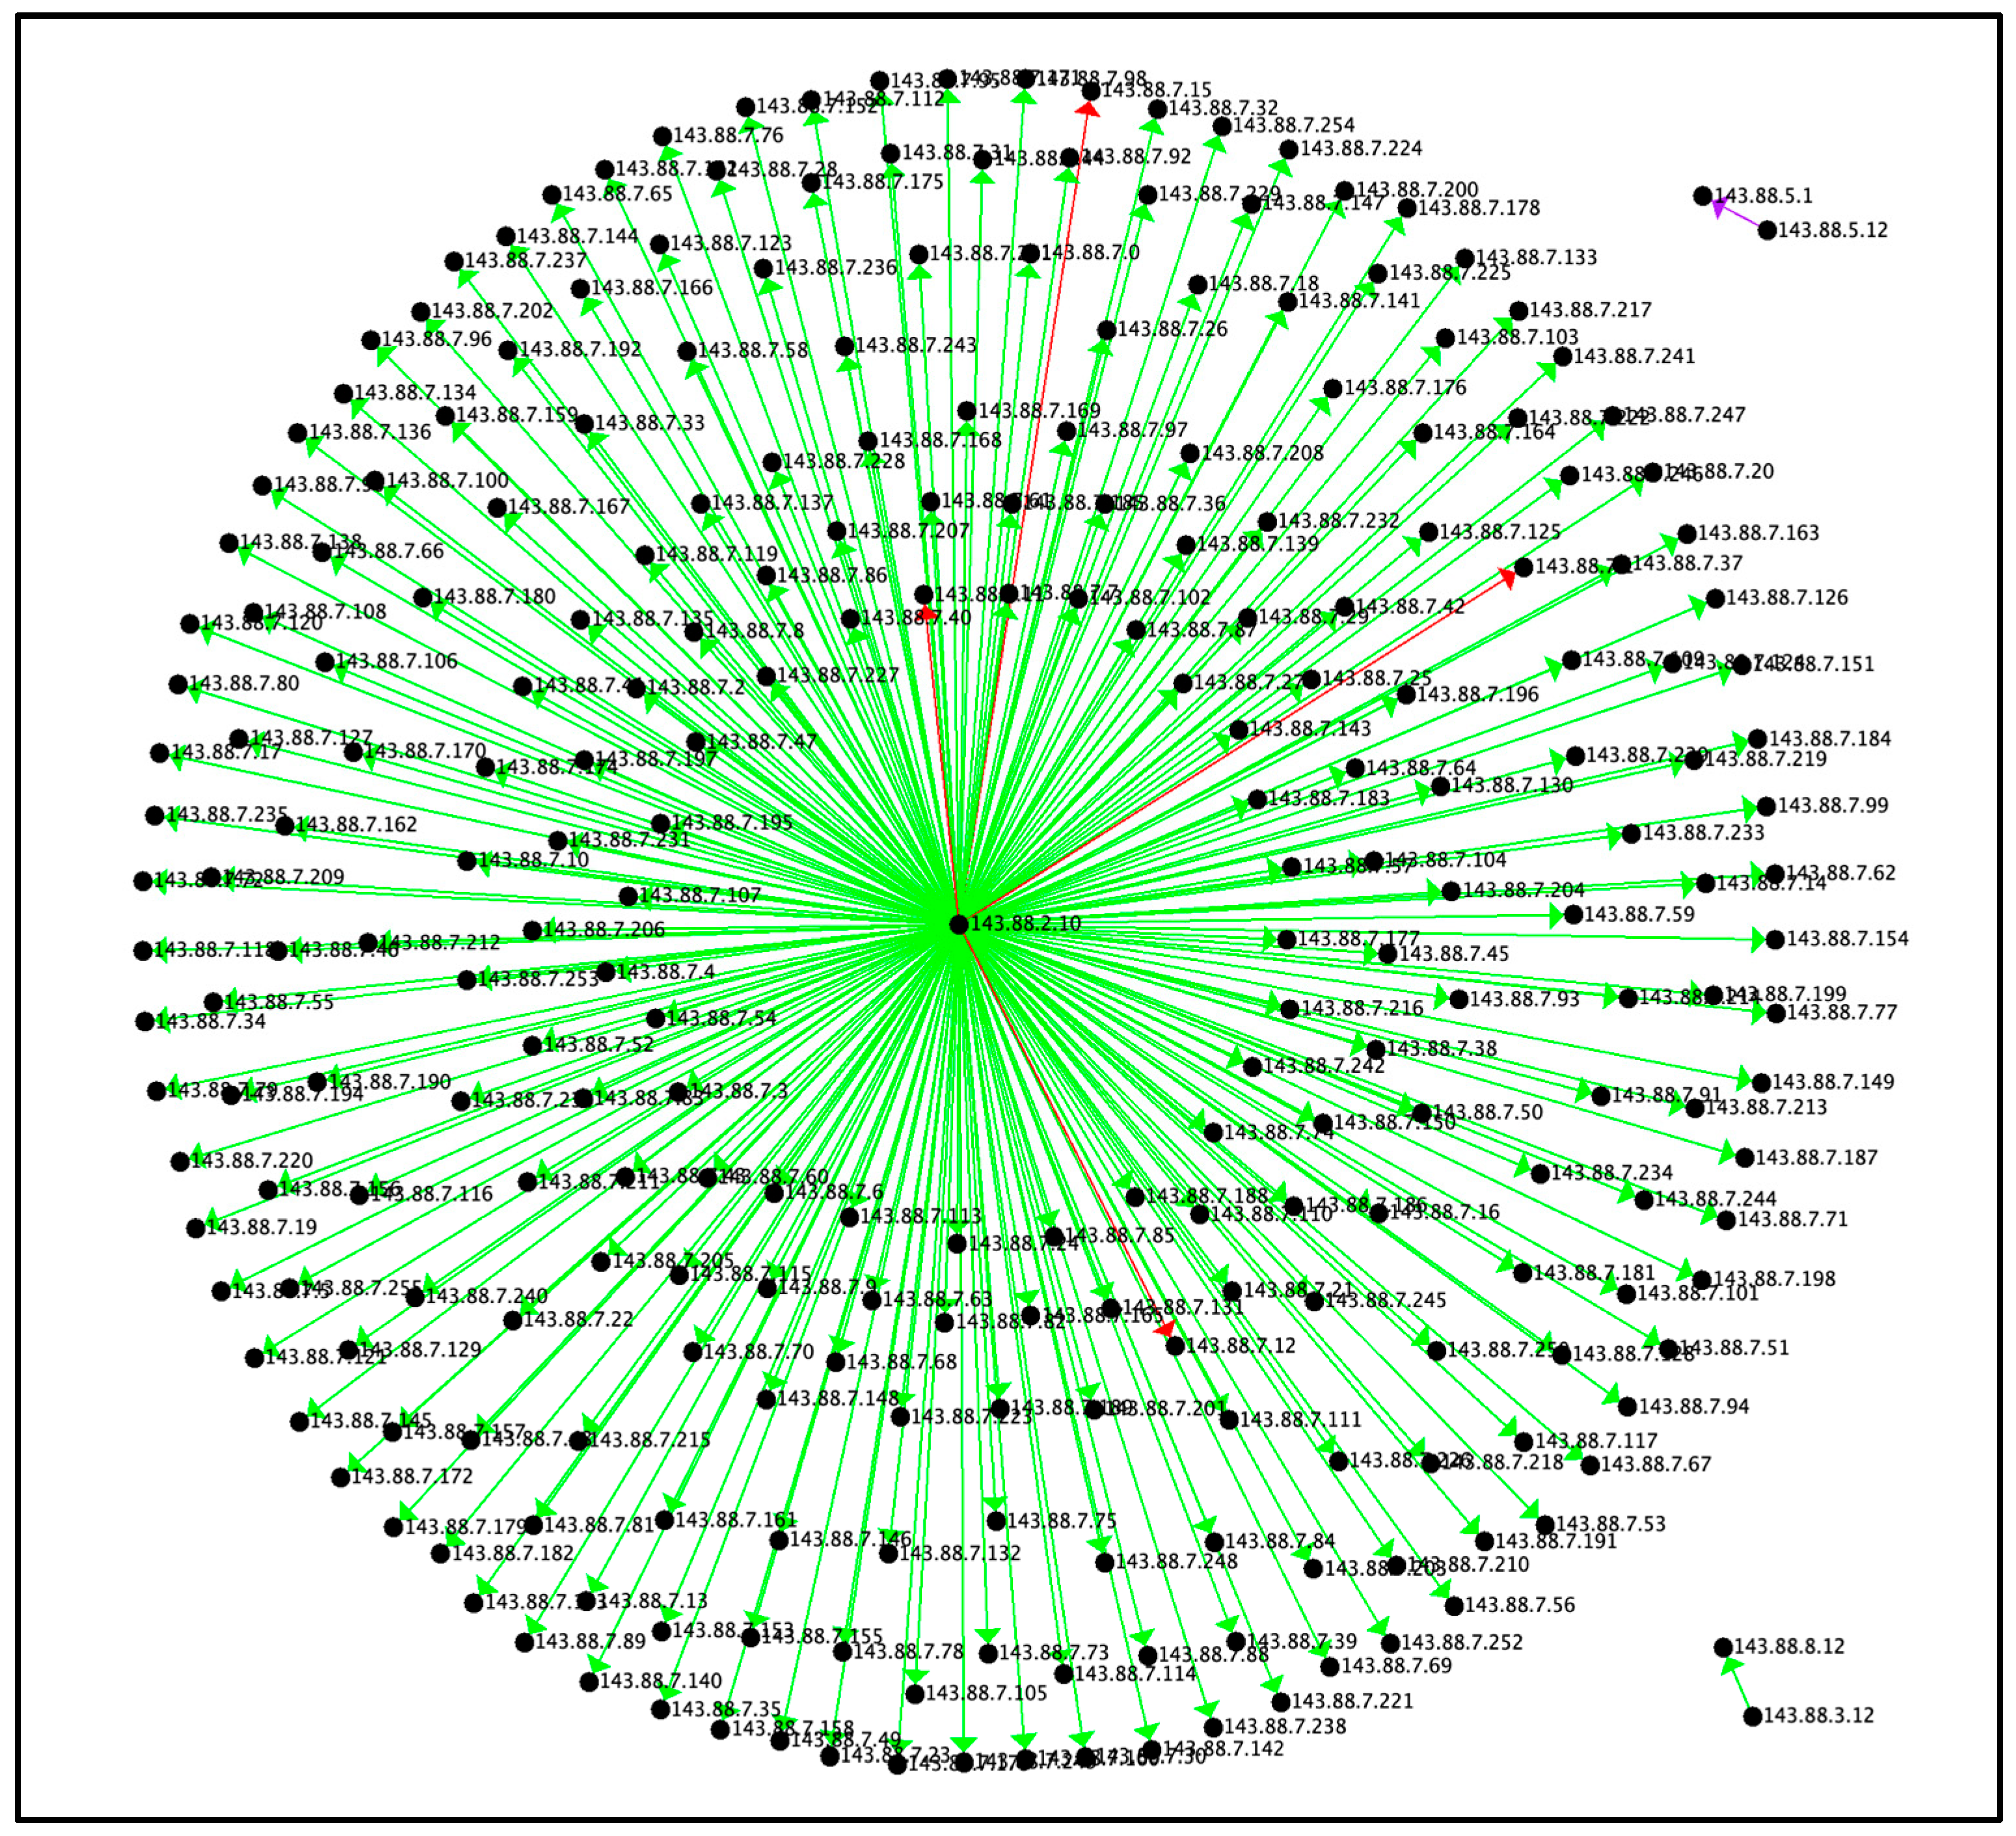
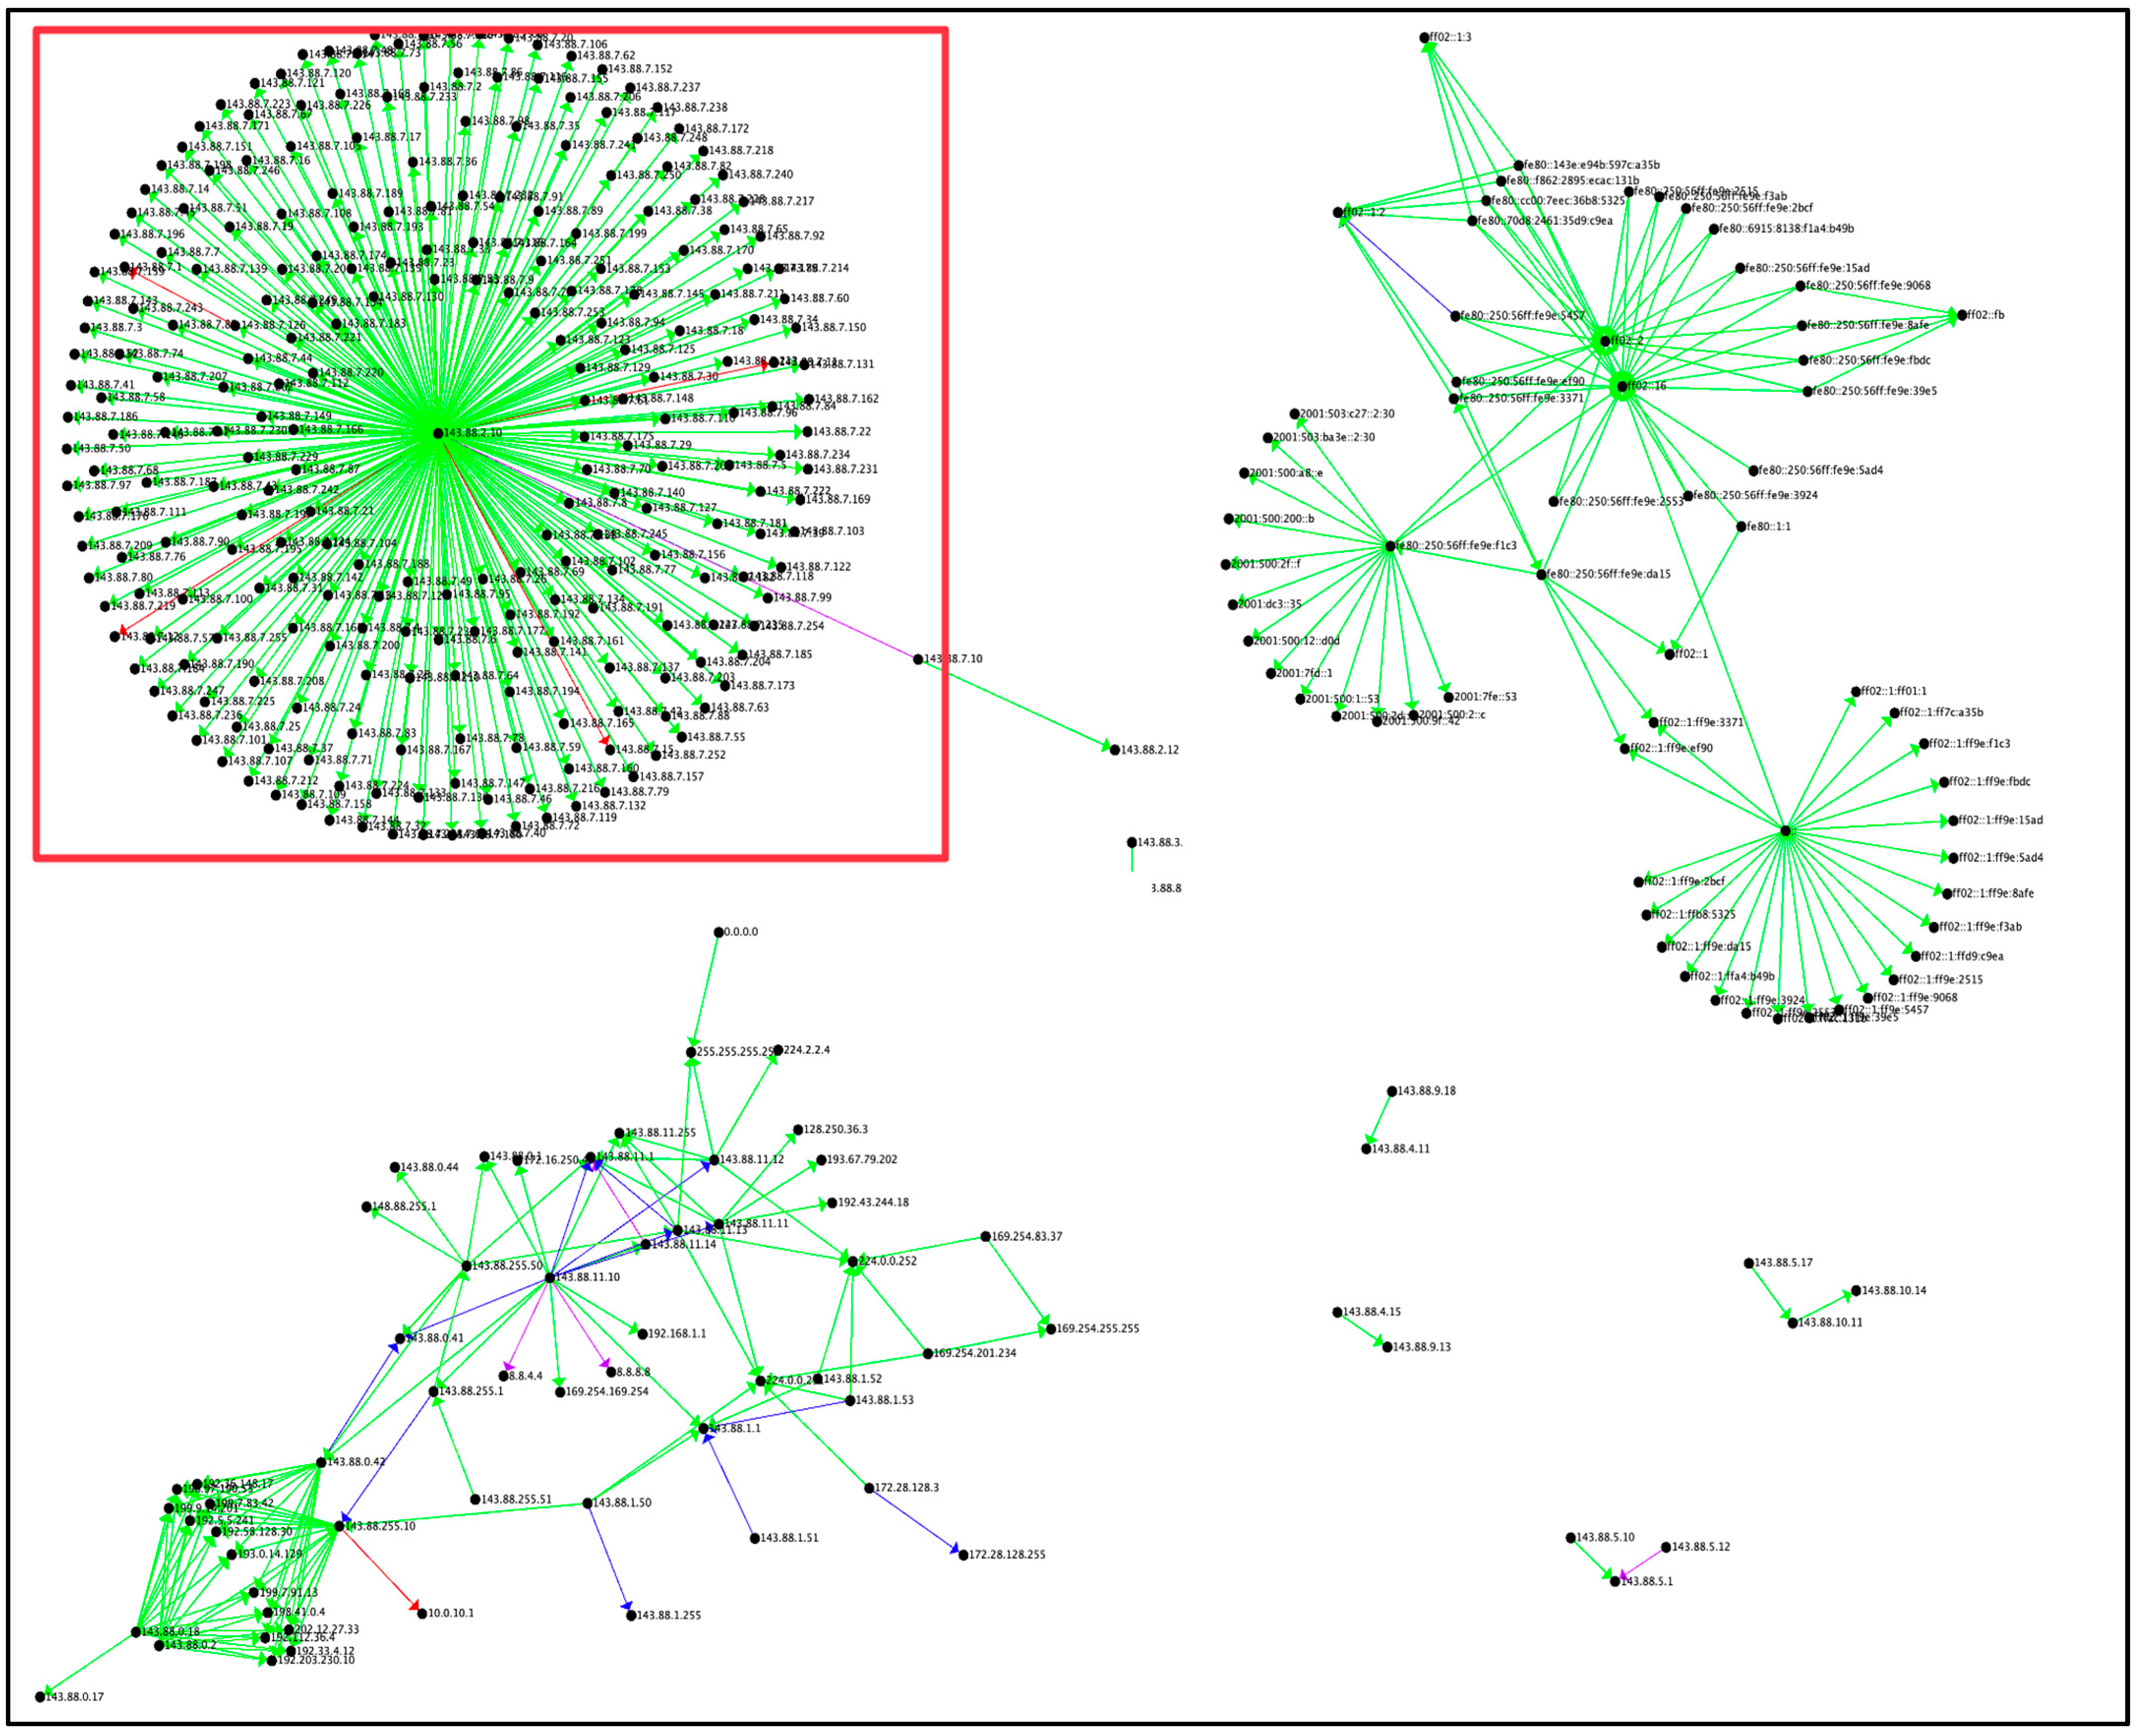
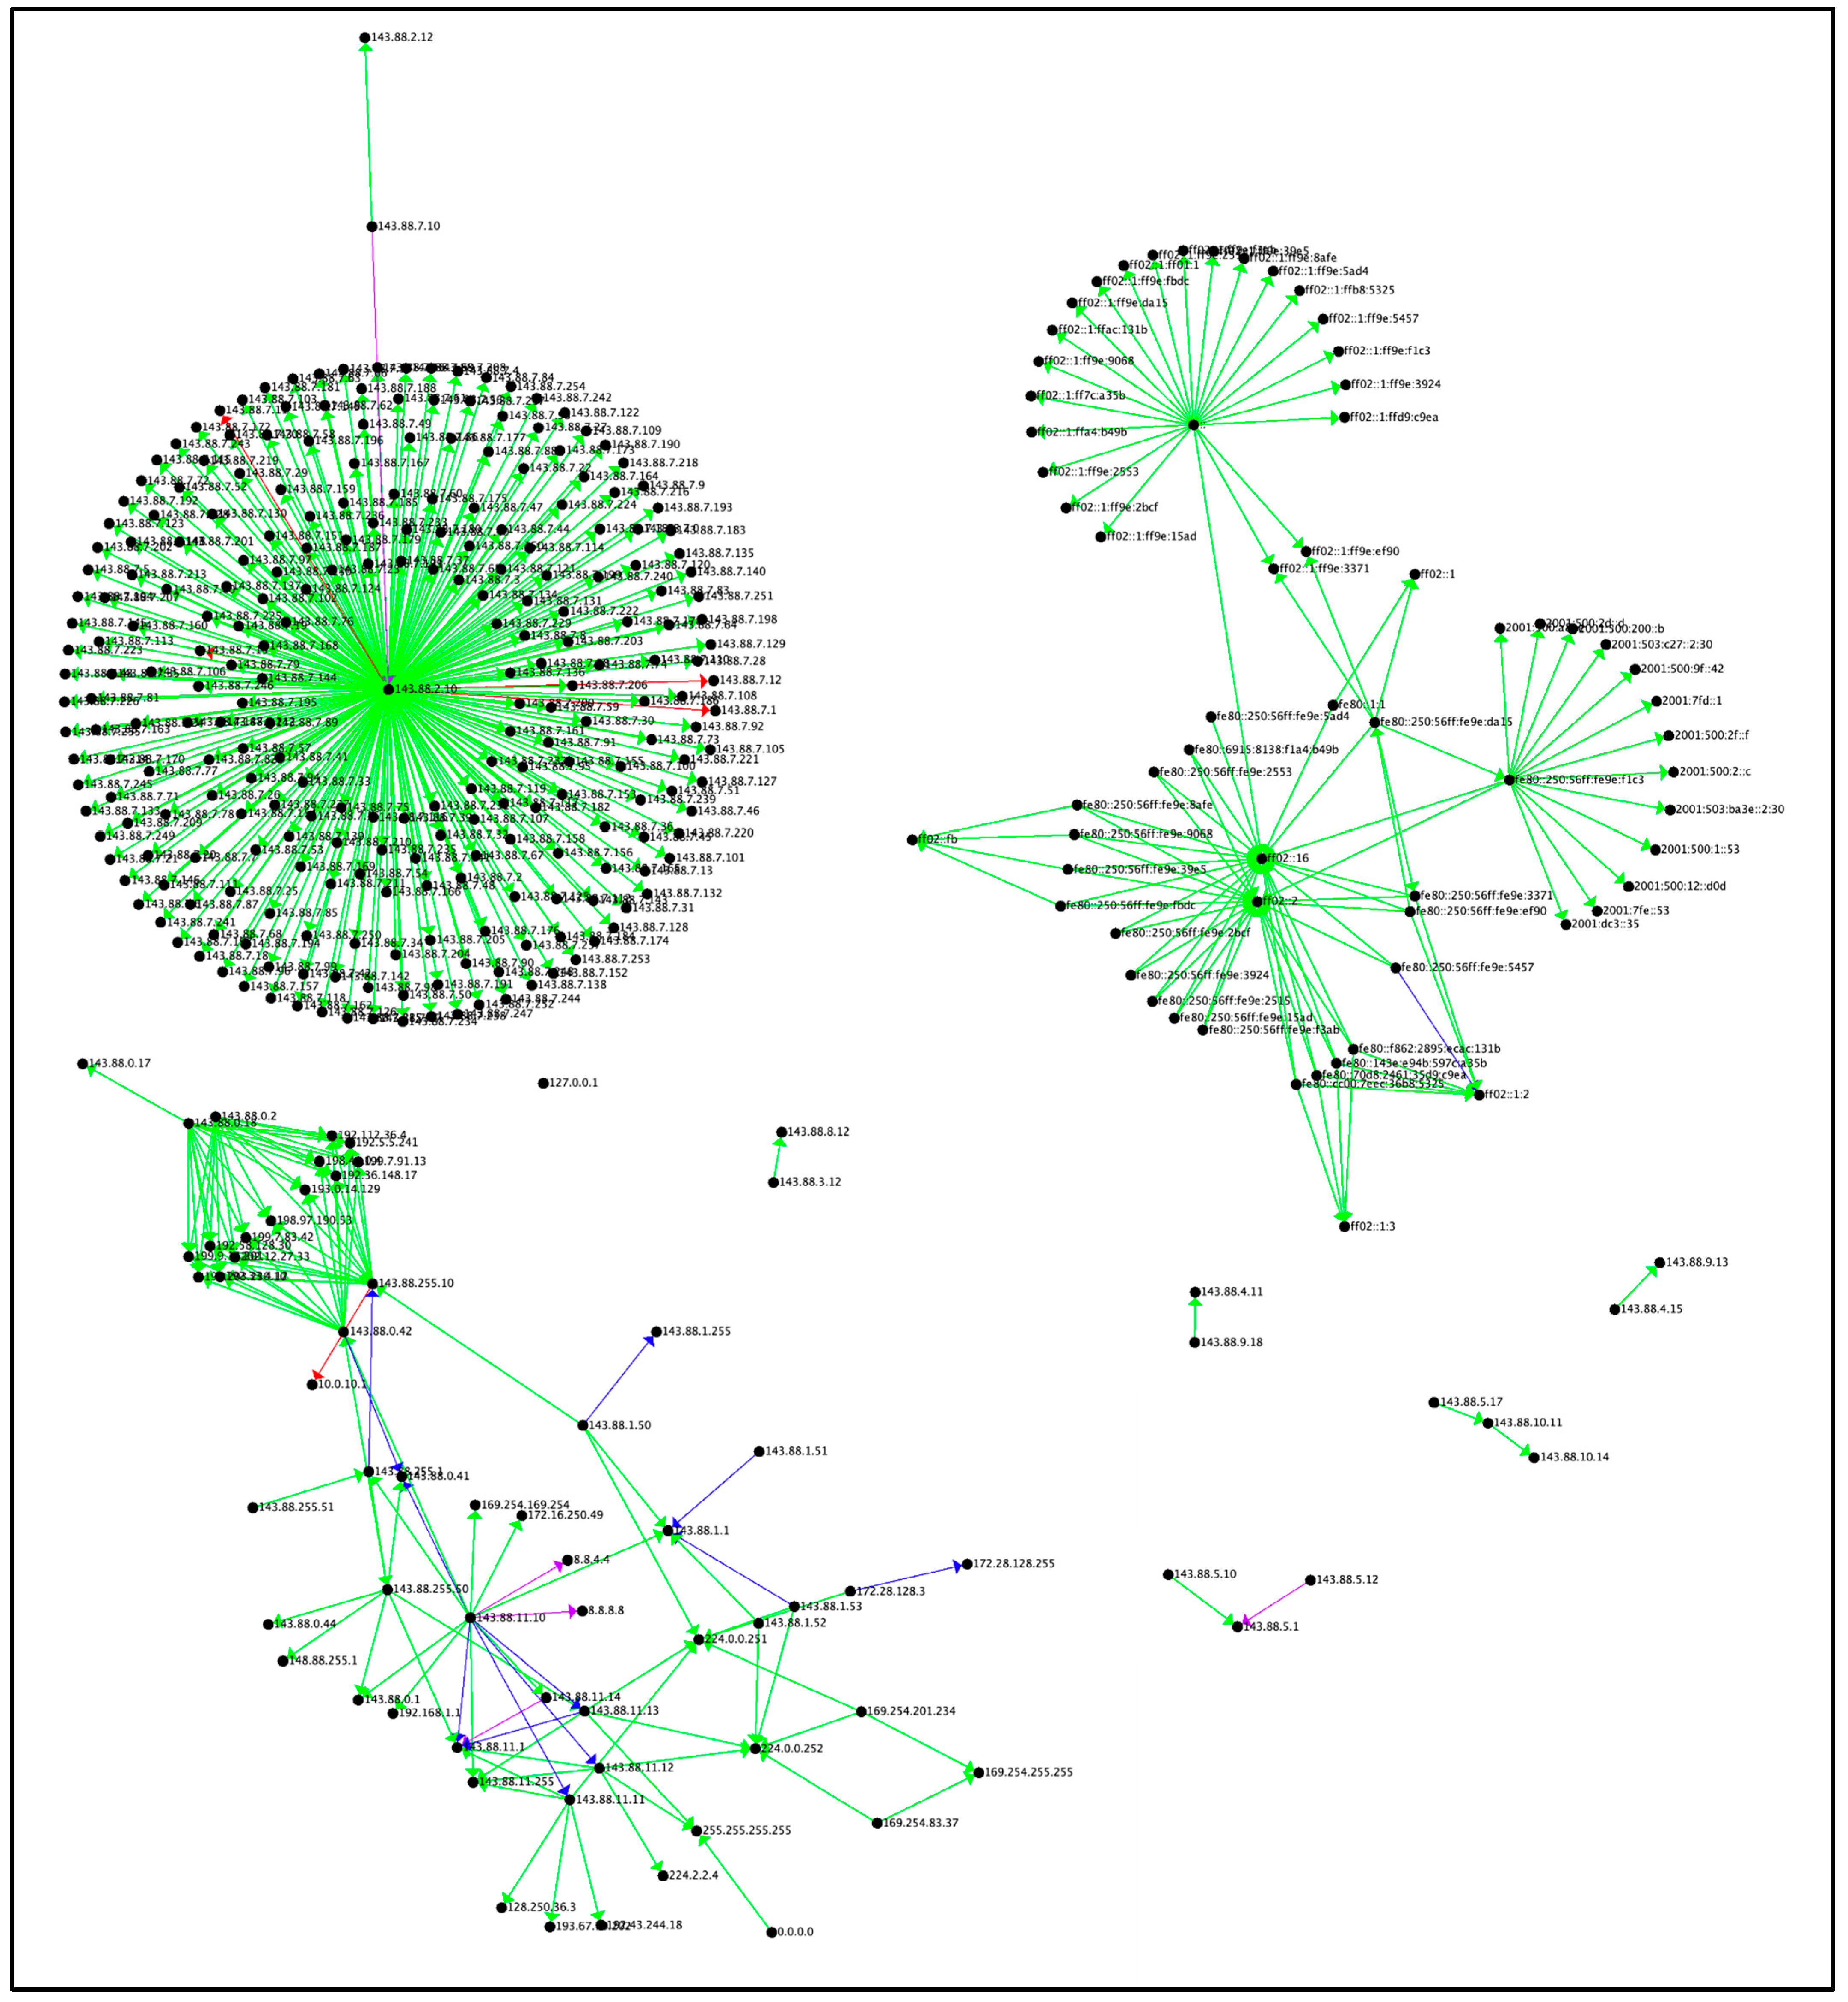
GraphStream [20] was utilized to generate graphical visuals for each of the subsets of the edges. GraphStream is a Java library used for modeling, visualizing, and analyzing dynamic networks of various sizes [20].
The data were fitted to different motif models to determine whether various attacks could be characterized by specific shapes. In the motifs (Figure 2, Figure 3, Figure 4, Figure 5, Figure 6, Figure 7 and Figure 8) that follow, the color of each edge represents the intensity/bin of the corresponding attribute that the graph represents. The colors—orange for bin 1, yellow for bin 2, green for bin 3, blue for bin 4, purple for bin 5, and red for bin 6—were used in order from least to highest intensity to represent the bin value ranges.
Figure 2.
Reconnaissance Tactic by connection count.
Figure 3.
Reconnaissance Tactic by average duration.
Figure 4.
Reconnaissance Tactic by average bytes.
Figure 5.
Maximal cliques found by connection count for UWF-ZeekData22.
Figure 6.
Non-Attack by connection count.
Figure 7.
All Attack Tactics by connection count.
Figure 8.
Noncyclic All Tactics by connection count.
6.1. Star Motif
As seen from Figure 2, Figure 3 and Figure 4, the Reconnaissance Tactic resembles the star motif, in which there is a central vertex from which the connections originate. All connections originate from the central vertex of 143.88.2.10. This indicates active scanning [26], typical of a Reconnaissance Tactic. In active scanning, an adversary probes a victim’s infrastructure network traffic by mechanisms such as port scanning. Port scanning classifies each port into a state of open, closed, filtered, unfiltered, open/filtered, or closed/filtered [27]. This helps an attacker determine which ports on a network are open and can be utilized to receive and send data. Figure 2, Figure 3 and Figure 4 represent the Reconnaissance motif by connection count, average duration, and average bytes, respectively.
6.1.1. Visualizing the Reconnaissance Tactic by Connection Count
Figure 2 depicts the Reconnaissance Tactic radiating from a single vertex, 143.88.2.10, to multiple other vertices in the graph. The number of connections from point to point was generally in the average range of connections, with the exception of a few that were in the extreme range of binning. Looking deeper into the data, it can be seen that each connection generally involves a different port; therefore, this graph is representative of a port scan, typical of a Reconnaissance Tactic. This graph has some areas of interest, represented by the red connections (bin = 6), where considerably more connections occur than the normal connection count (bin = 3), which was 1024 connections. Each of these bin 6 connections was in excess of 1 million. One outlier in the data was a connection between 143.88.5.12 and 143.88.5.1 (bin = 5) with ½ million connections. Example data points by connection count can be seen in Table 3. For the Reconnaissance Tactic, the maximum connection count was 3,112,192, while the minimum connection count was zero, and the average connection count was 33,927.946.
Table 3.
Reconnaissance points of interest (connection count).
It can also be noted from Figure 2 that 143.88.2.10 is mostly pointing to the 143.88.7.* addresses. The graph is actually pointing to the entire range of the subnet from 143.88.7.0-255. The red lines indicate where most of the bytes are being transmitted back and forth. This is highly likely because the four IP addresses belonged to virtual machines running on the victim’s network, and a reply from the victim’s network is indicative of an open port of a victim’s host.
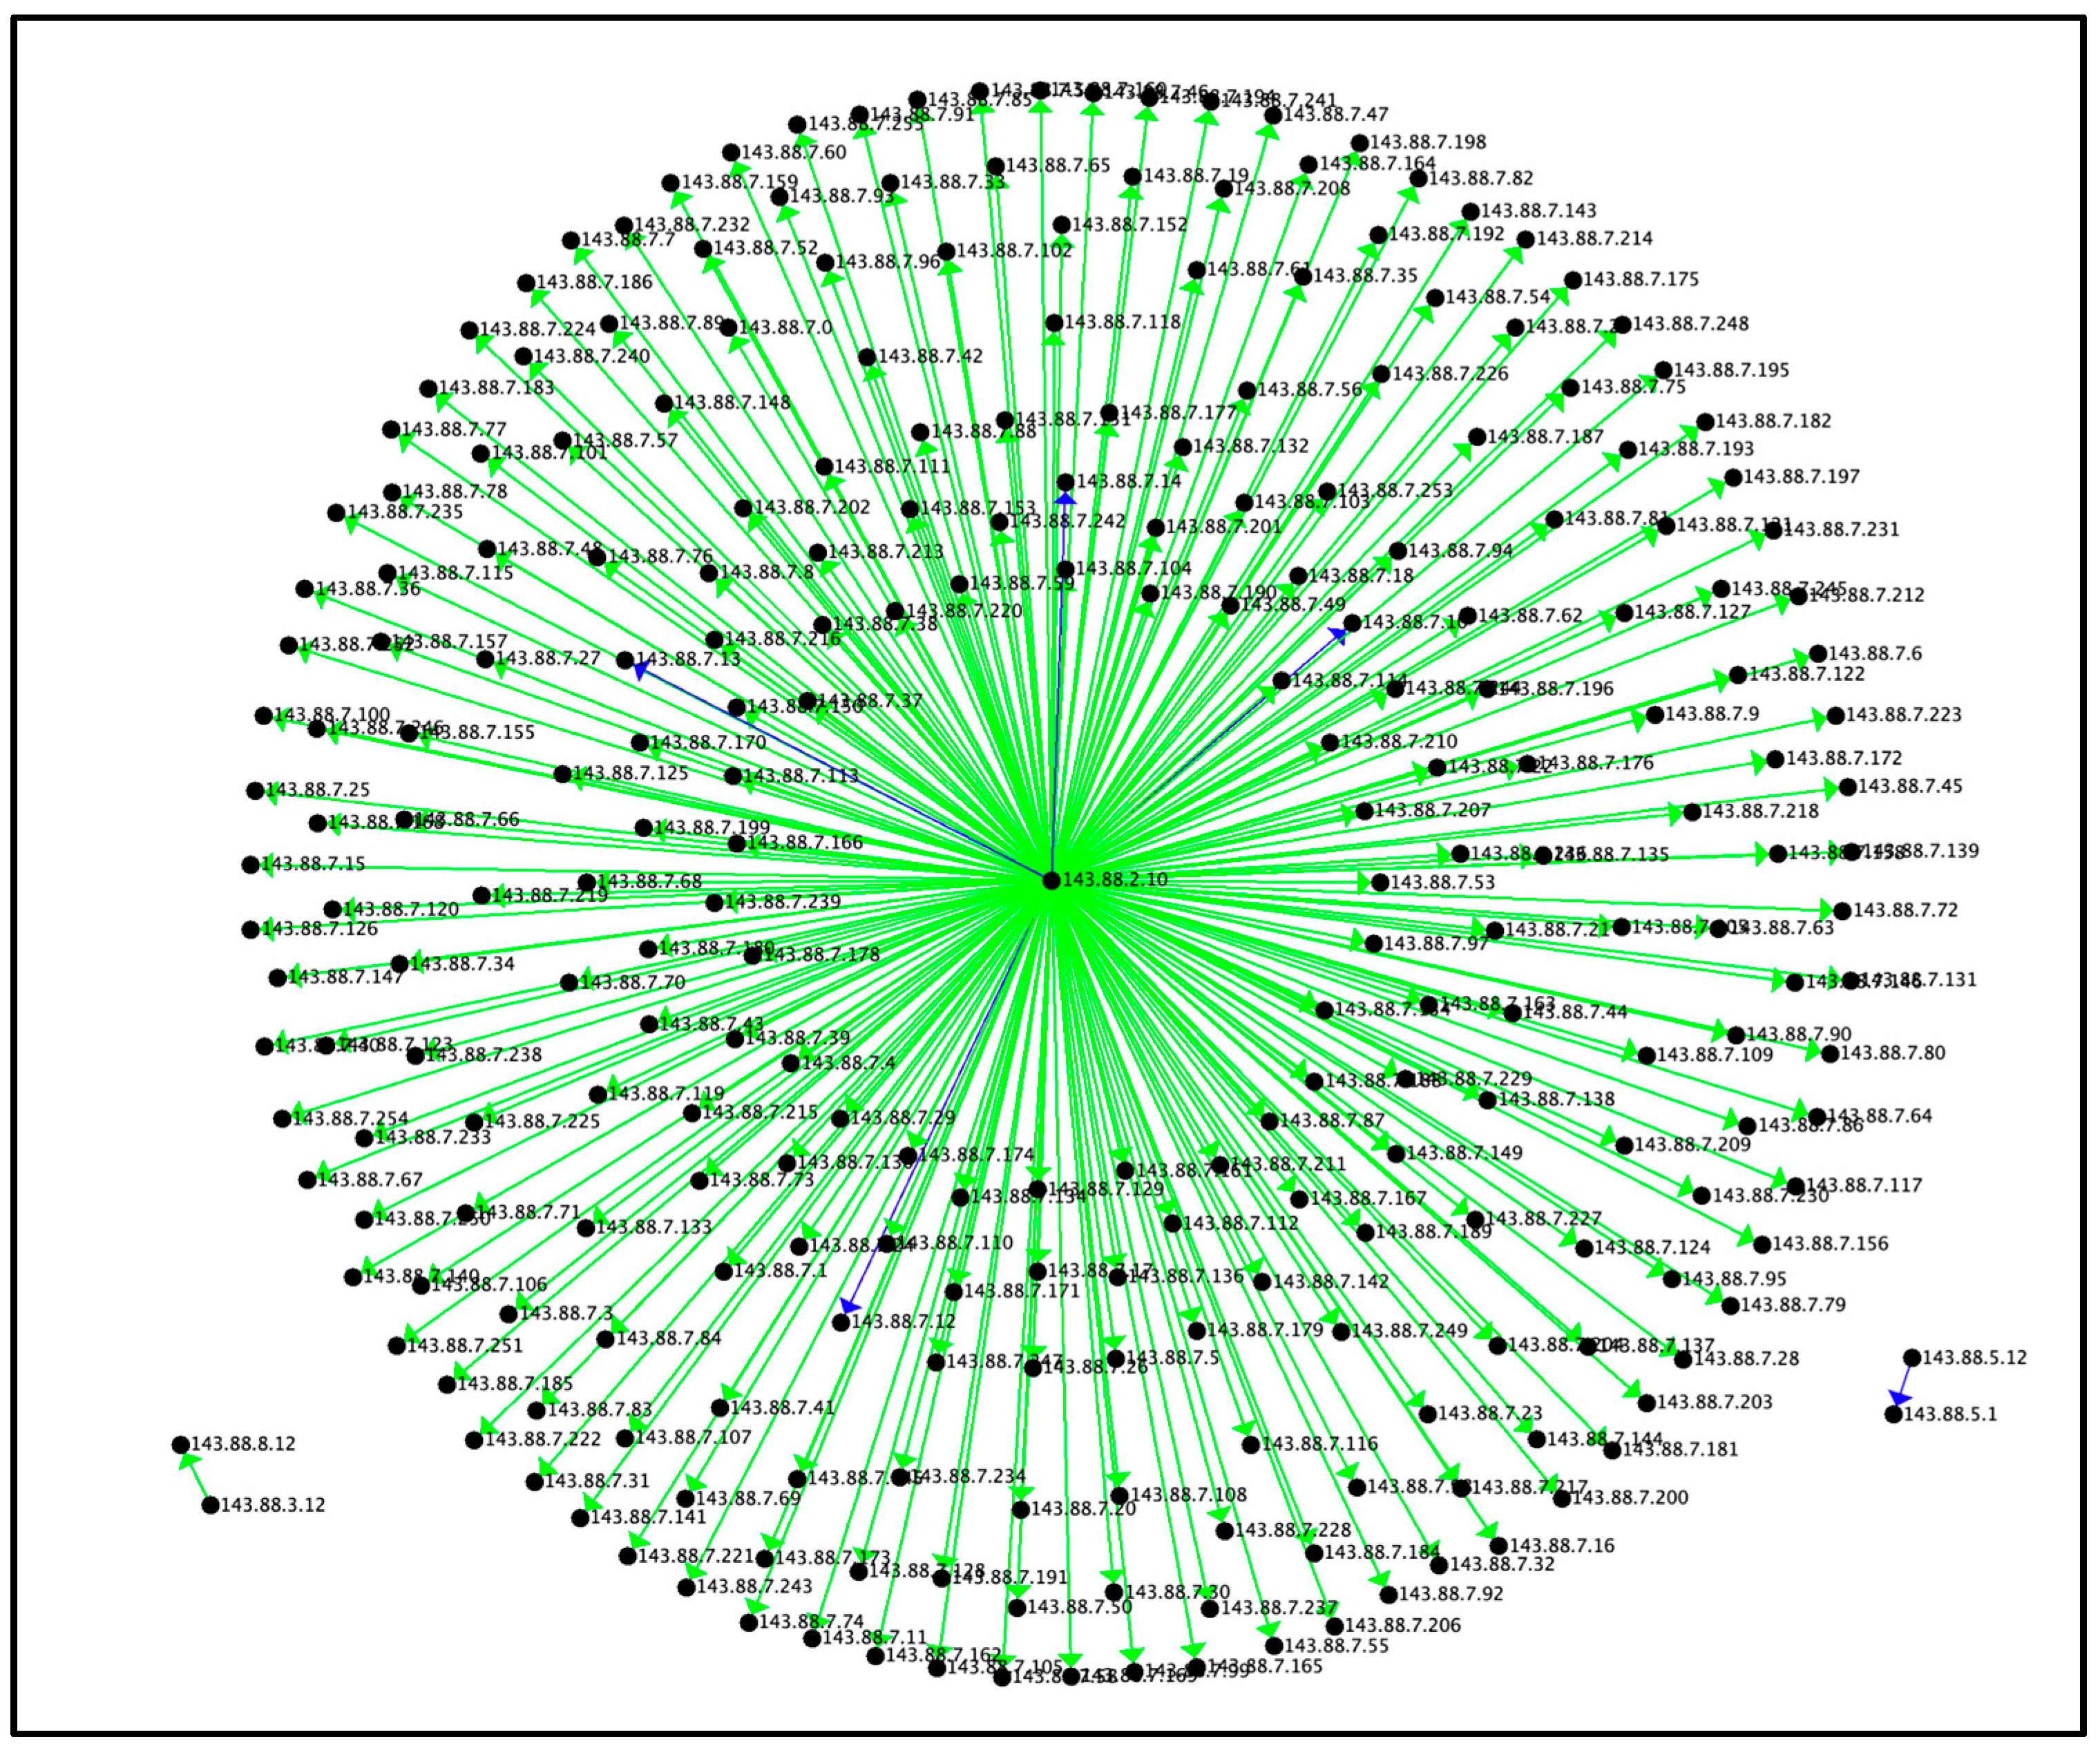
6.1.2. Visualizing the Reconnaissance Tactic by Average Duration
Figure 3 presents the visualization of the Reconnaissance Tactic by average duration. The average duration of the connections in the star motif did not identify areas of interest, as green (bin = 3) and blue (bin = 4) are average behaviors in this graph. The blue connections in Figure 3 correspond to the high connections found in Figure 2, although the duration per connection is considerably higher, ranging from 300 to 1700 times longer than the other connections in green. The connections in green transferred 0 bytes, whereas the connections in blue transferred data from between 2 bytes and 1.5 MB of data per connection. Sample data points for Reconnaissance points of interest based on average duration are presented in Table 4. The maximum duration was 972,063.54, the minimum duration was 0.04, and the average duration was 12,947.3263.
Table 4.
Reconnaissance points of interest (average duration).
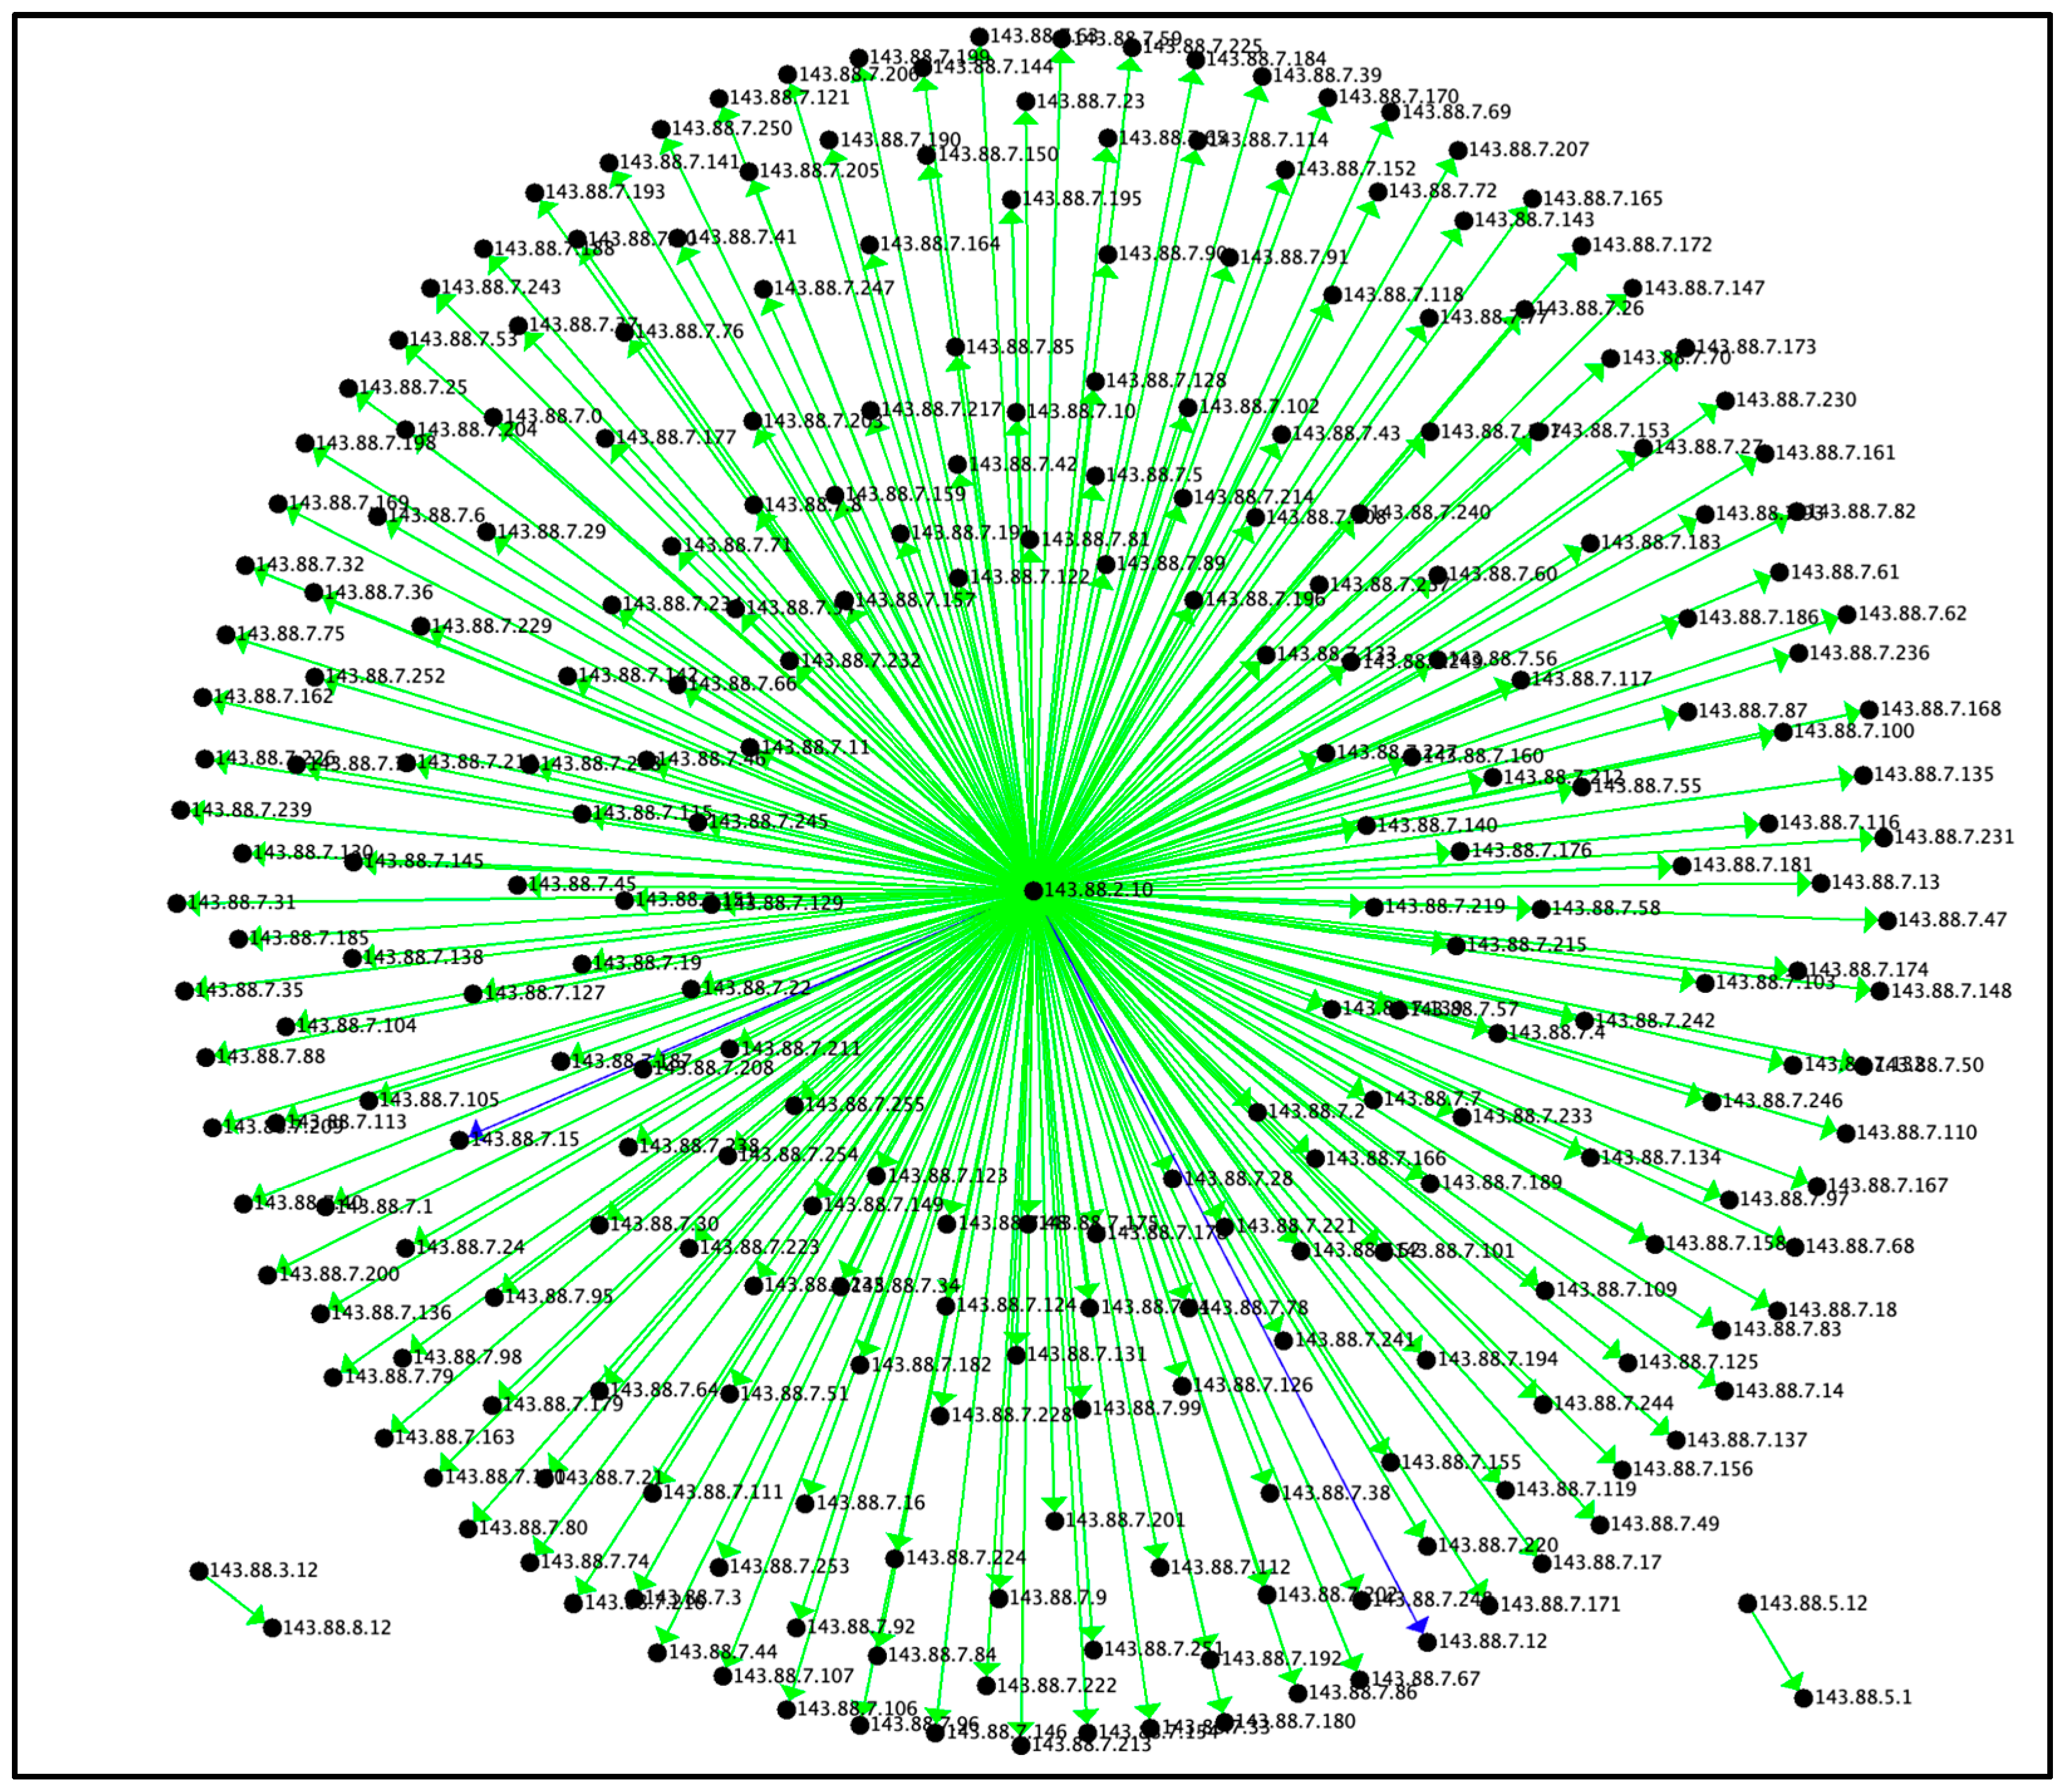
6.1.3. Visualizing the Reconnaissance Tactic by Average Bytes
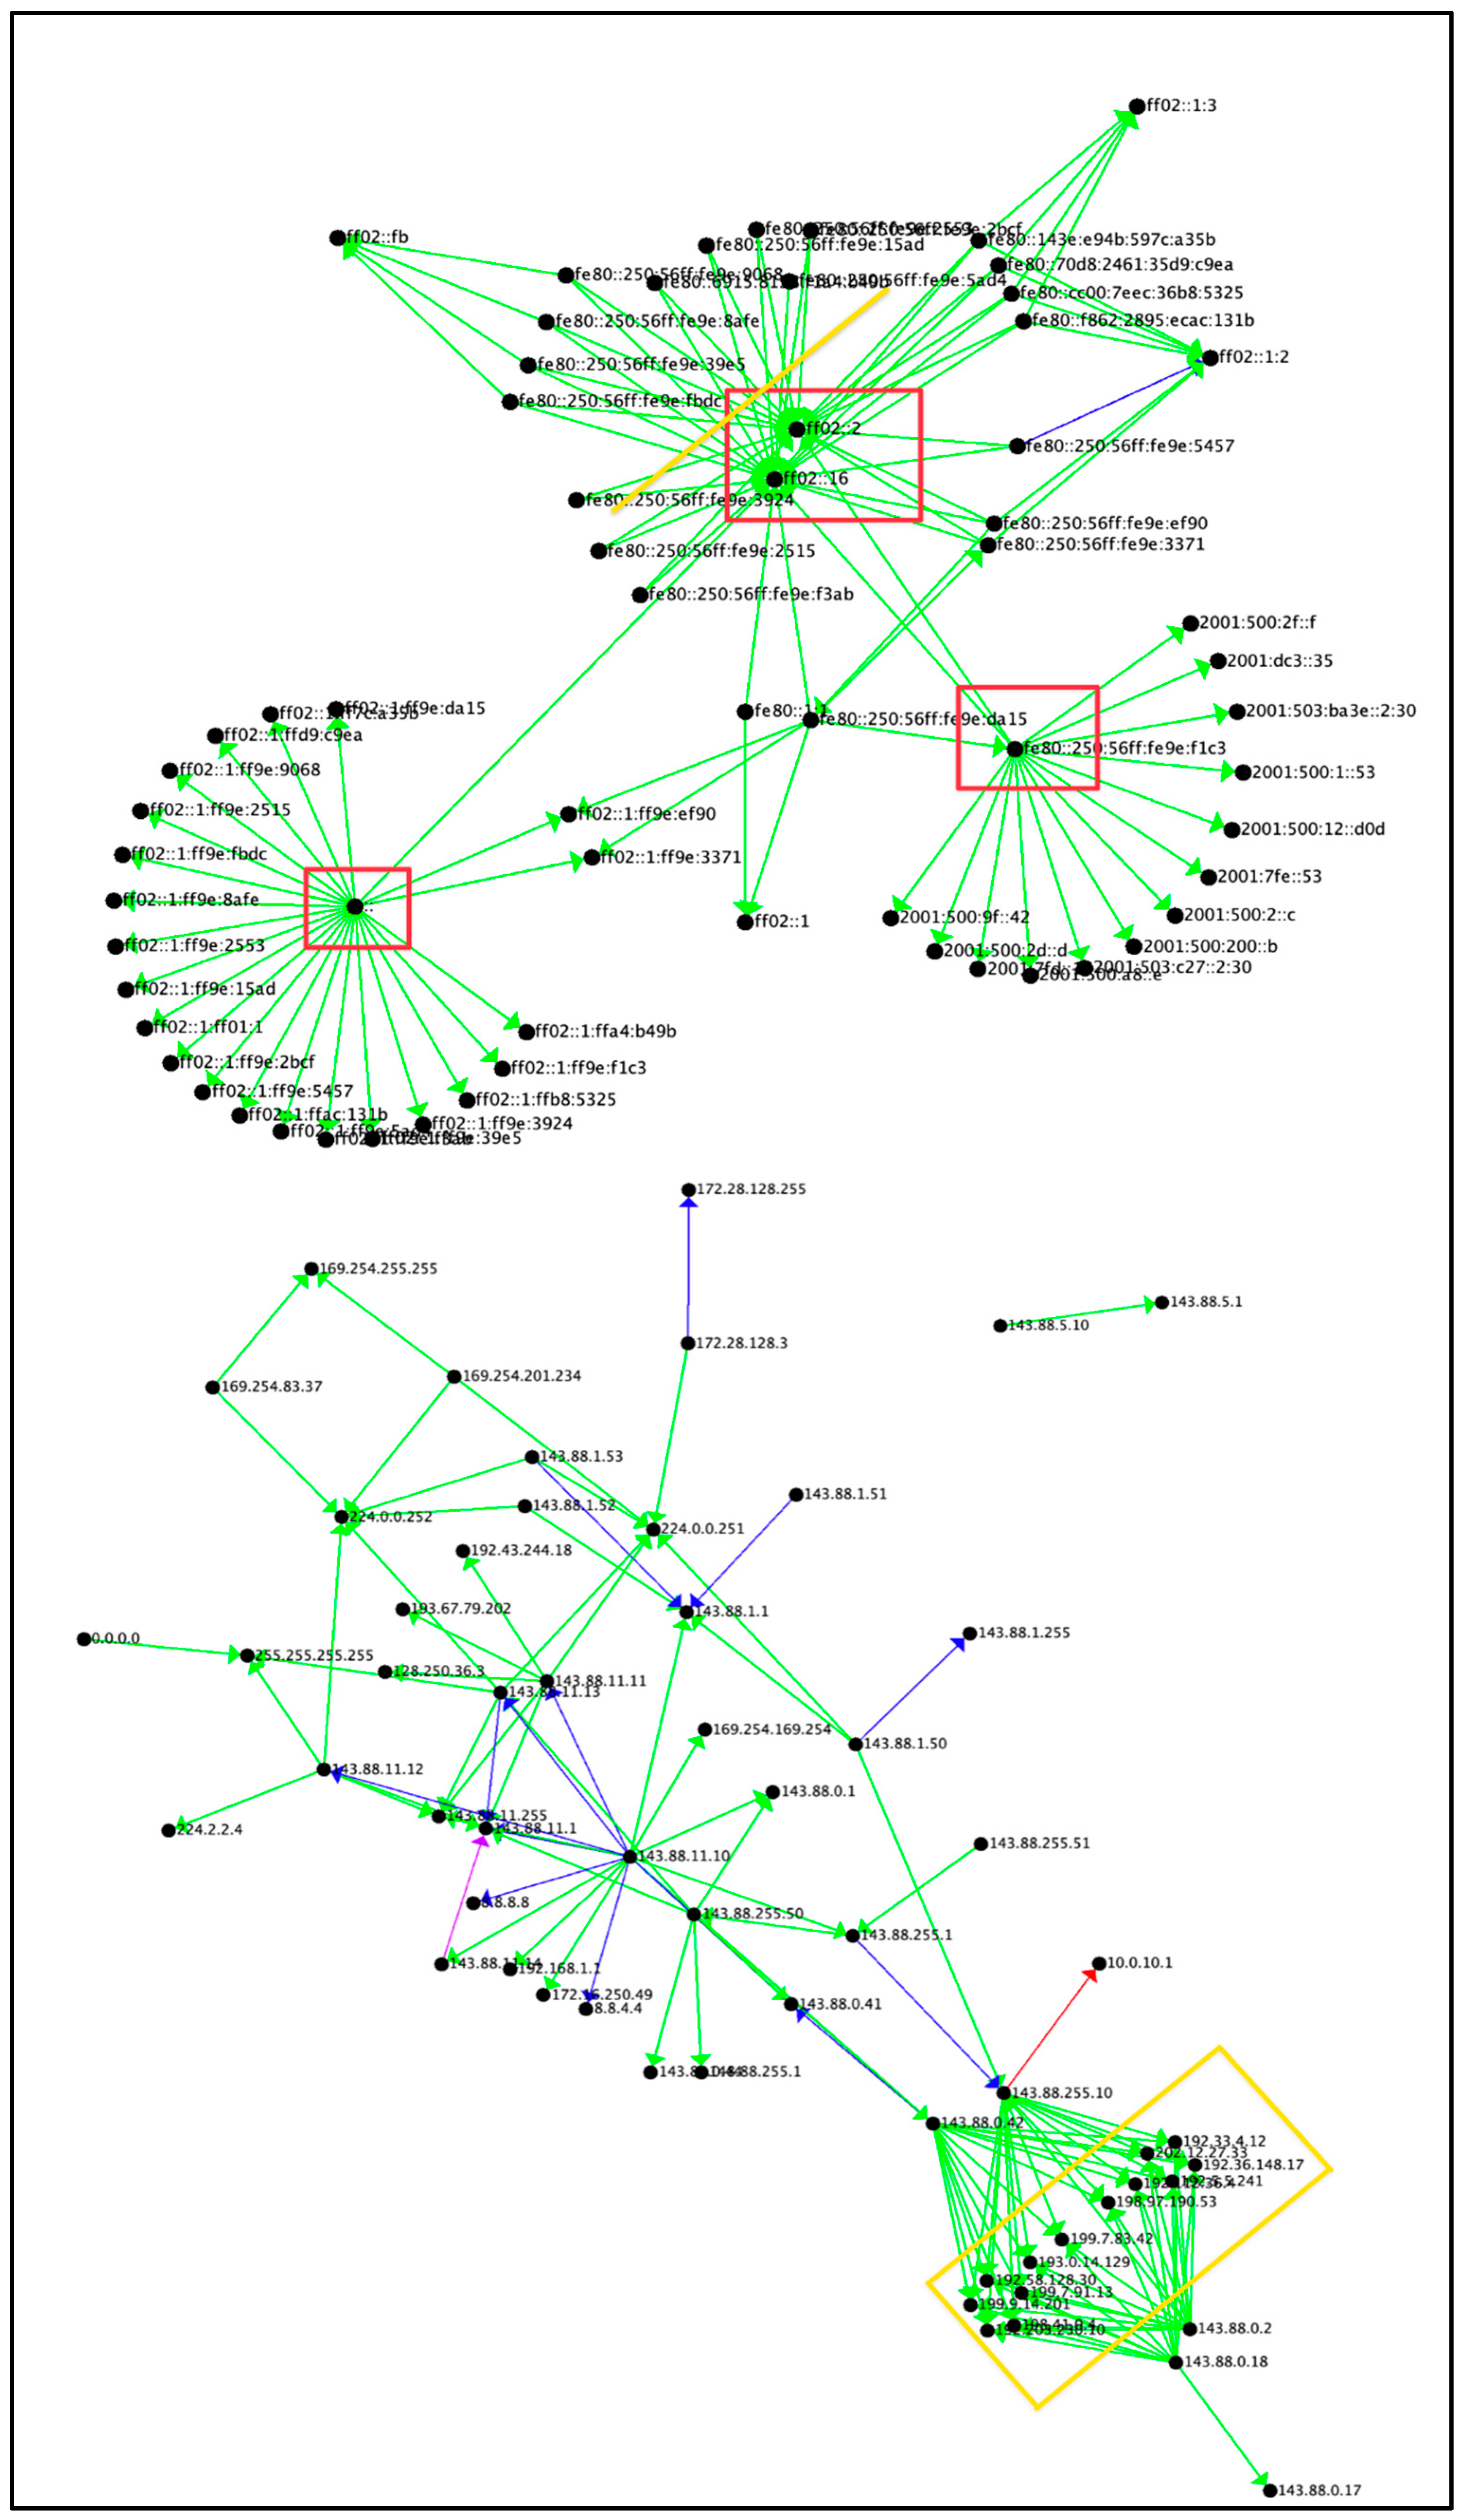
Figure 4 presents the Reconnaissance Tactic by average bytes. As depicted in Figure 4, only two areas of interest were identified. In both cases, the number of bytes transferred per connection was 0.8 MB to 1.5 MB. It is possible that the attacker found that these IP addresses had exposed ports that could be used to send and/or receive data to/from the network. Example data points for the Reconnaissance points of interest based on average bytes are presented in Table 5. The maximum number of bytes transferred was 2,654,582,328,320, the minimum number of bytes transferred was zero, and the average number of bytes transferred was 13,877,478,833.
Table 5.
Reconnaissance points of interest (average bytes).
6.2. Clique Motif
Figure 5 depicts the cliques found in UWF-ZeekData22. The bottom left set of IP addresses are reverse shells coming back to the 143.88.2.10 address, which were attackers on the Kali Linux machine used to scan and attack the victim’s network. The connections in the red box are interesting because they are able to gain a connection to the University of West Florida’s (UWF’s) IP address, which is the 143.88.0.* subnet. The group of connections in the top right are IPv6 addresses. The IPv6 address is the successor of the regular IPv4 address [28]. With the limited number of IPv4 addresses, in order to accommodate for the increasing number of devices on the internet, the Internet Engineering Task Force (IETF) developed the Internet Protocol version 6 (IPv6) address. IPv6 uses a 128-bit address, unlike IPv4, which uses a 32-bit address.
6.3. Visualizations of Non-Attacks by Count
Figure 6 depicts the counts of connections that were categorized as non-attacks and shows a large cluster of different connections of IPv6 addresses. There are several areas of interest identified by the colored boxes. The IP addresses within the red boxes are routers or switches that are redirecting traffic to different subnets (ff02::fb and ff02::1:3), and these subnets are possibly redirecting it to servers or load balancers.
As cycles were removed from the data, they appeared unidirectional. The yellow boxed area (bottom right) represents servers that were behind a load balancer. The load balancer evenly distributes traffic to the various servers.
Two data points for the non-attacks by connection count are presented in Table 6. The maximum count was 6,724,017, the minimum count was 1, and the average count was 4,273,817.
Table 6.
Non-Attack points of interest (count).
6.4. Visualizing Attacks by Count
Figure 7 depicts the full picture of the attack data binned with respect to the number of occurrences (count). The star motif in the red box is the Reconnaissance port scan sample shown in Figure 2. The top right of Figure 7 has more IPv6 addresses compared to Figure 6.
Example data points for all attack tactics by count are presented in Table 7. The maximum count was 6,724,017, the minimum count was 1, and the average count was 3,864,567.
Table 7.
All Attack Tactics points of interest (count).
6.5. Visualizations of the Noncyclic Counts
Figure 8 represents the final count of connections for all identified attacks, with all cycles removed. All edges were added in this graph, except for any edges that returned to a previously visited vertex. This allowed for the visualization of one-way traffic from the source to the destination. Adding the return cycles would have produced additional noise and could obscure the true target of the attack.
6.6. Summarizing the Graphical Visualizations
Figure 2, Figure 3 and Figure 4 are star motifs that depict the Reconnaissance Tactic, but from different angles—connection count, duration, and byte count, respectively. In this dataset, UWF-ZeekData22, the star motif represents the Reconnaissance Tactic well. The Reconnaissance Tactic essentially radiates from a single vertex, 143.88.2.10, to multiple other vertices in the graph. The clique motif was not useful in graphing the Reconnaissance Tactic.
7. Runtime Performance
This section presents the runtime performance of the process of creating the graph databases, starting from file processing to the visualization of the graphs. In every case, it can be noted that the truncated data, i.e., our reduced dataset used to create the graphs, performed better than the full data.
Table 8 presents the execution time for processing, including writing the resulting output files, running on a quad-core i5 intel processor at 2.4 GHz with 16 GB of DDR4 3200 RAM. For both Phase 1 (file processing) and Phase 2 (graph processing), it can be noted that the reduced data (with fewer attributes, used to create the graphs) performed better than the full data, which had all of the attributes.
Table 8.
Execution time for processing.
After file processing and graph processing, the resulting data file was reduced to vertices and summed by connection count, connection duration, and bytes transmitted. These summed amounts were then binned across the vertices and graphed. Table 9 presents the execution time for binning and generating the resulting CSV files after data processing, executed on a 10-Core Intel Core i9 at 3.6 GHz with 32 GB of 2667 MHz DDR4 RAM. It can once again be noted that the reduced data performed better than the full data.
Table 9.
Execution time for binning and generating resulting CSV files.
Table 10 presents the execution time for generating GraphStream visuals after data binning, running on a Quad-Core Intel Core i7 at 2.8 GHz with 16 GB of 2133 MHz LPDDR3 RAM. Here we can see that the reduced data performed better for the Reconnaissance and the IP address 143.88.2.10.
Table 10.
Execution time for generating visuals.
8. Conclusions
The objective of this research was to determine whether UWF-Zeekdata22 [9,10] could be mapped into a graph that could then be analyzed to yield consistent and identifiable patterns. Patterns involving network connectivity, connection duration, and data volume were found when the Conn Log files of the UWF-Zeekdata22 dataset were extracted and loaded into a graph environment. Patterns were also found in the graphed data that matched the attack tactics captured by UWF-Zeekdata22. The Reconnaissance Tactic was represented well by the star motif. This Reconnaissance Tactic, labeled as per the MITRE ATT&CK framework, has not been visually graphed in any previous work.
There were some interesting discoveries when reviewing the resulting graphs. In the non-attack data, it was possible to identify normally occurring interactions between vertices in the graph. This could be used to teach a machine learner what behaviors to ignore. This could help identify zero-day attacks, as they would not “look” like a learned normal behavior of the network.
Finally, an analysis of the runtime performance of the reduced dataset, using only four features from UWF-ZeekData22’s Conn Log files and two additionally generated features plus count, showed that the reduced dataset performed better than the full dataset. Hence, rather than using all 23 features of the Conn Log dataset, a set of four connection features and two additionally generated features plus the count was enough for the graph engine to generate the graphs.
9. Future Works
The results in this paper show that graph databases/graph engines can be essential tools for understanding network traffic and detecting various network intrusions. The amount of data available for use in the analysis of this paper was fairly limited, so one area for future research will be to apply the principles of this paper to multiple datasets and compare the results. Another area for further research would be to use the models generated from this analysis to train machine learners. The learners would then be run against various simulated attack/non-attack data to determine the accuracy of the models.
Author Contributions
This work was conceptualized by S.S.B., D.M., S.C.B., M.P. and J.H.; the methodology was mainly devised by S.S.B., D.M., S.C.B., M.P. and J.H.; software was handled by M.P. and J.H.; validation was performed by D.M. and M.E.; formal analysis was performed by M.P., J.H. and D.M.; investigation was conducted by S.S.B., D.M., M.P. and J.H.; data curation was performed by M.P.; writing—original draft preparation was performed by M.P. and J.H.; writing—review and editing was performed by S.S.B., D.M., S.C.B., M.P., J.H. and M.E.; visualization was performed by M.P. and J.H.; supervision was performed by S.S.B., D.M. and S.C.B.; project administration was performed by S.S.B. and D.M.; funding acquisition was performed by S.S.B., D.M. and S.C.B. All authors have read and agreed to the published version of the manuscript.
Funding
This research was funded by the National Centers of Academic Excellence in Cybersecurity, 2021 NCAE-C-002: Cyber Research Innovation Grant Program, Grant Number: H98230-21-1-0170.
Institutional Review Board Statement
Not applicable.
Informed Consent Statement
Not applicable.
Data Availability Statement
The data are available at datasets.uwf.edu (accessed on 1 June 2023).
Conflicts of Interest
The authors declare no conflict of interest.
References
- Huong, T.T.; Bac, T.P.; Long, D.M.; Thang, B.D.; Binh, N.T.; Luong, T.D.; Phuc, T.K. LocKedge: Low-Complexity Cyberattack Detection in IoT Edge Computing. IEEE Access 2021, 9, 29696–29710. [Google Scholar] [CrossRef]
- Leevy, J.L.; Hancock, J.; Zuech, R.; Khoshgoftaar, T.M. Detecting Cybersecurity Attacks across Different Network Features and Learners. J. Big Data 2021, 8, 38. [Google Scholar] [CrossRef]
- Bagui, S.; Simonds, J.; Plenkers, R.; Bennett, T.A.; Bagui, S. Classifying UNSW-NB15 Network Traffic in the Big Data Framework Using Random Forest in Spark. Int. J. Big Data Intell. Appl. 2022, 2, 39–61. [Google Scholar] [CrossRef]
- Zhang, J.; Sun, J.; He, H. Clustering Detection Method of Network Intrusion Feature Based on Support Vector Machine and LCA Block Algorithm. Wirel. Pers. Commun. 2021, 127, 599–613. [Google Scholar] [CrossRef]
- Kevric, J.; Jukic, S.; Subasi, A. An Effective Combining Classifier Approach Using Tree Algorithms for Network Intrusion Detection. Neural Comput. Appl. 2016, 28, 1051–1058. [Google Scholar] [CrossRef]
- MITRE ATT&CK Reconnaissance, Tactic TA0043-Enterprise. Available online: https://attack.mitre.org/tactics/TA0043 (accessed on 23 March 2023).
- Jia, Y.; Qi, Y.; Shang, H.; Jiang, R.; Li, A. A Practical Approach to Constructing a Knowledge Graph for Cybersecurity. Engineering 2018, 4, 53–60. [Google Scholar] [CrossRef]
- Oracle Corporation 17 Use Cases for Graph Databases and Graph Analytics. 2021. Available online: https://www.oracle.com/a/ocom/docs/graph-database-use-cases-ebook.pdf (accessed on 19 August 2022).
- Bagui, S.S.; Mink, D.; Bagui, S.C.; Ghosh, T.; Plenkers, R.; McElroy, T.; Dulaney, S.; Shabanali, S. Introducing UWF-ZeekData22: A Comprehensive Network Traffic Dataset Based on the MITRE ATT&CK Framework. Data 2023, 8, 18. [Google Scholar] [CrossRef]
- University of West Florida UWF-ZeekData22. Available online: https://datasets.uwf.edu (accessed on 20 August 2020).
- Lee, M.-C.; Nguyen, H.T.; Berberidis, D.; Tseng, V.S.; Akoglu, L. GAWD: Graph anomaly detection in weighted directed graph databases. In Proceedings of the 2021 IEEE/ACM International Conference on Advances in Social Networks Analysis and Mining, Virtual, 8–11 November 2021; ACM: New York, NY, USA, 2021. [Google Scholar]
- Coupette, C.; Vreeken, J. Graph Similarity Description: How Are These Graphs Similar? In Proceedings of the 27th ACM SIGKDD Conference on Knowledge Discovery & Data Mining, Virtual, 14–18 August 2021; ACM: New York, NY, USA, 2021. [Google Scholar]
- Schindler, T. Anomaly Detection in Log Data Using Graph Databases and Machine Learning to Defend Advanced Persistent Threats. Available online: https://dl.gi.de/handle/20.500.12116/4016 (accessed on 12 April 2023).
- Bai, Y.; Ding, H.; Bian, S.; Chen, T.; Sun, Y.; Wang, W. SimGNN: A Neural Network Approach to Fast Graph Similarity Computation. In Proceedings of the Twelfth ACM International Conference on Web Search and Data Mining, Melbourne, VIC, Australia, 11–15 February 2019; ACM: New York, NY, USA, 2019. [Google Scholar]
- Abraham, S.; Nair, S. A Predictive Framework for Cyber Security Analytics Using Attack Graphs. Int. J. Comput. Netw. Commun. 2015, 7, 1–17. [Google Scholar] [CrossRef]
- Rocha, R.C.; Thatte, B.D. Distributed Cycle Detection in Large-Scale Sparse Graphs. In Proceedings of the Simposio Brasileiro de Pesquisa Operacional (SBPO), Pernambuco, Brazil, 25–28 August 2015. [Google Scholar] [CrossRef]
- Ma, G.; Ahmed, N.K.; Wilke, T.L.; Yu, P.S. Deep graph similarity learning: A survey. Data Min. Knowl. Discov. 2021, 35, 688–725. [Google Scholar] [CrossRef]
- Li, Y.; Gu, C.; Vinyals, O.; Kohli, P. Graph Matching Networks for Learning the Similarity of Graph Structured Objects. In Proceedings of the 36th International Conference on Machine Learning, Long Beach, CA, USA, 10–15 June 2019. [Google Scholar]
- Koutra, D.; Parikh, A.; Ramdas, A.; Xiang, J. Algorithms for Graph Similarity and Subgraph Matching. Comput. Sci. 2011. Available online: https://www.cs.cmu.edu/~jingx/docs/DBreport.pdf (accessed on 1 June 2023).
- GraphStream—A Dynamic Graph Library. Available online: https://graphstream-project.org/ (accessed on 12 March 2023).
- Bagui, S.; Mink, D.; Bagui, S.; Ghosh, T.; McElroy, T.; Paredes, E.; Khasnavis, N.; Plenkers, R. Detecting Reconnaissance and Discovery Tactics from the MITRE ATT&CK Framework in Zeek Conn Logs Using Spark’s Machine Learning in the Big Data Framework. Sensors 2022, 22, 7999. [Google Scholar] [CrossRef] [PubMed]
- Sur, S.; Srimani, P.K. Topological Properties of Star Graphs. Comput. Math. Appl. 1993, 25, 87–98. [Google Scholar] [CrossRef]
- Bron, C.; Kerbosch, J. Algorithm 457: Finding All Cliques of an Undirected Graph. Commun. ACM 1973, 16, 575–577. [Google Scholar] [CrossRef]
- Mackaness, W.A.; Beard, K.M. Use of Graph Theory to Support Map Generalization. Cartogr. Geogr. Inf. Syst. 1993, 20, 210–221. [Google Scholar] [CrossRef]
- Von Landesberger, T.; Görner, M.; Rehner, R.; Schreck, T. A System for Interactive Visual Analysis of Large Graphs Using Motifs in Graph Editing and Aggregation. Proc. Vis. Model. Vis. Workshop 2009, 9, 331–340. [Google Scholar]
- MITRE ATT&CK Active Scanning, Technique T1595-Enterprise. Available online: https://attack.mitre.org/techniques/T1595/ (accessed on 23 January 2023).
- Chapter 4. Port Scanning Overview. Available online: https://nmap.org/book/port-scanning.html#port-scanning-intro (accessed on 13 March 2023).
- Frankel, S.; Green, D. Internet Protocol Version 6. IEEE Secur. Priv. Mag. 2008, 6, 83–86. [Google Scholar] [CrossRef]
Disclaimer/Publisher’s Note: The statements, opinions and data contained in all publications are solely those of the individual author(s) and contributor(s) and not of MDPI and/or the editor(s). MDPI and/or the editor(s) disclaim responsibility for any injury to people or property resulting from any ideas, methods, instructions or products referred to in the content. |
© 2023 by the authors. Licensee MDPI, Basel, Switzerland. This article is an open access article distributed under the terms and conditions of the Creative Commons Attribution (CC BY) license (https://creativecommons.org/licenses/by/4.0/).