Article

An Artificial Neural Network Autoencoder for Insider Cyber Security Threat Detection

by
Karthikeyan Saminathan
1,†,
Sai Tharun Reddy Mulka
2,
Sangeetha Damodharan
3,
Rajagopal Maheswar
4 and
Josip Lorincz
5,*,†
1
Computer Science and Engineering (AIML), KPR Institute of Engineering and Technology, Coimbatore 641407, Tamil Nadu, India
2
Computer Science and Engineering, VIT-AP University, Amaravati 522241, Andhra Pradesh, India
3
Information Technology, Madras Institute of Technology, Anna University, Chennai 600044, Tamil Nadu, India
4
Department of ECE, Centre for IoT and AI (CITI), KPR Institute of Engineering and Technology, Coimbatore 641407, Tamil Nadu, India
5
Faculty of Electrical Engineering, Mechanical Engineering and Naval Architecture (FESB), University of Split, Rudjera Boskovca 32, 21000 Split, Croatia
*
Author to whom correspondence should be addressed.
These authors contributed equally to this work.
Future Internet 2023, 15(12), 373; https://doi.org/10.3390/fi15120373
Submission received: 3 October 2023 / Revised: 18 November 2023 / Accepted: 20 November 2023 / Published: 23 November 2023
(This article belongs to the Section Cybersecurity)

Abstract

:
The COVID-19 pandemic made all organizations and enterprises work on cloud platforms from home, which greatly facilitates cyberattacks. Employees who work remotely and use cloud-based platforms are chosen as targets for cyberattacks. For that reason, cyber security is a more concerning issue and is now incorporated into almost every smart gadget and has become a prerequisite in every software product and service. There are various mitigations for external cyber security attacks, but hardly any for insider security threats, as they are difficult to detect and mitigate. Thus, insider cyber security threat detection has become a serious concern in recent years. Hence, this paper proposes an unsupervised deep learning approach that employs an artificial neural network (ANN)-based autoencoder to detect anomalies in an insider cyber security attack scenario. The proposed approach analyzes the behavior of the patterns of users and machines for anomalies and sends an alert based on a set security threshold. The threshold value set for security detection is calculated based on reconstruction errors that are obtained through testing the normal data. When the proposed model reconstructs the user behavior without generating sufficient reconstruction errors, i.e., no more than the threshold, the user is flagged as normal; otherwise, it is flagged as a security intruder. The proposed approach performed well, with an accuracy of 94.3% for security threat detection, a false positive rate of 11.1%, and a precision of 89.1%. From the obtained experimental results, it was found that the proposed method for insider security threat detection outperforms the existing methods in terms of performance reliability, due to implementation of ANN-based autoencoder which uses a larger number of features in the process of security threat detection.

1. Introduction

Possible attacks that are characterized as cyber security threats can impact a particular entity of an organization or a whole organization and can be categorized as external or insider attacks. External attacks propagate from an outside perimeter of the organization network and can occur in different forms, such as distributed denial of service (DDOS), phishing, etc. Otherwise, insider attacks originate from the inside of the organization’s network, which means that the attacker(s) have already gained some level of access to the network.
The frequent occurrence of cyberattacks and threats points to the importance of maintaining and enhancing an organization’s cyber security. To defend against external attacks such as distributed denial of service (DDoS), session hijacking, etc., organizations generally utilize several security tools, including firewalls, intrusion detection systems (IDS), intrusion prevention systems (IPS), and security gateways.
However, cyber security attacks originating from the organization, such as insider attacks, are especially challenging for detection, since threat detection of such attacks requires more sophisticated and complex threat detection processes. A report issued by the International Business Machines (IBM) company indicates that the average time it takes to detect a software vulnerability discovered by attackers before the vendor has become aware of it (zero-day attack) is 287 days [1]. Identifying a threat at the early stages will limit the propagation of a threat in an organization, since the longer the threat exists, the more damage it causes by propagating through the network and compromising more devices. This indicates the severity and extent of the damage that can be caused by insider security attacks. Insider cyber security attacks can be classified into three types, which include insider threat attacks, security information and event management (SIEM) attacks, and user behavior or user and entity behavior analysis (UBA/UEBA) attacks.

1.1. Insider Threats Attacks

Insider threats can be classified into three types that include malicious insider, careless insider, and compromised insider threats. The malicious insider threat is caused by an employee in the organization misusing resources, divulging confidential information, or hurting the organization’s values. In 2018, the Russian secret service arrested the employees of a country-leading nuclear research laboratory for misusing supercomputer resources to mine bitcoin, which is an example of a malicious insider attack [2].
In the careless insider threat scenario, an employee fails to follow security standards and, as a result, increases the attack space, which exposes the organization’s assets to a potential attack. A good example of a careless insider attack is leaving the systems without logging off, using the default passwords, and delaying the installation of application security patches. In 2019, 250 million Microsoft customers’ records were exposed to everyone on the Internet due to the negligence of the security team, who failed to secure the database with improper security rules [3].
A compromised insider threat is the most sophisticated attack, which manages to gain access to the privileged parts of the organization’s network by bypassing all the security measures such as firewalls and IDSs. The bypassing of security measures enables the compromising of the privileged accounts while trying to act as a legitimate entity that steals the organization’s data. A recent Twitter breach is a good example of a compromised insider attack, where attackers used a phone spearing phishing attack to gain an employee’s credentials and abuse them by making a cryptocurrency scam that resulted in a huge cost for the company [4].

1.2. Security Information and Event Management Attack

Although organizations integrate the different SIEMs in their security measures, business organizations are mostly affected by insider cyberattacks. In practice, an SIEM system has the role of a security management tool that gathers all data from network interfaces, servers, domain controllers, and other assets present in an organization [5]. The SIEM system workflow is related to logging, correlation and analysis, incident monitoring, sending alerts, and compiling and reporting. The main use cases of SIEM are basic security monitoring, advanced threat detection, log collection, security incident detection, and follow-up alerts.
Today’s attackers have developed sophisticated techniques and tactics, which are more difficult for SIEM tools to detect. As a result, SIEM shows the following limitations:
  • Due to centralized logging, when an insider threat is detected and alerted, security analysts cannot find out how and where to start an intruder search. Meanwhile, the attack goes deep into the network before being detected, and incident forensics are ineffective.
  • The SIEM tools protect against most external threats, and they are defenseless against insider threats.
  • The SIEM tools generally are not accurate for a particular security threat event. Mostly, they fail to detect the actual occurrence of an event.
  • The SIEM tools are difficult to control and manage.
  • Predefined correlation rules make the SIEM system unable to detect new attack techniques.
To address these limitations of SIEM tools, different approaches for improving organizations’ cyber security have been proposed, and they can be classified as approaches based on user behavior analysis (UBA) or on user and entity behavior analysis (UEBA).

1.3. User Behavior Analysis and User and Entity Behavior Analysis Attack

In 2014, Gartner, in [6], defined UBA as a security analysis approach that analyzes a user’s behavior on systems and networks. This approach is used to detect malicious behavior of users. Machine learning and deep learning algorithms constitute the core implementation of such an approach, while some recent results have proposed implementing blockchain technology for anonymous privacy-preserving authentication [7]. UBA as an approach, defines a baseline for the normal behavior of a user, and if the activity deviates from the baseline, an alert will be generated.
As a case study of the UBA approach, a United States-based tech company recorded an incident that involved a compromised Linux-based system controlled by attackers, which was used to navigate through the network and search for any further possibility of system compromission [8]. A basic approach was utilized through the attempt to log in to various servers and machines with the default credentials. As a result of this attempt, the attack seemed to have multiple users failing to log on to their systems, while these log-ins had been performed from a single machine. Thus, the shown use case provides a serious downside of UBA as an approach for the detection of cyber security threats. In 2015, Gartner redefined the UBA approach and proposed the UEBA approach. The UEBA considers the behavior of users and network and system entities like servers and includes all other assets in an organization. By taking most of the available information into account, this approach focuses on the problem of insider attacks instead of focusing on only the user and network data. It is more powerful than UBA and can detect complex attacks. In addition to monitoring and analyzing the behavior of users and entities, UEBA also identifies anomalous user behavior, recognizes unseen patterns through the utilization of machine learning and deep learning techniques, and alerts the security team in real time according to certain risk scores, before the attack propagates further.

1.4. Contribution of the Paper

According to three previously presented major types of cyber security attacks, it can be generally stated that the complexity of insider cyberattacks represents a complex problem with no unique or off-the-shelf solution that can ensure full protection of the organization’s internal network entities and systems. Although the SIEM approach significantly improves the detection of some types of cyberattacks, the main disadvantage of the SIEM approach is in the fact that it generally follows a set of predefined correlation rules, and finding correlation rules for every possible attack scenario is impossible [9]. In addition, present-day SIEM systems are not capable of detecting newly developed attack patterns, and therefore, they often end up generating large amounts of false alarms.
The cyber security level of every organization is based on a variety of criteria such as investment in information security, the capability of disaster recovery, the amount of monitored security-related information, the implementation of security policies at different levels, etc. The motivation of the insider attackers is to gain access to the organization’s network and to exfiltrate data by masking the zero-day attack. The organization must safeguard the data and ensure that the service is always available. Since the organization’s data are involved in any process related to the improvement of an organization’s cyber security, compromising an organization’s cyber security can have a negative impact on the organization’s financial stability and service availability. While observing the potential that UEBA has in terms of insider threat detection and the potential that SIEM data gathering offers, the main contribution of this paper is in developing and testing the solution based on integrating UEBA’s capabilities with the SIEM approach. Thus, the key contributions of the paper are related to the following:
  • Developing a more effective and sophisticated insider cyber security threat detection based on a combination of the SIEM and UEBA solutions;
  • The improvement of the detection of insider threats with unknown signatures that are mainly focused on situations that involve compromising user accounts.
Therefore, in this paper, a security framework that comprises architecture based on user and entity behavior analysis (UEBA) in combination with SIEM is proposed. The proposed security framework is based on a developed unsupervised deep learning algorithm that is used for the detection of insider cyber security threats by analyzing the behavior of users, systems, and network entities of the organization. The decision to adopt an unsupervised deep learning approach stems from the understanding that data Instances cannot be predetermined as legitimate or anomalous based on predefined attributes, as in the case of supervised learning. Unlike supervised learning, which necessitates labeled data to classify instances as legitimate or anomalous, unsupervised learning operates without such predetermined labels, making it a suitable approach for performing security threat detection.
The proposed approach requires data for training, which are collected from different sources that include the organization domain controller (DC), mouse, keyboard, file access, hypertext transfer protocol (HTTP) traffic, resource consumption metrics, and device metrics. After the training phase, the proposed model is capable of analyzing the activity of the user and the entities concurrently in real time and flagging the user behavior as legitimate or nonlegitimate.
The rest of the paper is organized as follows: Section 2 discusses the previous research related to the detection of insider security threats and explains the motivation for the performed research. Section 3 presents the system-level architecture of the proposed solution and explains the work carried out regarding dataset preparation for modeling the proposed approach to insider threat detection. In Section 4, the validation of the performance of the proposed model is presented, with results presenting a comparative analysis of the proposed approach with other security threat detection approaches. Finally, the conclusion of the paper is given in Section 5.

2. Related Works

As cybersecurity is an evolving area, many works in the literature have proposed solutions for insider threat detection. Most often, insider threats are difficult to recognize, and they remain unnoticed in a variety of ways, such as by compromising the systems and acting as if they were legitimate users, exfiltrating data remotely using a command-and-control server (C&C) by the attacker, etc. It is important to recognize that during their daily activity, every individual has a unique behavior for every action they take on a system. For example, a user’s behavior within the system is affected by how they move the mouse, click or type keystrokes on the keyboard, navigate web pages, etc. An indication of anomaly behavior that gives more exposure to insider threats can be detected when the user behavior does not match the expected and usual behavior. Many antivirus software products like Kaspersky, McAfee, Avast, etc. maintain a large evolving database for historical storage of known security threat patterns. These organizations update the databases continuously as a new security attack pattern is found. However, the limitation of antivirus programs is that they cannot detect unknown threat patterns caused by the changed behavior of users. To overcome the existing limitation of such software, anomaly-based user behavior detection is proposed in different studies.
UEBA solutions have been proposed in [10] for the Niara Security Analytics Platform in the form of a platform aimed at providing insider threat detection. This work proposes a solution for detecting security attacks by compromising an organization’s network architecture. The platform takes into account a number of features, including the time stamp of the first and last access during a day, the duration between those accesses, and the number of bytes sent and received. Using Mahalanobis distance, the algorithm calculates the distance between an observed and the mean value of all observations, which is then projected onto the singular value decomposition (SVD) space.
The algorithm automatically detects anomalies and reports them to the analyst. Eberle et al. in [11] demonstrated how graph-based anomaly detection (GBAD) approaches can be used to detect insider threats. The proposed method does not use the values of the data; instead, it uses relationships among the graph-based data, where relationships are projected with the help of edges between nodes of the graph. To analyze the graph’s structure, the authors in the paper use a graph-based technology system called “SUBDUE”. The results show that the GBAD anomaly detection using the GBAD minimum descriptive length and probabilistic and maximum partial substructure are prevailing, along with an ensemble-based approach to the detection of anomaly behavior.
Another approach to security threat detection is proposed based on network logs collected from the network devices. Gavai et al., in [12], worked on detecting insider threats based on the data related to social and online activity. The data contain features such as email attachments, files, user access activity, etc. The authors tried two approaches, namely, unsupervised learning, where they implemented an isolated forest algorithm, and the supervised approach, based on a random forest algorithm. Both methods performed well in terms of detecting insider security threats.
Some solutions related to security threat detection based on a binary classification have been proposed. The binary classification of security threat problems consists of two classes, positive and negative. If the binary classification is performed based on traditional machine learning algorithms, these algorithms attempt to classify the test cases as positive or negative, with high accuracy in cases where training data contain a ratio of positive to negative samples. If the dataset is imbalanced, then the model will be biased towards the class containing the higher number of samples. To deal with imbalanced datasets, a one-class classification approach is proposed by Kim et al. in [13]. They used four different one-class machine learning algorithms, namely, the Gaussian density estimation, K-means clustering (KMC), principal component analysis (PCA), and Parzen window density estimation, to detect anomalous behavior by using the computer emergency response team (CERT) dataset. The results are analyzed based on user roles and data types such as log-in activity, email content, etc. Among the analyzed algorithms, Parzen and a combination of Parzen with other algorithms performed well for less than one user role, while KMC and PCA performed better for more than one user role.
Threat detection based on the recurrent neural networks (RNNs) algorithm has been applied for threat prediction, and as such, it is also used in Google Assistant and Apple’s Siri applications [14]. The algorithm workflow is simple, as it is based on the output of the neural network layer, whose results are passed as input to the next RNN layer. This algorithm ensures the existence of the effect on the current layer of inputs from previous layers. For appropriate algorithm functionality, it is necessary to perform multiple recursions in order to extract a significant amount of context from the data, and it also depends on the type of data.
Jiuming et al., in [15], proposed a deep neural network with the long short-term memory (LSTM) algorithm, which is a subset of the RNN algorithm. The dataset used in this approach is a well-known CERT dataset. The data consist of different types of data related to the users such as log-in activity, files, email, etc. The proposed approach is divided into two parts, which are anomaly detection and insider threat detection. Initially, the anomalies are detected using the LSTM model, and later, through a series of anomaly events detection, the threat existence, score, and severity are decided. This model showed a better performance than log-based anomaly approaches, which can be helpful in real-time application scenarios.
Nasir et al., in [16], introduced a behavior-based insider threat detection approach using the LSTM autoencoder model that is applied to the CERT dataset. The model’s efficiency is measured using a loss function, and the model did perform well, with an accuracy of 90.4%. Veeramachananeni et al., in [17], propose a different method for detecting insider threats by combining an unsupervised learning approach with a supervised learning approach, which is a recursive process that learns from previous data inputs. A preprocessing step is carried out on the raw data before the approach is applied. Such a proposed approach is a combined approach, which begins with the unsupervised algorithm making an intuition on the events that occurred, and then, the security analyst ranks events based on whether the events are normal or malicious. After viewing the ranking, the supervised approach takes part in the process of detecting threats from the ranking.
The Hidden Markov Model is used to identify insider threats by Tabish Rashid et al. in [18]. According to the proposed approach, the baseline behavior is identified using legitimate behavior, and it is flagged if nonbaseline behavior crosses its baseline threshold. Balaram Sharma et al., in [19], proposed a user behavior analytics for anomaly detection approach using an LSTM autoencoder. In the proposed solution, the dataset used for training was the CERT v4.3 dataset. The model was trained on normal data, and the mean square error (MSE) was optimized during the training phase, while the prediction was made based on the reconstruction error. If the model cannot reconstruct the data, then the data are flagged as an anomaly and potential threat.
Killourthy et al., in [20], proposed an approach based on the analysis of the mouse dynamics for insider threat detection using 14 machine learning techniques. Park et al., in [21], analyzed keystroke and typing patterns using the two-class classifiers for anomaly detection. Similarly, Wang at al., in [22], proposed an approach for insider threat detection using a support vector machine (SVM) by considering key stroke dynamics, which contain key pressing time, latency, and other information. Hani et al., in [23], implemented user behavior analysis using machine learning algorithms, where anomaly detection for both Windows and Android platforms was implemented. The authors implemented seven algorithms, six are machine learning approaches and one neural network approach, on the dataset that contains key stroke dynamics information. The implemented algorithms are multiclass SVM, random forest, logistic regression, K-nearest neighbor, multilayer perceptron (MLP) classifier, decision trees, and the Gaussian naive Bayes (NB) algorithm. The results show that SVM outperformed other algorithms in terms of anomaly key stroke detection.
According to the presented overview of previous research works, many UBA and UEBA approaches exploiting the dynamics of keystrokes, mouse attributes, HTTP traffic, and log-in activity are discussed in the literature. However, cyber security attacks are continuously evolving, with new approaches appearing. The most advanced cyber security attacks are performed by compromising one system and using it as a “jump host” to compromise other assets. In this case, the attacker may not be detected by UBA. For that reason, the gap that needs to be addressed is the development of a security solution for insider threat detection, which will enable the detection of users’ and the entity’s anomaly behavior in an organization and ensure real-time monitoring for the organization’s security team.
A comparative overview of the similar related works to the work presented in this paper is given in Table 1. It is evident from Table 1 that already proposed approaches use limited datasets or the CERT dataset, which contains information about email, file usage.
HTTP, and log-on–log-off activity of users in the organization. However, from this information, it is possible to give only partial insights about user behavior. Also, information’s in the CERT dataset apply to the UBA approach, as this dataset do not contain the metrics of different system entities.
Even though the proposed UEBA approach considered network logs from different IP addresses, different devices or system metrics are not considered for detecting a security anomaly in the proposed insider threat detection approaches (presented in Table 1). Thus, an attacker can mislead the above approaches, presented in Table 1, without being detected. Therefore, it is reasonable to believe that implementing the UEBA approach with more available data can lead to significant improvements in detecting insider threat attacks. For that reason, in this paper, an approach that considers a large number of system entities, such as the keyboard and mouse dynamics, different files, HTTP traffic, system resources consumption, and network usage, is developed, in order to have a more effective UEBA insider threat detection than previously developed insider threat detection systems.

3. Proposed Architecture for User and Entity Behavior Analysis

3.1. Proposed System Architecture

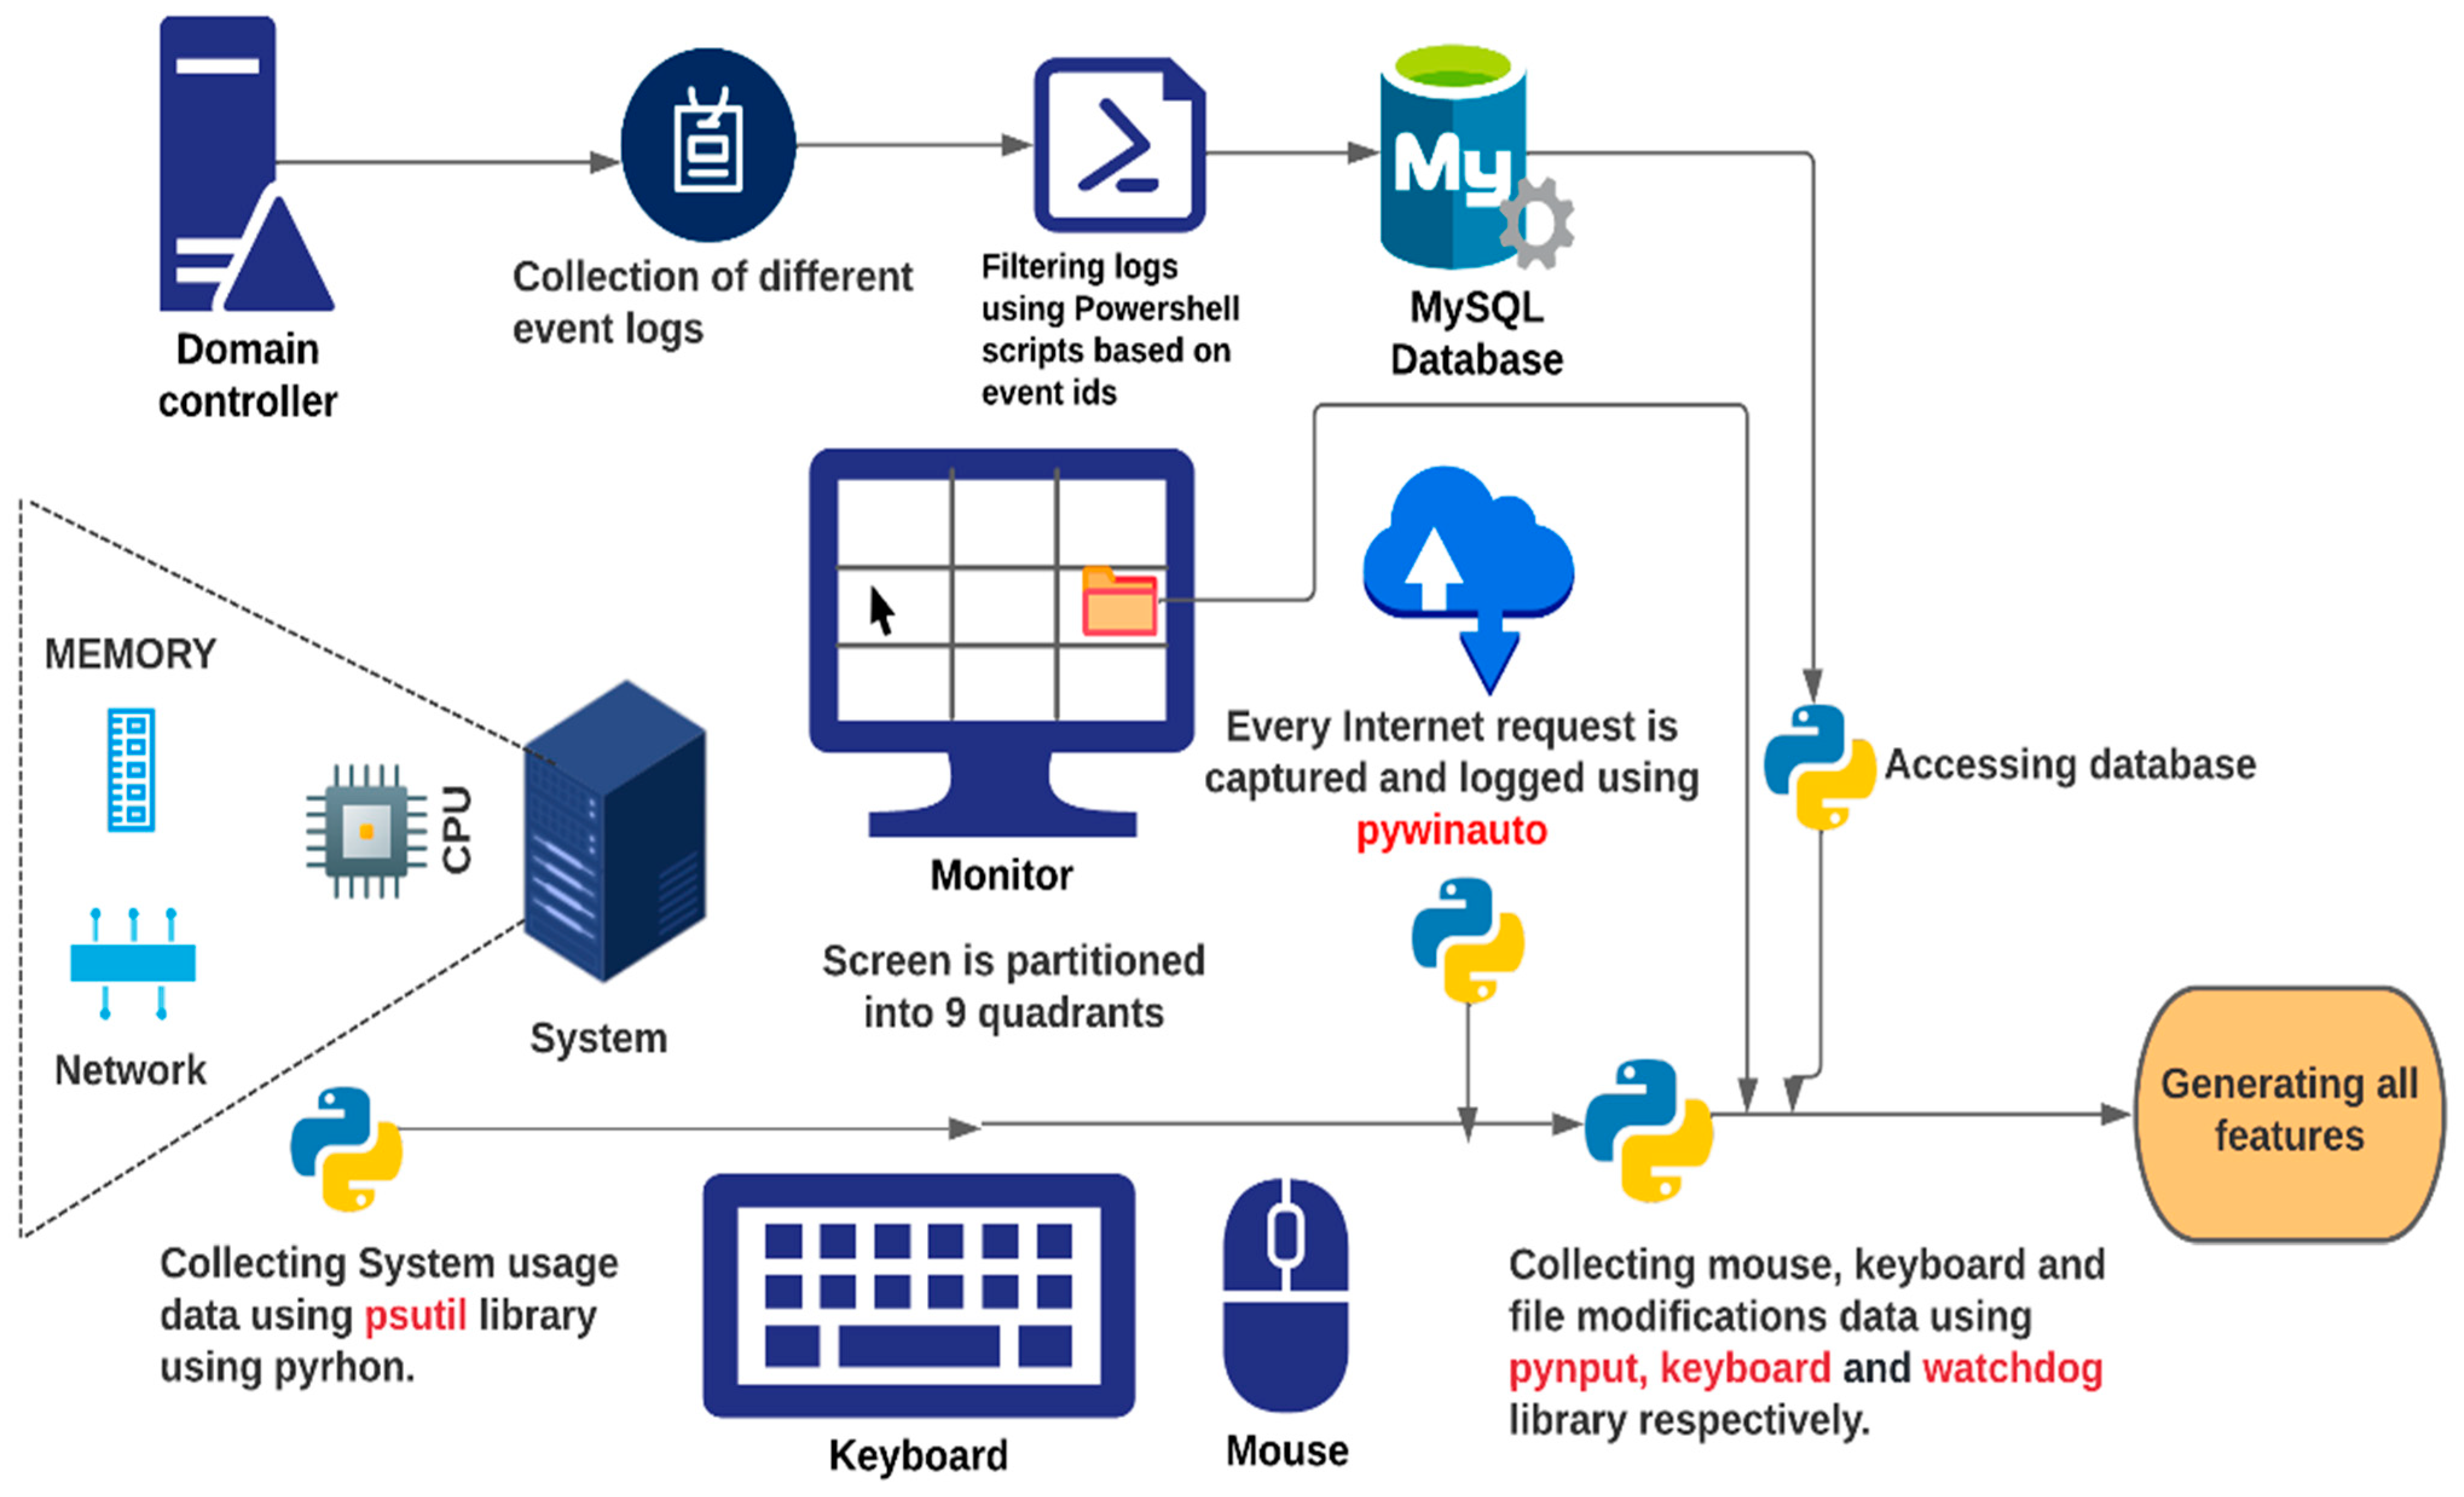
The architecture of the test system used for insider threat detection in this work is depicted in Figure 1. The architecture is based on the integration of the UEBA approach into an SIEM system. To make the analyses realistic, the environment that replicates a real organization is simulated. The proposed architecture uses an autoencoder model to detect anomalies and reports them accordingly (Figure 1). The model is deployed in the cloud, and the data are transmitted using application program interface (API) calls. The developed model checks for any anomaly behavior and alerts the security team. An interface in the proposed framework is created for remote supervision and access to the monitoring results for authorized users.
The main objectives of the proposed UEBA system architecture are to:
  • Perform a user and entity behavior analysis with the capability of detecting insider threats.
  • Provide a solution for detecting and storing nonregular intervals of intrusion data in time.
  • Provide a solution for collecting different system device metric information (such as the activity of the keyboard, mouse, processor, etc.), which will be used for detecting anomaly user behavior.
  • Provide a solution that overcomes the general disadvantages of the UBA approach.
All of the stated objectives have been built into the proposed UBA security threat detection solution.

3.2. Data Generation

There are many large public datasets available that can be used for cyber security threat analyses. However, these datasets are restricted to a specific set of features, and this happens to be a downside for security analyses, since performing analyses with a narrow set of features reduces the probability of security threat detection. Therefore, the scope of the dataset is crucial for any problem statement, and it needs to be realistic. For that reason, the scope of features used in this paper for security threat analyses is significantly larger than the scope of features used by other known approaches, because the proposed approach aims to show how an attacker behaves and how these characteristic features can contribute to detecting an anomaly.
In addition to the attributes considered by the already developed insider threat detection approaches [25], the proposed approach considers more user-related data such as the users’ device resource consumption data (Figure 1). Locally generated data related to each specific attribute are stored simultaneously in the database. For that purpose, individual Python scripts are crafted for each attribute domain that includes a keyboard, mouse, memory, central processing unit (CPU), etc., with the usage of respective libraries. There are multiple libraries involved in each of the developed Python scripts. The scripts are executed on locally generated data and are completely automated and set to run once the user logs in to the device.
The data generation part shown in Figure 2 represents the initial stage of the proposed UEBA system, and it also deals with the recording, filtering, and storing of the data logs. The collected data consist of different data sources, which are presented in Figure 3. These types of data sources include mouse usage dynamics, keyboard dynamics, device resource consumption, on-/off-logging activity, HTTP traffic, and file system activity. All of them are jointly used for anomaly detection.

3.2.1. Keyboard-Related Data

Different types of metrics can be generated using keyboard data. It is known that every individual uses the keyboard differently, depending on the speed of typing, as well as the duration and intensity of the keystrokes pressed. To collect the keyboard data (Figure 3), a library called “keyboard” is used, and the following attributes are filtered and calculated:
  • Keystroke timestamps;
  • The number of keystrokes;
  • Keystroke press and release time;
  • Keyboard-related application data transferred in the foreground.

3.2.2. Mouse-Related Data

Every click and movement of the mouse has an impact on the processing operation of the computer system. Therefore, this type of data enable an important characterization of user behavior. To collect the mouse data, a library called “pynput” is developed (Figure 3). To generate the required mouse-related attributes, the user screen is divided into nine quadrants. Based on the cursor position, location coordinates, and other types of mouse movement, the mouse-related data have been collected.
The major attributes of the mouse data are:
  • Two-dimensional (x, y) coordinates representing the location of the cursor;
  • Mouse clicks (left, right, and center click);
  • Mouse cursor movements on the entire screen.
For every attribute mentioned above, the corresponding applications executed in the background have been mapped.

3.2.3. Device Applications and Resource Usage Data

The device-behavior-related data rely on deviations in the device operation due to user activity. A normal privileged user does not have many deviations in their usage of device resources. However, if there are any deviations, they can be identified by analyzing a few metrics. The library “pywin32” is used for detecting the device applications and resource data usage (Figure 3). Based on such information, different metrics can be generated, such as:
  • The number of active applications;
  • The current foreground application name;
  • The amount of CPU usage by each process;
  • The application in the foreground (%);
  • The total CPU usage (%);
  • The amount of memory used by the foreground process and application (%);
  • The total memory usage (%);
  • Bytes received;
  • Bytes sent;
  • The number of processes of the application in the foreground.

3.2.4. Log-on and Log-off Activity-Related Data

Log-on and log-off sessions can act as primary barriers to securing the system and the necessary password protection that needs to be activated for performing log-on activity. Log-on and log-off events are completely handled by the system domain controller (Figure 3). To collect the logs, the usage of PowerShell scripts is useful, and modules such as Active Directory (AD) have been used to retrieve the logs and save them in the database. An activity is referred to as an event, and every event has a unique identification (ID).
In the performed analyses, the logs are filtered based on event IDs related to log-on, log-off, privilege escalations, etc. Next, log-on/log-off activities are collected:
  • 4624—successful log-on,
  • 4625—failed log-on,
  • 4648—log-on with explicitly mentioning credentials,
  • 4672—new log-on with special privileges.
Every event log has details such as workstation name, AD name, etc. These details are helpful in the process of synchronization during the system operation timeline.

3.2.5. File-System-Related Data

Cyberattackers’ primary goal is to log in to the system and search for sensitive information in the files and memory and later mitigate through the network to infect more devices. Considering that unauthorized access to the information contained in organization devices does pose a threat, this makes the control of file access important. To monitor this activity in relation to the access of the different devices located in the protected network, a library named “Watchdog” has been used to log the entire file system activity (Figure 3). The “Watchdog” is an open-source Python library that represents a simple software program that enables monitoring of file system events. It is possible to define a folder or a directory to be observed by the watchdog, which enables the monitoring of the selected folder for any changes such as file modification, creation, deletion, or moving among different folders.

3.2.6. The CPU and Memory Usage

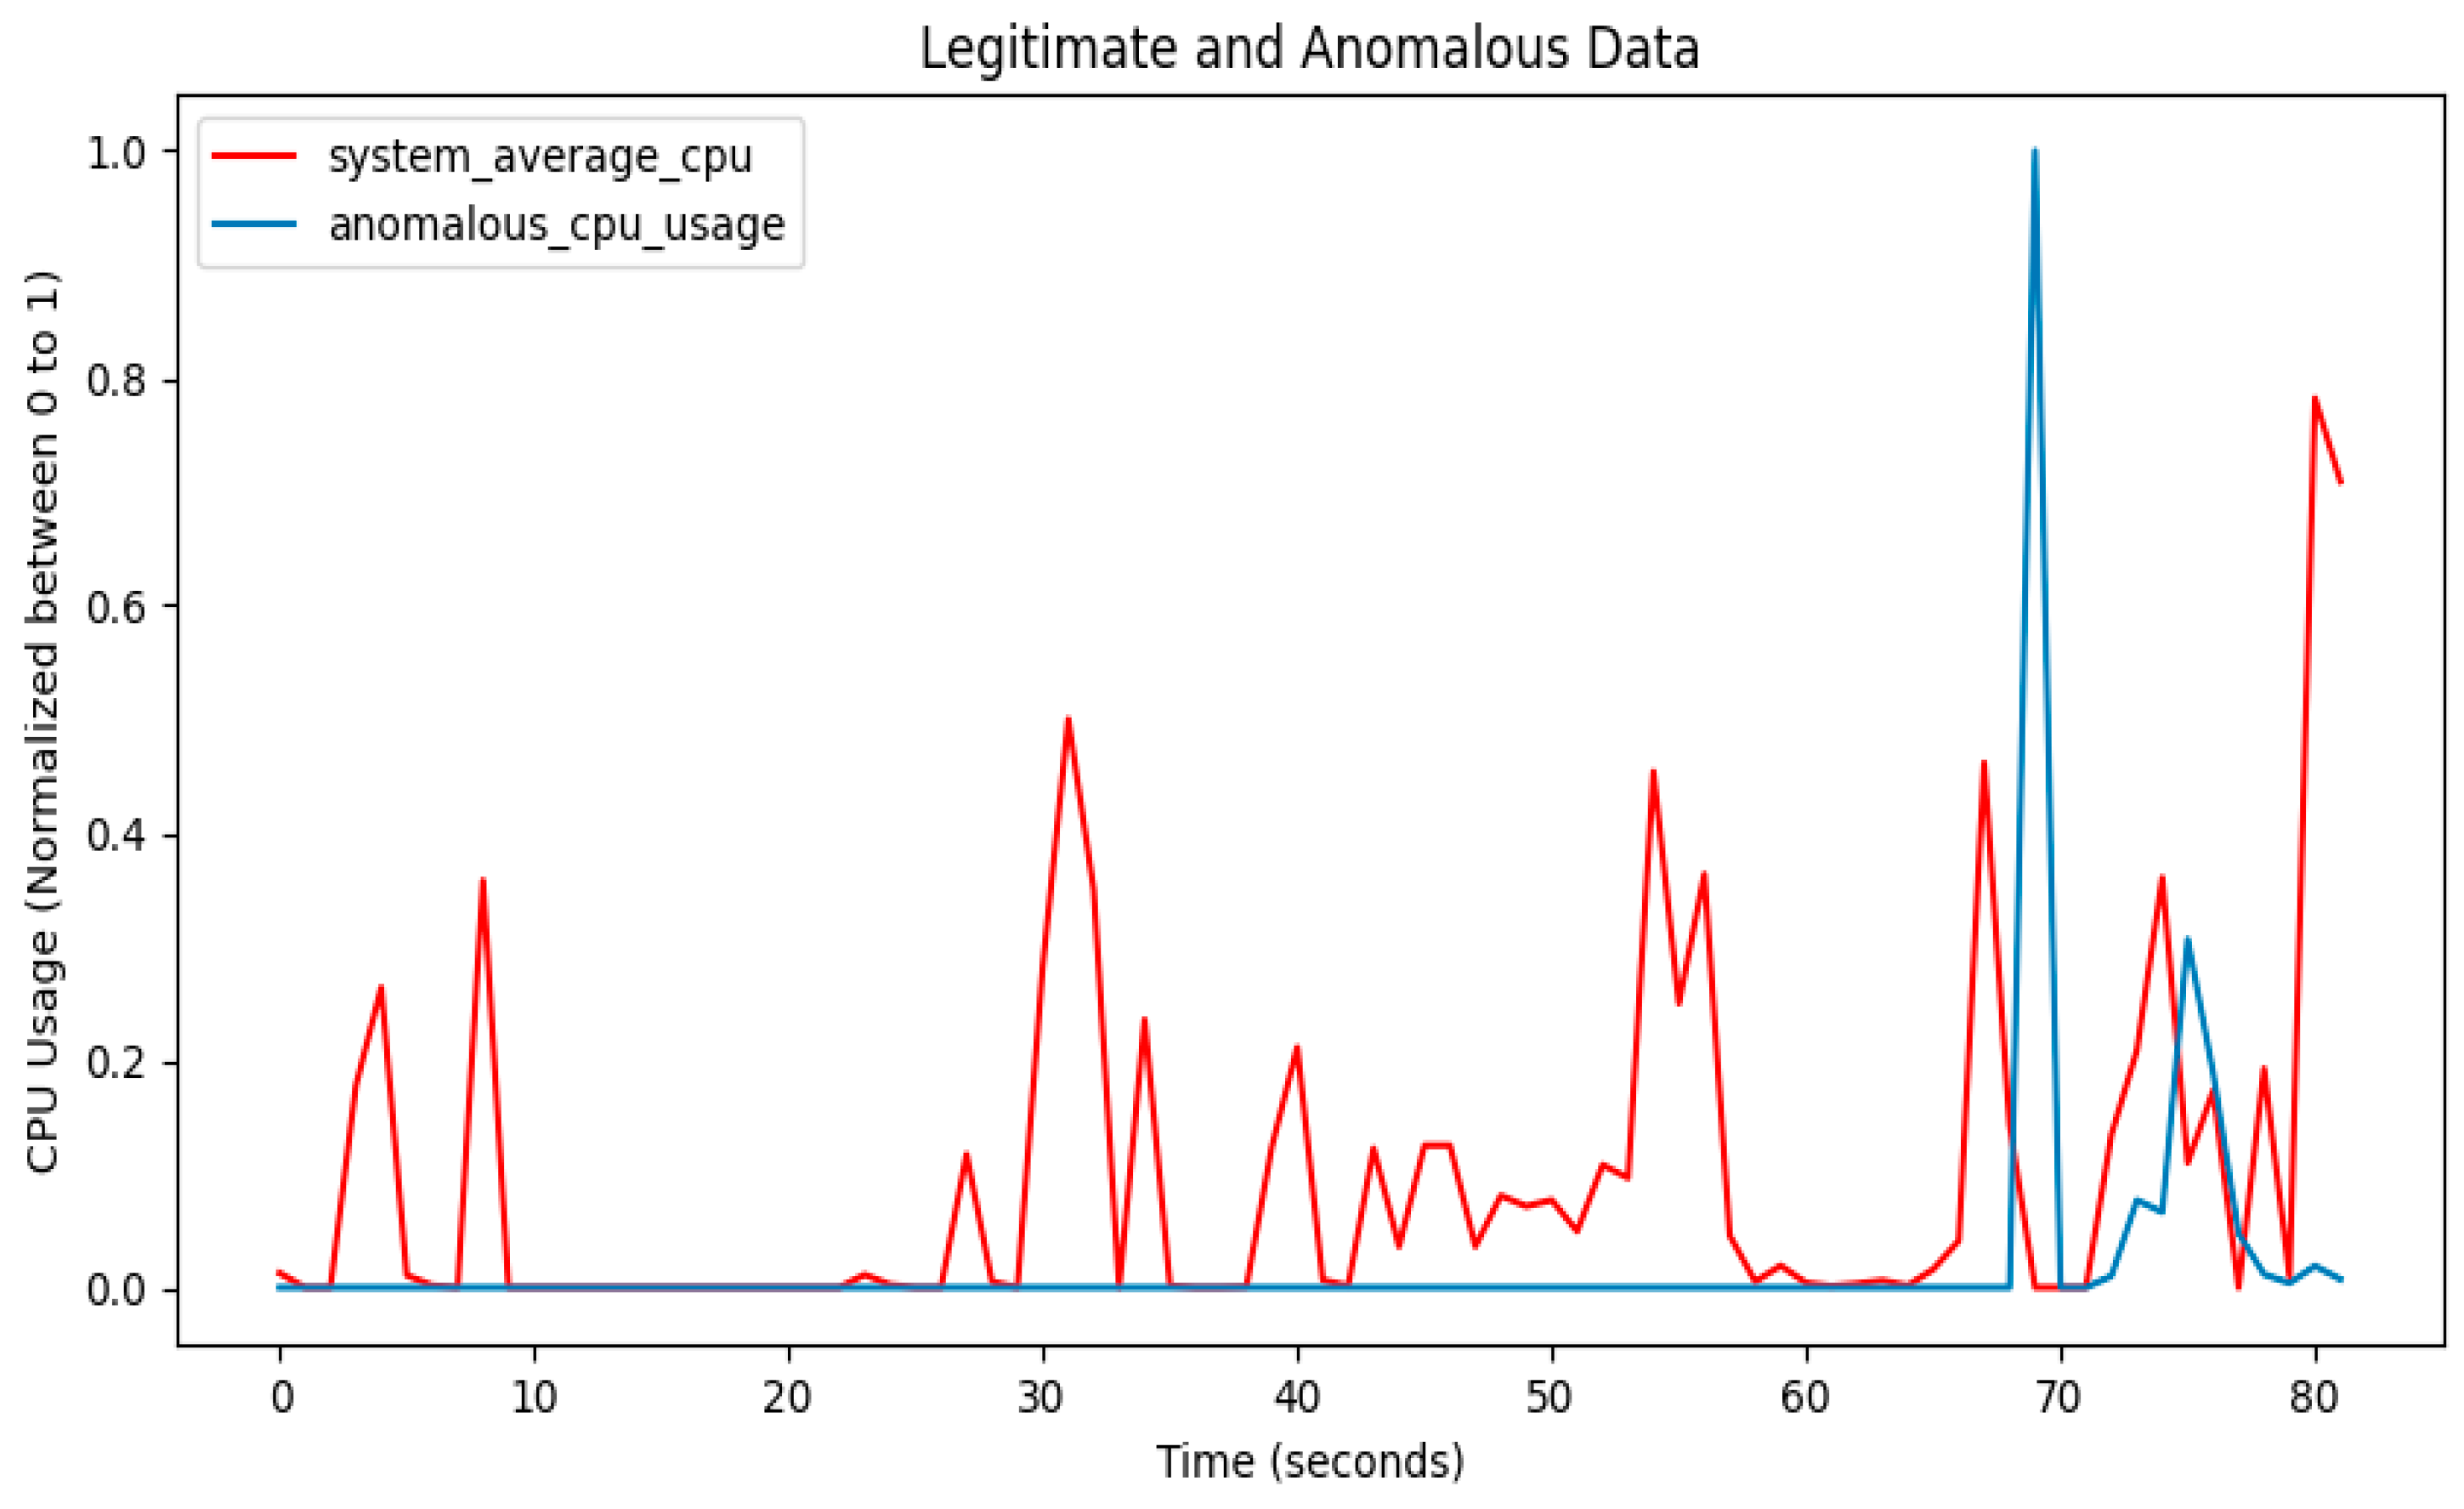
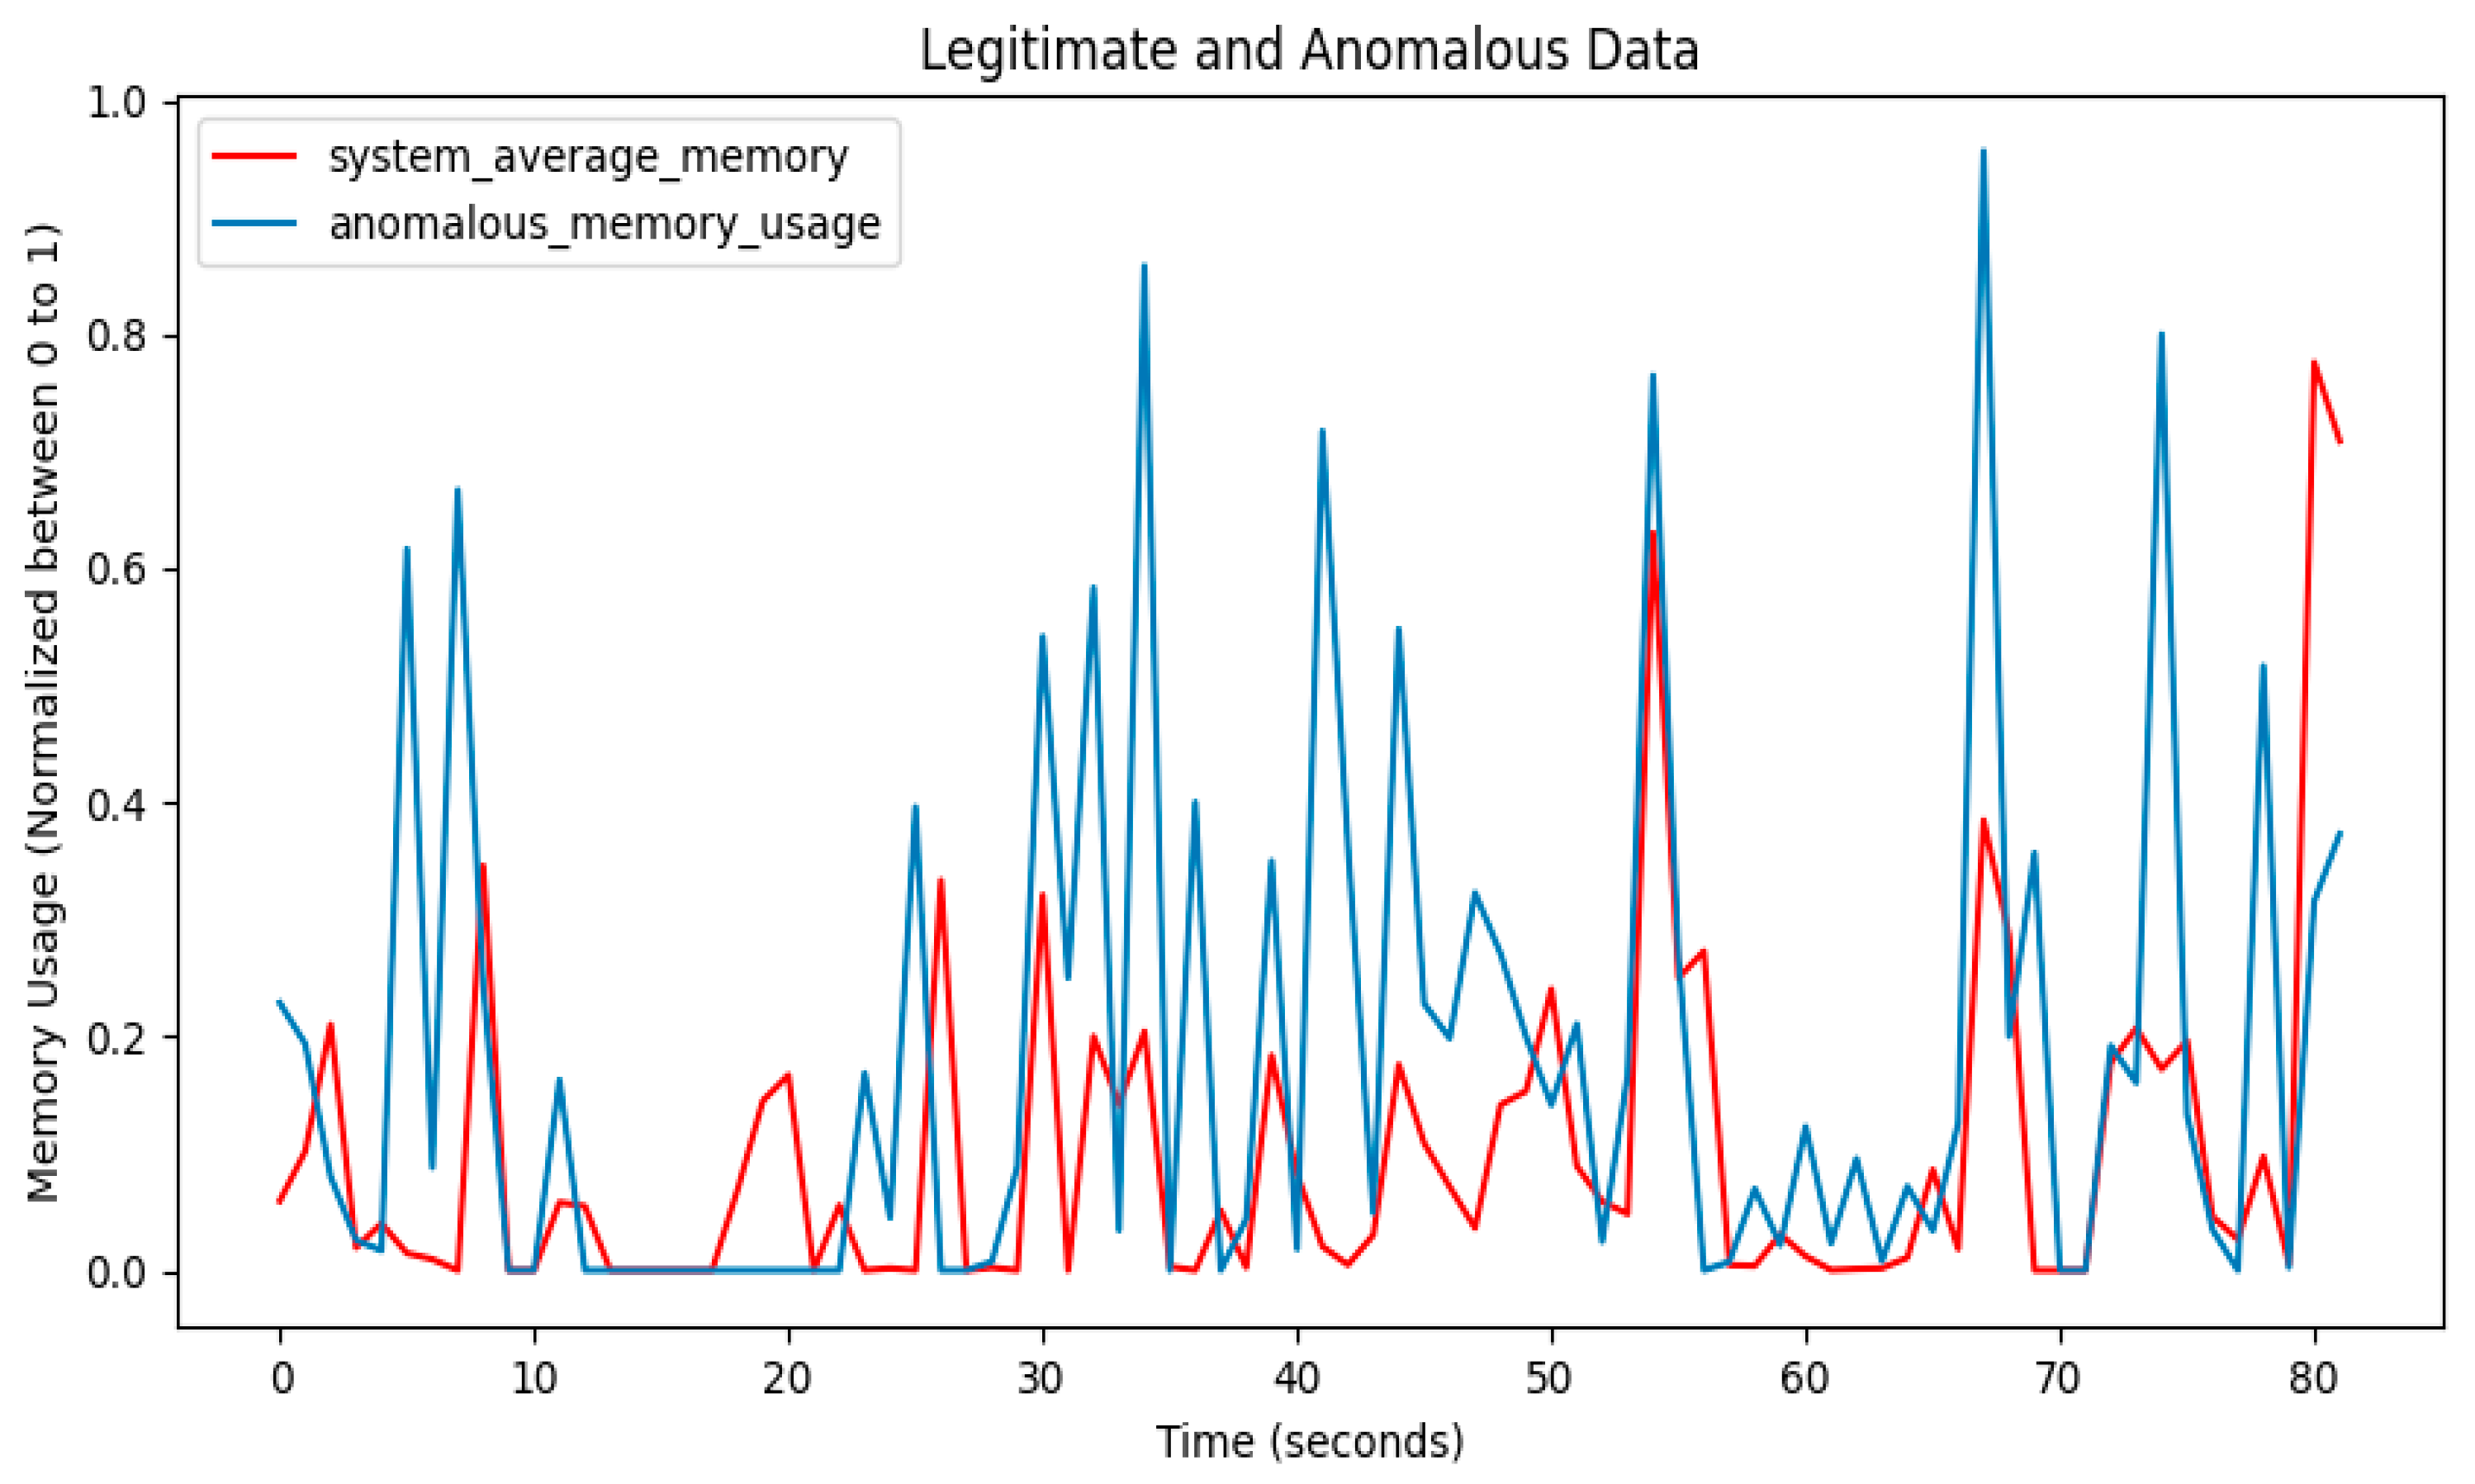
All the data related to the CPU and memory usage of the system devices have been synchronized according to the timelines of the activities that happened in the monitored system (Figure 3). For example, an employee working at the front desk in an organization generally has a routine usage of the system resources (CPU, memory, etc.), and there will be no rapid rise in resource consumption. Such behavior of resource usage is assumed to be normal. To better illustrate the differences between normal and anomaly resource usage, the data shown in Figure 4 and Figure 5 indicate a real system exhibiting average behavior in terms of CPU and memory usage, respectively. In Figure 4 and Figure 5, the characteristics of usage of CPU and memory are plotted separately during the time period of 80 s. Figure 4 and Figure 5 represent some typical occasions in which differences between normal and anomaly behavior are present. While the data used for predicting anomalies are considered in significantly longer time frames than a 80 s time frame, from Figure 4 and Figure 5, it can be seen that anomaly behavior of CPU or memory usage has been recorded and correlated with normal CPU and memory behavior, respectively. Such records of the system resources’ behavior are used as a benchmark for detecting the anomaly behavior of the cyberattacker in the process of detecting cyberattacks. Significant variations in the memory and CPU system records from those that are assumed to be normal can be indicators of a cyberattack. The library “psutil” is used for collecting information about CPU/memory usage and network usage (Figure 3).

3.2.7. Internet Browsing Data

Numerous requests are sent back and forth between a server and client devices during internet browsing. The connection between the client and server can be HTTP and a secured version of HTTP (HTTPS). Inspecting such requests can provide much information about a device’s usage. Every client–server request contains information such as the type of request, port number, etc. The “pywinauto” library presented in Figure 3 has been used to capture every request and filter them based on the required conditions.

3.2.8. Anomaly-Related Data

The proposed security threat detection approach is intended to detect anomalous activity within the organization’s network and systems. This activity can be created with the help of anomaly-related data in the form of low-profile malware such as trojans and botnets (Figure 3). The experimental analyses performed in this work include monitoring several actions of users performing anomaly behavior. As the users have different usage patterns, anomalous data is expected to be unique for each user (Figure 3).
The user’s behavior was simulated in the virtual environment by segregating and assigning specific work tasks on a daily basis. In this way, the data are logged for different usage scenarios, such as normal usage that represents a scenario where there is no cyberattack, and also for scenarios that correspond to cyberattacks. Therefore, the type of activity that a particular user is carrying out is known, since the user’s behavior was simulated in the virtual environment, in which we define users’ behavior for the purpose of analyses.
To make the anomaly data appear more legitimate, unique malware simulation programs are developed. A privilege escalation attack is one of the most dangerous attack patterns, and to simulate this attack in the performed analyses, a GitHub repository named “juicy-potato” [26] is used as a base, and it is further customized among the different users. Additionally, to achieve more realistic analyses, a scenario where user 1 and user 2 work on the same project is considered, and user 2 attempts to access highly confidential project files (Figure 1). Another type of malware attack is tested using a botnet in the analyses for controlling web requests remotely [27]. An example used for the examination of the performance of the proposed insider threat detection is based on a few users’ devices being scheduled to make requests to suspicious web domains in order to create malicious web traffic.

3.3. Feature Description

The next phase in the execution of the proposed solution is the feature description (Figure 2). The features, also called attributes, are used for training a model, and they have a key role in the model’s performance. The selection of different features is performed based on heterogeneous features proposed in [28] for modeling the users’ behavior when they interact with their personal computers. For different analyzed feature domains, the feature descriptions are presented in Table 2. Each feature presented in Table 2 represents the parameter that has been monitored, and collected parameters serve as input for the developed artificial neural network (ANN) encoder.
The feature vector represents the set of attributes for a single instance, which is an important element for the post-synchronization phase of the proposed solution. The post-synchronization of data is dedicated to the splitting, preprocessing, and training of the data collected in the previous phase (Figure 2). However, with sophisticated techniques, an attacker may generate threat pattern variations in the time scale of the order of milliseconds. Therefore, selecting a dataset, or feature vector, with a fixed time window might split the attacker’s threat pattern, thus increasing the possibility of detecting it. Hence, the risk of an attack can be reduced by performing detection in flexible time periods (windows).
The session-based time window approach was proposed in [19], where all the events in a session were recorded and represented in a single feature vector for a given session. A user can log off and log on many times in a day, which creates many sessions in a day. Examples of the characteristics of average CPU load (system_average_cpu attribute in Table 2) and average system memory load (system_average_memory attribute in Table 2) between log-on and log-off sessions are presented in Figure 4 and Figure 5, respectively. By considering the possibility of having many sessions in a day, the proposed threat detection algorithm offers a chance to split threat patterns between the sessions too. For example, considering the complete working hours of each day will be a possible approach for insider threat detection. Finding user activity outside of office hours can be considered an anomaly, unless there is an exceptional case like working overtime.

3.4. Preprocessing Phase

The preprocessing activity is the third stage in the workflow of the proposed model (Figure 2). The performance of the model is dependent on multiple factors, one of them being the data quality. For that reason, the collected data must be preprocessed. This process includes the removal of null values, normalization of the collected values, searching for outliers, etc. The data normalization process is performed in a way so that the data are scaled to the range between (0 and 1) using the Min–Max normalization technique. Every value in each attribute presented in Table 2 is normalized using the following formula:
X S C = X i X m i n X m a x X m i n
where x i represents the collected value, while the x m i n and x m a x represent the minimal and maximal value in the collected dataset.

3.5. Model Training

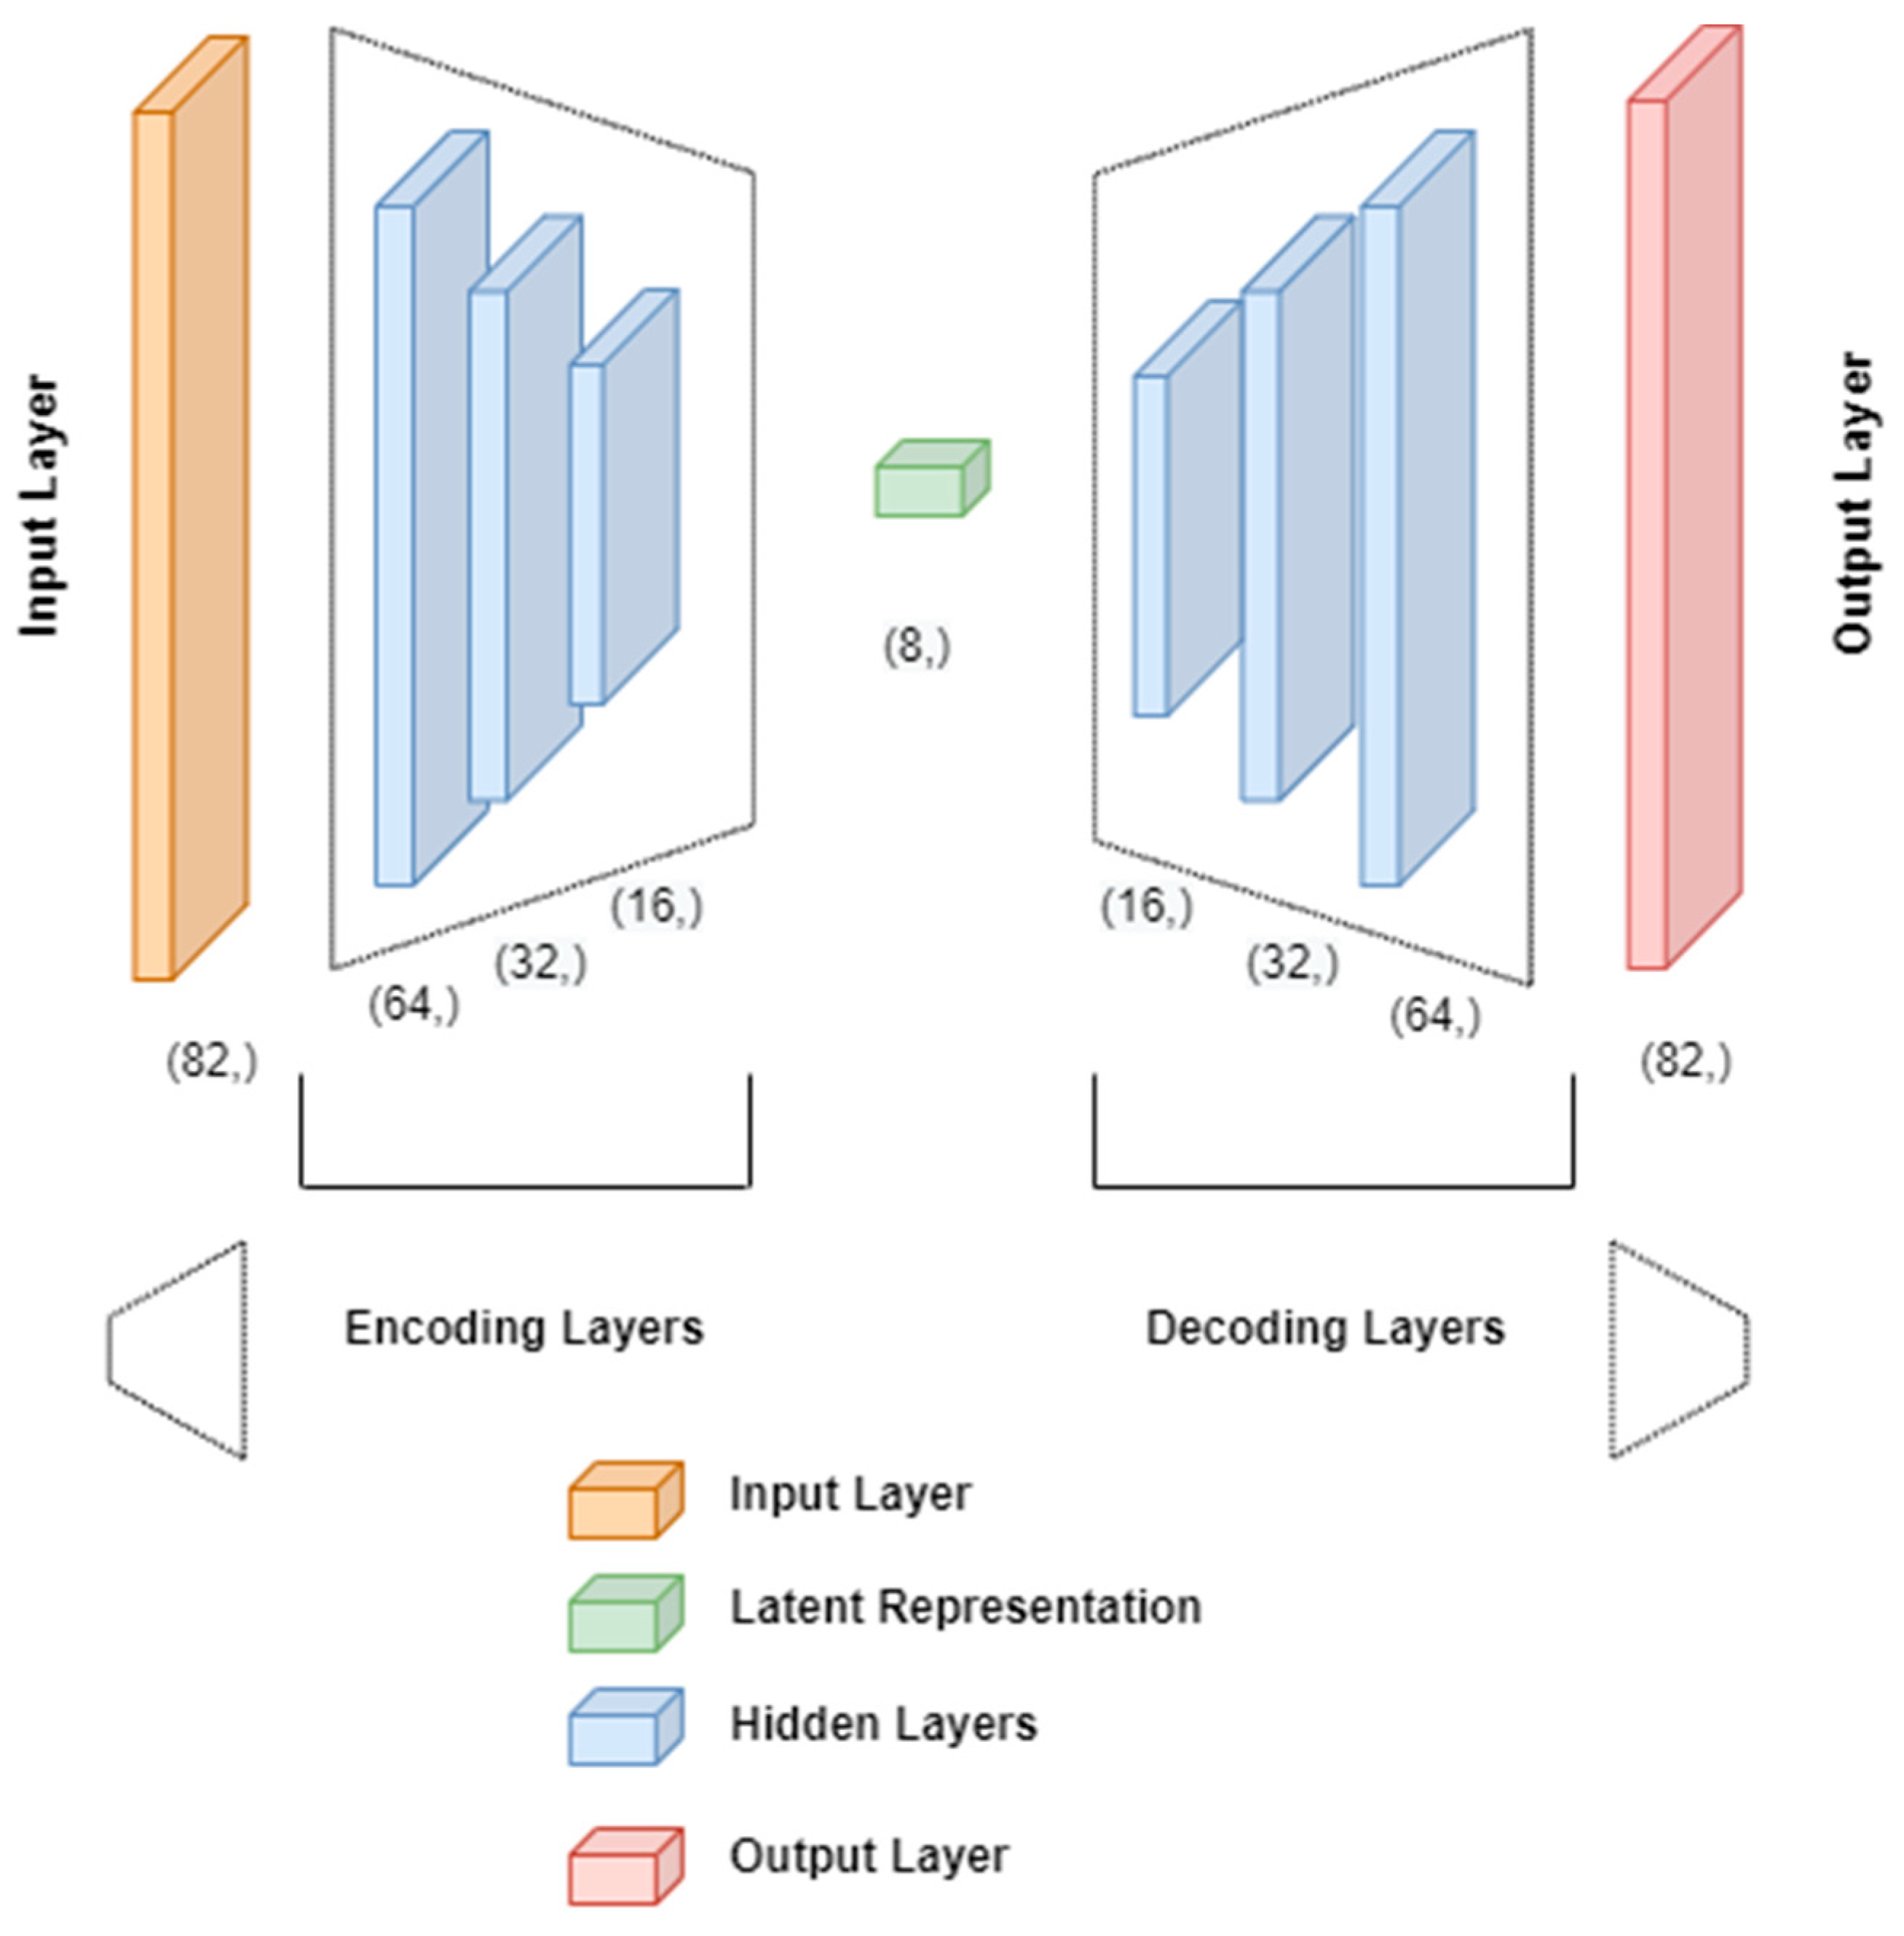
After the preprocessing phase is done, the next phase of the proposed solution is to build and train the model (Figure 2). To train the model, the unsupervised learning technique is applied in this paper. This technique does not need any labeled data, and instead, only the raw data are used as the input data. The technique used is based on trying to learn the patterns between the variables. As a variable, the data representing normal user behavior have been set as a benchmark variable, against which the security threat is tested. This means that the autoencoder, which consists of an encoder, decoder, and ANN, is used in this phase of the proposed model execution. The proposed architecture for insider threat detection is presented in Figure 6. Neural networks that are fully connected feed-forward networks are used in the analyses.
The encoder and decoder consist of four fully connected dense layers, which are the input, hidden (encoding and latent representation), and output layers (Figure 6). The input layer contains different feature values (Table 1) collected from different feature domains in real time. The ANN layers of the proposed model are presented in Figure 6 and include the following:
(Input layer (82, )) → (Encoding layers (64, ) → (32, ) → (16, )) → (Latent representation layer (8, )) → (Decoding layers (16, ) → (32, ) → (64, )) → (Output Layer (82, )).
The activation function used in each layer is the rectified linear activation unit (ReLU) function represented as
f ( x ) = x x > 0 0 x 0
where x is the input to the ANN neuron.
In the decoder, the last layer uses an activation function called the sigmoid (logistic) function which is represented as
z ( x ) = 1 1 + e x = e x e x + 1 = 1 z ( x )
The presented autoencoder performs a dimensionality reduction technique. This is because the autoencoder tries to learn in high-dimensional space. When the input data of any dimension are given to the encoder, it learns to map to the lower-dimensional space, and the decoder learns to map from the lower-dimensional space to the original input data. When the neurons pass the information from the encoder to the decoder, the information is preserved in a space called latent representation (Figure 6).
A model can be tuned for better performance using hyperparameters, where every parameter is designed to serve as a threshold for specific conditions, data types, etc. The parameters used for tuning the proposed model are:
  • Loss function parameter: among different loss functions, the MSE loss function (defined in the next section) fits best for the problem tackled by the proposed algorithm, since the proposed approach deals with continuous values.
  • Activation function parameter: for all the layers except the last layer, the ReLu activation function defined in Equation (2) is used. For the last ANN layer, sigmoid function (3) is used, as the output values need to be in the range of [0,1].
  • Optimizer parameter: the Adaptive Moment Estimation (ADAM) optimizer function is used to scale the magnitude of weight updates in order to minimize the network loss function.
  • The reason for choosing this specific optimizer is the fact that it is developed based on the drawbacks of other optimizers such as Adadelta (stochastic gradient-based optimization algorithm), root mean square propagation (RMSprop), etc.
  • Batch size parameter: this parameter also provides a major contribution to the model’s performance and needs to be lower than the lowest analyzed dataset size. For this approach, 120 is taken as the batch size according to the training set, CPU/GPU capability, etc.
  • Shuffle parameter: is set to false, as analysis is performed with continuous time series data. By setting it to false, this parameter helps in randomizing the data, which further enables the discretization of the analyzed data.
  • Restore_best_weights parameter: is set to True. The primary motive of a model is to select the best weights that provide a solution; therefore, this parameter selects the best weights from the previous epoch and updates accordingly.

3.6. Evaluation of the Model

The last phase of the proposed model is the evaluation of the capability of the model to be trained with the input data (Figure 2). The model is trained on input data (normalized according to Equation (1)), and its goal is to reconstruct the output data to be the same as the input data. This is achieved by minimizing the losses in each subsequent iteration of the model layers presented in Figure 6. The loss function used in the analyses is the MSE loss function, and the loss is minimized in each iteration, while weights are updated in the network through data backpropagation (Figure 3).
The MSE is calculated as
M S E = 1 N i = 1 n y i y ^ i 2
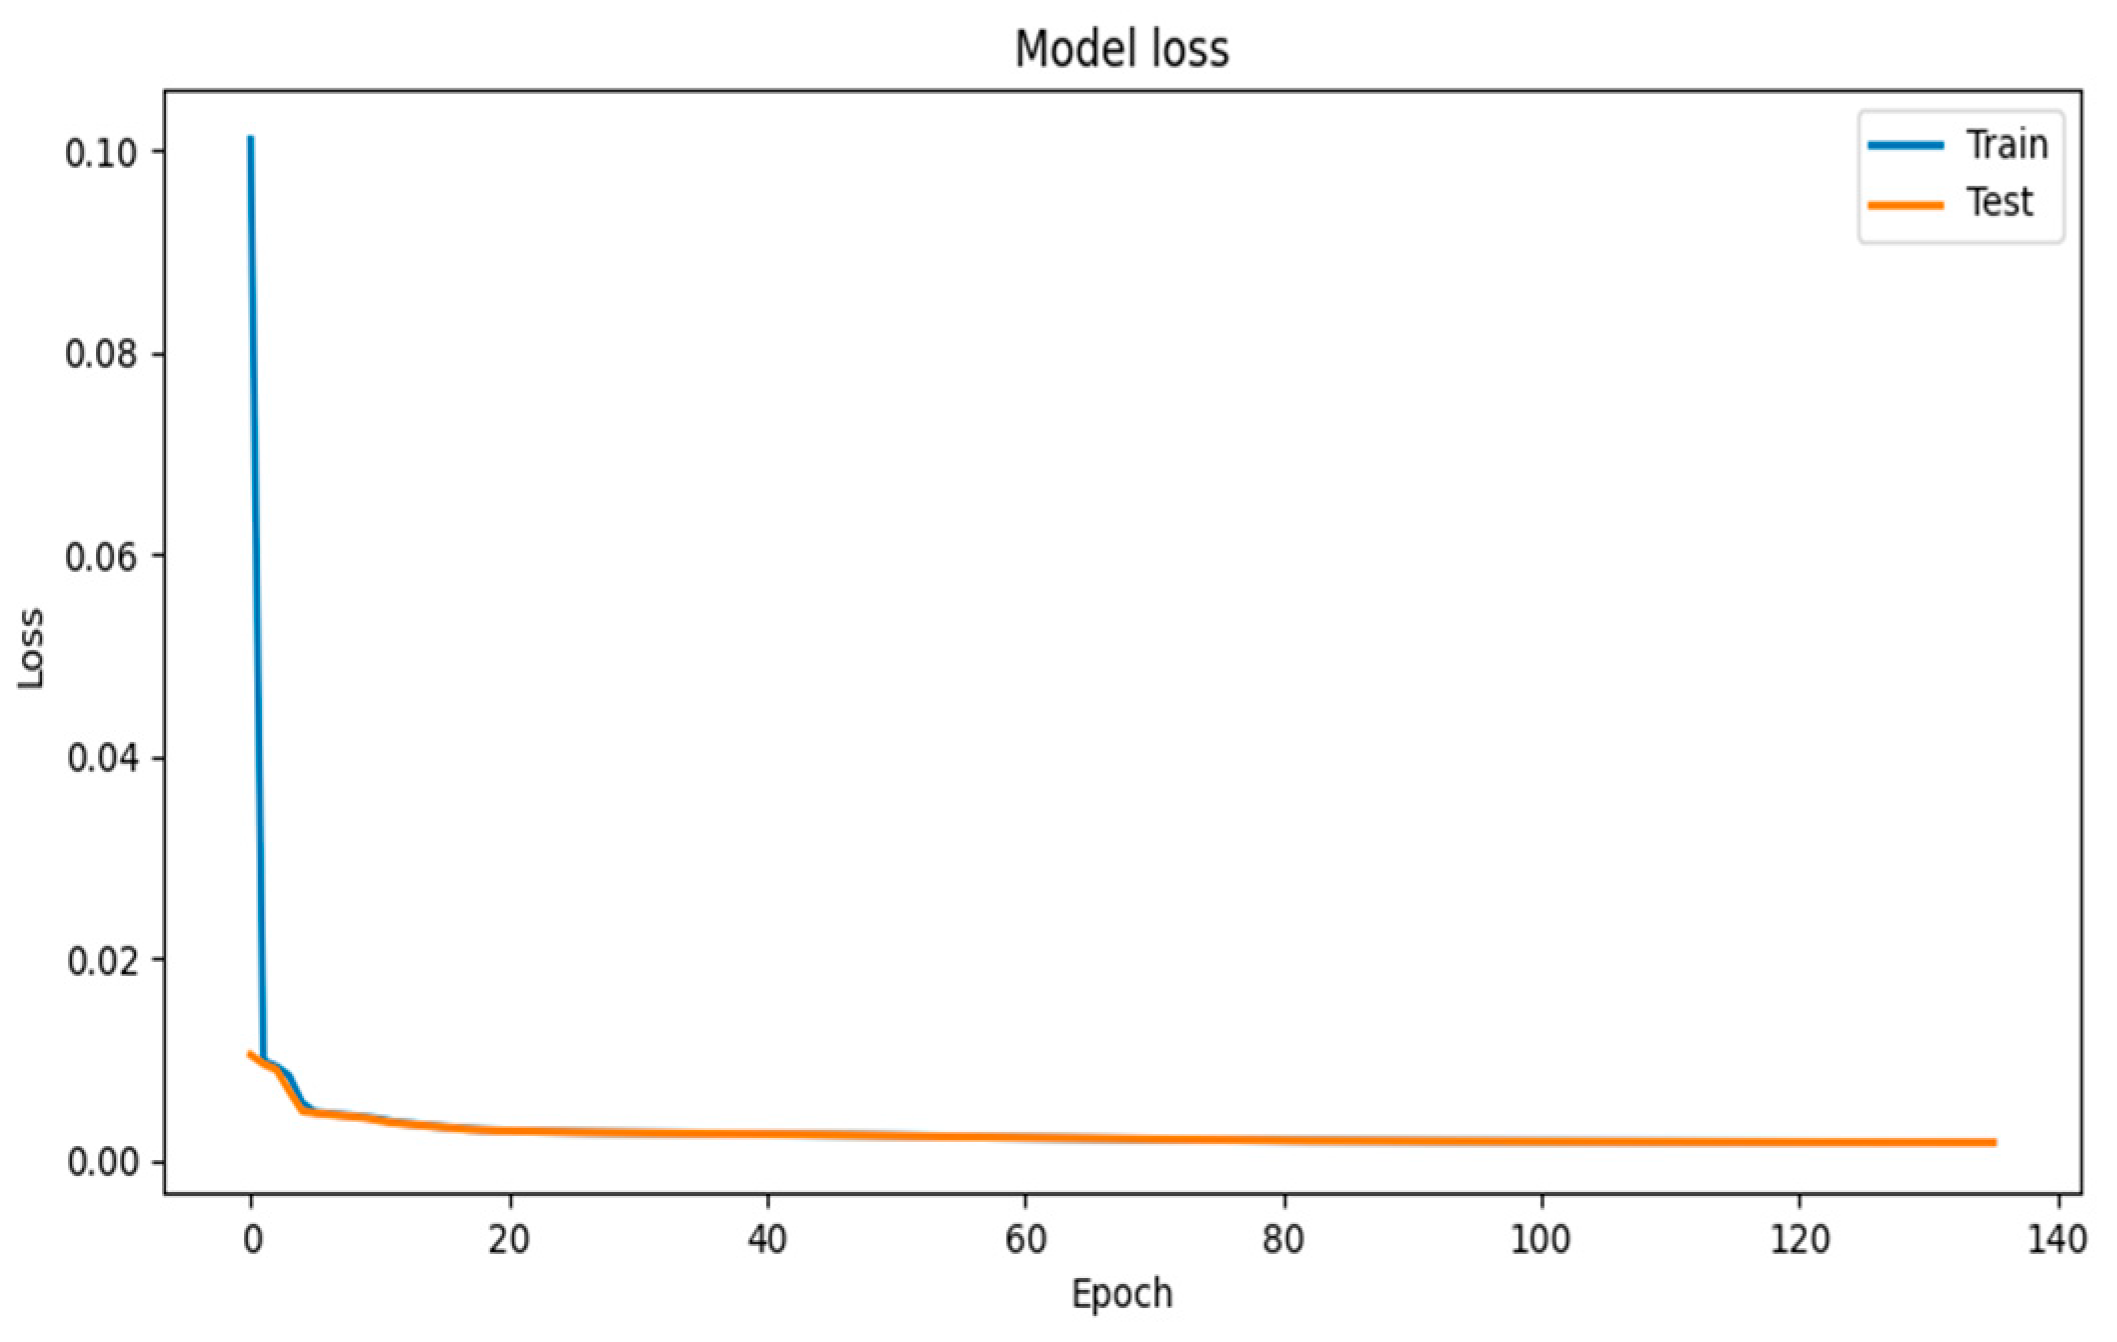
where yi is the actual value, ŷi is the predicted value of the normalized input data and i = 1, …, N is the iteration number, with N representing the total number of iterations. In Figure 7, the training and validation loss during the training phase (epoch) are presented. According to Figure 7, during the training phase, the model stopped early at 136 epochs due to a lack of significant loss between two successive iterations.
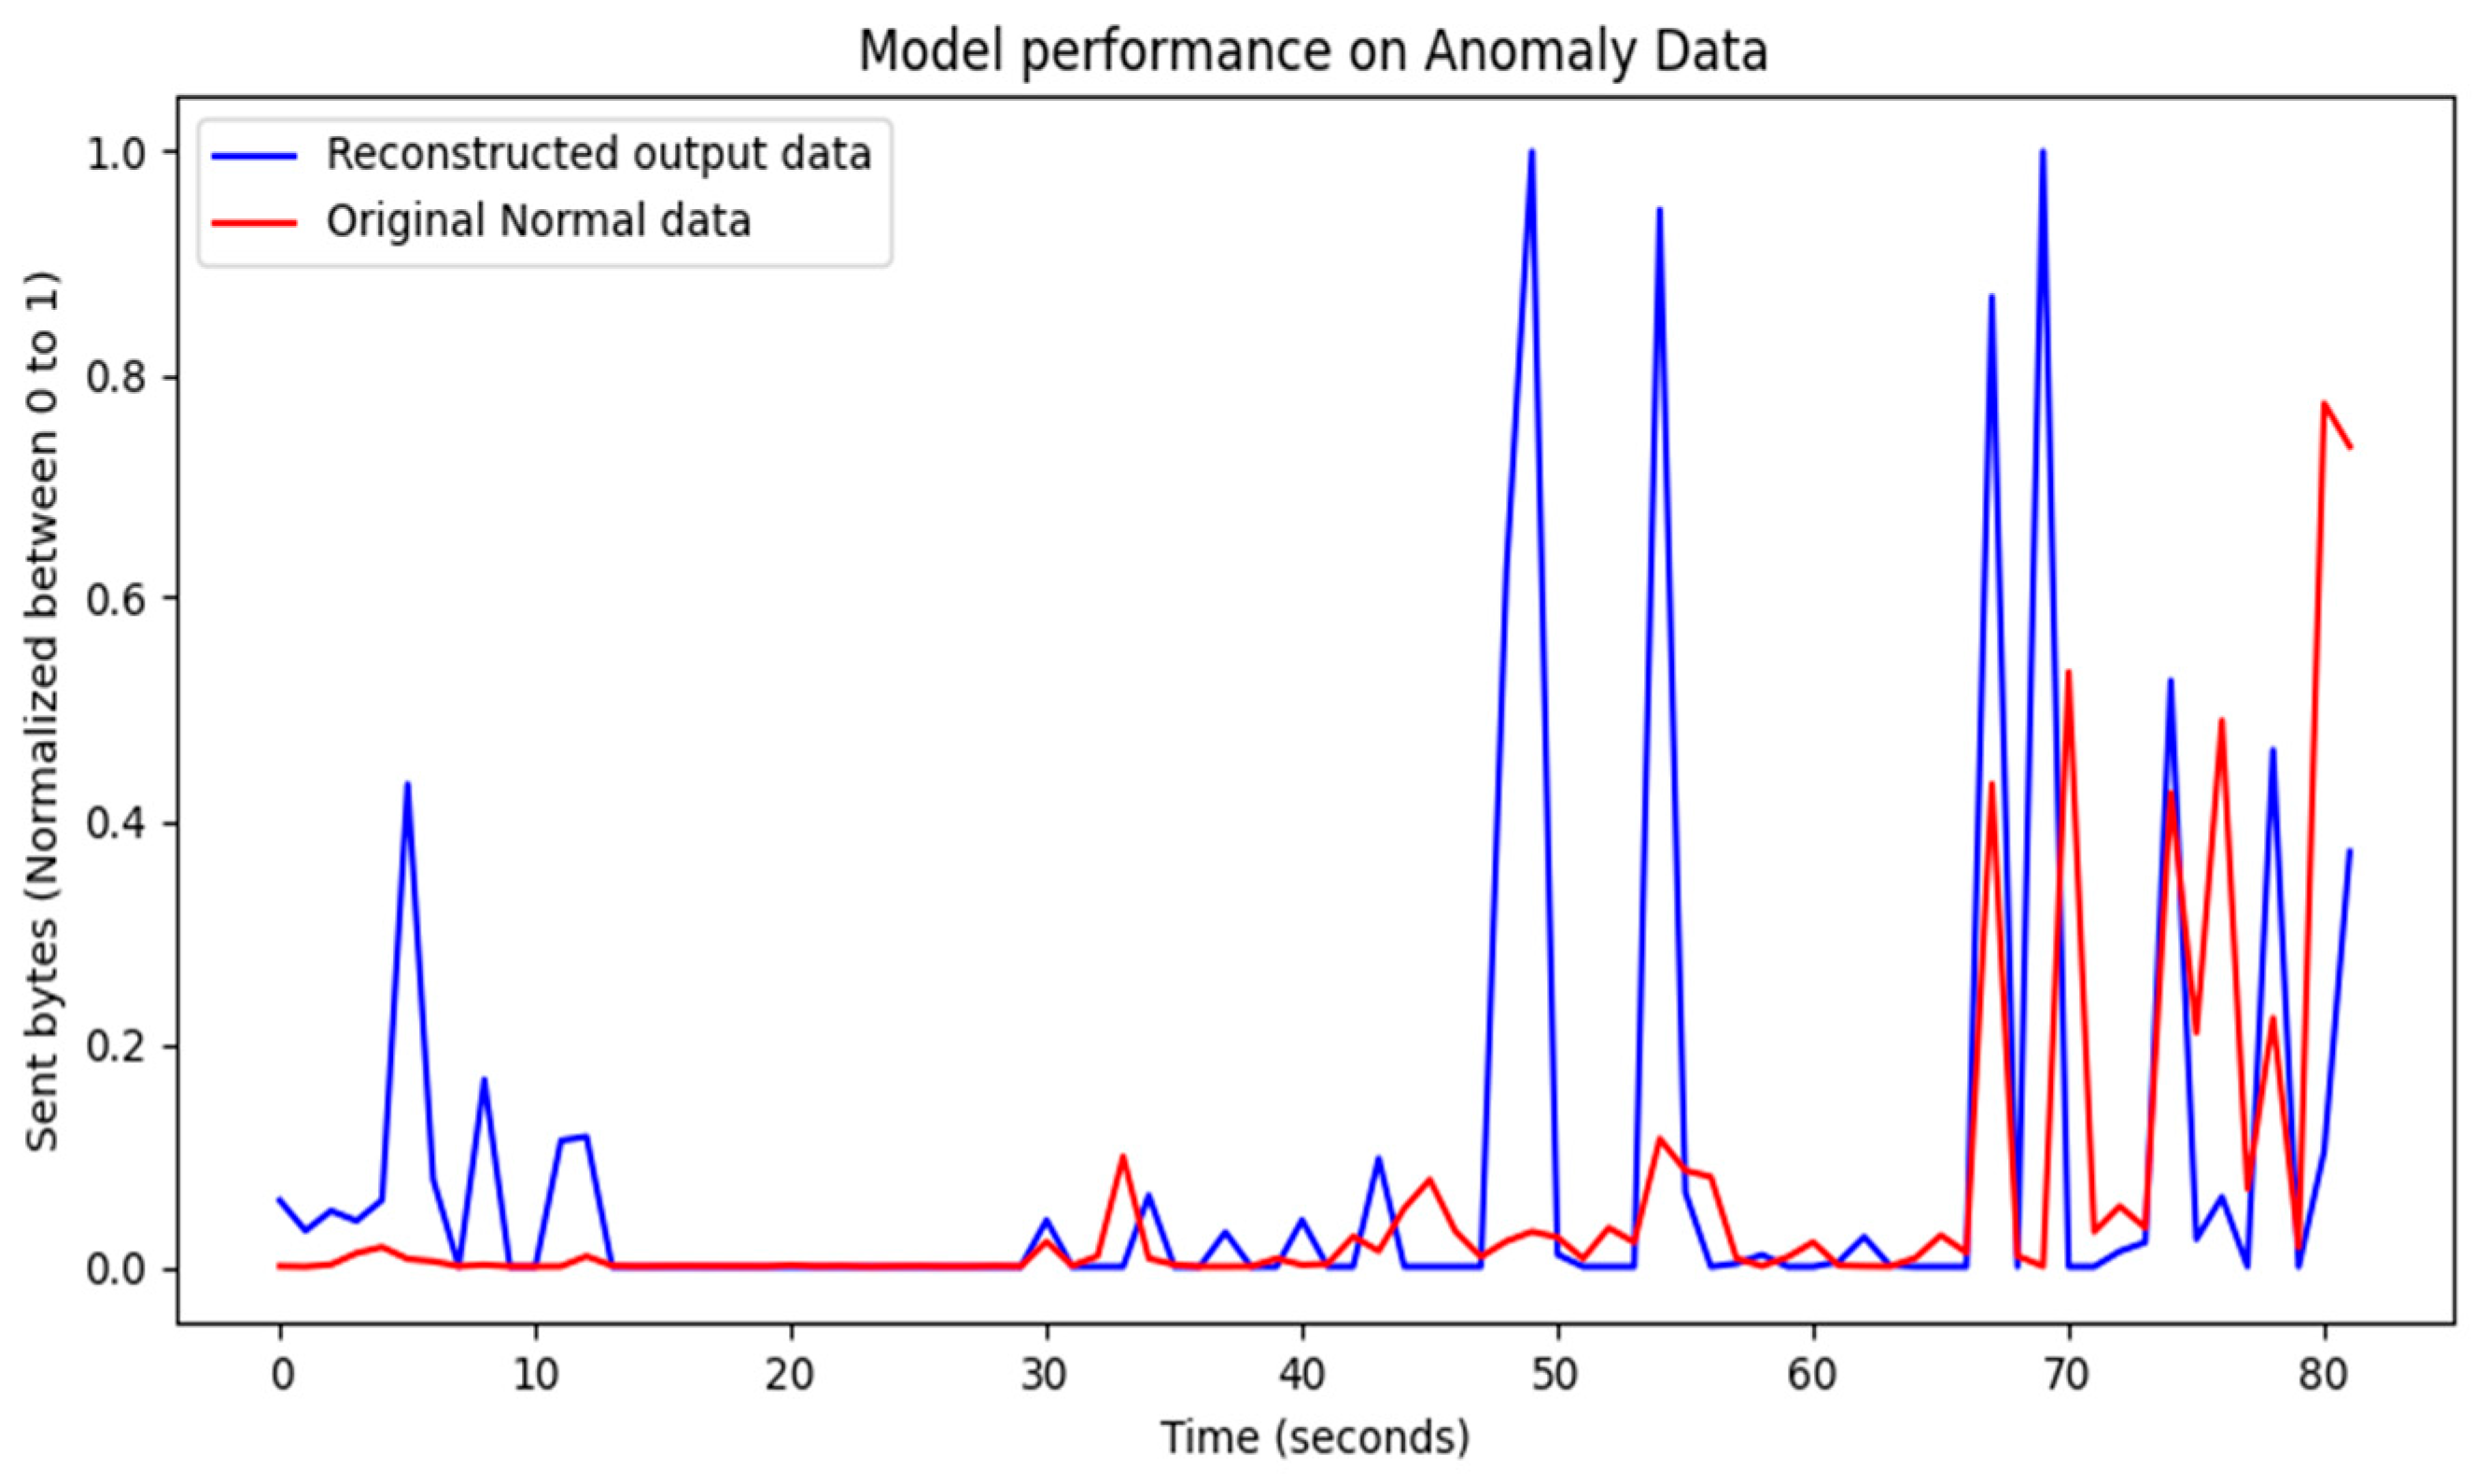
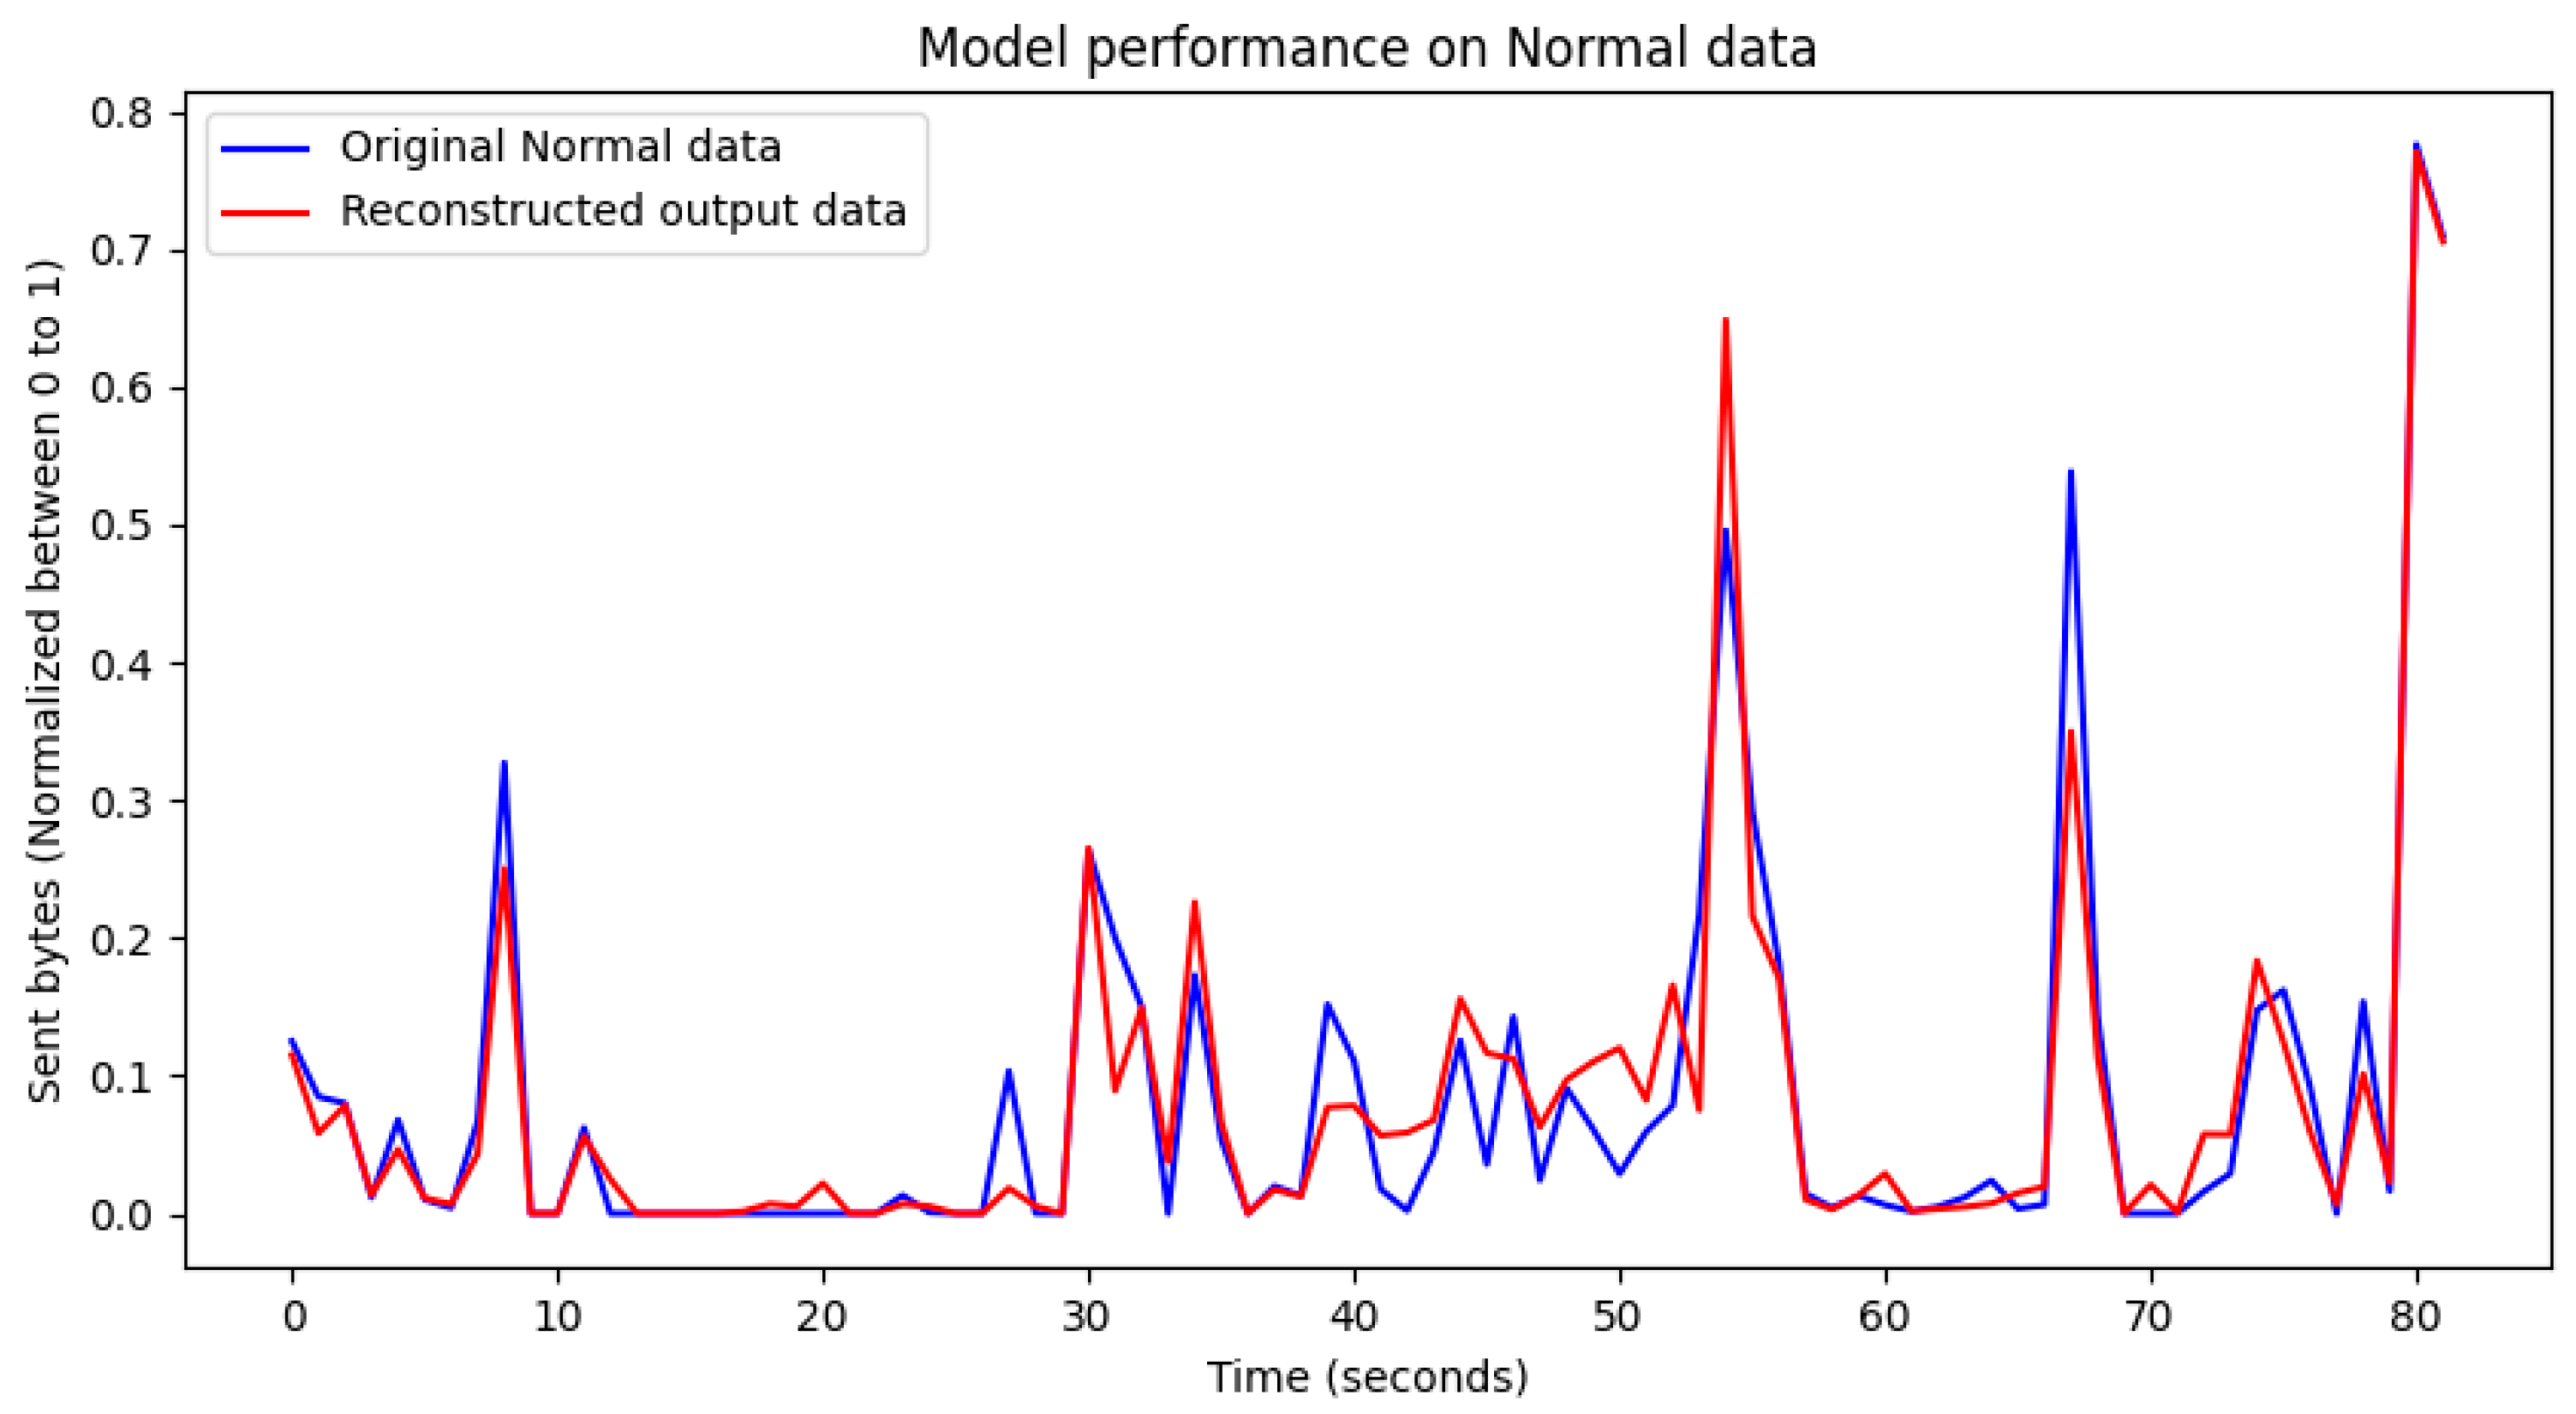
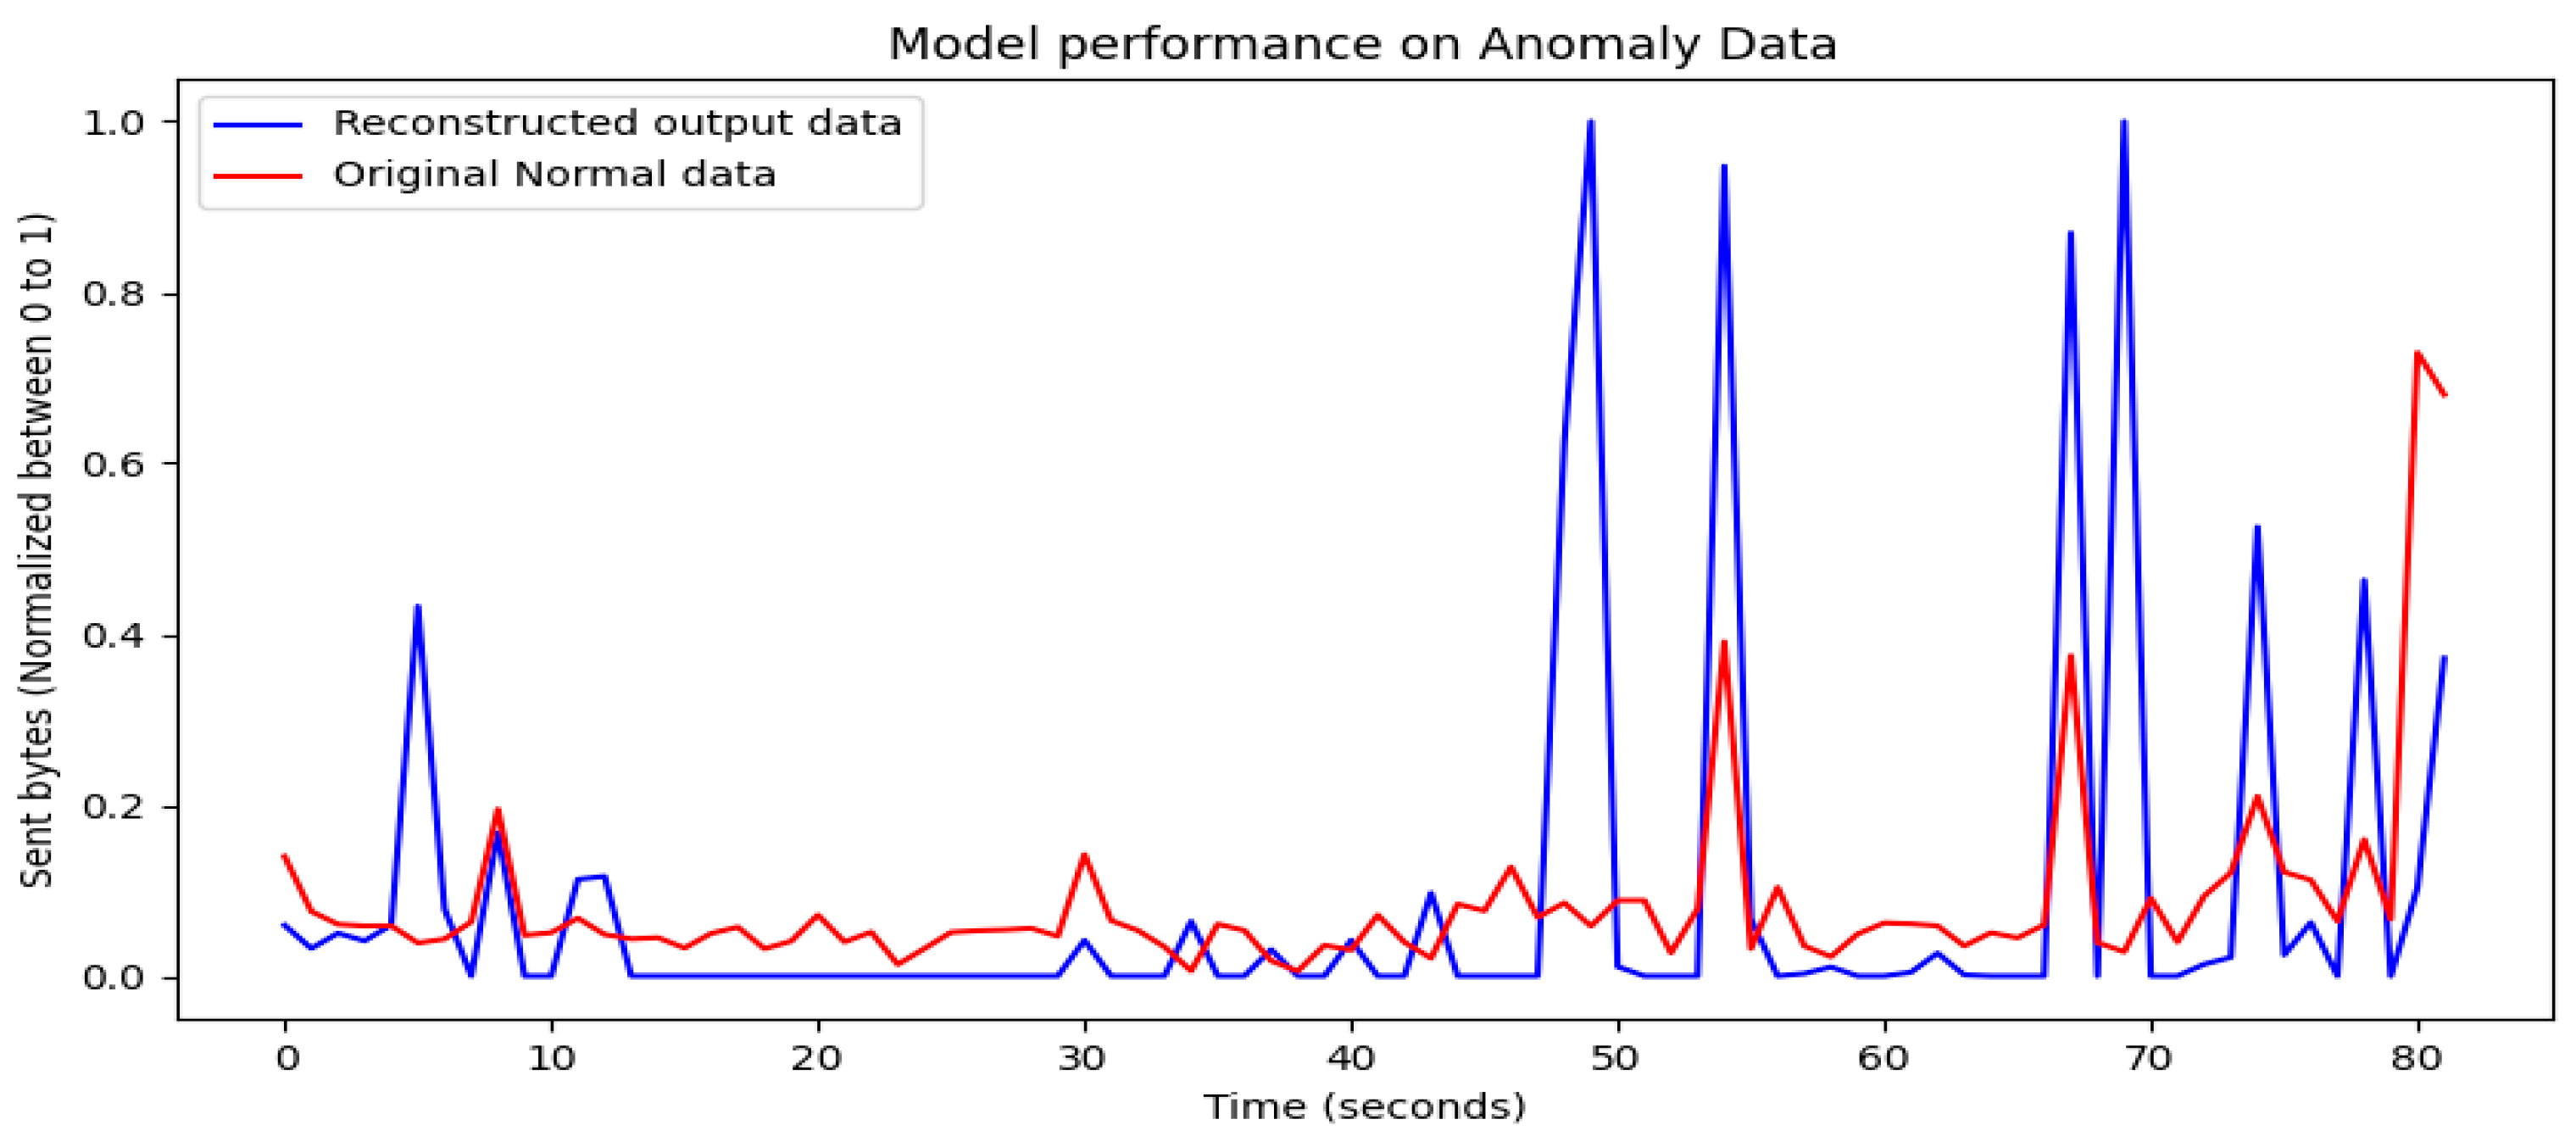
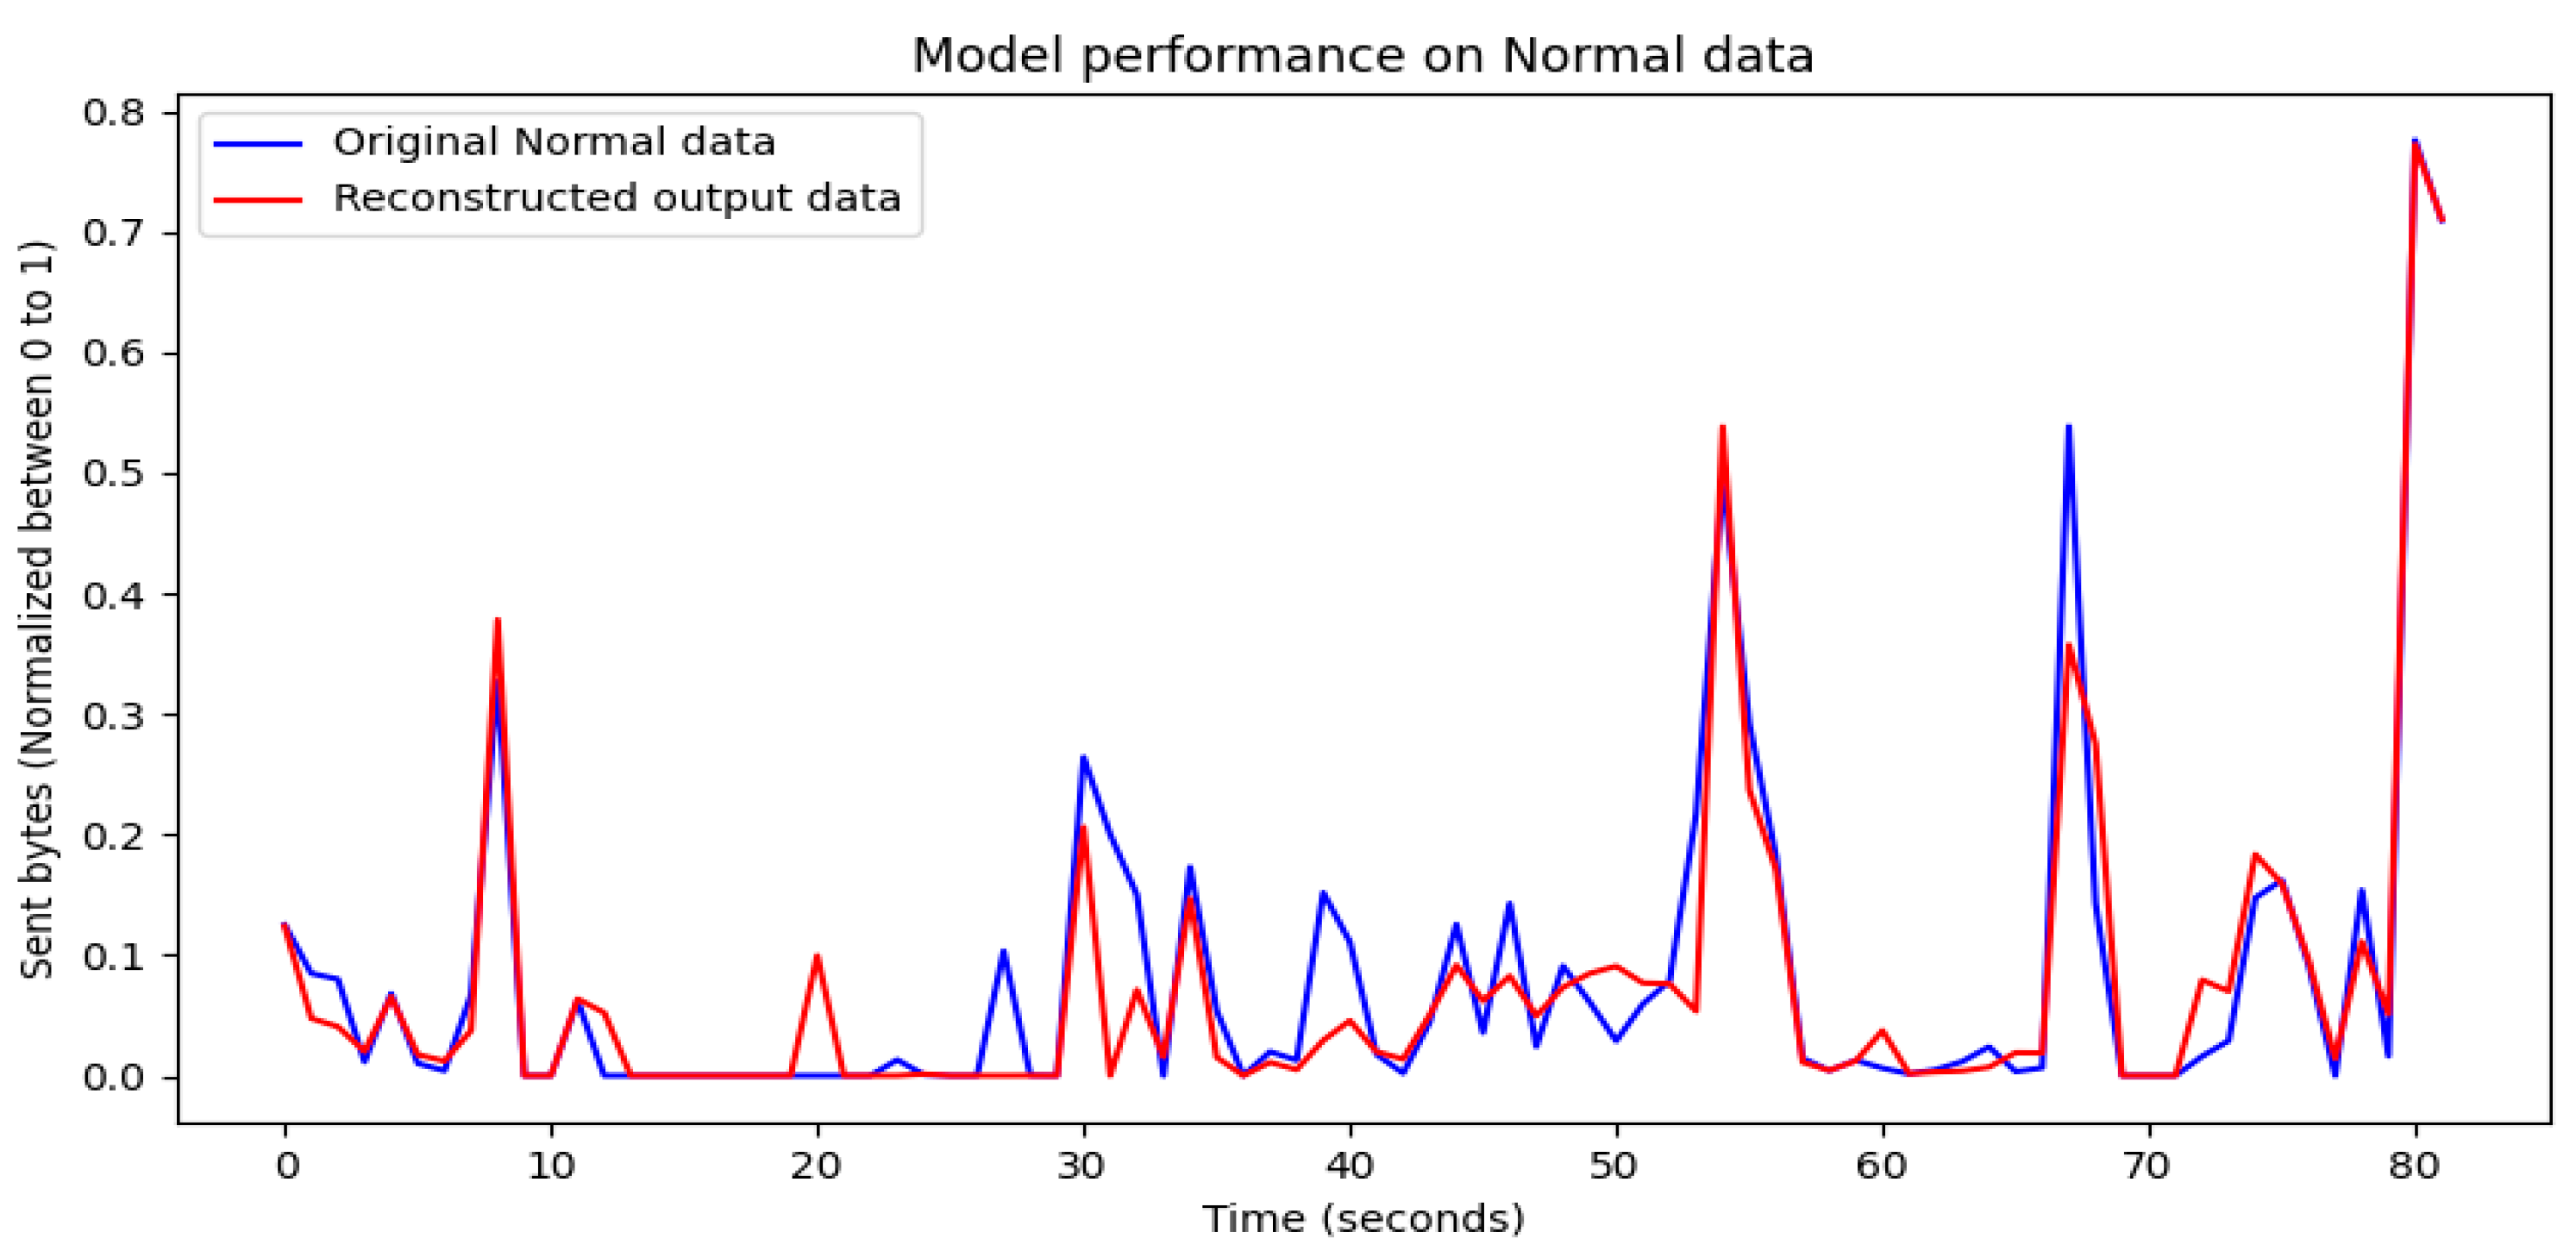
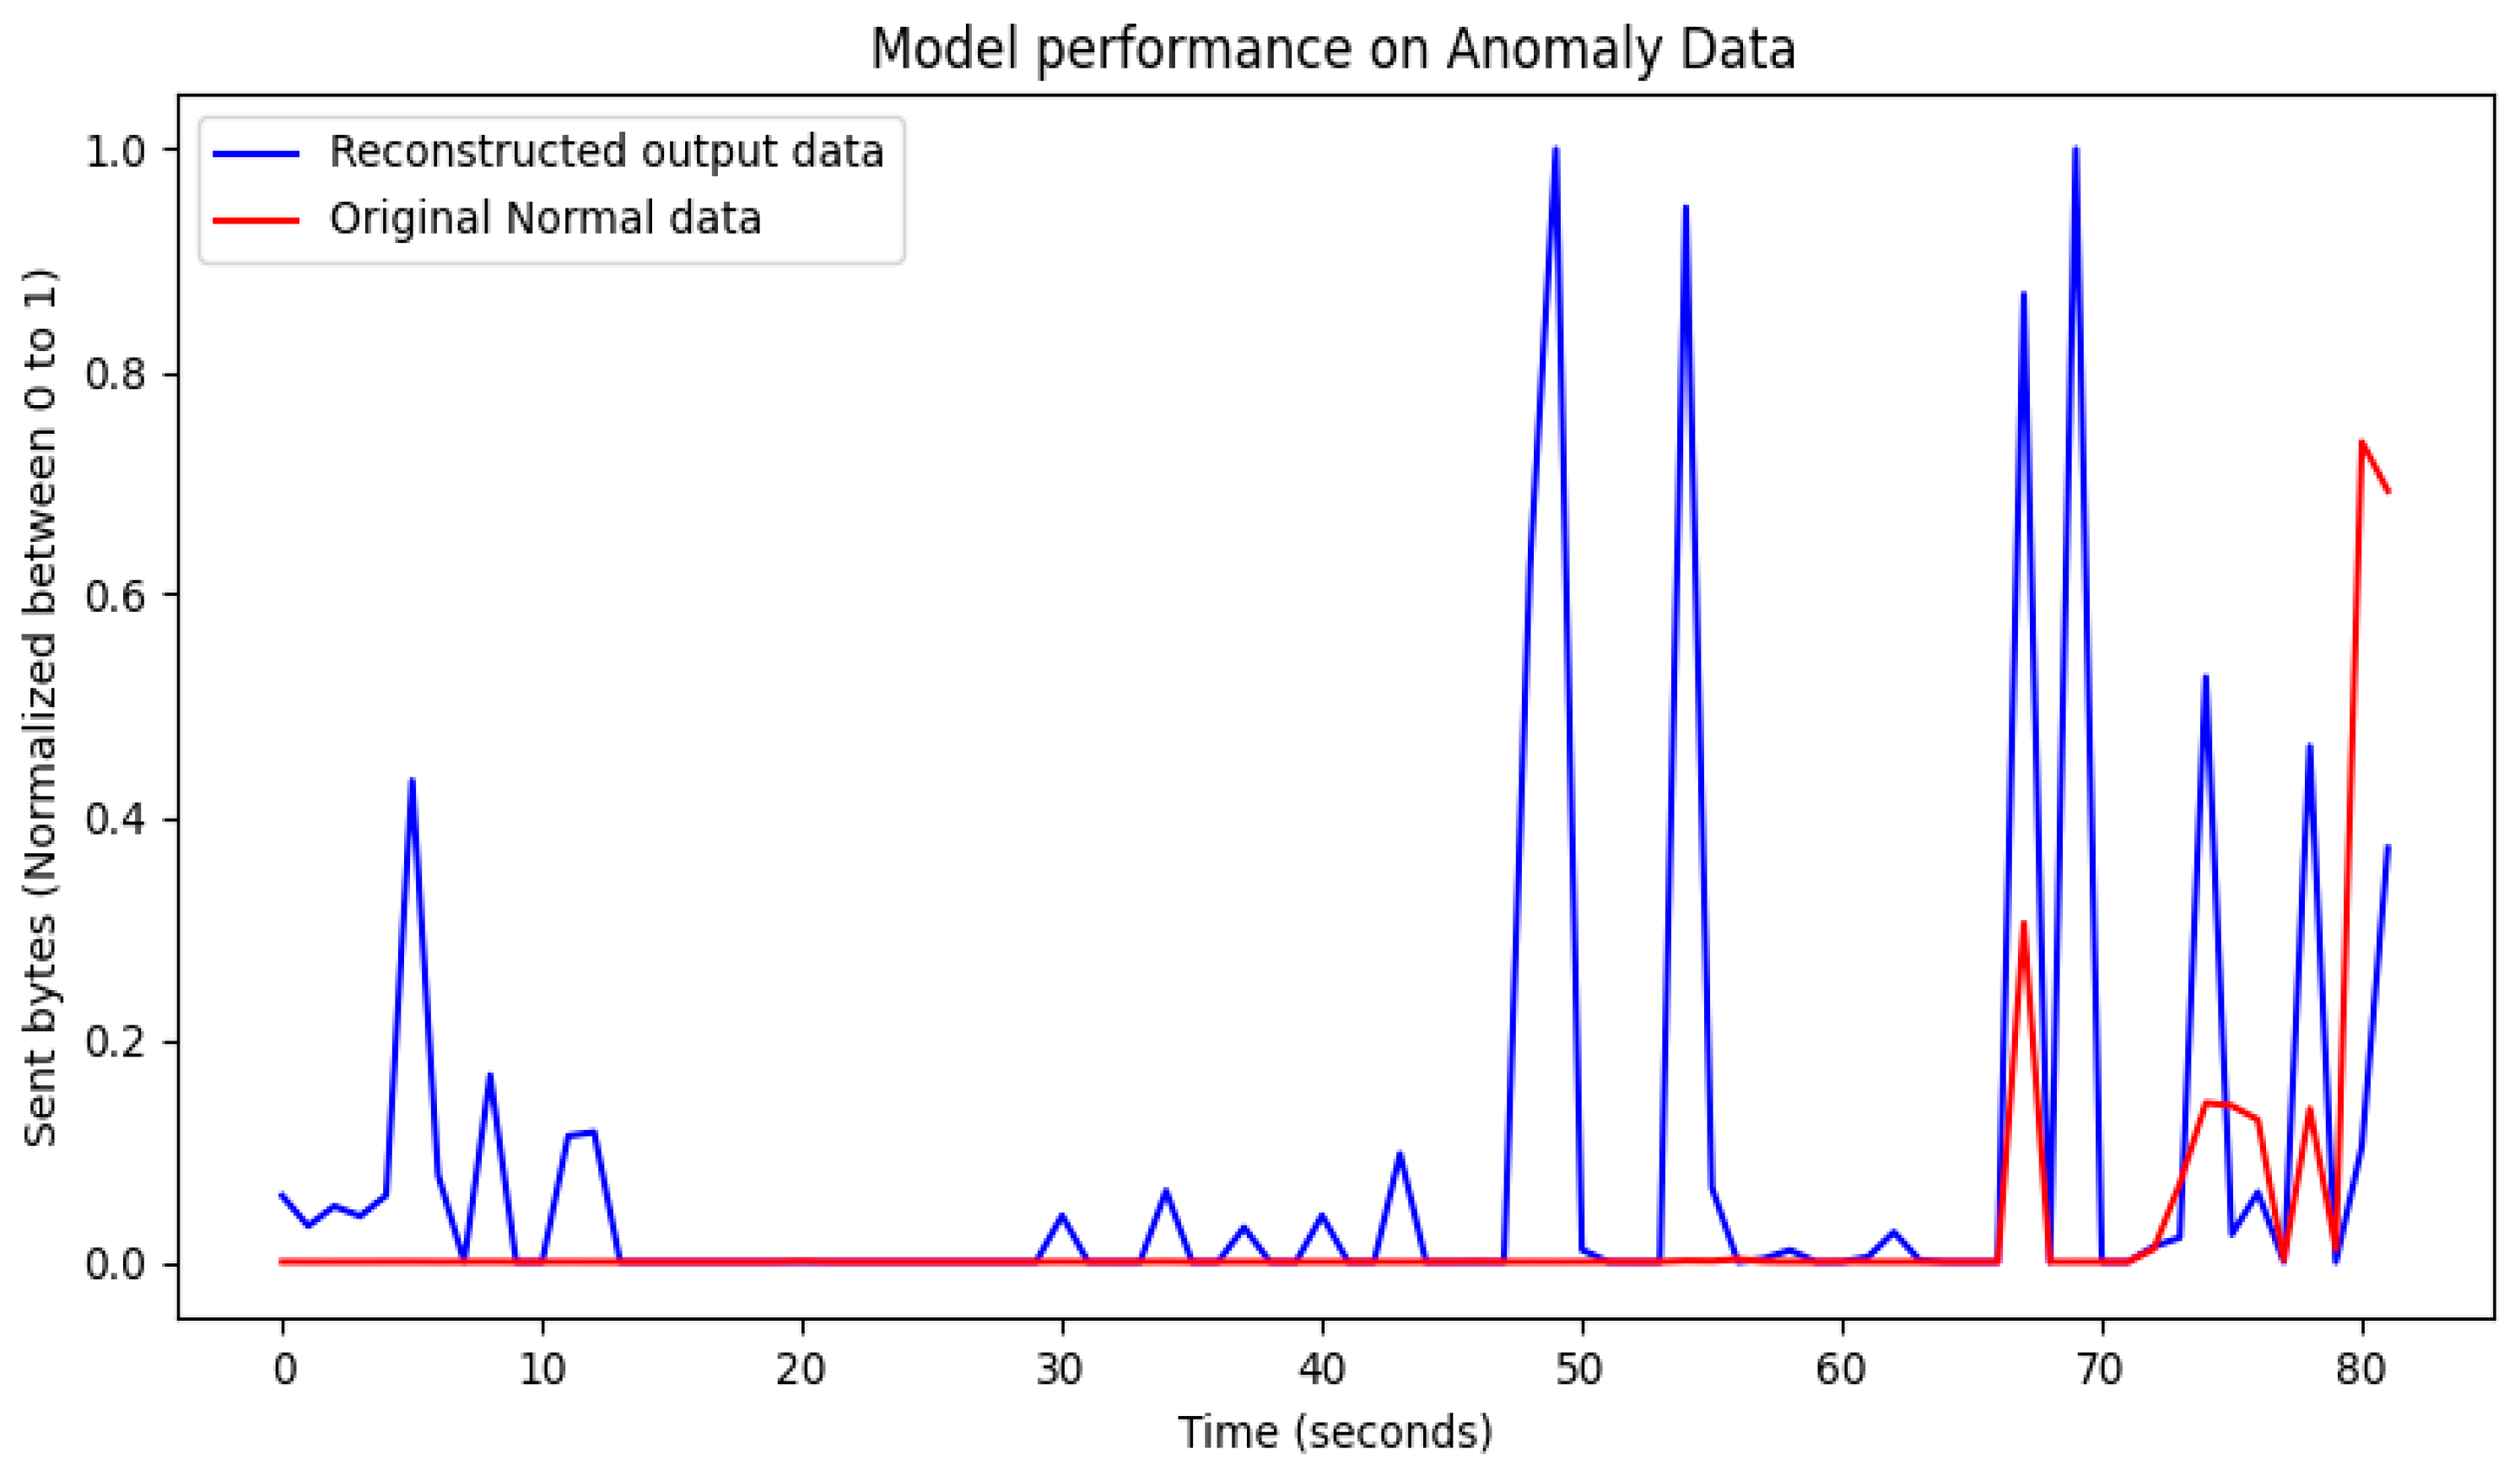
During testing, both normal training data and anomalous data have been passed through the test network presented in Figure 1. The model projected a low reconstruction error for the normal pattern and high for the anomalous pattern. In Figure 8 and Figure 9 for normal and anomaly data, a graph is plotted for presenting relationship among the input data feature parameter of resource consumption which represents sent bytes (sent_bytes feature in Table 2) and time, respectively. According to what is presented in Figure 8 and Figure 9, the proposed model has gained the capability to recognize user characteristics when the corresponding user data are inputted. In Figure 9, it can be seen that the model cannot reconstruct the input data of the same attribute, because the characteristics of that attribute do not match with what the model learned during training.
Therefore, Figure 8 represents the model being capable of reconstructing the normal data for the sent bytes (sent_bytes) attribute, when real-time data are sent through the network. This is because the sent data match the original (normalized) data in the analyzed model, which confirms that the proposed model learned the characteristics of the user with the associated parameters. Even though the model is trained well, the deciding factor is the threshold value, because the threshold always helps in defining a normal use case. Unlike other approaches such as those presented in [19], in the proposed approach, the threshold is calculated differently. For calculating the threshold, the reconstruction errors were collected for all attributes, by passing the normal data into the network, and the calculated minimum MSE and maximum MSE of passed data defined the thresholds. Therefore, the proposed model has been successfully trained with the normal data.

3.7. Anomaly Detection

The last execution phase of the proposed solution is anomaly detection (Figure 2). Based on the anomaly detection phase, it is necessary to identify whether the state of the monitored system indicates a security threat or not. Generally, it is not reliable to indicate that the user or organization entity is compromised based on one or two user or network entity activities. Therefore, in the proposed solution, multiple actions have been analyzed to have a reliable confirmation of the security threat attack. The organization needs to flag a user or entity as compromised and to report whether the threat exists or not. To achieve this, the proposed model uses different features presented in Table 2, which are continuously monitored and collected for appropriate analyses using an ANN model, trained on data that characterize normal user or entity behavior.

4. Performance Results of Threat Intrusion Monitoring

4.1. Visualization of Model Training Results

A graph-based real-time monitoring system is developed that utilizes graph databases and graph processing frameworks for representing and analyzing the collected data in a graphical format. The collected data are presented to the security and incident response team through a developed graph processing framework (Figure 1). This approach leverages the power of graph structures to model relationships between data entities, enabling efficient and flexible monitoring capabilities. The graph-based real-time monitoring system involves graph data representation, real-time data ingestion, autoencoder architecture, training, and real-time anomaly detection.
The system represents the monitored data in the form of a graph, where nodes represent entities, and edges represent relationships between them. Each node can contain attributes or properties that store relevant data. The system continuously ingests data from various sources, such as sensors, logs, events, or databases (Figure 3). As new data arrive, they are transformed into graph elements and added to the graph database.
The proposed anomaly detection system reconstructs the input data by compressing data into a lower-dimensional representation in the encoder and then reconstructs it in the decoder (Figure 6). The encoder–decoder architecture is trained using unsupervised learning techniques, as described in Section 3.5, on a large amount of data obtained from the analyzed entities (Table 2) of the monitored systems (Figure 3). This process allows the autoencoder to learn the underlying patterns and relationships within the data. Once the autoencoder is trained, it reconstructs new data samples in real time.
Anomalies from normal patterns can be detected by comparing the reconstructed data with the original input. Significant differences in data patterns indicate the presence of anomalies or anomaly behavior. When an anomaly is detected, the system generates alerts or notifications indicating anomaly conditions in the monitored system. The alerts can be based on predefined thresholds set via adaptive anomaly detection techniques. The autoencoder is tuned periodically to adapt to changing data patterns or to incorporate the new normal behavior of users as a benchmark for threat detection. This ensures that the monitoring system remains effective and responsive over time. A graph-based real-time monitoring system was developed using basic Python libraries and deployed in the cloud (Figure 1). Data are transferred continuously to have updated real-time data. The time units are adjusted according to the buffer size available for display.
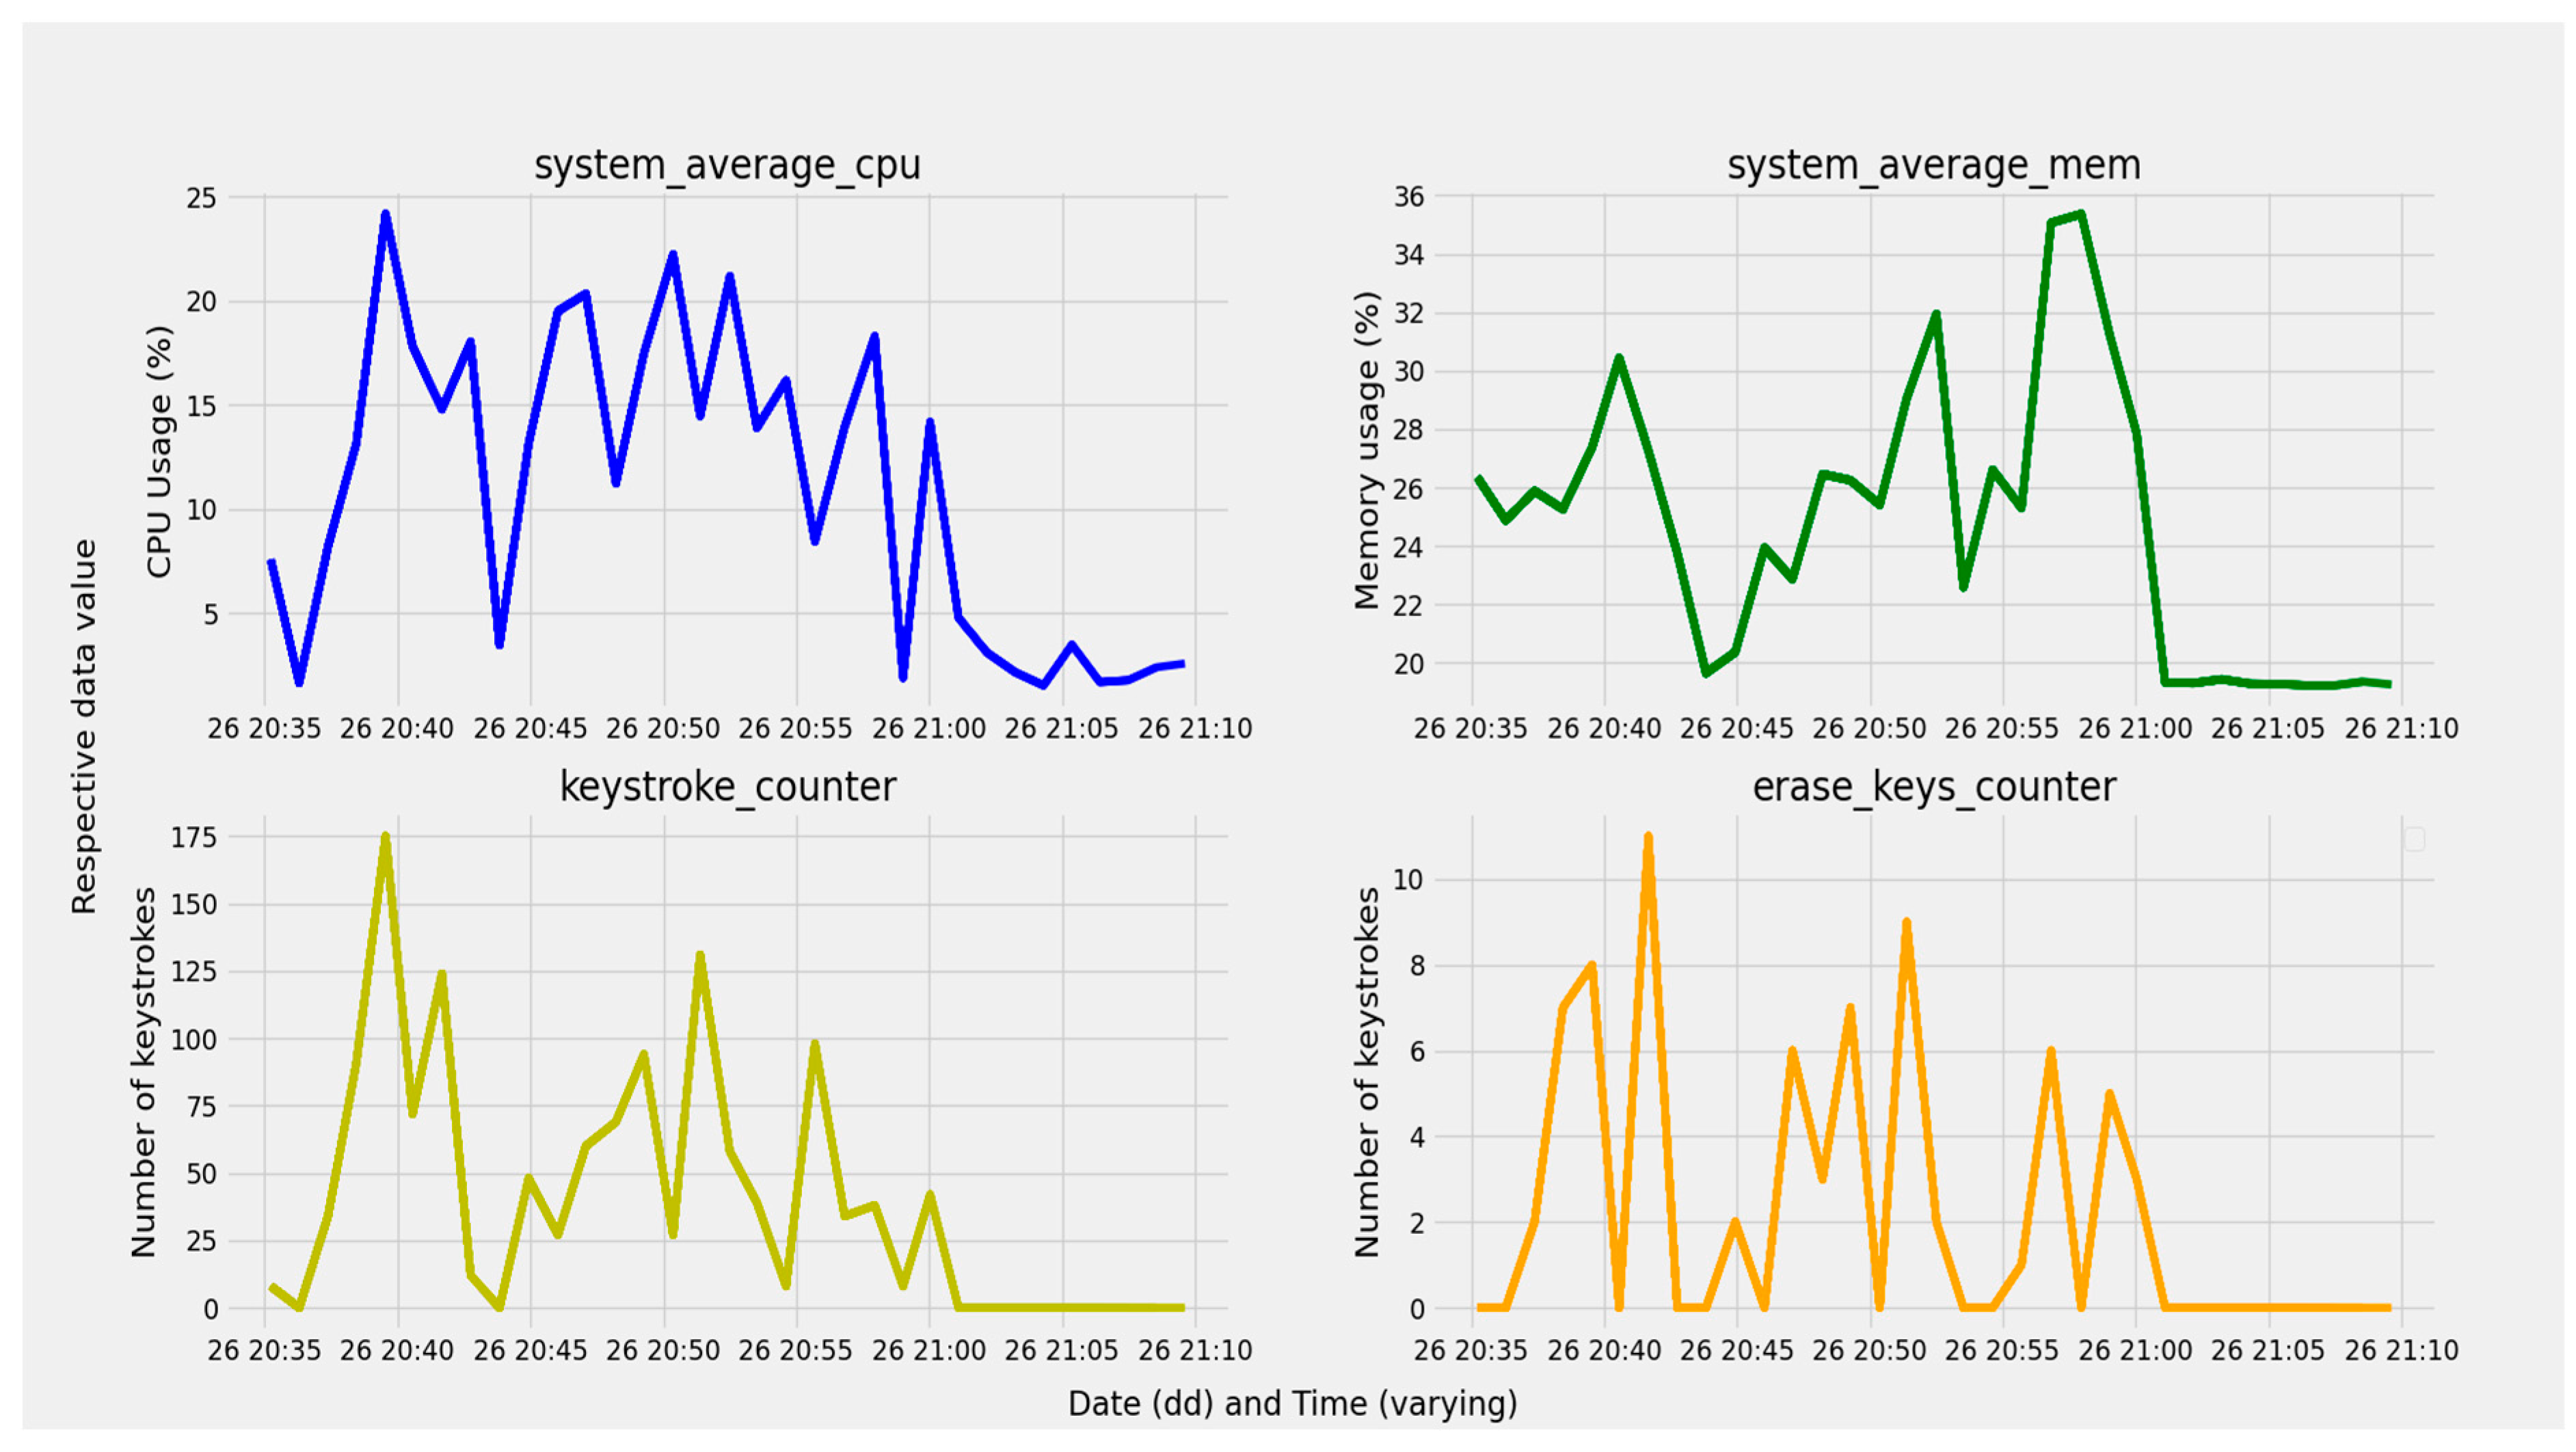
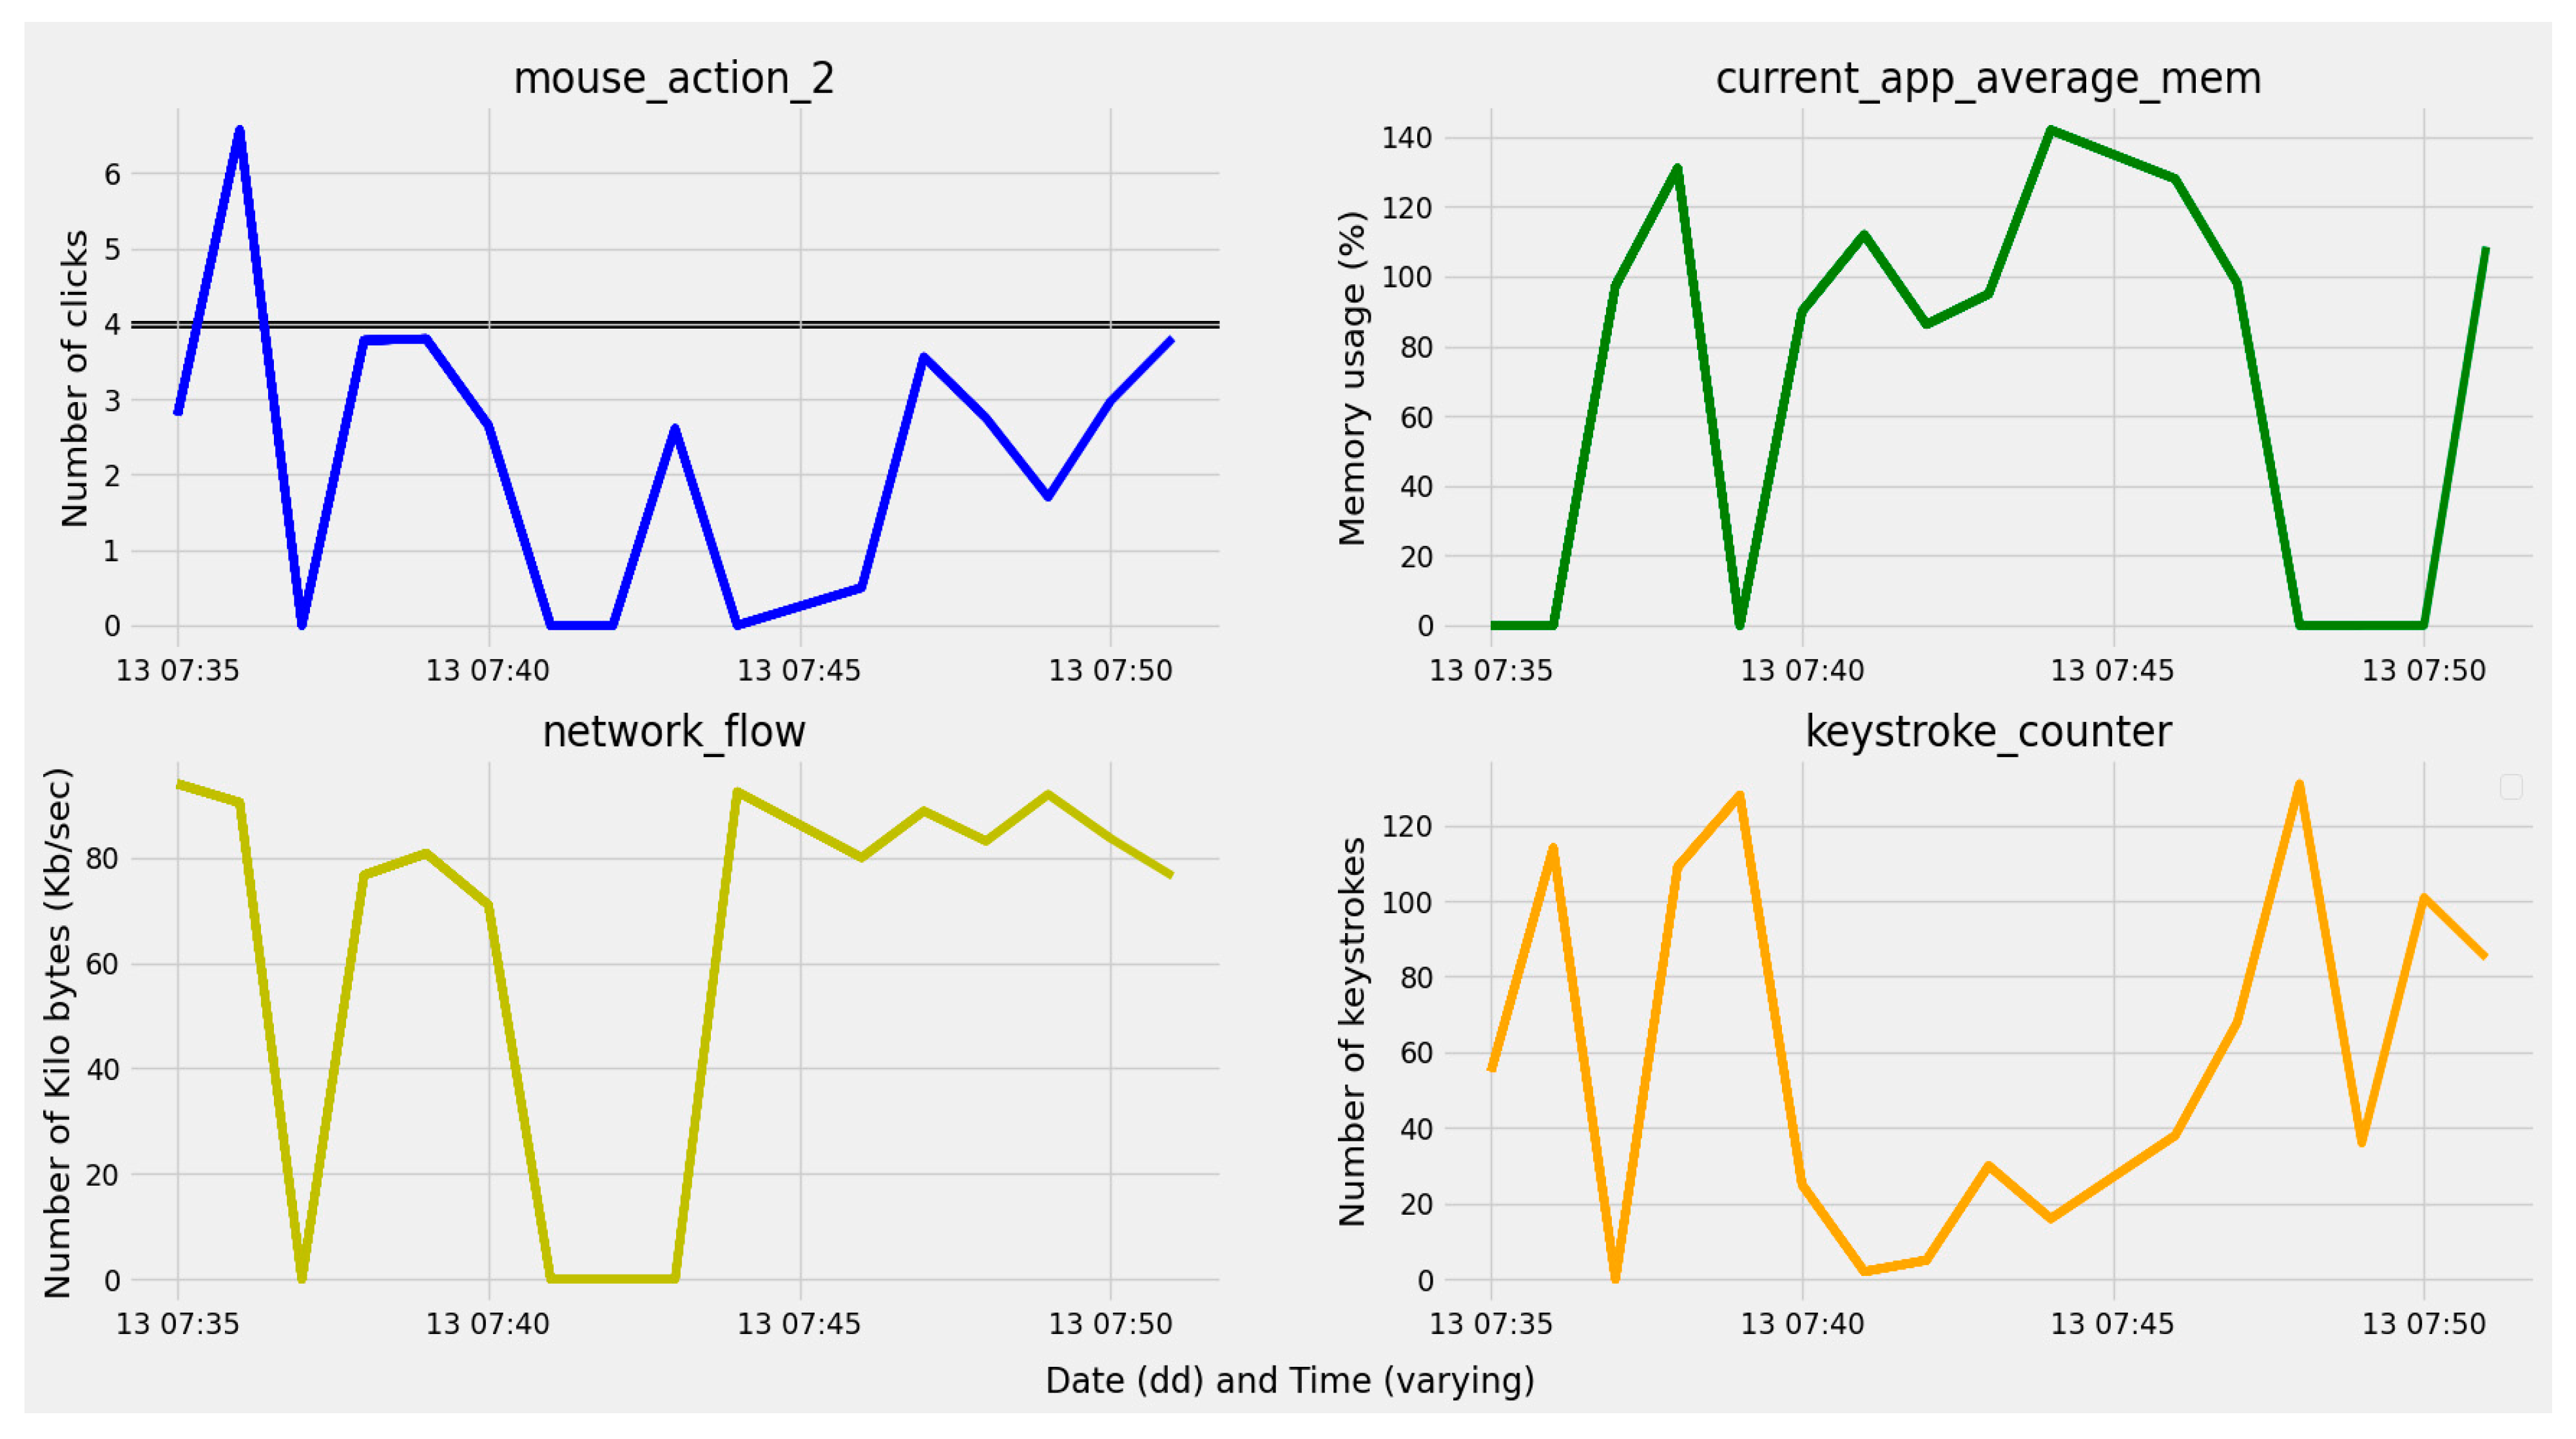
Examples of the monitoring of some feature parameters by the developed system are illustrated in Figure 10. The results have been presented for four different system features, which include the average system memory (presented as system_average_memory in Table 2) and CPU usage (presented as system_average_CPU in Table 2), the counter of key strokes (presented as keystroke_counter in Table 2), and the erased key pressure counter (presented as erase_keys_counter in Table 2) during the 26 days of analyses for a one hour period (20:30–21:30). By combining the graph-based representation of data with an autoencoder, the proposed anomaly detection monitoring concept provides a powerful and flexible solution for real-time monitoring and anomaly detection in complex systems.

4.2. Evaluation of Model Training Results

The metrics used for evaluating the proposed model are accuracy, precision, and recall. The calculation of these metrics is given in Equations (5), (6), and (7), respectively. Accuracy (α) is the ratio of true predictions made by the model to the total predictions made by the model. It is expressed as
α = T P + T N T P + T N + F P + F N × 100 %
where TP represents the true positive rate (TPR), TN represents the true negative rate (TNR), FP represents the false positive rate (FPR), and FN represents the false negative rate (FNR) of detected security threats. The TPR is the probability that an actual positive threat will be tested as a positive threat, and the TNR is the probability that an actual negative threat will be tested as a negative threat.
Also, the FPR is the probability of incorrectly indicating the presence of a security threat when the threat is not actually present, while the FNR is the probability of incorrectly indicating the absence of a security threat when it is actually present.
Precision (P) is the ratio of true positive predictions to the total positive predictions. It is expressed as
P = T P T P + F P × 100 %
Recall (R) is the ratio of true positive predictions to the total samples that are positive. It is expressed as
R = T P T P + F N × 100 %
In the next section, the results of the proposed threat detection system are analyzed with respect to these three metrics expressed through Equations (5)–(7).

4.3. Performance Results

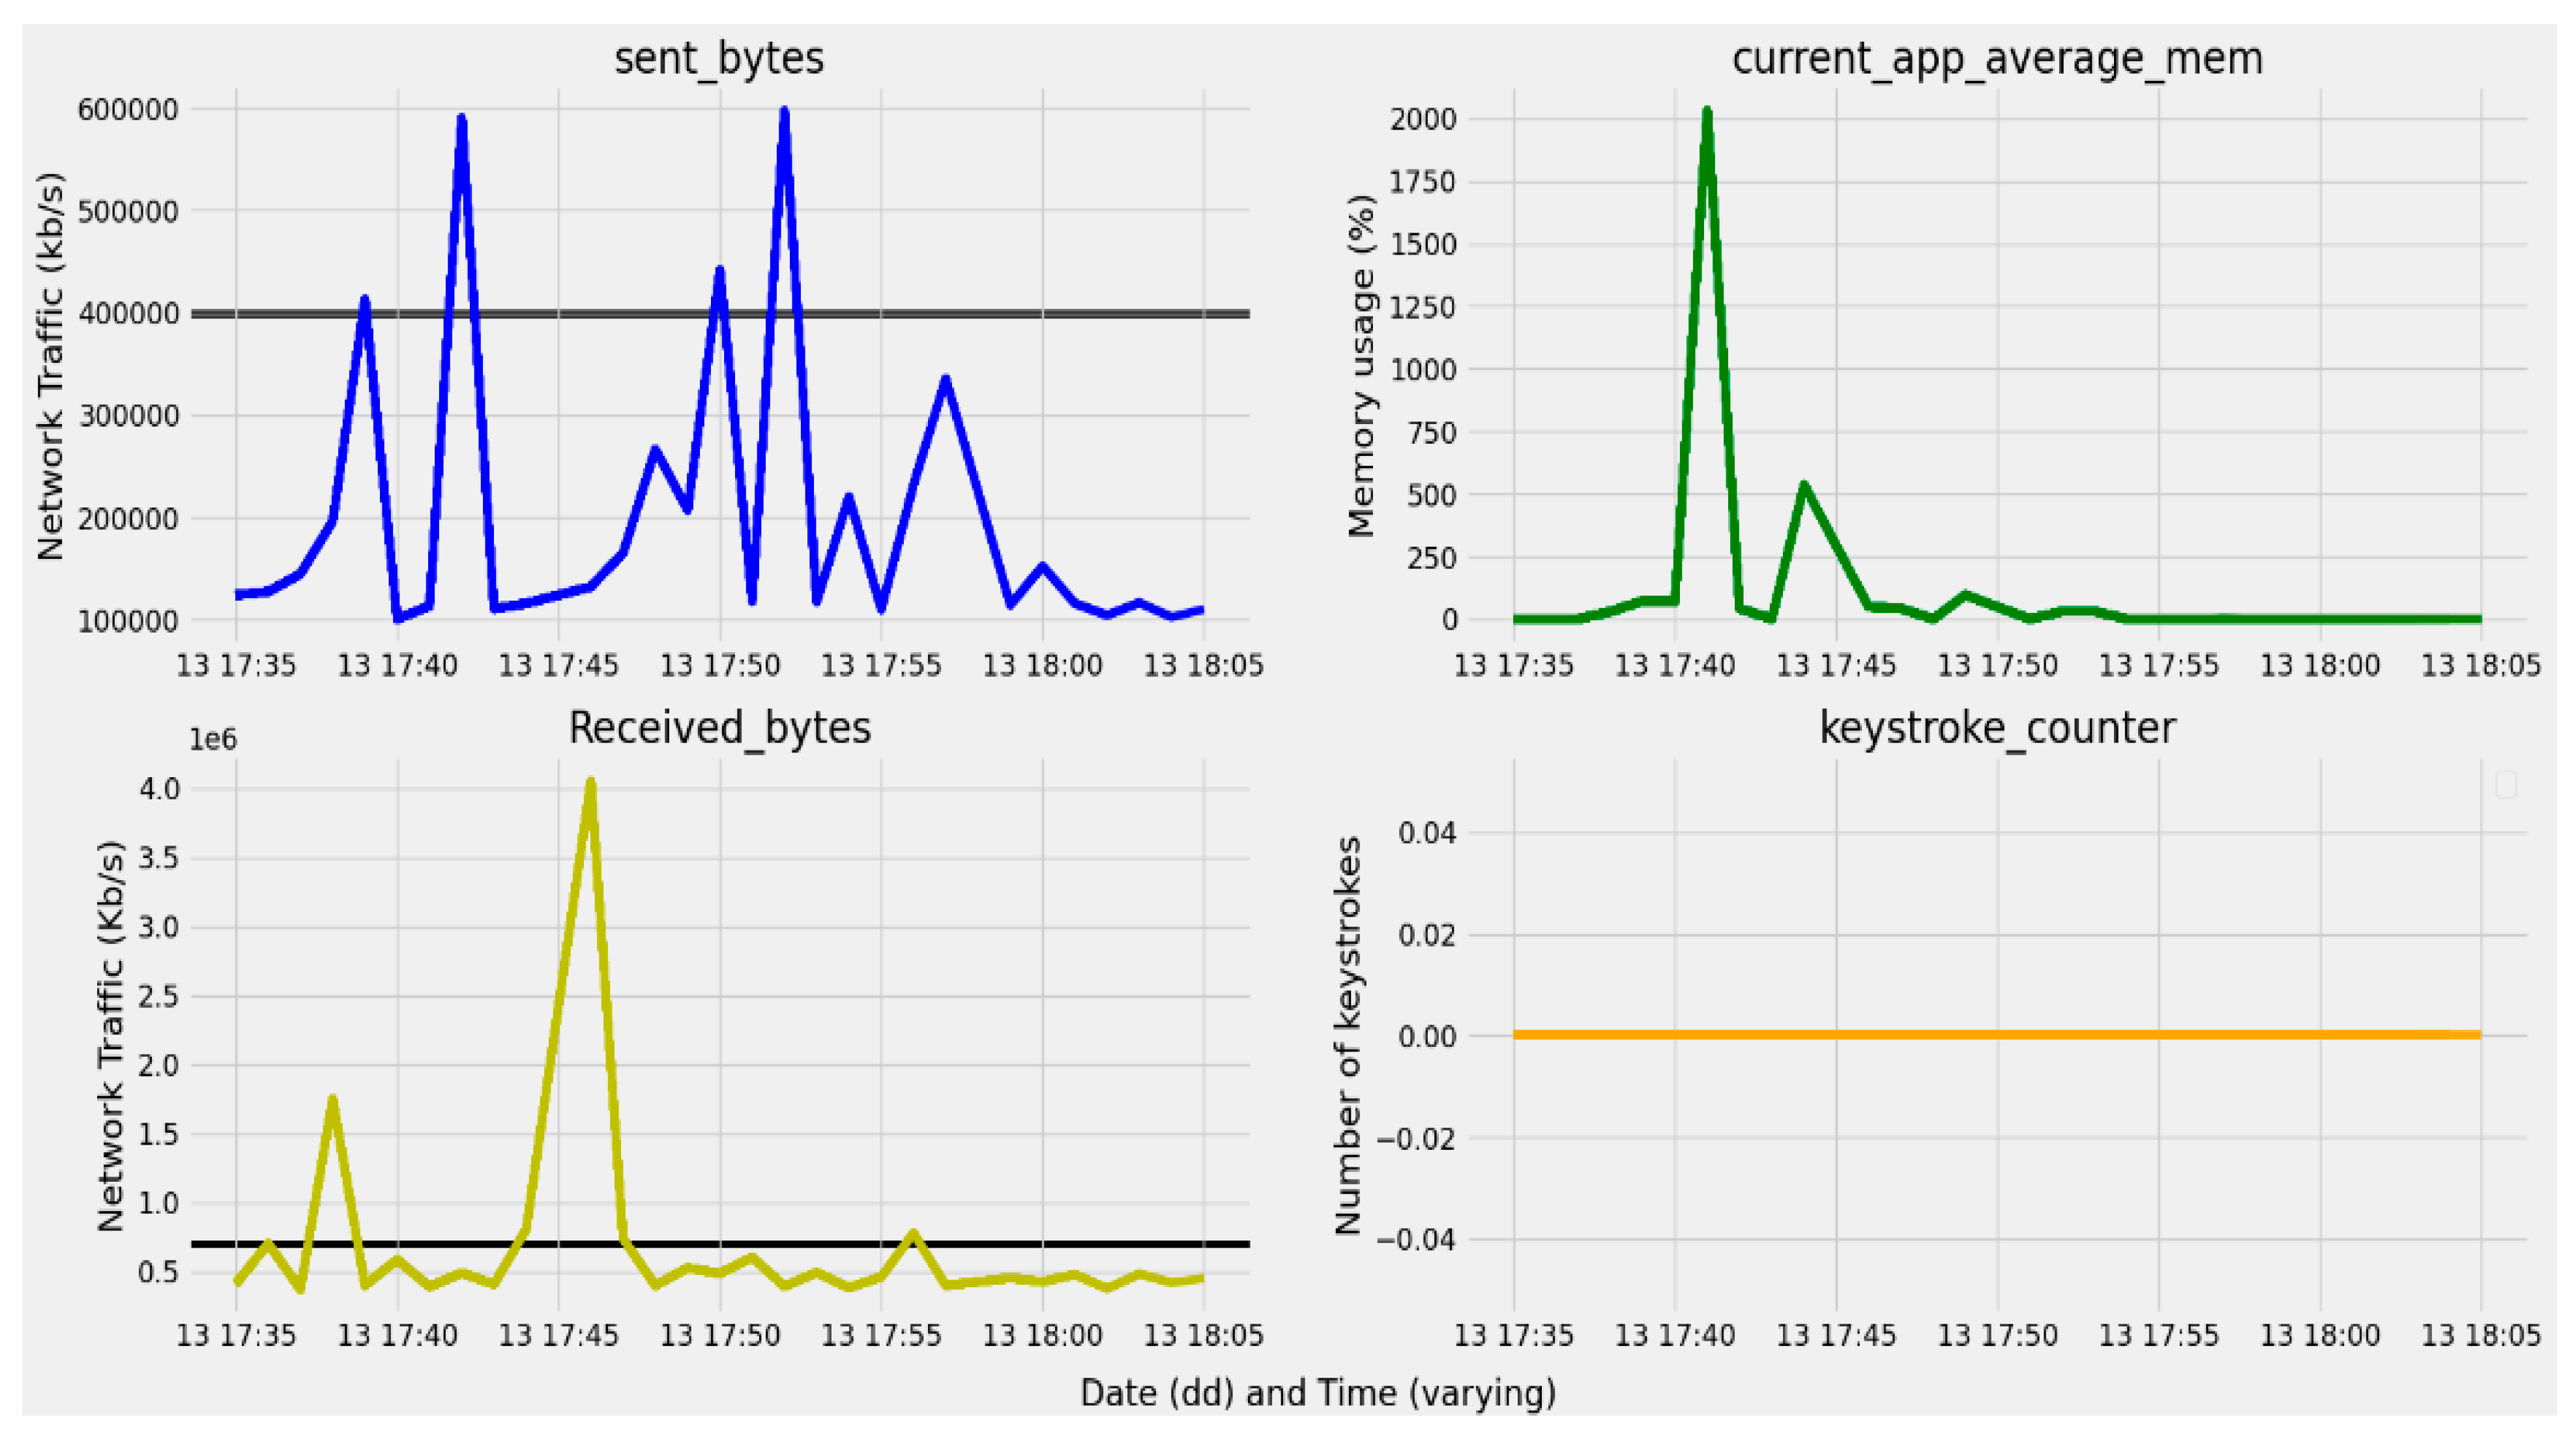
The model is deployed and tested on two operating scenarios. The first operating scenario is tested during working hours, i.e., 9:00 a.m. to 5:00 p.m. In this operating scenario, three users have different usage of network and system resources, generating data traffic on their devices in a way that simulates normal user activity. Out of the three users, one user is nonlegitimate. The nonlegitimate user deals with tasks that require significant internet usage. The consequence of this is presented as an example in Figure 11, in which it can be seen that the network usage is above the threshold (set to 400,000 kbit/s), which leads to the deviation in resource consumption and immediate alert of a security threat. The threshold value is not constant, and it is updated frequently according to the timings, user behavior, etc.
The second operating scenario is performed for an already logged-in device. A Trojan security threat is set to automate the execution of scripts for accessing files using mouse and keyboard activities. The motive behind this security threat is to access the files that need to be opened by mouse clicks on the attacked files. Figure 12 shows the excessive mouse activity (related to the double-click above the threshold (set to 4) performed repeatedly to open the files), and the files were exfiltrated through the network. This also leads to the deviation in resource consumption and an immediate alert of security threats. These actions were taken during nonworking hours, and hence, the alerts were sent under the nonworking hours category (Figure 12).
The results obtained for the analyzed metrics are shown in Figure 13. The dataset contains an imbalanced number of samples, equal to 99.9% of normal samples. Therefore, the model is successfully trained and validated for normal instances. According to the obtained results, the proposed model has high accuracy (α) equal to 94.3%, high recall (TPR) equal to 90%, high precision (P) equal to 89.1%, and high TNR equal to 88%. A low FPR equal to 11.1% is a consequence of the low number of wrong decisions regarding a possible threat occurrence (Figure 13). The FPR represents how many legit instances the model predicts as an anomaly. In the case of the proposed model, the number is small, because the model is trained well, and it is able to reconstruct the normal data. However, as the number of anomalous samples increased in the dataset, the probability of an increasing FPR is high, and the recall (TPR) becomes lower, because the model works best for the single-characteristic type of data. Autoencoders learn all the characteristics of the available data (might contain both positive and negative instances) but work well only if there are more single-characteristic data.
The obtained results are also compared with other well-known threat detection approaches, which are performed by employing an LSTM autoencoder, multiclass SVM, and MLP classifier. The results of the comparison are presented in Table 3, and they indicate that the proposed model based on the ANN autoencoder outperforms other models in terms of accuracy, while also preserving high recall and precision scores. This is a consequence of the autoencoder’s increase in performance efficiency when compared with the other approaches, which is contributed to by an appropriate security feature selection, usage of unique data, etc.
It is worth further emphasizing that although there are large datasets that can be used to conduct cyber security intrusion detection research, the motive of this paper is to show how a large number of different locally collected features can point to a real cyber security attack. An attacker never proceeds blindly without a proper attack plan, which starts from reconnaissance, i.e., information gathering, discovering attack vectors, etc., and exploiting the obtained information with the goal of achieving a successful exfiltration of data. Therefore, detecting the attacker’s activity becomes more and more complex as the attacker passes through each phase of the attack. Since it is common that sensitive data are accessible to highly privileged users only, an attack that escalates to the level at which an attacker can access sensitive data represents a large cyber security compromission of the organization. This points to the priority of detecting unusual activity at the initial stages of the attack, and the model proposed in this paper is primarily developed to achieve this goal.
Although there are insider cyber security threat detection approaches with even greater accuracy than the approach proposed in this paper, these approaches are tested with publicly available datasets, and few of them contain locally collected anomaly data in the process of model training on collected data. This paper completely deals with the real locally generated data from a large number of different sources and without the usage of anomaly data in the phase of training the model on collected data. The anomaly data were not used in the phase of model training, since the proposed model is based on the unsupervised learning approach. In comparison to the similar approaches presented in Table 3, the obtained results verify the practical applicability with high accuracy, which is one of the most important parameters related to insider security threat detection.

5. Discussion

5.1. Impact of Tuning Parameters on Threat Detection

The model performance is influenced by different parameters such as loss functions, optimizer type, batch size, and the number of epochs used in the analyses. The proposed model shows variations when these parameters are tuned. A loss function calculates the difference between the predicted and original output, and the optimizer tries to reduce the difference. The results of the comparison of different combinations of these parameters were further presented.

5.1.1. The Impact of the Combination of the Loss Function and Optimizer Type

The four combinations of the impact of loss functions and optimizer types on model performance were analyzed. In the analyses, the sent bytes (normalized with values in the range between 0 and 1) have been used as parameters for the reconstruction of anomaly and normal data patterns.
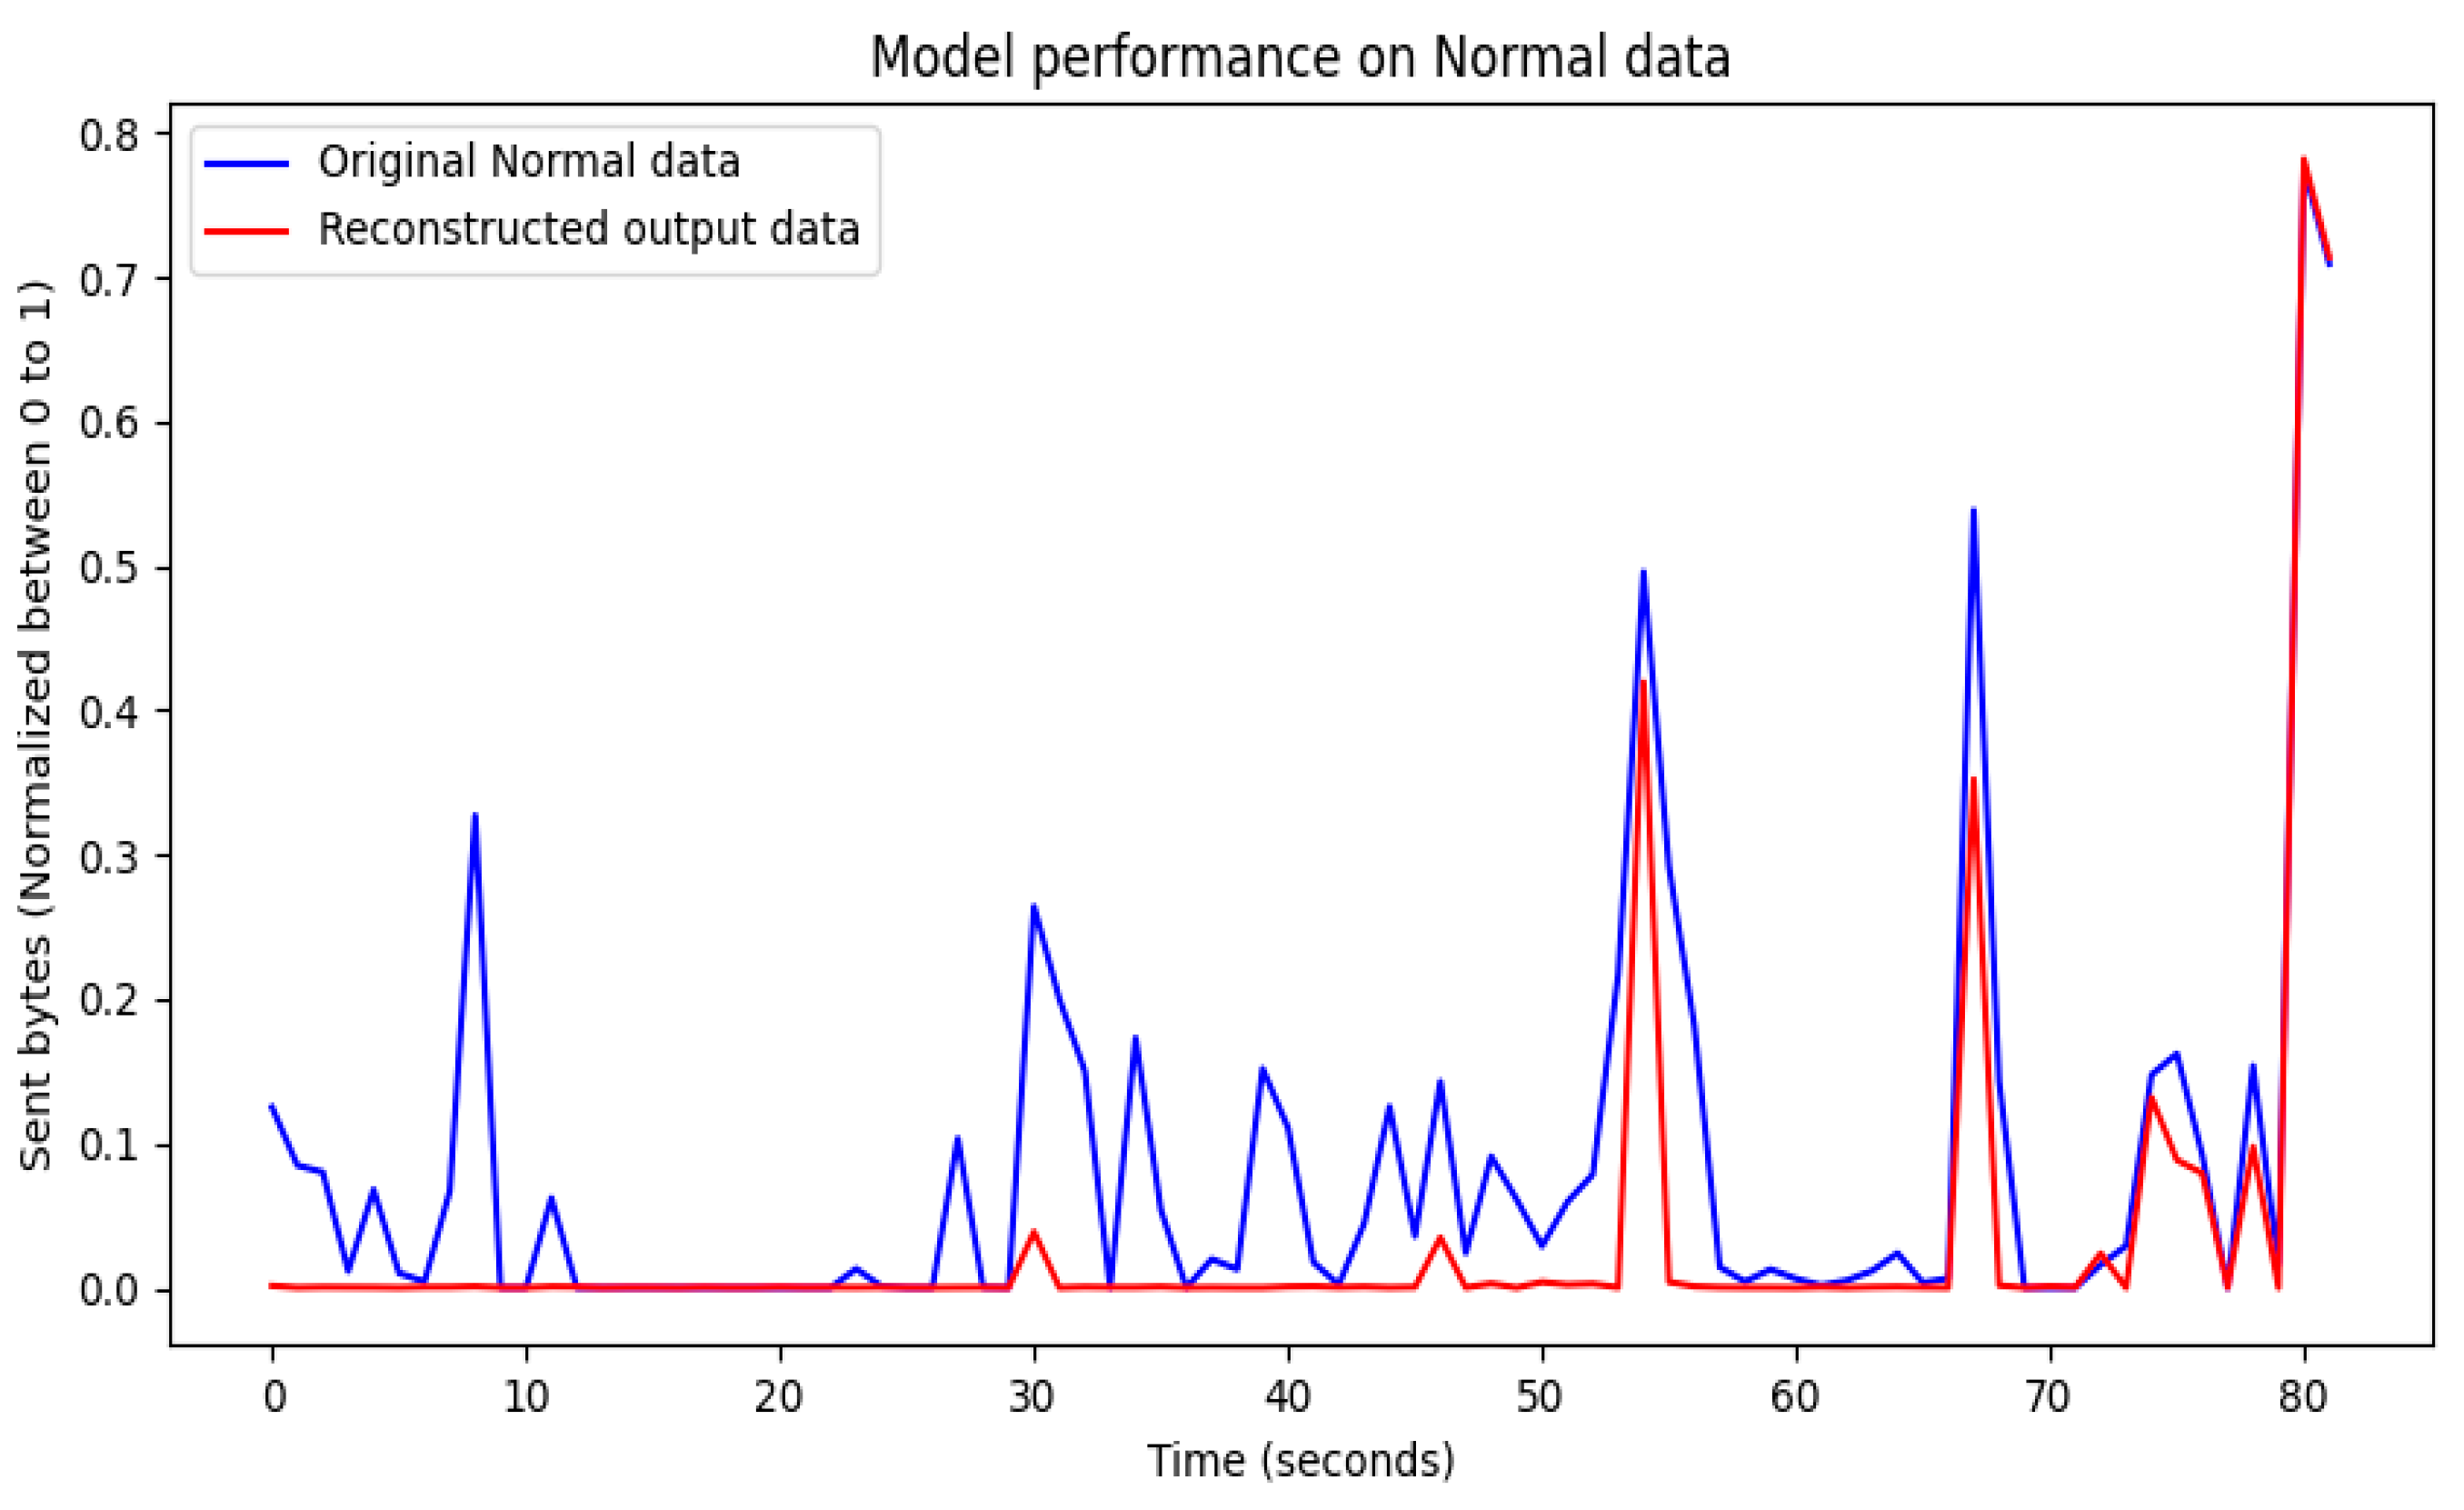
The first combination analyzed is the impact of the combination of using MSE (mean square error) as a loss function and the Adaptive Moment Estimation (ADAM) optimizer. The obtained results for the reconstruction of normal and anomaly data are presented in Figure 14 and Figure 15, respectively.
According to the presented results, it can be seen that the loss function and optimizer combination show good performance for both normal and anomaly data, since these analyzed parameters fit well.
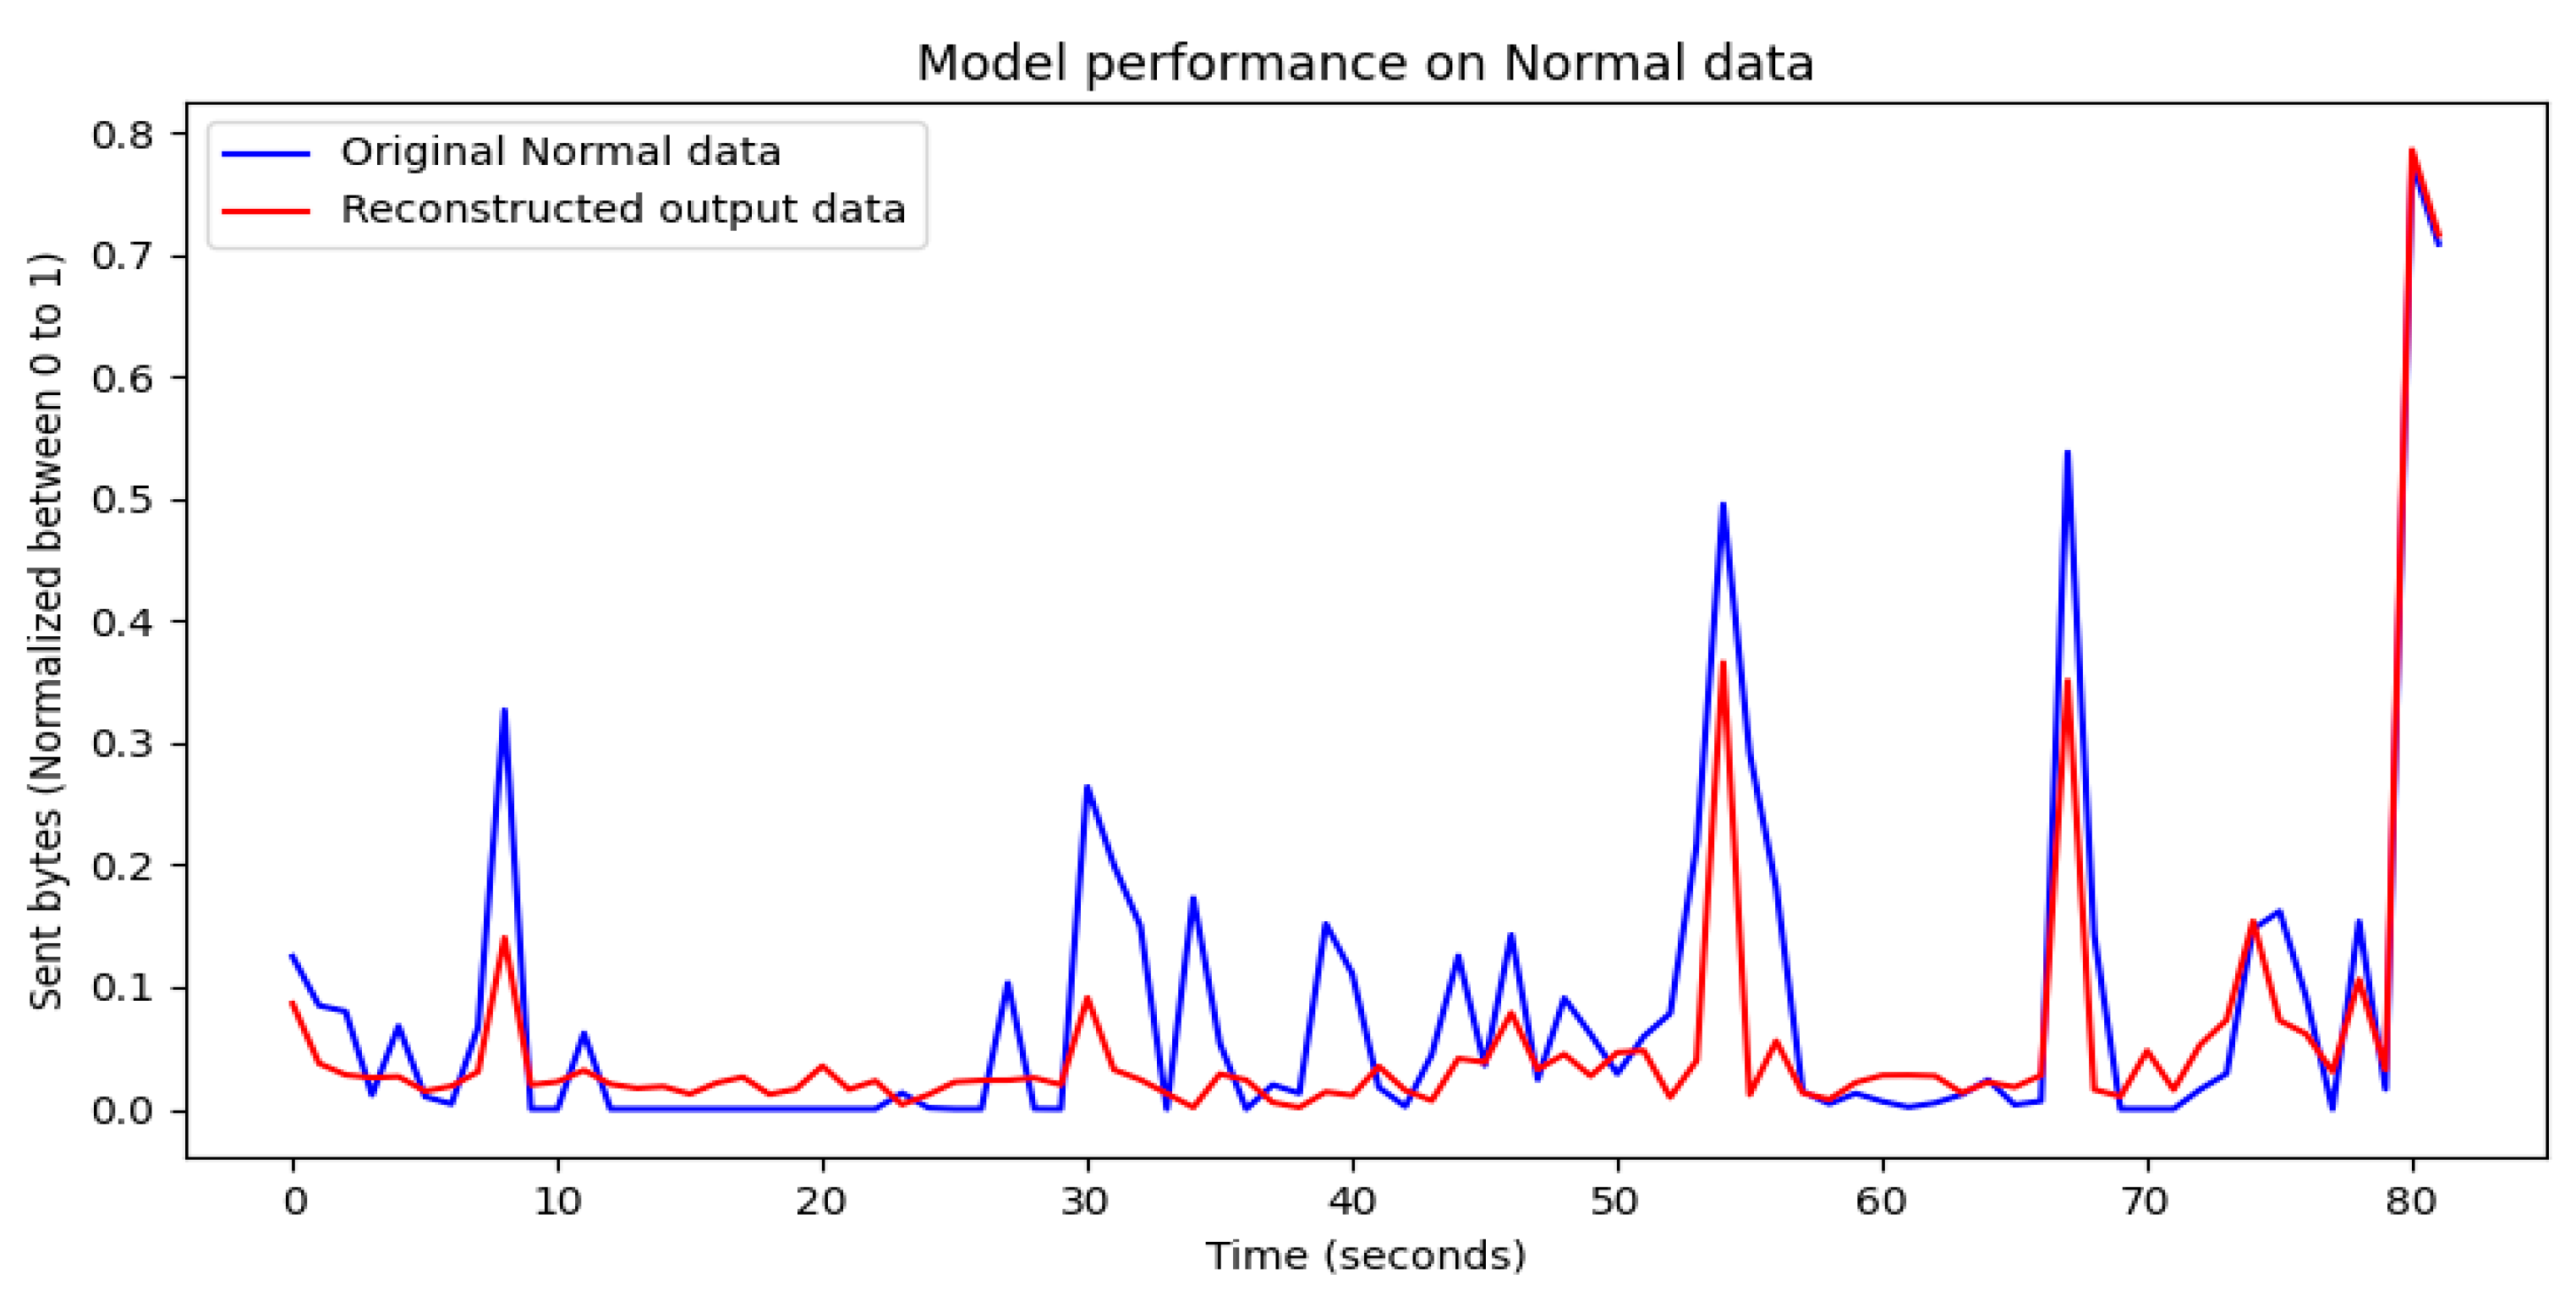
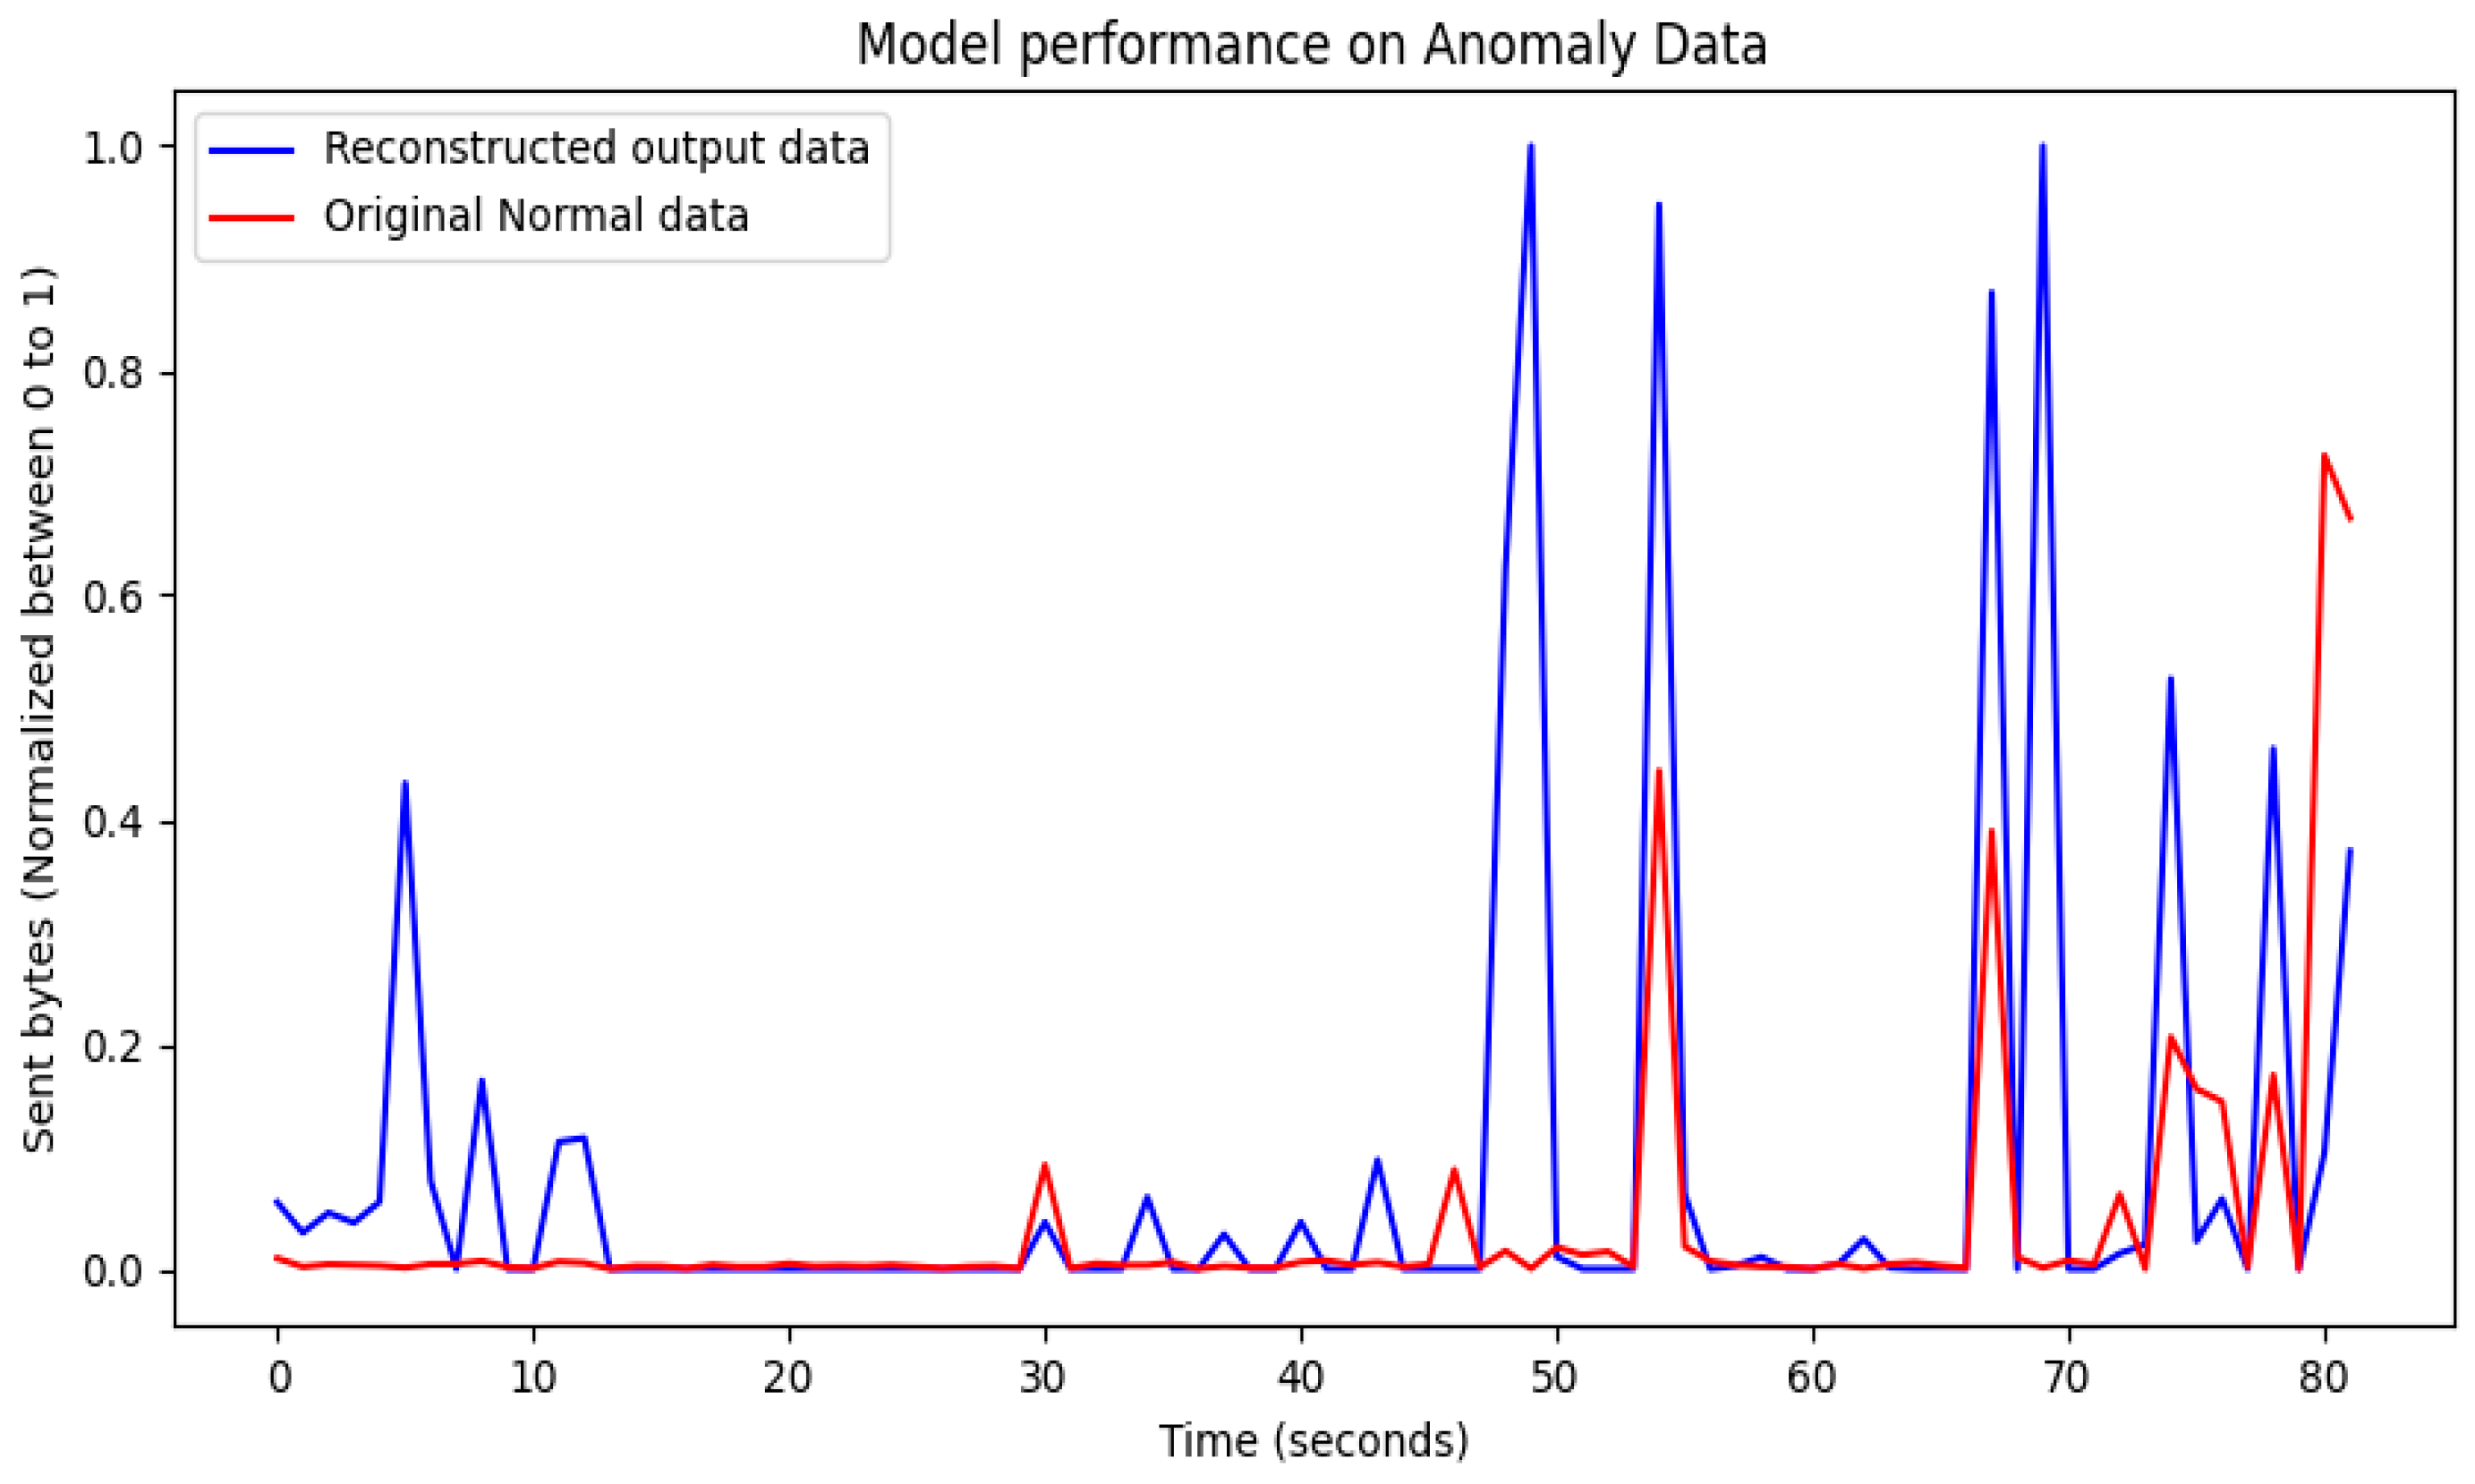
The second combination analyzed is the combination of using MSE (mean square error) as a loss function and the stochastic gradient descent (SGD) optimizer. The obtained results for the reconstruction of normal and anomaly data are presented in Figure 16 and Figure 17, respectively.
In comparison with the ADAM optimizer, for which results are presented in Figure 14 and Figure 15, it can be seen that the results presented in Figure 16 and Figure 17 show some instability in reconstructing the characteristics of the security threat pattern related to the sent bytes. In general, the SGD optimizer obtains more reliable results if the dataset used in the analyses is large. Since the analyzed case deals with more parameters rather than a large amount of data, it can be seen that such a combination struggled to reconstruct the normal data.
The third combination analyzed is the combination of using MAE (mean absolute error) as a loss function and the Adaptive Moment Estimation (ADAM) as an optimizer. The obtained results for the reconstruction of normal and anomaly data are presented in Figure 18 and Figure 19, respectively.
Based on the obtained results, it can be seen that the model’s performance with this combination of loss function and optimizer is satisfactory; however, the results for the MSE loss function presented in Figure 14 and Figure 15 show that the combination of the ADAM optimizer and MSE loss function is more efficient in terms of computation and more reliable.
Finally, the last combination analyzed is the combination of using MAE (mean absolute error) as a loss function and the stochastic gradient descent (SGD) as an optimizer. The obtained results for the reconstruction of normal and anomaly data are presented in Figure 20 and Figure 21, respectively.
This combination of loss function and optimizer leads to the worst results compared with the other tuning combinations, and the performance was especially poor in the case of reconstructing the normal data. This is due to the gradient being updated after every training sample rather than updating after every epoch. Also, the amount of data used in the analyses is also not large. All these factors make the optimization process unstable in the case of MAE as the loss function and ADAM as the optimizer.

5.1.2. Impact of Batch Size and Number of Epochs

Another analysis that is related to normal and anomaly data reconstruction accuracy is presented for the tuning parameters known as batch size and number of epochs. These parameters affect the training time of the ANN model used in the analyses. The batch size determines how many training samples should be trained in a single processing slot. The higher the batch size, the faster the training. However, during training with the higher batch size, the model might not learn the data characteristics properly. Therefore, choosing the optimal batch size leads to the best performance of the model.
Training the neural network with whole data for each single cycle creates an epoch, and increasing the number of epochs will make the model overfit instead of learning the characteristics of normal and anomaly data patterns. Therefore, increasing the number of epochs does not generalize the model to the new data. Choosing a low number of epochs makes the model underfit, i.e., training stops before learning the full characteristics of the data. The above-presented model used 200 epochs and 120 as its batch size. The selected number of epochs and batch size have been selected empirically after several different trials and have been found optimal for the specific proposed model. It is finally worth emphasizing that changing the number of epochs and batch size did not result in a large difference in the model prediction; however, it has a significant impact on the training time and loss.

6. Conclusions and Future Work

To mitigate the risks of internal cyberattacks, in this paper, a novel model for detecting insider cyber security threats using user and entity behavior analysis (UEBA) is presented. In the proposed approach, the user’s behavior and the system’s behavior are considered through a simultaneous collection of different user and system parameters that include mouse and keyboard dynamics, resource consumption, network traffic, file modifications, log-in/log-off access, and HTTP traffic. Such time-synchronized datasets, generated by logging all the events with custom Python scripts, serve as the input dataset for the UEBA. The unsupervised learning autoencoder and artificial neural network (ANN) are used to train the collected input dataset for the normal user and entity behavior. The MSE estimation is used as a loss function in the training phase. Each sample is fed to the network during the testing phase, and the reconstruction error is calculated, and if it is highly flagged, an anomaly in terms of security threat is indicated. The result of such model training is the capability of the system to recognize security threats on the imbalanced dataset through only a few anomaly samples and thus enable the detection of security breaches. The proposed model performed very well on testing data, which confirms its ability to reconstruct legitimate user data. The obtained results showed a high reconstruction error for anomaly data, and a comparison of the proposed model with similar existing models for inside threat detection shows better results for the proposed model in terms of accuracy, with almost equal results in terms of TPR, TFR, and TNR parameters.
For future work, the proposed model can be improved in terms of reducing computational time. Also, the other types of assets in an organization, like servers, can be considered by performing analyses for a scenario of a server attack with DDOS and multiple requests from different locations in the world. The analyses can describe the attack pattern at the starting stage, which can enable the securing of the organization’s assets without turning them down. Also, instead of generating features using scripts, the direct use of the logs is possible for building the features and implementing complex algorithms like generative adversarial networks (GANs), temporal generative adversarial networks (TGANs), etc.

Author Contributions

Conceptualization, K.S., S.T.R.M., S.D., R.M. and J.L.; literature review, K.S., S.T.R.M., S.D. and R.M.; investigation, K.S., S.T.R.M., S.D., R.M. and J.L.; writing—original draft preparation, K.S., S.T.R.M., S.D., R.M. and J.L.; writing—review and editing, K.S., S.T.R.M., S.D., R.M. and J.L.; supervision, R.M. and J.L., K.S. and J.L. are principal authors and contributed equally to this work. All authors have read and agreed to the published version of the manuscript.

Funding

This research received no external funding.

Data Availability Statement

Data are contained within the article.

Acknowledgments

The authors would like to thank S. V. Kota Reddy, Vice Chancellor, VIT-AP University, and M. Ramasamy, Principal, KPR Institute of Engineering and Technology, Coimbatore, Tamilnadu for the collaborative project and support. Also, the authors acknowledge and sincerely thank the Intelligent Systems Research Lab at the KPR Institute of Engineering and Technology for the successful project support.

Conflicts of Interest

The authors declare no conflict of interest.

References

  1. IBM. What Is a Zero-Day Exploit? Available online: https://www.ibm.com/topics/zero-day (accessed on 8 September 2023).
  2. BBC News. Russian Nuclear Scientists Arrested for ‘Bitcoin Mining Plot’. 9 February 2018. Available online: https://www.bbc.com/news/world-europe-43003740 (accessed on 8 June 2023).
  3. Ikeda, S. 250 Million Microsoft Customer Service Records Exposed; Exactly How Bad Was It? CPO Magazine. Available online: https://www.cpomagazine.com/cyber-security/250-million-microsoft-customer-service-records-exposed-exactly-how-bad-was-it/(accessed on 8 June 2023).
  4. Thompson, N.; Barrett, B. How Twitter Survived Its Biggest Hack—And Plans to Stop the Next One. WIRED, 20 September 2020. Available online: https://news.hitb.org/content/how-twitter-survived-its-biggest-hack-and-plans-stop-next-one(accessed on 8 June 2023).
  5. Petters, J. What Is SIEM? A Beginner’s Guide. 15 June 2020. Available online: https://www.varonis.com/blog/what-is-siem (accessed on 8 June 2023).
  6. Cassetto, O. What Is UBA, UEBA, & SIEM? Security Management Terms Defined. Exabeam, 13 July 2017. Available online: https://www.exabeam.com/siem/uba-ueba-siem-security-management-terms-defined-exabeam/(accessed on 8 June 2023).
  7. Rajasekaran, A.S.; Maria, A.; Rajagopal, M.; Lorincz, J. Blockchain Enabled Anonymous Privacy-Preserving Authentication Scheme for Internet of Health Things. Sensors 2022, 23, 240. [Google Scholar] [CrossRef] [PubMed]
  8. Warner, J. User Behavior Analytics (UBA/UEBA): The Key to Uncovering Insider and Unknown Security Threats. 9 May 2019. Available online: https://www.exabeam.com/ueba/user-behavior-analytics/#:~:text=Unknown%20Security%20Threats-,User%20Behavior%20Analytics%20(UBA%2FUEBA)%3A%20The%20Key%20to%20Uncovering,Insider%20and%20Unknown%20Security%20Threats&text=User%20Behavior%20Analytics%20was%20defined,detect%20anomalies%20and%20malicious%20behavior (accessed on 8 June 2023).
  9. What Is SIEM? Microsoft Security, Microsoft 2023. Available online: https://www.microsoft.com/en-us/security/business/security-101/what-is-siem (accessed on 23 October 2023).
  10. Shashanka, M.; Shen, M.-Y.; Wang, J. User and entity behavior analytics for enterprise security. In Proceedings of the 2016 IEEE International Conference on Big Data (Big Data), Washington, DC, USA, 5–8 December 2016. [Google Scholar] [CrossRef]
  11. Eberle, W.; Graves, J.; Holder, L. Insider Threat Detection Using a Graph-Based Approach. J. Appl. Secur. Res. 2010, 6, 32–81. [Google Scholar] [CrossRef]
  12. Gavai, G.; Sricharan, K.; Gunning, D.; Hanley, J.; Singhal, M.; Rolleston, R. Supervised and Unsupervised methods to detect Insider Threat from Enterprise Social and Online Activity Data. JoWUA 2015, 6, 47–63. [Google Scholar]
  13. Kim, J.; Park, M.; Kim, H.; Cho, S.; Kang, P. Insider Threat Detection Based on User Behavior Modeling and Anomaly Detection Algorithms. Appl. Sci. 2019, 9, 4018. [Google Scholar] [CrossRef]
  14. de Andrade, D.C. Recognizing Speech Commands Using Recurrent Neural Networks with Attention. Towards Data Science, 27 December 2018. Available online: https://towardsdatascience.com/recognizing-speech-commands-using-recurrent-neural-networks-with-attention-c2b2ba17c837(accessed on 16 June 2023).
  15. Lu, J.; Wong, R.K. Insider Threat Detection with Long Short-Term Memory. In Proceedings of the Australasian Computer Science Week Multiconference, New York, NY, USA, 29–31 January 2019; pp. 1–10. [Google Scholar] [CrossRef]
  16. Nasir, R.; Afzal, M.; Latif, R.; Iqbal, W. Behavioral Based Insider Threat Detection Using Deep Learning. IEEE Access 2021, 9, 143266–143274. [Google Scholar] [CrossRef]
  17. Veeramachaneni, K.; Arnaldo, I.; Korrapati, V.; Bassias, C.; Li, K. AI^2: Training a Big Data Machine to Defend. In Proceedings of the 2016 IEEE 2nd International Conference on Big Data Security on Cloud (Big Data Security), IEEE International Conference on High Performance and Smart Computing (HPSC), and IEEE International Conference on Intelligent Data and Security (IDS), New York, NY, USA, 9–10 April 2016; pp. 49–54. [Google Scholar] [CrossRef]
  18. Rashid, T.; Agrafiotis, I.; Nurse, J.R.C. A New Take on Detecting Insider Threats. In Proceedings of the 8th ACMCCS International Workshop on Managing Insider Security Threats, Vienna, Austria, 24–28 October 2016. [Google Scholar] [CrossRef]
  19. Sharma, B.; Pokharel, P.; Joshi, B. User Behavior Analytics for Anomaly Detection Using LSTM Autoencoder—Insider Threat Detection. In Proceedings of the 11th International Conference on Advances in Information Technology (IAIT2020), Bangkok, Thailand, 1–3 July 2020; pp. 1–9. [Google Scholar] [CrossRef]
  20. Killourhy, K.S.; Maxion, R.A. Comparing anomaly-detection algorithms for keystroke dynamics. In Proceedings of the 2009 IEEE/IFIP International Conference on Dependable Systems & Networks, Lisbon, Portugal, 29 June–2 July 2009; pp. 125–134. [Google Scholar] [CrossRef]
  21. Park, Y.; Molloy, I.M.; Chari, S.N.; Xu, Z.; Gates, C.; Li, N. Learning from Others: User Anomaly Detection Using Anomalous Samples from Other Users; Springer: Berlin/Heidelberg, Germany, 2015; pp. 396–414. [Google Scholar] [CrossRef]
  22. Wang, X.; Tan, Q.; Shi, J.; Su, S.; Wang, M. Insider Threat Detection Using Characterizing User Behavior. In Proceedings of the 2018 IEEE Third International Conference on Data Science in Cyberspace (DSC), Guangzhou, China, 18–21 June 2018; pp. 476–482. [Google Scholar] [CrossRef]
  23. Jawed, H.; Ziad, Z.; Khan, M.M.; Asrar, M. Anomaly detection through keystroke and tap dynamics implemented via machine learning algorithms. Turk. J. Electr. Eng. Comput. Sci. 2018, 26, 1698–1709. [Google Scholar] [CrossRef]
  24. Chen, Y.; Nyemba, S.; Malin, B. Detecting Anomalous Insiders in Collaborative Information Systems. IEEE Trans Dependable Secur. Comput. 2012, 9, 332–344. [Google Scholar] [CrossRef]
  25. Parveen, K.H.P.; Weger, Z.R.; Thuraisingham, B.; Khan, L. Supervised Learning for Insider Threat Detection Using Stream Mining. In Proceedings of the 2011 IEEE 23rd International Conference on Tools with Artificial Intelligence, Boca Raton, FL, USA, 7–9 November 2011. [Google Scholar]
  26. Pierini, A.; Trotta, G. Juicy-Potato. 2019. Available online: https://github.com/ohpe/juicy-potato (accessed on 23 June 2023).
  27. Thisisnzed. Anywhere. 2023. Available online: https://github.com/thisisnzed/Anywhere (accessed on 23 June 2023).
  28. Sánchez, P.M.S.; Valero, J.M.J.; Zago, M.; Celdrán, A.H.; Maimó, L.F.; Bernal, E.L.; Bernal, S.L.; Valverde, J.M.; Nespoli, P.; Galindo, J.P.; et al. BEHACOM—A dataset modelling users’ behaviour in computers. Data Brief 2020, 31, 105767. [Google Scholar] [CrossRef]
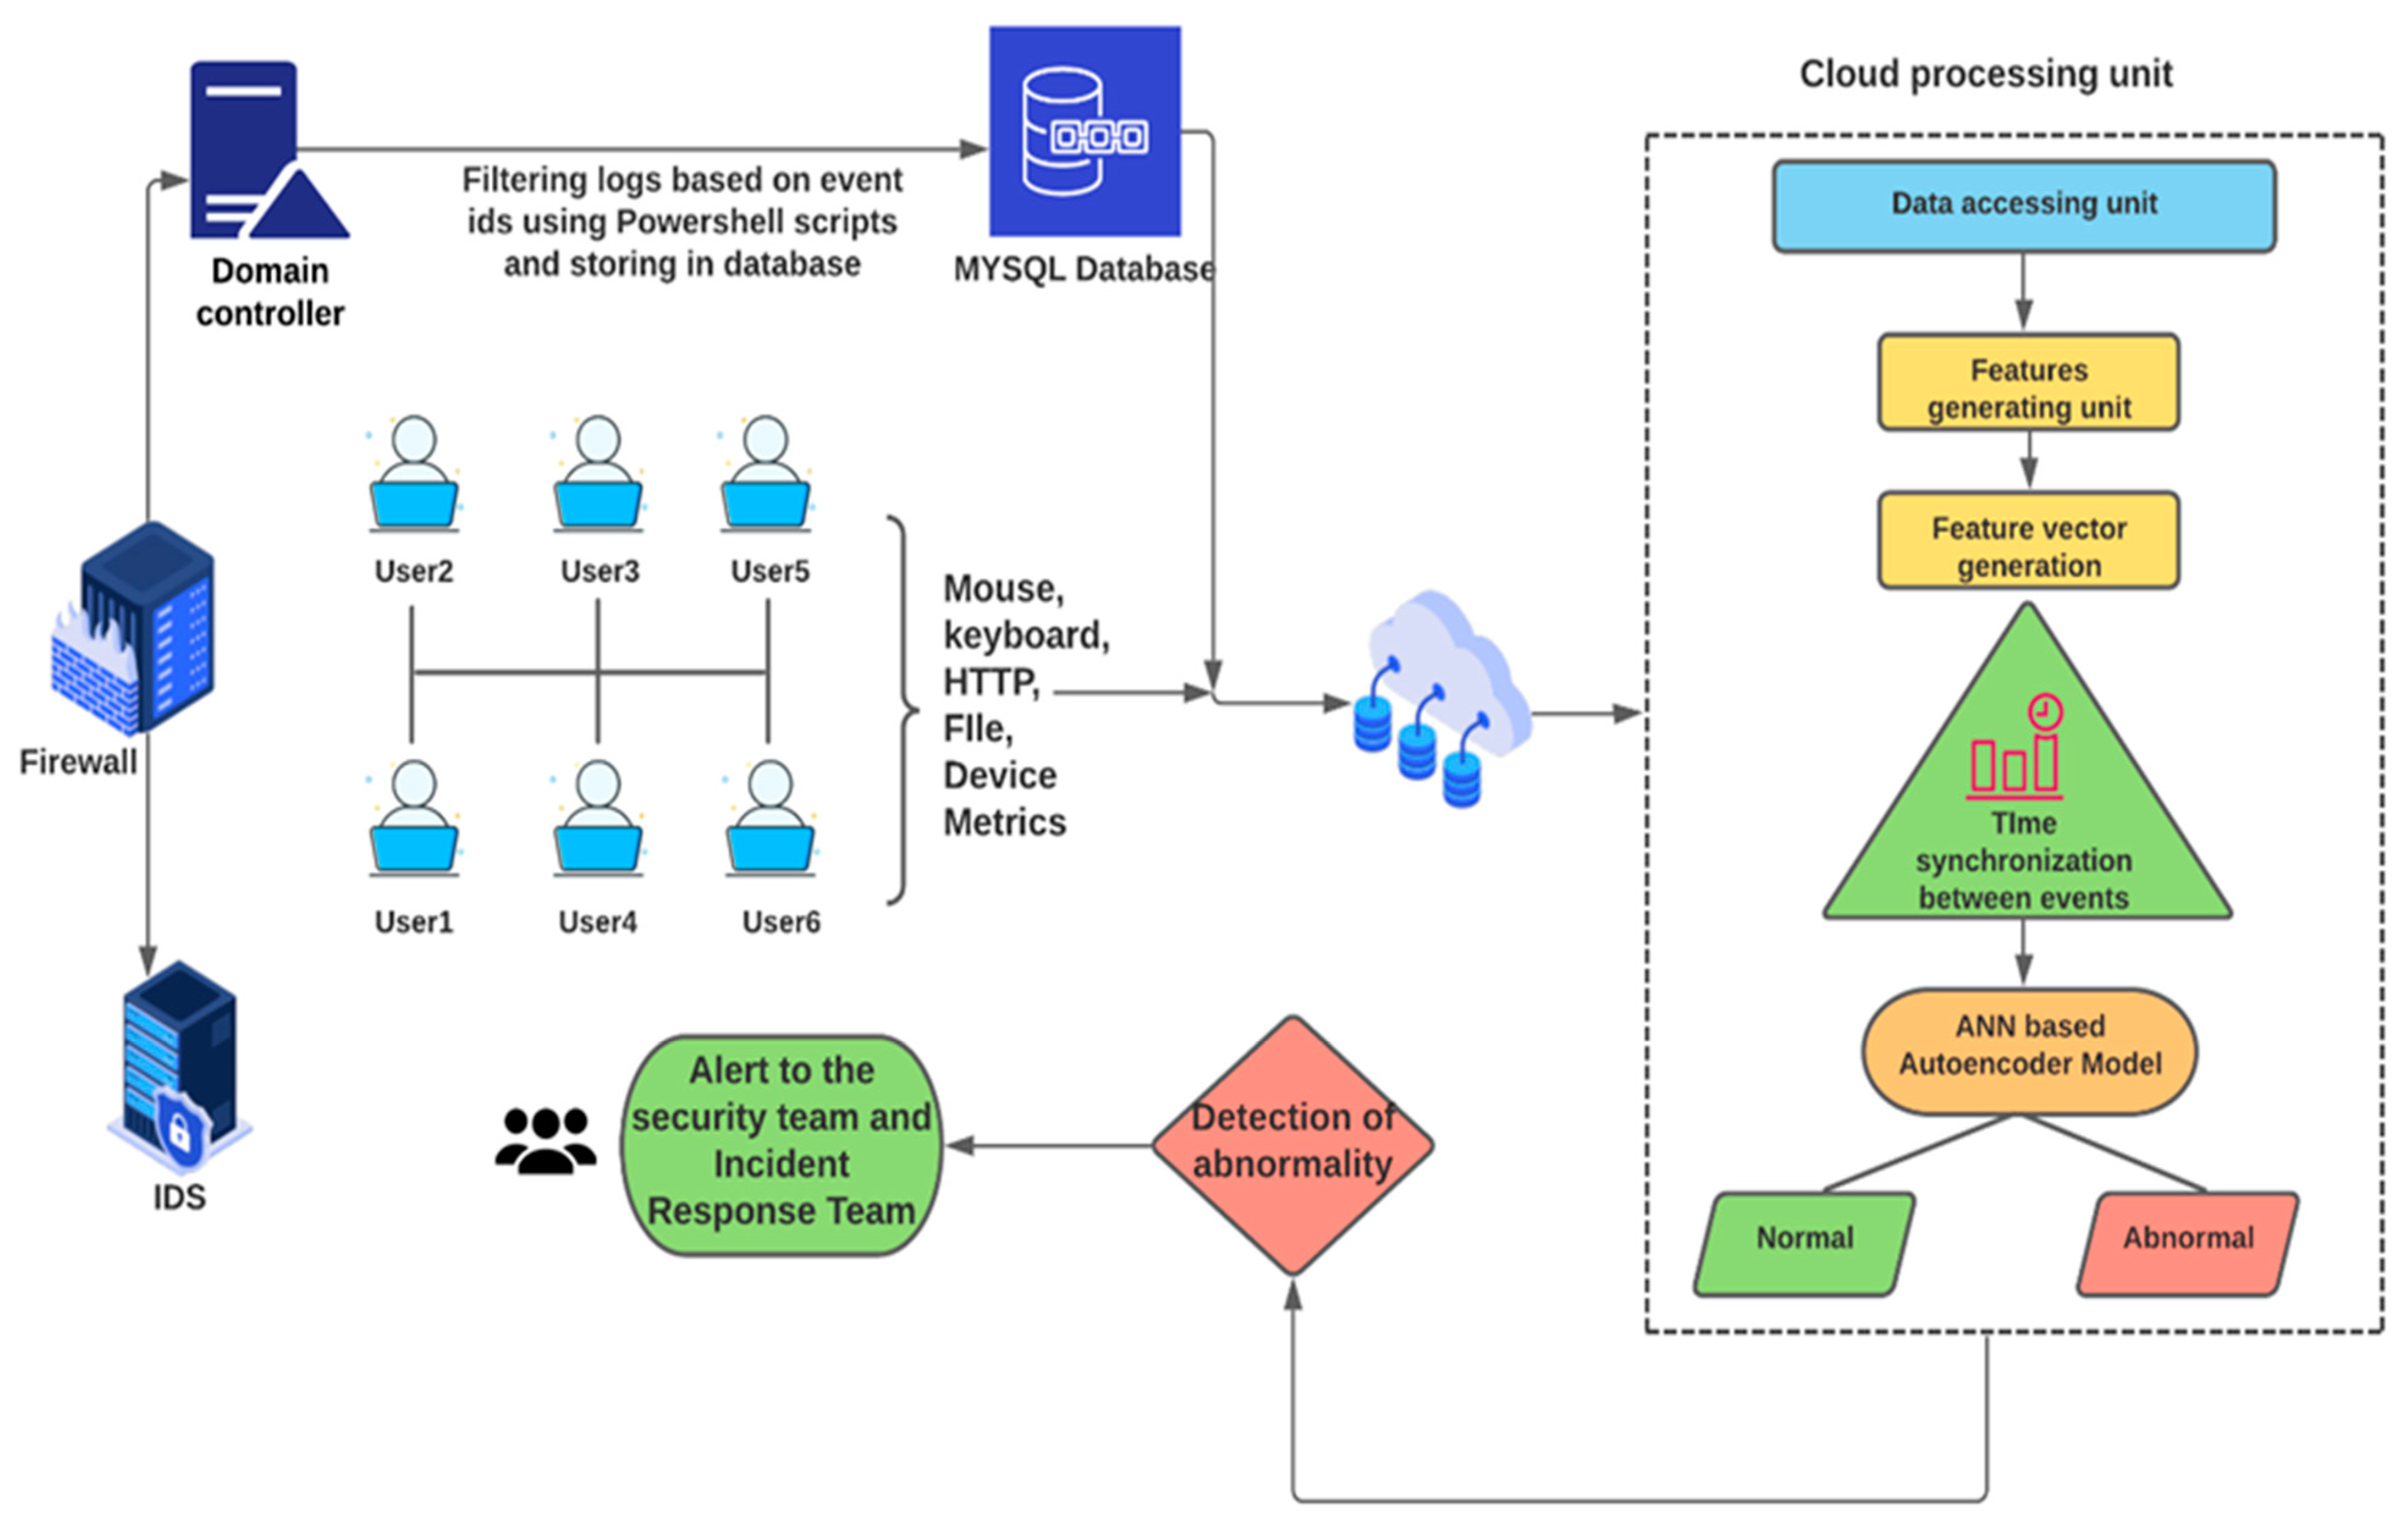
Figure 1. The system architecture of the proposed insider cyber security threat detection based on UEBA.
Futureinternet 15 00373 g001
Figure 2. Execution phases of the proposed solution.
Futureinternet 15 00373 g002
Figure 3. Flow of collecting events from different sources.
Futureinternet 15 00373 g003
Figure 4. Characteristics of CPU behavior (system_average_cpu attribute).
Futureinternet 15 00373 g004
Figure 5. Characteristics of memory behavior (system_average_memory attribute).
Futureinternet 15 00373 g005
Figure 6. Proposed ANN architecture for the insider threat detection system.
Futureinternet 15 00373 g006
Figure 7. Train and validation loss during the training phase.
Futureinternet 15 00373 g007
Figure 8. Model performance on normal data.
Futureinternet 15 00373 g008
Figure 9. Model performance on anomaly data.
Futureinternet 15 00373 g009
Figure 10. Monitoring of feature parameters in the graph-based real-time monitoring system.
Futureinternet 15 00373 g010
Figure 11. Security threat detection in the first scenario based on network traffic.
Futureinternet 15 00373 g011
Figure 12. Security threat detection in the second scenario based on mouse activity.
Futureinternet 15 00373 g012
Figure 13. Performance metrics for accuracy, recall (TPR), FPR, and TNR.
Futureinternet 15 00373 g013
Figure 14. Reconstruction of normal data with MSE and ADAM.
Futureinternet 15 00373 g014
Figure 15. Reconstruction of anomaly data with MSE and ADAM.
Futureinternet 15 00373 g015
Figure 16. Reconstruction of normal data with MSE and SGD.
Futureinternet 15 00373 g016
Figure 17. Reconstruction of anomaly data with MSE and SGD.
Futureinternet 15 00373 g017
Figure 18. Reconstruction of normal data with MAE and ADAM.
Futureinternet 15 00373 g018
Figure 19. Reconstruction of anomaly data with MAE and ADAM.
Futureinternet 15 00373 g019
Figure 20. Reconstruction of normal data with MAE and SGD.
Futureinternet 15 00373 g020
Figure 21. Reconstruction of anomaly data with MAE and SGD.
Futureinternet 15 00373 g021
Table 1. Comparison of related works.
Reference
Number
Behavior-
Based
(U/EBA)
Approach
AlgorithmDatasetFeatures
Considered
Device and Entities
Behavioral Analysis
[23]YesMulticlass SVMCustom-made datasetKeystrokes and tap dynamicsNo
[22]YesSupervised and unsupervised (one-class SVM)1998 Lincoln Laboratory intrusion detection datasetTime, user ID, machine IP, command, argument, pathNo
[19]YesLSTM autoencoderCERT datasetDevice, email, HTTP, file, log-on activityYes
[24]YesK-nearest neighbors and PCARUU datasetWindow touches, new processes, running processes, and applications on the systemYes
[21]NoLocal outlier factorMultiple datasetsKeyboard data, emails, log accessNo
Proposed approachYesANN-based autoencoderCustom-made datasetKeystroke, mouse, file, HTTP, resource consumption, device usage (central processing unit (CPU), random access memory (RAM), network)Yes
Table 2. Feature description.
Feature DomainFeatureDescription
Mouseclick_speed_aveage_NSet of features that depict the average time to complete a click using the mouse in (ms). Clicks (0—left, 1—right, 2—left double, 3—middle).
click_speed_stddev_NSet of features that depict the standard deviation in time to complete a click using the mouse in (ms). Clicks (0—left, 1—right, 2—left double, 3—middle).
mouse_action_counter_NSet of features that depict the number of events respective to each type of action. Actions (Clicks (0—left, 1—right, 2—left double, 3—middle, 4—mouse movement, 5—drag or selection, 6—scroll)).
mouse_position_histogram_NSet of features that depict the number of events that occurred in each quadrant of the screen, where the screen is divided into 3 × 3 matrix, i.e., 9 quadrants.
mouse_movement_direction_ histogram_NSet of features that represent the number of mouse movement events in each direction (8 directions).
mouse_average_movement_ durationAverage time of the mouse movements in (ms).
mouse_average_movement_ speedThe standard deviation in the time of the mouse movements in (ms).
mouse_average_movement_ speed_direction_NSet of features that depict the histogram of movement average speeds per direction.
Keyboardkeystroke_counterTotal number of key strokes generated by the user.
erase_keys_counterNumber of times the user pressed “backspace” and “delete”.
erase_keys_percentagePercentage of erased keys over total keys.
press_press_average_intervalThe average time between two successive key strokes in (ms).
press_press_stddev_intervalStandard deviation in the time between two successive key strokes.
press_release_average_intervalThe average time between press and release of all the key strokes in (ms).
press_release_stddev_intervalStandard deviation in the time between the press and release of all the key strokes in (ms).
keystrokes_key_KiSet of features that depict the number of key y-strokes per key. Ki is the key in the set of keys and is meant to be recorded.
press_release_average_KiSet of features that depict the average time between press and release of all the key strokes in keys set in (ms).
Applicationactive_apps_averageThe average number of active applications.
current_appExecutable name of the application in the foreground.
penultimate_appPenultimate application’s executable name in foreground.
changes_between_appsThe number of changes between different foreground applications.
current_app_foreground_timeAmount of time the current application has been in the foreground.
current_app_average_processesThe average number of processes of the current application in the foreground.
current_app_stddev_processesThe standard deviation in the number of processes of the current application in the foreground.
Resource Consumption (Device)current_app_average_cpuThe average amount of CPU used by the current application (%).
current_app_stddev_cpuThe standard deviation in the CPU used by the current application (%).
system_average_cpuThe average amount of the system’s total CPU capacity used (%).
system_stddev_cpuThe standard deviation in the system’s total CPU capacity used (%).
current_app_average_memThe average amount of memory used by the current application (%).
current_app_stddev_memThe standard deviation in the memory used by the current application (%).
system_average_memThe average amount of total system memory capacity used (%).
system_stddev_memThe standard deviation in total system memory capacity used (%).
received_bytesThe number of bytes received through the network interfaces of the device.
sent_bytesThe number of bytes sent using the network interfaces of the device.
HTTP and FileURLURLs visited by the user. These will be classified as 0—normal and 1—malicious.
File_modificationsAny read and write operations performed by escalating privileges are classified as 1 and 0 if not.
Table 3. Comparison of anomaly detection results.
ReferencesApproach (%)Accuracy
(%)
Recall
(%)
Precision
(%)
[13]LSTM autoencoder90.1791.039.84
[22]Multiclass SVM90.490.491.25
[22]MLP classifier (NN)81.681.683.9
Proposed modelANN-based autoencoder94.39089.1
Disclaimer/Publisher’s Note: The statements, opinions and data contained in all publications are solely those of the individual author(s) and contributor(s) and not of MDPI and/or the editor(s). MDPI and/or the editor(s) disclaim responsibility for any injury to people or property resulting from any ideas, methods, instructions or products referred to in the content.