Article

End-to-End Service Availability in Heterogeneous Multi-Tier Cloud–Fog–Edge Networks

Transport and Telecommunication Institute, LV-1019 Riga, Latvia
Future Internet 2023, 15(10), 329; https://doi.org/10.3390/fi15100329
Submission received: 19 September 2023 / Revised: 1 October 2023 / Accepted: 4 October 2023 / Published: 6 October 2023

Abstract

:
With the evolution towards the interconnected future internet spanning satellites, aerial systems, terrestrial infrastructure, and oceanic networks, availability modeling becomes imperative to ensure reliable service. This paper presents a methodology to assess end-to-end availability in complex multi-tiered architectures using a Markov model tailored to the unique characteristics of cloud, fog, edge, and IoT layers. By quantifying individual tier reliability and combinations thereof, the approach enables setting availability targets during the design and evaluation of operational systems. In the paper, a methodology is proposed to construct a Markov model for the reliability of discrete tiers and end-to-end service availability in heterogeneous multi-tier cloud–fog–edge networks, and the model is demonstrated through numerical examples assessing availability in multi-tier networks. The numerical examples demonstrate the adaptability of the model to various topologies from conventional three-tier to arbitrary multi-level architectures. As connectivity becomes ubiquitous across heterogeneous devices and networks, the proposed approach and availability modeling provide an effective tool for reinforcing the future internet’s fault tolerance and service quality.

1. Introduction

The internet, in its present form, is an intricate mosaic of interconnected networks, devices, and protocols. As we journey towards a more connected world, the imminent influx of the Internet of Things (IoT), coupled with advancements in edge and fog computing, promises to add layers of complexity to this landscape. This evolution, coupled with the impending amalgamation of space–air–ground–ocean networks, foreshadows an even more sophisticated internet architecture on the horizon.

1.1. Evolution and Significance of Multi-Level Communication Networks

From its inception, the internet’s expansive web has grown in complexity and importance. Currently, with the emergence of IoT and the nascent fields of edge and fog computing, we are on the cusp of more comprehensive integration. The merger of space–air–ground–ocean networks into this fold foretells an even more nuanced future for the internet’s structure.
As our technological era progresses, a surge in devices connecting to the internet is evident, ranging from domestic sensors in smart homes to industrial robots. These multi-level communication networks, now an integral part of modern connectivity, are distinguished by their multiple tiers. Each layer, whether it be cloud, fog, or edge, comes with unique computing, storage, and communication capacities. Central to this evolution is the cloud–fog–edge computing dynamic, which is decentralizing intelligence and transforming service delivery. At the core of this system, robust centralized cloud data centers stand tall, processing and storing colossal amounts of data from myriad endpoints.

1.2. The Imperative of High Availability

In this digital age, the global populace expects uninterrupted, seamless online service, spanning leisure activities to mission-critical tasks like remote surgeries. The gravity of ensuring consistent availability grows as we further transition to a world deeply interwoven with digital threads. Here, downtime is not merely an inconvenience. For businesses, brief lapses can cause substantial financial dents, tarnish brand images, and erode consumer trust. The future internet is not merely a tool for browsing or entertainment; it is poised to be the linchpin in pivotal systems, from autonomous transit and smart city frameworks to healthcare and defense mechanisms.
The pressing question now is: How do we guarantee this indispensable availability across the labyrinthine multi-tiered internet? As we integrate more layers into the internet, each with its own potential pitfalls, the challenge intensifies. The concept of service availability, pivotal to a system’s operational effectiveness, emerges as a primary metric alongside others like throughput and latency. Yet conventional reliability modeling techniques falter when faced with these multi-tiered behemoths.

1.3. Objective and Contributions of the Paper

This paper rises to the occasion, bridging this gap with a tailored methodology of modeling for comprehensive analysis of end-to-end availability in multi-tier communication setups. This technique not only sheds light on current systems but also provides additional insight for future designs, ensuring the reliability and efficacy of next-generation systems.
While traditional cloud–fog–edge models have three main tiers, modern multi-level architectures can be more complex. In large-scale systems covering expansive geographic areas, additional hierarchical levels may emerge.
However, traditional reliability modeling techniques have limitations when applied to complex, multi-level architectures.
This work aims to address this gap through a novel modeling approach tailored to analyze end-to-end availability in multi-tier communication systems. The proposed technique offers new ways to evaluate existing systems and set availability requirements during the design phase.

2. Related Works

In recent years, the evolving landscape of geographically distributed networks, especially with the integration of cloud, fog, and edge computing, has received considerable attention in both academia and industry. The intersection of these architectures with Quality of Service (QoS), specifically availability, has also been a focal point of numerous studies. This section delves into the seminal and contemporary works that have laid the groundwork for the current understanding and guided the research presented in this article.
Active research is underway exploring architectures, orchestration, optimization, availability modeling, fault tolerance, and security specifically for emerging multi-tier computing ecosystems.
Next-generation communication networks will need to handle resource-intensive applications for numerous users. While cloud computing can assist with offloading these tasks, its centralized nature results in significant communication delays, making it unsuitable for emerging delay-sensitive applications. The edge and/or cloud can be combined to facilitate the task offloading problem. The authors of [1] presented a fundamental survey on integrating edge and cloud computing to navigate the challenges of task offloading, emphasizing diverse optimization strategies. The comprehensive review underscored the intrinsic importance of this topic, concluding with open challenges and avenues for future research.
The main research directions and publications related to multi-level cloud–fog–edge computing architectures and assessing their reliability and availability include different topics:
  • Architectures and methodologies for integrating cloud, fog, and edge layers into unified platforms for seamless operation and resource orchestration, e.g., OpenFog Consortium reference architecture [2], multi-access edge computing standards of the European Standards Organization [3], fog computing and networking theory, practice, and applications [4].
  • Management and virtualization techniques to dynamically allocate resources across discrete layers, e.g., software-defined networking approaches [5].
  • Programming models and application development approaches tailored for distributed multi-tier environments, e.g., workflow partitioning techniques in a fog application placement mechanism under the requirement of QoS satisfaction degree [6,7].
  • Performance modeling and optimization, e.g., analytically modeling attributes like latency, reliability, and power consumption to optimize tiers [8,9,10].
  • Assessing availability and reliability of multi-tier applications using probabilistic models to combine individual tier reliabilities [11,12,13,14].
  • Machine learning techniques to predict reliability from system data and model correlations between tiers [15,16,17].
  • Hardware/software fault tolerance mechanisms tailored to heterogeneous distributed architectures to enhance reliability [18,19,20].
  • Security, privacy, and trust considerations in interconnected environments spanning administrative domains with decentralized data [21,22,23].
There are many publications with real-world case studies and applications of multi-tiered computing systems.
The authors of [24] proposed an architectural and implementational model for real-time hardware monitoring and management to enhance security in heterogeneous networks. The system used symmetrical design to allow data wrapping and transport across diverse operating systems.
A multi-layered architecture was proposed in [25], using the Modbus TCP protocol to integrate heterogeneous hardware and software components for deploying experimental smart grids and microgrids with photovoltaic integration. An application of the photovoltaic-based microgrid demonstrated and validated the architecture.
The authors of [26] analyzed a multi-tier cobalt supply chain case for electric vehicles to demonstrate the challenges of achieving transparency for sustainability in complex, multi-tier supply chains, finding that the existing literature had oversimplified operationalizing transparency in multi-tier, sustainable supply chain management. The study compared supply chain maps before and after an auditing and mapping project to outline how focal companies could increase multi-tier supply chain transparency. The authors of [27] surveyed and classified edge computing architectures for IoT according to factors like data placement, orchestration, security, and big data capabilities, comparing architectures with various features, limitations, and solutions while also mapping architectures to IoT models and recommending edge computing usage scenarios for IoT applications.
The survey in [28] comprehensively analyzed time-sensitive applications in fog computing, categorizing surveyed articles and discussing concepts of real-time and near real-time systems to understand the applications being implemented and how their temporal requirements are addressed.
The two-tier computation offloading strategy for multi-user, multi-MEC servers in 5G heterogeneous networks was investigated in [29], with the authors proposing an efficient particle swarm optimization algorithm to minimize mobile device computing overhead, including completion time and energy consumption. The simulation results showed that the algorithm reduced overhead and guaranteed convergence compared to baselines.
A distributed, multi-tier, emergency alert system using IoT sensors for real-time, georeferenced critical event detection in smart cities was proposed in [30], which delivered configurable emergency alarms based on detected events, area risk levels, and temporal data to enable flexible and modular perceptions of emergencies. Implementation on open-source platforms and real-time visualization demonstrated a useful application of the system as a supporting service for adaptive, IoT-based, emergency-aware, smart city applications.
The authors of [31] defined and formulated the problem of enabling smart neighborhoods in the context of smart grids through an extensive literature review on fog computing, smart grids, microgrids, and their challenges, identifying fog computing as a promising solution to provide ultra-low latency and reliable, secure, cost-effective power to smart grids serving smart neighborhoods. Potential solutions and the integration of challenges were discussed without rigorous analysis.
In some specific case studies, e.g., unique geographical terrains and densely packed urban settings, conventional three-tier systems occasionally fall short. These gaps in service birthed the need for more granulated multi-tier systems, such as those employing aircraft and drones [32] or satellites in the space segment [33,34]. These innovations aimed to ensure consistent quality of service (QoS) and enhance the reliability of networks, irrespective of the operational environment.
Prior works on availability modeling in multi-tier networks have limitations in several areas, which this research aims to address, including:
  • Most existing analytical models focus on reliability within isolated tiers rather than end-to-end availability across systems. For example, the authors of [2,3,4,12,13,14] assessed the reliability of individual cloud, edge, or fog tiers but did not study overall system availability. This fails to account for cascading failures between interdependent layers.
  • Simulation-based techniques like those in [8,9,10] provide high fidelity but lack the generalizability of closed-form mathematical models. They also incur high computational overhead.
  • Approaches such as those in [7,8,9] tend to study cloud, fog, and edge in separation rather than as integrated systems spanning all layers.
  • A few models, like the ones in [25,26,30], consider complex multi-level architectures beyond basic three-tier topologies but the end-to-end availability of the service provided by all layers was not analyzed.
  • There is limited guidance for setting availability requirements during the design process based on user needs, as seen in previous works like [12,13,14].
Our proposed modeling methodology attempts to overcome these gaps by:
  • Leveraging Markov chains to create an analytical model of availability spanning edge, fog, and cloud tiers;
  • Accounting for inter-tier dependencies and cascading failures in an integrated system-level model;
  • Providing a flexible approach adaptable to different multi-tier architectures, including sublayers;
  • Enabling quantitative availability target setting based on user specifications;
  • Striking a balance between model simplicity, mathematical tractability, and practical fidelity.
This work aims to develop an analytical technique for availability modeling in complex, heterogeneous communication networks by considering end-to-end system availability across interconnected tiers. The motivation behind this study is twofold. Firstly, there is a necessity to formulate a structured methodology that gauges the availability of these multi-level systems. Such a methodology would allow stakeholders to predict, assess, and optimize their networks based on robust mathematical foundations. Secondly, in an era in which data-driven decisions reign supreme, having a model that can guide the design, implementation, and maintenance of future network architectures is invaluable.
While existing works have made valuable contributions to availability modeling in multi-tier networks, the proposed Markov-based methodology offers several advantages:
  • Compared to purely analytical models like those in [12,13,14], the proposed approach better handles cascading failures between interdependent tiers. The Markov chain captures state transitions across layers.
  • Unlike purely simulation-based techniques in [15,16], the proposed methodology provides a generalizable mathematical model with lower computational overhead. The Markov model enables broader insights.
  • In contrast to methods focusing only on specific tiers, like edge [27] or fog [28], the proposed unified Markov approach models the entire multi-tier topology. This enables assessing end-to-end availability.
  • The proposed model is adaptable to complex multi-level architectures beyond basic three-tier systems, which most works were limited to studying, as in [32,33,34]. The proposed Markov approach scales to any topology.
  • The methodology enables quantitative availability target setting during design, which most of the literature lacks. This ties modeling to user requirements.
  • Compared to reliability-focused models like in [18,19,20], the proposed approach emphasizes measuring availability, which directly relates to service uptime guarantees.
While no single method will excel in all aspects, the proposed Markov modeling approach balances generality, mathematical tractability, design insight, and focuses on end-to-end availability across complex multi-tier systems. By leveraging Markov chains, it provides a flexible and practical methodology for availability analysis in emerging heterogeneous networks.

3. Materials and Methods

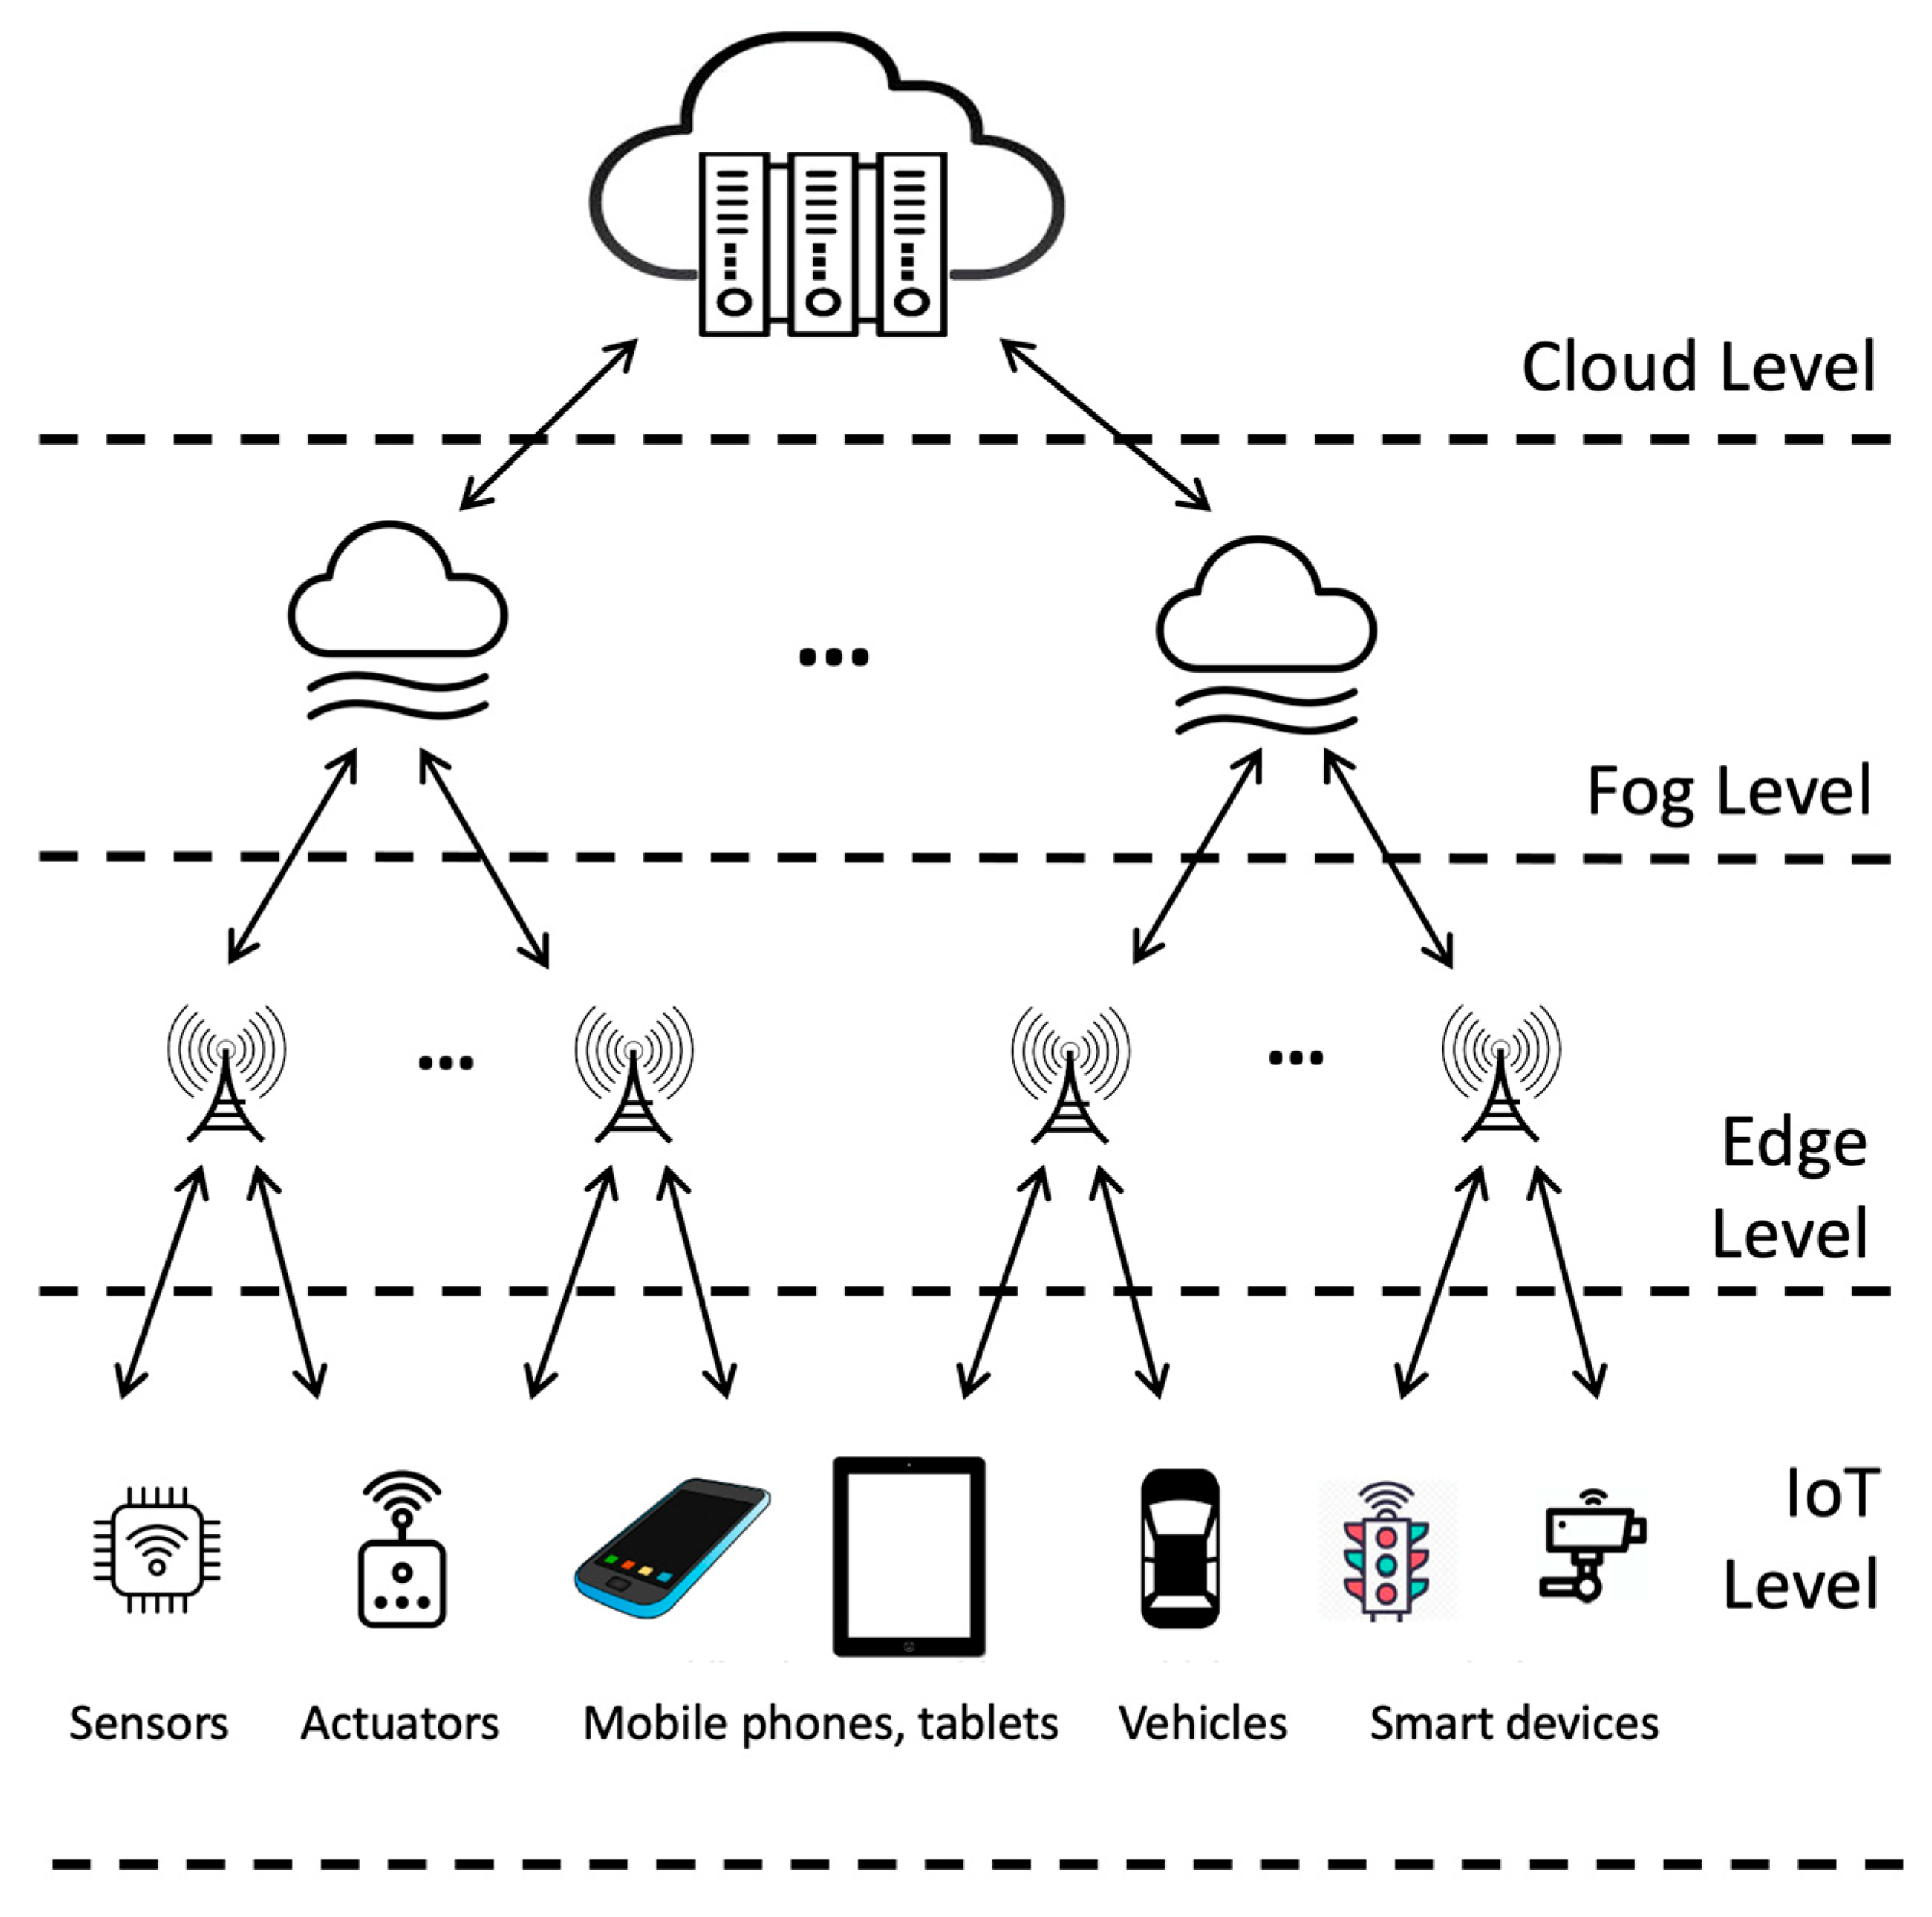
3.1. Traditional Three-Level Cloud–Fog–Edge Architecture

The traditional three-level architecture, comprising cloud, fog, and edge, represents a tiered approach to data processing and management in geographically distributed networks. Each level is uniquely positioned in the data processing chain, offering specific functionalities that cater to distinct needs (Table 1). This table offers a summarized overview of each layer’s characteristics, which stem from a convergence of widely accepted and recognized information within the field.
The typical three-level architecture is shown in Figure 1.
At the top is the cloud tier, comprised of massive, centralized data centers providing pooled compute, storage, and application services on demand.
Next is the fog layer, which distributes some networking, computing, and storage capacity into local access networks to reduce latency and network load. Fog nodes include routers, gateways, micro data centers, and more.
The edge tier aggregates and processes data flows from the IoT layer below it. It consists of devices like desktop computers, cameras, base stations, and local servers. The edge provides the first level of computing/storage resources outside end devices.
The IoT sublayer contains the plethora of endpoint sensors, wearables, appliances, vehicles, control systems, and other devices embedded in the physical environment. The IoT layer generates raw data from the field.
By separating the edge and IoT levels, it is possible to obtain a clearer understanding of the distribution of computational tasks and data flow within a multi-tier system. The IoT level’s primary job is data capture with minimal processing, while the edge level acts as a local decision maker, processing and analyzing the data in near real time.
In operation, IoT devices transmit data to the edge for localized processing. The edge passes summarized or filtered information into the fog layer for intermediate processing and buffering closer to users. The cloud finalizes processing, analyzes aggregated data, and provides global services.
This four-tier model provides a more complete picture of multi-level architectures spanning the centralized cloud, distributed fog/edge computing, and dispersed IoT endpoints. The IoT layer highlights the role of smart edge devices and systems producing and consuming data.
There are many examples of case studies illustrating applications of four-tier architecture with cloud, fog, edge, and IoT layers.
Smart Transportation. In an intelligent transportation system, vehicles act as edge nodes with onboard sensors and computers. Roadside units like traffic signals and message signs provide fog-level computing and connectivity. The cloud tier collects and analyzes regional traffic data to coordinate signals, dispatch emergency services, and relay information to vehicles.
Smart Grid. Smart meters at homes and buildings work as edge devices to send electricity usage data. Local transformers, substations, and routers comprise the fog layer to handle neighborhood-level processing and communications. Utility providers leverage the cloud for system-wide monitoring, control, analytics, and automation.
Video Surveillance. Networked security cameras are edge nodes that can pre-process visual data before sending video feeds to the fog layer for further analysis, compression, and storage. Additional analytics and long-term archives reside in the cloud.
Augmented Reality. AR headsets or glasses function as edge devices that integrate real-time views with overlaid computer-generated content. Local gateways and micro data centers provide fog-level processing such as occlusion handling and multi-user synchronization. Heavy computing, like scene reconstruction and object recognition, takes place in the cloud.
Remote Healthcare. Medical devices for patient monitoring make up the network edge to collect health data. Fog infrastructure aggregates and pre-processes these data, issuing alerts if needed. Centralized electronic health records are maintained in the cloud for analytics and personalized care plans.
In different case studies, the layers of network architecture are presented by different components. For example:
  • Smart Agriculture:
    -
    IoT—Sensors monitor soil moisture, crop growth parameters, weather, and livestock vitals.
    -
    Edge—Gateways in fields pre-process sensor data and activate irrigation.
    -
    Fog—Local farm servers aggregate data and optimize water/fertilizer levels.
    -
    Cloud—Cloud services analyze long-term trends and provide global monitoring.
  • Smart Retail:
    -
    IoT—RFID tags track inventory. Point-of-sale and shopping apps capture purchase data.
    -
    Edge—Store servers filter noise and detect localized trends.
    -
    Fog—Regional servers identify buying behaviors and optimize pricing.
    -
    Cloud—Central cloud analyzes worldwide sales and shopping habits.
  • Industrial Automation:
    -
    IoT—PLCs, sensors, and actuators control production processes and machinery.
    -
    Edge—Local control systems modulate manufacturing lines in real time.
    -
    Fog—Plantwide monitoring and control systems enhance coordination.
    -
    Cloud—Global cloud optimizes manufacturing operations and schedules.
  • Smart Energy Utilities:
    -
    IoT—Smart meters monitor household electricity usage. Grid sensors track power levels.
    -
    Edge—Neighborhood-level servers balance local loads.
    -
    Fog—Regional systems regulate distribution across substations.
    -
    Cloud—Cloud analyzes usage patterns and controls cross-region transmission.

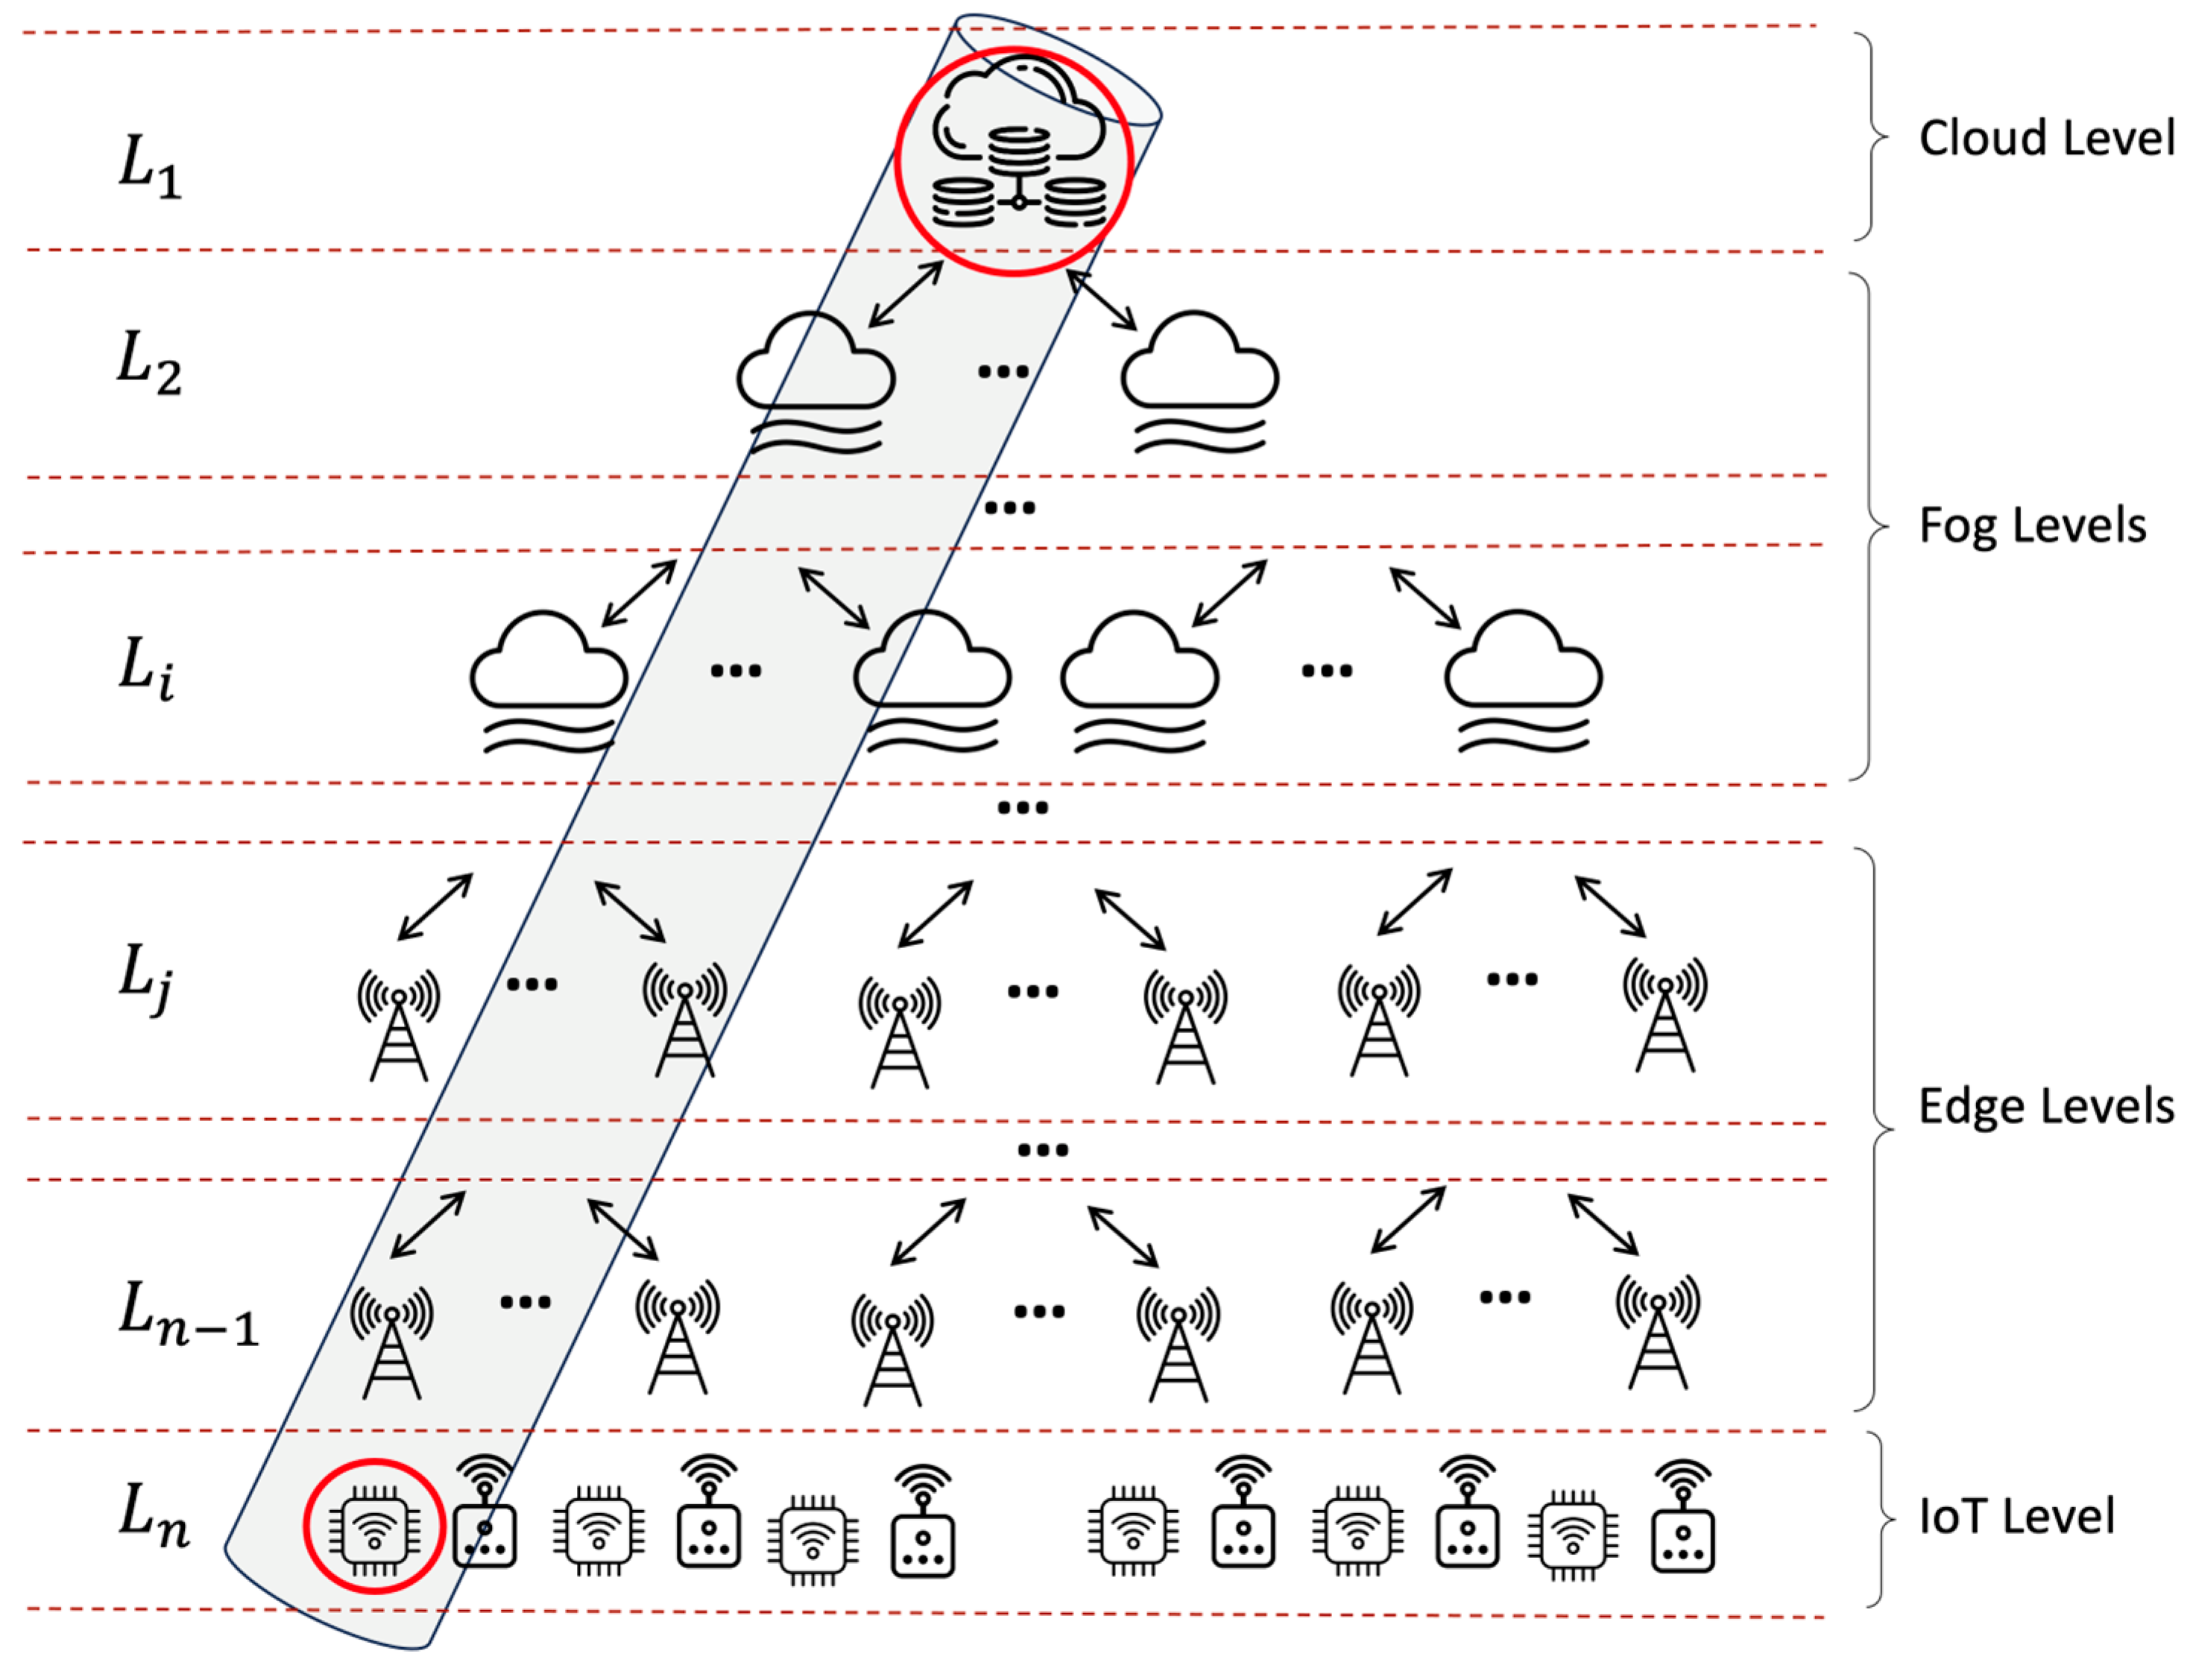
3.2. Multi-Tier Systems

In the realm of geographically distributed networks, as the demand for real-time processing and localized decision making has surged, the classical three-level architecture (cloud–fog–edge) has sometimes proven inadequate. This has led to the evolution of more nuanced, adaptable architectures known as multi-tier systems. Multi-tier systems introduce additional processing layers between traditional levels, thus enhancing the granularity of data management and processing.
Here are some case study examples of multi-level cloud-fog-edge architectures:
  • Smart City. A metropolitan area can have multiple tiers of fog infrastructure. A neighborhood fog layer of gateways and micro data centers connects into a wider city-level fog system for broader connectivity and storage, managed by a municipal IT department. Both feed into a regional cloud data center.
  • Private 5G Network. For a large corporate campus or industrial site, Wi-Fi can provide a lower fog tier for indoor/short-range wireless access. 5G small cells overlay this to cover the extended campus. A central on-premises private 5G core integrates the radio access network with internal IT systems and an optional public cloud service.
  • Retail Chain. Point-of-sale devices and inventory sensors in stores form the edge layer. In-store servers and networking comprise the fog layer. Regional distribution centers provide a second tier of fog resources. The central enterprise cloud contains core business systems and analytics.
  • Environmental Monitoring. A first tier of simple sensors monitors local conditions like temperature. More advanced gateways aggregate data from clusters of these devices over a wider area. Periodic drone flights act as temporary fog hotspots to backhaul data. The cloud provides centralized data historian capabilities.
In the modern age, as digital communication infiltrates nearly every aspect of our lives, the need for a unified, seamlessly integrated network becomes more pressing. While traditional network structures focused on specific domains, be it terrestrial, aerial, or marine, the future is seen in the convergence of these domains, culminating in a robust, all-encompassing communication paradigm known as the Space–Air–Ground Integrated Network (SAGIN) [35,36,37].
At its core, SAGIN represents the zenith of multi-level networking, bringing together the expansive reaches of space with the immediacy of terrestrial networks, the mobility of aerial systems, and the depth of oceanic communication. It is a vision that extends beyond the classic three-tier architecture of cloud, fog, and edge, encapsulating the vastness and dynamism of our planet’s communication needs. This AI-enabled architecture represents not just an upgrade but a transformative shift in how we envision and implement network infrastructure.
The multi-level architecture of SAGIN (Figure 2) is not merely a stratification of platforms but a meticulously crafted interplay of functionalities, in which each level brings its unique strengths.
The space domain in SAGIN refers to satellites and other space-based assets. These satellites bridge gaps between remote areas, providing global coverage. They act as high-speed data relays, ensuring that no corner of the Earth remains disconnected. In this expansive void, they are the guardians, ensuring that the internet’s reach is truly worldwide, unimpeded by terrestrial challenges such as mountains or dense urban construction. In the context of studying a multi-tier or multi-layer satellite communication system, satellites in low Earth orbit (LEO), medium Earth orbit (MEO), and geostationary orbit (GEO) can be considered as three distinct layers. Each of these layers serves specific functions and possesses unique characteristics that influence their operational purposes and the types of services they provide (Table 2). As with previous discussions, the information provided is a synthesis of commonly recognized knowledge in the realm of satellite communications.
The air domain consists of drones, aircraft, and other aerial vehicles. These airborne assets provide a dynamic layer of connectivity capable of rapidly adjusting to changing network demands. For areas where terrestrial networks might be momentarily compromised, perhaps due to natural calamities, these aerial entities can swoop in, providing immediate, albeit temporary, connectivity. They act as bridges, ensuring that communication remains uninterrupted during transitions or disturbances.
Terrestrial or the ground domain in SAGIN remains the primary backbone for most communication needs. From massive data centers to intricate networks of fiber-optic cables, the ground-based infrastructure supports the bulk of data processing, storage, and transmission. With the rise of smart cities and intelligent transportation systems, the ground becomes a bustling hub of IoT devices, all communicating, processing, and making decisions in real time.
The ocean domain dives deep, quite literally. With underwater sensors, submarines, and aquatic drones, this layer seeks to harness the vastness of the oceans. Whether for marine research, tracking underwater pipelines, or ensuring the safety of shipping routes, the ocean level provides a crucial link, allowing for real-time data collection and communication even in the most remote marine environments.
The multi-level design of SAGIN is not merely about its spatial organization but also about its functionality symbiosis. Each level, while distinct in its operations, complements the others in one common network.
In the SAGIN architecture, the integration of physical systems with digital network hierarchies like cloud–fog–edge–IoT presents a fascinating yet intricate challenge. Each segment of SAGIN has specific functionalities and plays a vital role in ensuring seamless communication.
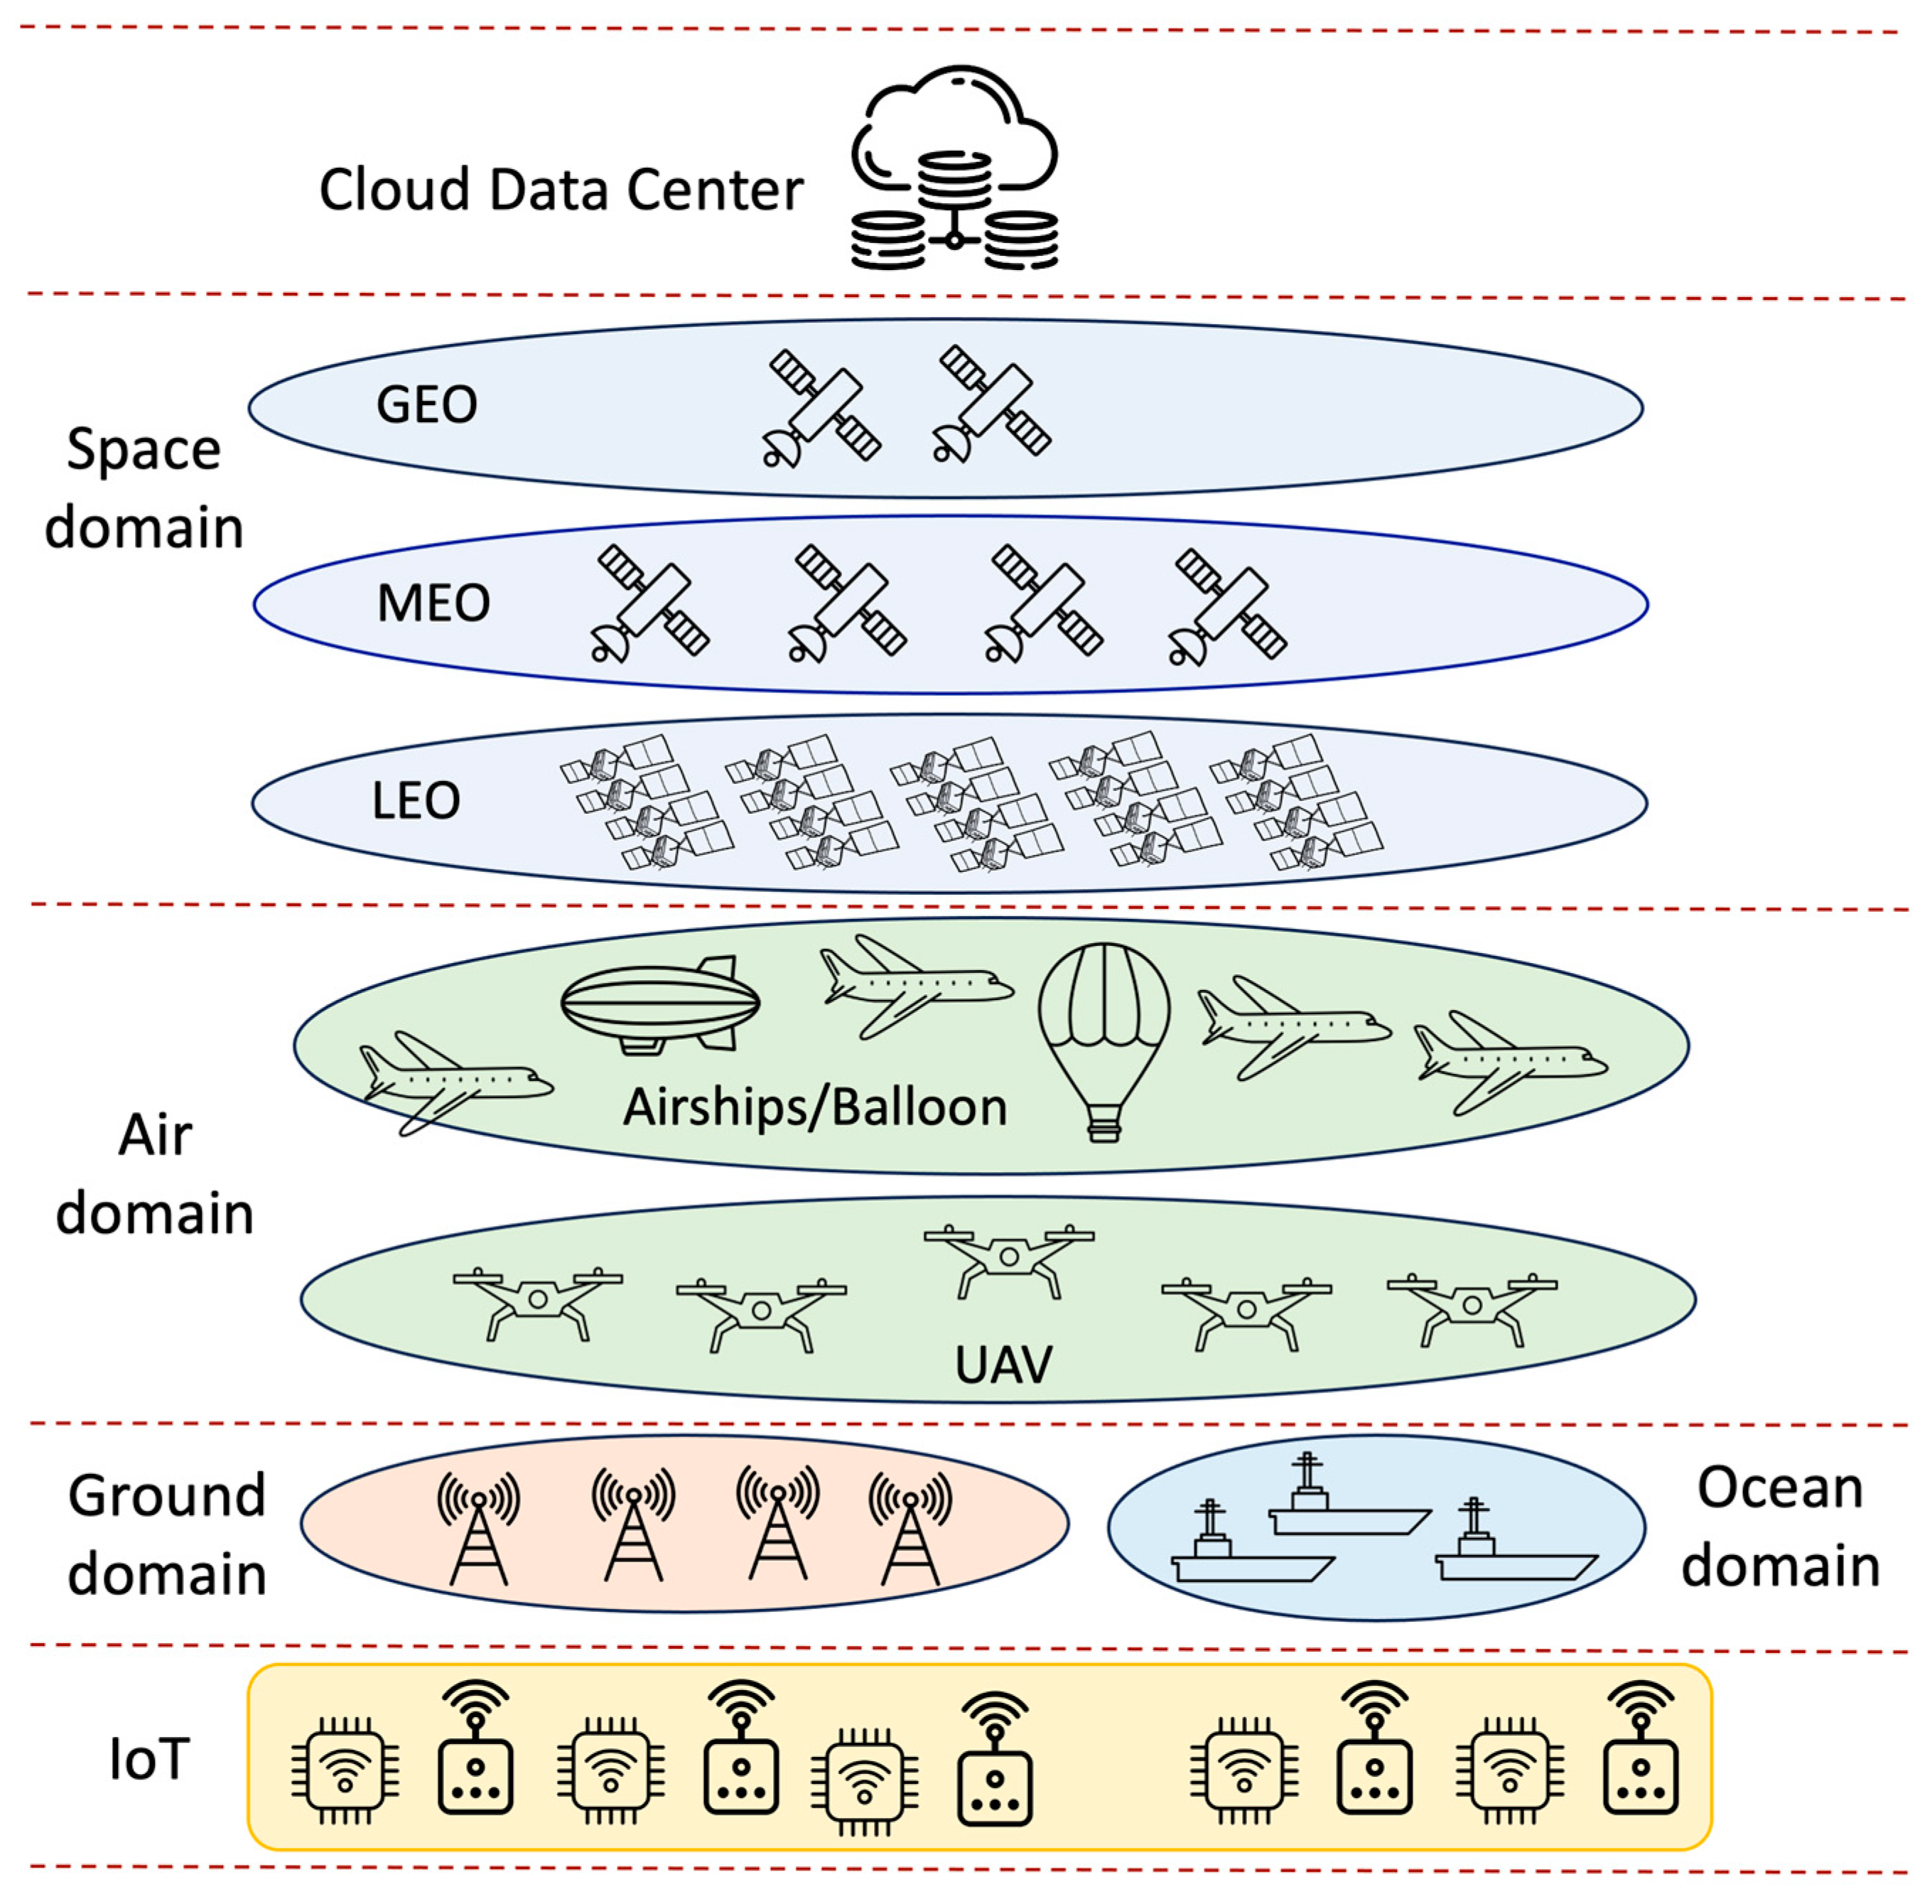
  • Cloud Level. The cloud represents the most abstract and vast digital storage and computational capacities. In the context of SAGIN, it includes:
    • Space. Ground-based control centers for space objects can interface with cloud platforms to handle vast amounts of data from satellites, ensuring global coverage and communication with remote satellites.
    • Air. Major control centers for managing large-scale aerial operations, such as fleets of drones or aircraft, rely on cloud infrastructure for coordination and data analysis.
    • Ground and Ocean. Large data centers, tasked with handling terrestrial and marine data, connect directly to the cloud.
  • Fog Level. Fog computing acts as an intermediate processing layer, residing closer to data sources:
    • Space. Nearby satellite clusters can communicate and process data in a local fog network before sending data down to Earth or to another satellite cluster.
    • Air. Aircraft and high-altitude drones can have onboard fog computing systems to process data in real time before sending essential data to the ground or the cloud.
    • Ground. Infrastructure like cellular towers or regional data hubs. For the marine context, surface vessels or buoy systems can have fog systems to handle localized oceanic data.
  • Edge Level. This level is closer to the data source and often responsible for more immediate, time-sensitive computations:
    • Space. Satellites, especially those in low Earth orbits, are edge devices gathering and sometimes processing data before sending data to the ground or across the satellite network.
    • Air. Individual drones or low-altitude aircraft can act as edge devices, making real-time decisions based on immediate data, like adjusting flight paths for obstacles.
    • Ground. Roadside units (RSUs) in intelligent transportation systems, regional communication hubs, and even individual buildings in smart cities operate at the edge level.
    • Ocean. Submarines or deep-sea drones equipped with sensors and communication tools act as edge devices, processing underwater data in real time.
  • IoT Level. This is the level at which data are primarily gathered.
    • Space. There is not a direct IoT equivalent in space in the traditional sense. However, individual sensors on satellites that pick up specific types of data can be seen as IoT devices.
    • Air. Sensors on drones or aircraft, which gather data like atmospheric conditions, camera feeds, etc., are the IoT devices of the air segment.
    • Ground. In a smart city, for example, traffic cameras, environmental sensors, or even devices in our homes are all IoT devices. In intelligent transportation systems, vehicular onboard units (OBU) operate at this level.
    • Ocean. Primary sensors placed on the ocean floor, those attached to marine animals for tracking, or sensors on floating buoys fall under the IoT level.
The SAGIN system’s intricacies and complexities make it a fascinating model for multi-level digital networking. The alignment of its physical systems with the cloud–fog–edge–IoT hierarchy ensures optimal data processing, transmission, and storage, regardless of where the data originate, be it space, air, ground, or ocean.
While SAGIN provides a comprehensive framework integrating multiple domains, its true strength lies in its adaptability. Depending on the application, this network can be molded, emphasizing certain layers and domains over others, ensuring optimal performance, responsiveness, and efficiency.
Depending on the specific application, different SAGIN domains (space, aviation, terrestrial, oceanic) can form different configurations of the network architecture, which in general can be represented by a hierarchical structure with a different number of sublevels in the classical three-level cloud–fog–edge system.
Without differentiating between main levels and sublevels, and simply viewing the architecture as a hierarchy of n distinct levels, the network configuration from an application operation point of view can be presented by the model shown in Figure 3.
In such a model, you only need to keep track of each level and its associated nodes.
Let us represent a node in the hierarchy using two indices:
i —level in the hierarchy
j —index within that level
So, node N i j would be represented as j node in the i level.
Without differentiating between main levels and sublevels, and simply viewing the architecture as a hierarchy of n distinct levels, the network configuration from an application operation point of view can be presented by the model shown in Figure 3. In such a model, you only need to keep track of each level and its associated nodes.
The hierarchy of the architecture can be represented by a set of levels L = L i i = 1 , n ¯ } and set of nodes N = N i j i = 1 , n ¯ ; j = 1 , k ¯ , where i represents the level in the hierarchy and j represents an index within that level.
A link represents communication between two nodes. It can be represented as E ( N i j , N ν η ) , where N i j , N ν η are nodes. Because of our hierarchical model, i should always be one unit less than ν (i.e., ν = i + 1 ), denoting the vertical connectivity between adjacent levels.
This representation simplifies the hierarchical nature by only capturing the vertical connections between nodes in adjacent levels. The lack of distinction between primary levels and sublevels streamlines the model while retaining the essence of the hierarchical structure and main characteristics of multi-tier systems:
  • These systems can dynamically adapt to different scenarios, allowing for customized deployments based on specific geographic or operational requirements.
  • Additional tiers can lead to reduced data travel distances and, consequently, lower latency, which is crucial for applications demanding near instantaneous responses.
  • By adding or removing tiers based on demand, multi-tier systems can be seamlessly scaled up or down, accommodating fluctuating data volumes and processing needs.

4. Results

The success and efficiency of multi-level systems, whether traditional or incorporating segments such as space, are deeply entrenched in the Quality of Service (QoS) they offer and their inherent reliability. Ensuring high QoS and reliability becomes especially pivotal in a complex, geographically distributed network.
QoS denotes the performance level of a service or system, encapsulating various parameters such as latency, throughput, availability, and error rate. In multi-level systems:
  • Latency refers to the time it takes for a packet of data to move from the source to the destination. In geographically distributed networks, this is influenced by the number of tiers the data have to traverse and the nature of those tiers (terrestrial, aerial, or orbital).
  • Throughput is the amount of data that can be transferred within a given time frame. It is influenced by the bandwidth and capacity of each tier.
  • Availability is the likelihood that the system or service is operational and accessible when needed. It is directly correlated with the system’s reliability.
  • Error rate is the frequency at which errors occur during data transmission or processing. In multi-level systems, errors can arise from factors like signal interference, hardware malfunctions, or software glitches.
In the context of multi-level systems, reliability focusing on availability stands out as a paramount concern. Availability, in essence, indicates the system’s operational uptime, ensuring that users can access services without disruptions.
There are some main challenges in maintaining QoS and reliability:
  • As the number of connected devices grows, ensuring consistent QoS and reliability can become challenging.
  • Effective communication and coordination between tiers are essential, especially in dynamic scenarios.
  • External factors like space weather for satellite tiers, physical obstructions for aerial tiers, or terrestrial network congestion can pose challenges.
While the multi-tier architecture of geographically distributed networks offers numerous advantages in terms of scalability, flexibility, and coverage, maintaining a consistent quality of service and ensuring high reliability are fundamental to the system’s success. As technology advances, strategies to bolster QoS and reliability will be crucial for these multi-level systems to fulfill their promise and potential.
Reliability, in the context of geographically distributed networks, signifies the capability of the system to provide uninterrupted service despite inherent uncertainties and potential failures. Historically, several mathematical models have been utilized to analyze and predict reliability. Among them, Markov reliability models have emerged as a potent tool due to their adaptability and comprehensive nature [38].
Markov reliability models, with their probabilistic approach and inherent flexibility, serve as invaluable tools in the analysis of complex systems. Their adaptability makes them an apt choice for the proposed model, aiming to understand and predict the availability of service in geographically distributed networks [39].
Adapting Markov reliability models for multi-level systems requires an understanding of the interplay between various layers, their unique characteristics, and the overarching network dynamics. When appropriately tailored, these models can provide insight into the reliability and availability of service across the entire network, guiding both design decisions and operational strategies.
In any complex system, particularly multi-level networks, the concept of availability stands out as a paramount metric. Availability denotes the proportion of time a system, or any of its components, is operational and ready to deliver the expected service. Within the framework of Markov reliability models adapted for multi-level systems, understanding and measuring availability demands a specialized approach.
Availability, in terms of QoS, is often expressed as the fraction of time a service or system is operational and can be accessed, as expected by users or other systems. This is one of the key metrics in service-level agreements (SLAs) across various industries. Availability A for a given component is the probability that it is operational when required. It can be represented as:
A = U p t i m e U p t i m e + D o w n t i m e
where:
  • U p t i m e refers to the amount of time a system, service, or component is operational and available to perform its intended function. Uptime is essentially the period when a system is functioning without any interruptions.
  • D o w n t i m e represents the duration when a system, service, or component is not operational due to planned maintenance, unplanned outages, or failures. It is the period when the system is not available for its intended purpose.
For a multi-level system, if we assume that the service for the endpoint depends on each component working sequentially (like a series system in reliability theory), the availability of end-to-end service A s is the product of the availabilities of each of the components:
A s = i = 1 n A i
where n is the number of levels.
At the apex of multi-tier hierarchy (level i = n ) is the cloud tier. Quantifying cloud service availability depends on numerous architectural factors, including redundancy, failover mechanisms, and distributed deployment across geographically diverse data centers. Detailed analytical modeling of cloud reliability is an active research area, such as in [40]. However, in practice, cloud providers specify availability via service-level agreements (SLAs) with quantified uptime guarantees. Industry standards range from 99% uptime for routine, non-critical services up to “five 9s” (99.999%) or higher availability for mission-critical applications where even rare downtime has unacceptable consequences [41]. Thus, within our multi-tier availability model, the cloud tier availability A m can be represented by a constant value dictated by the SLA tier purchased from the provider rather than requiring an elaborated availability model. This parameterized SLA approach allows flexibility in capturing a range of cloud reliability characteristics in the overall end-to-end quantification.
We can represent the availability of the endpoint as a product of the availabilities along a single path from the top (cloud) to the endpoint. In essence, the availability of the endpoint becomes the product of the availabilities of all the individual connections leading to it, from the top to the bottom of the hierarchy (Figure 4).
Endpoint availability is a crucial metric in multi-tier systems, providing insight into the overall system’s ability to offer service without disruptions. For the multi-tier systems under study, determining endpoint availability can be determined using the following methodology. In the methodology described, availability is assessed step-by-step, factoring in the unique attributes of each hierarchy level and their interactions. The technique involves the next steps:
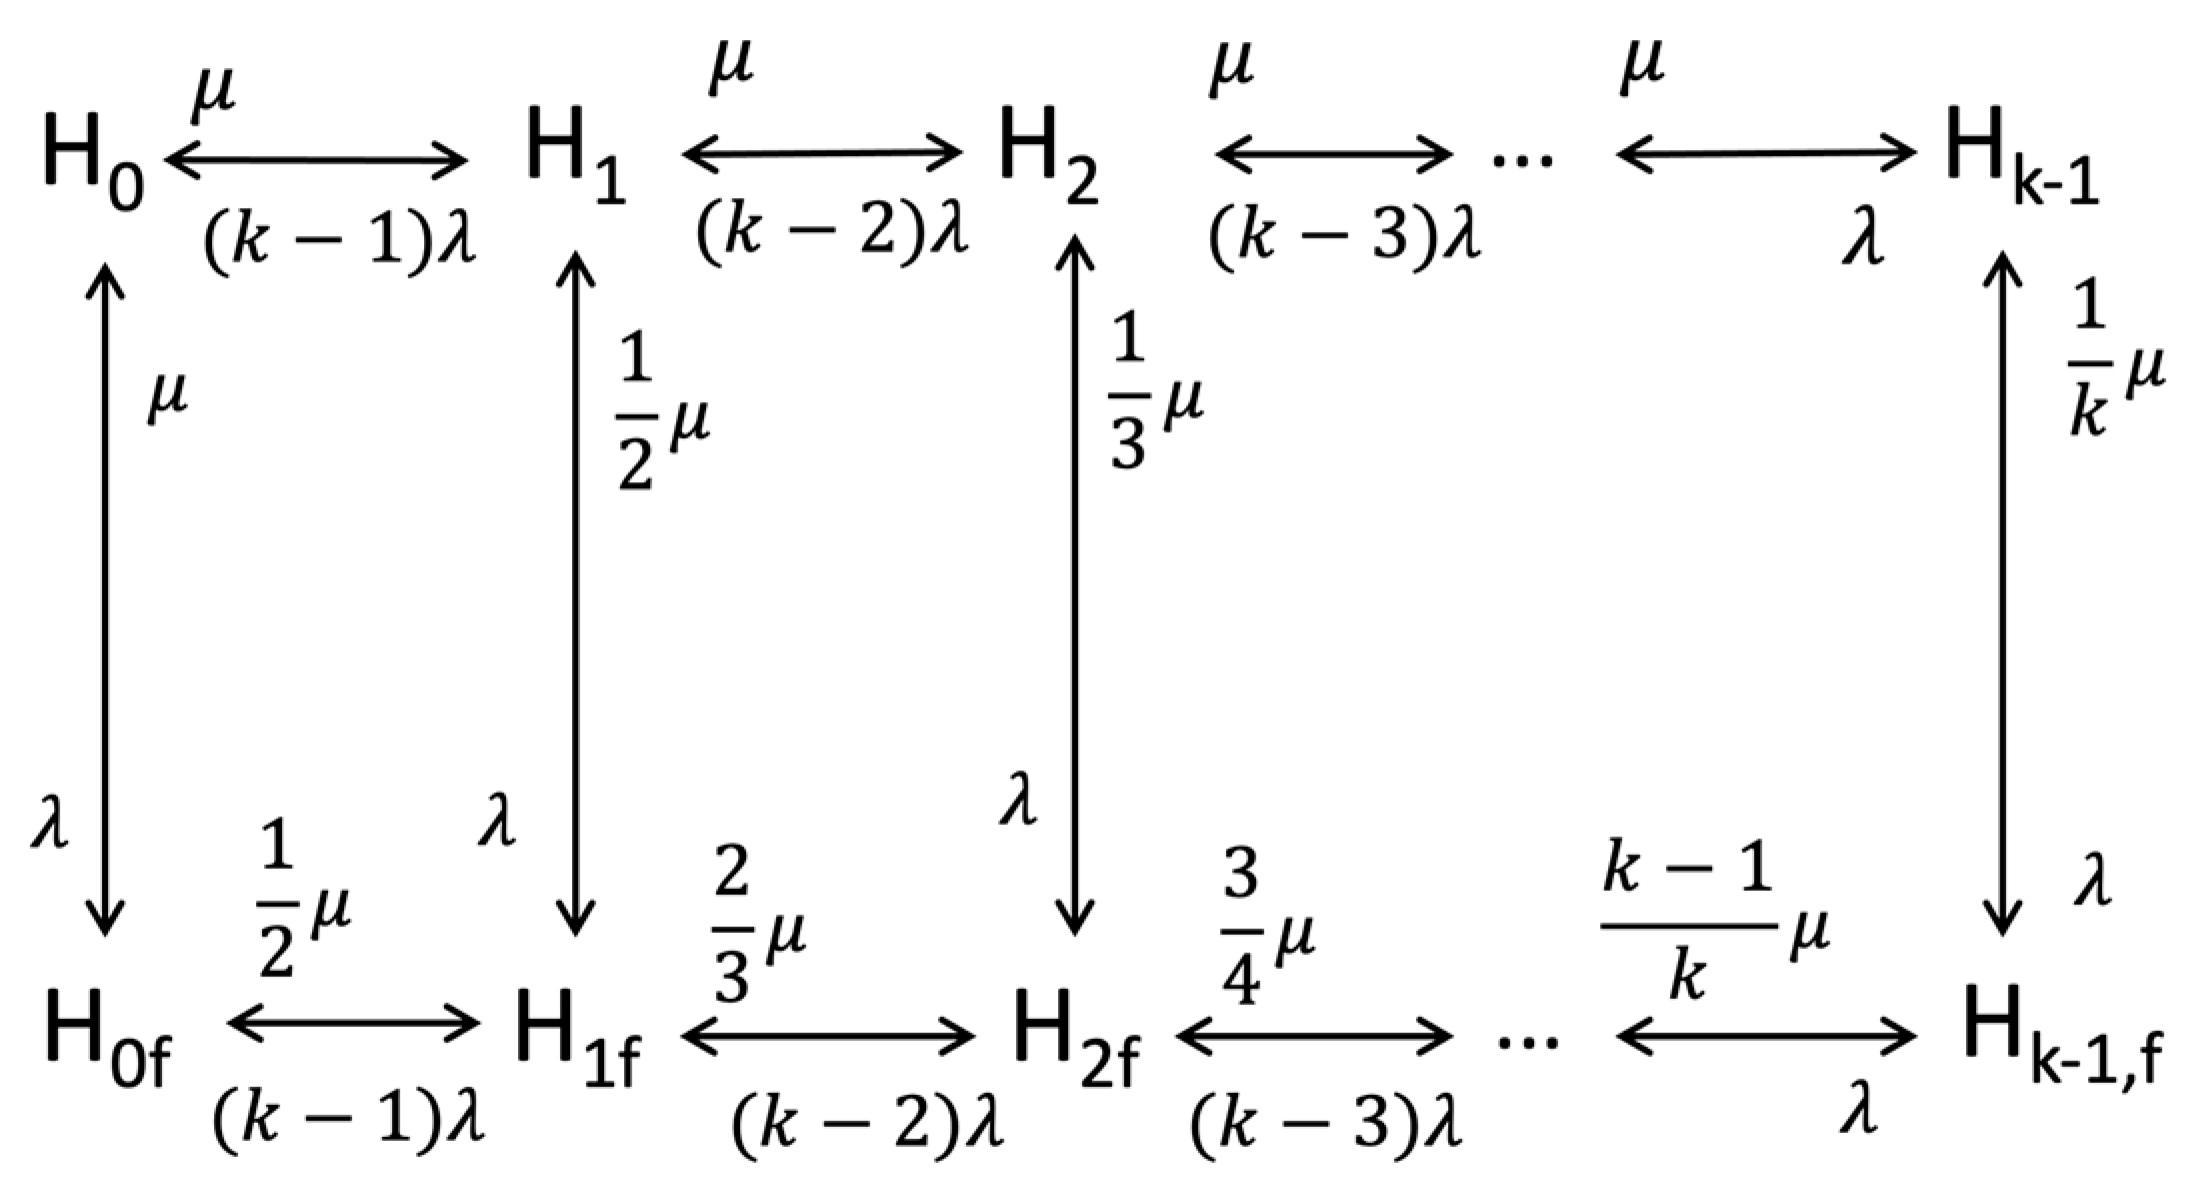
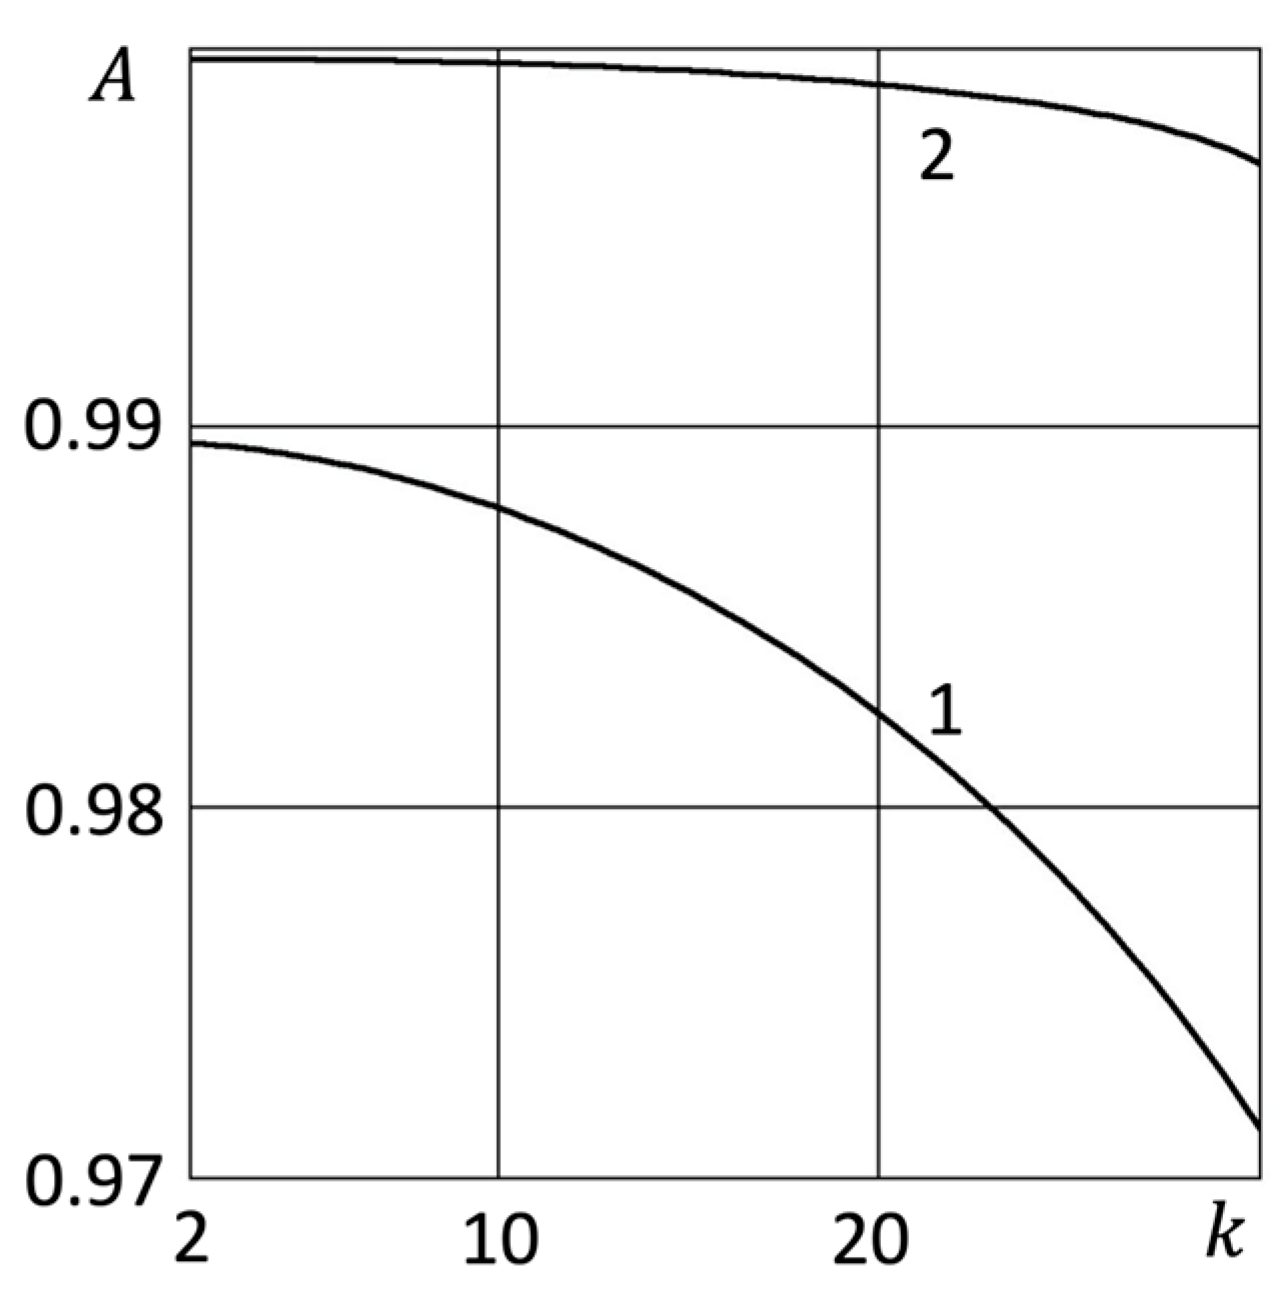
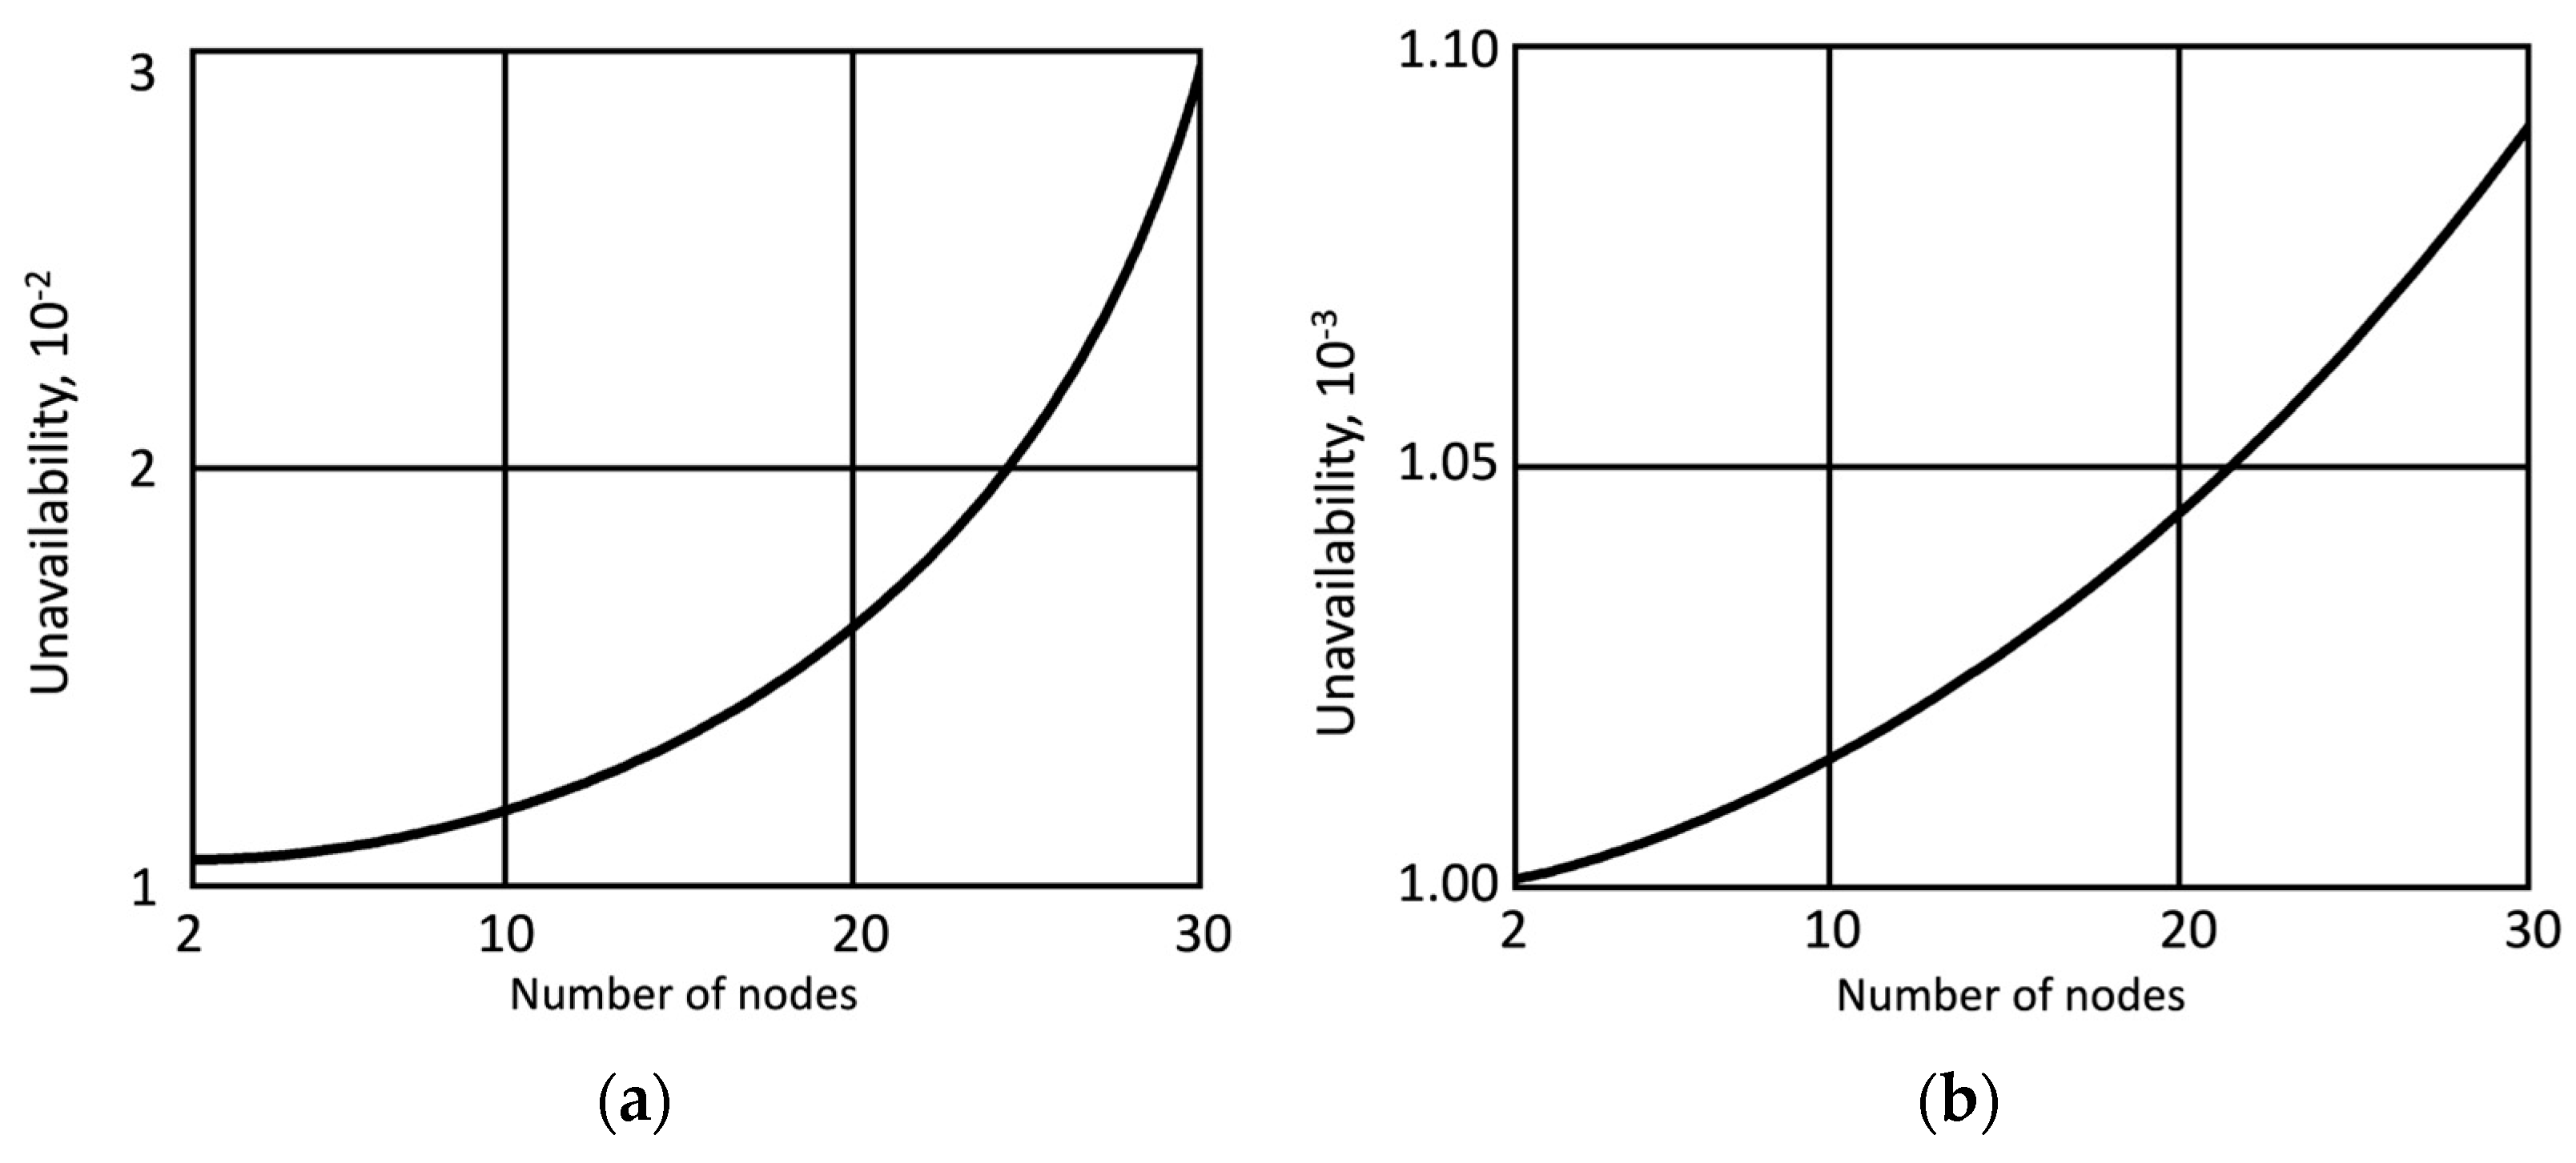
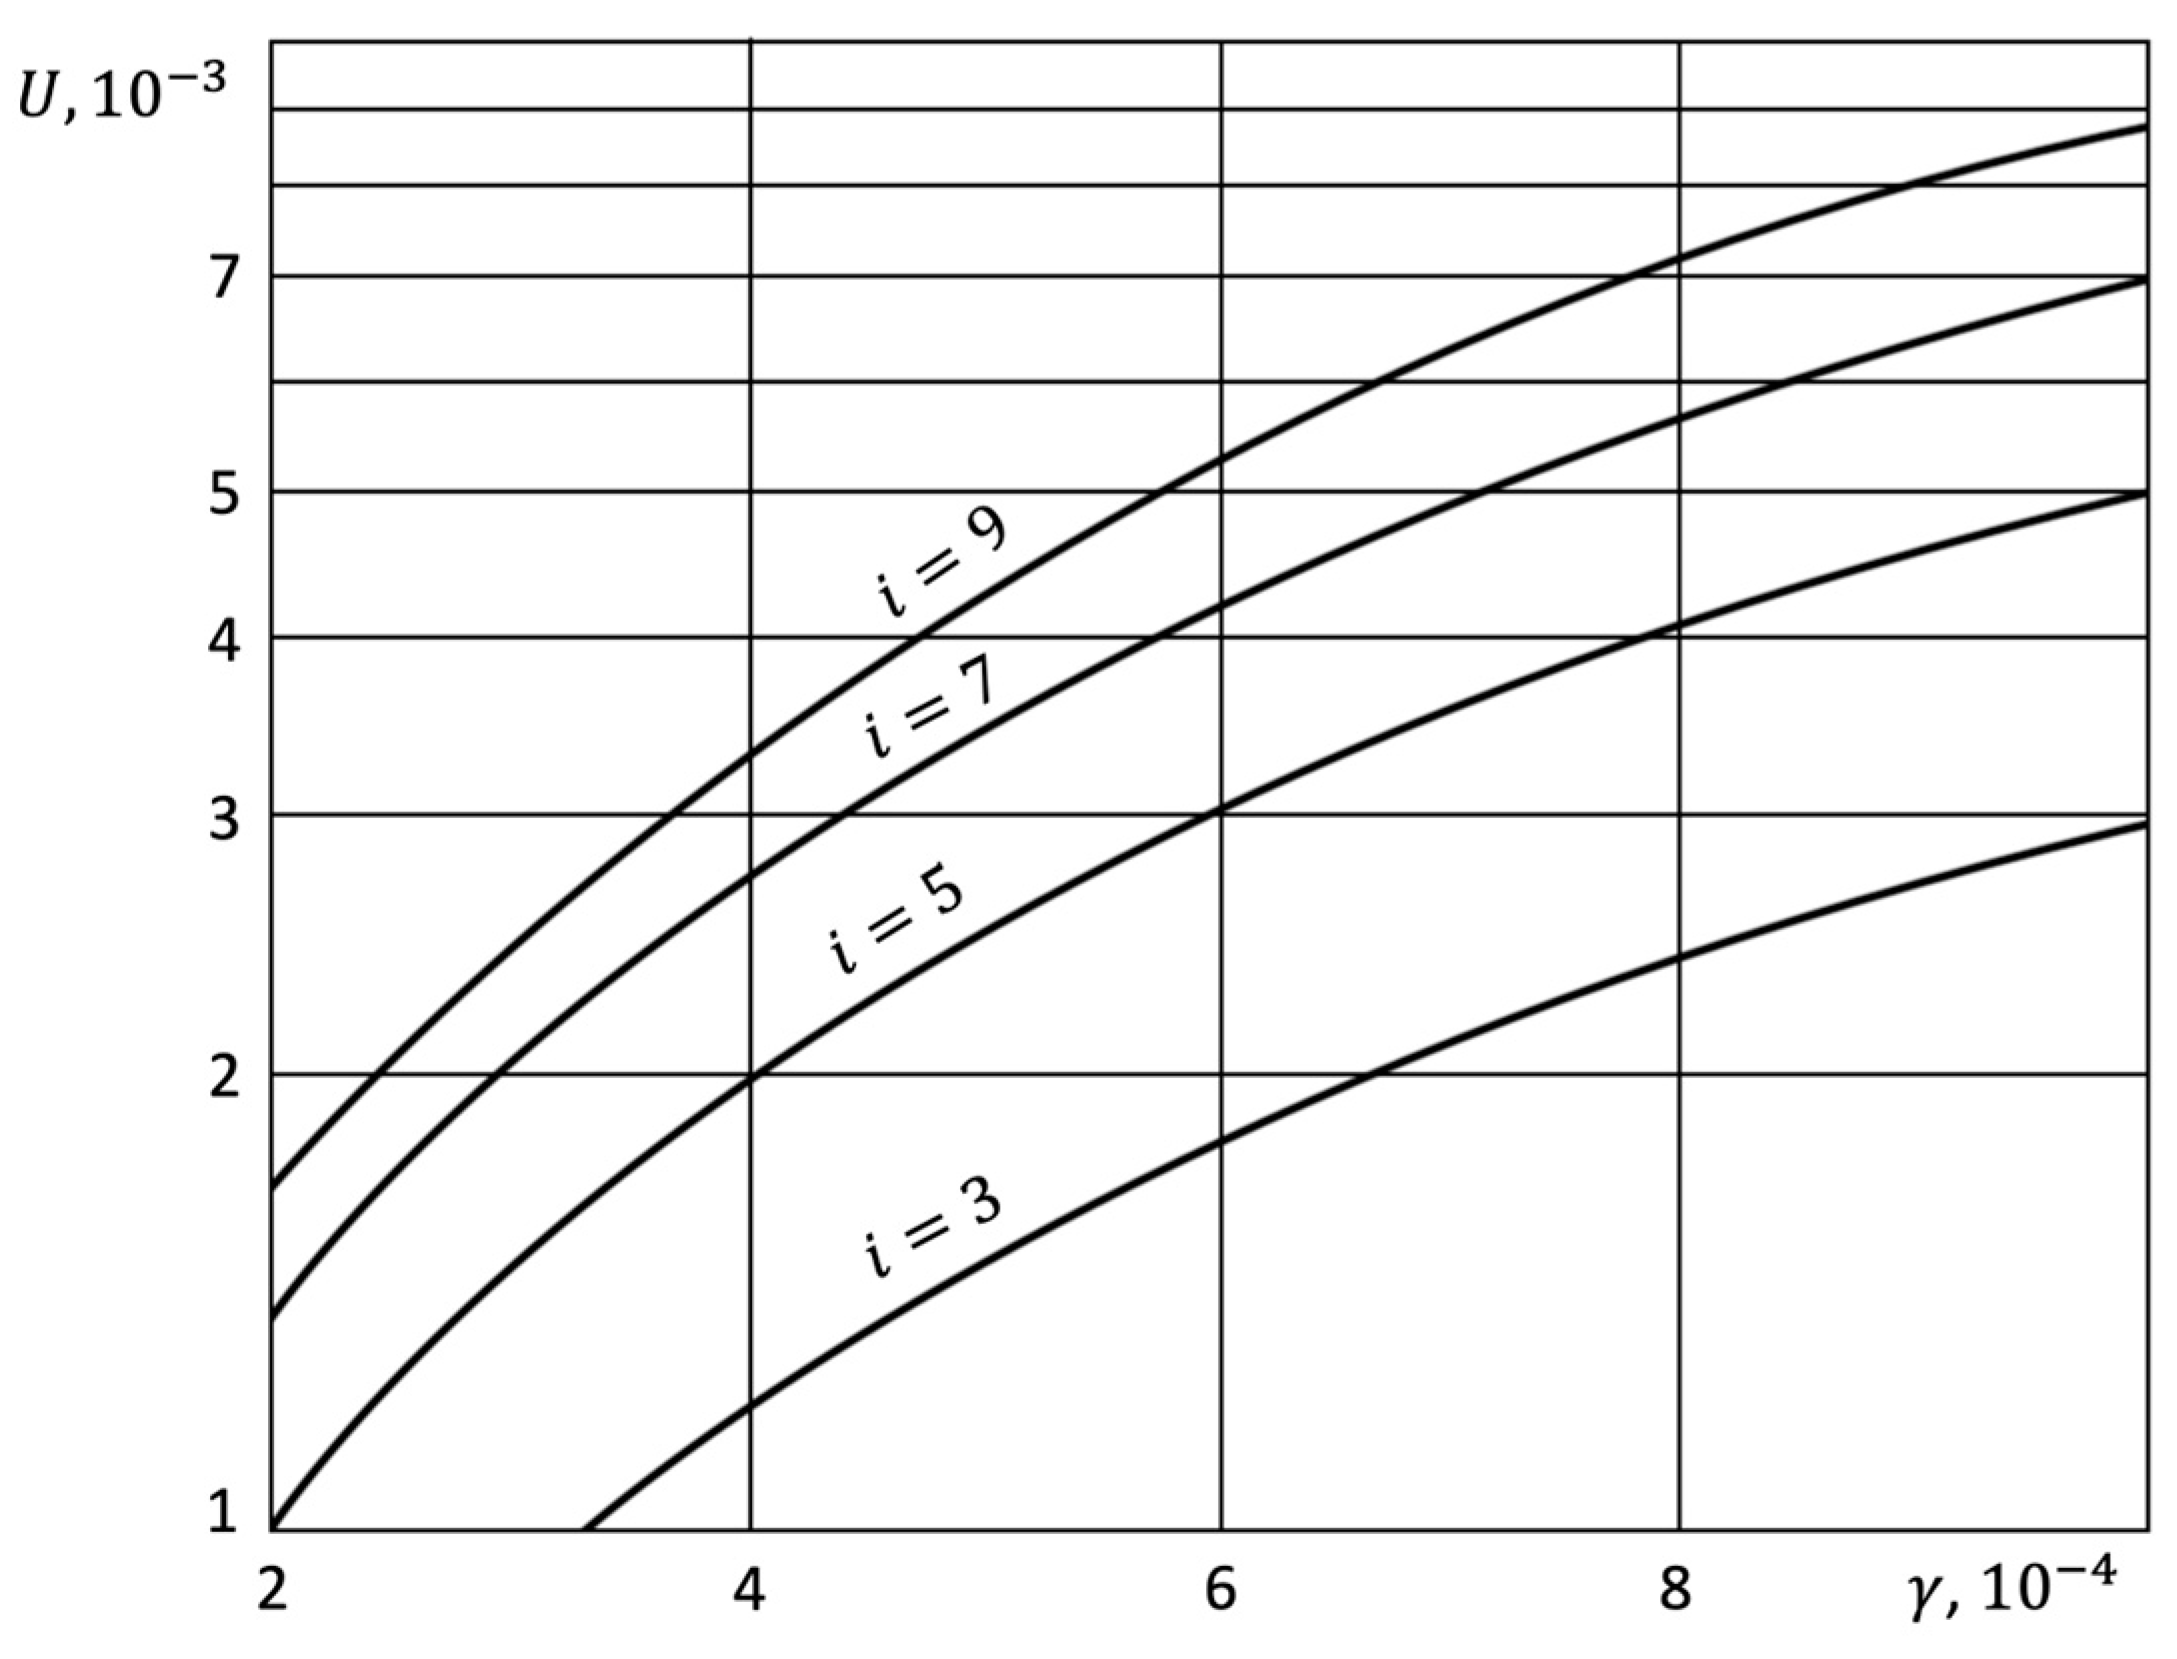
  • Assessing the local availability between an endpoint device and its connected node at the lowest tier using a dedicated two-state Markov chain model representing up and down states. This local availability reflects reliability just for the specific endpoint’s channel, disregarding other endpoints.
  • Iteratively applying the same Markov model at each higher tier to quantify the availability of nodes providing dedicated service to the tier below. Failures of other nodes at a given tier are assumed to not affect service to the endpoint.
  • Taking the product of the local availability values at each tier to derive the overall end-to-end availability for the selected endpoint and service. This combines reliability along the hierarchical service provisioning path.
The model can be adapted to various multi-tier topologies by adjusting the number of tiers and Markov parameters. It provides a probabilistic methodology to assess service availability spanning interconnected heterogeneous network resources.
The Markov model is the key element in the described methodology. Let us develop the specified Markov model for one level of the architecture under consideration and determine the availability of the dedicative service for the endpoint element in this model.
The main interest in this study is the definition of availability of service A i provided to the endpoint node as a dynamic object at the i   ( i = 1 , n 1 ) level.
In practice, when organizing access to user applications, it is of interest to determine the availability of service for a separate dedicated node (marked service in Figure 4). In this case, the user is not interested in the availability of service at all other nodes or IoT devices and applications provided for other users. Let us study the availability A j of a dedicated endpoint service (DES) at the j   ( i = j , n 1 ) level for one selected IoT device.
For a practical important system with l = 1 repair bodies and k nodes at the level of hierarchy architecture under study, the behavior of the examined system is described by the Markov Chain state transition diagram (Figure 5), where H i represents the state with i failed nodes, but the dedicated user service is fault-free, and H i f represents the state with i failed nodes unused by the dedicated user and one failed DES.
Figure 5 illustrates the Markov model for analyzing the availability of a dedicated endpoint service (DES) within a tier of the multi-tier architecture at each level of hierarchy architecture.
The model consists of state H j representing j nodes failed but the DES still working, and state H j f denotes j nodes failed along with failure of the DES. The system can be in state H x with probability p x t | x .
The transitions between states are governed by the failure rate λ and repair rate μ . Both failure and repair transitions are shown between the working and failed DES states.
From working state H j , failure of non-DES nodes lead to a state with a higher index, j . Repairs from state H j f bring the DES back to working state H j .
Solving this continuous-time Markov chain provides the steady-state probabilities of being in each state. The availability of the DES is computed by summing the probabilities of being in operational state H j .
This elegantly captures the reliability characteristics of the DES within its tier environment. Extending this to multiple tiers gives an end-to-end multi-tier availability model.
The flexibility to specify failure and repair rates enables modeling a range of environments from reliable to unstable. This is a core strength of the Markov approach to availability analysis.
On the basis of the diagram (Figure 5), the Chapman–Kolmogorov system of differential equations can be writing in accordance with the general rules [39]:
p 0 t = k λ p 0 t + μ p 1 t + μ p 0 f ( t ) p 1 t = k 1 λ p 0 t k 1 λ + μ p 1 t + μ p 2 t + 1 2 μ p 1 f t p k 1 t = λ p k 2 t λ + μ p k 1 t + 1 k μ p k 1 , f ( t ) p 0 f t = λ p 0 t k 1 λ + μ p 0 f t + 1 2 μ p 1 f ( t )
p 1 f t = λ p 1 t + k 1 λ p 0 f t k 2 λ + μ p 1 f t + 2 3 μ p 2 f ( t ) p k 1 t = λ p k 1 t + λ p k 2 , f t μ p k 1 , f ( t )
The normalizing condition is:
i z p i ( t ) = 1 ,             z = 1 , k 1 ¯ , 0 f , ( k 1 ) f ¯  
For stationary conditions of operation, the system of differential Equations (3) and (4) is transformed into a linear system of equations, in which p i t = 0 ,   i and p i t = P i , i . Steady-state probabilities can be determined in this case in accordance with the general rules [39]:
P i = k 1 ! k i 1 ! γ i P 0 ,                                 1 i k 1
P i , f = k 1 ! ( i + 1 ) k i 1 ! γ i + 1 P 0 ,           0 i k 1
The value of P 0 can be obtained by replacing P i ,   1 , k 1 ¯ and P i , f ,   0 , k 1 ¯ in the normalizing Equation (4):
P 0 = 1 + i = 1 k 1 k 1 ! γ i k i 1 ! + i = 0 k 1 k 1 ! ( i + 1 ) γ i + 1 k i 1 ! 1
Considering the obtained expressions for steady-state probabilities, the availability of the DES at the one hierarchy level is obtained as
A 1 = 1 i , f P i f = a 1 a 1 + a 2 ,  
where:
a 1 = k 1 ! i = 0 k 1 γ i ( k i 1 ) ! ,
a 2 = k 1 ! i = 0 k 1 ( i + 1 ) γ i + 1 k i 1 ! ,
γ = λ / μ
The resulting Equation (5) is generalized for determining the availability of a dedicated endpoint service for other hierarchical levels in the architecture under consideration A i   ( i = 1 ,   n 1 ¯ ) . By consistently determining the availability of service at all levels in accordance with the reliability indicators of their nodes, we can obtain the required service availability in the system by substituting the obtained availability values into Equation (1).
Let us investigate the availability of dedicated user service at the i level in the network in accordance with Equation (5).
Figure 6 shows the availability of a dedicated endpoint service at a single tier in the multi-tier architecture as a function of the number of nodes at that tier.
Two cases with different node reliabilities are presented: 1 represents γ = 0.01 and 2 represents γ = 0.001 , where γ is the ratio of failure to repair rate.
As observed, the availability of the endpoint service decreases as the number of nodes increases, for both reliability cases.
The decreasing trend is logical since more nodes means more potential failure points, reducing overall service availability.
The case with the higher γ value exhibits lower availability overall because of the poorer inherent reliability (higher failure rate).
This demonstrates how the Markov model can quantify the availability of a single tier based on node count and reliability. This tier availability then contributes to the overall multi-tier availability based on the end-to-end path.
The model enables exploring tradeoffs between tier size and reliability targets to meet desired availability thresholds. This is valuable in designing multi-tier systems and validating service-level agreements.
Figure 7 shows the unavailability parameter of unavailability U = 1 A as a function of the number of nodes at a given tier for two different node reliability cases: (a) γ = 0.01 and (b) γ = 0.001 . Higher unavailability corresponds to lower availability.
As observed in both Figure 7a,b, the unavailability increases as the number of nodes increases, demonstrating the reduced availability.
The trends illustrate how adding more potential failure points (nodes) reduces overall service availability, seen through increasing unavailability.
Comparing Figure 7a,b also shows that better node reliability (lower γ ) yields lower unavailability, as expected.
This analysis demonstrates using the Markov model to quantify node relationships between tier size, node reliability, and unavailability/availability metrics.
The model provides a tool to explore tradeoffs between dimension tiers and set reliability requirements to achieve target availability thresholds.
Figure 8 shows the impact of the number of tiers in the multi-tier system architecture on the unavailability of a dedicated endpoint service. Four cases with different numbers of tiers (3, 5, 7, 9) are compared.
Within each architecture, the unavailability is plotted as a function of the reliability of nodes across tiers.
As observed, adding more tiers consistently increases the unavailability of the endpoint service.
The trend illustrates how additional tiers provide more points of potential failure that reduce overall service availability when aggregated end-to-end. The more layers data must traverse from the endpoint to the cloud, the lower the combined reliability.
This demonstrates how the Markov model can provide insight into availability dependencies in complex multi-tier architectures in order to guide design tradeoffs between tier count and functionality factors.
To quantitatively demonstrate the proposed modeling approach, we simulated a four-tier network with the following reliability parameters:
-
Tier 1 (IoT): 10 nodes, γ = 0.01
-
Tier 2 (Edge): 15 nodes, γ = 0.02
-
Tier 3 (Fog): 5 nodes, γ = 0.005
-
Tier 4 (Cloud): Availability = 99.95%
Applying the Markov model methodology, the calculated availability of an endpoint device was 98.51%. Changing the reliability of sensors at the first IoT level of topology to γ = 0.001 improved the availability to 99.88%. Analysis of the obtained values showed that by changing the reliability of the sensors at the first level, it was possible to reduce the unavailability of the end-to-end service by 3.725 times.
These quantitative results showcased the use of the proposed technique to evaluate availability in multi-tier networks under different configurations. The model enables architects to set numerical availability targets and determine required reliability levels and nodes per tier to achieve set goals. Developers can quantify the impact of topology changes and identify upgrade priorities.
The proposed Markov chain modeling approach provides a methodology backed by quantitative analysis capabilities to assess the availability in geographically distributed multi-tier networks. As connectivity expands across heterogeneous systems, this technique offers an effective tool for ensuring robust and reliable service.

5. Discussion

Understanding the availability of dedicated connections in multi-tier systems, particularly using a Markov chain model, offers a distinctive blend of advantages. The approach not only provides robustness in reliability analysis but also ensures that system designers and maintainers have a more granular view of their network.
Each dedicated connection is analyzed in isolation, ensuring that its metrics are pure and unaffected by other system components.
By understanding each connection’s behavior, tailored solutions can be created. Instead of a one-size-fits-all solution that may not address specific weak points, this granular understanding enables targeted interventions.
To demonstrate the advantages of the proposed methodology for multi-tier availability modeling, we can compare it, in general, against prior work using simulation-based approaches and analytical models.
While simulations can provide high-fidelity availability estimates, such techniques are typically computationally intensive and lack analytical tractability. The Markov modeling approach is more efficient and enables mathematical analysis.
Purely analytical methods in the literature often model reliability within isolated tiers but do not capture inter-tier dependencies and cascading failures. The proposed Markov methodology is better equipped to account for cross-tier effects on end-to-end availability.
Some data-driven techniques are restricted to only predicting availability for specific tiers, like edge devices. They have limited generalization capability across complex multi-tier topologies. In contrast, the flexibility of the Markov modeling approach allows it to analyze arbitrary heterogeneous architectures.
The proposed methodology balances model complexity, computational efficiency, mathematical insight, and the ability to assess end-to-end availability across interconnected systems. This makes it well suited for availability analysis in emerging multi-tier networks, in comparison to the limitations of existing techniques.
The methodology can be iteratively applied to various connections across the system. This modular approach means that as the system grows or evolves, the methodology remains relevant and applicable.
By using the same Markov model across various dedicated connections, there is uniformity in how availability is determined. This makes comparisons and aggregations more coherent. The Markov chain model offers predictive insights by analyzing the probability of transitions between states. This provides foresight, allowing stakeholders to prepare for potential downtimes or disruptions.
Understanding the individual availability of dedicated connections can aid in quicker root cause analysis during system outages or disruptions. Instead of sifting through the entire system, the affected connection can be quickly identified and rectified. With a clear understanding of which connections are most and least reliable, resources (both human and technological) can be allocated more efficiently. This prevents wastage and ensures that attention is directed where it is most needed.
The predictive insights from the Markov model can guide preventive maintenance schedules. This can lead to cost savings, as potential disruptions are addressed before they escalate into bigger issues.
While our discussion centers around IoT in multi-tier systems, the methodology is versatile. It can be adapted for various domains and scenarios in which understanding the availability or reliability of individual connections or components is pivotal.
The approach provides foundational data that can be used in more complex system reliability models. For instance, once individual availabilities are understood, they can be incorporated into systemic models that consider interdependencies and cascading effects.
In essence, the proposed approach, centered around the Markov chain model for individual connection availability assessment, blends precision, scalability, and insightful decision-making capabilities. It addresses both the immediate need to understand individual connection behaviors and the broader objective of ensuring overall system health and efficiency.
While the proposed approach offers a multitude of advantages, it is essential to acknowledge its potential limitations to ensure a balanced understanding:
  • The Markov chain inherently assumes that the future state depends only on the current state and not on the sequence of states that preceded it. This “memoryless” property might not always be representative of real-world systems, especially if there are underlying patterns or dependencies that span across multiple states.
  • As the number of states and transitions increases in the system, the complexity of the Markov chain model can grow exponentially. This state explosion can make the model computationally intensive and challenging to manage and interpret.
  • In rapidly evolving systems, transition probabilities might not remain constant over time. If these probabilities change and the model is not correspondingly updated, the predictions and availability calculations could be off the mark.
  • While the approach focuses on the availability of individual connections in isolation, real-world systems often have intricate interdependencies. Ignoring these can lead to an over- or underestimations of system availability.
  • The accuracy of the Markov chain model is heavily reliant on the accuracy and completeness of the input data. Inaccurate or incomplete data can lead to misleading results.
  • Markov chains work with discrete state spaces. If the system has continuous or hybrid states, using a straightforward Markov chain model could be restrictive.
  • For vast multi-tier systems with numerous nodes and connections, the model might become unwieldy, especially if each connection is to be analyzed in detail.
  • The proposed model might oversimplify some aspects of the system, especially if there are nuances or subtleties that do not fit neatly into the Markov chain framework.
While the Markov chain model for assessing individual connection availability in multi-tier systems is a potent tool, it is essential to be aware of its limitations. Careful consideration and supplementary methods might be potentially needed to address these limitations in specific scenarios.
In the burgeoning landscape of interconnected systems, the method of using Markov chains to determine the availability in multi-tier systems not only provides innovative solutions but also sparks a realm of untapped research opportunities.
One of the most imminent avenues is the expansion of our modeling technique. With more deep analysis, the interconnectedness of the nodes and tiers within systems will undoubtedly become more prominent. A deeper dive into understanding the subtle nuances of these connections can lead to a more holistic assessment of availability. Moreover, the shape and structure of the networks themselves, our very topologies, could be pivotal in influencing system availability.
While our approach is generalized, there is immense value in customization. Different sectors, be it healthcare, transportation, or energy, might present unique challenges and requirements. Crafting domain-specific Markov models could enhance accuracy and relevance. Concurrently, there is a treasure trove of insights waiting to be unearthed in researching optimal system configurations tailored for specific applications.
The power of AI could be harnessed to predict future availability, making our systems proactive rather than reactive. Furthermore, leveraging AI for anomaly detection could be a game changer, preemptively identifying and mitigating potential points of failure.
Security, often viewed in isolation, has profound implications for availability. Understanding this interplay is crucial. Moreover, while our model was system-centric, we must not lose sight of the end users. Incorporating metrics like Quality of Experience could make our model more holistic, catering not just to system health but also user satisfaction.

6. Conclusions

In the paper, a methodology is presented for modeling the availability of services in multi-tiered cloud–fog–edge networks, which are becoming pervasive in the evolution towards the future internet. As interconnected systems spanning satellites, aerial platforms, terrestrial infrastructure, and oceanic components continue proliferating, quantifying end-to-end service availability becomes critical.
The proposed Markov modeling approach provides an adaptable tool to assess and optimize reliability across the heterogeneous networks and devices that will comprise the future internet. By evaluating individual tiers and their composition into overall availability, system architects can set quantitative availability targets during design based on application requirements. Operators can benchmark availability to guide enhancements in real-world deployments.
As the scale and complexity of networks grow exponentially, availability modeling using techniques like that developed here may be useful in delivering the ubiquitous, reliable connectivity that users expect. By identifying high-risk points across multi-tier systems, availability modeling helps reinforce the future internet’s fault tolerance and resilience.
As the future internet emerges, reliability modeling will rapidly increase in importance across both research and practical engineering for networks like space–air–ground–ocean architectures. The methodology presented in the paper offers a foundation to support the availability demands of the complex, mission-critical applications to come.
While the proposed Markov chain modeling approach provides a useful methodology for assessing availability in multi-tier networks, there remain opportunities to further enhance the technique and address its limitations. Here are some potential future research directions in this area:
-
The standard Markov chain assumes time-homogeneous transition probabilities. Extension to semi-Markov or time-dependent Markov models could capture temporal variations in failure and repair processes. This could improve the accuracy in non-stationary environments.
-
Individual tier Markov models could be integrated into larger system-level availability models to account for cascading failures between interdependent tiers. Hybrid modeling approaches could also couple Markov chains with complementary simulation, machine learning, or network science techniques.
-
As multi-tier systems evolve, the Markov model should be dynamically updated to reflect changes in transition probabilities and topology. Adaptive Markov chains and reinforcement learning methods could enable self-reconfiguring availability models.
-
While the methodology is generalizable, adapting the Markov model with reliability data and attributes tailored to specific applications and sectors (e.g., telecom, power grid, healthcare) could improve its fidelity.
-
Availability and security are interlinked. Extending the model to account for the impact of threats like cyber attacks on availability could be highly relevant.

Funding

This research received no external funding.

Data Availability Statement

Data sharing not applicable.

Conflicts of Interest

The author declares no conflict of interest.

References

  1. Saeik, F.; Avgeris, M.; Spatharakis, D.; Santi, N.; Dechouniotis, D.; Violos, J.; Leivadeas, A.; Athanasopoulos, N.; Mitton, N.; Papavassiliou, S. Task offloading in Edge and Cloud Computing: A survey on mathematical, artificial intelligence and control theory solutions. Comput. Netw. 2021, 195, 108177. [Google Scholar] [CrossRef]
  2. OpenFog Consortium Architecture Working Group. OpenFog Reference Architecture for Fog Computing; OpenFog Consortium: Piscataway, NJ, USA, 2017; Available online: https://site.ieee.org/denver-com/files/2017/06/OpenFog_Reference_Architecture_2_09_17-FINAL-1.pdf (accessed on 30 August 2023).
  3. Sabella, D.; Hechwartner, R.; Scarrone, E.; Shailendra, S.; Song, J.; Flynn, B.; Ishaq, A.; Velez, L.; Gazda, R.; Jieun, L. Enabling Multi-Access Edge Computing in Internet-of-Things: How to Deploy ETSI MEC and oneM2M; White Paper No. 59; ETSI: Sophia Antipolis, France, 2023; Available online: https://www.etsi.org/images/files/ETSIWhitePapers/ETSI-WP59-Enabling-Multi-access-Edge-Computing-in-iot.pdf (accessed on 30 August 2023).
  4. Zomaya, A.; Abbas, A.; Khan, S. (Eds.) Fog Computing: Theory and Practice; John Wiley & Sons: Hoboken, NJ, USA, 2020. [Google Scholar]
  5. Al-Qamash, A.; Soliman, I.; Abulibdeh, R.; Saleh, M. Cloud, Fog, and Edge Computing: A Software Engineering Perspective. In Proceedings of the 2018 International Conference on Computer and Applications (ICCA), Beirut, Lebanon, 25–27 April 2018; pp. 276–284. [Google Scholar] [CrossRef]
  6. Skarlat, O.; Nardelli, M.; Schulte, S.; Dustdar, S. Towards QoS-Aware Fog Service Placement. In Proceedings of the 2017 IEEE 1st International Conference on Fog and Edge Computing (ICFEC), Madrid, Spain, 14–15 May 2017; pp. 89–96. [Google Scholar] [CrossRef]
  7. Mahmud, R.; Srirama, S.N.; Ramamohanarao, K.; Buyya, R. Quality of Experience (QoE)-Aware Placement of Applications in Fog Computing Environments. J. Parallel Distrib. Comput. 2019, 132, 190–203. [Google Scholar] [CrossRef]
  8. Mas, L.; Vilaplana, J.; Mateo, J.; Solsona, F.; Rius, A.; Melià-Seguí, J. A Queuing Theory Model for Fog Computing. J. Supercomput. 2022, 78, 11138–11155. [Google Scholar] [CrossRef]
  9. Vilaplana, J.; Solsona, F.; Teixidó, I.; Abella, J.; Rius, A. A Queuing Theory Model for Cloud Computing. J. Supercomput. 2014, 69, 492–507. [Google Scholar] [CrossRef]
  10. Panigrahi, S.K.; Goswami, V.; Apat, H.K.; Mund, G.B.; Das, H.; Barik, R.K. PQ-Mist: Priority Queueing-Assisted Mist–Cloud–Fog System for Geospatial Web Services. Mathematics 2023, 11, 3562. [Google Scholar] [CrossRef]
  11. Bai, Y.; Zhang, H.; Fu, Y. Reliability Modeling and Analysis of Cloud Service Based on, Complex Network. In Proceedings of the 2016 Prognostics and System Health Management Conference (PHM-Chengdu), Chengdu, China, 19–21 October 2016; pp. 1–5. [Google Scholar] [CrossRef]
  12. Shahid, M.A.; Alam, M.M.; Su’ud, M.M. Achieving Reliability in Cloud Computing by a Novel Hybrid Approach. Sensors 2023, 23, 1965. [Google Scholar] [CrossRef] [PubMed]
  13. Alshammari, S.T.; Albeshri, A.; Alsubhi, K. Integrating a High-Reliability Multicriteria Trust Evaluation Model with Task Role-Based Access Control for Cloud Services. Symmetry 2021, 13, 492. [Google Scholar] [CrossRef]
  14. Chiang, M.-L.; Huang, Y.-F.; Hsieh, H.-C.; Tsai, W.-C. Highly Reliable and Efficient Three-Layer Cloud Dispatching Architecture in the Heterogeneous Cloud Computing Environment. Appl. Sci. 2018, 8, 1385. [Google Scholar] [CrossRef]
  15. Panicucci, S.; Nikolakis, N.; Cerquitelli, T.; Ventura, F.; Proto, S.; Macii, E.; Makris, S.; Bowden, D.; Becker, P.; O’Mahony, N.; et al. A Cloud-to-Edge Approach to Support Predictive Analytics in Robotics Industry. Electronics 2020, 9, 492. [Google Scholar] [CrossRef]
  16. Peniak, P.; Bubeníková, E.; Kanáliková, A. Validation of High-Availability Model for Edge Devices and IIoT. Sensors 2023, 23, 4871. [Google Scholar] [CrossRef] [PubMed]
  17. Behera, S.R.; Panigrahi, N.; Bhoi, S.K.; Sahoo, K.S.; Jhanjhi, N.Z.; Ghoniem, R.M. Time Series-Based Edge Resource Prediction and Parallel Optimal Task Allocation in Mobile Edge Computing Environment. Processes 2023, 11, 1017. [Google Scholar] [CrossRef]
  18. Abba Ari, A.A.; Djedouboum, A.C.; Gueroui, A.M.; Thiare, O.; Mohamadou, A.; Aliouat, Z. A Three-Tier Architecture of Large-Scale Wireless Sensor Networks for Big Data Collection. Appl. Sci. 2020, 10, 5382. [Google Scholar] [CrossRef]
  19. Stan, O.P.; Enyedi, S.; Corches, C.; Flonta, S.; Stefan, I.; Gota, D.; Miclea, L. Method to Increase Dependability in a Cloud-Fog-Edge Environment. Sensors 2021, 21, 4714. [Google Scholar] [CrossRef]
  20. Alsowail, R.A.; Al-Shehari, T. A Multi-Tiered Framework for Insider Threat Prevention. Electronics 2021, 10, 1005. [Google Scholar] [CrossRef]
  21. Mora-Gimeno, F.J.; Mora-Mora, H.; Marcos-Jorquera, D.; Volckaert, B. A Secure Multi-Tier Mobile Edge Computing Model for Data Processing Offloading Based on Degree of Trust. Sensors 2018, 18, 3211. [Google Scholar] [CrossRef] [PubMed]
  22. Abdulsalam, Y.S.; Hedabou, M. Security and Privacy in Cloud Computing: Technical Review. Future Internet 2022, 14, 11. [Google Scholar] [CrossRef]
  23. Ayedh, M.A.T.; Wahab, A.W.A.; Idris, M.Y.I. Systematic Literature Review on Security Access Control Policies and Techniques Based on Privacy Requirements in a BYOD Environment: State of the Art and Future Directions. Appl. Sci. 2023, 13, 8048. [Google Scholar] [CrossRef]
  24. Aldea, C.L.; Bocu, R.; Solca, R.N. Real-Time Monitoring and Management of Hardware and Software Resources in Heterogeneous Computer Networks through an Integrated System Architecture. Symmetry 2023, 15, 1134. [Google Scholar] [CrossRef]
  25. González, I.; Calderón, A.J.; Portalo, J.M. Innovative Multi-Layered Architecture for Heterogeneous Automation and Monitoring Systems: Application Case of a Photovoltaic Smart Microgrid. Sustainability 2021, 13, 2234. [Google Scholar] [CrossRef]
  26. Fraser, I.J.; Müller, M.; Schwarzkopf, J. Transparency for Multi-Tier Sustainable Supply Chain Management: A Case Study of a Multi-tier Transparency Approach for SSCM in the Automotive Industry. Sustainability 2020, 12, 1814. [Google Scholar] [CrossRef]
  27. Hamdan, S.; Ayyash, M.; Almajali, S. Edge-Computing Architectures for Internet of Things Applications: A Survey. Sensors 2020, 20, 6441. [Google Scholar] [CrossRef]
  28. Gomes, E.; Costa, F.; De Rolt, C.; Plentz, P.; Dantas, M. A Survey from Real-Time to Near Real-Time Applications in Fog Computing Environments. Telecom 2021, 2, 489–517. [Google Scholar] [CrossRef]
  29. Huynh, L.N.T.; Pham, Q.-V.; Pham, X.-Q.; Nguyen, T.D.T.; Hossain, M.D.; Huh, E.-N. Efficient Computation Offloading in Multi-Tier Multi-Access Edge Computing Systems: A Particle Swarm Optimization Approach. Appl. Sci. 2020, 10, 203. [Google Scholar] [CrossRef]
  30. Costa, D.G.; Vasques, F.; Portugal, P.; Aguiar, A. A Distributed Multi-Tier Emergency Alerting System Exploiting Sensors-Based Event Detection to Support Smart City Applications. Sensors 2020, 20, 170. [Google Scholar] [CrossRef] [PubMed]
  31. Jaiswal, R.; Davidrajuh, R.; Rong, C. Fog Computing for Realizing Smart Neighborhoods in Smart Grids. Computers 2020, 9, 76. [Google Scholar] [CrossRef]
  32. Alam, M.S.; Kurt, G.K.; Yanikomeroglu, H.; Zhu, P.; Đào, N.D. High Altitude Platform Station Based Super Macro Base Station Constellations. IEEE Commun. Mag. 2021, 59, 103–109. [Google Scholar] [CrossRef]
  33. Lu, Y.; Wen, W.; Igorevich, K.K.; Ren, P.; Zhang, H.; Duan, Y.; Zhu, H.; Zhang, P. UAV Ad Hoc Network Routing Algorithms in Space–Air–Ground Integrated Networks: Challenges and Directions. Drones 2023, 7, 448. [Google Scholar] [CrossRef]
  34. Liao, Z.; Chen, C.; Ju, Y.; He, C.; Jiang, J.; Pei, Q. Multi-Controller Deployment in SDN-Enabled 6G Space–Air–Ground Integrated Network. Remote Sens. 2022, 14, 1076. [Google Scholar] [CrossRef]
  35. Qiu, Y.; Niu, J.; Zhu, X.; Zhu, K.; Yao, Y.; Ren, B.; Ren, T. Mobile Edge Computing in Space-Air-Ground Integrated Networks: Architectures, Key Technologies and Challenges. J. Sens. Actuator Netw. 2022, 11, 57. [Google Scholar] [CrossRef]
  36. Cui, H.; He, H.; Zhou, J.; Li, Q.; Wang, Q.; Niu, J.; Zhang, Y. Space-Air-Ground Integrated Network (SAGIN) for 6G: Requirements, Architecture and Challenges. China Commun. 2022, 19, 90–108. [Google Scholar] [CrossRef]
  37. Xu, Q.; Su, Z.; Li, R. Security and Privacy in Artificial Intelligence-Enabled 6G. IEEE Netw. 2022, 36, 188–196. [Google Scholar] [CrossRef]
  38. Trivedi, K.; Bobbio, A. Reliability and Availability Engineering: Modeling, Analysis, and Applications; Cambridge University Press: Cambridge, UK, 2017. [Google Scholar]
  39. Rubino, G.; Sericola, B. Markov Chains and Dependability Theory; Cambridge University Press: Cambridge, UK, 2014. [Google Scholar]
  40. Bauer, E.; Adams, R. Reliability and Availability of Cloud Computing; Wiley-IEEE Press: Hoboken, NJ, USA, 2012. [Google Scholar]
  41. Federal Aviation Administration. Reliability, Maintainability, and Availability (RMA) Handbook; FAA-HDBK-006A; Federal Aviation Administration: Washington, DC, USA, 2008.
Figure 1. Traditional cloud–fog–edge architecture.
Futureinternet 15 00329 g001
Figure 2. Space–Air–Ground Integrated Network.
Futureinternet 15 00329 g002
Figure 3. The multi-level cloud–fog–edge architecture.
Futureinternet 15 00329 g003
Figure 4. Endpoint path as individual connections of device from IoT level to cloud level (from the top to the bottom of the architecture hierarchy).
Futureinternet 15 00329 g004
Figure 5. Markov Chain state transition diagram.
Futureinternet 15 00329 g005
Figure 6. The availability of service at one level.
Futureinternet 15 00329 g006
Figure 7. The unavailability parameters for (a) γ = 10 2 and (b) γ = 10 3 .
Futureinternet 15 00329 g007
Figure 8. Impact of the number of tiers on the unavailability of a dedicated endpoint service in the multi-tier system architecture.
Futureinternet 15 00329 g008
Table 1. Assignment of levels in three-level cloud–fog–edge architecture.
LevelLocationFunctionalityCommunication
Cloud LevelData centers that can be continents away from the data source.Houses vast computational resources, data storage, and advanced analytics tools. Ideal for complex operations and long-term data storage.Primarily communicates with the fog layer, receiving aggregated or processed data, and sending back processed insights or commands.
Fog LevelTypically within the local network infrastructure, e.g., in gateways, routers, and local network nodes.Offers intermediate processing capabilities, often handling tasks like data aggregation, preliminary analytics, and local storage. It can offload some of the immediate processing needs from the edge while filtering and reducing the amount of data sent to the cloud.Acts as a two-way bridge, communicating with the cloud for more advanced processing or updates and with the edge to receive raw data or to send immediate commands.
Edge LevelTypically located close to the data source, possibly within the same premises or even embedded within devices.Immediate processing of data: because of the proximity to the data source, edge devices can process data almost instantly, making them crucial for time-sensitive applications.
Decentralized decision-making: they can make on-the-spot decisions based on the data they collect, without necessarily having to send it to a centralized system.
Primarily communicates with nearby devices or systems.
Can send summarized or processed data back to the fog or cloud layers for further processing or storage.
Suitable for intermittent connectivity—not always required to be online.
IoT LevelIntegrated into our daily environment, from our homes and workplaces to public spaces. These are the endpoints of data collection.Raw data collection: IoT devices primarily function as data collectors, sensing changes in their environment and reporting them.
Limited processing: Some IoT devices have the ability to minimally process data, deciding what is worth sending forward in the network hierarchy.
IoT devices usually communicate data to the edge level, which might be a local gateway or processing unit. This communication might be continuous or event-driven (i.e., only when a change is detected).
Uses low-power communication protocols like Zigbee, LoRaWAN, or BLE (Bluetooth Low Energy) for short-range transmissions.
Table 2. Layers of the satellite communication system.
Layer of Space DomainProximityCharacteristics and FunctionsApplications
LEO LayerClosest to the Earth, typically at altitudes between 160 and 2000 km.Quick data transmission due to low latency, high-resolution Earth imaging. Often involves constellations for continuous global coverage.Internet service in remote areas, Earth observation, space research, and scientific studies.
MEO LayerOccupying a mid-range altitude, typically between 2000 and 35,786 km.Acts as a bridge between the closeness of LEO and the wide coverage of GEO, balancing latency and coverage.Primarily home to global navigation satellite systems (GNSS) like GPS, GLONASS, and Galileo. Also utilized for certain communication purposes, especially in areas lacking infrastructure.
GEO LayerPositioned at an altitude of exactly 35,786 km above the equator.Provides a fixed view of a particular region of the Earth, facilitating continuous coverage of that region.Ideal for stable communication links, TV broadcasting, weather monitoring, surveillance, and defense systems.
Disclaimer/Publisher’s Note: The statements, opinions and data contained in all publications are solely those of the individual author(s) and contributor(s) and not of MDPI and/or the editor(s). MDPI and/or the editor(s) disclaim responsibility for any injury to people or property resulting from any ideas, methods, instructions or products referred to in the content.

