Article

Clinical Screening Prediction in the Portuguese National Health Service: Data Analysis, Machine Learning Models, Explainability and Meta-Evaluation

1
Department of Computer Science, University of Évora, 7000-671 Évora, Portugal
2
Centro Algoritmi, Vista Lab, University of Évora, 7000-671 Évora, Portugal
3
Department of Computer Science, Zhongyuan University of Technology, Zhengzhou 450007, China
4
CIDEHUS, University of Évora, 7000-809 Évora, Portugal
5
Department of Mathematics, University of Évora, 7000-671 Évora, Portugal
6
CIMA—Centro de Investigação em Matemática e Aplicações, University of Évora, 7000-671 Évora, Portugal
7
Serviços Partilhados do Ministério da Saúde, 1050-099 Lisboa, Portugal
*
Authors to whom correspondence should be addressed.
Future Internet 2023, 15(1), 26; https://doi.org/10.3390/fi15010026
Submission received: 10 November 2022 / Revised: 8 December 2022 / Accepted: 16 December 2022 / Published: 3 January 2023
(This article belongs to the Special Issue Internet of Things (IoT) for Smart Living and Public Health)

Abstract

:
This paper presents an analysis of the calls made to the Portuguese National Health Contact Center (SNS24) during a three years period. The final goal was to develop a system to help nurse attendants select the appropriate clinical pathway (from 59 options) for each call. It examines several aspects of the calls distribution like age and gender of the user, date and time of the call and final referral, among others and presents comparative results for alternative classification models (SVM and CNN) and different data samples (three months, one and two years data models). For the task of selecting the appropriate pathway, the models, learned on the basis of the available data, achieved F1 values that range between 0.642 (3 months CNN model) and 0.783 (2 years CNN model), with SVM having a more stable performance (between 0.743 and 0.768 for the corresponding data samples). These results are discussed regarding error analysis and possibilities for explaining the system decisions. A final meta evaluation, based on a clinical expert overview, compares the different choices: the nurse attendants (reference ground truth), the expert and the automatic decisions (2 models), revealing a higher agreement between the ML models, followed by their agreement with the clinical expert, and minor agreement with the reference.

1. Introduction

The Portuguese National Health Contact Center, called SNS24, is a national telephone and digital public service in Portugal, supplied by trained nurses, that delivers clinical services for citizens.
When receiving a call, and according to the citizen’s medical history and self-reported symptoms, the nurse selects the most appropriate clinical pathway. This pathway leads to five possible final referrals: transference to Poison Information Center (PIC), transference to the National Medical Emergency Institute (INEM), clinical assessment in hospital emergency or at a primary health care unit, and self-care.
During the triage, nurses ensure that the main symptoms reported are registered and considered for the correct choice of the clinical pathway, which, in place, determine the final referral. As other triage protocols such as the Manchester Triage System [1], these pathways use a risk-averse system prioritisation. For this reason, SNS24 service has an important role in the National Health Service since allows a close connection with citizens in their home places and, according to their symptoms, a specialist analysis upon their clinical situation and decision about the most appropriate referral.
Clinical pathways are developed by health professionals and approved by the General Directorate of Health (DGS). During the period of this study, the number of existent clinical pathways was 54, ranging from “Cough” or “Abdominal Pain” to “Allergy”.
The SNS24 Scout.AI project aims at applying Artificial Intelligence methodologies in the construction of decision support tools to help nurses in selecting the most appropriate clinical pathway and to support DGS in the process of optimising the design of clinical pathways and respective referrals.
This study presents the work developed during the second year of the project, which extends and elaborates on previous experiments using three years of receiving calls, in a total of around 2,577 millions of records. In [2], a preliminary study using different text representations and shallow ML classification algorithms is presented while in [3] a thorough analysis of Deep Neural Network (DNN) models is exposed. Both studies use a subset of data composed of 3 months calls (with around 270,000 records).
Differently from these previous works, the current one presents a detailed characterisation of the data, a comparison between both approaches along with a new comprehensive analysis of the results, regarding errors per class, model explainability and a meta-evaluation made by an clinical expert.
The main contributions of this paper are summarised as follows:
  • a characterisation of 3 years SNS24 calls;
  • a thorough comparison of different Machine Learning models to select the most appropriate clinical pathway;
  • a comprehensive analysis of the results including classification and execution time performance, per class error analysis, explainability of decisions and experts’ meta-evaluation.
The rest of the paper is organised as follows: in Section 2, the related work is discussed, and, to support the choices of the conducted experiments, the machine learning models that have been usually employed and evaluated in clinical decision support systems are pointed out; Section 3 presents the materials and methods: the data, the features used, the prediction techniques and how experiments were organized; Section 4 presents the results, first giving an overview of the main findings regarding the data analysis to help better understand the problem, then evaluating the prediction models; Section 5 looks deeper into the results reported, presenting an error analysis, discussing how decisions are made for some specific examples through the use of an explainability method, and providing a meta evaluation performed by domain specialists; and finally, conclusions are presented in Section 6.

2. Related Work

Machine Learning (ML) and Natural Language Processing (NLP) have recently shown important progress in applications such as clinical decision support systems by improving the quality of information processing from clinical narratives [4,5,6,7,8,9].
In the literature we find approaches to health care data that are based on unsupervised ML models. Funkner et al. [10], propose a data-driven prediction model of clinical pathways for patient staying at hospitals: patients are clustered according to their movements (clinical paths) in a hospital; then, a decision tree is used to explore the existing diversity of patients’ clinical pathways. In [11], Simulation Modeling and ML are used for the purpose of designing pathways and evaluating the return on investment, having a elderly hip-fracture care scheme as use case. Almeida et al. [12] exploit the historical component of the patient trajectory to improve the performance of clinical decision support systems; by automatically extracting information from patient medical notes they aim to assimilate detailed relevant patient information and provide recommendations during clinical treatments.
Our approach, on the other hand, considers supervised models for the task of text classification. In this type of task, different paradigms and algorithms are often considered [13], and there is an objective way of measuring systems accuracy.
Traditional approaches usually represent text as a bag-of-words, using a specific weighting scheme, with the most used one being TF-IDF (Term Frequency—Inverse Document Frequency); a possible generalization is using bags of n-grams. More recently, word embeddings [8] are being used to represent text, where each word is represented by a vector (of a specific size) instead of a number.
As commonly known, each particular problem and dataset may have a preferred model, with no optimal general algorithm choice [14]. In this way, there are many works comparing approaches and experiment designs. One example is Mascio et al.´s work [15], where alternative classification algorithms and various word representations are compared regarding applications involving clinical texts.
Support Vector Machines (SVM) and Deep Learning (DL) architectures usually present the best evaluation results [6,7,16] on evaluations performed on clinical decision support problems [17]. One known difference between these two approaches is that using ML methods (such as SVM) often requires feature engineering efforts, as these features are not learned automatically in the process. On the other hand, DL based methods have shown powerful feature learning capabilities. The literature presents many comparisons of these two types of approaches. Baker et al. [18] deal with text classification on a cancer dataset. They showed that a Convolution Neural Network (CNN) model, with fine-tuned hyper-parameters, initialisation and training process, achieved better performance than an SVM model based on engineered features.
Flores et al. [19] present extensive comparisons of alternative models, such as active learning, SVM, Naïve Bayes, and a BERT classifier applied to biomedical datasets. They found that the active learning approach reduced the number of training examples necessary for achieving the same performance of the other classifiers. Other experimental results [20] show that Bidirectional Encoder Representations from Transformers (BERT) models did not achieve better performance when compared to CNN and Hierarchical Self Attention Networks (HiSAN) models.
Besides making efficient predictions, it is very important to analyse the data and explain the predictions made by the algorithm, particularly in this area of application [21,22]. In a different way from what was found in the literature, this work presents a detailed analysis of the data, since it is useful to better understand the characteristics and the issues regarding the learned models. Data analysis is also important for the clinical team to find (new) insights from the phone calls received along the years and the way those calls are being handled.
Regarding the classification task, and following the tendencies seen in the related work, this work presents a comparative study of the two most evident methods found in the literature: SVM and CNN. Moreover, a detailed analysis of the results, explainability of the models, and a meta evaluation of errors are presented.

3. Materials and Methods

This section introduces the materials, including a characterisation of datasets, and the methods: the conducted data analysis, the prediction task and the experiments organisation.

3.1. Materials

The datasets used in these experiments correspond to the information collected from the phone calls of triage type received by the SNS24 line throughout different periods of time. These records include personal data (such as age, gender, encrypted primary care unit, county and district of the call, between others), call data (start and end date/time, initial intention, comments, contact reason, clinical pathway and final disposition, between others) and triage agent encrypted id and decisions.
The data, provided by SPMS (Serviços Partilhados do Ministério da Saúde), the public business entity which provides specific shared services in the health area to establishments and services of the Portuguese National Health Service (SNS), was anonymised and the study protocol was approved by the competent ethics committee.

3.1.1. Three-Month Data

The three-month data, available in the beginning of the project and used on previous studies, included a total of 269,663 records dated from January to March 2018. It was composed of 18 different attributes and 53 clinical pathways.
For building the dataset, clinical pathways with less than 50 instances were removed from the original data, resulting in a dataset with 269,654 instances and 51 clinical pathways for classification.

3.1.2. Three-Year Data

The three-year data, a superset of the three-month data, was made available later and comprised records dated from January 2017 to December 2019. It was composed of a total of 64 attributes and examples from 54 pathways from the 59 possible ones. A similar procedure was performed by removing pathways with less than 100 instances, resulting in a dataset of 53 different pathways with a total of 2,577,517 instances.
The proportion of observations per clinical pathway is diverse, ranging from 10.68% for “Cough” to 0.01% for “Heat-related problems”; 4 clinical pathways have proportions above 5%, and 25 have less than 1%. The possible clinical pathways and the corresponding number of calls (in each of the three years of study) are listed in Table A1 in Appendix A.

3.1.3. Features under Analysis

Besides “Contact Reason”, previous studies considered other available information (age, time and day of the week of the call, and comments) for building classification models but no better results were obtained. Building upon those results, the classification models will consider only the “Contact Reason” attribute and the corresponding clinical pathway (selected by the nurse). “Contact Reason” is a medium length text attribute, written in Portuguese by the technician who answered the call, containing the most relevant information about the patient’s condition; it is composed of a maximum of 25 words and the average number of words is 8.27. Table 1 presents a few examples of the “Contact Reason” attribute (the original Portuguese text is written in italics following the corresponding translation to English) and the corresponding clinical pathway (one for each of the 10 most common pathways).
The following attributes were further considered to characterize the population using the SNS24 service: gender, age, date and time of the call, district of the call, and final referral.

3.2. Methods

As mentioned before, the present work builds upon the 3 years data, including a detailed characterisation of the data and a comparison between SVM and CNN enlarged models including a comprehensive analysis of the model performance, errors per class, model explainability and a meta-evaluation made by an clinical expert.

3.2.1. Data Characterisation

Carefully analysing the data is useful not only to understand the profile of the calling citizens but also for the SPMS team to get new insights over the phone calls received along the years and the way those are being handled. Thus, it was agreed to analyse the following information: distribution of calls per clinical pathway, per gender, per relation of the caller with the citizen, per district, per age of citizen (general and for the 10 most frequent pathways), per hour of the day, day of week and month of year (general and for the the 10 most frequent pathways). Moreover, an analysis of the distribution of referrals per pathway was also done.

3.2.2. Pathway Prediction

SNS24 calls are received by nurses that, after an initial assessment (pre-triage) that enables the detection of emergent situations, follow predefined clinical pathways. The outcome of a pathway is a referral (transference to PIC, transference to INEM, clinical assessment in hospital emergency or at a primary health care unit and self-care) that can be changed by the nurse.
Self reported symptoms and signs, as well as relevant information provided on medical history are considered for the selection of the most appropriate clinical pathway. This choice is extremely relevant since it should have the discriminant capability for not sending to Hospitals Emergency situations of low clinical risk and, most importantly, ensure safety by identifying all situations that demand urgent medical contact.
Since, in the course of a call, nurses need to choose a specific clinical pathway, this problem can be seen as a multi-class classification task where the “Clinical pathway” is the class to be predicted.
The “Contact Reason” text was processed to get 2 different representations aiming to weight the importance of a word in the prediction task: the traditional TF-IDF representation (which determines the importance of a word in the text within the corpus) and a locally trained word embedding (word embeddings map the words into a low-dimensional continuous space encoding their semantic and syntactic information by assuming that words in similar contexts should have similar meanings [23]).
The ML algorithms chosen to build the prediction models were SVM and CNN. This selection was made considering the previous work developed over a 3 month data period. In [2] Random Forests, SVM with linear and RBF kernels SVM and Multinomial Naïve Bayes were tested with different text representations (TF-IDF with different n-grams and BERT [24] and Flair [25] embeddings); linear SVM with Flair embedding model reached the highest performance. In [3], a comparison between several DNN architectures (CNN, RNN and Transformers, namely BERTimbau Base BERT model for Portuguese [26], based architectures) was made using locally trained word embeddings with a 200-dimension vector; the transformers based architecture reached the best performance. The RBF kernel SVM algorithm and the CNN based architecture were chosen for this work because they presented the best compromise between model performance and the time needed to build the models.
Following the setup from previous experiments, a SVM with standard RBF kernel with default parameters using TF-IDF to represent text [2] and a CNN based architecture with locally trained word embeddings [3] were used. The CNN architecture used was a classical convolutional neural network for text classification described by Yoon Kim [27] and was composed of 4 hidden layers: convolutional, max-pooling, fully connected and dropout layers. The convolution layer’s settings were as follows: filters = 128, kernel_size = 3, activation = ‘relu’; the dense layer’s settings were as follows: batch_size = 128, activation = ‘relu’; the settings of the dropout layer [28] were as follows: dropout_rate = 0.3; and finally, the ADAM optimizer [29] was selected with patience = 5 and learning_rate = 10 4 .
Scikit-learn (v1.2) [30], TensorFlow (v2.2) [31], Pytorch (v1.8) [32] and Python (v3.8) [33] were the libraries used to build the ML models.

3.2.3. Experiment Organisation

Experiments were set up to assess the impact of larger datasets and older models in the model performance. For that, the 2019 data was kept for testing and 3 training sets were built: one with 2017 data, one with 2018 data and one with 2017-2018 data. Moreover, the 3 months models obtained in the previous studies [2,3] were also tested over the 2019 data.
The prediction performance was assessed using balanced accuracy (recall, sensitivity), precision (positive predictive value) and F1 measures; an analysis of the prediction time of each model was also made.

4. Results

This section presents and discusses the results obtained concerning the characterisation of the population that use the SNS24 service and the clinical pathway prediction models.

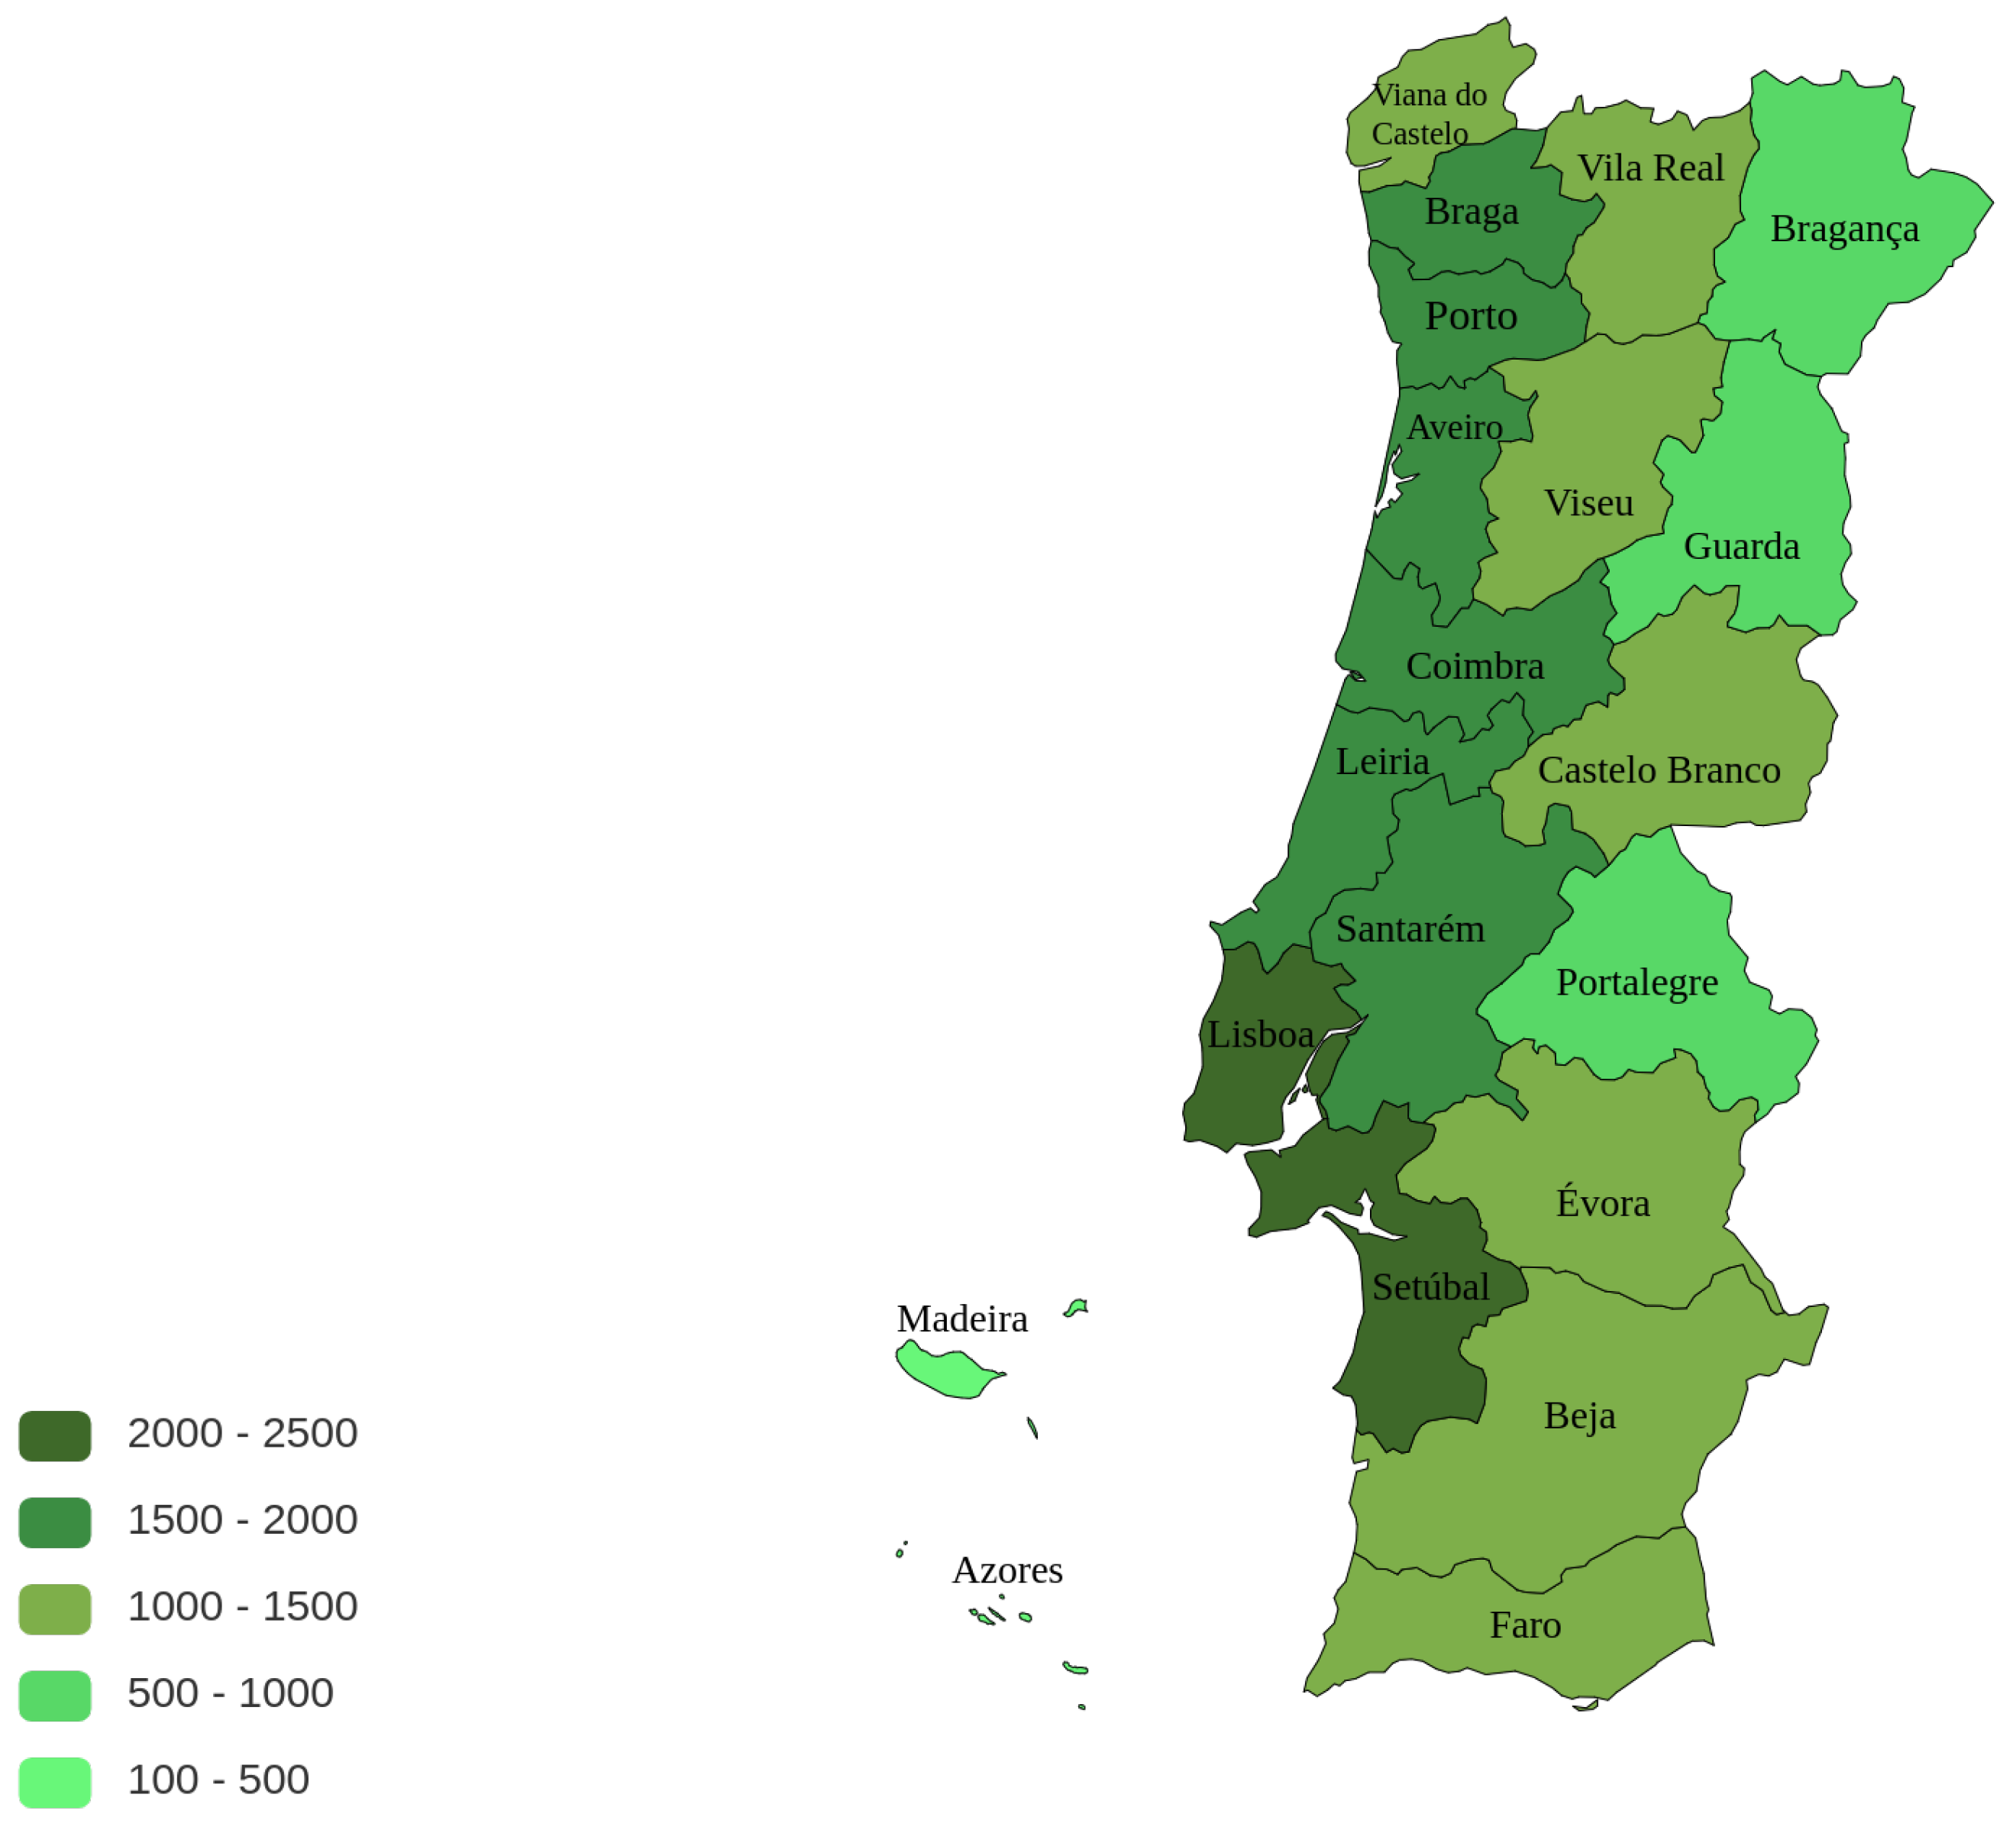
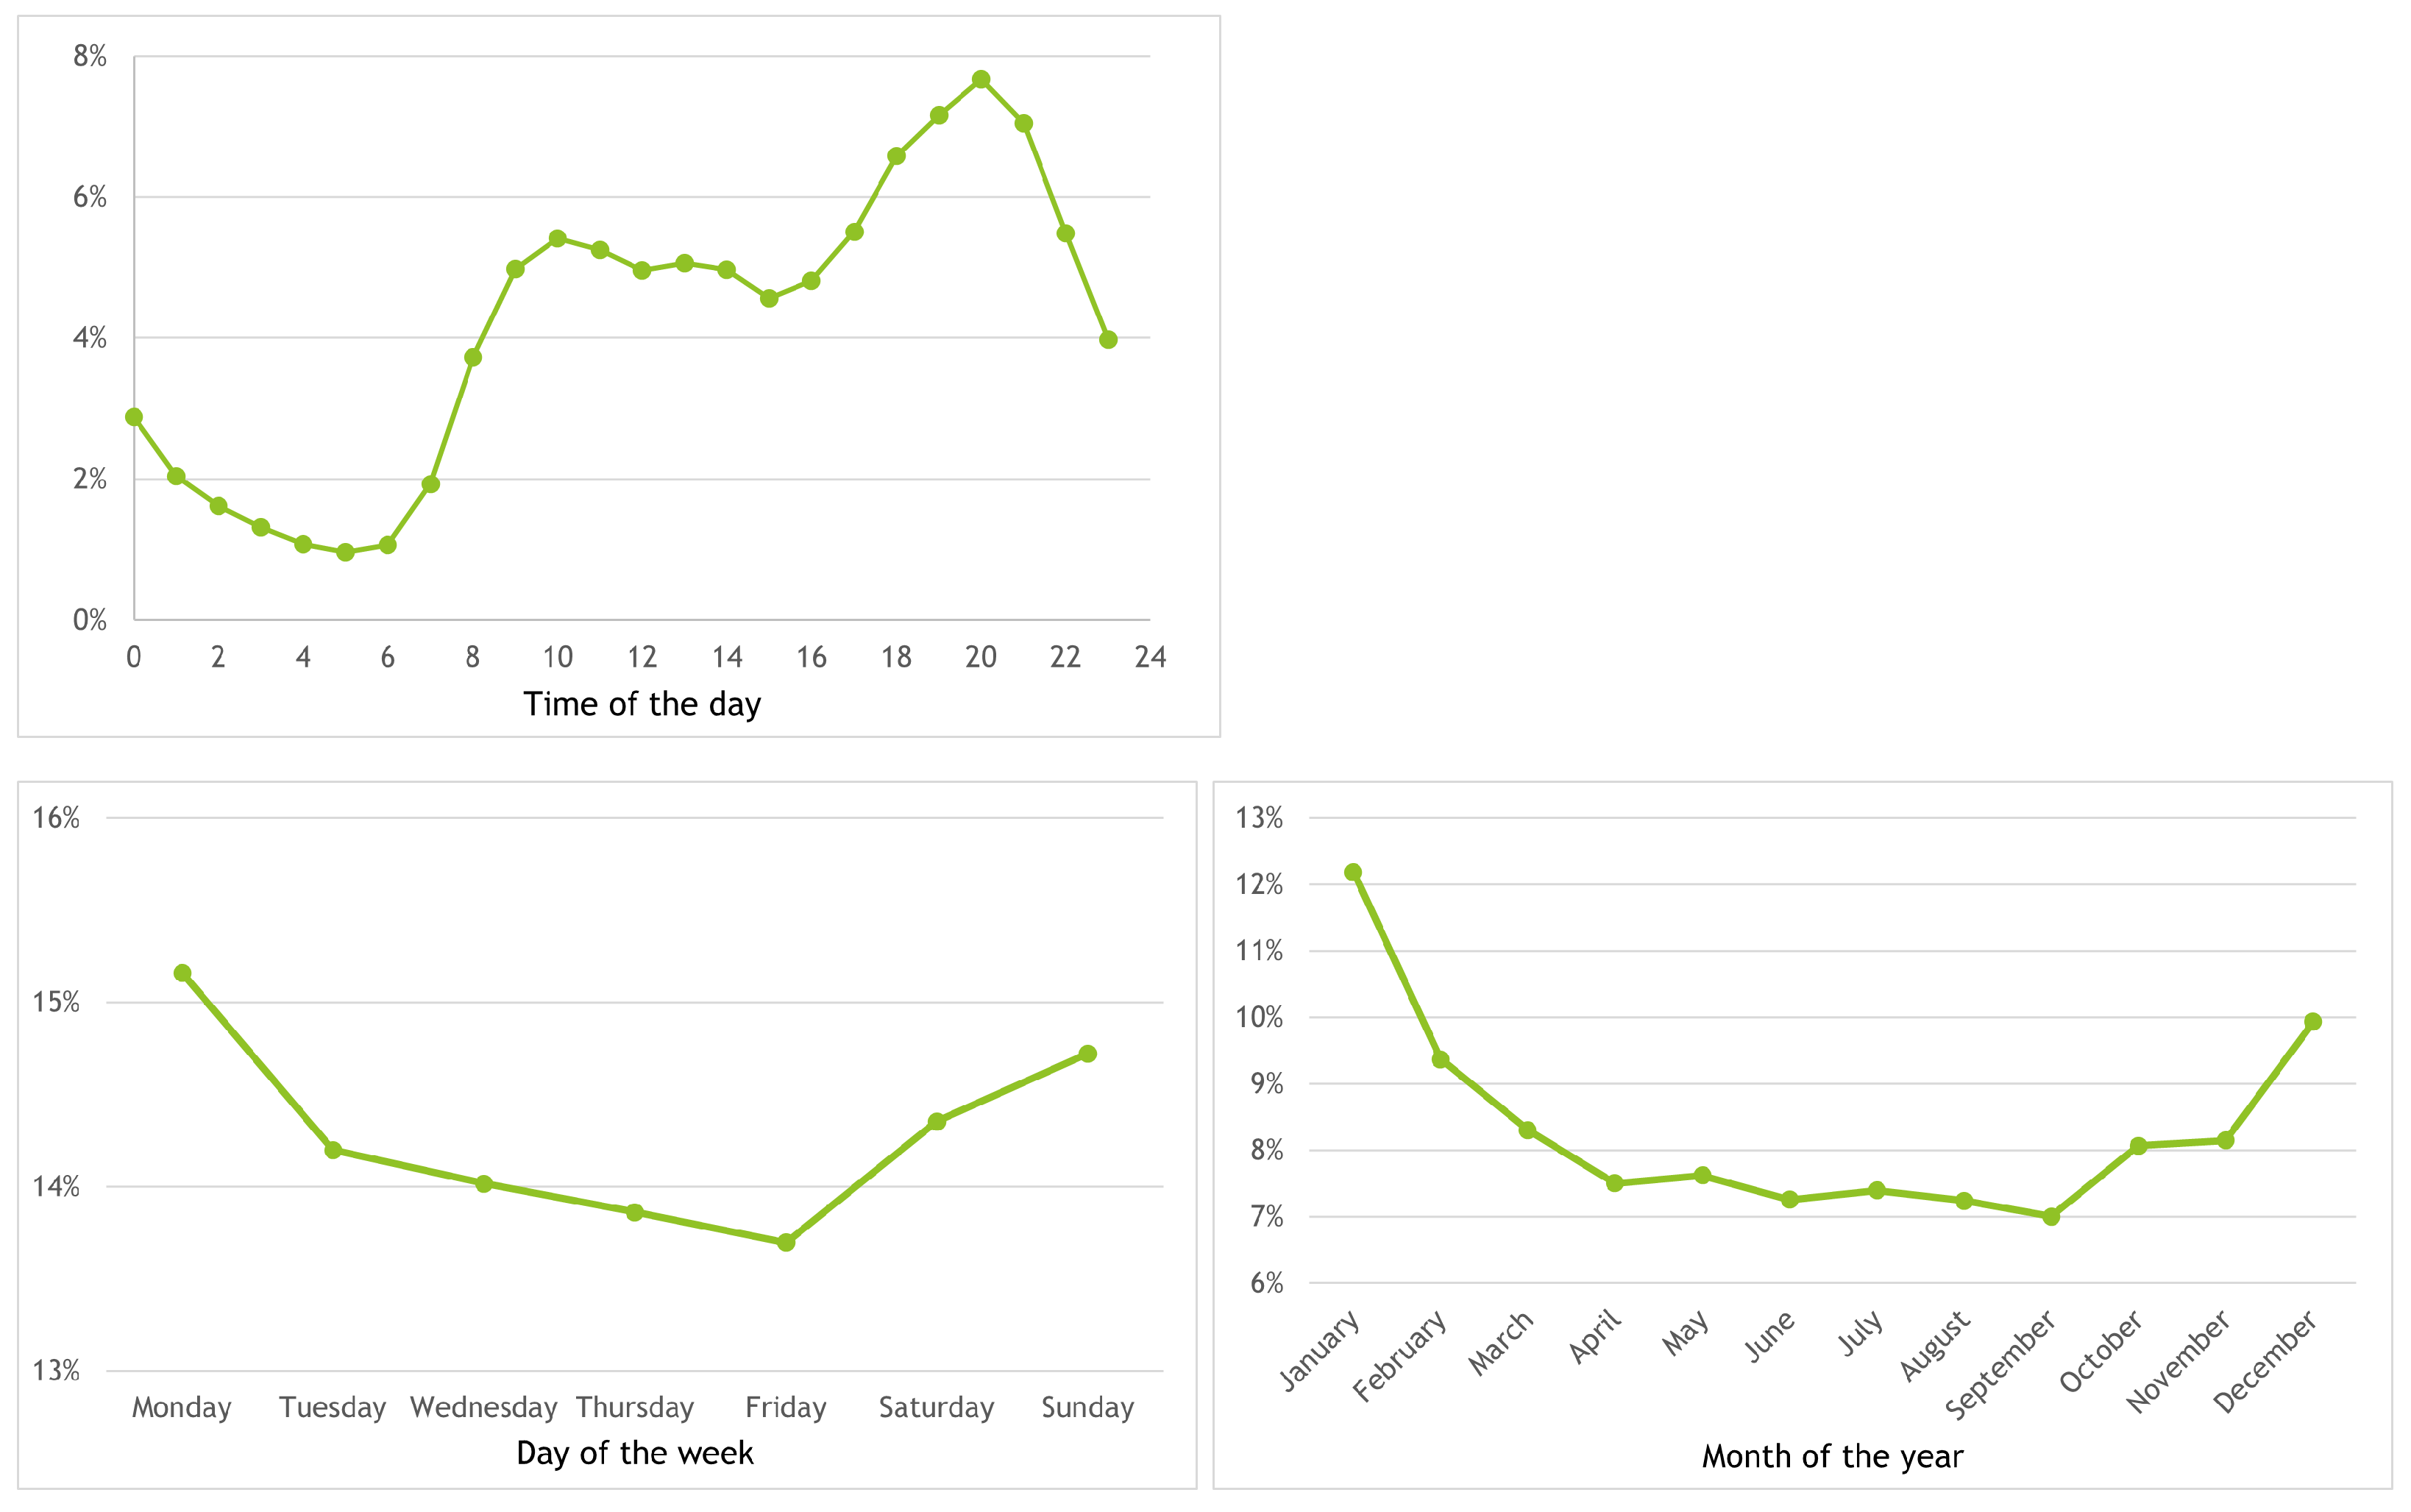
4.1. Data Characterisation: Main Findings

The origin of the call was studied and Figure 1 presents the number of calls per district per 100,000 inhabitants. It can be observed that the great majority of calls are made from the greater Lisbon area (Lisbon and Setubal districts) with a number of calls between 2000 and 2500 per 100,000 inhabitants, followed by the the coastal districts north of Lisbon with values between 1500 and 2000 calls. In the mainland, 3 inland districts (Brangança, Guarda and Portalegre) use less the line, with a number of calls ranging 500 and 1000 per 100,000 inhabitants. The citizens living in the islands (Azores and Madeira autonomous regions) use the phone line even less; one possible explanation for this minor use of the SNS24 phone line is the existence of a similar service run by the regional health authorities.
One important and needed data characterisation is the clinical pathway, being it the attribute the classification models will aim to predict (known as target class). The proportion of examples of each clinical pathway on the dataset is presented in Figure 2. As can be observed, the dataset is very unbalanced, which turns the learning of a classification model a more complex problem (the absolute numbers are presented in Table A1 on Appendix A).
The most frequent pathway is “Cough” with 10.68% of the calls, followed by “Nausea and vomiting problems”, “Abdominal pain”, “Oropharynx problem” and “Rash” with 7.44%, 6.26%, 5.08% and 4.86%, respectively. Moreover, the 23 most frequent pathways account for at least 80% of the calls, with the 7 most frequent ones accounting for around 42.4%; furthermore, there are 25 pathways for which the frequency is less than 1%.
Regarding the caller, Figure 3 shows that about half of the calls is to report a problem of the callers themselves, followed by calls from the mother of the patient (26%); father or husband of the patient account for 5% each, whereas caretakers account for 1% of the callers.
Concerning the citizen gender distribution, the majority is female representing 59% of the calls. For the age distribution it can be observed that the phone line is mostly used to attend patients in their first years (up to five years old), followed by young adults, with the number decreasing for the elderly; this trend is presented in Figure 4.
A similar age distribution analysis was done for the 10 most common pathways; these were then empirically clustered by similar trends over patient age, having one cluster following the general trend and 3 others with some differences. The distribution for those clustered pathways can be observed in Figure 5. The first cluster (top-left) follows the general trend and includes four pathways: “Cough”, “Nausea and vomiting problems”, “Rash” and “Diarrhea”; the second cluster (top-right), shows the age distribution for the “Flu Syndrome”: younger patients are not so frequent, with an increased percentage for the adults between 30 and 40 years old. “Chest pain” and “Migraine” pathways represent the third cluster (bottom-left) and have the most dissimilar distribution when compared to the general age distribution. The final cluster (bottom-right) includes “Abdominal pain”, “Oropharynx problem” and “Urinary problem” pathways and follow, somehow in a smoother version, the general trend.
A study of the distribution of calls over time, namely hour of the day, day of the week and month of the year was also made. Figure 6 presents the results (on top, the hour of the day; on bottom left and right, the day of the week and month of the year, respectively. It can be observed that dinner time (between 19:00 and 21:00) is the period summing around 20% of the calls; the value reaches its minimum at 5:00 and increases until 10:00, keeping more or less steady (with a small decrease) until 15:00, when it starts increasing again until 20:00.
In what concerns the day of the week, Monday and Friday are the weekdays with more and less calls, with 15.25% and 13.75%, respectively; while the values decrease between Monday and Friday, Saturday and Sunday receive 14.30% and 14.75% of the calls. The number of calls around the year ranges between less than 6% in September and 12% in January, with values around 10% from February to June and around 6% from July to November; December has a value of around 10.05%.
A study on the distribution of the calls per month per pathway for the 10 most common pathways was also made; these were empirically clustered by similar trends over time, having, again, one cluster following the general trend and 3 others with some differences. The distribution for those clustered pathways can be observed in Figure 7.
The first cluster is composed by the “Rash”, “Diarrhea” and “Body temperature change problem” pathways and it follows, more or less, the general trend: decreases until March, raises until June, decreases in July, keeping steady until September an slowly increasing until December (except “Diarrhea” that decreases from October to December). “Cough” and “Nausea and vomiting problems” compose the second cluster and show a somehow similar behaviour over the year (top-right): the number of calls drops until August, then the first raises until December while the second has the highest value in October slowly decreasing until December.
The third cluster (bottom-left) is composed of four pathways: “Abdominal pain”, “Chest pain”, “Oropharynx problem” and “Urinary problem” and has the following trend: starting from January the values drop until March, raise until April, decreases until July and stays steady until December. Finally, “Flu syndrome” composes the fourth cluster (bottom-right): it has a huge peak in January (with almost 45% of the calls) and drops to 2.5% in April reaching almost 0% in August, starting to raise slowly until November and having a steep raise in December.
Finally, a study of the distributions of referrals (self-care, primary care unit, emergency room, INEM, others) per pathway was also made. Figure 8 presents the results for all pathways. “Chest pain”, “Blood pressure problem” and “Fainting or lipothymia problems” (not considering “Emergency”) are the pathways with higher percentage of INEM referral with values around 25% of the calls, while “Vaccination reaction problem”, “Body temperature change problem”, “Nasal problem”, “Flu syndrome” and “Diarrhea” (not considering “Asymptomatic contact tracing”) are the ones with higher percentage of self-care referral, with percentages between around 60% and 75%.
Figure 9 further presents the same analysis but for the 10 most common pathways, arranging them by the percentage of selfcare referral: “Body temperature change”, “Diarrhea” and “Flu syndrome” have percentages higher than 50%; “Cough”, “Oropharynx problems” and “Nausea and vomiting problems” have percentages higher than 30% and lower than 50%; “Abdominal pain” and “Rash” have a similar selfcare of around 23%; “Chest pain” and “Urinary problems” have selfcare percentages lower than 10%. On the other end, around 28% of “Chest pain” are referred to INEM and around 60% of “Abdominal pain” and 50% of “Urinary problems” and “Chest pain” calls are referred to the emergency room.

4.2. Evaluation of Prediction Models

As previously mentioned models were built to assess the impact of larger datasets and older models in the model performance. Table 2 presents the balanced accuracy of the models when considering the 1, 3 and 5 most probable clinical pathways (top-1, top-3, top-5) along with the average time to predict 1000 examples (over 10 runs). The 3 months models were built and assessed in previous works [2,3].
Observing the top-1 accuracies, they range from 63.1% and 78.3% for CNN model with 3 months and 2 years data, respectively. It is curious to observe that the lowest and highest performance were obtained with a deep neural network architecture, which is in accordance with previous studies: deep architectures are able to achieve higher performances than other algorithms when a large amount of training data exists, overfitting easily when there is not enough data. We can also observe that SVM models with different sizes of data are more stable than CNN ones: the difference in accuracy between the 3 months and the 2017-2018 SVM and CNN data models is 2.5% and 15.1%, respectively.
It is also possible to conclude that adding more data consistently improves the models and that models built with more recent data are also better. For example, using the 2 previous years increments the accuracy by 0.2% when compared with a model built with only the previous year (2017–2018 vs. 2018); using a model built with data from the previous year increments the accuracy by 0.8% (CNN) to 1.1% (SVM) when compared to a model built with the data from 2 years apart (2018 vs. 2017).
When looking at the model performance considering the 3 most probable pathways (top-3), SVM is substantially better than CNN for the 3 months model (15.2% higher) presenting very similar accuracies for the other models (with SVM surpassing CNN in 2017 and 2018 models by 0.1% and having an equal accuracy for 2017–2018 model). This trend is also true considering the 5 most probable pathways: SVM is 15.5%, 0.2%, 0.4% and 0.2% higher than CNN for the 3 months, 2017, 2018 and 2017–2018 models.
Finally, observing the prediction time, and as expected, SVM takes more time to predict when models are built with more data, with CNN maintaining an almost fixed time independently of the size of the training set.
Table 3 presents the weighted precision, recall (values are repeated here as they are usually presented along with precision and F1) and F1 values over the test set (2019 data) of the 8 trained models (2 algorithms: SVM and CNN; 3 datasets: 3 months, 2017 data, 2018 data and 2017–2018 data).
Similarly to balanced accuracy (recall), the minimum and maximum precision and F1 values were obtained for the CNN model with 3 months and 2 years data, respectively; precision range between 65.7% and 78.5%, and F1 between 64.2% and 78.2%. We can also observe, when comparing CNN and SVM models, the same trend for these measures (as observed in accuracy): the performance difference between the 3 months and 2 years models varies between 1.7% (precision) and 2.3% (F1) for SVM while, for CNN, it varies between 12.8% (precision) and 14% (F1).

5. Error Analysis, Explainability and Meta-Evaluation

This section analyses, from different points of view, the predictions made by the developed ML models. Namely, it looks into the errors by class, exemplifies how a model makes its decisions and evaluates the similarity between the clinical pathways chosen initially by the nurses (and used as ground truth to build and evaluate the models), the models and a clinical expert.

5.1. Error Distribution by Class

Some disadvantageous facets of the problem at hands are: the unbalanced nature of the dataset, the considerable number of clinical pathways with pathways sharing common symptoms as referred by the healthcare experts (for instance, “Abdominal pain”, “Nausea and vomiting problems” and “Diarrhea”, or “Crying child problem” and “Body temperature change problem”) and the existence of very short text sequences describing the contact reason of the call. Upon these conditions, we consider that the results achieved are very satisfactory.
Table 4 shows the individual precision, recall and F1 values for the 10 most and least common pathways along with minimum, maximum, average and standard deviation values obtained for the SVM and CNN 2017-2018 models (Table A2, in Appendix A, presents the results for all pathways sorted, in descending order, by the pathway support). As can be observed, there is a huge performance difference between classes: F1 ranges between 0.000 and 0.931 for CNN and 0.013 and 0.919 for SVM (precision and recall have similar ranges). As expected, the average performance is higher for 10 most frequent pathways when compared with the 10 least frequent ones, with F1 equal or above 0.792 and equal or below 0.395, respectively. Moreover, standard deviation is much higher for the least common pathways; for example, and for the SVM model, the least common pathways have a value of 0.260 while most common pathways present a value of 0.082 (similar trends are valid for the CNN model and for precision and recall).
Nonetheless, there are pathways, with similar support values, that seem to be much more difficult to classify than others: for example, while “Emergency” presents an F1 value of 0.140, “Foreign body problem” has an F1 of 0.679 (with support of 3201 and 3220, respectively); the case is similar, but with a smaller difference, between “Flu syndrome” and “Diarrhea”, with the F1 values of 0.609 and 0.810 and support of 41827 and 37202, respectively.
Figure 10 shows the F1 values vs. the support of the class over the test set for the 2017–2018 SVM and CNN models. It can be observed that, as expected, the class prediction performance tends to increase with a higher number of examples.
In a few cases, this tendency is interrupted (see Table A2, in Appendix A for the pathways names): “Geriatric problems” presents a sharp decrease when compared to pathways with similar support such as “Diabetes problem” or “Finger problem”, with F1 values of 0.460, 0.711, and 0.697 for the SVM model, respectively; the same occurs with “Nonspecifc problem” when compared to “Blood pressure problem” or “Anxiety problem” (F1 values of 0.386, 0.780, and 0.735 for the SVM model, respectively) or “Flu syndrome” when compared to “Diarrhea” or “Urinary problem” (F1 values of 0.609, 0.810, and 0.885 for the SVM model, respectively). On the other hand, “Solar exposure problem” and “Elbow problem” present higher performance than pathways with few similar cases. This analysis allows us to conclude that despite the number of examples per class, some pathways are more difficult to predict than others.
Table 5 presents the confusion matrix between “Cough” and “Flu syndrome”, two problems that share symptoms using the 2017–2018 models. It can be observed that, for the CNN model, the number of “Cough” examples misclassified as “Flu syndrome” surpasses the total for all other pathways (10,636 vs. 10,359), being also true for “Flu syndrome” examples classified as “Cough” (7157 vs. 6922); for the SVM model this trend is also true for “Flu syndrome” examples classified as “Cough” (7821 vs. 7484), but there are less “Cough” examples misclassified as “Flu syndrome” when compared to all other classes (9271 vs. 10,988). Moreover, while SVM classifies more “Flu syndrome” cases as “Cough” (7821 vs. 7157), CNN classifies more “Cough” cases as “Flu syndrome” (10,636 vs. 9271).

5.2. Explainability

It is well known that explaining a ML model decision is not a straightforward task (except in very simple models). Presently, there is a considerable effort in the community to overcome this issue; in that sense, several tools are becoming available.
Some of these tools intend to show the most relevant features contributing to the decision process, thus providing ways to explain black-box models. ELI5 (v0.13) [34] is one such tool and was used here to illustrate how we can explain the output produced by the SVM model. Figure 11 shows the ELI5 output for two examples corresponding to the following contact reasons:
  • derrame ocular à direita há 2 semanas aprox. e prurido ocular desde ontem
    right eye effusion 2 weeks ago approx. and itchy eyes since yesterday
  • Congestão nasal, tosse com expectoração não eficaz e secreções oculares amarelas há 24 horas
    Nasal congestion, coughing ineffective sputum and yellow eye secretions for 24 h
Both texts above were assigned by the nurse to the pathway “Ocular problem”; they were classified by the SVM model as “Ocular problem” in the first case and as “Cough” in the second (with “Ocular problem” being the third guess).
Figure 11 shows, for each example, the input words and corresponding weights for two pathways. For the first example, it shows the pathway chosen by the classifier the second most probable pathway; for the second example, it shows the pathways chosen by the classifier and by the nurse (the 3rd most probable one). The green colour signals words contributing in favour of the pathway; the red colour, against.
Figure 11. ELI5 output for two “Ocular problem” pathway examples: the left example was classified as “Ocular problem”; the right example was classified as “Cough”.
Futureinternet 15 00026 g011
Looking at the examples and their explanations, it is noticeable that sometimes the most contributing words have similarities with the pathway name. Nonetheless, there are also cases in which different terms are chosen as important contributors to the decision.
For the first example (on the left), the most relevant features for classifying it as “Ocular problem” are: “ocular” (being related to the algorithm denomination), followed by “secretion” (derrame), “right” (direita) and “itching” (prurido); only 3 words count negatively. For the second most probable pathway, “Rash”, “itching” (prurido is the word contributing the most to the class, with six words contributing negatively (being “ocular” one of them). ELI5 also states that the example has a belonging probability of 99.2% to “Ocular problem” and of 0.1% to “Rash”.
For the second example (on the right), classified as “Cough” by the ML model with a probability of 70.1%, “cough” (tosse) is the word with the highest positive weight, followed by “expectoration” (expectoração) and “nasal”. The pathway chosen by the nurse, “Ocular problem”, was the 3rd most probable one, with a probability of 4.3% (after “Flu syndrome” with a probability of 12.6%); for this pathway, “oculars” (oculares), “secretions” (secreções) and “yellow” (amarelas) have considerable positive weights, but there are 5 words contributing negatively, being “cough” (tosse) and “nasal” the most important ones. Although contributing negatively, their weights in this pathway are not as large (absolute value) as the weights contributing positively to pathway “Cough” (for example, -1.118 vs. +9.108 for word “cough”).
From a clinical perspective, the ML model leads to the correct assessment of the clinical symptoms priority when choosing the algorithm. In the specific case of the second example, the opinion of clinical expert is that the ocular involvement is most likely due to respiratory symptoms and consequently, the ML model suggestion of “Cough” is the most adequate one, despite the choice of the nurse.
When it comes to practice, this kind of analysis should be incorporated in the system with the explanations about the decisions being presented to the user whenever required. Here, one such explainability tool and the explanation for two specific contact reasons were presented as illustration.

5.3. Meta-Evaluation

This meta evaluation aims at assessing the differences and similarities between the clinical pathways chosen initially by the nurses (and used as ground truth to build and evaluate the models), the ML models and a clinical expert.
For this study a total of 200 examples were chosen randomly, 10 for each of the 10 most frequent and the 10 least frequent clinical pathways. These examples were presented to a clinical expert and to the 2017-2018 SVM and CNN models. For some examples (totalling 14), and looking only to the “Contact Reason” information, the clinical expert was not able to decide the correct pathway, so these examples were not considered for the analysis. It is important to stress out that by having access only to the “Contact Reason” text, the clinical expert was not able to consider any other information the nurse had when attending the call. It is also important to have in mind that, although being specifically trained for choosing the most suitable clinical pathway, the choice, seen as ground truth by the ML algorithms, is made by different nurses (for the 3 years it totals 1888 different nurses) and with a diversity of clinical practice.
Table 6 resumes, per clinical pathway, the agreement between each pair of decisions (clinical expert, ground truth, SVM and CNN).
Observing the total number of agreements one can conclude that, while the agreement of the ML models is the highest (166), the clinical expert agrees the less with the pathway chosen by the SNS24 working nurses (58). Moreover, the number of agreements between both ML models and the nurses or the clinical expert is similar (74 and 70 with the nurses; 104 and 109 with the clinical expert, for SVM and CNN, respectively) but they are higher with the clinical expert by 30 cases or more.
Looking at the agreements with the clinical expert (columns e-g, e-s, e-c), a conclusion that stands out is that the agreement with the ML models (columns e-s, e-c) is much higher when compared with the agreement with the SNS24 working nurses (column e-g); this is true for the least and for the most frequent pathways, with the number of agreements more than doubling for the least frequent pathways (52 for ML models vs. 25 for the nurses). Moreover, the agreement with the ML models is similar for the most and least frequent pathways (between 52 and 57). On the other hand, the agreement with the nurses is higher for the most frequent pathways when compared to the least frequent ones (33 vs. 25).
Although not as important, it is interesting to observe the agreements of the working nurses with the ML models (columns s-g, c-g). Even if the number of agreements is similar for both ML models, it more than doubles for the most frequent pathways when compared to the least frequent ones (50 and 49 vs. 24 and 21 for SVM and CNN, respectively).
Similarly to the agreement with the clinical expert, the agreement between the two ML models (column s-c) is similar for the most and least common pathways (84 vs. 82).
Looking at individual pathways, it seems that some are easier to distinguish than others. From a total of 10 examples tagged by the nurses as “Urinary problem”, the clinical expert agreed on 7 and the CNN on 10; for the 10 examples tagged as “Cough”, the clinical expert agreed on 2 and both ML models agreed on 5. A similar conclusion can be drawn from the set of the least common pathways: “Foreign body problem” seems to be a much easier pathway to be detected (7 and 8 agreements with the ML models and clinical expert) than the “Elbow problem” (2 to 4 agreements with the ML models and clinical expert).
Finally, it is also interesting to observe that, for the 14 examples where the clinical expert was not able to choose a pathway, SVM and CNN models always disagreed with the ground truth but agreed with each other in all but one example. Following, there are two examples where the ML models although agreeing with each other, disagreed with the the working nurses:
  • Palpitações, hiperventilação há 1 hora
    Palpitations, hyperventilation 1 h ago
  • refere prurido anal há 1 hora
    reports anal itching 1 h ago
For first example, nurses chose “Chest pain” and the ML models predicted as being an “Anxiety problem”; for second example, nurses chose “Rash” pathway, the SVM model predicted as being a “Stool color change problem” and the CNN as being a “Skin integrity problem”.
These findings stress the importance of using such a decision support system, since it can help the attending nurses, when in doubt, to choose a clinical pathway.

6. Conclusions and Future Work

This work presents the analysis of a dataset containing calls received by the Portuguese National Health Contact Center and a comparison of different Machine Learning approaches to the task of classifying these calls according to their contact reason.
To help further understand the problem, the data was characterised, with its distribution regarding the classes of health problems and the customer gender and age and living district being reported. The service seems to have a great impact in child care and young adults, mainly on coastal districts.
The contact reason of the reported situation serves to help in selecting the pathway algorithm to be followed by the attendant to reach the appropriate referral between self-care, clinical assessment at primary care unit or at a hospital emergency if not transferred to the INEM. The pathway is to be chosen from 59 options so Artificial Intelligence techniques are applied to accelerate the finding of the best choice.
A comparative analysis among the best options according to the literature was presented and, on the basis of three years data, different configurations of training sets were tested. The conclusion is that date proximity along with larger training data are relevant for producing models with better performance.
The unbalanced nature of the classes normally impacts the generation of the models; this was confirmed for this problem when analysing performance and frequency. Another issue found in the study is the great similarity among symptoms of some pathways, such as “Cough” and “Flu syndrome”, having a clear negative impact in the performance due to the difficulty to generalise the fine distinctions among these situations.
Moreover, it was shown that current techniques aiming at explaining ML models decisions may be applied by providing users with an explanation of the system decision, an essential feature for AI applications in the health domain.
It is also important to note that the ground truth was considered the right decision, assuming that the attendant is always correct regarding the chosen algorithm, a situation that was questioned during the process of meta evaluation. The presented error analysis enables to stress the importance of having a decision support system to help the attending nurses decide the best clinical pathway when in doubt.
Regarding the comparison of different classification methods, the best results were obtained with CNN, with an F1 of 0.782 against a maximum of 0.768 obtained with SVM. It is known, however, that the computational cost for training DNNs are much higher than the cost of using SVM. Moreover, the experiments showed that, although both ML algorithms give an answer within the reasonable time for having the system running in real time, the SVM model classification time is higher especially for bigger models. There are issues regarding these choices and their associated carbon footprint [35,36]. No specific carbon footprint measurements were done in this study but it is known that there is a large difference in resources consumption between these two approaches. Considering that the application of these solutions on a daily practice will require a periodical re-training, that is a relevant factor indicating the one year SVM model as a fair alternative, if a 1.4% reduction in performance (accuracy, precision, recall and F1) is not crucial.
As future work we intend to investigate other ML algorithms, namely a boosting ensemble approach like Gradient Tree Boosting [37], since these models generally provide top accuracies if the parameters are set correctly, and update the models with the calls from 2020 and 2021 when new clinical pathways related to COVID were designed.
On a different line of research, we intend to study the consistency between the clinical pathway final referrals and the follow-up screening at the hospital emergency or primary health care unit. Moreover, and since the number and practice of nurses attending the calls is very diverse, we intend to investigate trends in the nurses selection of clinical pathways.

Author Contributions

Conceptualization, T.G. and P.Q.; methodology, T.G. and R.V. (Renata Vieira); software, R.V. (Rute Veladas) and H.Y.; validation, P.I., A.R.P., N.F. and C.G.; investigation, R.V. (Renata Vieira); resources, C.S.P., J.O., M.C.F. and J.M.; data curation, T.G., H.Y., R.V. (Rute Veladas), C.S.P., J.O., A.R.P., N.F. and C.G.; writing, T.G. and R.V. (Renata Vieira); visualization, T.G. and P.I.; supervision, T.G.; project administration, T.G.; funding acquisition, P.Q. All authors have read and agreed to the published version of the manuscript.

Funding

This research work was funded by FCT—Fundação para a Ciência e a Tecnologia, I.P, within the project SNS24.Scout.IA—Aplicação de Metodologias de Inteligência Artificial e Processamento de Linguagem Natural no Serviço de Triagem, Aconselhamento e Encaminhamento do SNS24 (ref. DSAIPA/AI/0040/2019).

Institutional Review Board Statement

The study was conducted in accordance with the Declaration of Helsinki, and approved by the Ethics Committee of University of Évora (Documento 20044, 14 April 2020).

Informed Consent Statement

Patient consent was waived due to the explicit acceptance for registry and record of calls by the users of the SNS24 line and the full anonymisation of the records.

Data Availability Statement

Not applicable.

Acknowledgments

The authors would like to thank Pedro Salgueiro for the help provided in setting up the experimental environment.

Conflicts of Interest

The authors declare no conflict of interest.

Abbreviations

The following abbreviations are used in this manuscript:
AIArtificial Intelligence
ANNArtificial Neural Network
AUCArea Under the Learning Curve
BERTBidirectional Encoder Representations from Transformers
CNNConvolution Neural Network
DGSDirectorate General of Health
DLDeep Learning
DNNDeep Neural Networks
HiSANHierarchical Self-Attention Network
INEMNational Medical Emergency Institute
MLMachine Learning
NLPNatural Language Processing
NNNeural Network
PICPoison Information Center
SNSServiço Nacional de Saúde (Portuguese National Health Service)
SNS24Portuguese National Health Line
SPMSServiços Partilhados do Ministério da Saúde
SVMSupport-Vector Machines

Appendix A. Clinical Pathways and Performance of 2017–2018 Models

This Appendix presents details the data made available for this work, namely the distribution of examples per clinical pathway (Table A1, along with the performance results per pathway for 2 years models (Table A2).
Table A1. Total and per year clinical pathway distribution.
3 Years201720182019
Clinical Pathwayabs.%abs.%abs.%abs.%
Cough275,29110.6862,9869.2289,70710.43122,59811.86
Nausea and vomiting problem191,7167.4460,1168.8059,2896.8972,3116.99
Abdominal pain161,4616.2643,4306.3652,6126.1265,4196.33
Oropharynx problem130,9995.0832,8504.8141,8224.8656,3275.45
Rash125,1424.8635,6915.2241,6954.8547,7564.62
Flu syndrome109,8804.2624,4863.5843,5675.0741,8274.04
Diarrhea98,0923.8130,0204.3930,8703.5937,2023.60
Urinary problem91,9103.5723,4573.4330,6963.5737,7573.65
Body temperature change problem90,6303.5225,3353.7130,9313.6034,3643.32
Chest pain87,0983.3822,5873.3129,1183.3935,3933.42
Migrain85,8463.3322,7993.3428,0083.2635,0393.39
Eye problem68,5462.6618,2722.6723,3132.7126,9612.61
Ear problem66,9282.6018,3222.6822,0582.5626,5482.57
Pregnancy problem, puerperium57,7812.2415,9322.3319,9422.3221,9072.12
Dizziness problem53,5642.0810,8481.5919,3062.2423,4102.26
Face problem52,8512.0514,3562.1017,5552.0420,9402.03
Skin integrity problem52,3272.0313,3961.9617,6892.0621,2422.05
Women’s health problem51,5682.0013,6352.0017,2512.0120,6822.00
Head and neck problem50,9161.9813,8442.0317,1421.9919,9301.93
Nasal problem49,4641.9212,4301.8216,5721.9320,4621.98
Nonspecific problem48,5851.8816,8762.4714,8811.7316,8281.63
Low back pain problem48,2221.8787661.2816,9301.9722,5262.18
Blood pressure problem42,4911.6511,0751.6214,7821.7216,6341.61
Anxiety problem41,3001.6011,3211.6614,0861.6415,8931.54
Lower limb—ankle foot37,5831.4610,0041.4612,5561.4615,0231.45
Toxic sub ingestion problem35,3551.3710,5491.5412,2211.4212,5851.22
Allergy problem31,0341.2079761.1710,4351.2112,6231.22
Lower limb—hip29,3001.1479681.1793501.0911,9821.16
Upper limb—shoulder collarbone arm25,4690.9967790.9983800.9710,3101.00
Constipation problem24,8510.9681811.2082600.9684100.81
Lower limb—knee24,7000.9663270.9382890.9610,0840.98
Diabetes problem23,1570.9071391.0479820.9380360.78
Crying child problem (0–1 year)22,0680.8665450.9673320.8581910.79
Respiratory problem21,8210.8555850.8275280.8887080.84
Geriatric problem21,2410.8266880.9868790.8076740.74
Stool color change problem20,7230.8033590.4977270.9096370.93
Upper limb—wrist hand17,3740.6746650.6857830.6769260.67
Finger problem16,5990.6440200.5955930.6569860.68
Men’s health problem16,2720.6342580.6254350.6365790.64
Vaccination reaction problem11,0730.4332340.4735310.4143080.42
Depression problem10,9800.4333150.4935880.4240770.39
Burn problem92870.3626820.3931640.3734410.33
Breast problem87750.3423380.3429800.3534570.33
Fainting or lipothymia problem85000.3316860.2531300.3636840.36
Foreign body problem84790.3323940.3528650.3332200.31
Emergency72720.2812360.1828350.3332010.31
Breastfeeding problem44360.1713230.1915340.1815790.15
Asthma or wheezing problem36180.149040.1311950.1415190.15
Elbow problem18190.074450.076080.077660.07
Solar exposure problem15500.064470.075020.066010.06
Crisis adaptation problem6630.031240.022260.033130.03
Measles problem5760.022570.042070.021120.01
Heat problem3340.011020.011560.02760.01
TOTAL2,577,517683,360860,0931,034,064
Table A2. Performance values (precision, recall and F1) for the 2017–2018 SVM and CNN models.
SVMCNN
Clinical Pathway Prec Rec F1 Prec Rec F1 Sup
Cough0.8180.8350.8260.8430.8290.836122,598
Nausea and vomiting problem0.7790.8310.8040.8030.8640.83272,311
Abdominal pain0.7710.7810.7760.8070.8070.80765,419
Oropharynx problem0.7690.7120.7400.7930.7410.76656,327
Rash0.8750.9060.8900.8880.8970.89247,756
Flu syndrome0.5860.6340.6090.5620.6630.60841,827
Diarrhea0.8420.7800.8100.8460.8260.83637,202
Urinary problem0.8970.8730.8850.8970.8800.88837,757
Body temperature change problem0.7300.7640.7470.7420.7620.75234,364
Chest pain0.8360.8360.8360.8470.8530.85035,393
Migrain0.7350.7610.7480.8010.7960.79835,039
Eye problem0.9160.9220.9190.9290.9320.93126,961
Ear problem0.8890.8440.8660.9050.8670.88626,548
Dizziness problem0.7280.7270.7270.7770.8070.79123,410
Low back pain problem0.8430.8120.8270.8490.8420.84622,526
Pregnancy problem, puerperium0.8270.6930.7540.8110.7000.75221,907
Skin integrity problem0.6650.6450.6550.6560.6540.65521,242
Face problem0.7360.7800.7570.7250.8040.76320,940
Women’s health problem0.7960.8360.8160.8040.8310.81720,682
Nasal problem0.7060.7300.7170.7100.7570.73320,462
Head and neck problem0.7750.8110.7930.7880.8260.80619,930
Nonspecific problem0.3460.4370.3860.3750.4080.39116,828
Blood pressure problem0.7880.7730.7800.8340.7800.80616,634
Anxiety problem0.7610.7110.7350.7380.7450.74215,893
Lower limb—ankle foot0.7770.7600.7680.7550.7870.77115,023
Allergy problem0.7660.5800.6600.7690.5730.65712,623
Toxic sub ingestion problem0.8360.8520.8440.8420.8490.84612,585
Lower limb—hip0.6480.7350.6890.6540.7450.69611,982
Upper limb—shoulder collarbone arm0.7380.8010.7680.7590.8190.78810,310
Lower limb—knee0.8190.6920.7500.8300.6920.75510,084
Stool color change problem0.7310.7540.7420.7450.7030.7239637
Respiratory problem0.5710.6330.6010.5820.6530.6168708
Constipation problem0.7570.7790.7680.7350.8320.7808410
Crying child problem (0–1 Year)0.6710.4930.5680.6670.4980.5708191
Diabetes problem0.8450.6130.7110.8210.6410.7208036
Geriatric problem0.4470.4740.4600.4530.4620.4577674
Finger problem0.6640.7330.6970.6890.7110.7006986
Upper limb—wrist hand0.7240.6440.6820.7570.6580.7046926
Men’s health problem0.8310.7970.8130.8450.7940.8196579
Vaccination reaction problem0.7430.6970.7190.7470.6760.7104308
Depression problem0.7670.6470.7020.7830.6320.7004077
Breast problem0.7020.8120.7530.7140.8000.7553457
Burn problems0.8620.8400.8510.8530.8530.8533441
Fainting or lipothymia problem0.6470.6880.6670.7010.7200.7103684
Foreign body problem0.6750.6840.6790.6750.6510.6633220
Emergency0.4370.0830.1400.4130.1140.1793201
Breastfeeding problem0.5950.5050.5470.5970.4570.5181579
Asthma or wheezing problem0.5760.2570.3550.5770.2750.3721519
Elbow problem0.5650.6210.5920.6640.5990.630766
Solar exposure problem0.5650.7590.6480.5850.5820.584601
Crisis adaptation problem1.0000.0060.0130.0000.0000.000313
Measles problems0.7060.1070.1860.8000.0710.131112
Heat problems0.3330.0790.1280.0000.0000.00076
minimum0.3330.0060.0130.0000.0000.000
maximum1.0000.9220.9190.9290.9320.931
average0.7250.6710.6770.7120.6740.683
stdev0.1360.2130.1990.1850.2240.212

References

  1. Mackway-Jones, K.; Marsden, J.; Windle, J. Emergency Triage: Manchester Triage Group; John Wiley & Sons: New York, NY, USA, 2013. [Google Scholar]
  2. Veladas, R.; Yang, H.; Quaresma, P.; Gonçalves, T.; Vieira, R.; Sousa Pinto, C.; Martins, J.P.; Oliveira, J.; Cortes Ferreira, M. Aiding Clinical Triage with Text Classification. In Proceedings of the EPIA Conference on Artificial Intelligence; Springer: New York, NY, USA, 2021; pp. 83–96. [Google Scholar]
  3. Yang, H.; Gonçalves, T.; Quaresma, P.; Vieira, R.; Veladas, R.; Pinto, C.S.; Oliveira, J.; Ferreira, M.C.; Morais, J.; Pereira, A.R.; et al. Clinical Trial Classification of SNS24 Calls with Neural Networks. Future Internet 2022, 14, 130. [Google Scholar] [CrossRef]
  4. Kavuluru, R.; Rios, A.; Lu, Y. An empirical evaluation of supervised learning approaches in assigning diagnosis codes to electronic medical records. Artif. Intell. Med. 2015, 65, 155–166. [Google Scholar] [CrossRef] [PubMed] [Green Version]
  5. Marafino, B.J.; Boscardin, W.J.; Dudley, R.A. Efficient and sparse feature selection for biomedical text classification via the elastic net: Application to ICU risk stratification from nursing notes. J. Biomed. Inform. 2015, 54, 114–120. [Google Scholar] [CrossRef] [PubMed] [Green Version]
  6. Mujtaba, G.; Shuib, L.; Idris, N.; Hoo, W.L.; Raj, R.G.; Khowaja, K.; Shaikh, K.; Nweke, H.F. Clinical text classification research trends: Systematic literature review and open issues. Expert Syst. Appl. 2019, 116, 494–520. [Google Scholar] [CrossRef]
  7. Shickel, B.; Tighe, P.J.; Bihorac, A.; Rashidi, P. Deep EHR: A survey of recent advances in deep learning techniques for electronic health record (EHR) analysis. IEEE J. Biomed. Health Inform. 2017, 22, 1589–1604. [Google Scholar] [CrossRef] [PubMed]
  8. Shao, Y.; Taylor, S.; Marshall, N.; Morioka, C.; Zeng-Treitler, Q. Clinical text classification with word embedding features vs. In bag-of-words features. In Proceedings of the 2018 IEEE International Conference on Big Data (Big Data), Seattle, WA, USA, 10–13 December 2018; IEEE: Piscataway, NJ, USA, 2018; pp. 2874–2878. [Google Scholar]
  9. Mustafa, A.; Rahimi Azghadi, M. Automated Machine Learning for Healthcare and Clinical Notes Analysis. Computers 2021, 10, 24. [Google Scholar] [CrossRef]
  10. Funkner, A.A.; Yakovlev, A.N.; Kovalchuk, S.V. Data-driven modeling of clinical pathways using electronic health records. Procedia Comput. Sci. 2017, 121, 835–842. [Google Scholar] [CrossRef]
  11. Elbattah, M.; Molloy, O.; Zeigler, B.P. Designing Care Pathways Using Simulation Modeling and Machine Learning. In Proceedings of the 2018 Winter Simulation Conference (WSC), Gothenburg, Sweden, 9–12 December 2018; pp. 1452–1463. [Google Scholar] [CrossRef] [Green Version]
  12. Almeida, J.R.; Silva, J.F.; Sierra, A.P.; Matos, S.; Oliveira, J.L. Leveraging Clinical Notes for Enhancing Decision-Making Systems with Relevant Patient Information. In Proceedings of the Biomedical Engineering Systems and Technologies; Ye, X., Soares, F., De Maria, E., Gómez Vilda, P., Cabitza, F., Fred, A., Gamboa, H., Eds.; Springer International Publishing: Cham, Switzerland, 2021; pp. 521–540. [Google Scholar]
  13. Aggarwal, C.C.; Clustering, C.R.D. Algorithms and Applications; Springer: New York, NY, USA, 2014. [Google Scholar]
  14. Gómez, D.; Rojas, A. An empirical overview of the no free lunch theorem and its effect on real-world machine learning classification. Neural Comput. 2016, 28, 216–228. [Google Scholar] [CrossRef] [PubMed] [Green Version]
  15. Mascio, A.; Kraljevic, Z.; Bean, D.; Dobson, R.; Stewart, R.; Bendayan, R.; Roberts, A. Comparative analysis of text classification approaches in electronic health records. arXiv 2020, arXiv:2005.06624. [Google Scholar]
  16. Stein, R.A.; Jaques, P.A.; Valiati, J.F. An analysis of hierarchical text classification using word embeddings. Inf. Sci. 2019, 471, 216–232. [Google Scholar] [CrossRef]
  17. Kadhim, A.I. Survey on supervised machine learning techniques for automatic text classification. Artif. Intell. Rev. 2019, 52, 273–292. [Google Scholar] [CrossRef]
  18. Baker, S.; Korhonen, A.L.; Pyysalo, S. Cancer Hallmark Text Classification Using Convolutional Neural Networks. In Proceedings of the Fifth Workshop on Building and Evaluating Resources for Biomedical Text Mining (BioTxtM 2016), Osaka, Japan, 11–16 December 2016. [Google Scholar] [CrossRef]
  19. Flores, C.A.; Figueroa, R.L.; Pezoa, J.E. Active Learning for Biomedical Text Classification Based on Automatically Generated Regular Expressions. IEEE Access 2021, 9, 38767–38777. [Google Scholar] [CrossRef]
  20. Gao, S.; Alawad, M.; Young, M.T.; Gounley, J.; Schaefferkoetter, N.; Yoon, H.J.; Wu, X.C.; Durbin, E.B.; Doherty, J.; Stroup, A.; et al. Limitations of Transformers on Clinical Text Classification. IEEE J. Biomed. Health Inform. 2021, 25, 3596–3607. [Google Scholar] [CrossRef] [PubMed]
  21. Markus, A.F.; Kors, J.A.; Rijnbeek, P.R. The role of explainability in creating trustworthy artificial intelligence for health care: A comprehensive survey of the terminology, design choices, and evaluation strategies. J. Biomed. Inform. 2021, 113, 103655. [Google Scholar] [CrossRef]
  22. Amann, J.; Blasimme, A.; Vayena, E.; Frey, D.; Madai, V.I. Explainability for artificial intelligence in healthcare: A multidisciplinary perspective. BMC Med. Inform. Decis. Mak. 2020, 20, 1–9. [Google Scholar] [CrossRef] [PubMed]
  23. Li, Y.; Yang, T. Word Embedding for Understanding Natural Language: A Survey. In Guide to Big Data Applications; Springer International Publishing: Cham, Switzerland, 2018; pp. 83–104. [Google Scholar] [CrossRef]
  24. Devlin, J.; Chang, M.; Lee, K.; Toutanova, K. BERT: Pre-training of Deep Bidirectional Transformers for Language Understanding. In Proceedings of the 2019 Conference of the North American Chapter of the Association for Computational Linguistics: Human Language Technologies, NAACL-HLT 2019, Minneapolis, MN, USA, 2–7 June 2019, Volume 1 (Long and Short Papers); Burstein, J., Doran, C., Solorio, T., Eds.; Association for Computational Linguistics: Stroudsburg, PA, USA, 2019; pp. 4171–4186. [Google Scholar] [CrossRef]
  25. Akbik, A.; Blythe, D.; Vollgraf, R. Contextual String Embeddings for Sequence Labeling. In Proceedings of the 27th International Conference on Computational Linguistics, Santa Fe, NM, USA, 20–26 August 2018; Association for Computational Linguistics: Santa Fe, NM, USA, 2018; pp. 1638–1649. [Google Scholar]
  26. Souza, F.; Nogueira, R.; Lotufo, R. BERTimbau: Pretrained BERT models for Brazilian Portuguese. In Proceedings of the 9th Brazilian Conference on Intelligent Systems, BRACIS, Rio Grande do Sul, Brazil, 20–23 October 2020. [Google Scholar]
  27. Kim, Y. Convolutional Neural Networks for Sentence Classification. In Proceedings of the 2014 Conference on Empirical Methods in Natural Language Processing (EMNLP), Doha, Qatar, 25–29 October 2014; Association for Computational Linguistics: Doha, Qatar, 2014; pp. 1746–1751. [Google Scholar] [CrossRef] [Green Version]
  28. Srivastava, N.; Hinton, G.; Krizhevsky, A.; Sutskever, I.; Salakhutdinov, R. Dropout: A simple way to prevent neural networks from overfitting. J. Mach. Learn. Res. 2014, 15, 1929–1958. [Google Scholar]
  29. Kingma, D.P.; Ba, J. Adam: A method for stochastic optimization. arXiv 2014, arXiv:1412.6980. [Google Scholar]
  30. Scikit-learn. Available online: https://scikit-learn.org/stable/ (accessed on 7 December 2022).
  31. TensorFlow. Available online: https://www.tensorflow.org/ (accessed on 7 December 2022).
  32. Pytorch. Available online: https://pytorch.org/ (accessed on 7 December 2022).
  33. Python. Available online: https://www.python.org/ (accessed on 7 December 2022).
  34. ELI5. Available online: https://eli5.readthedocs.io/en/latest/index.html (accessed on 7 December 2022).
  35. Dhar, P. The carbon impact of artificial intelligence. Nat. Mach. Intell. 2020, 2, 423–425. [Google Scholar] [CrossRef]
  36. Bannour, N.; Ghannay, S.; Névéol, A.; Ligozat, A.L. Evaluating the carbon footprint of NLP methods: A survey and analysis of existing tools. In Proceedings of the EMNLP, Workshop SustaiNLP, Online, 7–11 November 2021. [Google Scholar]
  37. Friedman, J.H. Stochastic gradient boosting. Comput. Stat. Data Anal. 2002, 38, 367–378. [Google Scholar] [CrossRef]
Figure 1. Total number of calls per district per 100,000 inhabitants (image generated using https://paintmaps.com/, accessed on 9 November 2022).
Futureinternet 15 00026 g001
Figure 2. Distribution of calls per clinical pathway.
Futureinternet 15 00026 g002
Figure 3. Distribution of calls by relation of the caller to the citizen.
Futureinternet 15 00026 g003
Figure 4. Distribution of calls per the age of the citizen.
Futureinternet 15 00026 g004
Figure 5. Distribution of calls per age for the 10 most frequent pathways (clustered by similarity).
Futureinternet 15 00026 g005
Figure 6. Distribution of calls per hour of the day (top), day of the week (bottom-left) and month of the year (bottom-right).
Futureinternet 15 00026 g006
Figure 7. Distribution of calls per age for the 10 most frequent pathways (clustered by similarity over time).
Futureinternet 15 00026 g007
Figure 8. Distribution of referrals per pathway.
Futureinternet 15 00026 g008
Figure 9. Distribution of referrals for the 10 most common pathways.
Futureinternet 15 00026 g009
Figure 10. Per class performance: F1 value vs. support.
Futureinternet 15 00026 g010
Table 1. One example of the “Contact Reason” for each of the 10 most common clinical pathways.
Contact ReasonClinical Pathway
Rinorreira transparente, tosse produtiva e febre há 3d.
Transparent rhinorrhea, productive cough and fever 3d.
Cough
Dor Abdominal e nauseas há 15 dias, agravamento hoje
Abdominal pain and nausea for 15 days, worse today
Nausea and vomiting pr.
Dor supraumbilical há cerca de alguns dias
Supraumbilical pain for about a few days
Abdominal pain
Congestão nasal há 24 h.
Nasal congestion for 24 h.
Oropharynx problem
Foliculite purulenta face, tronco, braços e pernas desde 3a feira
Purulent folliculitis face, corpo since Tuesday
Rash
desde dia 21 tosse seca provoca o vomito, mialgias
since the 21st dry cough causes vomiting, myalgias
Flu syndrome
Sangue nas fezes e diarreia ha 5 h
Blood in stool and diarrhea for 5 h
Diarrhea
Lombalgias e hematuria há 72 h.
Low back pain and hematuria 72 h ago.
Urinary problem
Episódios de febre e extremidades cianosadas há 18 h
Episodes of fever and cyanotic extremities for 18 h
Body temp. change pr.
Dor na região costal algumas vezes
Pain in the rib area sometimes
Chest pain
Table 2. Test set balanced accuracy (top 1, top 3 and top 5 most probable clinical pathways) and average prediction time (for 1000 examples) of SVM and CNN models with different training sets.
AccuracyPred Time (ms)
SVM CNN SVM CNN
Training Set Top 1 Top 3 Top 5 Top 1 Top 3 Top 5
3 months0.7430.9270.9590.6310.7750.80414.8212.31
20170.7550.9320.9630.7720.9310.96154.3212.41
20180.7660.9380.9680.7800.9370.96454.5712.50
2017–20180.7680.9400.9690.7820.9400.96792.4814.19
Table 3. Test set precision, recall and F1 (weighted average) of SVM and CNN models with different training sets.
SVMCNN
Training SetPrecRecF1PrecRecF1
3 months0.7540.7430.7450.6570.6320.642
20170.7610.7550.7550.7760.7720.772
20180.7680.7660.7650.7820.7800.779
2017–20180.7710.7680.7680.7850.7830.782
Table 4. Test set precision, recall and F1 of 2017–2018 SVM and CNN models for the 10 most and least frequent pathways.
SVMCNN
Clinical Pathway Prec Rec F1 Prec Rec F1 Sup
Cough0.8180.8350.8260.8430.8290.836122,598
Nausea and vomiting0.7790.8310.8040.8030.8640.83272,311
Abdominal pain0.7710.7810.7760.8070.8070.80765,419
Oropharynx problem0.7690.7120.7400.7930.7410.76656,327
Rash0.8750.9060.8900.8880.8970.89247,756
Flu syndrome0.5860.6340.6090.5620.6630.60841,827
Diarrhea0.8420.7800.8100.8460.8260.83637,202
Urinary problem0.8970.8730.8850.8970.8800.88837,757
Body temp change pr.0.7300.7640.7470.7420.7620.75234,364
Chest pain0.8360.8360.8360.8470.8530.85035,393
average (10 most freq)0.7900.7950.7920.8030.8120.807
stdev (10 most freq)0.0880.0800.0820.0960.0720.083
Fainting or lipothymia0.6470.6880.6670.7010.7200.7103684
Foreign body problem0.6750.6840.6790.6750.6510.6633220
Emergency0.4370.0830.1400.4130.1140.1793201
Breastfeeding problem0.5950.5050.5470.5970.4570.5181579
Asthma or wheezing0.5760.2570.3550.5770.2750.3721519
Elbow problem0.5650.6210.5920.6640.5990.630766
Solar exposure pr.0.5650.7590.6480.5850.5820.584601
Crisis adaptation pr.1.0000.0060.0130.0000.0000.000313
Measles problem0.7060.1070.1860.8000.0710.131112
Heat problem0.3330.0790.1280.0000.0000.00076
average (10 least freq)0.6100.3790.3950.5010.3470.379
stdev (10 least freq)0.1760.3000.2600.2820.2870.280
minimum (full data)0.3330.0060.0130.0000.0000.000
maximum (full data)1.0000.9220.9190.9290.9320.931
average (full data)0.7250.6710.6770.7120.6740.683
stdev (full data)0.1360.2130.1990.1850.2240.212
Table 5. Confusion matrix for “Cough” and “Flu syndrome” pathways using 2017–2018 models.
SVMCNN
CoughFluOther CoughFluOther
Cough102,339927110,988Cough101,60310,63610,359
Flu782126,5227484Flu715727,7486922
Other14,9899432991,171Other11,72811,015994,040
Table 6. Agreement between experienced analyst (e), ground truth (g) and SVM (s) and CNN (c) models.
Clinical PathwayTotale-ge-se-cg-sg-cs-c
Cough10245559
Nausea and vomiting problem9243338
Abdominal pain10556679
Oropharynx problem9467349
Rash8123447
Flu syndrome10378438
Diarrhea9123449
Urinary problem107879109
Body temperature change problem10377537
Chest pain9578769
Sub-total (10 most frequent)94335257504984
Fainting or lipothymia10365547
Foreign body problem10865878
Emergency7322206
Breastfeeding problem10067329
Asthma or wheezing problem9066008
Elbow problem10423239
Solar exposure problem8656458
Crisis adaptation problem8066009
Measles problem100660010
Heat problem10176008
Sub-total (10 least frequent)92255252242182
TOTAL186581041097470166
Disclaimer/Publisher’s Note: The statements, opinions and data contained in all publications are solely those of the individual author(s) and contributor(s) and not of MDPI and/or the editor(s). MDPI and/or the editor(s) disclaim responsibility for any injury to people or property resulting from any ideas, methods, instructions or products referred to in the content.

