1. Introduction
Cryptocurrencies are digital assets whose transfers and accounting are cryptographically estabilished through the blockchain [
1]. Even though they are not backed by any physical asset, they have become popular financial assets for online trading. After bitcoin, which is the first and most famous cryptocurrency [
2], many different cryptocurrencies have been created, thus increasing the options to invest in cryptoassets significantly.
Following the recent trends on algorithmic trading, many research efforts have been devoted to designing cryptocurrency trading systems based on Machine Learning (ML) and Artificial Intelligence (AI). Existing methods rely on algorithms that span from classical classification and regression methods (e.g., [
3,
4,
5,
6,
7]) to Deep Learning architectures (e.g., [
8,
9,
10,
11]). The aim is to learn predictive models from historical data related to cryptocurrency assets (e.g., markets, blockchain-related data, news) and apply them to forecast the future price directions. A recent survey on cryptocurrency trading can be found in [
12].
Although Machine Learning-based solutions have shown to achieve better performance than simpler heuristic methods [
12], they suffer from the lack of transparency. In fact, most state-of-the-art classification models, including all the Neural Network-based approaches, are not explainable; i.e., domain experts cannot gain insights into the model decisions. Cryptocurrency markets can be influenced by a large variety of factors, including the underlying market trends, the characteristics of the blockchain, and the sentiment of financial investors on the virtual assets. This prompts the need for new approaches aimed at explaining ML reasoning in cryptocurrency trading.
This work focuses on leveraging an established eXplainable AI (XAI) method, namely SHapley Additive exPlanations (SHAP) [
13], to provide domain experts with an effective visualization of the ML reasoning behind cryptocurrency trading. SHAP quantifies the contribution of different features on classifier predictions, thus highlighting the contribution of different factors to the decisions of the ML-based system. We aim at addressing the following research questions:
Q1: What are the most discriminative features for cryptocurrency price prediction?
Q2: How can cryptocurrency investors be provided with quantitative estimates of the influence of specific features and feature categories on machine learning-based cryptocurrency predictions?
Q3: How can we evaluate the statistical dependency of the Machine Learning (ML) feature ranks returned by SHAP in different time periods and on different cryptocurrencies?
To address Q1, this paper explores a large variety of features computed on the daily price series of 21 different cryptocurrencies. The analyzed features are established for cryptocurrency trading [
12] and encompass the price- and volume-related series, the technical indicators summarizing the momentum, volatility, and moving averages of the original price series, and the blockchain-related features. The latter are particularly relevant to the scope of the present study because they are peculiar to cryptoassets.
To address Q2, we use eXplainable AI methods based on the Shapley value [
14] to provide cryptocurrency traders with evidence of the main factors influencing algorithmic trading. We present a new eXplainable AI tool for visualizing and monitoring the activities of Machine Learning-based systems, with particular attention paid to the blockchain-based features influencing the decision process.
To tackle Q3, we apply the Rank Biased Overlap similarity measure [
15] to quantify the pairwise agreement between the top-10 features shortlisted by SHAP. We also performed the experiment using feature subcategories and categories rather than individual features.
The experiments carried out on a 8-year period produce the following main outcomes:
O1: The high variability of the feature importance across different cryptocurrencies. This confirms the relevance of eXplainable AI solutions for cryptocurrency traders.
O2: A visual eXplainable AI tool, namely Crytpocurrency-based Machine Learning Explainer (CryptoMLE, in short). Some practical examples of use of CryptoMLE are also presented.
O3: The dependency among the feature ranks is weak, whereas those among feature subcategories and categories are stronger.
The paper is organized as follows:
Section 2 overviews the related literature.
Section 3 details the dataset employed in the study.
Section 4 and
Section 5 introduce the fundamentals of Shapley values and SHAP and presents the Visual Analytics tool, based on SHAP, to support cryptocurrency investors’ activities.
Section 6 summarizes the main empirical results, whereas
Section 7 and
Section 8, respectively, report a discussion of the main achievements and open issues and draw the conclusions of the present work.
2. Comparison with Prior Works
Table 1 summarizes the main characteristics of the existing approaches to eXplainable AI (XAI) in finance, including the Crytpocurrency-based Machine Learning Explainer (CryptoMLE) presented in this paper. We analyze the current and prior works under the following aspects:
The considered assets, which encompass specific stocks, cryptocurrencies, or a combination of the above (e.g., the stocks belonging to the Standard&Poor500 U.S. index).
The features under analysis, which describe the environmental and market characteristics considered by the classification models (including the blockchain-related features for cryptocurrency assets).
The availability of a user interface to support domain expert decisions.
The main model used to explain ML-based decisions (e.g., SHAP [
13] for the proposed CryptoMLE tool).
The resolution of the analyzed data (typically, one sample per trading day).
The goal of the approach (e.g., support decision making with data-driven insights for CryptoMLE).
The main goal of this work is to present a visual analytics tool providing AI-based explanations for cryptocurrency investors. Notice that our goal is not to propose a new, more effective trading system but rather to provide experts with an interactive tool, based on XAI, to explain the decisions of algorithmic trading approaches and make appropriate decisions.
Similar to [
16,
17,
18], CryptoMLE provides domain experts with a graphical interface. Unlike all the prior works on algorithmic trading, it also allows them to interactively collect, analyze, and compare data models trained in multiple time periods. Analogously to [
18], CryptoMLE analyzes a large number of cryptocurrencies. Unlike [
18], it also considers blockchain-related data.
CryptoMLE relies on SHAP [
13], whereas other approaches (e.g., [
17,
19]) adopt simpler explainable models such as partitional clustering and decision tree, which are known to be less robust to noise and model bias than SHAP. The work recently proposed in [
20] is, to the best of our knowledge, the first attempt to use SHAP in algorithmic trading. Unlike [
20], this work (1) Addresses short-term cryptocurrency trading instead of long-term portfolio management. Hence, it compares the outcomes of classification models predicting next-day cryptocurrency price; (2) Presents a graphical tool for supporting decision making. It also allows experts to interact with the tool and gain insights into specific market trends; (3) Analyzes a significantly larger set of cryptocurrencies (21 vs. 8).
Table 1.
Comparison with prior works. Legend: crypto = cryptocurrency/cryptocurrencies, BC = blockchain, MA = market data, V = Exchanged volumes, TA = technical analysis, B6 = CME Globex British Pound futures, SPF = S&P E-mini Futures.
Table 1.
Comparison with prior works. Legend: crypto = cryptocurrency/cryptocurrencies, BC = blockchain, MA = market data, V = Exchanged volumes, TA = technical analysis, B6 = CME Globex British Pound futures, SPF = S&P E-mini Futures.
| | | | User Interface | | | |
|---|
| Paper | Asset | Features | Graphical | Interactive | XAI Model | XAI Resolution | XAI Goal |
|---|
| CryptoMLE | 21 crypto | BC, MP, TA | Yes | Yes | SHAP [13] | Daily | Decision making |
| [21] | S&P index | MA | No | No | Ablation, permutation, added noise, integrated gradients [22] | Daily | XAI model comparison |
| [23] | CHES120 China | MA | No | No | Custom LightGBM-based model [24] | 10 s, 30 s, 1 min ticks | Matching testing and real-trading performances |
| [20] | 8 crypto | MA | No | No | SHAP [13] | Daily | Portfolio management approach for crypto |
| [19] | The BTC crypto | BC, MA | No | No | K-means clustering, decision tree classifier [25] | Daily | Valuation method for cryptocurrency markets |
| [16] | The ETH crypto | MA, TA | Yes | No | Adversarial Deep Neural Networks [26] | Daily | Display reversal patterns on candlestick charts [27] |
| [17] | The S&P stocks | MA, TA, News | Yes | No | decision tree classifier | Daily | Identify the most impactful words in business-specific stock market sectors |
| [18] | 18 crypto | MA, Reddit | Yes | No | Ensemble methods, co-occurrence analyses [25] | Daily | Correlation analysis between crypto |
| [28] | B6, SPF | MA, V | No | No | Decision trees [25], SHAP [13] | Daily | Adapt market data to the Machine Learning pipeline. |
3. Data Overview and Categorization
We collect historical data about the 21 most popular cryptocurrencies within the time period from 2011 to 2018 (For the cryptocurrencies whose year of introduction is after 2011, we gathered data from the date they became available.). In the experiments we sampled cryptocurrency data at a daily granularity. However, the performed analyses can be straightforwardly extended to finer or coarser aggregation levels.
We consider three main feature categories:
The
Blockchain-related (BC) features, which describe the underlying characteristics of the distributed ledger technology enabling each cryptocurrency [
18].
The
Market Data (MD) features, which represent the main cryptocurrency Open–High–Low–Close–Volume (OHLCV) price series as well as a selection of summarized features derived from the candlestick chart [
29].
The
Technical Analysis (TA) features, which include a variety of momentum indicators, volatility indices, and oscillators that are commonly used in Technical Analysis on both cryptocurrencies and regulated market assets [
8].
3.1. Blockchain-Related Features
We gathered BC features containing various specific properties of the enabling blockchain architecture, which are aggregated on a daily basis. The 30 features belonging to the BC category cover different aspects addressed by the following subcategories: Address, Economics, Exchange, Fees and Revenues, Market, Mining, and Network Usage. They are likely to show direct or indirect relations with the cryptocurrency bid and ask prices. Hence, they can be deemed relevant by the Machine Learning model to obtain accurate price predictions.
The high variability of the technologies enabling each cryptocurrency makes cross-cryptocurrency analyses of BC features particularly relevant to understand the rationale behind Machine Learning predictions. For example, the in-depth analysis of the blockchain supply and mining features can reveal an increasing/decreasing interest of the cryptocurrency investors in particular virtual assets.
3.2. Market Data Features
MD features characterize temporal trends in cryptocurrency prices [
11]. The data we gathered include the raw Open–High–Low–Close–Volume (OHLCV) price series, the residuals from the Seasonal-Trend Decomposition using Loess (STL) [
30], and the characteristics of the shapes of the candles in the candlestick chart [
29].
3.3. Technical Analysis Features
Technical analysis provides a synthetic description of price- and volume-related trends [
27]. They were derived from the historical price and volume series using the TA-Lib Python library (
https://ta-lib.org/, accessed on 10 January 2022).
The TA feature category describes notable price-related properties of the cryptocurrency such as momentum, volatility, oversold/overbought conditions, etc. Recently, they have shown to be relevant to cryptocurrency trading as well [
8].
4. SHapley Additive Explanation Values
SHapley Additive Explanation (SHAP, in short) [
13] is a method to explain individual predictions. It is based on the Shapley value, whose applications to eXplainable AI rely on coalitional game theory [
14].
4.1. The Shapley Value
Given a set of players
= {
,
, …,
}, a
player coalition is a
’s subset cooperating to accomplish a specific task. The
utility (
) evaluates the payoff of the coalition for the task, whereas the
marginal utility (
) indicates the additional contribution provided by a new player
being added to the coalition
, i.e.,
The Shapley value [
14] is the expectation of the marginal contribution
in all possible coalitions.
Computing the exact Shapley value entails enumerating all the possible coalitions, which is computationally prohibitive in real-world contexts.
4.2. Additive Feature Attribution Methods
Given a training dataset consisting of a set of features = {, , …, }, each value of an individual feature acts as a player in a coalition. The number n of considered features can be interpreted as maximum coalition size.
Let f be a complex prediction model, trained on instances. For the sake of simplicity, we assume the financial forecasting model f predicts the next-day closing price direction (i.e., Uptrend or Downtrend) of a specific cryptocurrency based on the past samples observed in the last W days (Hereafter, we will disregard the Stationary class (neither uptrend nor downtrend)).
We seek explanations of f clarifying the effects of features in . Specifically, we aim at explaining the prediction f(x) of an instance x of by computing the contribution of each individual feature.
Within this scope, the Shapley value of feature indicates how to fairly distribute the payout among the features; i.e., it quantifies the effect of the individual feature on the outcome of the prediction task. To generalize players as sets of feature values, we exploit the additive feature attribution method to linearly combine the individual Shapley values.
The explanation model
g is defined as a linear combination of binary features associated with each feature
:
where
is a binary variable denoting either the presence of a feature (
= 1) or its absence (
= 0).
is the
’s attribution value, which quantifies the effect of
on
f(
x). The explanation model sums the effect of all individual feature attributions approximating the output.
4.3. The SHAP Explanation Model
In [
13], Shapley values are leveraged to explain Machine Learning models by applying sampling approximations to the original Shapley expression. Specifically, it approximates the effect of removing a variable from the model by integrating over samples from the training dataset.
The key steps of the SHAP model generation are as follows:
Generate random sample coalitions of m < n features in , where .
Sample coalitions to valid instances.
Train a regression model on the generated instances, whose target is the prediction for a coalition.
To move from coalitions of feature values to valid data instances (Step 2), instance values are taken from the instance x we want to explain for all features that are present in the coalition ( = 1), whereas the other features are randomly sampled from the training dataset instances for all the absent features ( = 0).
The regression function (Step 3) corresponds to the weighted linear explanation model g previously defined according to the additive feature attribution method.
5. The CryptoMLE Tool
Receiving advice from algorithmic advisors is becoming more and more popular for financial analysts [
31]. However, relying on sophisticated Machine Learning models trained on massive datasets is particularly risky in financial market forecasting, because the ML models often act as black boxes and domain experts are not keen to trust.
EXplainable AI models provide insights into ML algorithms by indicating which features are more important and how they could affect ML predictions [
32]. They can return either local or global explanations. In the former case, the insight is about a particular instance
x. The local model estimates the effect of the features in
on
f(
x) [
13]. Conversely, global models summarize the main patterns driving ML decisions (on whatever instance). In this work, we conveniently combine the local explanations of the cryptocurrency price predictions provided by SHAP to model the global influence on ML models of individual features, features subcategories and categories.
We present a visual eXplainable AI tool, namely Crytpocurrency-based Machine Learning Explainer (CryptoMLE, in short). It supports cryptocurrency traders and investors in monitoring the performance of quantitative Machine Learning-based cryptocurrency predictions. CryptoMLE consists of an interactive dashboard summarizing the main feature contributions to the ML price predictions.
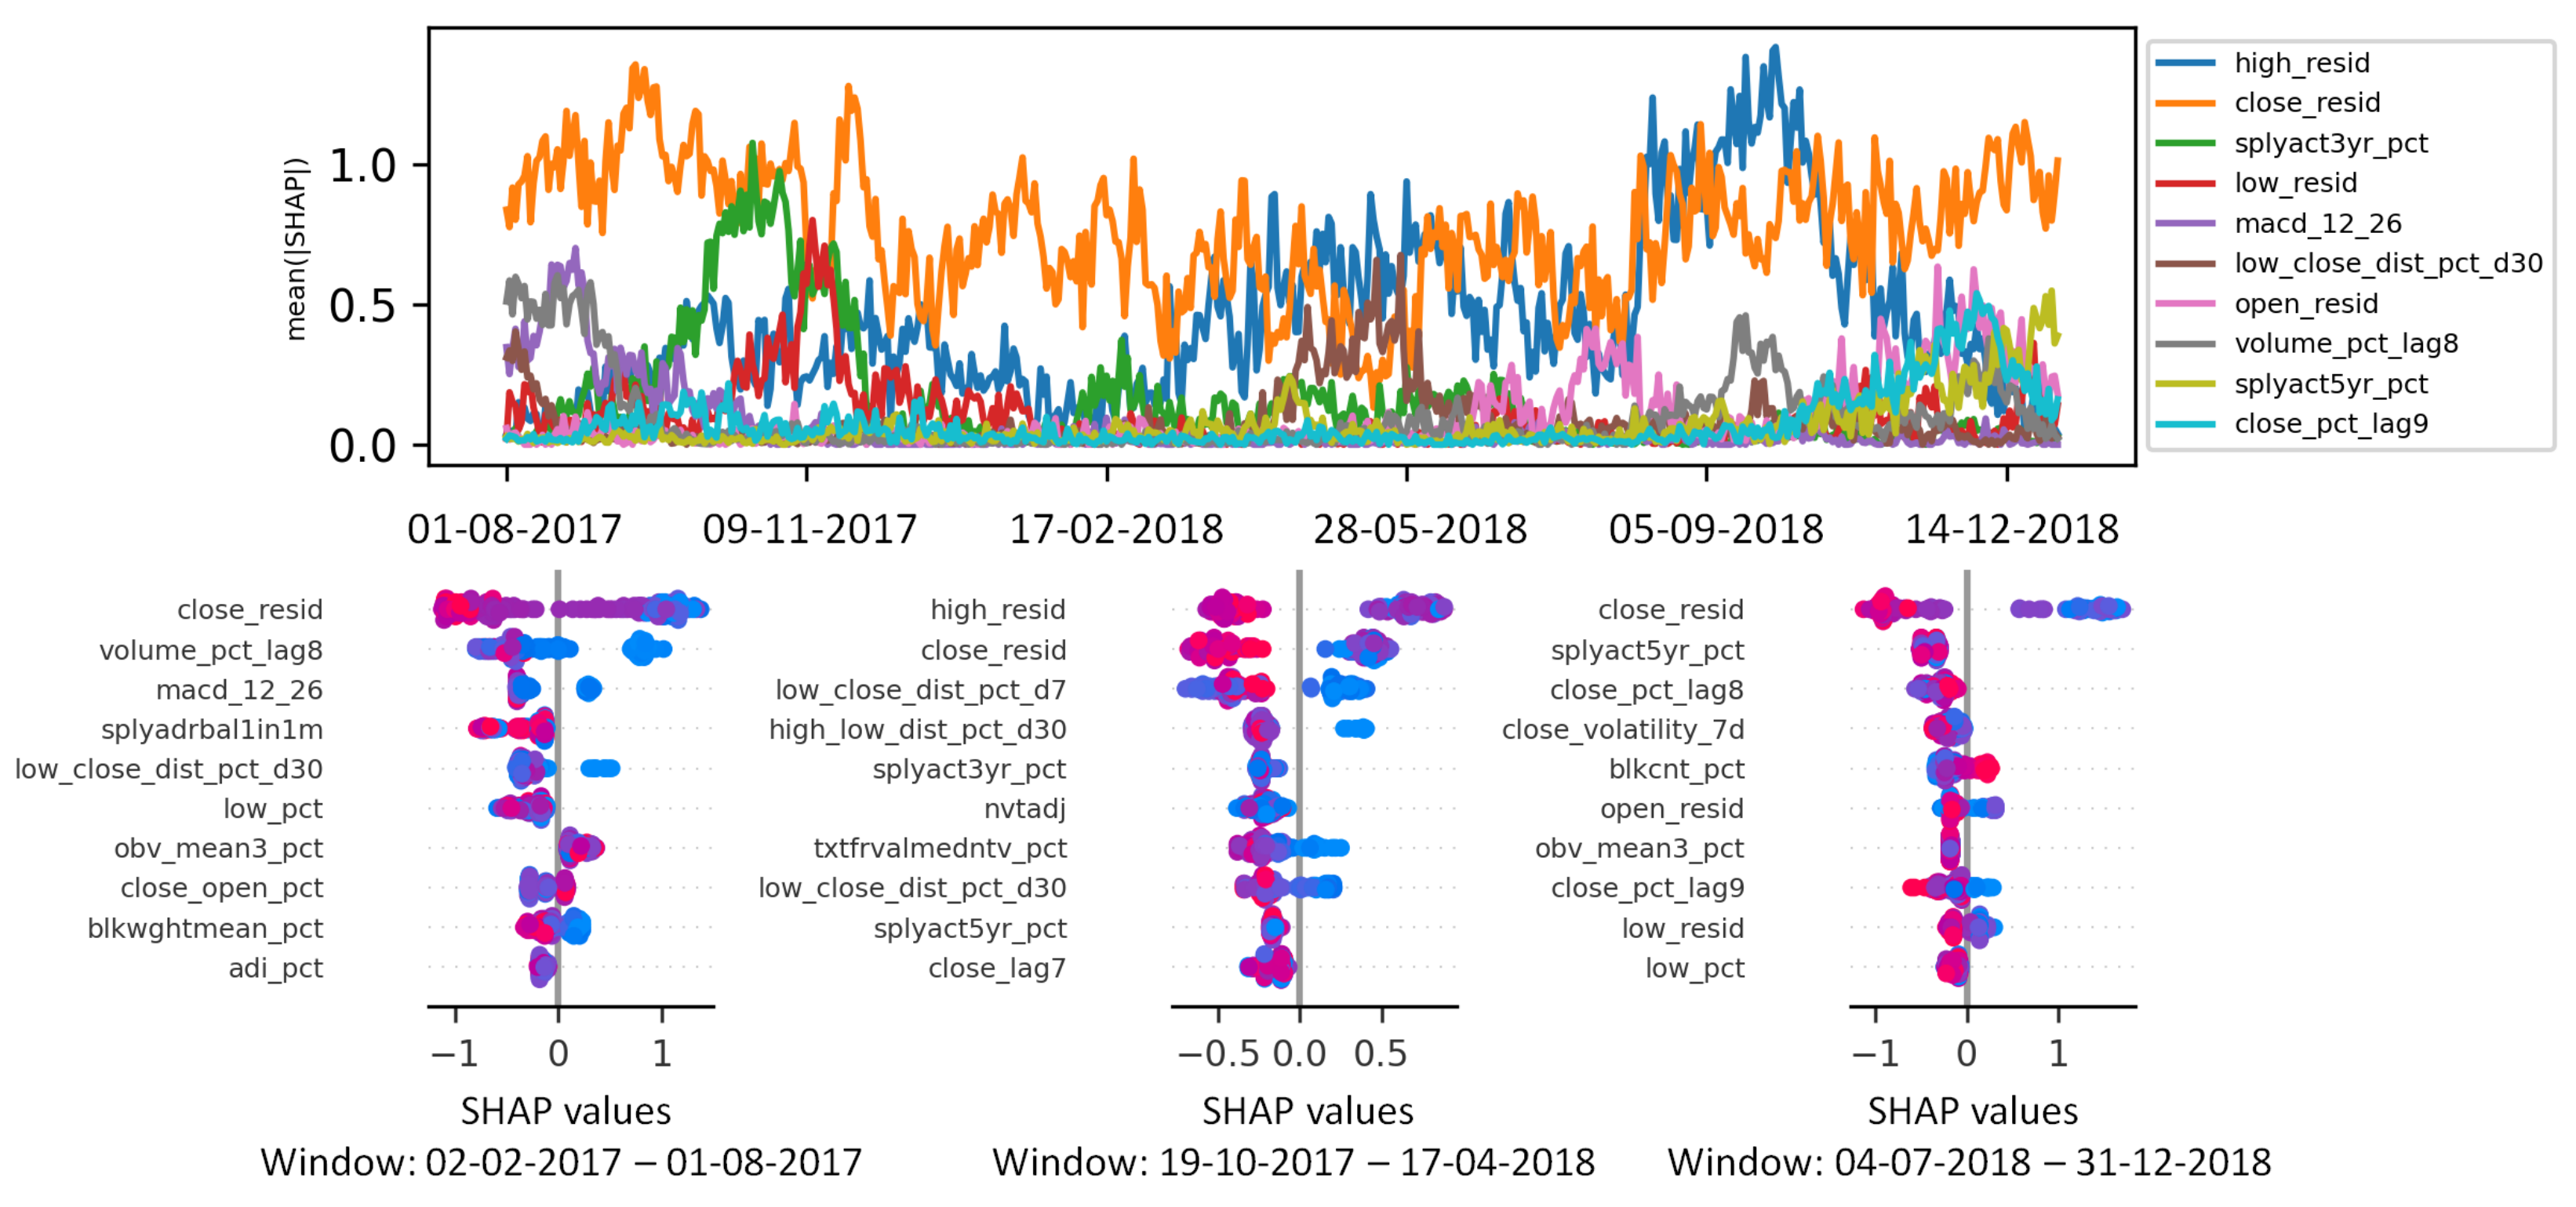
A snapshot of the dashboard interface is depicted in
Figure 1. The plot in the upper side of the dashboard shows the SHAP time series of the 10 most influential features in the prediction of class
uptrend. The purpose is to explain how ML works within a restricted time period and how ML decisions vary over time. More specifically, a time series value sampled on day
d consists of the mean Shapley value of a given feature
computed over the
W days preceding
d (Since historical data are collected at a daily granularity, each time point in the series corresponds to a distinct trading day.). The mean Shapley value of
indicates the effect of
on the ML model trained on
d using a sliding window approach.
For example, according to the SHAP series plot in
Figure 1, the MD feature
close_resid appears to be the most influential one in the period between August 2017 and April 2018, whereas between May 2018 and December 2018,
Close_resid and
High_resid are joint winners. The SHAP series plot can be useful, for instance, for discretionary traders who need to select and monitor a relatively small subset of visual features.
The bee-swarm summary plots in the lower side of the dashboard snapshot are pop-up windows that analysts might activate when they are interested in gaining insights into the characteristics of the ML model trained on a particular day. It shows the Shapley values of all instances belonging to a training window of size W (i.e., W points per feature). For the sake of readability, only the top-10 features in order of decreasing Shapley value are visualized.
For example, according to the left hand-side bee-swarm summary plot in
Figure 1,
close_resid,
volume_pct_tag8 macd_12_26, and
low_close_dist_pct_d30 are the only features obtaining a significant number of positive Shapley values during the training window from the beginning of February 2017 to the end of July 2017. Comparing different summary plots over time can be useful, for instance, for detecting temporal changes in the ML decisions. Traders can manually verify and possibly revise the current trading strategy based on the alarms triggered by the eXplainable AI tool.
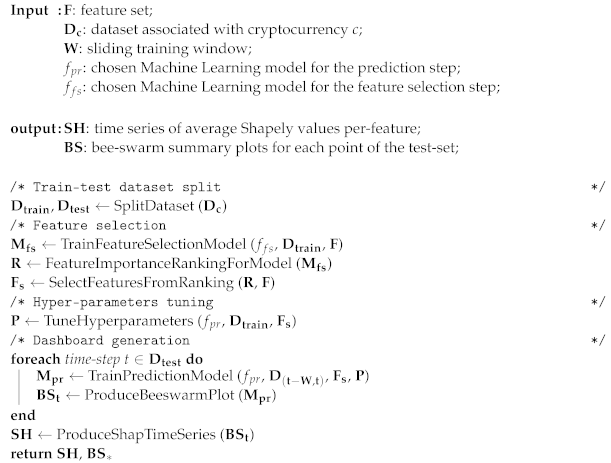
To generate the plot, we apply the procedure described in Algorithm 1 considering one cryptocurrency at a time. First, the dataset
, containing the data of the cryptocurrency
c, is split into train and test, and the feature importance scores are computed based on a general-purpose Machine Learning model trained on
(e.g., XGBoost [
33]). Then, we generate a ranked feature list, based on the importance score, and tune the system hyper-parameters. This first phase aims at performing feature selection and parameter tuning before training the following models. To have up-to-date and contextualized models, one model is retrained for each test date/time-step
t considering the latest
W days preceding
t, using the previously defined feature subset and hyperparameters; i.e., we employ a sliding window approach to train ML models tailored to the time-steps
t. Finally, the trained ML models (one per test time-step) are analyzed to compute the SHAP series and the summary plots, thus enabling the visual exploration of the ML reasoning at different time points. The procedure is repeated for all cryptocurrencies of interest.
| Algorithm 1: CryptoMLE: Procedure of dashboard generation for a cryptocurrency. |
![Futureinternet 14 00251 i001]() |
6. Experimental Results
In this section, we simulate a session of Machine Learning-based forecasting of 21 cryptocurrency prices explained by CryptoMLE.
The rest of the section is organized as follows.
Section 6.1 clarifies the experimental settings and the reproducibility aspects.
Section 6.2 reports the main findings related to Research Question 1, i.e.,
What are the most discriminative features for cryptocurrency price prediction? Empirical outcome
O1 compares the feature importance plots relative to different cryptocurrencies.
Section 6.3 addresses the Research Question 2, i.e.,
How to provide cryptocurrency investors with quantitative estimates of the influence of specific features and feature categories on Machine Learning-based cryptocurrency predictions? The empirical outcome
O2 consists of a selection of SHAP series and bee-swarm summary plots highlighting interesting trends in the analyzed cryptocurrencies.
Section 6.4 addresses the Research Question 3, i.e.,
How can we evaluate the statistical dependence of the ML feature ranks returned by SHAP in different time periods and on different cryptocurrencies? We address
O3 by evaluating the pairwise agreement between the shortlisted feature ranks using the Rank Biased Overlap similarity measure [
15].
6.1. Experimental Design
In the following, we describe the hardware used to perform the experiments and the experimental settings to improve reproducibility.
Hardware settings. We run experiments in a single-node setting on an HPC facility. The node runs Ubuntu 20.04.2 LTS, with an 8 CPU threads Intel(R) Xeon(R) Gold 6140 CPU @ 2.30 GHz and 40 GB of RAM.
Experimental settings and reproducibility. The source data described in
Section 3 and a detailed per-feature description are available for research purposes. We also release the guidelines for dashboard creation (again for research purposes only).
As a representative ML model for both classification and feature importance estimation, we used the XGBoost classifier available in the SK-Learn library [
33]. It is both efficient and accurate. To run SHAP [
13], we use the publicly available code released by the paper’s authors.
6.2. Empirical Outcome O1: Feature Importance across Cryptocurrencies
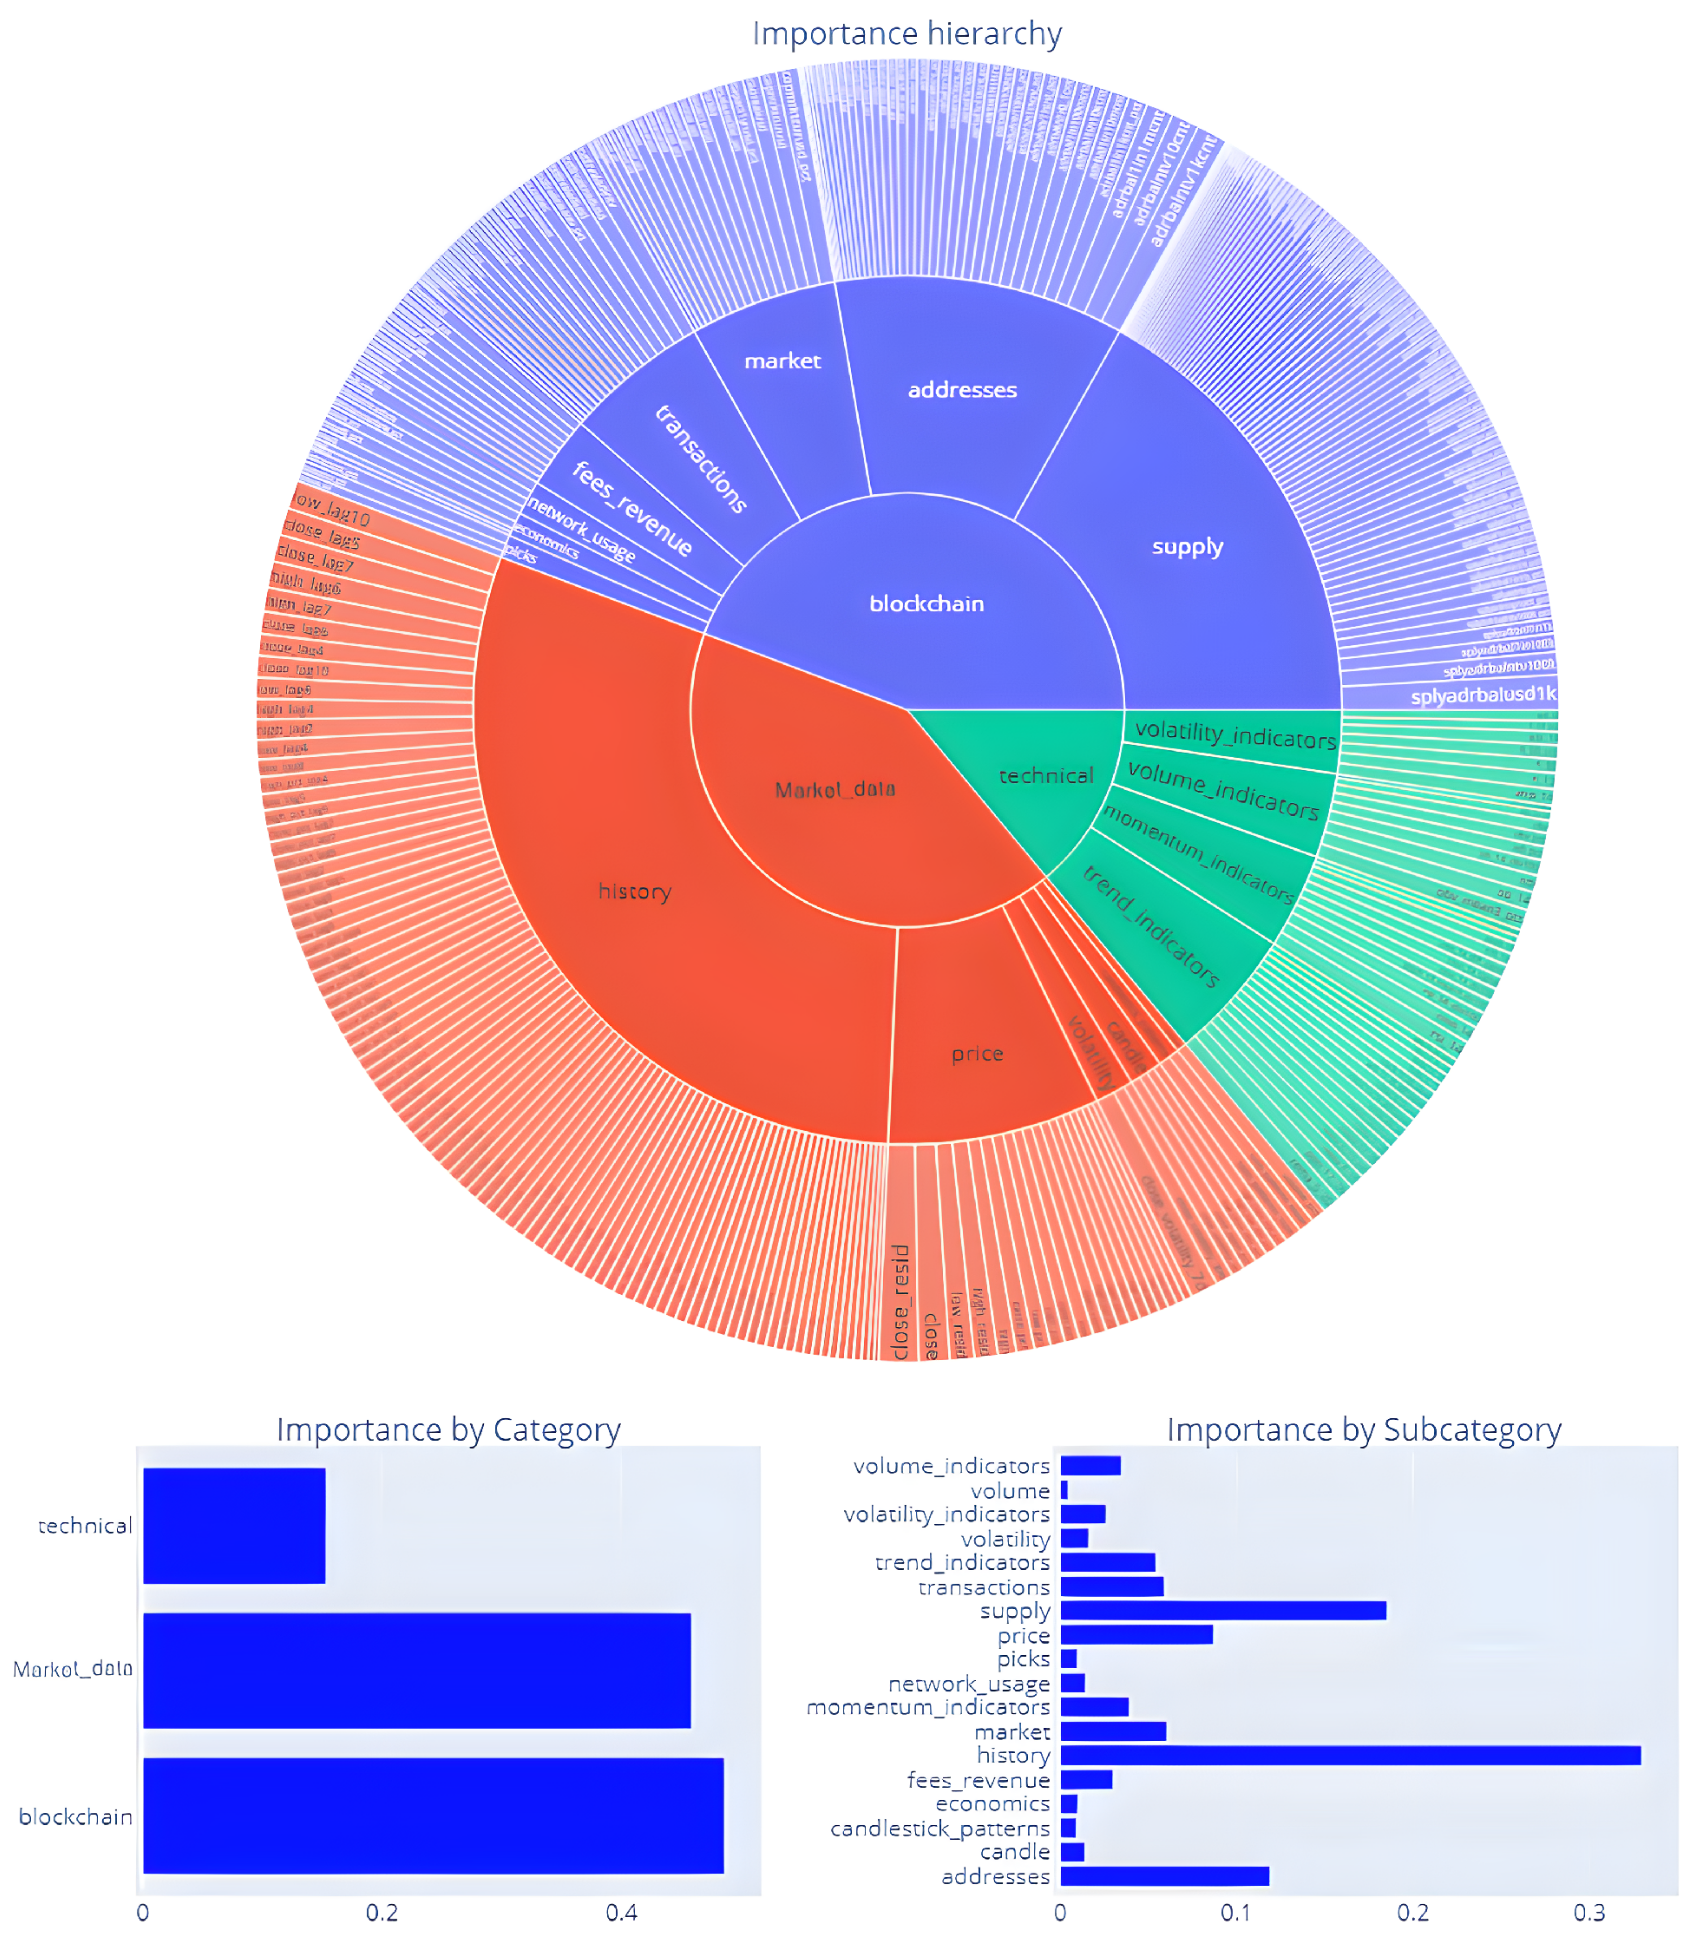
The pie charts in
Figure 2,
Figure 3,
Figure 4 and
Figure 5 show the feature importance scores (returned by the XGBoost ML model) computed over all cryptocurrencies (see
Figure 2) and separately for BTCUSD, BCHUSD, and ETHUSD (see
Figure 3,
Figure 4 and
Figure 5). BTCUSD is, by far, the most famous cryptocurrency. BCHUSD is a fork of BTCUSD, whereas ETHUSD is another extremely popular cryptocurrency.
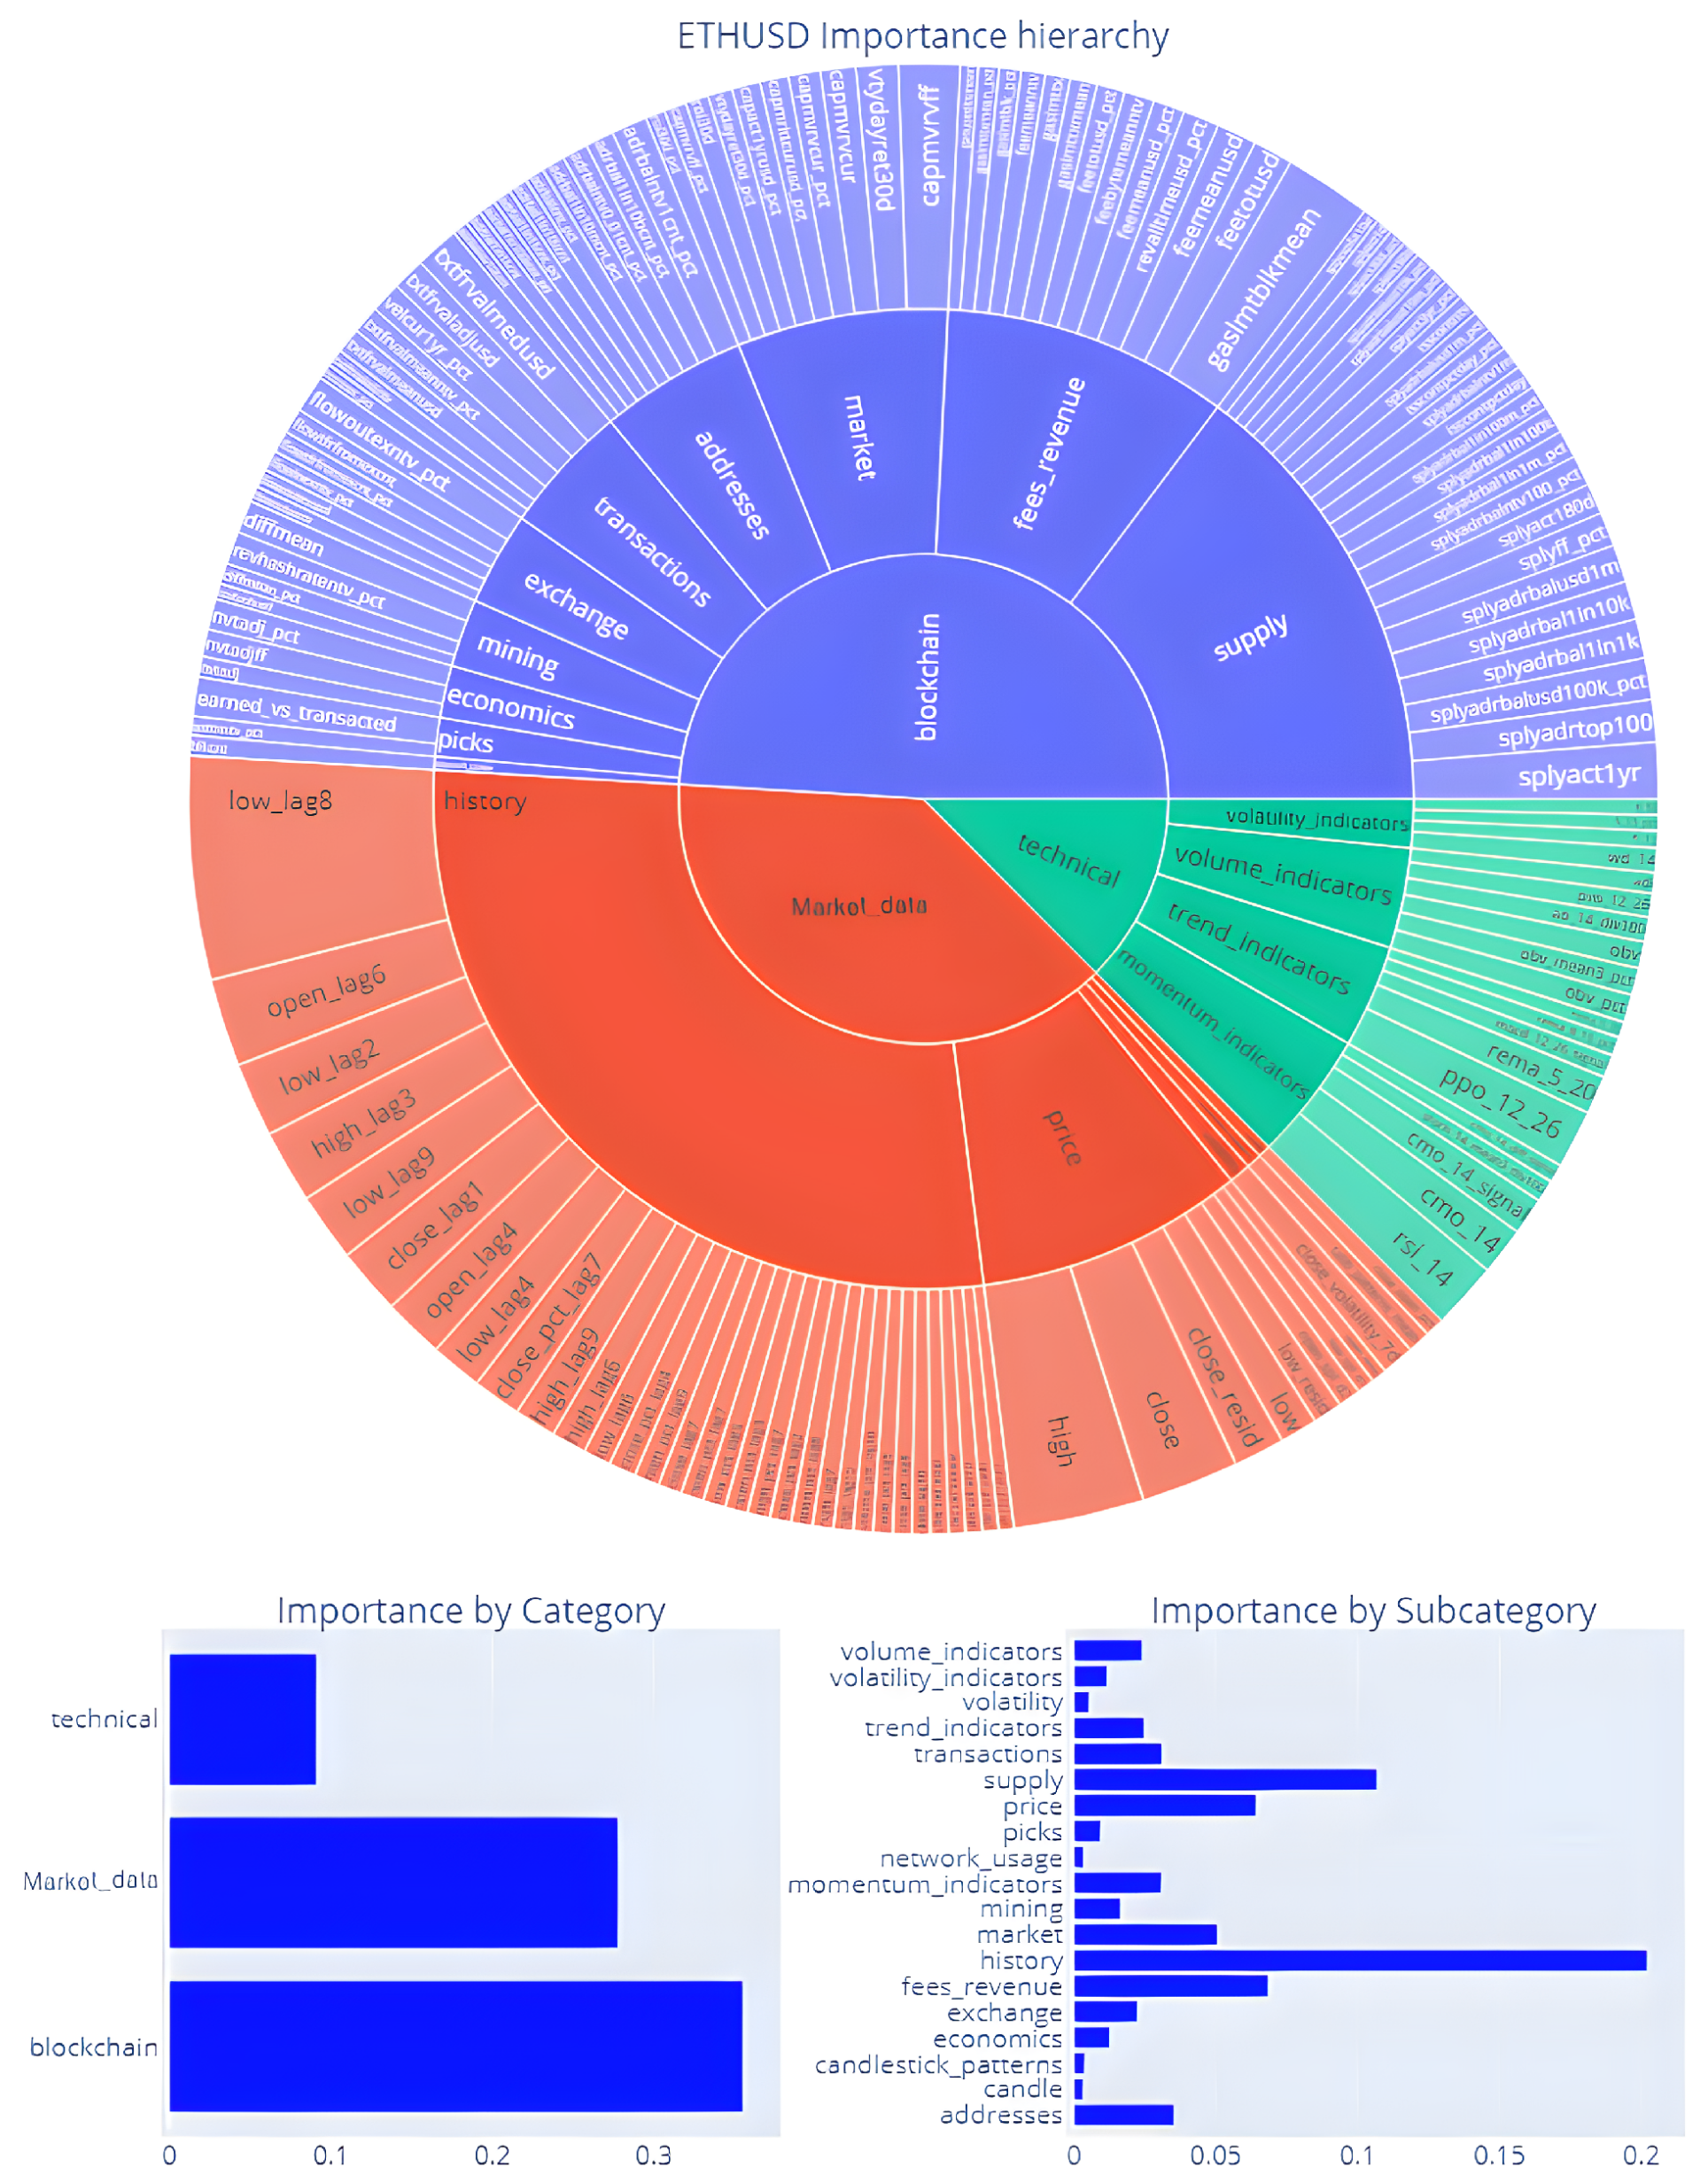
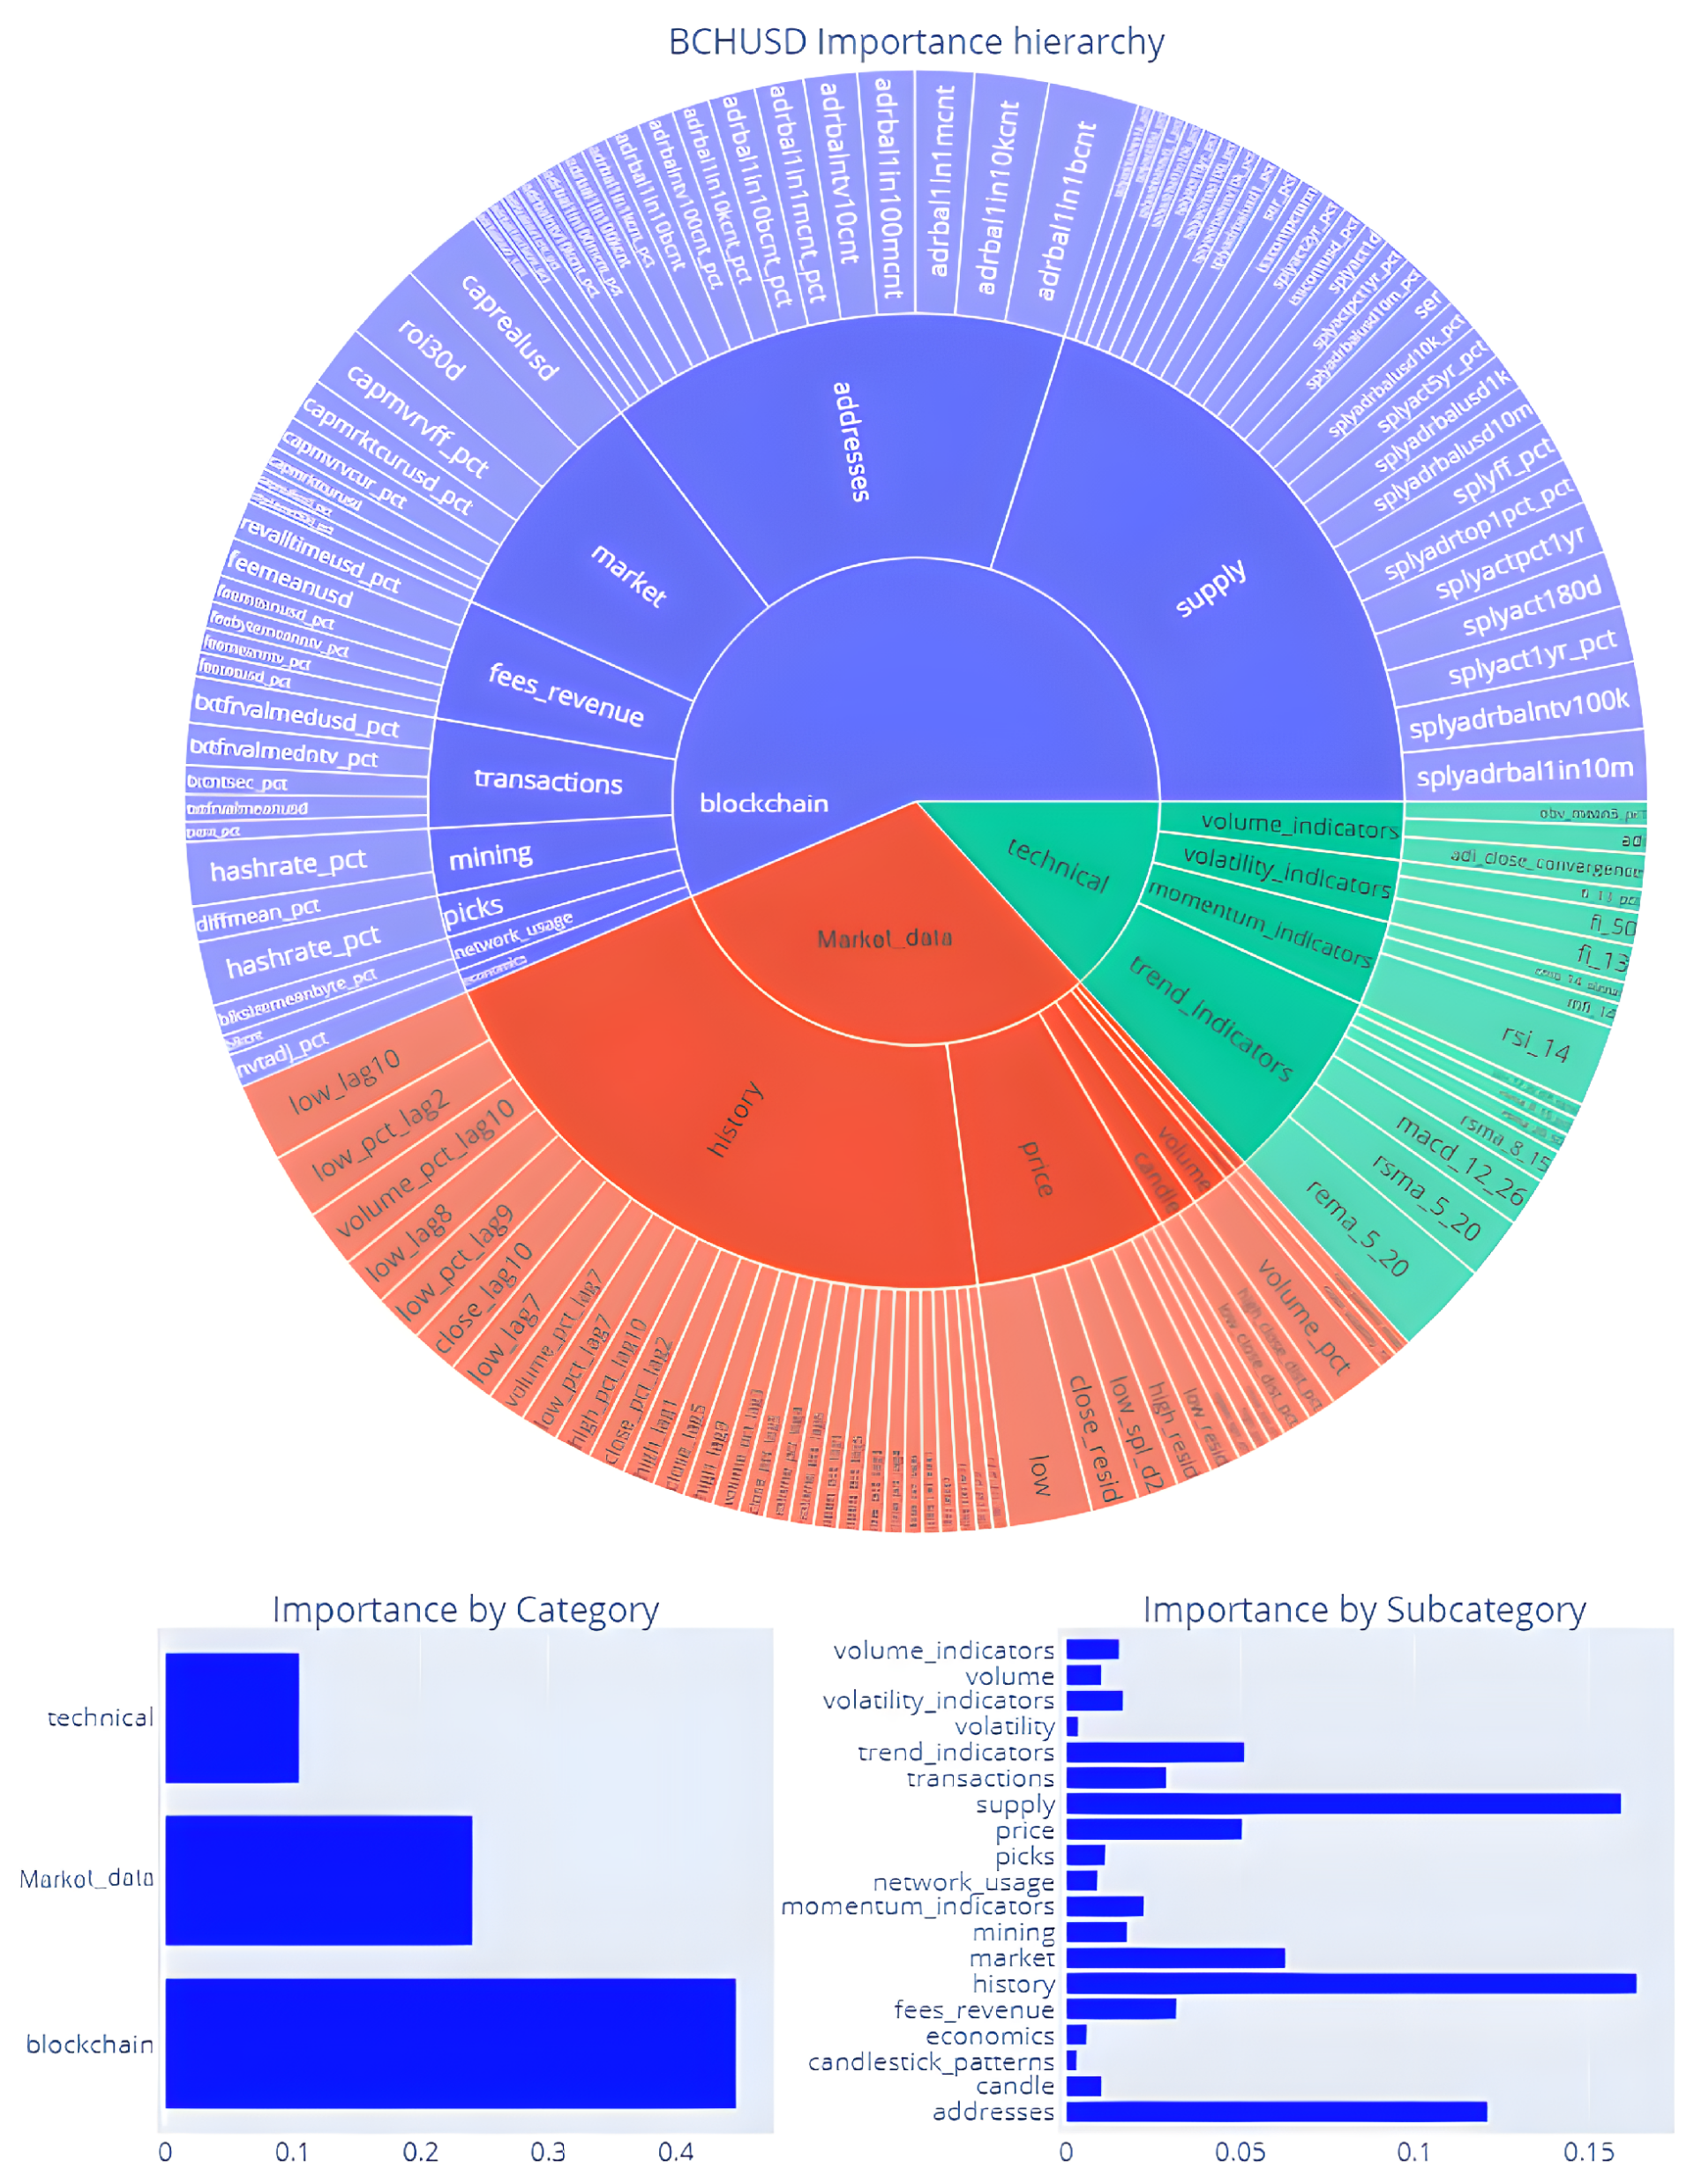
The outermost circular crown of the pie chart in
Figure 2 reports the average importance scores per feature by considering all cryptocurrencies. Specific price-related features, such as
close_resid (i.e., the Seasonal-Trend decomposition using LOESS of the closing price series [
30], have shown to be the most relevant to predict future cryptocurrency prices). However, the selected features are not the same for all cryptocurrencies and also include blockchain-related ones. For example,
hashrate_pct, which indicates the amount of computational operations that a miner or the network of miners is capable of carrying out, is particularly relevant to BitCoin casH (BCH), which has been created to specifically address efficiency issues of the most established BTC cryptocurrency. Conversely, it is not relevant to Ethereum (ETH) because ETH is known to be weakly correlated to BTC.
To have a higher-level view of which features are more discriminating for a given cryptocurrency, we also aggregate the feature importance scores per subcategory and category (see the two inner crowns in
Figure 2 and the bar charts). The most relevant features are those belonging to category
Blockchain (average score 0.48), which is followed by
Market data (0.46) and
Technical analysis features (0.16). This means that to drive their investments, cryptocurrency traders should closely monitor blockchain-related features first rather than simply analyzing price-related features (e.g., moving averages, momentum [
27]).
Focusing on the most influential subcategories, they encompass the properties of the supply chain, namely Supply (BC category), the historical cryptocurrency prices, i.e., History (MD category), and the blockchain network activity metrics, namely Addresses (BC category). It is worth noticing that restricting the in-depth analysis to these feature subsets allows experts to ignore almost 70% of the original features.
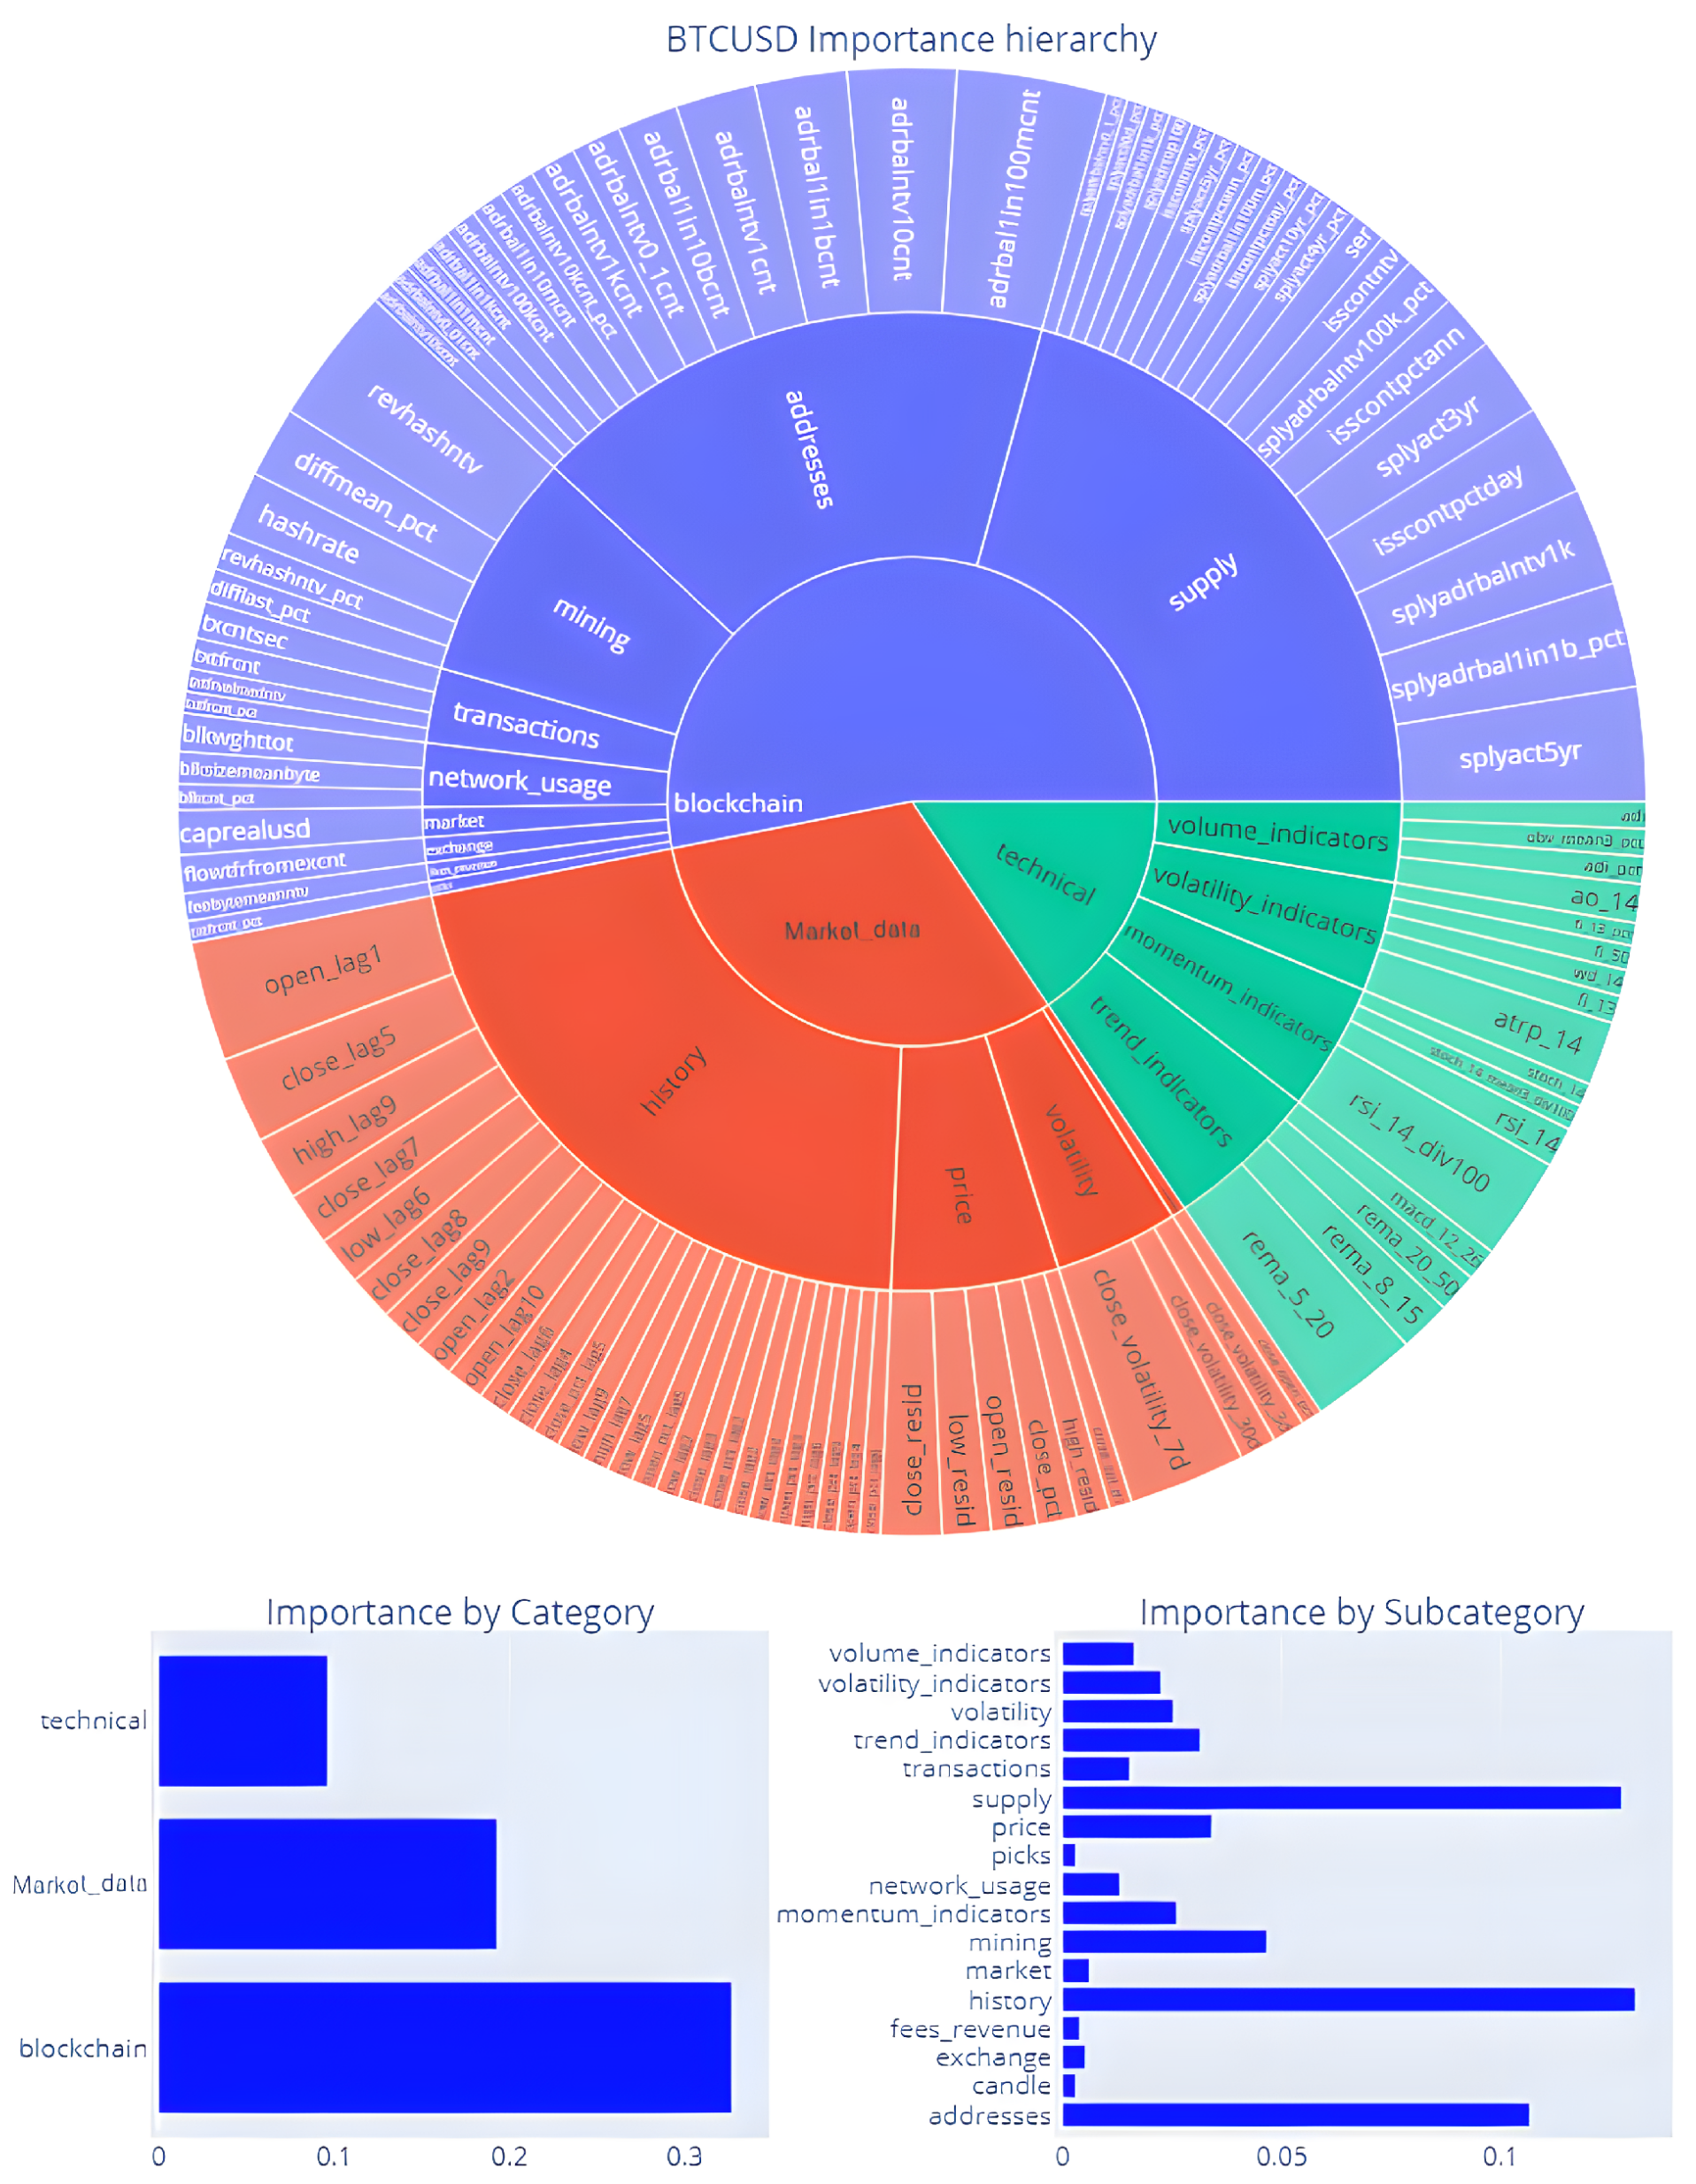
The variability in feature importance across different cryptocurrencies is also quite significant (see
Figure 3,
Figure 4 and
Figure 5). For example, for ETHUSD, the blockchain-related features turn out to be slightly less significant than for BTCUSD and BCHUSD, which is possibly due to the primary influence of the blockchain architecture on the price movements of the BiTCoin-related assets. Ethereum (ETH) is partly uncorrelated with BC and weakly dependent on blockchain-related properties such as hash rate and transaction counts.
6.3. Visual Explanations
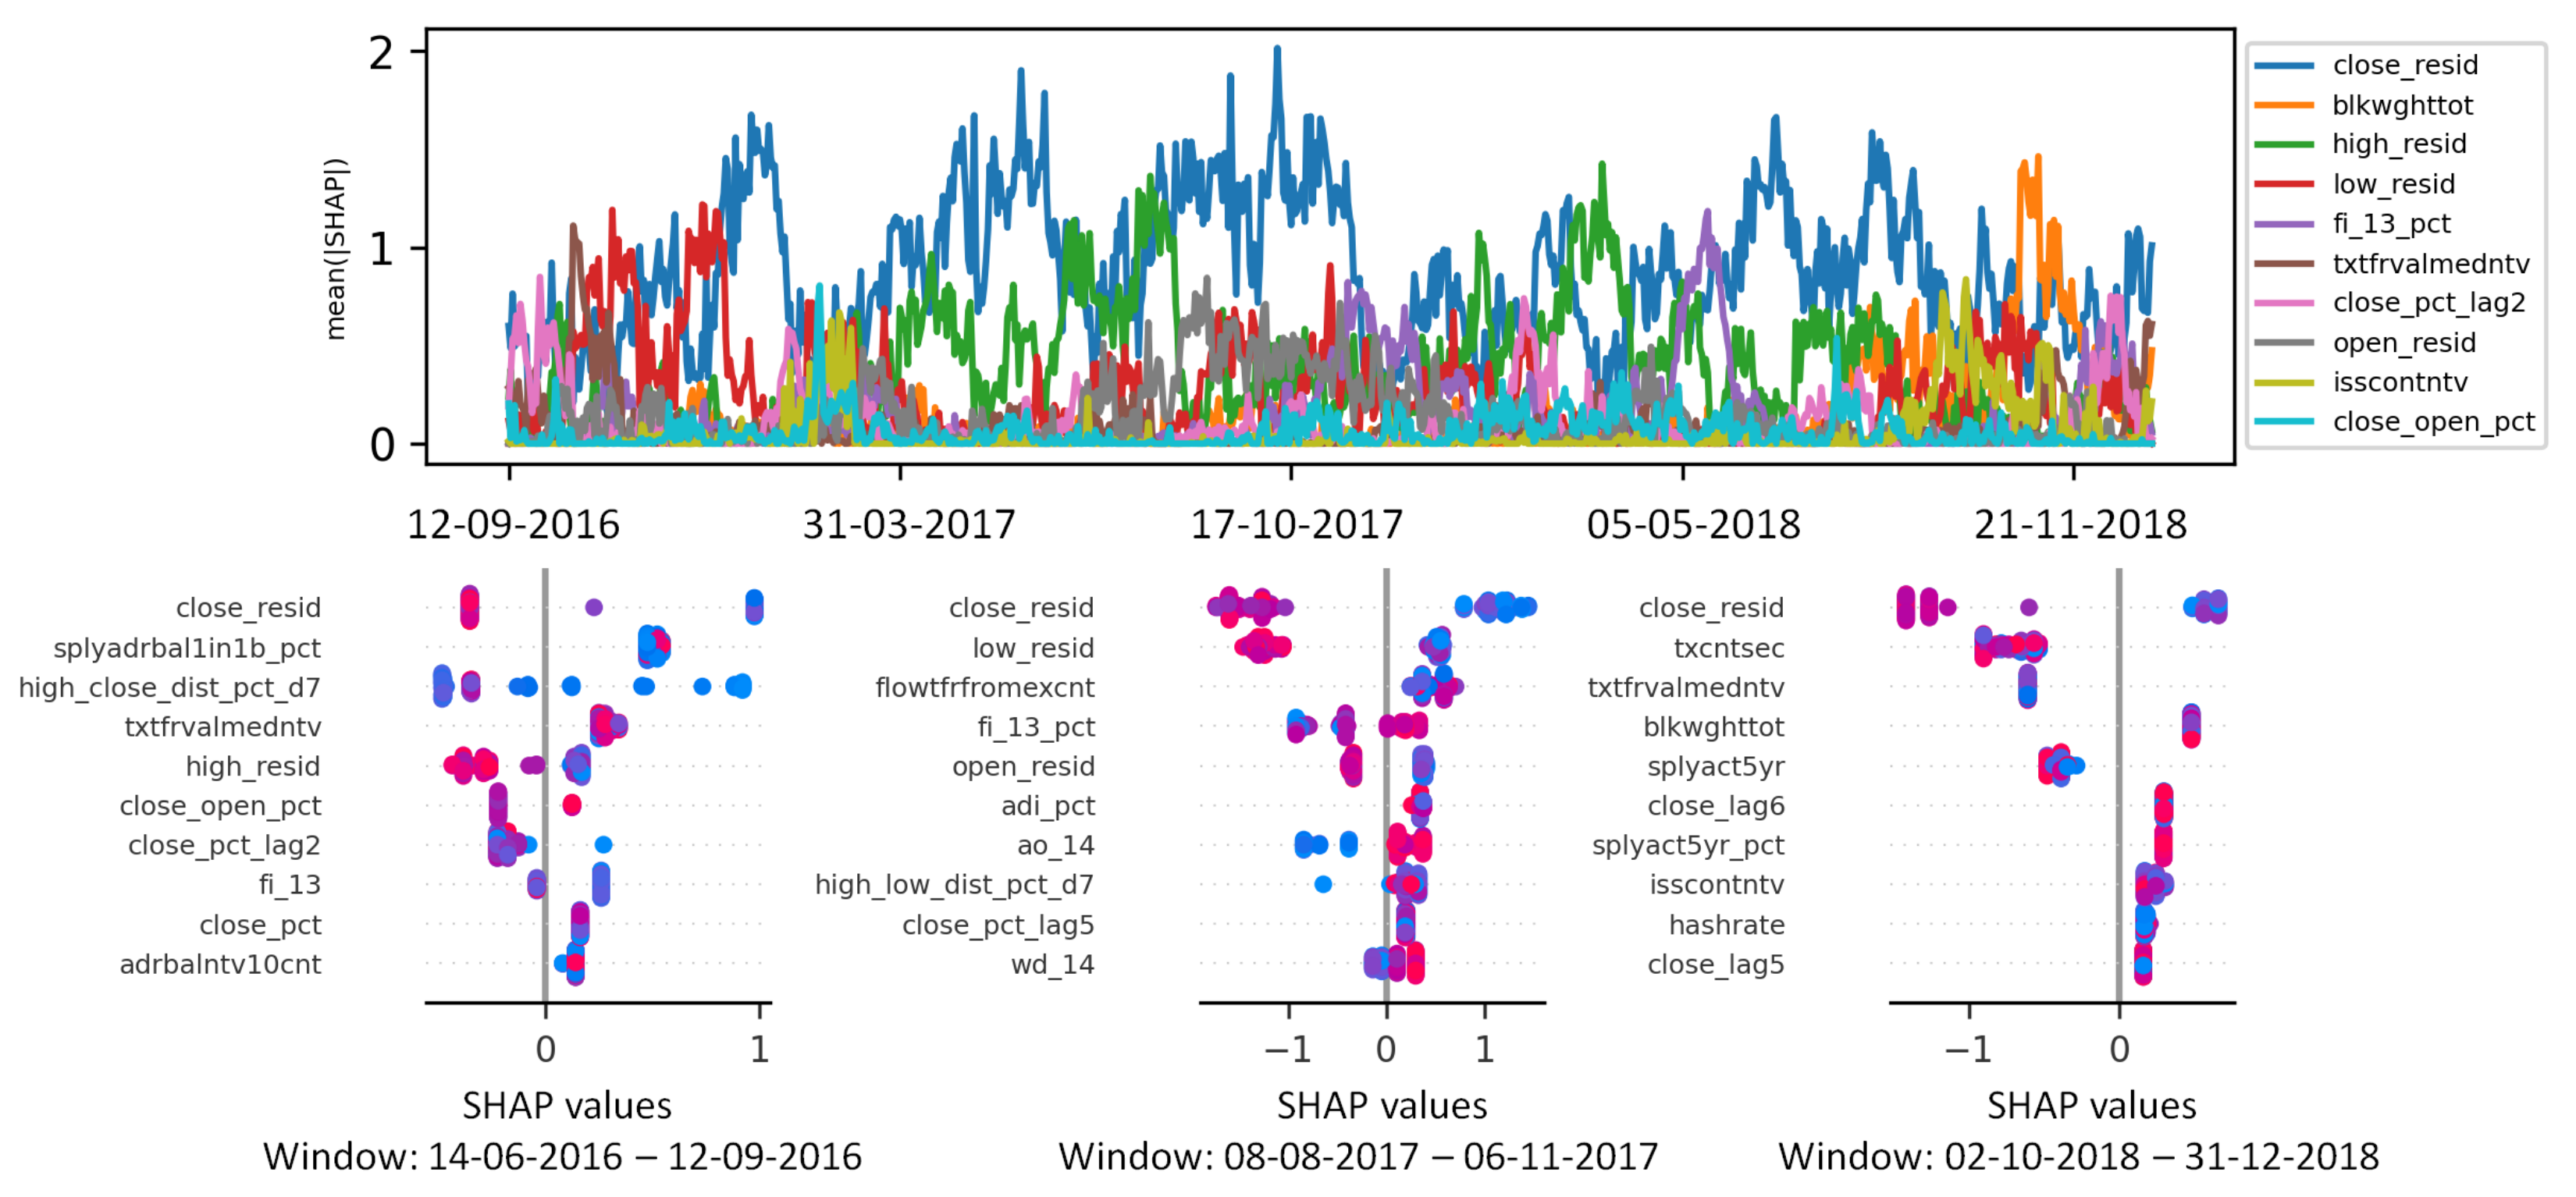
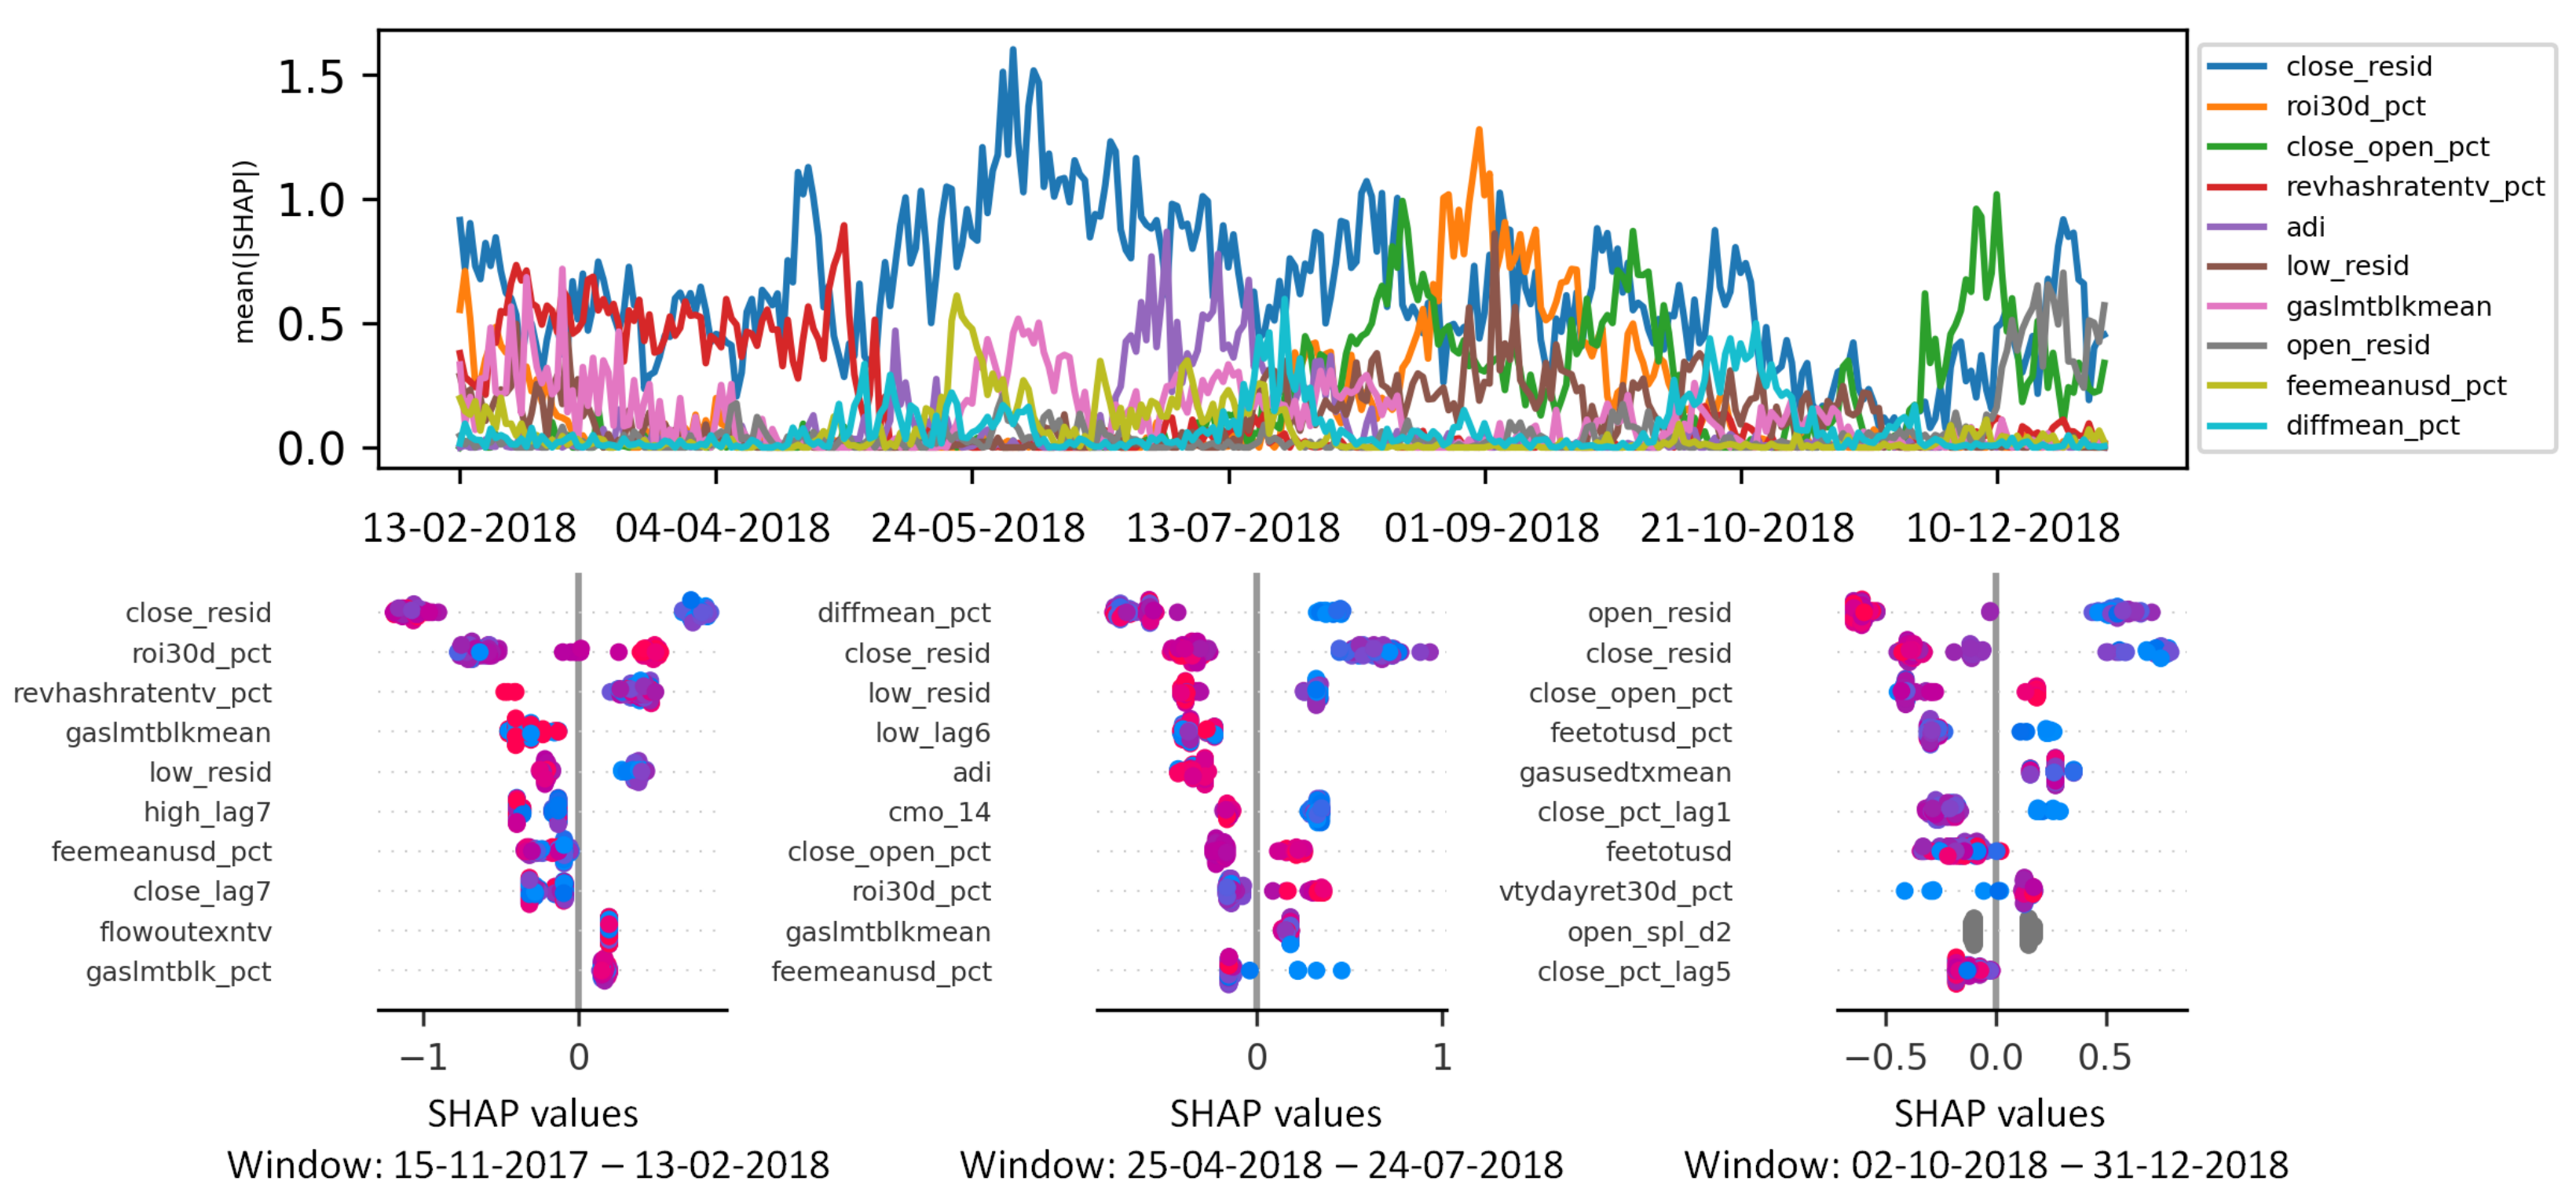
From the line chart in the upper side of
Figure 6, we can see how the average Shapley value changes over time for the top-10 most influential features for class Uptrend. Some features (e.g.,
close_resid) are always highly relevant regardless of the considered time period, whereas some others show variable influence. The latter can be dynamically included in the trading system models according to the feedback collected from the eXplainable AI tool. Moreover, traders can also use the provided information to assess the reliability of the performed predictions. If the features associated with the highest absolute Shapley values are, based on the prior knowledge of traders, remarkable features, traders will become more confident in the returned predictions and thus will likely use them in the design of the cryptocurrency trading strategy. In a nutshell, the visual explanation of CryptoMLE has a twofold aim: (1) understand the rationale behind ML decisions, and (2) discover potentially interesting (cryptocurrency-specific) patterns that are worth considering in the future trading activities.
The charts in the bottom part of
Figure 6 report the Shapley values computed for three representative windows of size
W (i.e., the ones associated with the first, the middle, and last date of the considered evaluation period). Each chart reports, for the top-10 most influential features, the Shapley values associated with the predictions made within the considered time window (i.e., one point in the plot per prediction). The absolute Shapley value indicates the strength of the feature influences. Its sign indicates whether the value of the feature positively or negatively impacts on the prediction of the Uptrend label. If the Shapley values associated with a feature are close to −1 or 1, it means that the feature affects the prediction more significantly than the other ones. As for the SHAP series plot, the variability in the summary plots over time strongly depends on the underlying market conditions. For example, in the last quarter of 2018, AI model predictions turn out to be primarily influenced by the historical price series, whereas in the previous quarters of 2018, the influence of blockchain-related features is more evident. Based on these results, domain experts can investigate more in depth the reasons behind such a strategy change to judge the reliability of the algorithmic trading approach. More specifically, in the last quarter of 2018, all the BitCoin-related plunged, and such an evident market downtrend is prevailing for algorithmic trading systems.
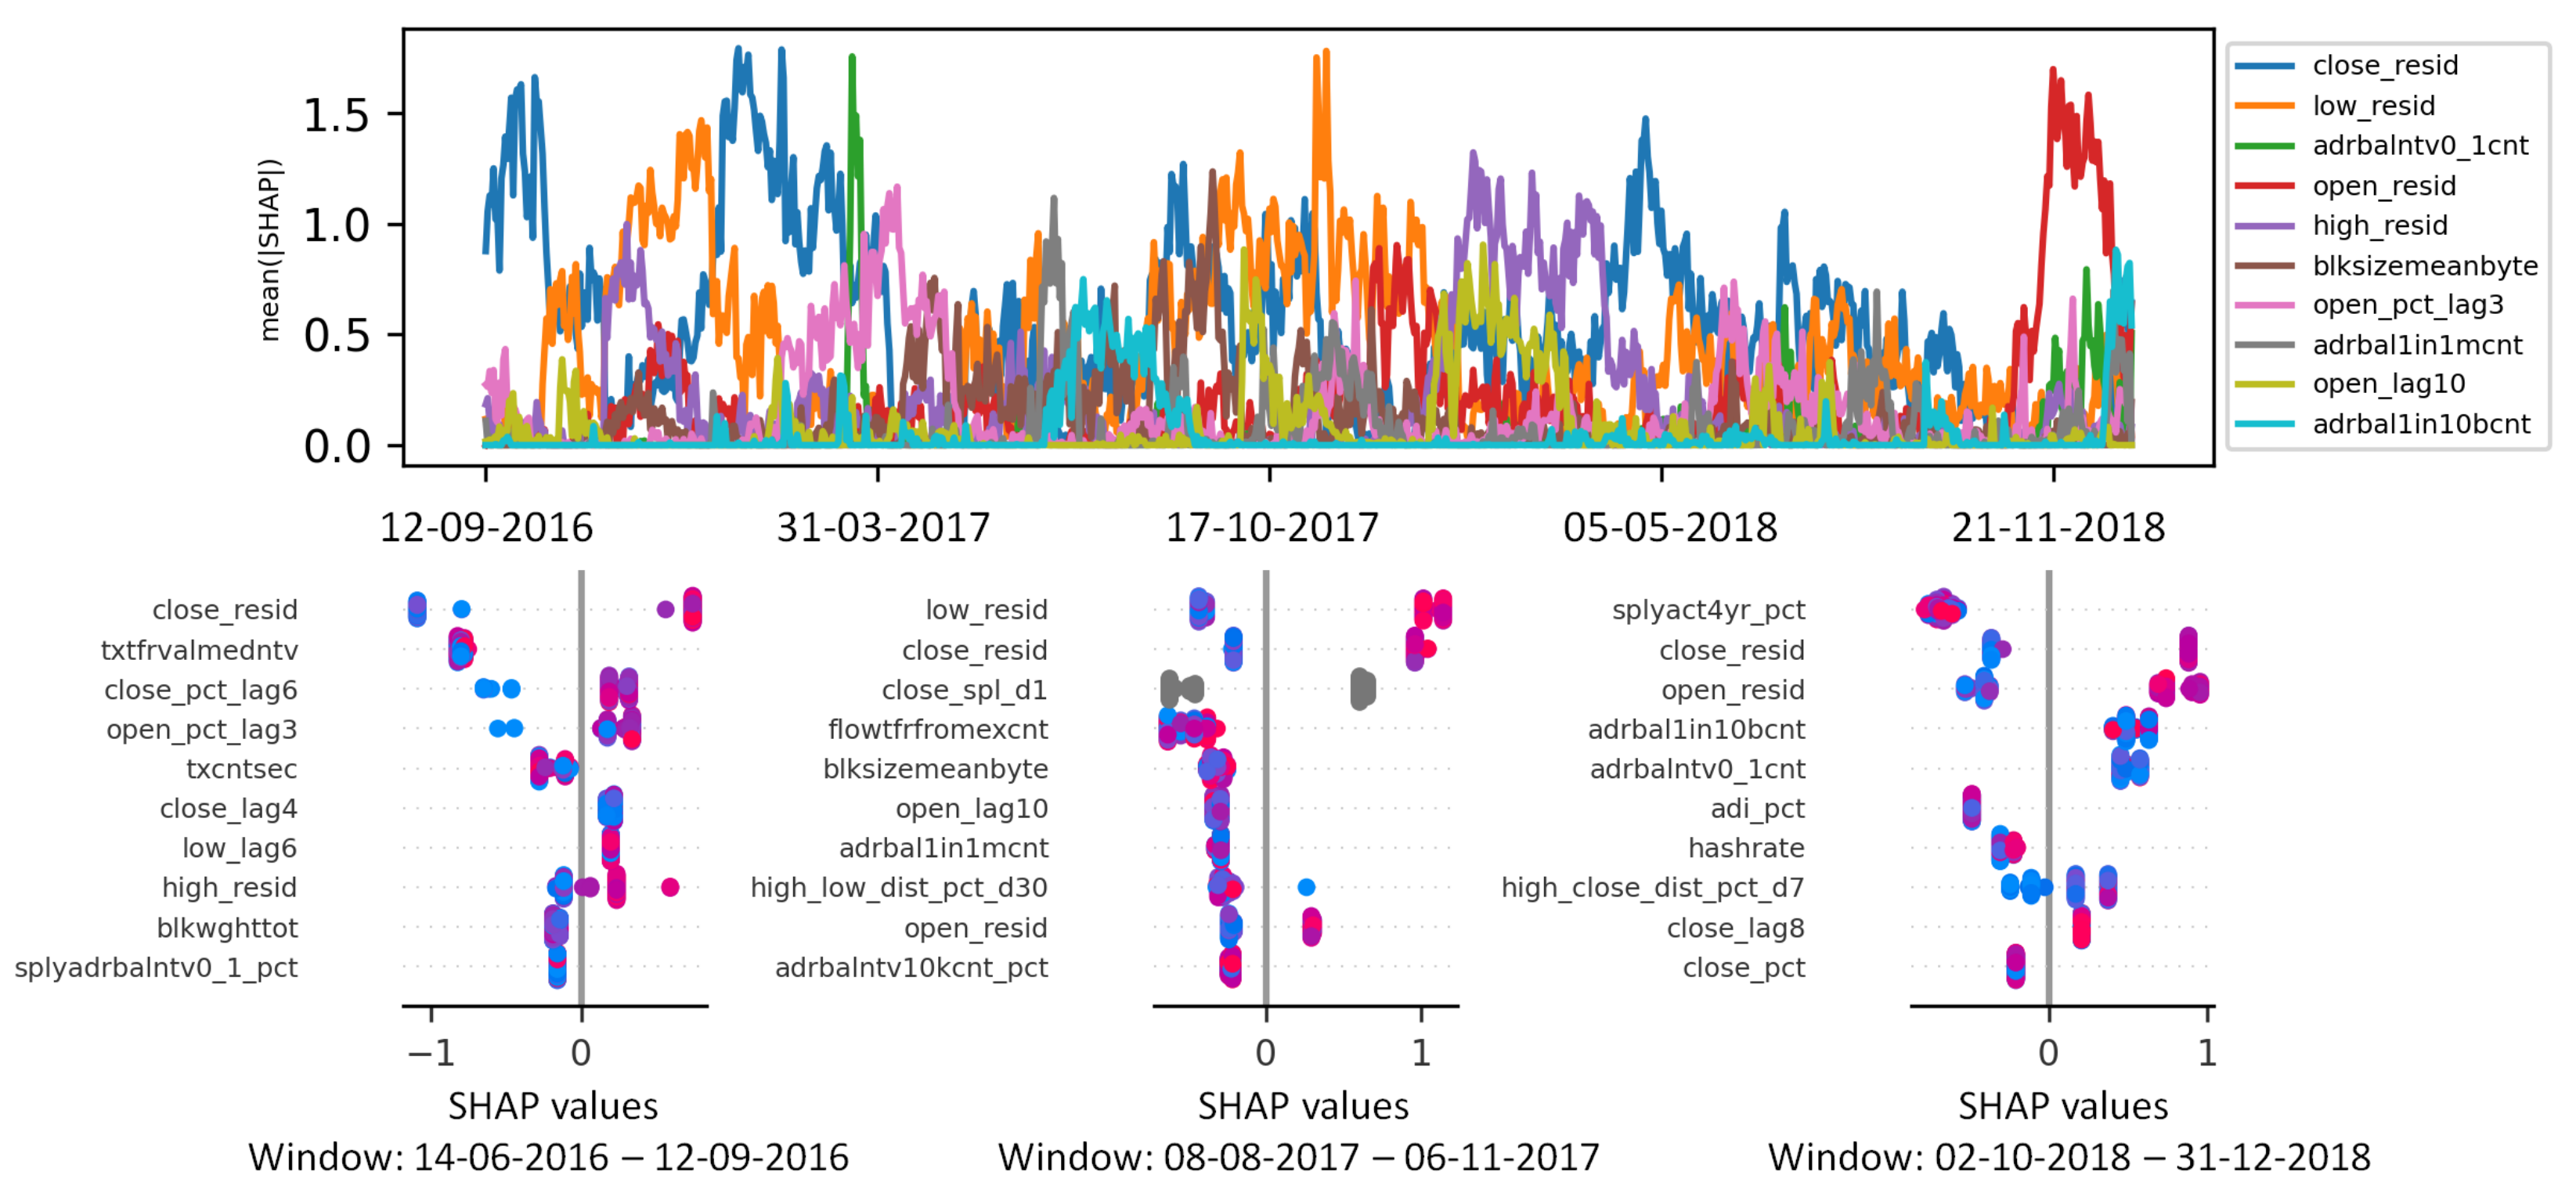
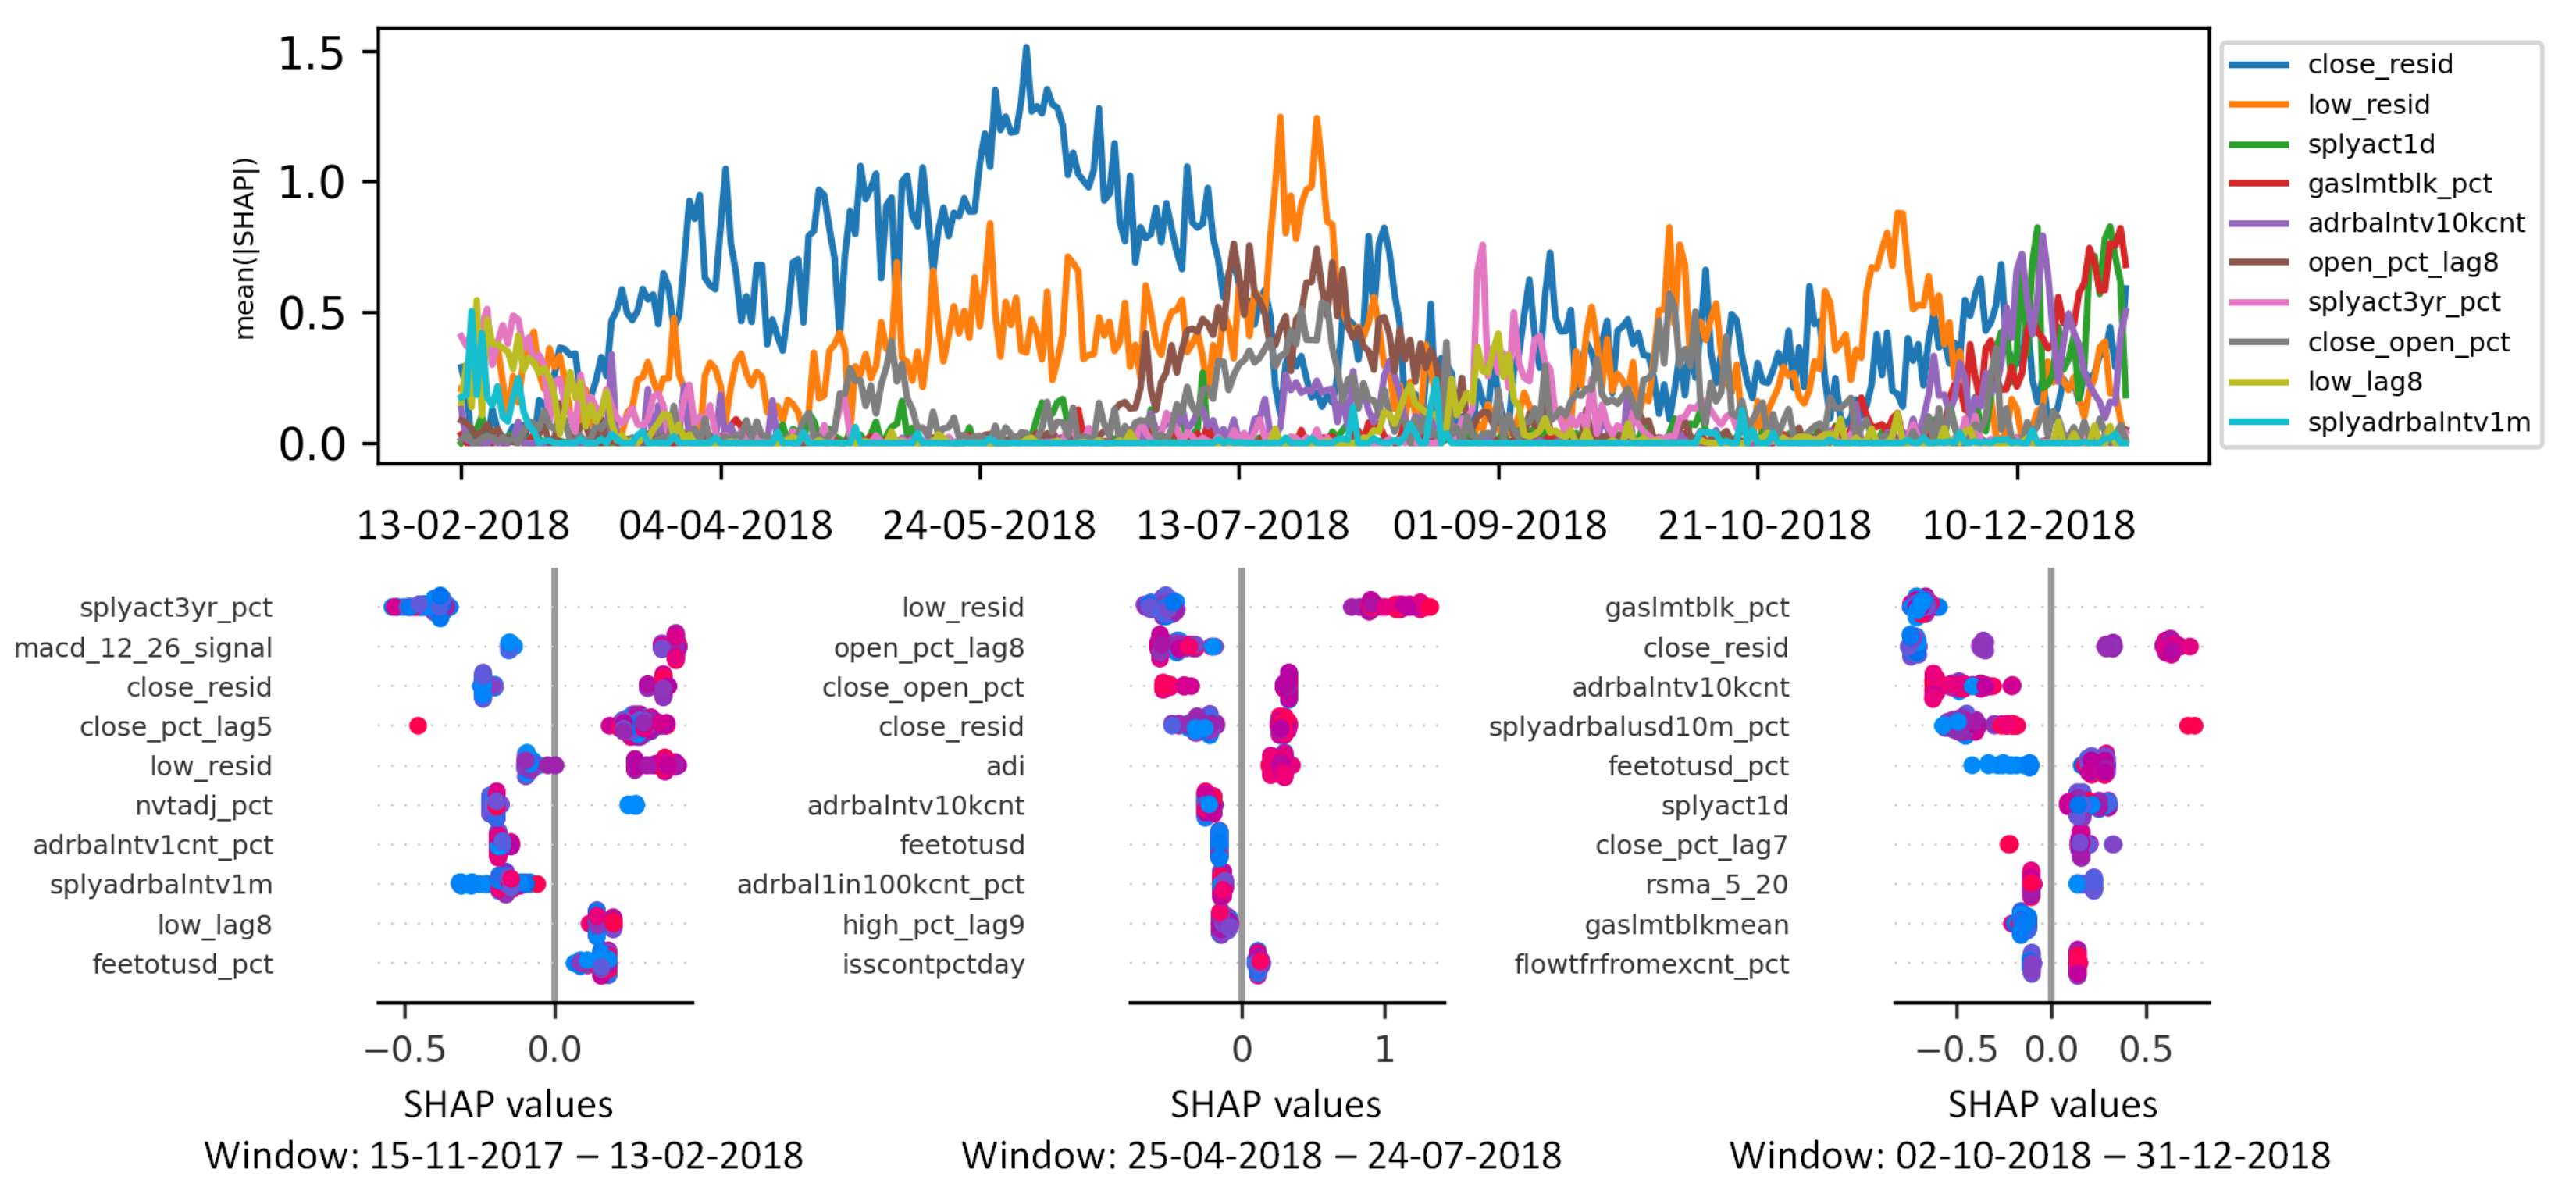
Figure 7 reports a similar information but the class label Downtrend is considered, i.e., those charts try to explain which features impacted more on the prediction of the label Downtrend. Some features are relevant for the prediction of both class labels, whereas others are specific for each class.
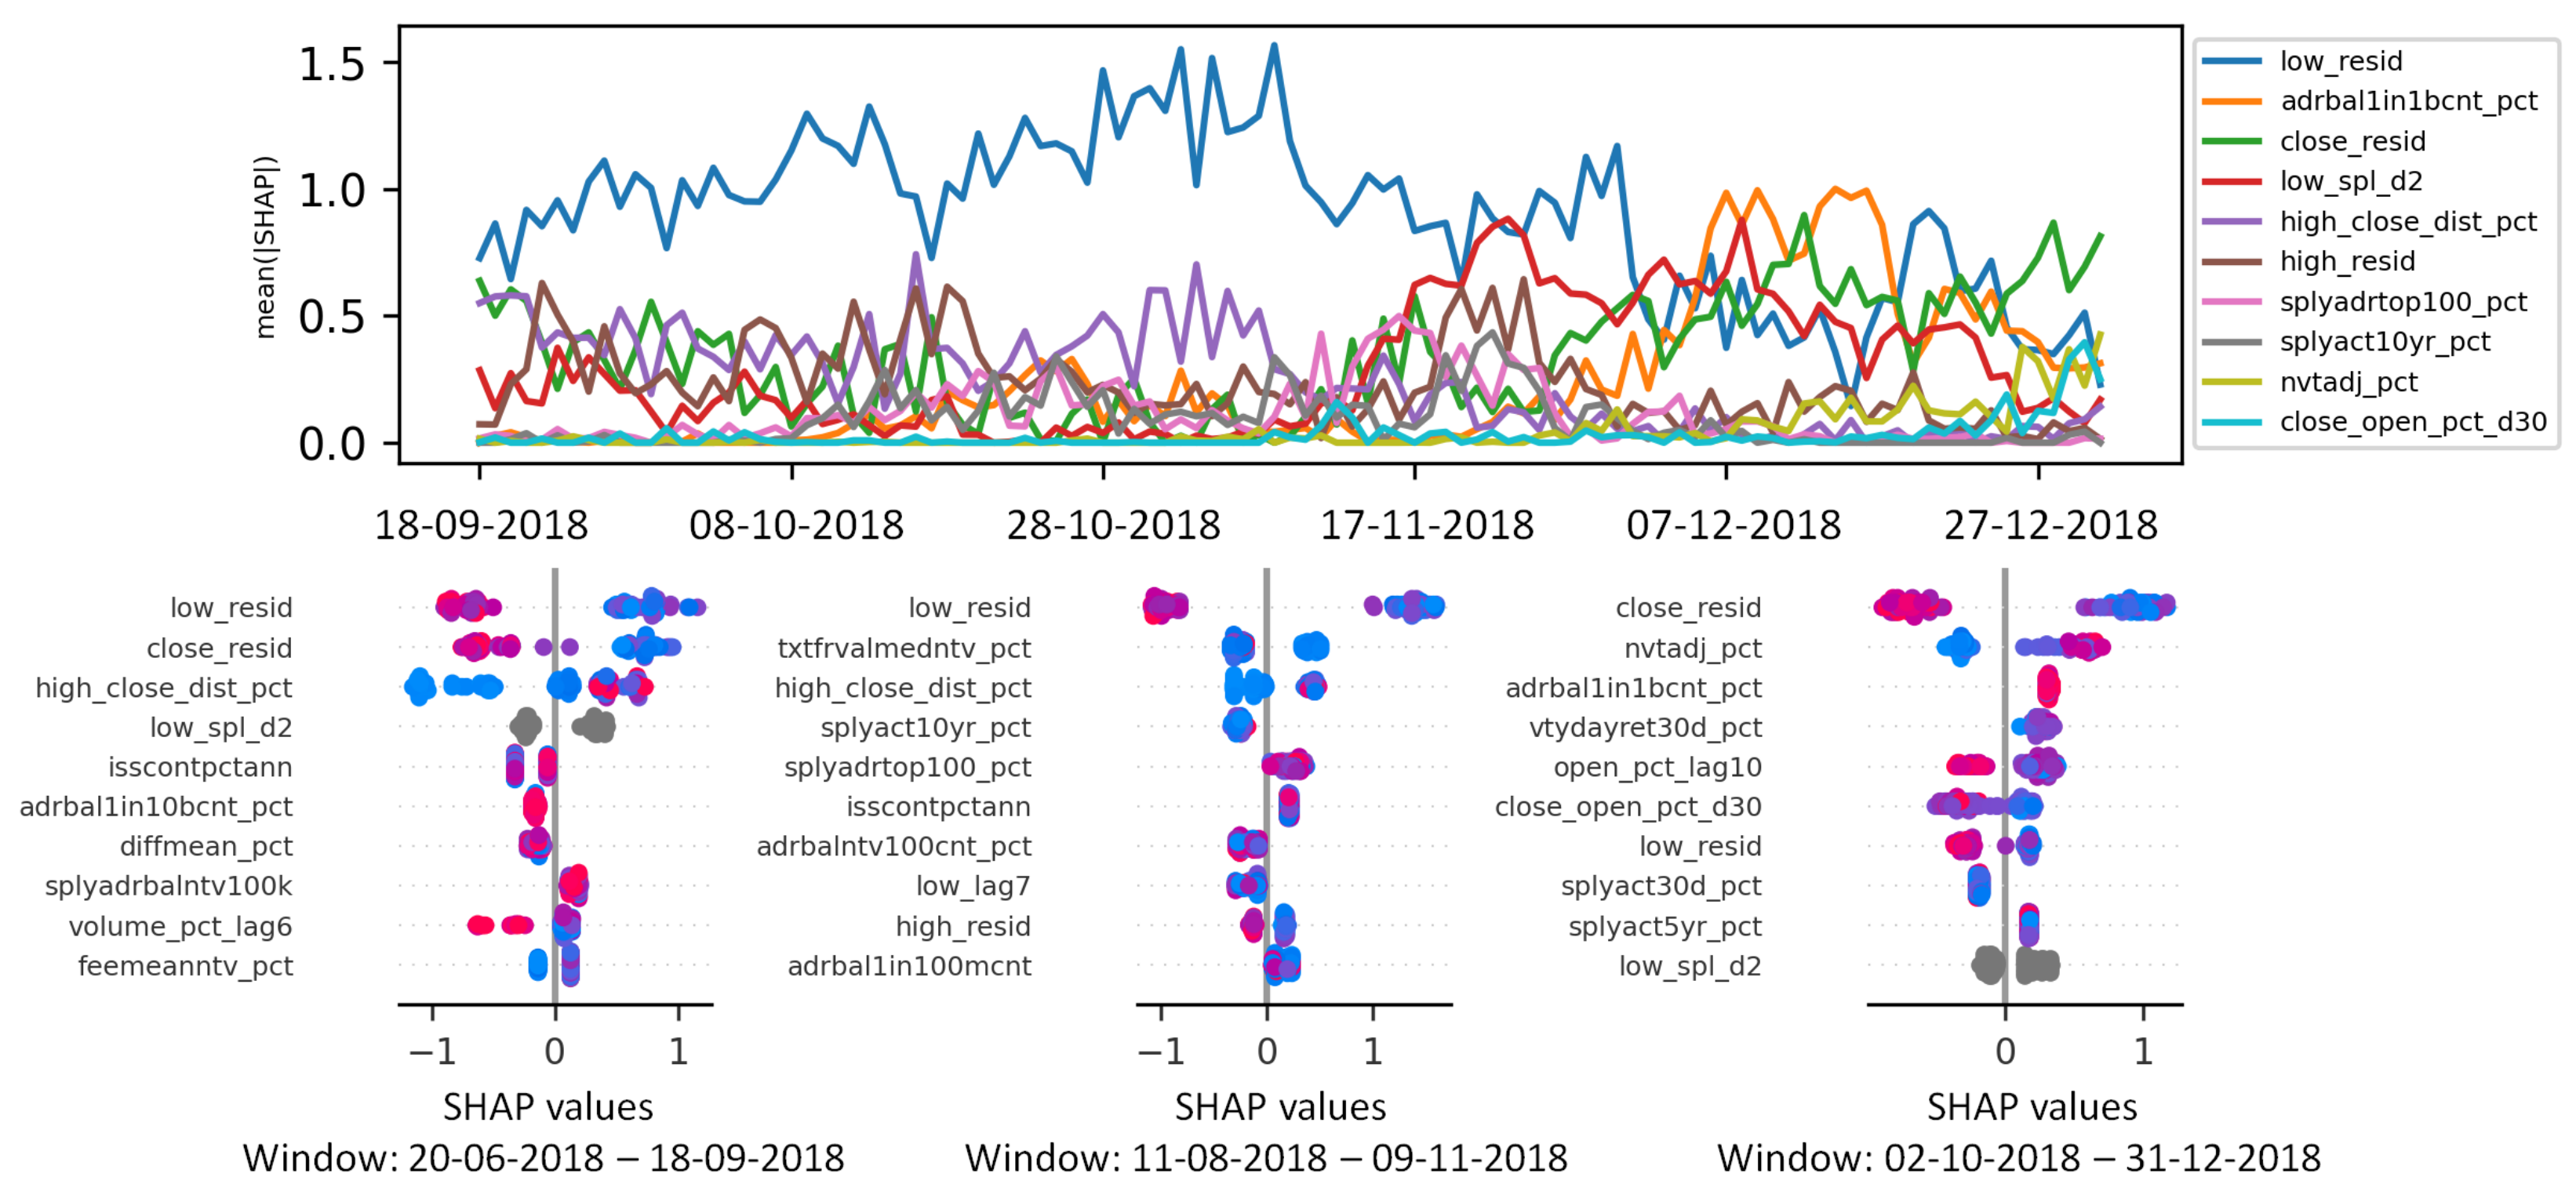
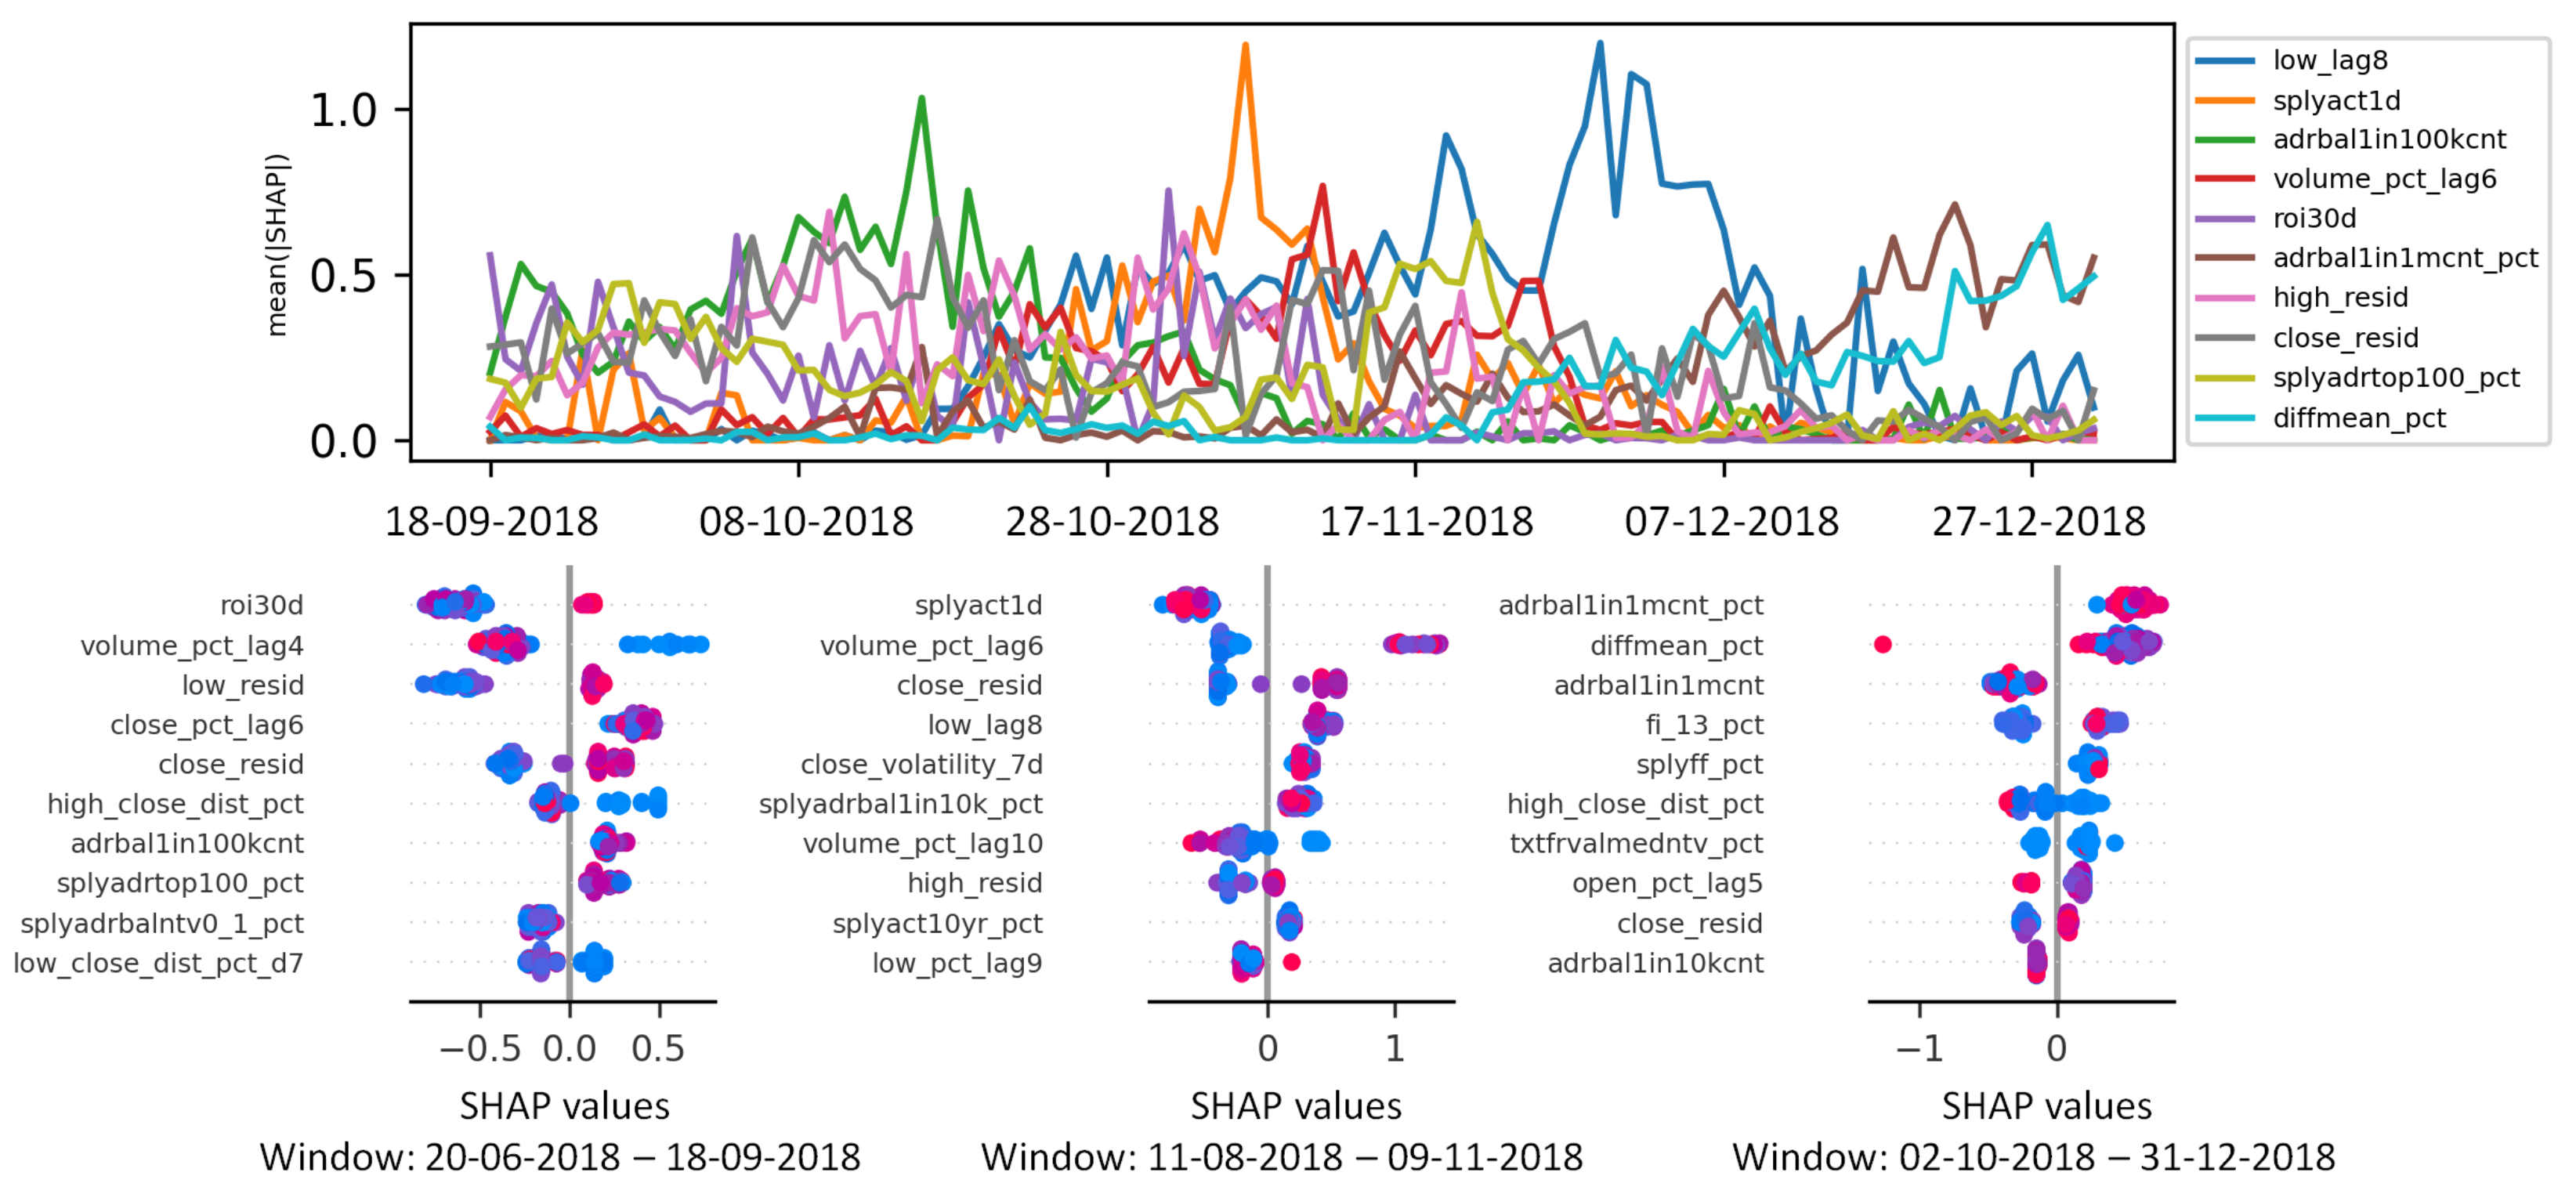
Figure 8,
Figure 9 and
Figure 10,
Figure 11 report similar pieces of information for BCHUSD and ETHUSD, respectively. We can notice that some of the top features are shared between BTCUSD and BCHUSD, whereas ETHUSD is more affected by other blockchain-related features. Most of the top features categories are shared among all the three considered features.
Table 3 and
Table 4 report the top-3 most influential features per cryptocurrency and class in terms of average Shapley value. The achieved results confirm that for most of the analyzed cryptocurrencies, the subcategories of the most influential features are independent of the predicted class label.
6.4. Statistical Dependence between Feature Ranked Lists
We evaluate the agreement between the feature ranked lists associated with the 21 cryptocurrencies using the Rank Biased Overlap similarity measure [
15]. The goal is to verify whether ML predictions on different cryptocurrencies are influenced by the same features, feature subcategories, or categories.
Table 5 and
Table 6, respectively, report the pairwise similarity matrices for the classes Uptrend and Downtrend. They allow us to identify specific cryptocurrency clusters characterized by relatively high pairwise similarities. For instance, XMR and ZEC are highly similar, which is probably because they are both focused on privacy aspects.
We performed a further experiment to compare the list of categories of the features that are more relevant for predicting Uptrend or Downtrend. We considered three different windows/time periods (P1, P2, P3) to analyze also the impact of the time dimension.
Table 7 reports the results. For each cryptocurrency, we report the computed correlations in P1, P2, and P3. For almost all cryptocurrencies, the correlation value is stable with respect to the time slot and is higher than 0.7. Hence, for almost all cryptocurrencies, the decision about the class label is based on the same categories of features independently of the predicted label.
7. Discussion
Explainability plays an important role in many Machine Learning-driven applications, including quantitative cryptocurrency trading. Despite their accuracy, ML models are deemed as not reliable enough, as domain experts do not trust the automated solutions. In the financial, in particular, a clear explanation of the rationale behind machine-driven decisions is deemed as unavoidable.
EXplainable AI opens the ML black boxes providing global or local explanations based on the underlying data features. Due to their high dimensionality and multi-faceted nature, cryptocurrencies are particularly suited to eXplainable AI. The main purposes are:
The enhancement of existing crytpocurrency trading systems based on the collected feedback on the current market trends.
The online support to discretionary traders, who commonly monitor the financial markets and execute trading operations in real time.
CryptoMLE is designed for supporting the monitoring of ML model performances on cryptocurrency markets. To enhance trading system strategies, CryptoMLE helps cryptocurrency investors verify the predictive rules inferred by the ML algorithms against the domain knowledge. To support online discretionary traders’ activities, it shortlists the most influential cryptocurrency features that are worth monitoring. The SHAP series and the SHAP summary plots provide them with a simple, interactive environment to obtain actionable feedback based on the recent ML outcomes.
The main takeaways from the empirical outcomes can be summarized as follows:
Feature relevance to cryptocurrency price forecasting is either generalized, i.e., valid for all cryptocurrencies independently of time periods and market conditions (e.g., for the Close_rel feature), or selective, i.e., valid only for a subset of features and for specific time periods. For the latter feature subset, CryptoMLE provides experts with an automated way to recognize them and leverage their predictive power for quantitative trading.
Based on the prediction outcomes, the relevance of the individual features is highly variable (see the dashboard snapshots in
Figure 6,
Figure 7,
Figure 8,
Figure 9,
Figure 10 and
Figure 11). To drive short-term cryptocurrency investments, it is crucial to monitor the most likely causes of market movements. For example, the percentage variations of the trading volume between current and previous days (namely
volume_pct*) appear to be relevant to predict BCHUSD variations (see
Figure 9), whereas they are less influential in the prediction of other cryptocurrency prices.
The influence of feature subcategories and categories is less sensitive to the market conditions, but they can be tailored to particular cryptocurrencies. For example, a cryptocurrency is more likely to be more influenced by BC features than others. This can be easily verified using CryptoMLE in real trading simulations.
The discrepancies between the observed results among the target class (e.g., Uptrend, Downtrend) are often negligible. Therefore, traders relying on both long- and short-selling trading strategy can easily and quickly interact with CryptoMLE to gather all the required information.
Simpler ML models analyzing only the prices of the target cryptocurrency assets appear to be suboptimal because, according to the achieved results, cryptocurrency prices are likely to be relevantly influenced by many other features (see, for instance, BCHUSD and ETHUSD). This confirms the utility of the CryptoMLE graphical interface, which provides human experts with a summary of the main feature contributions to the ML predictors.
8. Conclusions and Future Works
This paper introduced an eXplainable AI tool for cryptocurrency price forecasting. It presented a visual interface based on which domain experts can infer actionable dependencies among input data features and Machine Learning predictions. The interactive dashboard consists of an SHAP series plot, showing the temporal variation of the mean Shapley values associated with the most recent ML predictions, and a selection of pop-up summary plots, which are snapshots of the main features’ influences at given time points. The empirical simulation, which was run on a 8-year period, showed the variability of the model explanations across 21 cryptocurrencies and three reference time periods in terms of selected features, feature subcategories and categories.
As future work, we plan to leverage the Shapley values in quantitative intraday trading. Specifically, we aim at dynamically adapt algorithmic decisions in crtyptocurrency trading based on the relevant feedback provided by domain experts through the graphical interface.


