Article

High-Frequency Direction Forecasting of the Futures Market Using a Machine-Learning-Based Method

1
College of Economics and Management, China Three Gorges University, Yichang 443002, China
2
School of History, Beijing Normal University, Beijing 100875, China
*
Author to whom correspondence should be addressed.
Future Internet 2022, 14(6), 180; https://doi.org/10.3390/fi14060180
Submission received: 15 May 2022 / Revised: 5 June 2022 / Accepted: 6 June 2022 / Published: 9 June 2022
(This article belongs to the Special Issue Machine Learning for Software Engineering)

Abstract

:
Futures price-movement-direction forecasting has always been a significant and challenging subject in the financial market. In this paper, we propose a combination approach that integrates the XGBoost (eXtreme Gradient Boosting), SMOTE (Synthetic Minority Oversampling Technique), and NSGA-II (Non-dominated Sorting Genetic Algorithm-II) methods. We applied the proposed approach on the direction prediction and simulation trading of rebar futures, which are traded on the Shanghai Futures Exchange. Firstly, the minority classes of the high-frequency rebar futures price change magnitudes are oversampled using the SMOTE algorithm to overcome the imbalance problem of the class data. Then, XGBoost is adopted to construct a multiclassification model for the price-movement-direction prediction. Next, the proposed approach employs NSGA-II to optimize the parameters of the pre-designed trading rule for trading simulation. Finally, the price-movement direction is predicted, and we conducted the high-frequency trading based on the optimized XGBoost model and the trading rule, with the classification and trading performances empirically evaluated by four metrics over four testing periods. Meanwhile, the LIME (Local Interpretable Model-agnostic Explanations) is applied as a model explanation approach to quantify the prediction contributions of features to the forecasting samples. From the experimental results, we found that the proposed approach performed best in terms of direction prediction accuracy, profitability, and return–risk ratio. The proposed approach could be beneficial for decision-making of the rebar traders and related companies engaged in rebar futures trading.

1. Introduction

As an exploration and innovation of the financial market, the futures market plays an essential role in risk diversification, price discovery, and hedging that cannot be replaced by the spot market [1]. In China, the steel industry has been an essential support for various industries such as agriculture, transportation, and architecture. Currently, China is the world’s largest steel producer and trader, and the launch of rebar futures is of great significance to the progress of the Chinese futures market and steel industry. Since its listing on the Shanghai Futures Exchange (SHFE) in 2009, rebar futures have become one of the most active futures, with its trading volume ranking first among the steel-related futures for many years. On the one hand, rebar futures provides market participants with an effective tool for reducing market risk by establishing a profit and loss hedging mechanism by employing the futures and spot markets. On the other hand, steel enterprises can have access to corresponding market price information so they could rationally arrange their steel production and operation activities. Therefore, the study of price-movement-direction forecasting of the rebar futures market has become an essential issue for many scholars, market investors, and steel-related companies.
In the last few decades, numerous scholars have developed practical approaches in exploring financial forecasting, such as the traditional econometric methods and artificial intelligence technologies. Among those approaches, Autoregressive Integrated Moving Average (ARIMA) is one of the most commonly used traditional econometric models [2,3]. However, when referring to the nonlinear characteristics of time series data in financial markets, traditional analysis methods might be unable to show favorable forecasting ability [4,5]. With the development and successful application of artificial intelligence, many machine learning methods, such as Artificial Neural Network (ANN) [6,7], Support Vector Machines (SVM) [8,9], and Random Forest (RF) [10,11], have been evidenced to be capable of producing excellent performances for financial time series forecasting. For instance, an ANN-based model was proposed by Kara et al. for daily price-movement prediction in the stock market, and it generated great forecasting accuracy [12]. Hao et al. adopted a novel SVM-based method to predict stock price trends by extracting financial news texts, and the results showed that their proposed model was more robust than the benchmark methods [13]. Ballings et al. successfully predicted the stock price direction by applying an RF-based method [14].
Recently, since Chen and Guestrin first proposed the eXtreme Gradient Boosting (XGBoost) algorithm in 2016 [15], an increasing number of researchers have implemented it to solve the forecasting task, and great accuracies have been produced in many applications [16,17]. The most remarkable advantage of XGBoost is that the prediction accuracy and computing speed are significantly enhanced compared to the traditional gradient boosting algorithms [18,19,20]. In the field of financial markets, Huang et al. predicted the intradaily market trends using an XGBoost-based method, and it successfully produced satisfactory forecasting performance [21,22,23]. Chen et al. built an XGBoost-based portfolio construction method to forecast the price movement of stock market, and the experiment results indicated that their proposed method outperformed all the benchmarks by evaluating the trading returns and transaction risks [24]. However, there are a limited number of studies in the literature that report on the futures market prediction by using the XGBoost method. Hence, this paper fills the gap and applies XGBoost in the rebar futures price prediction to investigate whether XGBoost could be employed as an efficient method and whether it is superior to the machine learning algorithms that other researchers have applied.
Nevertheless, when using the machine-learning-based methods, training and testing data often have a problem of data imbalance in the model learning process, resulting in unsatisfied classification performance of the minority class samples [25,26]. Therefore, classification tasks with imbalanced data categories in machine learning have received increasing attention in academic and practical applications. To solve this problem, the Synthetic Minority Oversampling Technique (SMOTE) [27], which is an improved random oversampling method, has been extensively adopted. For the class-imbalanced data, the training dataset of minority categories could be oversampled by the SMOTE, which aims to solve the unbalanced class distribution problem of the studied data [28]. In academics, the efficiency of the SMOTE technique for enhancing classification accuracy of minority categories has been successfully applied and proved by many scholars [29,30]. Therefore, in this research, the SMOTE technique is integrated with the XGBoost model to predict the price-movement direction of rebar futures.
For the simulation trading in financial markets, how to design trading strategies and determine various trading parameters has drawn much attention from market participants. However, because of the extraordinary high leverage and risk of futures trading, other than a great return, trading risk should also be an essential indicator in the futures market, while it is generally overlooked by researchers. Therefore, different from the literature reports that considered only the return as the objective function, we propose to implement a multiobjective optimization approach for optimizing the pre-designed trading rule by considering both the trading return and the trading risk. Recent optimization studies have shown that the application of the Nondominated Sorting Genetic Algorithm II (NSGA-II) algorithm [31], which is one of the well-known multiobjective optimization algorithms, has been successfully expanded in many application fields. For example, Raad et al. optimized the design of an urban water distribution system using an NSGA-II-based method, intending to find a tradeoff between system cost and reliability [32]. Cao et al. focused on optimizing spatial multiobjective land use, and they applied an NSGA-II-based method to generate the best compromise solutions among minimum conversion costs, maximum accessibility, and maximum compatibilities among land uses [33]. Feng et al. developed a multiobjective optimization algorithm based on the NSGA-II algorithm to find a reasonable allocation of medical resources [34]. To improve the trading performance of the proposed approach, the objective functions, including the accumulated return and maximum drawdown, are both optimized using NSGA-II to search for the best parameter combination of the pre-designed trading rule.
Additionally, in recent years, hybrid methods have been extensively applied widely in research, and their empirical results demonstrated that those hybrid algorithms generally performed better than one part of the single model [35,36,37,38]. It provides us with an idea to forecast the movement and to perform trading simulation by a hybrid approach that integrates the XGBoost, SMOTE, and NSGA-II.
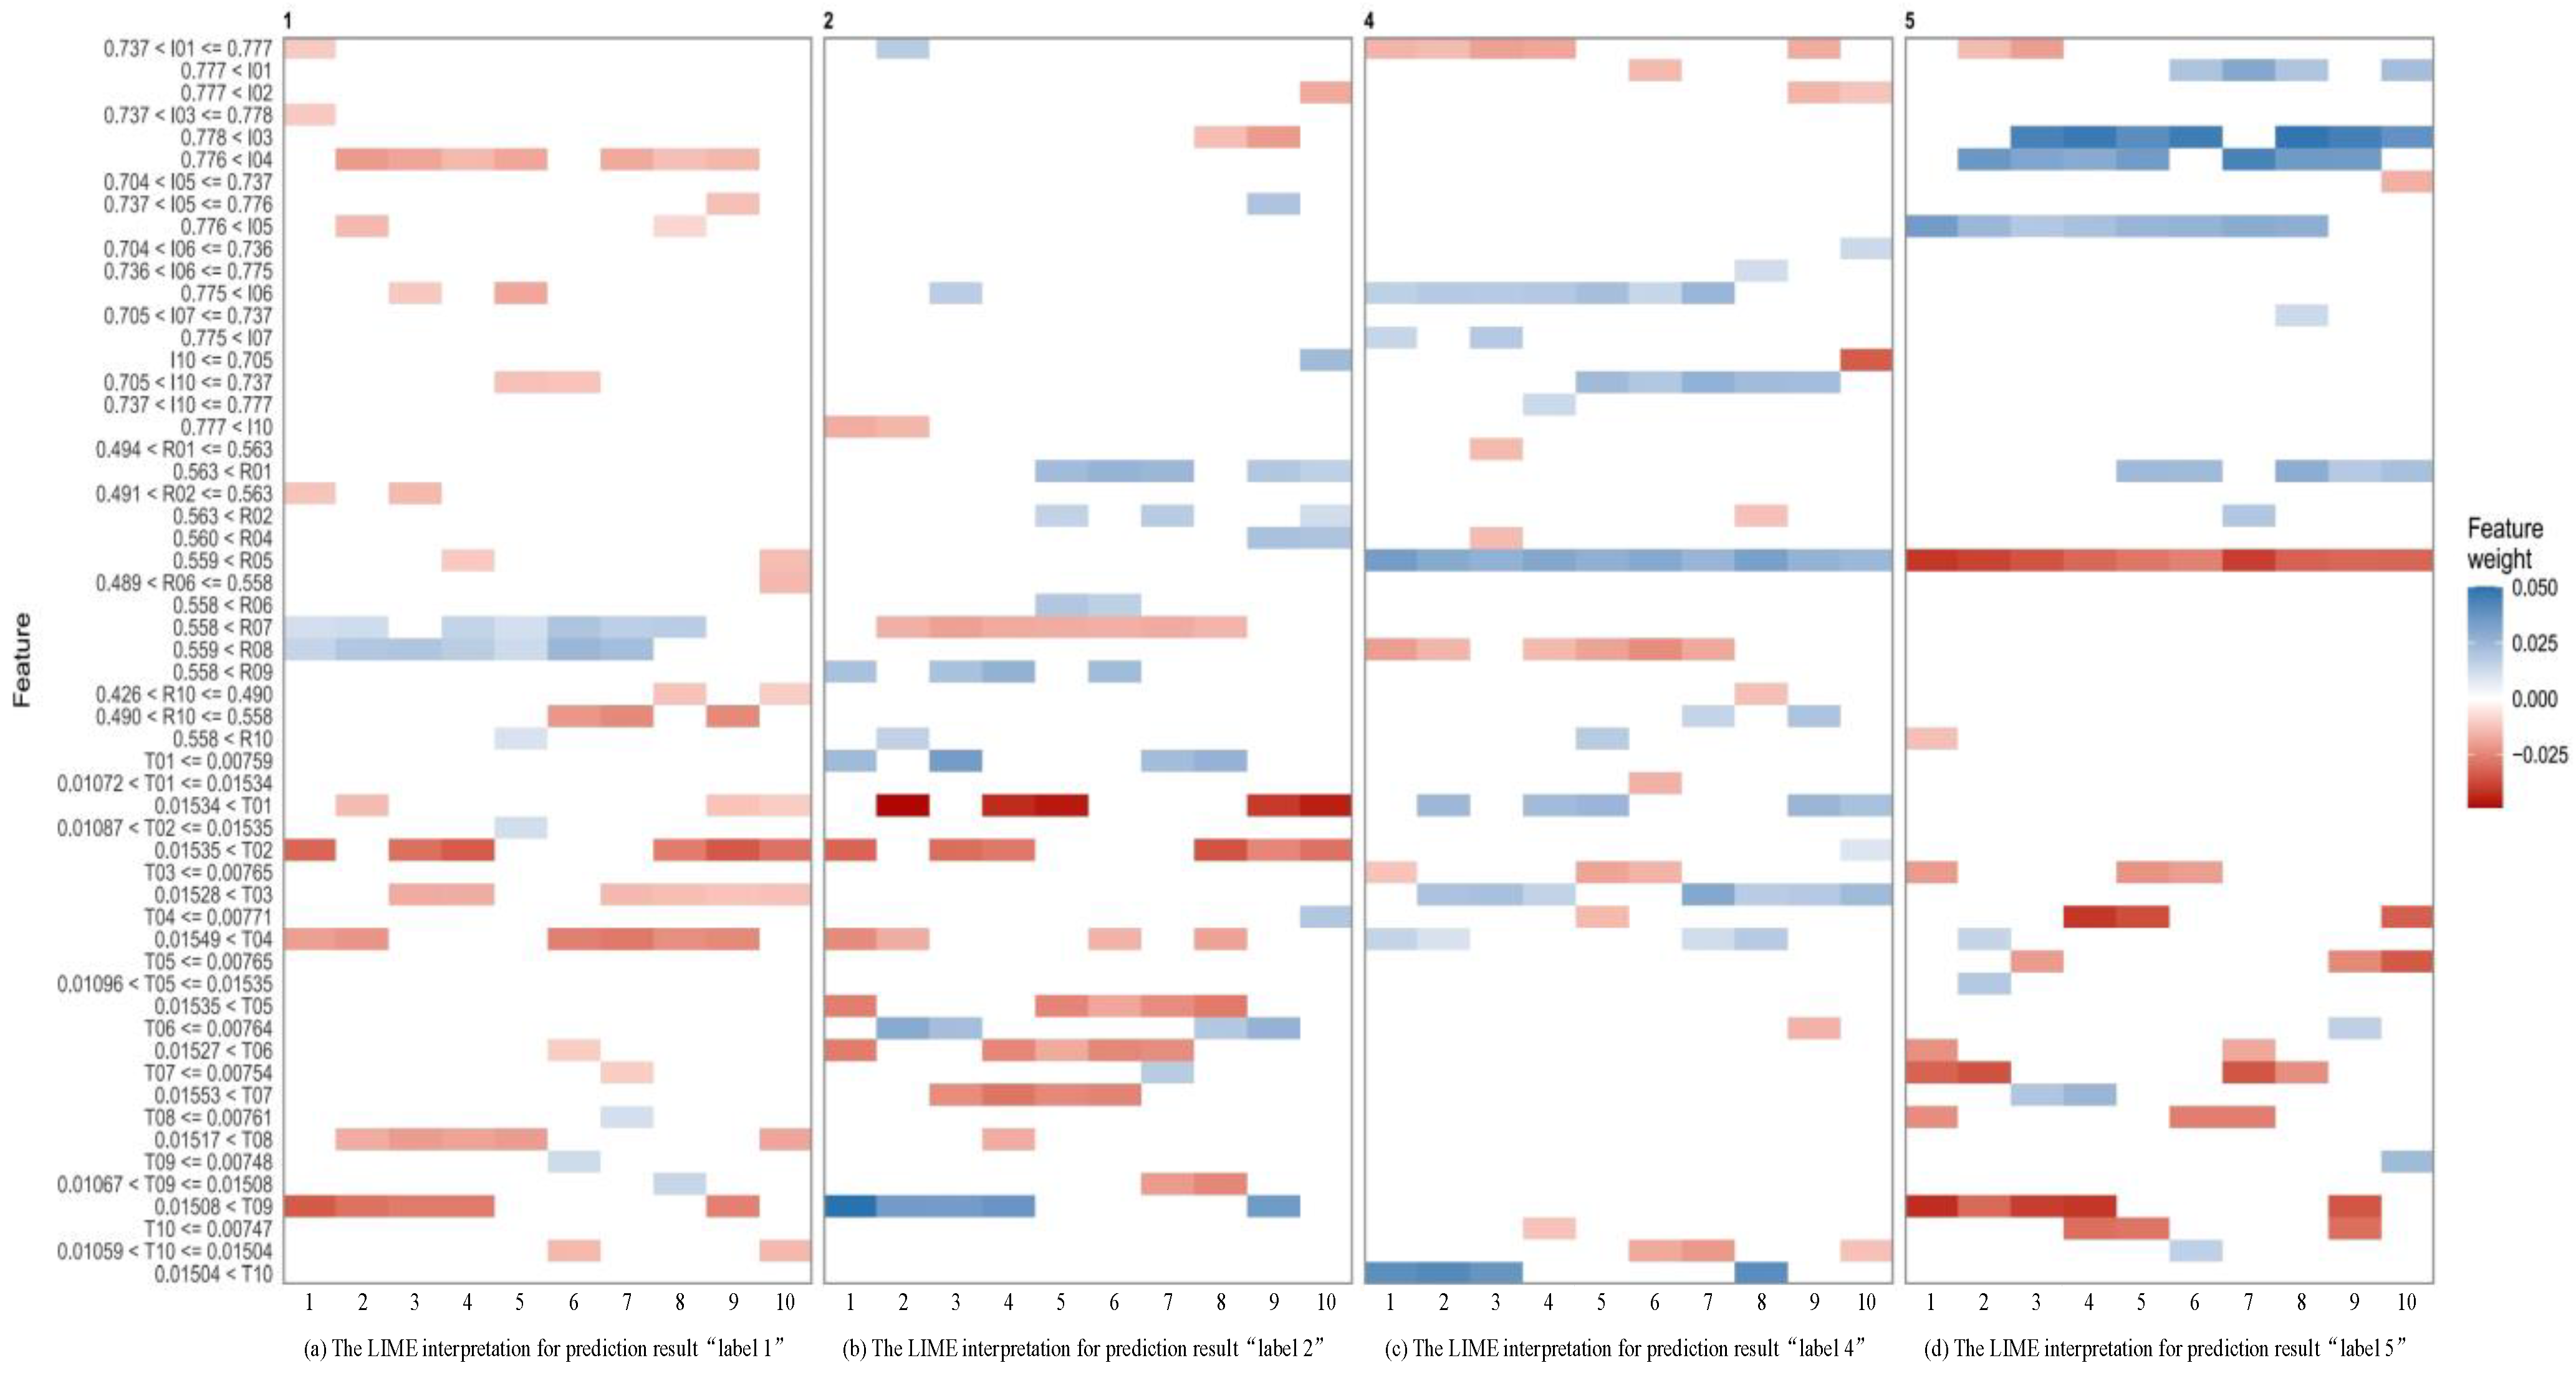
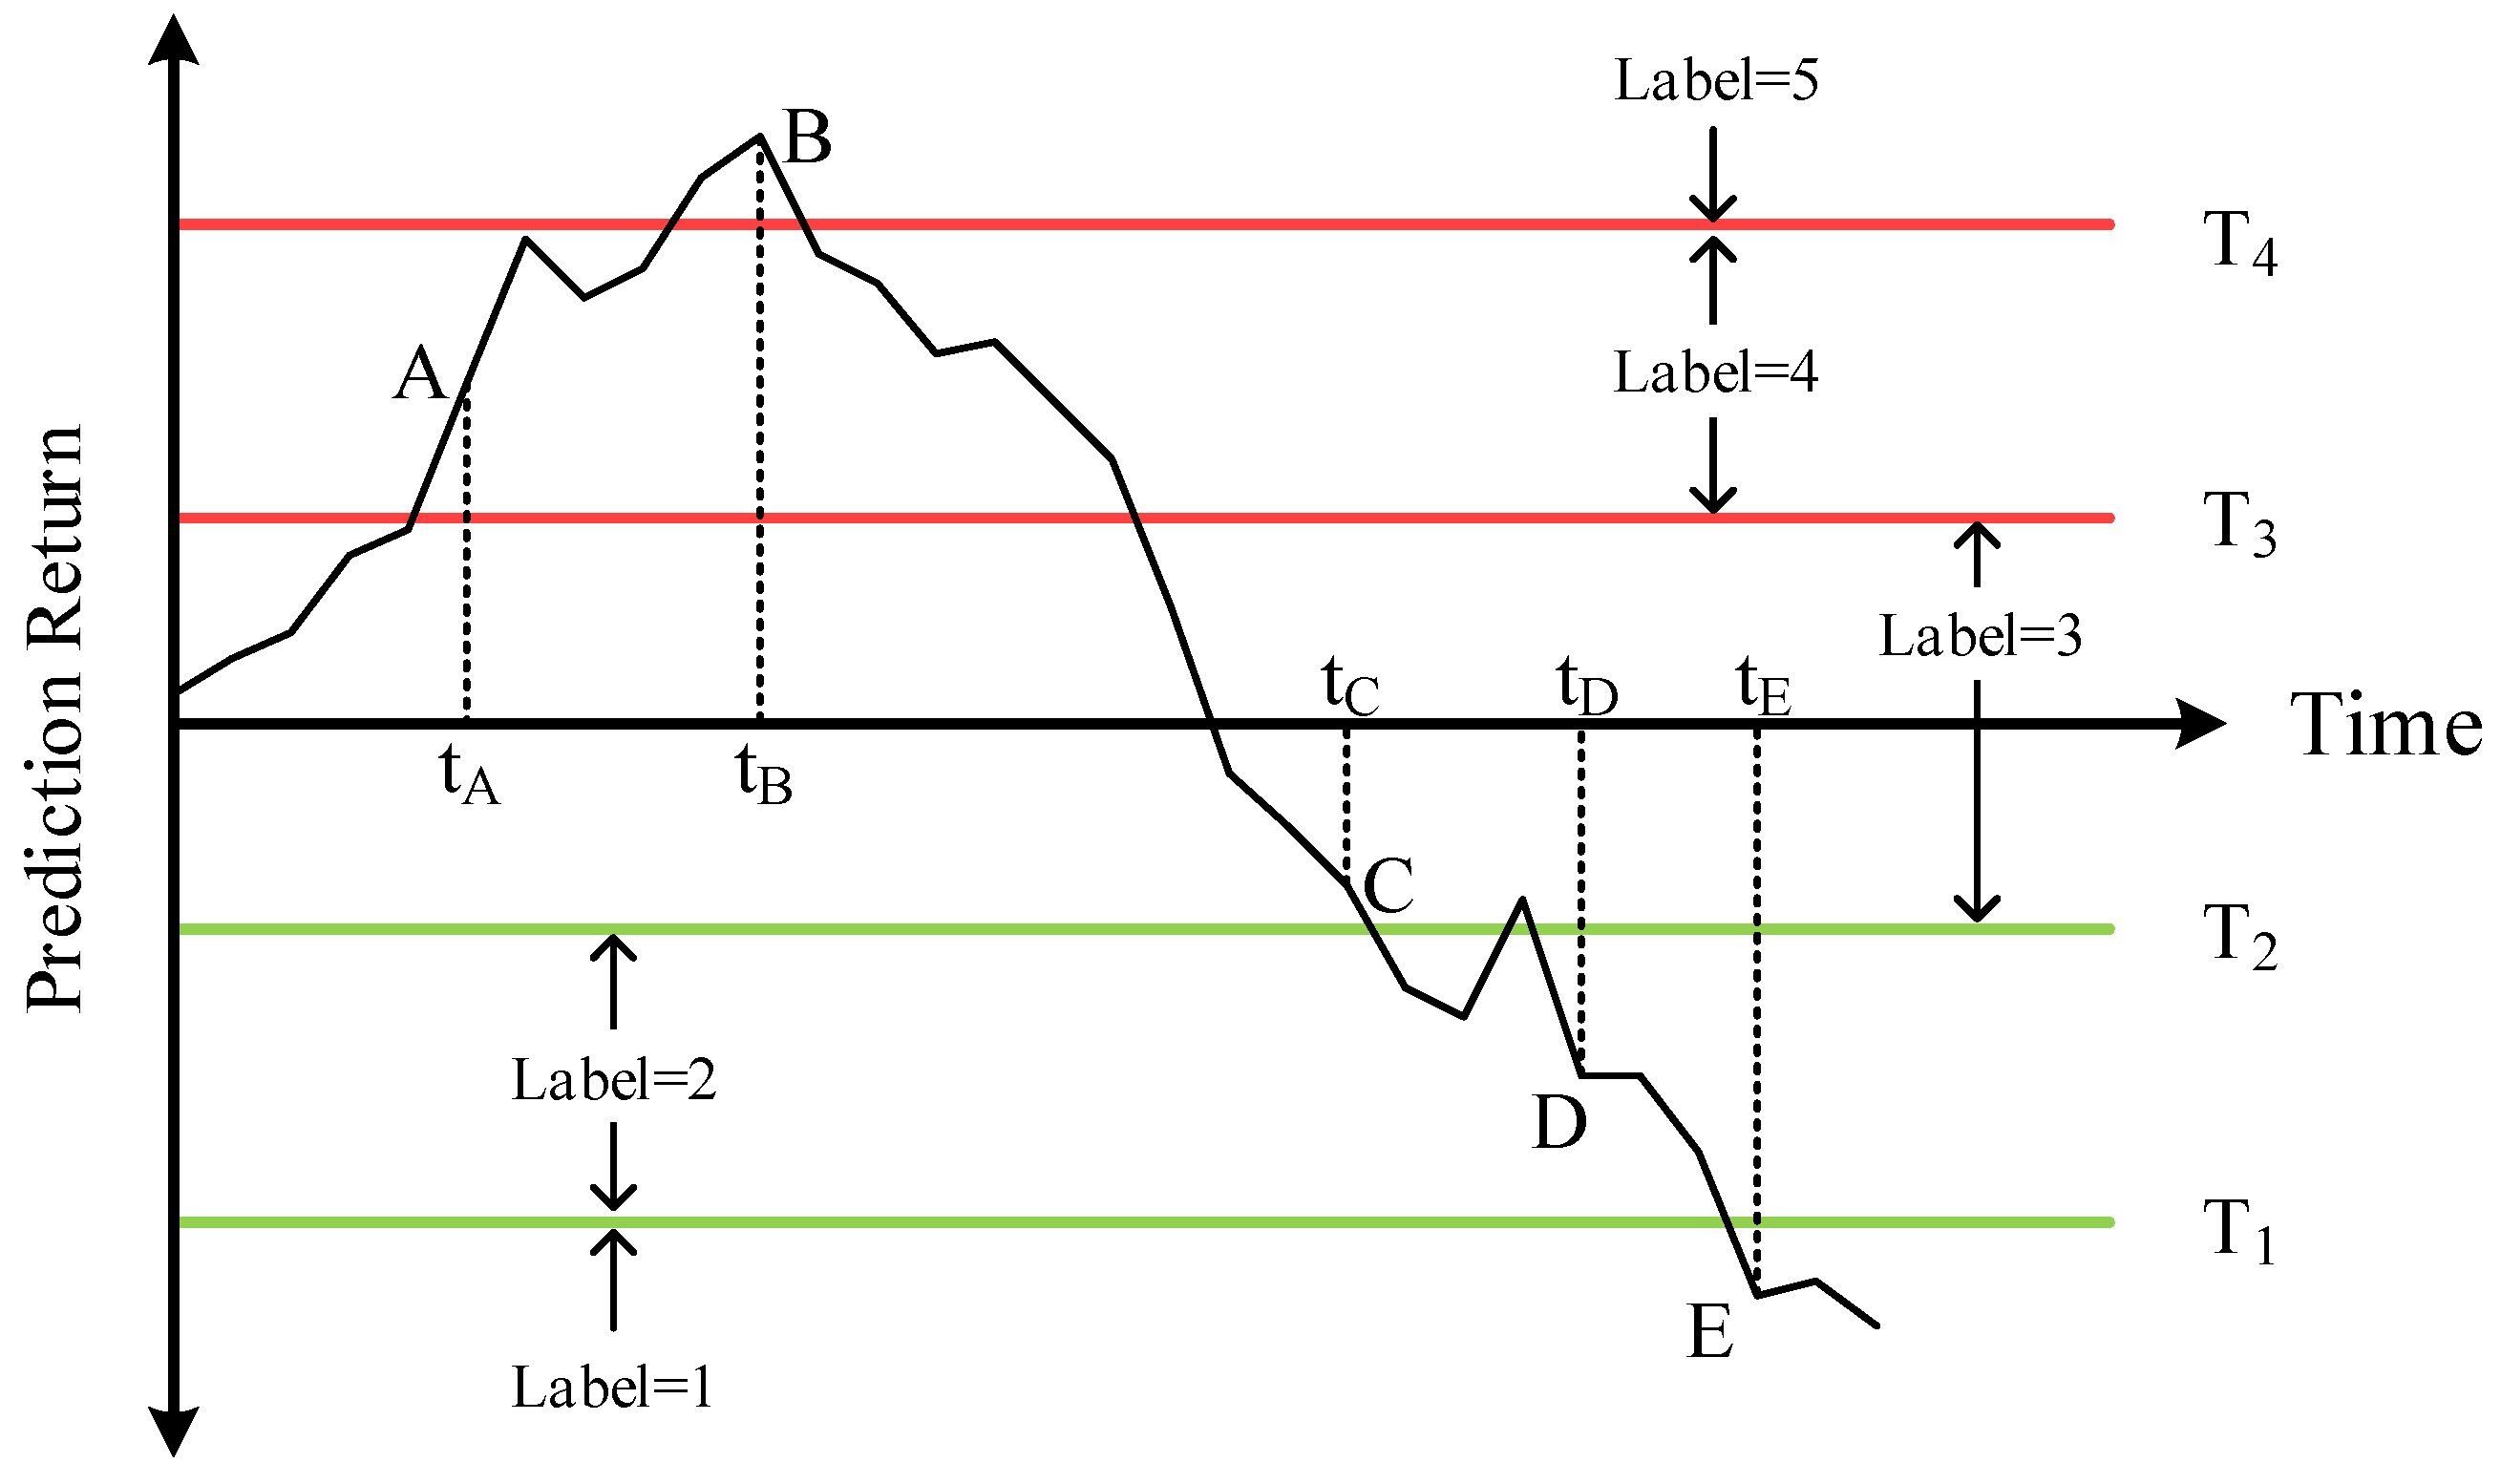
In summary, the main procedures of the method proposed in this research are as follows. First, the proposed approach collects and pre-processes the historical high-frequency data of the Chinese rebar futures. Second, the whole dataset is divided into several consecutive in-sample and out-of-sample periods, with the predicted labels divided into multiple categories of magnitude. Third, the training samples with smaller ratios are oversampled using the SMOTE for producing the balanced training datasets. Next, an XGBoost-based multiclass direction prediction model is trained for price direction change forecasting. Meanwhile, NSGA-II is employed to optimize the simulation trading rule. At last, Local Interpretable Model-agnostic Explanations (LIME) is employed for an explanation of the proposed method by analyzing the contributions of each feature on the multiclass labels. To validate the efficiency of the proposed approach, several performance evaluation indicators and a group of benchmark methods are designed and used to investigate their classification and trading results.
In short, this paper contains mainly the following three contributions: (1) A novel multi-classification method is proposed to forecast the price-movement direction, and to perform simulation trading of rebar futures in the Chinese futures market. (2) The SMOTE technique is adopted to overcome the class imbalance problem in the original training dataset, which further enhances the prediction performance of the classification model. (3) A sophisticated trading rule for high-frequency trading of rebar futures is designed, and the trading parameters are optimized using NSGA-II by considering trading profits and trading risks. (4) The LIME method is adopted to explain how the proposed method performed movement direction predictions for rebar futures prices quantitatively.
The rest of this paper is structured as follows. In Section 2, we introduce some basic background about the relevant algorithms used in this research. Section 3 explains the main structure of the proposed approach. The empirical data, design, and optimization of trading rule, evaluation metrics, and benchmark models are provided in Section 4. The experimental results are reported and discussed in Section 5. At last, Section 6 summarizes the conclusion of this research.

2. Related Methodology

2.1. eXtreme Gradient Boosting (XGBoost)

As an effective ensemble learning algorithm, XGBoost was proposed by Chen and Guestrin in 2016 [15]. XGboost is considered as an improved GBDT algorithm [39]. The main operating principle of XGBoost is that it is composed of several base classifiers that can be linearly superimposed into a more robust classifier to obtain the final optimization algorithm. Unlike the GBDT algorithm, first, a second-order Taylor expansion is utilized for the optimization process of the loss function in XGBoost instead of the first-order Taylor expansion in GBDT. Second, XGBoost adds a regularization term to the objective function to effectively reduce the model complexity and prevent the overfitting problem [40,41]. The superiority of high accuracy, generalization ability, and fast running speed makes it an efficient and excellent computing tool in the fields of machine learning and data mining [42].
The prediction results y ^ i summarize the leaf scores of the K weak learners produced by a boosting method. The formula is given by Equation (1):
y ^ i = k = 1 K f k x i , f k F
where f k · represents the score for the k -th weak learner and F is the set of all CART decision trees. When establishing an XGBoost model, the main task is to search for the optimal parameters by minimizing the objective function O b j . As shown in Equation (2), O b j consists of two components, which are the loss function term l and the model regularization term Ω :
O b j = i = 1 n l y i , y ^ i + k = 1 K Ω f k
In Equation (2), the former part is an item used to measure the differences between the prediction y ^ i and the target y i , and the latter part is employed to punish the complexity of the tree structure. The regularization term Ω is defined as:
Ω ( f ) = γ T + 1 2 λ j = 1 T w j 2
where γ denotes the complexity parameter, T represents the total number of leaf nodes, λ is a regularization coefficient, and ω is the score of the leaf nodes.
Notably, the model is trained in an additive manner, that is, it adds a new f t x i to develop the current model, and it establishes a new loss function. The objective function can be expressed as:
O b j t = i = 1 n l y i , y ^ i t 1 + f t x i + Ω f t
The loss function is extended by performing a second-order Taylor expansion during the process of gradient boosting, and the constant term is then removed to simplify the objective function. The final O b j is shown in Equation (5), while g i and h i are defined in Equation (6), representing the gradient statistics of the loss function:
O b j t i = 1 n g i f t x i + 1 2 h i f t 2 x i + Ω f t = j = 1 T i I j g i ω j + 1 2 i I j h i + λ w j 2 + γ T
g i = y ^ i ( t 1 ) l ( y i , y ^ i ( t 1 ) ) ,   h i = y ^ i ( t 1 ) 2 l ( y i , y ^ i ( t 1 ) )
Assume that an instance set I j in the leaf j is I j = i q x i = j . When the tree structure is given, the formula for calculating the optimal leaf weight w j and the loss function at the leaf node j can be evaluated by Equations (7) and (8), respectively:
w j = i I j g j i I j h j + λ
O b j ( t ) ( q ) = 1 2 j = 1 T i I j g i 2 i I j h i + λ + γ T
In XGBoost, the greedy search algorithm is used to evaluate the split candidates and to find an optimal tree structure. Suppose that I L and I R represent the sample sets of the left and right branches, respectively; the information gain of leaf nodes after splitting can be scored by Equation (9):
G a i n = 1 2 i I L g i 2 i I L h i + λ + i I R g i 2 i I R h i + λ i I g i 2 i I h i + λ γ
The criterion of maximizing the information gain ultimately determines the optimal splitting in the learning process of XGBoost.

2.2. NSGA-II

A series of Multiobjective Evolutionary Algorithms (MOEAs) have been introduced by scholars over the past decades. The primary task of MOEAs is to find the multiple Pareto optimal solutions in one single simulation run. Nondominated Sorting Genetic Algorithm (NSGA) is one of the first MOEAs, which has been widely applied since it was proposed by Srinivas and Deb in 1994 [43]. As an improved version of NSGA, Nondominated Sorting Genetic Algorithm II (NSGA-II) is considered to be superior to many contemporary MOEAs for solving optimization problems. In NSGA-II, there are mainly three innovations, including a fast nondominated sorting procedure, a fast crowded distance estimation procedure, and a simple crowded comparison operator [31]. Meanwhile, the Pareto optimal solutions could be identified by applying the nondominated sorting and crowding distance sorting algorithms [44]. The following steps explain the main procedures of NSGA-II:
  • Step 1: Initialize a random parent population P t of size N .
  • Step 2: The initialized population is sorted according to nondomination. Employ the binary tournament selection, crossover, and mutation operators to generate an offspring population Q t .
  • Step 3: Combine the parent population and child population to form a population R t of size 2 N .
  • Step 4: The combined population is sorted based on the nondomination sorting. Then, assign the crowding distance of all individuals in the population. Using this approach, the individuals could be selected based on a crowded comparison operator of rank and crowding distance [45]. Once the population is sorted with the crowding distance assigned, the selection of individuals for the next generation is carried out. In this process, elitism is guaranteed as all parent and offspring best population members are accommodated in the combined population R t .
  • Step 5: Form a new population P t + 1 of size N , which is utilized for the following selection, crossover, and mutation to create a new offspring population Q t + 1 with a size of N . The sorting procedure can be stopped until there is a large enough number of fronts to have size N in P t + 1 .
  • Step 6: Repeat steps 2–5 until the maximum number of generations is satisfied and the approximate nondominated resource allocation solutions are found.
Generally, the determination of trading parameters could have a significant impact on forecasting performance. Thus, we adopt NSGA-II to search for the best combination of the trading rule parameters during the model training step.

3. Proposed Approach

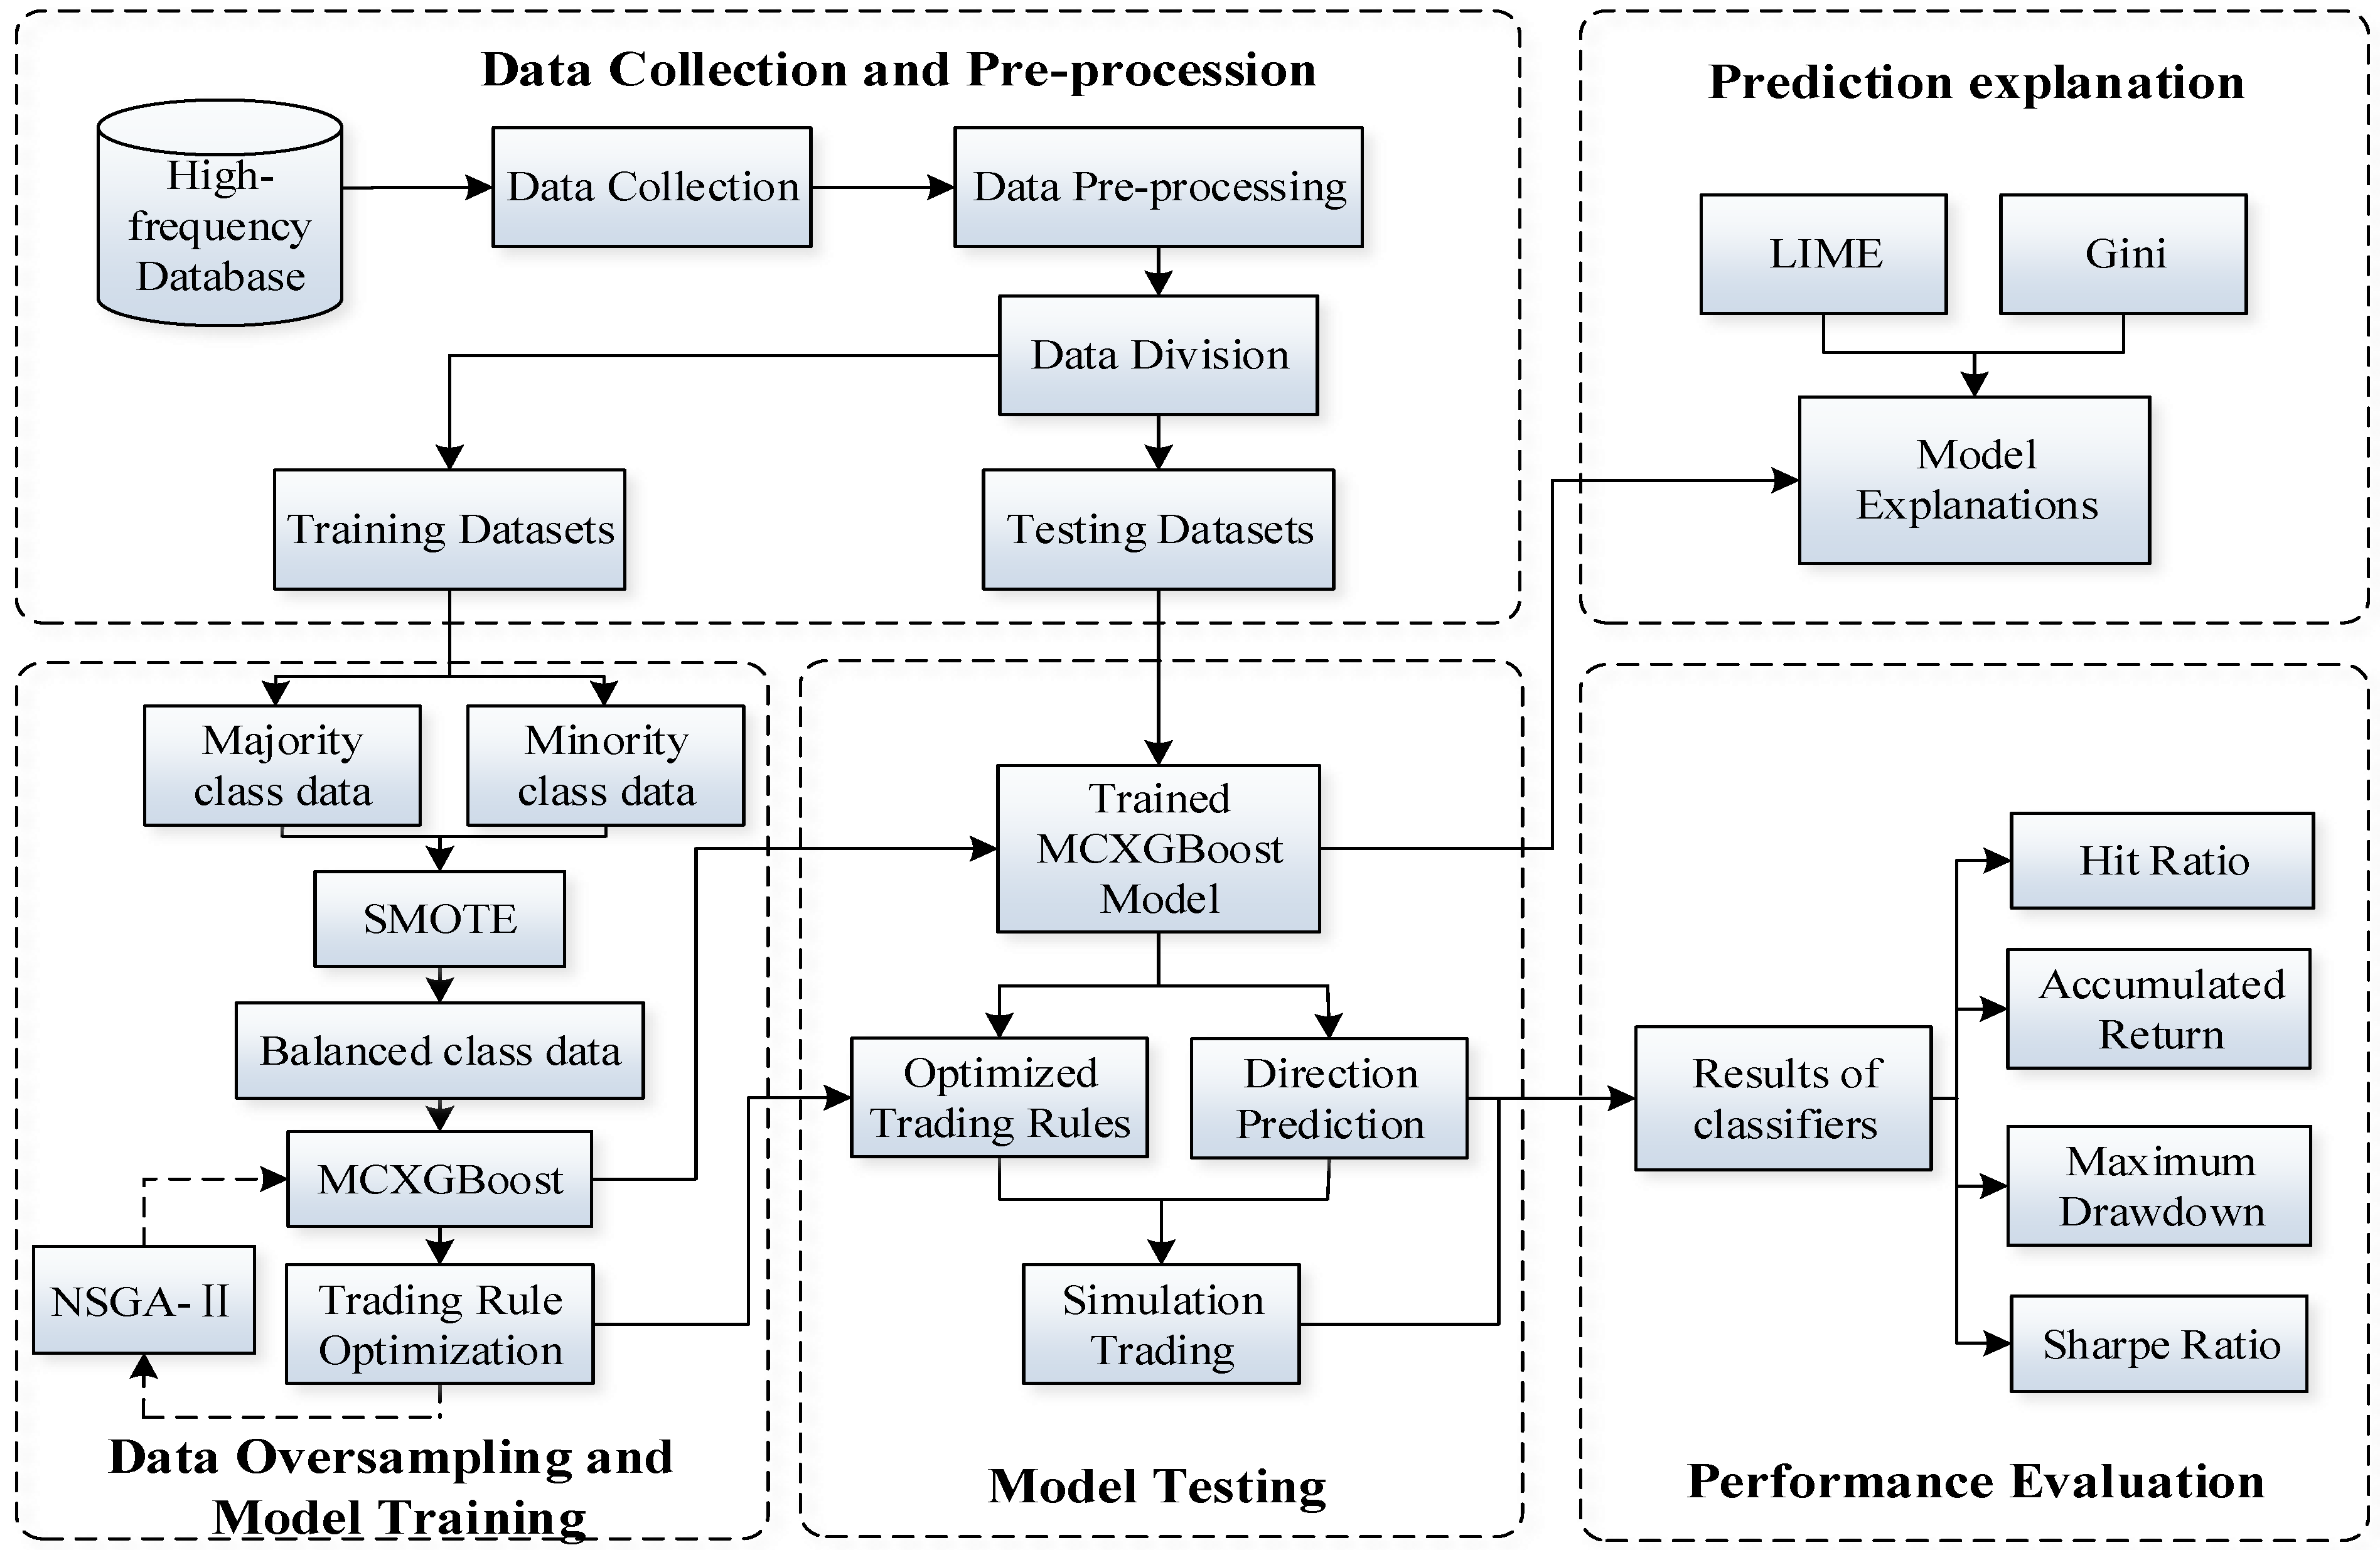
For direction prediction and simulation trading of the rebar futures, a multiclassification method, which combines XGBoost, SMOTE, and NSGA-II, is proposed in this research. The main structure of the proposed approach is presented in Figure 1, with its specific procedures summarized in the following steps:
  • Step 1: Data collection and pre-processing
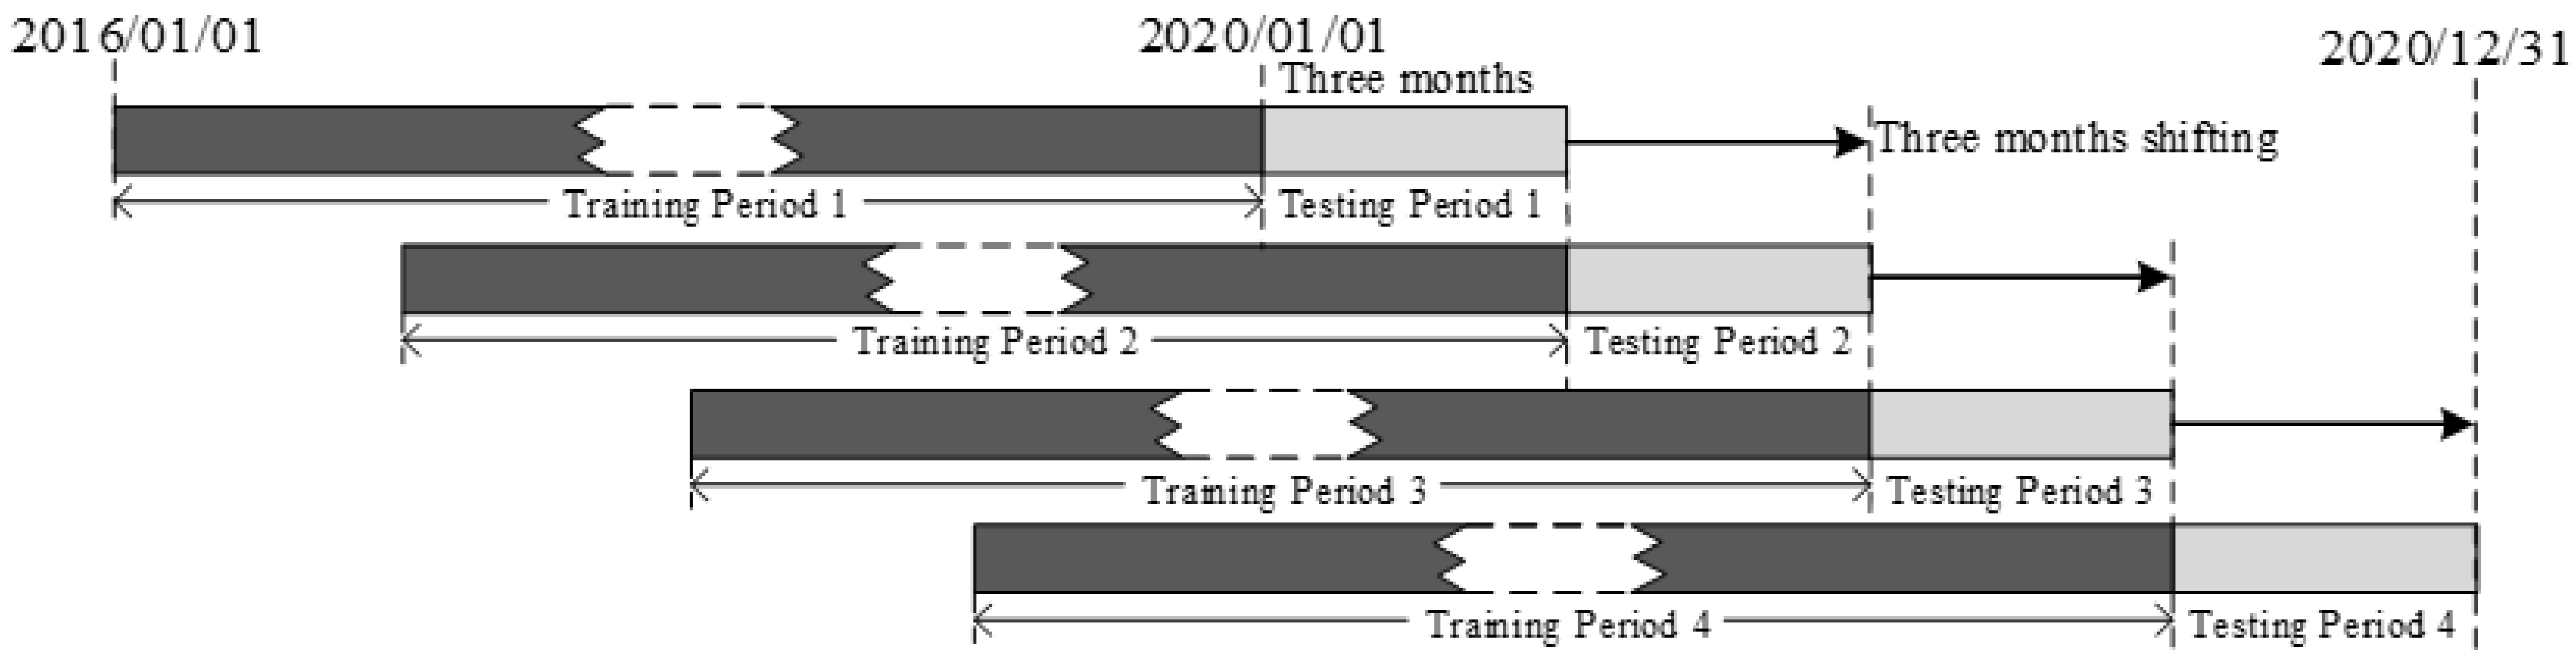
At first, 5 min historical trading data of the rebar futures are collected from databases. After timeframe transformation, the 1-h interval trading data are generated and normalized. Then, the entire dataset is divided into four consecutive experimental datasets. Each subdataset consists of a training period and a testing period.
  • Step 2: Data oversampling and model training
In the second step, the proposed approach uses the SMOTE technique to generate the class-balanced training datasets. Then, XGBoost is adopted to construct a multiclassification forecasting model using the balanced datasets. Meanwhile, NSGA-II is incorporated for parameters optimization of the pre-designed trading rule. The multiobjective optimization is performed to achieve the Pareto optimal solution for two objectives, including the maximization of accumulated return and minimization of the maximum drawdown.
  • Step 3: Model testing
In the third step, the optimized XGBoost model and trading rule are selected for price-movement-direction prediction and trading simulation of rebar futures in four consecutive testing periods.
  • Step 4: Model explanation
In the fourth step, LIME is adopted to explain how the XGBoost made multiclassification predictions for rebar futures price direction.
  • Step 5: Performance evaluation
In the final step, evaluation measures are employed to judge the prediction and trading performances of all methods from the perspective of direction prediction accuracy, profitability, and trading risk.

4. Experimental Design

4.1. Experimental Data

For direction forecasting and trading simulation, the 1-h frequency trading data of rebar futures are chosen and prepared for the experiments. It should be noted that before separating the whole dataset into the training and testing datasets, the 5 min frequency data are transformed into 1-h frequency data, and they are normalized afterward. The whole dataset includes five years data from 4 January 2016 and ending on 31 December 2020, which are derived from the Choice database (The formal website of Choice Database is http://choice.eastmoney.com/, accessed on 1 May 2022). Specifically, the historical transaction data consist of the opening, closing, high, and low prices. In addition, the trading volume and open interest of rebar futures are also included. Finally, the hourly returns ( R e t u r n ), trading volume change rates ( T V C R ), and open interest change rates ( O I C R ) from the ( i 9 )-th period to the i -th period are utilized as the input features for the classification model. The calculation formulas for the three input features at time t are shown in Equations (10)–(12), respectively:
R e t u r n t = C l o s e t O p e n t 9 O p e n t 9
T V C R t = T V t T V t 9 T V t 9
O I C R t = O I t O I t 9 O I t 9
where C l o s e and O p e n refer to the closing price and opening price of rebar futures in Equation (10). In Equations (11) and (12), T V and O I denote the trading volume and open interest of rebar futures, respectively.
Figure 2 shows a slide window method for the dynamic arrangement of the training and testing periods. The primary purpose of dividing the whole dataset into four consecutive subdatasets is to better test the effectiveness of the proposed method. The training period is designed for XGBoost model training and trading rule optimization, while the testing period is utilized to test the prediction and trading performance. After the experiment of one subdataset is done, the slide window is moved forward by three months to perform a new subdataset of model training and testing. The specific date ranges and sample sizes of four training and testing datasets are reported in Table 1. Note that the whole testing period lasts for one year.

4.2. Training Data Oversampling

In this research, for constructing a multiclassification model, the predicted labels are divided into five categories (see Section 4.3). Through our pre-analysis of the dataset in training period 1, we found that about 55% of the labels could be regarded as small fluctuations, according to which the classifier would not provide correct direction prediction and simulation trading for the large magnitude predictions. In addition, there is a minority sample of only 8% of this training dataset in one of the other four classes. It has been evidenced that the presence of the class imbalance in the raw training dataset might result in poor classification performance of minority categories in some binary or multiclassification classification tasks [46,47]. To solve this problem, a commonly used oversampling technique, named Synthetic Minority Oversampling Technique (SMOTE) [27], is integrated into the proposed approach. SMOTE is a heuristic oversampling technique that aims to balance the class distribution of the dataset to improve the efficiency of the classifier, while it can also alleviate the overfitting problem caused by random oversampling methods [47]. Rather than replicating existing observations, the SMOTE creates and inserts new synthetic samples in the minority class [26]. Specifically, suppose that the sample of the minority class in the training dataset is S min , the steps of SMOTE is to generate a class-balanced dataset follow:
Step 1: A random minority sample x is chosen from S min . Then, calculate the Euclidean distance of x from the other samples in S min , and its k nearest neighbors are identified.
Step 2: A random sample x n is selected from k nearest neighbors, and a new sample x n e w is created by the following rule:
x n e w = x + ω × x x n
where ω is a random weight chosen from the range [0, 1].
Step 3: Repeat steps 1–2 until the number of minority samples is satisfied.

4.3. Trading Rule Design and Optimization

Generally, it is necessary to optimize and select a set of optimal trading parameters for investors to improve the profit-making ability in the process of simulation trading. Instead of determining the parameters by experience of industry experts, the parameters of the trading rule designed in this research would be optimized by NSGA-II. To define the multiobjective optimization function, our proposed approach takes into account not only the profits from the trading rules but also the trading risks of transactions in the rebar futures market. Thus, two indicators, including the largest accumulated return and the smallest maximum drawdown, are designed as the optimization objectives of NSGA-II. Finally, through parameters optimization of the trading rule using NSGA-II, the XGBoost model with the Pareto optimal solutions in terms of those two optimization objectives is regarded as the optimal one for trading simulation in the corresponding testing period.
In the proposed approach, there are five categories of the price-movement magnitude (see Table 2), and the trading signals are determined based on the predicted level thresholds. Details for the multiclassification are shown in Figure 3. As the points B shown in Figure 3, when the predicted return (PR) is larger than T4, label = 5, and it will open a long position with leverage l4; similar to point A, when the PR is greater than T3 and less than or equal to T4, label = 4, and it will open a long position with leverage l3. As for point C, when PR is greater than or equal to T2 and less than or equal to T3, label = 3, and there is no transaction. As for point D, when the PR is greater than or equal to T1 and less than T2, label = 2, and a short-selling transaction will be conducted at the opening price of the next period with leverage l2. As for point E shown in Figure 3, when PR is less than T1, label = 1, and a short-selling transaction will be executed at the opening price of the next period with leverage l1. Note that the holding position will last for five hours. Then, the trading return TRi for each transaction can be calculated.
Additionally, the profit-taking thresholds ( P T ), loss-cutting thresholds ( L T ), and trading leverage ( l ) are comprehensively considered in the simulation trading of the rebar futures market. The primary purpose for the design of the loss-cutting threshold is to alleviate huge losses from potentially adverse market direction movements, while the profit-taking threshold is designed to prevent traders from losing profit opportunities if the market moves in the expected direction followed by a rapid retreat. When TRi is greater than PT or less than LT, the proposed method will close the opened position automatically. Hence, the NSGA-II algorithm is used to optimize the parameters of the trading rule, including the profit-taking thresholds (PT1, PT2, PT3, and PT4), loss-cutting thresholds (LT1, LT2, LT3, and LT4), and trading leverages (l1, l2, l3, and l4) for each transaction, which are presented as detailed in Table 2. The parameters of the trading rule and their search ranges are described in Table 2, with the calculation rule for the real return Ri generated from the i-th simulation transaction shown in Equation (14).
R e t u r n i = l i L T i ,   if   Trading   Signal = short & L T i > T R i l i T R i ,   if   Trading   Signal = short & L T i < T R i 0 ,                         if   Trading   Signal = No   Trading l i P T i ,   if   Trading   Signal = long & P T i < T R i l i T R i ,   if   Tranding   Signal = long & P T i > T R i  

4.4. Benchmark Models

To evaluate the forecasting and trading performance of our proposed approach on rebar futures, we compared its experimental results with other well-known machine-learning-based approaches and famous passive trading strategies, including XGBoost, Random Forest (RF), Support Vector Machines (SVM), Artificial Neural Network (ANN), Buy-and-Hold (BAH), and Short-and-Hold (SAH). Additionally, an integration method called XGBoost-SMOTE is also constructed to compare with the proposed approach on the rebar futures price prediction. A list including the proposed approach and benchmark approaches in the experiments with their brief descriptions is displayed in Table 3. Method 1 is our proposed approach, which is designed as a multiclassification method based on the XGBoost algorithm. Before direction prediction, as described in Section 4.2, the SMOTE technique is employed for solving the imbalanced data problem. Next, NSGA-II is used for optimizing the parameters of the trading rule as introduced in Section 4.3. In order to validate the direction prediction accuracy and profitability of the proposed approach with the application of the multiobjective optimization method, XGBoost and SMOTE are integrated in Method 2 to forecast the movement direction and to execute simulation trading. In particular, since there is an obvious category imbalance in the training data if the SMOTE is not employed, Methods 3–6 are designed as binary classification models to forecast the price-movement direction of rebar futures. If the predicted result is positive, those methods will execute a long transaction at the next opening price. Otherwise, they would execute a short-selling transaction if the classification result belongs to the negative class. Method 3 is designed based on a binary XGBoost model to identify whether the integration of SMOTE could successfully enhance the classification performance of the classifier. Method 4 adopts a tree-based algorithm RF to construct the forecasting model. Moreover, Methods 5 and 6 develop an SVM-based model and an ANN-based model, respectively, which are utilized to compare the efficiency of XGBoost with those two classic and commonly used machine learning methods for the financial time series prediction. Note that the model hyperparameters of all methods (Methods 1–6) are optimized by the grid search algorithm. Moreover, for the purpose of investigating whether the proposed approach is superior to the classic passive trading strategies, BAH and SAH are also involved (Methods 7 and 8). Furthermore, as recommended by Thomason [48], a forecasting period of five periods could be a suitable time horizon. Thus, it is chosen in the simulation trading for our proposed method and all benchmarks.

4.5. Evaluation Metrics

To assess the direction prediction accuracy and profitability of the proposed method, four measures are employed in the experiments. The formulas to calculate those four metrics are presented in Table 4.
First, hit ratio ( H R ) calculates the correct direction prediction rate, which is generally used to identify the classification accuracy of the proposed approach and benchmark methods on rebar futures forecasting. Since our proposed model would not perform direction prediction if the predicted trading signal belongs to the “No Trading” class, the number of predictions in this range is not included in the formula. As shown in formula 1 of Table 4, N denotes the number of all prediction times, P N and N N respectively refers to the number of correct “upward” predictions and correct “downward” predictions.
Second, accumulated return ( A R ) is defined and utilized to measure the profit-making ability of simulation trading in each testing period. There are a total of three conditions for simulating trading: (1) Suppose that if the predictor predicts that the rebar futures price is in a rising trend, and the predicted return is larger than the level threshold for long, a “long” position would be executed. (2) If the price movement is downward and the predicted value is smaller than the level threshold for short, the proposed method would perform a “short-selling” transaction in the rebar futures market. (3) The proposed method would not execute trading simulation if the predicted return is in the range T 2 , T 3 . Additionally, the profit-taking and loss-cutting thresholds are utilized in the proposed method, so that the trading position will be automatically closed in the case that the floating return exceeds one of those values during the position holding period. In formula 2 of Table 4, n represents the number of periods that lasts for one quarter in each testing period; c l and o p denote the closing and opening prices of rebar futures, respectively, l means the trading leverage, and t refers to the number of periods ahead for simulation trading. As recommended by Thomason [48], five-periods-ahead prediction is designed in this experiment. Additionally, the transaction cost c o s t is required when the model executes a long or short transaction in the futures market. The transaction cost includes the liquidity, execution, and slippage cost. It is set to be 0.1% per round trip based upon an arbitrary assumption [49]. Furthermore, sgn φ is a symbolic function, in which φ refers to the movement magnitude level.
Third, except for generating excellent prediction ability and profitability, trading risk also exerts a fundamental influence in examining the performance of a portfolio that market investors should pay attention to. As a commonly used risk indicator, maximum drawdown ( M D D ) describes the maximum retracement magnitude of the expected return generated by an investment portfolio over a selected period. This indicator could be used to help the market investors understand the stability of the profits and the possibility of potential losses of the model. As shown in formula 3 of Table 4, A R i represents the accumulated return at the time i , A R j denotes the value of accumulated return at the time j before the time i , and D i represents the maximum retracement magnitude of the accumulated return at the time i .
Fourth, the Sharpe ratio ( S R ) was proposed by William F. Sharpe in 1994 [50], which is also employed as one of the famous indicators for transaction risk evaluation. The Sharpe ratio is implemented to evaluate the excess return per unit of return deviation in a portfolio, which allows a combination of returns and risks to be comprehensively considered to examine investment performance. The method for calculating the Sharpe ratio is described in Table 4, in which R a refers to the asset return, r f means the risk-free interest rate, and σ a represents the standard deviation of asset return. The one-year treasury bond interest rates of China, which are provided by the China Bond Information website (China Bond Information Website is https://www.chinabond.com.cn/, accessed on 1 May 2022), is considered as the risk-free interest rate to calculate the Sharpe ratio results of each method. Note that the period is from January 2020 to December 2020. Considering that the time horizon of one testing period is three months, a quarter of the one-year treasury bond interest rate is finally set to be 0.61% for calculation.

5. Results and Discussion

5.1. Results of Classifiers

5.1.1. Hit Ratio

To explore the forecasting performance of our proposed approach on the rebar futures price, several methods described in Section 4.4, including XGBoost-SMOTE, XGBoost, SVM, ANN, and RF, are used as the benchmark methods in the experiments. Firstly, we focus on the hit ratio results to compare the forecasting accuracy of the proposed method and the benchmark methods. The hit ratio results are provided in Table 5.
Among all the methods, XGBoost-SMOTE-NSGA-II achieved the best average hit ratio result in predicting the direction movements of the rebar futures price. As shown in Table 5, the average hit ratio of XGBoost-SMOTE-NSGA-II was about 53.98%, while XGBoost, RF, SVM, and ANN yielded the values of 48.98%, 48.95%, 47.17%, and 48.05%, respectively. Specifically, it was found that the average hit ratio result of XGBoost was a slightly larger than that of RF, SVM and ANN, suggesting that the direction classification performance of XGBoost is superior to other machine learning technologies. Compared to that improvement, the proposed method XGBoost-SMOTE-NSGA-II obviously achieved a superior result in terms of the average hit ratio, as well as generating the best hit ratio results in testing periods 1 and 4. In particular, despite the better classification performance achieved by XGBoost in testing period 2, the hit ratio results in the other three testing periods were worse than our proposed approach. Similarly, ANN yielded a larger hit ratio in testing period 3, while our proposed method still outperformed ANN in the other three testing periods. It demonstrates that the integration of the SMOTE technology successfully promoted the classifier’s prediction accuracy. In conclusion, our proposed approach has a relatively superior forecasting ability to forecast the movement direction of the rebar futures price.

5.1.2. Accumulated Return

As described in Section 4.5, whether the investment portfolio designed in simulation trading could generate considerable profits is even more critical for market investors. In Table 6, the trading return results of all methods in four quarters are reported. Note that the two passive investment strategies, BAH and SAH, are also included in Table 6 to better evaluate the profitability of the proposed method.
From the return results shown in Table 6, the largest average return result was generated by XGBoost-SMOTE-NSGA-II, reaching approximately 0.349, which is superior to that of other benchmark methods. Among the four single-algorithm-based models (ANN, SVM, RF, and XGBoost), we find that although none were able to produce positive average returns, XGBoost yielded an average return of −0.064. It outperformed ANN, SVM, and RF, which incurred losses of −0.183, −0.267, and −0.354 on rebar futures simulation transaction, respectively. Specifically, the two traditional machine learning methods (ANN and SVM) continuously suffered from huge losses, thus both generated negative returns in the four testing periods. It demonstrates that it would be less effective to improve return predictions on the rebar futures price movements by implementing a single machine learning method. In addition, it can be observed that the method XGBoost-SMOTE still failed to obtain a satisfactory result in terms of the average trading return, demonstrating that solving the class imbalanced dataset problem could not lead to a significant improvement on the profitability of the trading rule. Hence, to facilitate trading performance, the optimization of the trading rule is employed in our proposed method.
By comparing the results of BAH and SAH with our proposed approach, it is found that the SAH strategy produced negative returns in the last three testing periods, resulting in an average loss of −0.056. For the BAH, despite yielding a positive average return, the yield is significantly worse than that of our proposed method. Besides the best average return, XGBoost-SMOTE-NSGA-II achieved return results of 0.278, 0.237, 0.462, and 0.418 in the four testing periods, which are much better than other benchmark methods. According to the return results and analysis mentioned above, it should be noted that the proposed approach achieved optimal profitability among all benchmark methods after considering the NSGA-II method. Therefore, the effectiveness of the proposed method in rebar futures simulation trading has been further verified.
To verify whether the profitability of the proposed method XGBoost-SMOTE-NSGA-II was significantly better than that of the benchmark methods, the Friedman test [51] was employed to investigate whether the accumulated return results achieved by the proposed method and the benchmark methods were significantly different. Table 7 reports the Friedman test results on the accumulated return results, from which we find that the conclusion is significant at the 0.05 level for one-tailed test. It demonstrates that the method proposed in this study significantly outperformed the benchmark methods in terms of profit-making ability.
Furthermore, Figure 4 shows the accumulated return curves generated by the proposed method XGBoost-SMOTE-NSGA-II and other benchmarks and the closing price of rebar futures in the whole testing period. The horizontal axis represents the experimental date from January 2020 to December 2020. The left vertical axis of Figure 4 indicates the value of accumulated returns, while the price movements of the rebar futures plotted by the brown curve are displayed on the right vertical axis. According to the experimental results, XGBoost-SMOTE-NSGA-II performed at 31, 47, 42, and 47 times the direction predictions and transactions, respectively, and the black marks “L” and “S” above the red curve in Figure 4 indicate that the proposed method executed a “long-selling” and “short-selling” transaction at this period.
As shown in Figure 4, it could be found that the proposed method yielded the largest accumulated return over the whole testing period, with a one-year return of 1.395 at the end of December 2020. For comparison, the accumulated returns of the benchmarks, including BAH, SAH, ANN, SVM, RF, XGBoost, and XGBoost-SMOTE, were about 0.216, −0.224, −0.733, −1.069, −1.415, −0.254, and −0.311, respectively. It is observed that there were no obvious returns produced by BAH and SAH during the entire testing period. Compared to our proposed approach, the accumulated returns of these two passive strategies were smaller by about 1.179 and 1.619 at the end of the testing period. In addition, for the machine-learning-based benchmark methods ANN, SVM, RF, XGBoost, and XGBoost-SMOTE, each suffered from several losses in the four testing periods, which ultimately led to less satisfactory return results. In contrast, the process of positive return accumulated by our proposed method was steadier than other benchmarks in rebar futures market trading, with a relatively large retracement only occurring in March and April 2020. It demonstrates that the proposed method has superior stability and profitability for achieving an outstanding trading performance, which could be utilized as a reliable alternative for rebar futures transactions.

5.1.3. Trading Result Results

In Table 8, we show the maximum drawdown results, while the Sharpe ratio results of the proposed method and benchmarks are reported in Table 9. The primary objective of adopting those two indicators is to measure the transaction risks of each method in determining the investment portfolio.
The maximum drawdown results in Table 8 show that BAH yielded an average maximum drawdown result of 0.080 and an overall maximum drawdown result of 0.134 over four testing periods, which outperformed our proposed approach and other benchmarks. Nevertheless, as we discussed in Section 5.1.2, although BAH experienced no obvious retracement, the profit-making ability that market traders give much attention to is markedly worse than the proposed XGBoost-SMOTE-NSGA-II method. Similar conclusions can be drawn from the maximum drawdown results of SAH. Except for BAH and SAH, the proposed method generated an overall maximum drawdown result of 0.146 over the one-year testing period, while other benchmark methods ANN, SVM, RF, XGBoost, and XGBoost-SMOTE, respectively, generated values of about 0.838, 1.241, 1.575, 0.587, and 0.491, which were worse than the proposed method. Furthermore, although the proposed method obtained a larger maximum drawdown result than the XGBoost-based benchmark in testing period 2, it produced better results than the benchmarks in the other three testing periods. Experimental results demonstrate that the proposed method yielded a relatively stable and excellent return successfully, and the proposed method was remarkably superior to the other machine-learning-based methods, which suffered from large retracements.
Furthermore, as we mentioned in Section 4.5, the risk-free interest rate set at 0.61% is used for the Sharpe ratio calculation. In Table 9, we report the excess returns and Sharpe ratio results of the benchmark methods and proposed method.
In the trading simulation over the whole testing period of 2020, the proposed method generated the best Sharpe ratio result (3.6574), which was obviously superior to all the other benchmark methods. As for the trading strategy BAH, its excess return was about 0.0479, ultimately leading to a very small positive Sharpe ratio value of 0.4176. Additionally, it could be noticed that the Sharpe ratio of SAH, ANN, SVM, RF, XGBoost, and XGBoost-SMOTE were all negative with the values of −0.5414, −2.0454, −1.6346, −1.2001, −0.2537, and −1.2948, respectively, demonstrating that the integration of the parameter optimization method NSGA-II successfully promoted the profitability as well as lowering the volatility for the proposed method. The excellent performance indicates that the proposed method could be adopted as an effective approach for movement direction prediction and high-frequency trading of the rebar futures.

5.2. Feature Importance Results

To enhance the model interpretability, the influential indicators for the rebar futures price direction prediction can be explored by the ranking of feature importance derived from XGBoost [52]. Figure 5 shows the relative importance scores of the top ten most essential features in four training periods. A larger importance score indicates that the corresponding input variable is more important. We observe that among the top ten features, the features with the largest relative importance scores in the first training period primarily belong to the return and trading volume change rate. Additionally, in the next three training periods, the importance of trading volume change rate in the top ten most essential features was gradually increased, indicating that trading volume consistently exerts a significant influence. It should be highlighted in the direction prediction of the rebar futures price. In contrast, the decreasing proportion of the open interest change rate showed a lower necessity for the forecasting model. In addition, trading volume change rates with a five-period lag and an eight-period lag consistently ranked in the top ten relative importance scores over the four training periods, which demonstrate that these two features could be the most important elements in predicting the rebar futures price movement. Thus, the results of feature importance ranking are of practical significance for improving the interpretability of the model and identifying influential features for market participants.

5.3. Results of LIME

In the proposed method, the LIME algorithm is applied to interpret how the XGBoost made multiclassification of the rebar futures price direction. Since the proposed method produced the largest accumulated return during the third period, the LIME results within the third period are presented and discussed. The effects of each variable on the multiclassification results for the sample in the third period are illustrated in Figure 6. The subplots (a)/(b)/(c)/(d) represent the prediction results for label = 1/2/4/5, respectively. Note that label = 3 indicates no trading. In addition, these labels correspond to four trading signals. The horizontal axis of each subplot contains the ten cases we selected in the testing period, while the vertical axis of each subplot displays the influence of features on the prediction results. Additionally, a red square means that the feature has a negative influence, while a blue one reflects a positive influence. A deeper color means that it is more influential of that feature. Note that we focus on the top eight most important features out of all features. As we explained in Section 4.1, Ri ( R e t u r n i ), Ti ( T V C R i ), and Ii ( O I C R i ) respectively, denote the return at time i, trading volume change rate at time i, and open interest change rate with lag length i. For example, “I02” represents the open interest change rate with a lag of two periods.
In Figure 6a, it can be observed that for case 1, the top eight most influential features for the prediction result “label = 1” are “I01”, “I03”, “R02”, “R07”, “R08”, “T02”, “T04”, and “T09”. Among them, when feature R07 is larger than 0.558 and feature R08 exceeds to 0.559, they both have a positive influence on the classification results. When feature “I01” is larger than 0.737 and less than 0.777, feature “I03” is larger than 0.737 and less than 0.778, feature “R02” is larger than 0.491 and less than “0.563”, feature “T02” exceeds 0.01535, feature “T04” exceeds 0.00159, and feature “T09” exceeds 0.01508, then they all have negative effects on the prediction results. Moreover, it is obvious that features “T02” and “T09” exert greater influence on the results in the range compared to other features with negative influence. Similar conclusions can be drawn from other cases. In general, for the result “label = 1”, there is a great negative influence when feature “I04” is larger than 0.776 and “T02” is larger than 0.01535. Additionally, there is a significant positive effect as feature “R07” exceeds 0.558 and “R08” exceeds 0.559; Similarly, for “label = 2”, there is a significant negative effect as feature “T01” exceeds 0.01534 and a significant positive effect when feature “T09” exceeds 0.01508; for “label = 4”, there is a significant positive effect as feature “R05” exceeds 0.559; for “label = 5”, when feature “I03” exceeds 0.778 and features “I04” and “I05” exceed 0.776, there is a significant positive effect on the classification results. On the contrary, there is a significant negative effect when “R05” exceeds 0.559. The model explanation using LIME effectively enhanced the interpretability of the proposed approach. It provides market investors and regulators with a powerful tool to better understand how the proposed method makes predictions and trading.

6. Conclusions

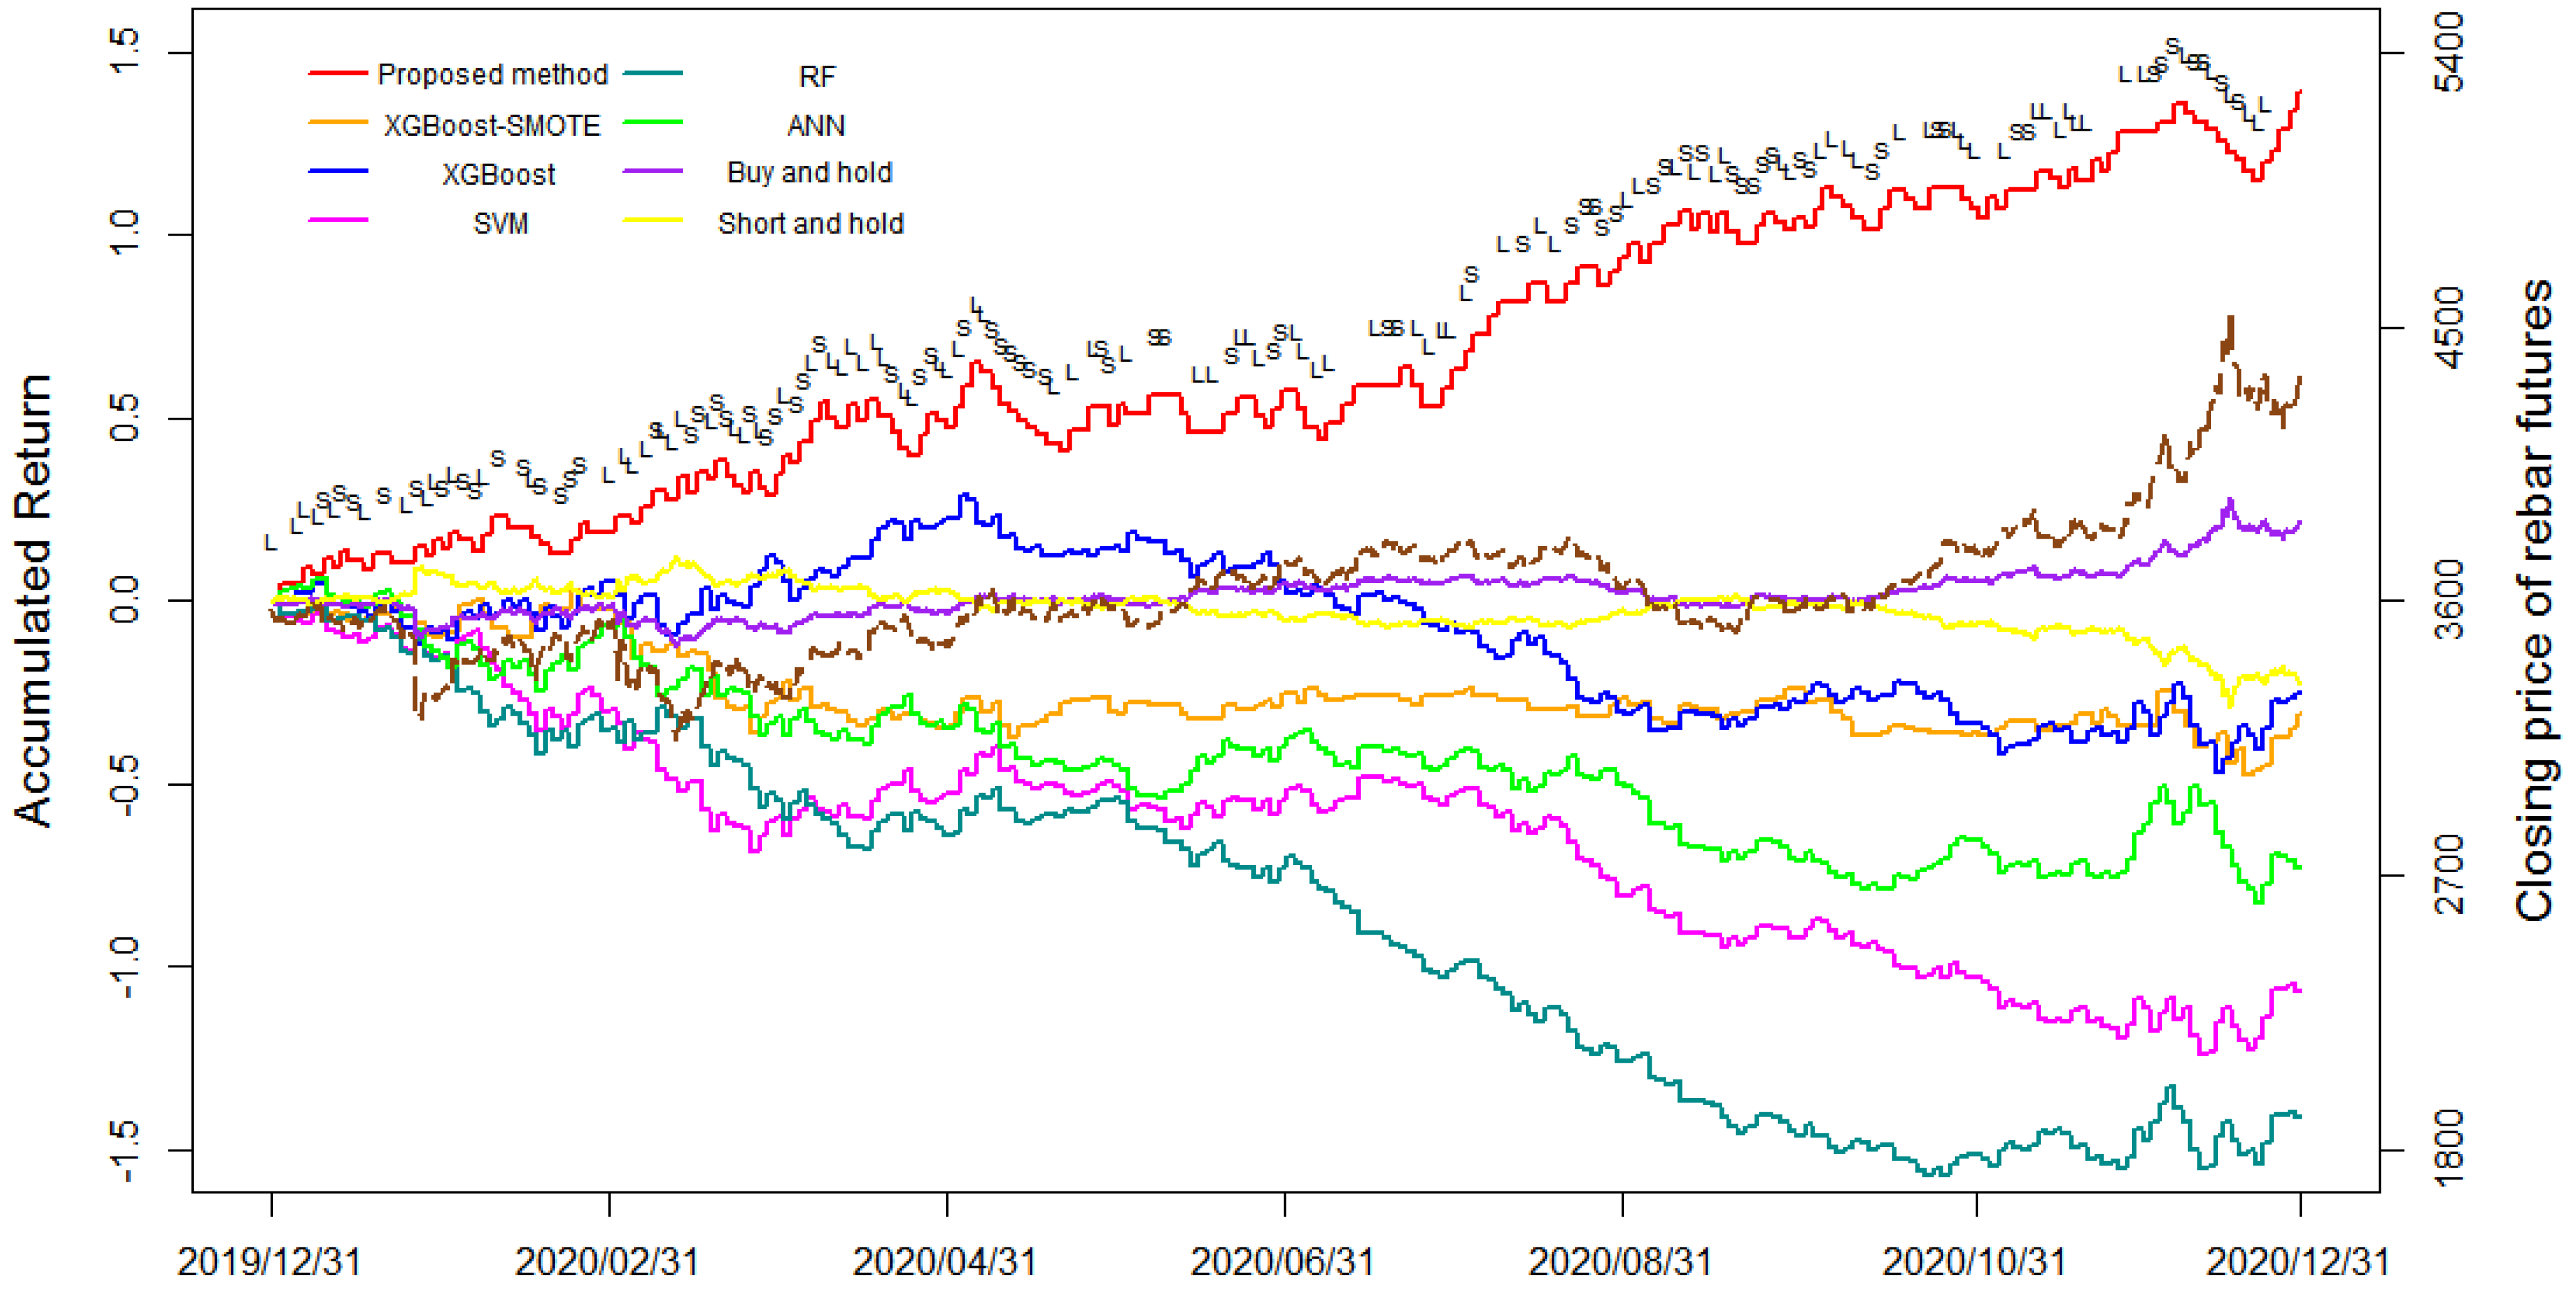
In this research, a novel integration approach based on a combination of XGBoost, SMOTE, and NSGA-II is developed to predict and trade on rebar futures. In the proposed model, the training datasets of minority classes are oversampled by the SMOTE technique to overcome the problem of the class imbalance, and XGBoost is adopted for the rebar futures price direction prediction using the oversampled training data. Then, NSGA-II is employed to search for the Pareto optimal solution of the trading rule parameters by efficiently allocating accumulated returns and maximum drawdown. The proposed approach produced an average hit ratio of 53.98% and an average return of 34.9% over the four testing periods. The proposed method also performed well in terms of the accumulated return of the entire one-year simulation trading with the value of 1.395. Furthermore, the maximum drawdown and Sharpe ratio of the proposed method reached 0.135 and 3.6574, respectively, which were superior to all the benchmark methods. Based on the experimental results comparison of the proposed method and benchmarks, it demonstrates that the proposed method XGBoost-SMOTE-NSGA-II successfully enhances the direction prediction accuracy and profitability, and generates the best return–risk ratio results among all the investigated methods. In summary, according to the outstanding direction prediction and simulation trading performances, it demonstrates that the proposed XGBoost-SMOTE-NSGA-II method can be utilized as an effective decision-making system for both investors and regulators engaged in the rebar futures market.
In this paper, we propose a high-frequency direction prediction and simulation trading model for rebar futures that combines the XGBoost, SMOTE and NSGA-II algorithms. The LIME algorithm is adopted to explain the prediction results of the proposed method. There are some research directions to be further expanded. For instance, in this research, historical transaction data from ten periods are utilized for five periods-ahead movement prediction, different time frames of historical data could be further considered as input features for prediction performance comparison. Moreover, this research develops an integrated approach based on the historical price data of rebar futures for direction forecasting. However, the sentiment and behavior of investors in the futures market could have an impact on the movement of futures prices. Therefore, other researchers may take into account the influence of investors’ sentiment features to improve the model prediction and trading accuracy. Moreover, scholars could employ other machine-learning algorithms as the multiclassification models, such as Random Forest [53], CatBoost, and LightGBM. Moreover, scholars can also try other methods to solve the imbalance sample problem, such as the Generative Adversarial Networks (GAN) [54], LoRAS [55], or the improved algorithms of SMOTE [56].

Author Contributions

Conceptualization, S.D. (Shangkun Deng); methodology, S.D. (Shangkun Deng); software, X.H. and Y.Z.; validation, S.D. (Shangkun Deng) and Y.Z.; formal analysis, S.D. (Shangkun Deng) and X.H.; investigation, Y.Z.; resources, S.D. (Shangkun Deng) and Z.F.; data curation, Y.Z.; writing—original draft preparation, Y.Z. and S.D. (Shangkun Deng); writing—review and editing, S.D. (Shangkun Deng) and S.D. (Shuangyang Duan); visualization, X.H.; supervision, S.D.; project administration, S.D. (Shangkun Deng) and Z.F.; funding acquisition, S.D. (Shangkun Deng) and X.H. All authors have read and agreed to the published version of the manuscript.

Funding

This research was sponsored by the Hubei Provincial Natural Science Foundation of China (grant number 2021CFB175) and the Philosophy and Social Science Research Project of the Department of Education of Hubei Province (grant number 21Q035).

Institutional Review Board Statement

Not applicable.

Informed Consent Statement

Not applicable.

Data Availability Statement

Publicly available datasets were analyzed in this study. This data can be found here: [http://choice.eastmoney.com/ accessed on 1 May 2022].

Acknowledgments

We thank the anonymous reviewers for their comments and discussions.

Conflicts of Interest

The authors declare no conflict of interest.

References

  1. Kim, K.; Lim, S. Price discovery and volatility spillover in spot and futures markets: Evidences from steel-related commodities in China. Appl. Econ. Lett. 2019, 26, 351–357. [Google Scholar] [CrossRef]
  2. Tan, Z.; Zhang, J.; Wang, J.; Xu, J. Day-ahead electricity price forecasting using wavelet transform combined with ARIMA and GARCH models. Appl. Energy 2010, 87, 3606–3610. [Google Scholar] [CrossRef]
  3. Batchelor, R.; Alizadeh, A.; Visvikis, I. Forecasting spot and forward prices in the international freight market. Int. J. Forecast. 2007, 23, 101–114. [Google Scholar] [CrossRef]
  4. Lu, W.; Geng, C.; Yu, D. A New Method for Futures Price Trends Forecasting Based on BPNN and Structuring Data. IEICE Trans. Inf. Syst. 2019, 102, 1882–1886. [Google Scholar] [CrossRef] [Green Version]
  5. Li, X.; Tang, P. Stock index prediction based on wavelet transform and CD-MLGRU. J. Forecast. 2020, 39, 1229–1237. [Google Scholar] [CrossRef]
  6. Lasheras, F.S.; De Cos Juez, F.J.; Sánchez, A.S.; Krzemień, A.; Fernández, P.R. Forecasting the COMEX copper spot price by means of neural networks and ARIMA models. Resour. Policy 2015, 45, 37–43. [Google Scholar] [CrossRef]
  7. Baruník, J.; Malinská, B. Forecasting the term structure of crude oil futures prices with neural networks. Appl. Energ. 2016, 164, 366–379. [Google Scholar] [CrossRef] [Green Version]
  8. Das, S.P.; Padhy, S. A novel hybrid model using teaching–learning-based optimization and a support vector machine for commodity futures index forecasting. Int. J. Mach. Learn. Cyb. 2018, 9, 97–111. [Google Scholar] [CrossRef]
  9. De Almeida, B.J.; Neves, R.F.; Horta, N. Combining Support Vector Machine with Genetic Algorithms to optimize investments in Forex markets with high leverage. Appl. Soft Comput. 2018, 64, 596–613. [Google Scholar] [CrossRef]
  10. Lessmann, S.; Voss, S. Car resale price forecasting: The impact of regression method, private information, and heterogeneity on forecast accuracy. Int. J. Forecast. 2017, 33, 864–877. [Google Scholar] [CrossRef]
  11. Zhang, J.; Cui, S.; Xu, Y.; Li, Q.; Li, T. A novel data-driven stock price trend prediction system. Expert Syst. Appl. 2018, 97, 60–69. [Google Scholar] [CrossRef]
  12. Kara, Y.; Boyacioglu, M.A.; Baykan, Ö.K. Predicting direction of stock price index movement using artificial neural networks and support vector machines: The sample of the Istanbul Stock Exchange. Expert Syst. Appl. 2011, 38, 5311–5319. [Google Scholar] [CrossRef]
  13. Hao, P.Y.; Kung, C.F.; Chang, C.Y.; Ou, J.B. Predicting stock price trends based on financial news articles and using a novel twin support vector machine with fuzzy hyperplane. Appl. Soft Comput. 2021, 98, 106806. [Google Scholar] [CrossRef]
  14. Ballings, M.; Van den Poel, D.; Hespeels, N.; Gryp, R. Evaluating multiple classifiers for stock price direction prediction. Expert Syst. Appl. 2015, 42, 7046–7056. [Google Scholar] [CrossRef]
  15. Chen, T.; Guestrin, C. XGBoost: A Scalable Tree Boosting System. In Proceedings of the 22nd ACM Sigkdd International Conference on Knowledge Discovery and Data Mining, San Francisco, CA, USA, 13–17 August 2016; pp. 785–794. [Google Scholar]
  16. Chang, Y.C.; Chang, K.H.; Wu, G.J. Application of eXtreme gradient boosting trees in the construction of credit risk assessment models for financial institutions. Appl. Soft Comput. 2018, 73, 914–920. [Google Scholar] [CrossRef]
  17. Mahendiran, T.V. A color harmony algorithm and extreme gradient boosting control topology to cascaded multilevel inverter for grid connected wind and photovoltaic generation subsystems. Sol. Energy 2020, 211, 633–653. [Google Scholar] [CrossRef]
  18. Deng, S.; Wang, C.; Li, J.; Yu, H.; Tian, H.; Zhang, Y.; Cui, Y.; Ma, F.; Yang, T. Identification of Insider Trading Using Extreme Gradient Boosting and Multi-Objective Optimization. Information 2019, 10, 367. [Google Scholar] [CrossRef] [Green Version]
  19. Meng, M.; Zhong, R.; Wei, Z. Prediction of methane adsorption in shale: Classical models and machine learning based models. Fuel 2020, 278, 118358. [Google Scholar] [CrossRef]
  20. Madrid, E.A.; Antonio, N. Short-Term Electricity Load Forecasting with Machine Learning. Information 2021, 12, 50. [Google Scholar] [CrossRef]
  21. Huang, S.F.; Guo, M.; Chen, M.R. Stock market trend prediction using a functional time series approach. Quant. Financ. 2020, 20, 69–79. [Google Scholar] [CrossRef]
  22. Deng, S.; Huang, X.; Qin, Z.; Fu, Z.; Yang, T. A novel hybrid method for direction forecasting and trading of apple futures. Appl. Soft Comput. 2021, 110, 107734. [Google Scholar] [CrossRef]
  23. Deng, S.; Huang, X.; Wang, J.; Qin, Z.; Fu, Z.; Wang, A.; Yang, T. A decision support system for trading in apple futures market using predictions fusion. IEEE Access 2021, 9, 1271–1285. [Google Scholar] [CrossRef]
  24. Chen, W.; Zhang, H.; Mehlawat, M.K.; Jia, L. Mean–variance portfolio optimization using machine learning-based stock price prediction. Appl. Soft Comput. 2021, 100, 106943. [Google Scholar] [CrossRef]
  25. Blagus, R.; Lusa, L. SMOTE for high-dimensional class-imbalanced data. BMC Bioinform. 2013, 14, 106. [Google Scholar] [CrossRef] [Green Version]
  26. Douzas, G.; Bacao, F.; Last, F. Improving imbalanced learning through a heuristic oversampling method based on k-means and SMOTE. Inf. Sci. 2018, 465, 1–20. [Google Scholar] [CrossRef] [Green Version]
  27. Chawla, N.V.; Bowyer, K.W.; Hall, L.O.; Kegelmeyer, W.P. Smote: Synthetic minority over-sampling technique. J. Artif. Intell. Res. 2002, 16, 321–357. [Google Scholar] [CrossRef]
  28. Bunkhumpornpat, C.; Sinapiromsaran, K.; Lursinsap, C. DBSMOTE: Density-Based Synthetic Minority Over-sampling Technique. Appl. Intell. 2012, 36, 664–684. [Google Scholar] [CrossRef]
  29. Bach, M.; Werner, A.; Żywiec, J.; Pluskiewicz, W. The study of under-and over-sampling methods’ utility in analysis of highly imbalanced data on osteoporosis. Inf. Sci. 2017, 384, 174–190. [Google Scholar] [CrossRef]
  30. Guan, H.; Zhang, Y.; Xian, M.; Cheng, H.D.; Tang, X. SMOTE-WENN: Solving class imbalance and small sample problems by oversampling and distance scaling. Appl. Intell. 2021, 51, 1394–1409. [Google Scholar] [CrossRef]
  31. Deb, K.; Pratap, A.; Agarwal, S.; Meyarivan, T. A fast and elitist multiobjective genetic algorithm: NSGA-II. IEEE. Trans. Evol. Comput. 2002, 6, 182–197. [Google Scholar] [CrossRef] [Green Version]
  32. Raad, D.; Sinske, A.; Van Vuuren, J. Robust multi-objective optimization for water distribution system design using a meta-metaheuristic. Int. Trans. Oper. Res. 2009, 16, 595–626. [Google Scholar] [CrossRef]
  33. Cao, K.; Batty, M.; Huang, B.; Liu, Y.; Yu, L.; Chen, J. Spatial multi-objective land use optimization: Extensions to the non-dominated sorting genetic algorithm-II. Int. J. Geogr. Inf. Sci. 2011, 25, 1949–1969. [Google Scholar] [CrossRef]
  34. Feng, Y.Y.; Wu, I.C.; Chen, T.L. Stochastic resource allocation in emergency departments with a multi-objective simulation optimization algorithm. Health Care Manag. Sci. 2017, 20, 55–75. [Google Scholar] [CrossRef] [PubMed]
  35. Areekul, P.; Senjyu, T.; Toyama, H.; Yona, A. A Hybrid ARIMA and Neural Network Model for Short-Term Price Forecasting in Deregulated Market. IEEE. Trans. Power Syst. 2010, 25, 524–530. [Google Scholar] [CrossRef]
  36. Kim, H.Y.; Won, C.H. Forecasting the Volatility of Stock Price Index: A Hybrid Model Integrating LSTM with Multiple GARCH-Type Models. Expert Syst. Appl. 2018, 103, 25–37. [Google Scholar] [CrossRef]
  37. Deng, S.; Xiang, Y.; Nan, B.; Tian, H.; Sun, Z. A hybrid model of dynamic time wrapping and hidden Markov model for forecasting and trading in crude oil market. Soft Comput. 2020, 24, 6655–6672. [Google Scholar] [CrossRef]
  38. Niu, H.; Xu, K.; Wang, W. A hybrid stock price index forecasting model based on variational mode decomposition and LSTM network. Appl. Intell. 2020, 50, 4296–4309. [Google Scholar] [CrossRef]
  39. Xu, Y.; Zhao, X.; Chen, Y.; Yang, Z. Research on a Mixed Gas Classification Algorithm Based on Extreme Random Tree. Appl. Sci. 2019, 9, 1728. [Google Scholar] [CrossRef] [Green Version]
  40. Mustapha, I.B.; Saeed, F. Bioactive Molecule Prediction Using Extreme Gradient Boosting. Molecules 2016, 21, 983. [Google Scholar] [CrossRef] [Green Version]
  41. Song, K.; Yan, F.; Ding, T.; Gao, L.; Lu, S. A steel property optimization model based on the XGBoost algorithm and improved PSO. Comput. Mater. Sci. 2020, 174, 109472. [Google Scholar] [CrossRef]
  42. Li, S.; Zhang, X. Research on orthopedic auxiliary classification and prediction model based on XGBoost algorithm. Neural Comput. Appl. 2020, 32, 1971–1979. [Google Scholar] [CrossRef]
  43. Srinivas, N.; Deb, K. Multiobjective Function Optimization Using Nondominated Sorting Genetic Algorithms. Evol. Comput. 1994, 2, 1301–1308. [Google Scholar] [CrossRef]
  44. Li, J.; Yang, X.; Ren, C.; Chen, G.; Wang, Y. Multiobjective optimization of cutting parameters in Ti-6Al-4V milling process using nondominated sorting genetic algorithm-II. Int. J. Adv. Manuf. Tech. 2015, 76, 941–953. [Google Scholar] [CrossRef]
  45. Panda, S.; Yegireddy, N.K. Automatic generation control of multi-area power system using multi-objective non-dominated sorting genetic algorithm-II. Int. J. Electr. Power Energy Syst. 2013, 53, 54–63. [Google Scholar] [CrossRef]
  46. Zhao, Z.; Xu, Y.; Zhao, Y. SXGBsite: Prediction of Protein–Ligand Binding Sites Using Sequence Information and Extreme Gradient Boosting. Genes 2019, 10, 965. [Google Scholar] [CrossRef] [Green Version]
  47. Dong, H.; He, D.; Wang, F. SMOTE-XGBoost using Tree Parzen Estimator optimization for copper flotation method classification. Powder Technol. 2020, 375, 174–181. [Google Scholar] [CrossRef]
  48. Thomason, M. The Practitioner Methods and Tool. J. Comput. Int. Financ. 1999, 7, 36–45. [Google Scholar]
  49. Caginalp, G.; Laurent, H. The predictive power of price patterns. Appl. Math. Financ. 1998, 5, 181–206. [Google Scholar] [CrossRef]
  50. Sharpe, W.F. The Sharpe Ratio. J. Portfolio Manag. 1994, 21, 49–58. [Google Scholar] [CrossRef]
  51. Derrac, J.; García, S.; Molina, D.; Herrera, F. A practical tutorial on the use of nonparametric statistical tests as a methodology for comparing evolutionary and swarm intelligence algorithms. Swarm Evol. Comput. 2011, 1, 3–18. [Google Scholar] [CrossRef]
  52. Guo, J.; Yang, L.; Bie, R.; Yu, J.; Gao, Y.; Shen, Y.; Kos, A. An XGBoost-based physical fitness evaluation model using advanced feature selection and Bayesian hyper-parameter optimization for wearable running monitoring. Comput. Netw. 2019, 151, 166–180. [Google Scholar] [CrossRef]
  53. Deng, S.; Wang, C.; Fu, Z.; Wang, M. An intelligent system for insider trading identification in chinese security market. Comput. Econ. 2021, 57, 593–616. [Google Scholar] [CrossRef]
  54. Douzas, G.; Bacao, F. Effective data generation for imbalanced learning using conditional generative adversarial networks. Expert Syst. Appl. 2018, 91, 464–471. [Google Scholar] [CrossRef]
  55. Bej, S.; Davtyan, N.; Wolfien, M.; Nassar, M.; Wolkenhauer, O. LoRAS: An oversampling approach for imbalanced datasets. Mach. Learn. 2021, 110, 279–301. [Google Scholar] [CrossRef]
  56. Douzas, G.; Bacao, F. Geometric SMOTE a geometrically enhanced drop-in replacement for SMOTE. Inf. Sci. 2019, 501, 118–135. [Google Scholar] [CrossRef]
Figure 1. The structure of the proposed approach XGBoost-SMOTE-NSGA-II.
Futureinternet 14 00180 g001
Figure 2. The slide window method for the dynamic arrangement of the training and testing periods.
Futureinternet 14 00180 g002
Figure 3. The multiclassification examples of the proposed method.
Futureinternet 14 00180 g003
Figure 4. Accumulated returns of the proposed method and benchmarks in the entire testing period.
Futureinternet 14 00180 g004
Figure 5. The relative importance of input features for the proposed method in four training periods.
Futureinternet 14 00180 g005
Figure 6. The LIME explanation results for the prediction cases 1–10. The sub-figures (ad) are the explanation results for labels 1/2/3/4.
Futureinternet 14 00180 g006
Table 1. The dataset design for the experiments.
DatasetsTraining DatasetTesting Dataset
PeriodSample SizePeriodSample Size
Dataset 12016/Jan.–2019/Dec.56802020/Jan.–2020/Mar.243
Dataset 22016/Apr.–2020/Mar.54792020/Apr.–2020/June288
Dataset 32016/July–2020/June53892020/July–2020/Sep.372
Dataset 42016/Oct.–2020/Sep.54062020/Oct.–2020/Dec.338
Table 2. The parameters of the trading rule. Note that N/A means no parameters need to be optimized since no simulation trading is executed.
Category(Label)Level ThresholdTrading SignalProfit-TakingLoss-CuttingLeverage
ThresholdSearch RangeThresholdSearch RangeValueSearch Range
Label = 1<T1Short P T 1 [0.02, 0.06] L T 1 [−0.06, −0.02] l 1 [3, 6]
Label = 2[T1, T2)Short P T 2 [0.02, 0.06] L T 2 [−0.06, −0.02] l 2 [3, 6]
Label = 3[T2, T3]No TradingN/AN/AN/AN/AN/AN/A
Label = 4(T3, T4]Long P T 3 [0.02, 0.06] L T 3 [−0.06, −0.02] l 3 [3, 6]
Label = 5>T4Long P T 4 [0.02, 0.06] L T 4 [−0.06, −0.02] l 4 [3, 6]
Table 3. A list of the proposed approach and benchmark approaches in the experiments.
NoMethodDescription
1XGBoost-SMOTE-NSGA-II
(Proposed method)
A multiclassification method based on an XGBoost classifier. SMOTE is employed for balancing the samples of datasets, while NSGA-II is integrated to optimize the parameters of the trading rule.
2XGBoost-SMOTEXGBoost is employed as a multiclass classifier, while SMOTE is adopted for solving the imbalanced dataset problem.
3XGBoostA classification method based on a binary (upward or downward) XGBoost classifier.
4RFA classification method based on a binary (upward or downward) random forest classifier.
5SVMA classification method based on a binary (upward or downward) SVM classifier.
6ANNA classification method based on a binary (upward or downward) ANN classifier.
7Buy and Hold (BAH)To execute a long transaction at the beginning, and close the position at the end of each testing period.
8Short and Hold (SAH)To execute a short-selling transaction at the beginning, and close the position at the end of each testing period.
Table 4. Calculation formula of the four evaluation metrics.
FormulaEvaluation MetricsCalculation Formula
1 Hit   Ratio   ( H R ) H R = P N + N N N
2 Accumulated   Return   ( A R ) A R = i = 1 n l c l i + t o p i + 1 o p i + 1 c o s t × sgn φ ,   sgn φ = 1 ,   φ [ , T 2 ) 0 ,   φ [ T 2 , T 3 ] 1 ,   φ ( T 3 , + ]
3 Maximum   Drawdown   ( M D D ) M D D = max 0 i n D i , D i = max 0 j i A R j + 1 A R i + 1 A R j + 1
4 Sharpe   Ratio   ( S R ) S R = E R a r f σ a
Table 5. Hit ratio results for rebar futures price direction forecasting.
Testing PeriodANNSVMRFXGBoostXGBoost-SMOTEXGBoost-SMOTE-NSGA-II
Period 144.03%44.86%51.44%51.03%61.04%61.04%
Period 246.53%47.57%50.69%52.08%51.03%51.03%
Period 351.34%48.92%42.20%45.16%50.00%50.00%
Period 450.30%47.34%51.48%47.63%53.85%53.85%
Average48.05%47.17%48.95%48.98%53.98%53.98%
Table 6. Accumulated return results for rebar futures simulation trading.
Testing PeriodBAHSAHANNSVMRFXGBoostXGBoost-SMOTEXGBoost-SMOTE-NSGA-II
Period 1−0.0870.085−0.241−0.489−0.315−0.091−0.1190.278
Period 20.075−0.077−0.290−0.069−0.3050.257−0.1620.237
Period 30.002−0.004−0.156−0.363−0.817−0.488−0.0230.462
Period 40.226−0.228−0.046−0.1480.0220.068−0.0070.418
Average0.054−0.056−0.183−0.267−0.354−0.064−0.0780.349
Sum0.216−0.224−0.733−1.069−1.415−0.254−0.3111.395
Table 7. Friedman test results on the accumulated return results for XGBoost-SMOTE-NSGA-II against the benchmark methods.
Compared ModelsSignificant Level α = 0.05
XGBoost-SMOTE-NSGA-II versus XGBoost-SMOTEH0: n1 = n2 = n3 = n4 = n5 = n6 = n7
XGBoost-SMOTE-NSGA-II versus XGBoostF = 17.17
XGBoost-SMOTE-NSGA-II versus RFp = 0.02 (reject H0)
XGBoost-SMOTE-NSGA-II versus SVM
XGBoost-SMOTE-NSGA-II versus ANN
XGBoost-SMOTE-NSGA-II versus SAH
XGBoost-SMOTE-NSGA-II versus BAH
Table 8. Maximum drawdown results of all methods for simulation trading.
Testing PeriodBAHSAHANNSVMRFXGBoostXGBoost-SMOTEXGBoost-SMOTE-NSGA-II
Period 10.1070.0850.3010.4890.4170.1570.1790.083
Period 20.0440.1470.3280.1990.3670.1210.2570.175
Period 30.0810.0830.3040.4310.8370.5230.0920.128
Period 40.0860.2860.2740.3510.2010.2240.2250.154
Average0.0800.1500.3020.3680.4560.2560.1880.135
Overall0.1340.3670.8381.2411.5750.5870.4910.146
Table 9. Sharpe ratio results of all methods for simulation trading.
BAHSAHANNSVM
Excess Return0.0479−0.0621−0.1894−0.2733
Standard Deviation0.11470.11470.09260.1672
Sharpe Ratio0.4176−0.5414−2.0454−1.6346
RFXGBoostXGBoost-SMOTEXGBoost-SMOTE-NSGA-II
−0.3599−0.0696−0.08390.3427
0.29990.27430.06480.0937
−1.2001−0.2537−1.29483.6574
Publisher’s Note: MDPI stays neutral with regard to jurisdictional claims in published maps and institutional affiliations.

