
Measuring Ethical Values with AI for Better Teamwork


Abstract
:1. Introduction
Foundational Research
2. Method
3. Results
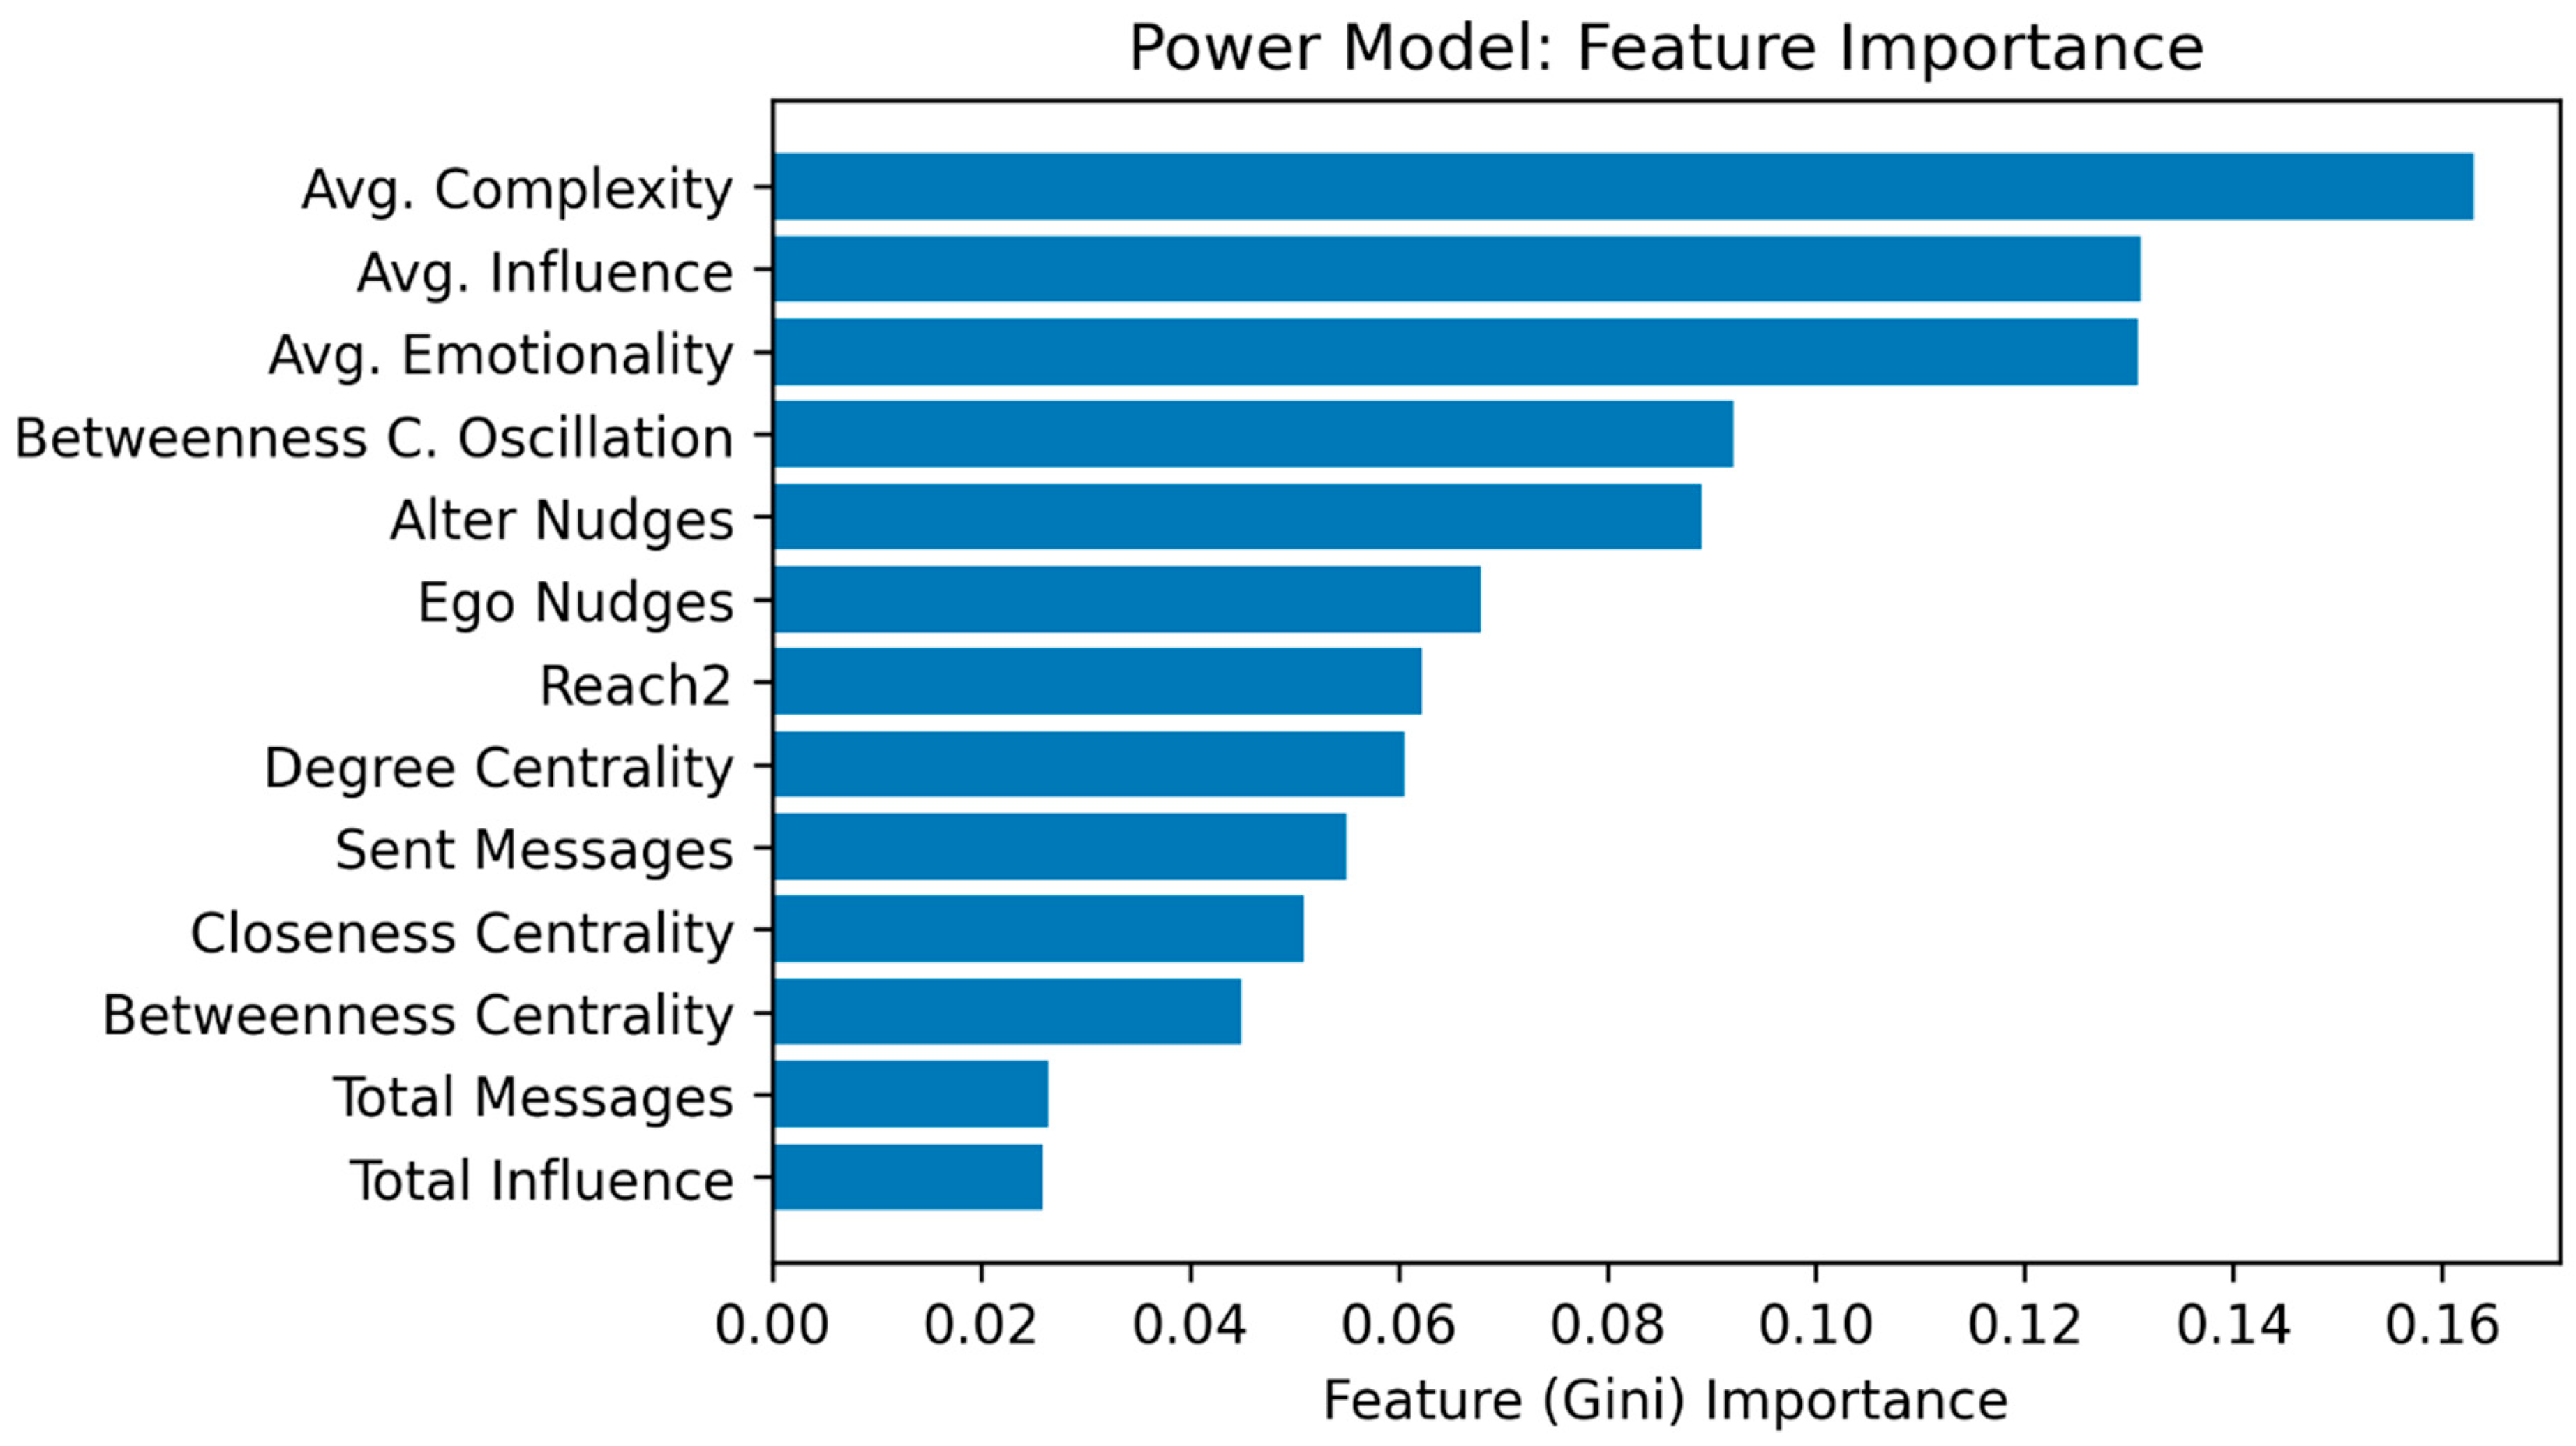
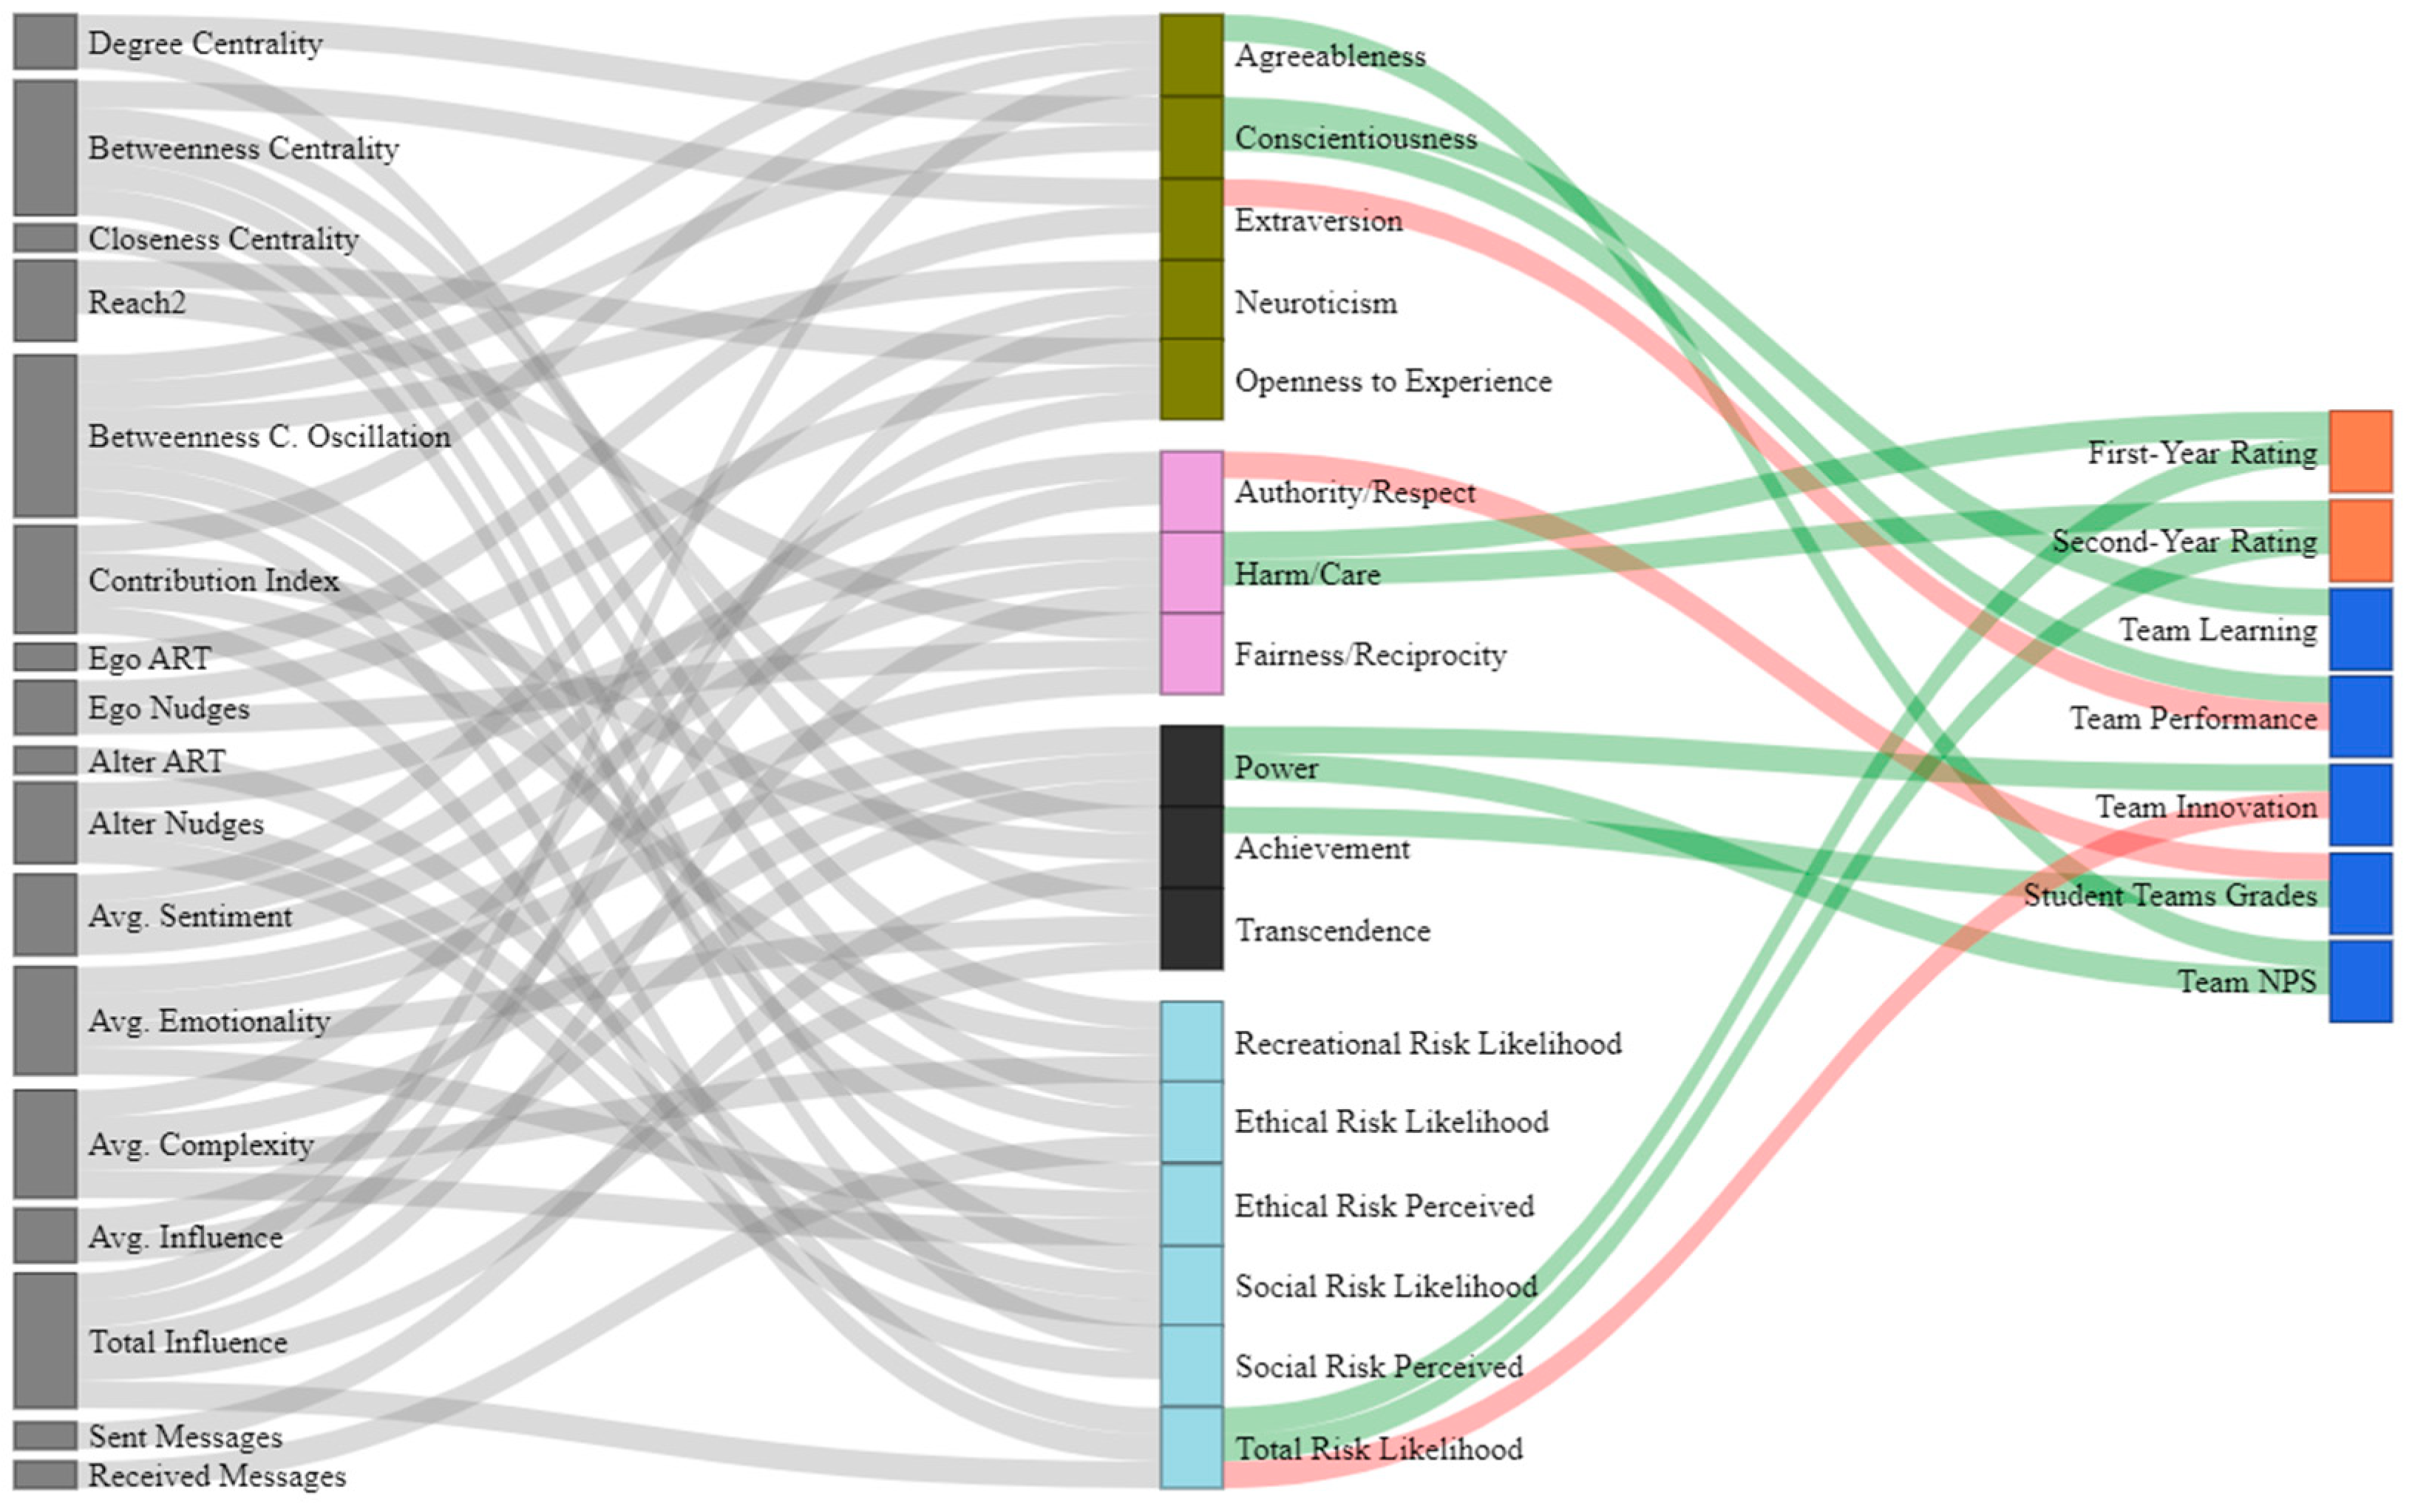
3.1. Predicting Personal and Moral Values
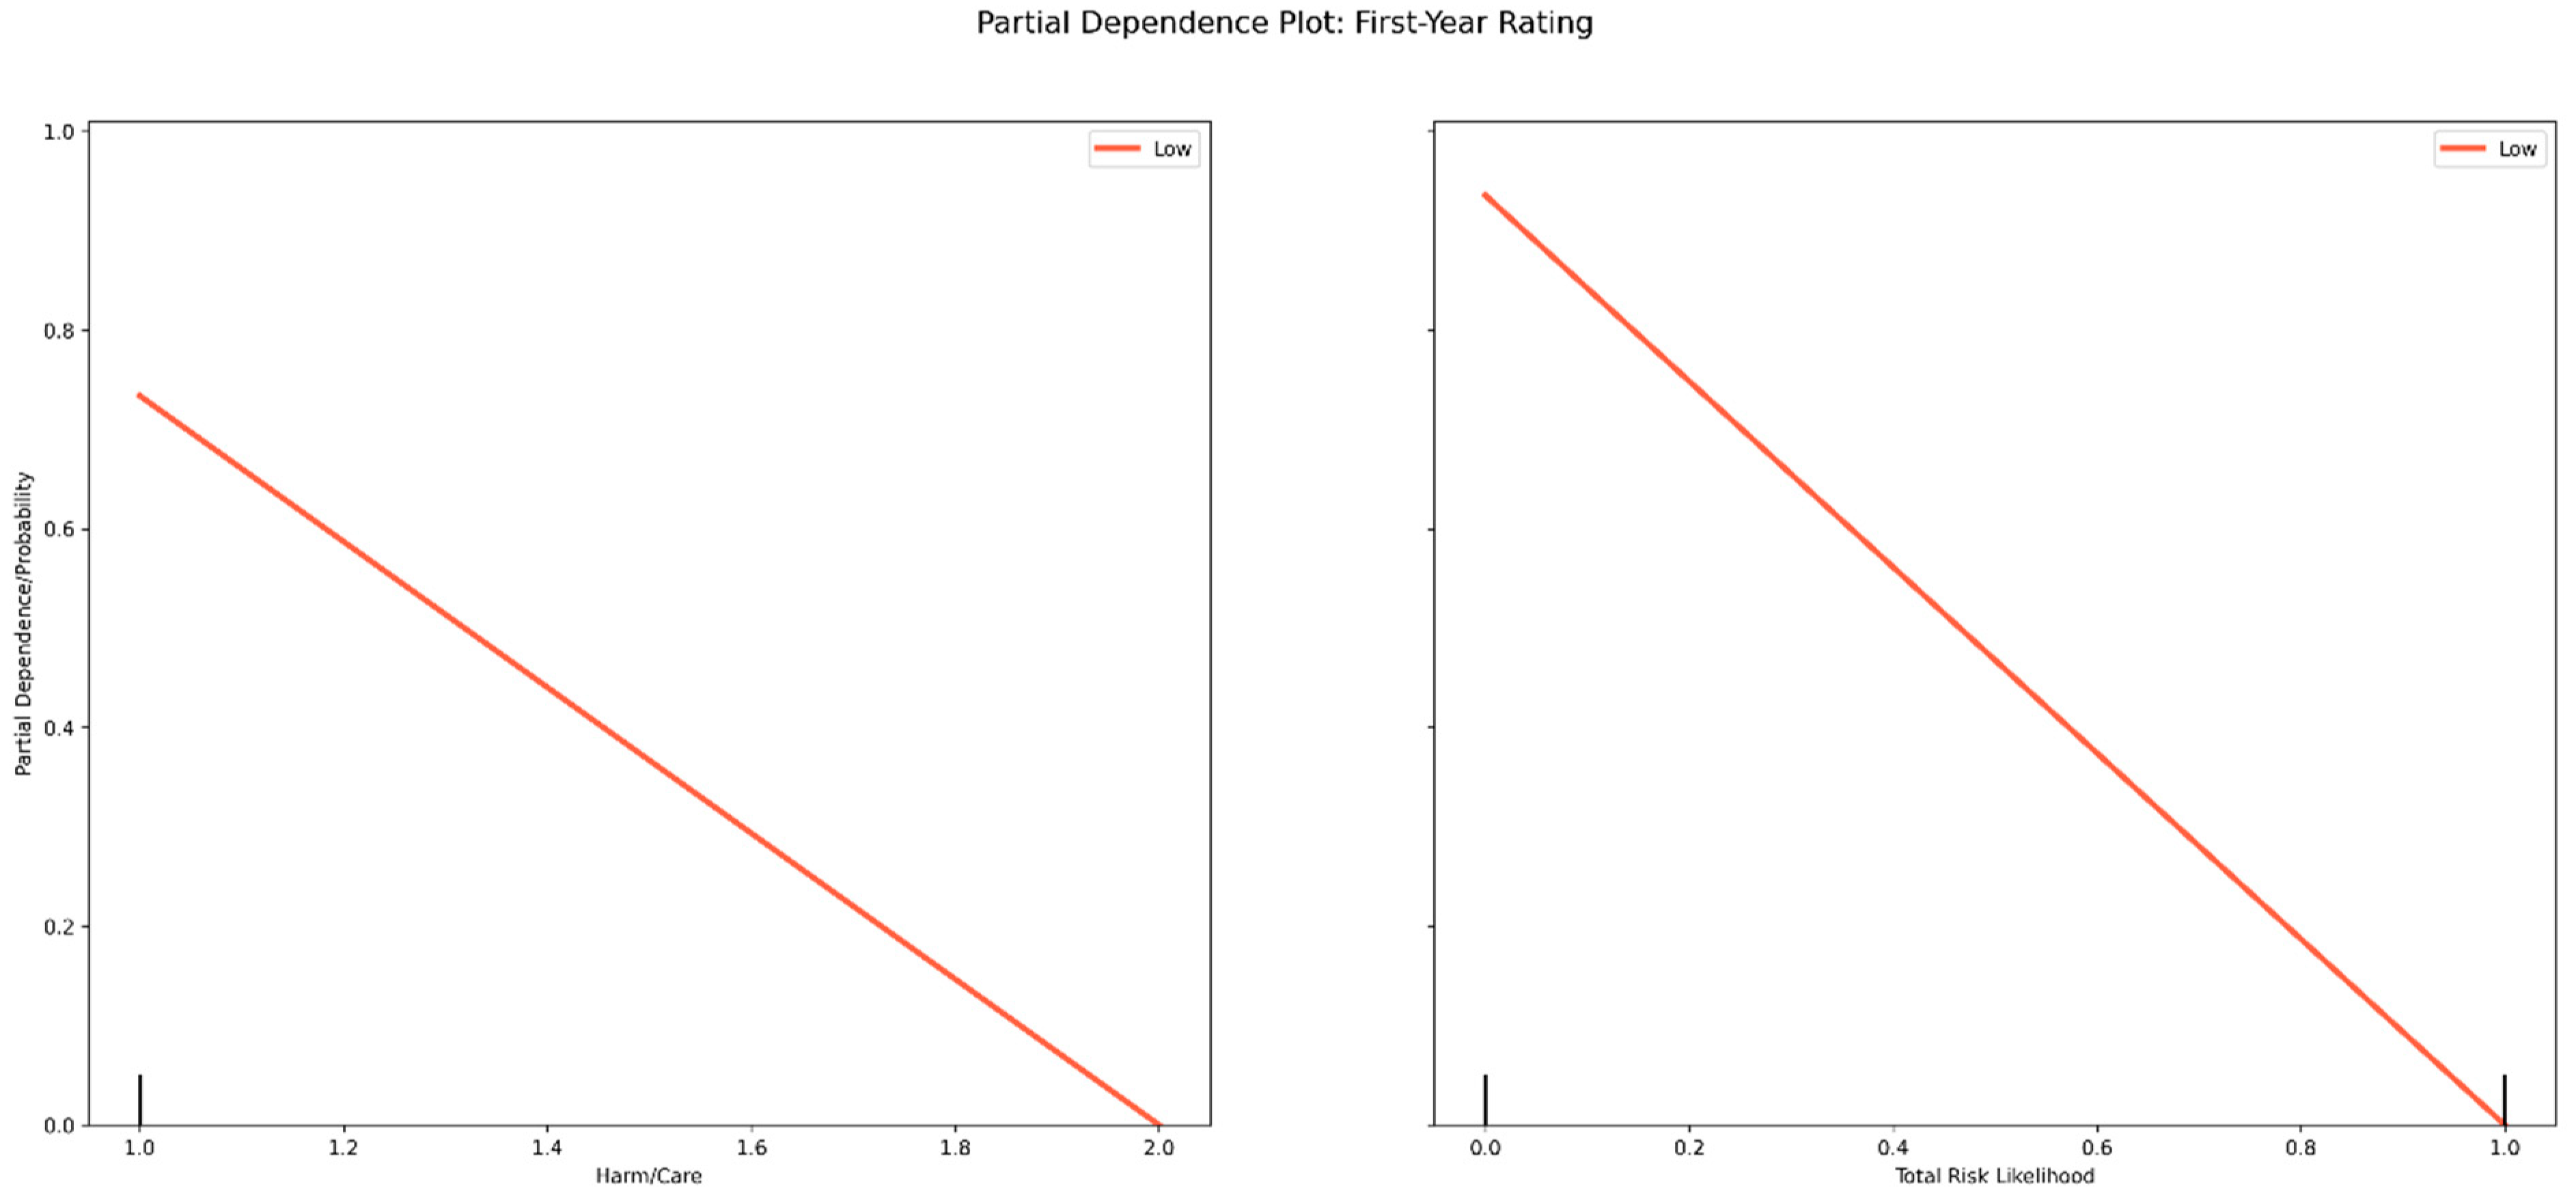
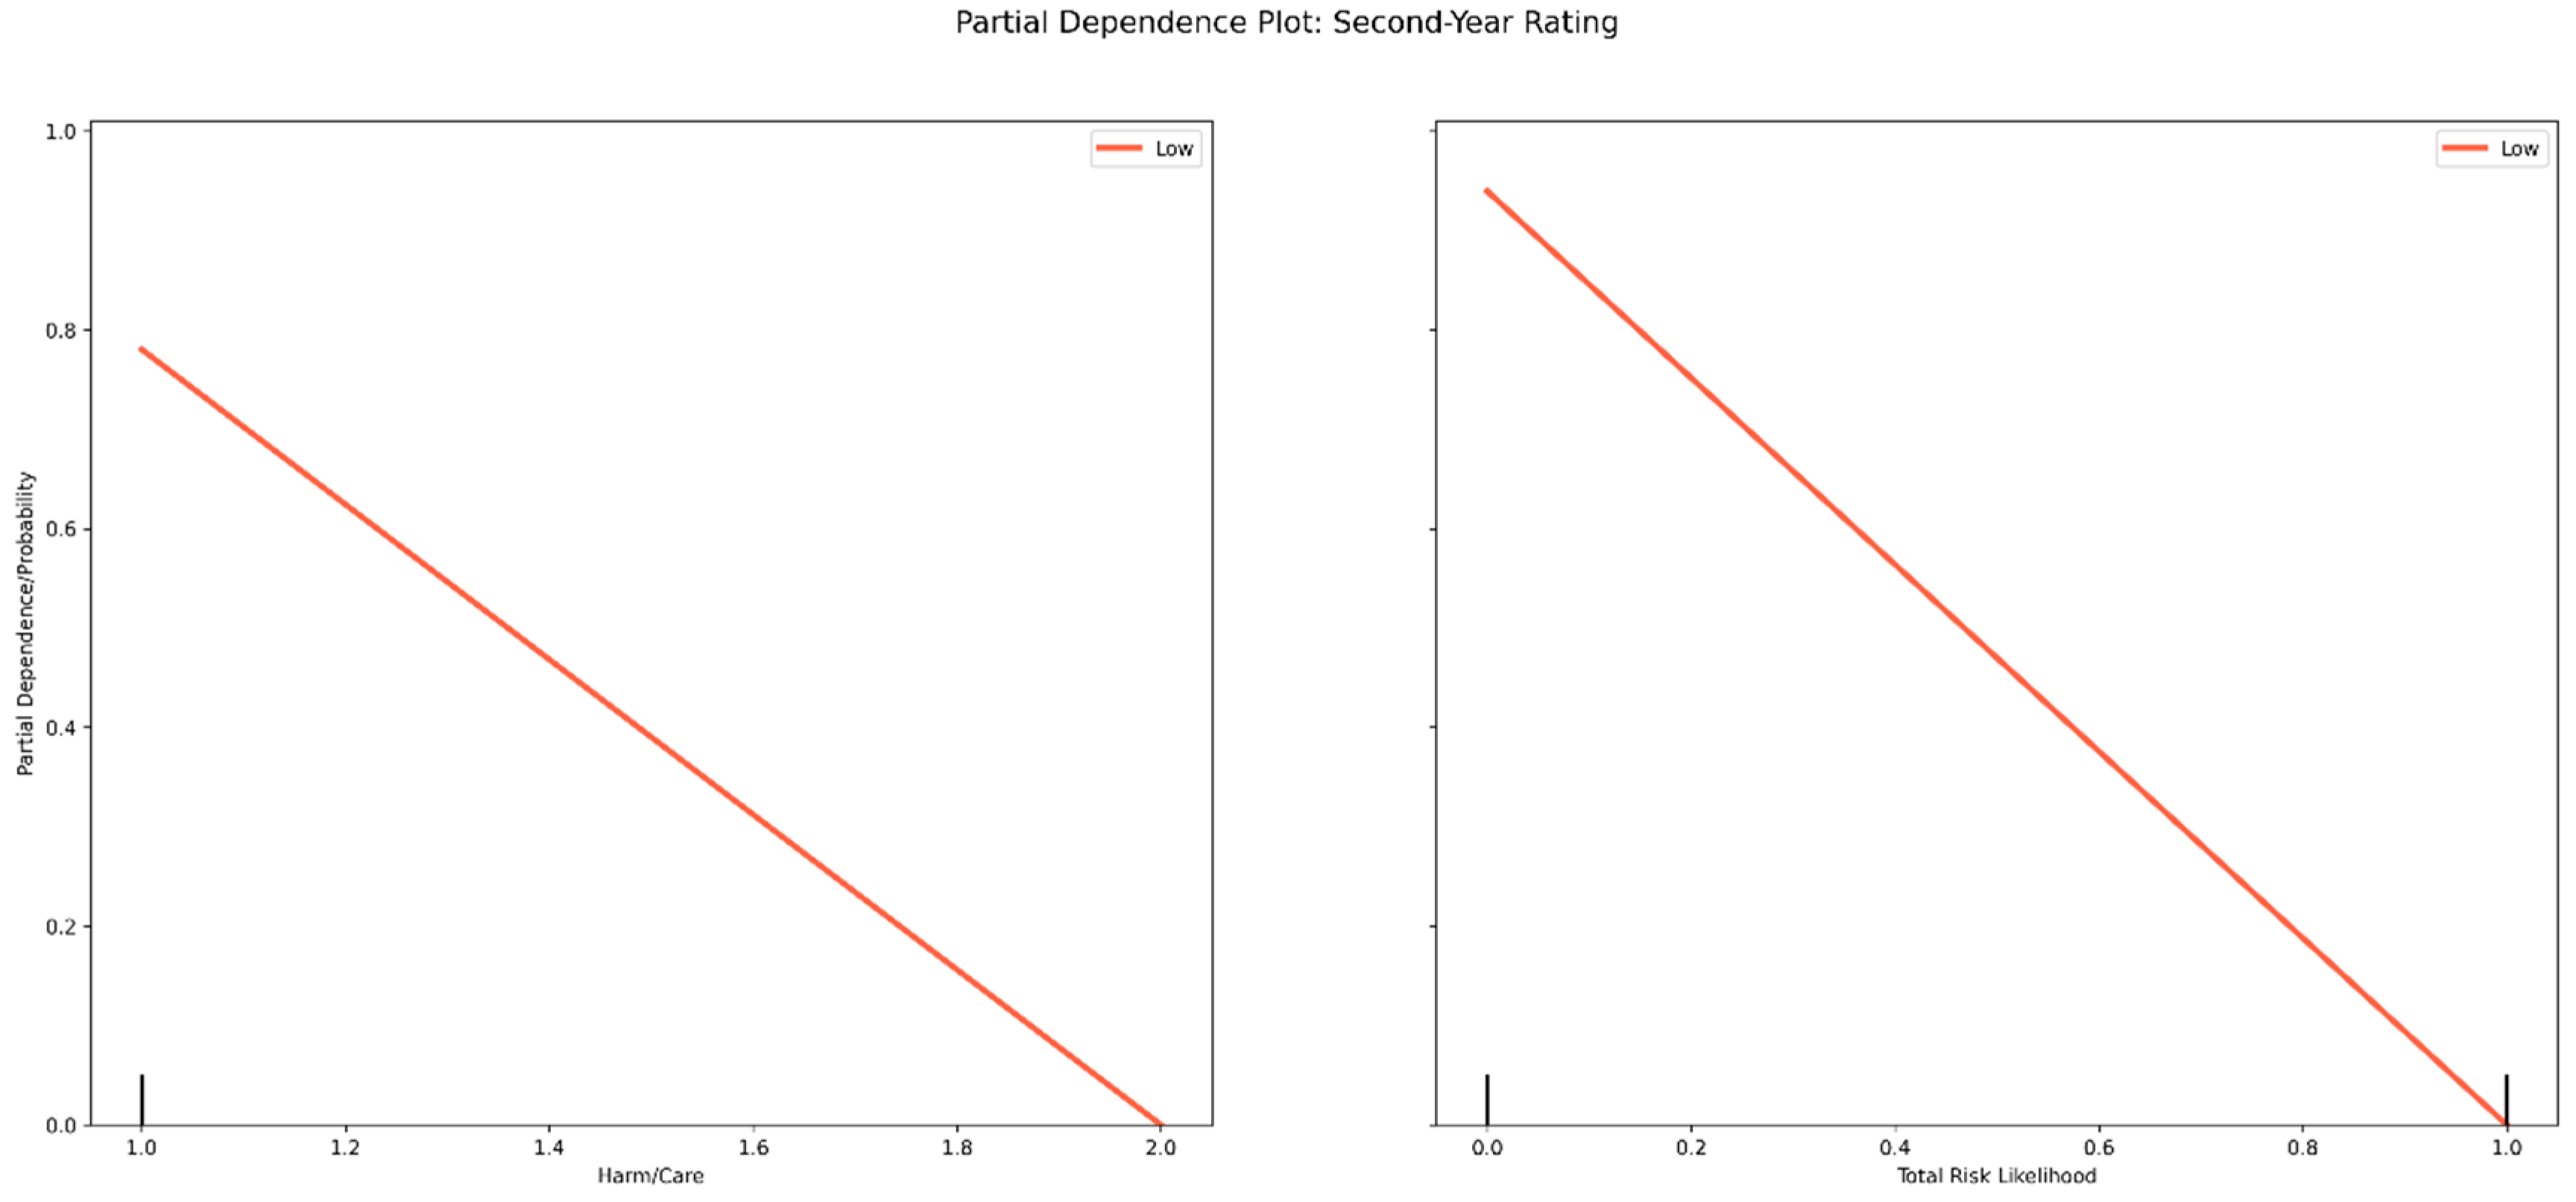
3.2. Predicting Job Performance
4. Discussion and Conclusions
4.1. Implications for Research and Practice
4.2. Limitations and Future Research
Author Contributions
Funding
Institutional Review Board Statement
Informed Consent Statement
Data Availability Statement
Acknowledgments
Conflicts of Interest
Appendix A

| Variables | Alter ART | Alter Nudges | Between-ness Centrality | Between-ness C. Oscillation | Closeness Centrality | Avg. Com-plexity | Contribu-tion Index | Contribu-tion Index Osc. | Degree Central-ity | Ego ART | Ego Nudges | Avg. Emotionality | Avg. Influence | Total Influence | Received Messages | Sent Messages | Total Messages | Reach 2 | Avg. Senti-ment | |
|---|---|---|---|---|---|---|---|---|---|---|---|---|---|---|---|---|---|---|---|---|
| Agreeableness | Pearson Correlation | 0.021 | −0.134 | −0.226 * | −0.362 *** | −0.286 ** | −0.147 | −0.196 | −0.228 * | −0.243 * | −0.045 | −0.048 | −0.165 | −0.262 * | −0.221 * | −0.059 | −0.316 ** | −0.177 | −0.091 | −0.169 |
| N | 81 | 81 | 81 | 81 | 81 | 81 | 81 | 81 | 81 | 81 | 81 | 81 | 81 | 81 | 81 | 81 | 81 | 81 | 81 | |
| Conscien−tiousness | Pearson Correlation | 0.209 | 0.183 | 0.221 * | 0.180 | 0.084 | 0.107 | −0.073 | 0.135 | 0.227 * | 0.091 | 0.156 | 0.180 | 0.076 | 0.180 | 0.200 | 0.128 | 0.194 | 0.134 | 0.038 |
| N | 81 | 81 | 81 | 81 | 81 | 81 | 81 | 81 | 81 | 81 | 81 | 81 | 81 | 81 | 81 | 81 | 81 | 81 | 81 | |
| Extraversion | Pearson Correlation | −0.076 | −0.050 | 0.147 | 0.105 | −0.059 | −0.045 | −0.020 | −0.030 | 0.090 | −0.162 | −0.085 | −0.018 | −0.050 | 0.006 | −0.047 | 0.026 | −0.015 | −0.106 | −0.068 |
| N | 81 | 81 | 81 | 81 | 81 | 81 | 81 | 81 | 81 | 81 | 81 | 81 | 81 | 81 | 81 | 81 | 81 | 81 | 81 | |
| Neuroticism | Pearson Correlation | −0.021 | −0.091 | −0.200 | −0.311 ** | −0.021 | −0.092 | −0.030 | 0.028 | −0.132 | −0.002 | −0.069 | −0.048 | −0.038 | −0.113 | 0.041 | −0.044 | −0.005 | −0.008 | −0.102 |
| N | 81 | 81 | 81 | 81 | 81 | 81 | 81 | 81 | 81 | 81 | 81 | 81 | 81 | 81 | 81 | 81 | 81 | 81 | 81 | |
| Openness to Experience | Pearson Correlation | 0.039 | −0.058 | 0.003 | 0.063 | −0.097 | −0.071 | −0.193 | −0.096 | 0.007 | 0.011 | −0.084 | −0.041 | −0.069 | 0.001 | −0.051 | −0.099 | −0.066 | −0.090 | −0.150 |
| N | 81 | 81 | 81 | 81 | 81 | 81 | 81 | 81 | 81 | 81 | 81 | 81 | 81 | 81 | 81 | 81 | 81 | 81 | 81 | |
| Authority/ Respect | Pearson Correlation | −0.077 | −0.271 * | −0.278 * | −0.323 * | −0.360 ** | −0.228 | −0.443 *** | −0.360 ** | −0.304 * | −0.028 | −0.197 | −0.319 * | −0.310 * | −0.272 * | −0.207 | −0.365 ** | −0.287 * | −0.234 | −0.421 ** |
| N | 55 | 55 | 55 | 55 | 55 | 55 | 55 | 55 | 55 | 55 | 55 | 55 | 55 | 55 | 55 | 55 | 55 | 55 | 55 | |
| Fairness/ Reciprocity | Pearson Correlation | 0.201 | 0.258 | 0.139 | 0.185 | 0.072 | 0.333 * | −0.104 | 0.234 | 0.156 | 0.124 | 0.330 * | 0.305 * | 0.265 | 0.231 | 0.218 | 0.100 | 0.177 | 0.374 ** | 0.110 |
| N | 55 | 55 | 55 | 55 | 55 | 55 | 55 | 55 | 55 | 55 | 55 | 55 | 55 | 55 | 55 | 55 | 55 | 55 | 55 | |
| Harm/Care | Pearson Correlation | 0.335 * | 0.524 *** | 0.393 ** | 0.459 *** | 0.468 *** | 0.533 *** | 0.104 | 0.410 ** | 0.383 ** | 0.252 | 0.483 *** | 0.472 *** | 0.434 *** | 0.392** | 0.322 * | 0.380 ** | 0.366 ** | 0.55 *** | 0.332 * |
| N | 55 | 55 | 55 | 55 | 55 | 55 | 55 | 55 | 55 | 55 | 55 | 55 | 55 | 55 | 55 | 55 | 55 | 55 | 55 | |
| Ingroup/ Loyalty | Pearson Correlation | 0.36 ** | 0.430 ** | 0.305 * | 0.212 | 0.465 *** | 0.399 ** | −0.077 | 0.186 | 0.294 * | 0.186 | 0.371 ** | 0.479 *** | 0.353 ** | 0.169 | 0.127 | 0.228 | 0.188 | 0.420 ** | 0.337 * |
| N | 55 | 55 | 55 | 55 | 55 | 55 | 55 | 55 | 55 | 55 | 55 | 55 | 55 | 55 | 55 | 55 | 55 | 55 | 55 | |
| Purity/ Sanctity | Pearson Correlation | 0.205 | 0.121 | 0.103 | 0.064 | 0.043 | 0.191 | −0.137 | 0.174 | 0.102 | 0.073 | 0.149 | 0.089 | 0.086 | 0.122 | 0.126 | 0.101 | 0.118 | 0.156 | −0.002 |
| N | 55 | 55 | 55 | 55 | 55 | 55 | 55 | 55 | 55 | 55 | 55 | 55 | 55 | 55 | 55 | 55 | 55 | 55 | 55 | |
| Power | Pearson Correlation | −0.173 | −0.319 * | −0.379 ** | −0.461 *** | −0.377 ** | −0.419 *** | −0.022 | −0.231 | −0.278 * | −0.174 | −0.268 * | −0.389 ** | −0.444 *** | −0.345 ** | −0.237 | −0.310 * | −0.291 * | −0.341 ** | −0.242 |
| N | 61 | 61 | 61 | 61 | 61 | 61 | 61 | 61 | 61 | 61 | 61 | 61 | 61 | 61 | 61 | 61 | 61 | 61 | 61 | |
| Achieve−ment | Pearson Correlation | −0.037 | −0.090 | −0.258 * | −0.315 * | −0.245 | −0.128 | −0.331 ** | −0.088 | −0.186 | 0.054 | 0.032 | −0.138 | −0.121 | −0.152 | −0.055 | −0.268 * | −0.153 | −0.078 | −0.200 |
| N | 61 | 61 | 61 | 61 | 61 | 61 | 61 | 61 | 61 | 61 | 61 | 61 | 61 | 61 | 61 | 61 | 61 | 61 | 61 | |
| Hedonism | Pearson Correlation | −0.029 | 0.036 | 0.051 | −0.214 | 0.108 | −0.026 | 0.139 | 0.047 | 0.048 | 0.087 | 0.051 | 0.018 | −0.041 | −0.037 | 0.087 | 0.078 | 0.081 | 0.036 | 0.09 |
| N | 61 | 61 | 61 | 61 | 61 | 61 | 61 | 61 | 61 | 61 | 61 | 61 | 61 | 61 | 61 | 61 | 61 | 61 | 61 | |
| Stimulation | Pearson Correlation | −0.035 | −0.033 | 0.053 | 0.028 | 0.088 | −0.055 | 0.082 | 0.143 | 0.076 | 0.156 | 0.007 | 0.052 | −0.014 | 0.029 | 0.053 | 0.043 | 0.053 | 0.005 | −0.016 |
| N | 61 | 61 | 61 | 61 | 61 | 61 | 61 | 61 | 61 | 61 | 61 | 61 | 61 | 61 | 61 | 61 | 61 | 61 | 61 | |
| Self−Direction | Pearson Correlation | 0.097 | 0.134 | 0.098 | 0.125 | 0.122 | 0.053 | 0.156 | 0.200 | 0.190 | 0.116 | 0.141 | 0.178 | 0.032 | 0.106 | 0.153 | 0.14 | 0.158 | 0.119 | 0.114 |
| N | 61 | 61 | 61 | 61 | 61 | 61 | 61 | 61 | 61 | 61 | 61 | 61 | 61 | 61 | 61 | 61 | 61 | 61 | 61 | |
| Universalism | Pearson Correlation | −0.099 | 0.111 | 0.106 | 0.276 * | 0.031 | 0.054 | 0.033 | 0.194 | 0.277 * | 0.120 | 0.061 | 0.110 | 0.119 | 0.211 | 0.115 | 0.145 | 0.144 | 0.051 | 0.152 |
| N | 61 | 61 | 61 | 61 | 61 | 61 | 61 | 61 | 61 | 61 | 61 | 61 | 61 | 61 | 61 | 61 | 61 | 61 | 61 | |
| Benevolence | Pearson Correlation | 0.222 | 0.202 | 0.251 | 0.320 * | 0.123 | 0.155 | −0.021 | 0.223 | 0.310 * | 0.136 | 0.175 | 0.249 | 0.141 | 0.240 | 0.173 | 0.204 | 0.205 | 0.141 | 0.116 |
| N | 61 | 61 | 61 | 61 | 61 | 61 | 61 | 61 | 61 | 61 | 61 | 61 | 61 | 61 | 61 | 61 | 61 | 61 | 61 | |
| Tradition | Pearson Correlation | −0.059 | −0.084 | −0.145 | −0.154 | −0.155 | −0.138 | −0.137 | −0.123 | −0.081 | 0.040 | −0.021 | −0.108 | −0.220 | −0.220 | −0.054 | −0.163 | −0.109 | −0.084 | −0.256 * |
| N | 61 | 61 | 61 | 61 | 61 | 61 | 61 | 61 | 61 | 61 | 61 | 61 | 61 | 61 | 61 | 61 | 61 | 61 | 61 | |
| Conformity | Pearson Correlation | −0.047 | −0.030 | −0.248 | −0.053 | −0.261 * | −0.083 | −0.312 * | −0.039 | −0.131 | 0.201 | 0.105 | −0.078 | −0.037 | −0.102 | −0.018 | −0.214 | −0.109 | −0.011 | −0.235 |
| N | 61 | 61 | 61 | 61 | 61 | 61 | 61 | 61 | 61 | 61 | 61 | 61 | 61 | 61 | 61 | 61 | 61 | 61 | 61 | |
| Security | Pearson Correlation | 0.109 | 0.262 * | 0.044 | 0.189 | 0.126 | 0.180 | −0.100 | 0.180 | 0.187 | 0.242 | 0.316 * | 0.263 * | 0.154 | 0.113 | 0.160 | 0.106 | 0.147 | 0.211 | 0.026 |
| N | 61 | 61 | 61 | 61 | 61 | 61 | 61 | 61 | 61 | 61 | 61 | 61 | 61 | 61 | 61 | 61 | 61 | 61 | 61 | |
| Tran-scen-dence | Pearson Correlation | 0.120 | 0.293 * | 0.292 * | 0.488 *** | 0.267 * | 0.281 * | 0.031 | 0.213 | 0.329 ** | 0.112 | 0.180 | 0.281 * | 0.301 * | 0.318 * | 0.181 | 0.279 * | 0.247 | 0.221 | 0.166 |
| N | 61 | 61 | 61 | 61 | 61 | 61 | 61 | 61 | 61 | 61 | 61 | 61 | 61 | 61 | 61 | 61 | 61 | 61 | 61 | |
| Conserva−tion | Pearson Correlation | −0.191 | −0.204 | −0.226 | −0.263 * | −0.309 * | −0.245 | −0.336 ** | −0.206 | −0.236 | −0.010 | −0.069 | −0.217 | −0.188 | −0.277 * | −0.150 | −0.293 * | −0.226 | −0.202 | −0.297 * |
| N | 61 | 61 | 61 | 61 | 61 | 61 | 61 | 61 | 61 | 61 | 61 | 61 | 61 | 61 | 61 | 61 | 61 | 61 | 61 | |
| Ethical Risk Likelihood | Pearson Correlation | −0.122 | −0.028 | −0.257 | −0.228 | 0.025 | −0.070 | 0.020 | −0.189 | −0.190 | 0.056 | −0.071 | 0.060 | −0.039 | −0.271 | −0.292 * | −0.200 | −0.273 | 0.003 | 0.020 |
| N | 49 | 49 | 49 | 49 | 49 | 49 | 49 | 49 | 49 | 49 | 49 | 49 | 49 | 49 | 49 | 49 | 49 | 49 | 49 | |
| Ethical Risk Perceived | Pearson Correlation | −0.156 | −0.296 * | −0.379 ** | −0.437 ** | −0.310 * | −0.298 * | 0.046 | −0.274 | −0.385 ** | −0.296 * | −0.326* | −0.363* | −0.248 | −0.264 | −0.122 | −0.236 | −0.195 | −0.250 | −0.190 |
| N | 49 | 49 | 49 | 49 | 49 | 49 | 49 | 49 | 49 | 49 | 49 | 49 | 49 | 49 | 49 | 49 | 49 | 49 | 49 | |
| Financial Risk Likelihood | Pearson Correlation | −0.137 | −0.143 | −0.403 ** | −0.377 ** | −0.351 * | −0.140 | −0.369 ** | −0.282 * | −0.316 * | −0.178 | −0.164 | −0.076 | −0.193 | −0.387 ** | −0.231 | 0.470 *** | −0.354 * | −0.088 | −0.298 * |
| N | 49 | 49 | 49 | 49 | 49 | 49 | 49 | 49 | 49 | 49 | 49 | 49 | 49 | 49 | 49 | 49 | 49 | 49 | 49 | |
| Financial Risk Perceived | Pearson Correlation | 0.41 ** | 0.442 ** | 0.314 * | 0.297 * | 0.362* | 0.444 ** | 0.070 | 0.168 | 0.363* | −0.046 | 0.244 | 0.418 ** | 0.163 | 0.243 | 0.235 | 0.293 * | 0.282 * | 0.378 ** | 0.360 * |
| N | 49 | 49 | 49 | 49 | 49 | 49 | 49 | 49 | 49 | 49 | 49 | 49 | 49 | 49 | 49 | 49 | 49 | 49 | 49 | |
| Health Risk Likelihood | Pearson Correlation | −0.136 | −0.219 | 0.009 | −0.129 | −0.108 | −0.191 | −0.079 | −0.114 | −0.067 | −0.194 | −0.263 | −0.089 | −0.110 | −0.109 | −0.173 | −0.086 | −0.144 | −0.202 | −0.045 |
| N | 49 | 49 | 49 | 49 | 49 | 49 | 49 | 49 | 49 | 49 | 49 | 49 | 49 | 49 | 49 | 49 | 49 | 49 | 49 | |
| Health Risk Perceived | Pearson Correlation | 0.254 | 0.237 | 0.089 | 0.321* | 0.077 | 0.255 | −0.044 | −0.015 | 0.146 | 0.148 | 0.249 | 0.033 | 0.117 | 0.125 | 0.103 | 0.089 | 0.103 | 0.170 | −0.013 |
| N | 49 | 49 | 49 | 49 | 49 | 49 | 49 | 49 | 49 | 49 | 49 | 49 | 49 | 49 | 49 | 49 | 49 | 49 | 49 | |
| Recreational Risk Likelihood | Pearson Correlation | −0.142 | −0.188 | −0.371 ** | −0.308 * | −0.435 ** | −0.236 | −0.461 *** | −0.185 | −0.354 * | −0.090 | −0.085 | −0.121 | −0.013 | −0.210 | −0.107 | −0.408 ** | −0.251 | −0.134 | −0.255 |
| N | 49 | 49 | 49 | 49 | 49 | 49 | 49 | 49 | 49 | 49 | 49 | 49 | 49 | 49 | 49 | 49 | 49 | 49 | 49 | |
| Recreational Risk Perceived | Pearson Correlation | 0.294 * | 0.162 | 0.338 * | 0.164 | 0.367 ** | 0.225 | 0.411 ** | 0.048 | 0.289 * | −0.109 | 0.006 | 0.087 | −0.085 | 0.075 | 0.082 | 0.290 * | 0.182 | 0.065 | 0.210 |
| N | 49 | 49 | 49 | 49 | 49 | 49 | 49 | 49 | 49 | 49 | 49 | 49 | 49 | 49 | 49 | 49 | 49 | 49 | 49 | |
| Social Risk Likelihood | Pearson Correlation | 0.352 * | 0.311 * | 0.430 ** | 0.345 * | 0.349 * | 0.341 * | 0.008 | 0.301 * | 0.407 ** | 0.082 | 0.285 * | 0.367 ** | 0.290 * | 0.203 | 0.354 * | 0.254 | 0.350 * | 0.341 * | 0.304 * |
| N | 49 | 49 | 49 | 49 | 49 | 49 | 49 | 49 | 49 | 49 | 49 | 49 | 49 | 49 | 49 | 49 | 49 | 49 | 49 | |
| Social Risk Perceived | Pearson Correlation | 0.211 | 0.201 | 0.115 | 0.133 | 0.225 | 0.178 | −0.015 | −0.057 | 0.080 | −0.073 | −0.019 | 0.216 | 0.156 | −0.036 | −0.105 | −0.005 | −0.055 | 0.127 | 0.096 |
| N | 49 | 49 | 49 | 49 | 49 | 49 | 49 | 49 | 49 | 49 | 49 | 49 | 49 | 49 | 49 | 49 | 49 | 49 | 49 | |
| Total Risk Likelihood | Pearson Correlation | −0.009 | 0.013 | −0.185 | −0.210 | −0.031 | 0.008 | −0.197 | −0.104 | −0.143 | −0.034 | −0.012 | 0.130 | 0.124 | −0.251 | −0.140 | −0.267 | −0.200 | 0.102 | −0.001 |
| N | 49 | 49 | 49 | 49 | 49 | 49 | 49 | 49 | 49 | 49 | 49 | 49 | 49 | 49 | 49 | 49 | 49 | 49 | 49 | |
| Total Risk Perceived | Pearson Correlation | 0.288 * | 0.200 | 0.112 | 0.203 | 0.135 | 0.209 | −0.003 | 0.041 | 0.110 | 0.015 | 0.156 | 0.139 | 0.089 | 0.131 | 0.206 | 0.132 | 0.191 | 0.191 | 0.111 |
| N | 49 | 49 | 49 | 49 | 49 | 49 | 49 | 49 | 49 | 49 | 49 | 49 | 49 | 49 | 49 | 49 | 49 | 49 | 49 |
Appendix B
| Variables | Team Performance | Team Innovation | Team Learning | Student Grades | Team NPS | First-Year Rating | Second-Year Rating | |||||||
|---|---|---|---|---|---|---|---|---|---|---|---|---|---|---|
| Pearson Correlation | N | Pearson Correlation | N | Pearson Correlation | N | Pearson Correlation | N | Pearson Correlation | N | Pearson Correlation | N | Pearson Correlation | N | |
| Alter ART | −0.178 | 70 | 0.322 ** | 70 | −0.148 | 70 | −0.008 | 80 | −0.147 | 78 | 0.086 | 82 | −0.106 | 82 |
| Alter Nudges | 0.150 | 70 | −0.161 | 70 | 0.104 | 70 | −0.146 | 80 | −0.304 ** | 78 | 0.163 | 82 | 0.006 | 82 |
| Betweenness Centrality | 0.223 | 70 | −0.120 | 70 | 0.254 * | 70 | −0.176 | 80 | −0.010 | 78 | 0.024 | 82 | −0.135 | 82 |
| Betweenness C. Oscillation | 0.102 | 70 | −0.095 | 70 | 0.133 | 70 | −0.072 | 80 | −0.126 | 78 | 0.054 | 82 | 0.035 | 82 |
| Closeness Centrality | 0.097 | 70 | −0.251 * | 70 | 0.137 | 70 | −0.009 | 80 | −0.185 | 78 | 0.027 | 82 | −0.030 | 82 |
| Avg. Complexity | −0.289 * | 70 | 0.086 | 70 | −0.366 ** | 70 | 0.035 | 80 | 0.066 | 78 | 0.066 | 82 | 0.078 | 82 |
| Contribution Index | 0.108 | 70 | 0.040 | 70 | 0.200 | 70 | 0.056 | 80 | 0.057 | 78 | −0.056 | 82 | −0.050 | 82 |
| Contribution Index Oscillation | 0.096 | 70 | −0.111 | 70 | 0.112 | 70 | 0.017 | 80 | −0.190 | 78 | 0.045 | 82 | −0.060 | 82 |
| Degree Centrality | 0.131 | 70 | −0.190 | 70 | 0.192 | 70 | −0.131 | 80 | −0.103 | 78 | 0.013 | 82 | −0.125 | 82 |
| Ego ART | −0.150 | 70 | 0.179 | 70 | −0.065 | 70 | −0.140 | 80 | −0.176 | 78 | 0.140 | 82 | −0.182 | 82 |
| Ego Nudges | −0.020 | 70 | 0.071 | 70 | −0.106 | 70 | −0.065 | 80 | 0.040 | 78 | −0.103 | 82 | 0.018 | 82 |
| Avg. Emotionality | 0.163 | 70 | 0.011 | 70 | 0.281 * | 70 | 0.248 * | 80 | 0.213 | 78 | 0.099 | 82 | −0.145 | 82 |
| Avg. Influence | 0.024 | 70 | −0.176 | 70 | −0.057 | 70 | −0.063 | 80 | 0.077 | 78 | 0.031 | 82 | −0.039 | 82 |
| Total Influence | 0.098 | 70 | −0.143 | 70 | 0.112 | 70 | −0.121 | 80 | −0.270 * | 78 | −0.035 | 82 | −0.124 | 82 |
| Received Messages | 0.174 | 70 | −0.096 | 70 | 0.201 | 70 | −0.096 | 80 | −0.224 * | 78 | −0.053 | 82 | 0.051 | 82 |
| Sent Messages | 0.232 | 70 | −0.051 | 70 | 0.248 * | 70 | −0.091 | 80 | −0.278 * | 78 | −0.047 | 82 | 0.023 | 82 |
| Total Messages | 0.195 | 70 | −0.084 | 70 | 0.219 | 70 | −0.112 | 80 | −0.241 * | 78 | −0.053 | 82 | 0.045 | 82 |
| Reach2 | 0.027 | 70 | −0.178 | 70 | −0.016 | 70 | −0.363 *** | 80 | 0.074 | 78 | −0.058 | 82 | −0.059 | 82 |
| Avg. Sentiment | 0.086 | 70 | −0.107 | 70 | 0.108 | 70 | −0.143 | 80 | 0.129 | 78 | −0.025 | 82 | −0.053 | 82 |
| Agreeableness | −0.093 | 70 | −0.249 * | 70 | −0.147 | 70 | −0.035 | 80 | 0.105 | 78 | 0.017 | 82 | −0.071 | 82 |
| Neuroticism | − | 70 | − | 70 | − | 70 | 0.058 | 80 | −0.186 | 78 | −0.051 | 82 | −0.020 | 82 |
| Extraversion | −0.178 | 70 | −0.034 | 70 | −0.229 | 70 | 0.010 | 80 | 0.030 | 78 | 0.100 | 82 | 0.253 * | 82 |
| Openness to Experience | − | 70 | − | 70 | − | 70 | 0.067 | 80 | − | 78 | − | 82 | − | 82 |
| Conscientiousness | 0.074 | 70 | 0.002 | 70 | 0.057 | 70 | −0.129 | 80 | 0.119 | 78 | −0.035 | 82 | 0.117 | 82 |
| Authority/Respect | −0.045 | 70 | −0.128 | 70 | 0.053 | 70 | 0.188 | 80 | −0.025 | 78 | 0.123 | 82 | 0.042 | 82 |
| Fairness/Reciprocity | − | 70 | − | 70 | − | 70 | 0.068 | 80 | − | 78 | − | 82 | − | 82 |
| Harm/Care | 0.034 | 70 | 0.051 | 70 | −0.048 | 70 | 0.016 | 80 | 0.083 | 78 | −0.187 | 82 | −0.162 | 82 |
| Power | 0.098 | 70 | 0.179 | 70 | 0.098 | 70 | 0.061 | 80 | 0.266 * | 78 | −0.041 | 82 | −0.068 | 82 |
| Achievement | − | 70 | − | 70 | − | 70 | −0.220 * | 80 | − | 78 | − | 82 | − | 82 |
| Transcendence | −0.008 | 70 | −0.003 | 70 | −0.031 | 70 | 0.046 | 80 | 0.152 | 78 | 0.190 | 82 | 0.035 | 82 |
| Ethical Risk Likelihood | − | 70 | − | 70 | − | 70 | 0.007 | 80 | − | 78 | − | 82 | − | 82 |
| Ethical Risk Perceived | 0.032 | 70 | −0.242 * | 70 | 0.062 | 70 | − | 80 | −0.099 | 78 | 0.094 | 82 | −0.078 | 82 |
| Recreational Risk Likelihood | 0.018 | 70 | −0.101 | 70 | −0.013 | 70 | −0.122 | 80 | − | 78 | 0.094 | 82 | −0.078 | 82 |
| Social Risk Likelihood | −0.142 | 70 | 0.190 | 70 | −0.192 | 70 | 0.131 | 80 | −0.084 | 78 | 0.041 | 82 | −0.096 | 82 |
| Social Risk Perceived | 0.040 | 70 | −0.143 | 70 | 0.068 | 70 | 0.089 | 80 | − | 78 | − | 82 | − | 82 |
| Total Risk Likelihood | −0.103 | 70 | −0.116 | 70 | −0.032 | 70 | 0.041 | 80 | −0.145 | 78 | −0.178 | 82 | −0.224 * | 82 |
| Team Avg. Alter ART | −0.375 ** | 70 | 0.679 *** | 70 | −0.312 ** | 70 | −0.013 | 80 | −0.341 ** | 78 | ||||
| Team Avg. Alter Nudges | 0.380 ** | 70 | −0.410 *** | 70 | 0.264 * | 70 | −0.293 ** | 80 | −0.435 *** | 78 | ||||
| Team Avg. Betweenness Centrality | 0.505 *** | 70 | −0.271 * | 70 | 0.573 *** | 70 | −0.383 *** | 80 | −0.028 | 78 | ||||
| Team Avg. Betweenness C. Oscillation | 0.229 | 70 | −0.214 | 70 | 0.299 * | 70 | −0.096 | 80 | −0.160 | 78 | ||||
| Team Avg. Closeness Centrality | 0.200 | 70 | −0.517 *** | 70 | 0.282 * | 70 | −0.013 | 80 | −0.242 * | 78 | ||||
| Team Avg. Avg. Complexity | −0.565 *** | 70 | 0.169 | 70 | −0.715 *** | 70 | 0.061 | 80 | 0.081 | 78 | ||||
| Team Avg. Contribution Index | 0.329 ** | 70 | 0.121 | 70 | 0.611 *** | 70 | 0.144 | 80 | 0.090 | 78 | ||||
| Team Avg. Contribution Index Oscillation | 0.216 | 70 | −0.250 * | 70 | 0.252 * | 70 | 0.024 | 80 | −0.274 * | 78 | ||||
| Team Avg. Degree Centrality | 0.269 * | 70 | −0.391 *** | 70 | 0.395 *** | 70 | −0.182 | 80 | −0.251 * | 78 | ||||
| Team Avg. Ego ART | −0.443 *** | 70 | 0.529 *** | 70 | −0.192 | 70 | −0.218 | 80 | −0.291 ** | 78 | ||||
| Team Avg. Ego Nudges | −0.066 | 70 | 0.236 * | 70 | −0.352 ** | 70 | −0.098 | 80 | 0.060 | 78 | ||||
| Team Avg. Avg. Emotionality | 0.438 *** | 70 | 0.031 | 70 | 0.756 *** | 70 | 0.564 *** | 80 | 0.296 ** | 78 | ||||
| Team Avg. Avg. Influence | 0.052 | 70 | −0.373 ** | 70 | −0.120 | 70 | −0.117 | 80 | 0.130 | 78 | ||||
| Team Avg. Total Influence | 0.216 | 70 | −0.316 ** | 70 | 0.249 * | 70 | −0.163 | 80 | −0.466 *** | 78 | ||||
| Team Avg. Received Messages | 0.415 *** | 70 | −0.228 | 70 | 0.478 *** | 70 | −0.106 | 80 | −0.296 ** | 78 | ||||
| Team Avg. Sent Messages | 0.551 *** | 70 | −0.122 | 70 | 0.590 *** | 70 | −0.152 | 80 | −0.431 *** | 78 | ||||
| Team Avg. Total Messages | 0.461 *** | 70 | −0.198 | 70 | 0.518 *** | 70 | −0.123 | 80 | −0.325 ** | 78 | ||||
| Team Avg. Reach2 | 0.057 | 70 | −0.384 ** | 70 | −0.035 | 70 | −0.372 *** | 80 | 0.120 | 78 | ||||
| Team Avg. Avg. Sentiment | 0.250 * | 70 | −0.310 ** | 70 | 0.314 ** | 70 | −0.265* | 80 | 0.231 * | 78 | ||||
| Team Avg. Agreeableness | −0.188 | 70 | −0.504 *** | 70 | −0.298 * | 70 | −0.054 | 80 | 0.395 *** | 78 | ||||
| Team Avg. Neuroticism | − | 70 | − | 70 | − | 70 | 0.122 | 80 | −0.306 ** | 78 | ||||
| Team Avg. Extraversion | −0.487 *** | 70 | −0.093 | 70 | −0.625 *** | 70 | 0.020 | 80 | 0.064 | 78 | ||||
| Team Avg. Openness to Experience | − | 70 | − | 70 | − | 70 | 0.104 | 80 | − | 78 | ||||
| Team Avg. Conscientiousness | 0.347 ** | 70 | 0.007 | 70 | 0.267 * | 70 | −0.208 | 80 | 0.217 | 78 | ||||
| Team Avg. Authority/Respect | −0.081 | 70 | −0.228 | 70 | 0.095 | 70 | 0.366 *** | 80 | −0.063 | 78 | ||||
| Team Avg. Fairness/Reciprocity | − | 70 | − | 70 | − | 70 | 0.116 | 80 | − | 78 | ||||
| Team Avg. Harm/Care | 0.090 | 70 | 0.136 | 70 | −0.129 | 70 | 0.025 | 80 | 0.169 | 78 | ||||
| Team Avg. Power | 0.187 | 70 | 0.341 ** | 70 | 0.186 | 70 | 0.111 | 80 | 0.611 *** | 78 | ||||
| Team Avg. Achievement | − | 70 | − | 70 | − | 70 | −0.418 *** | 80 | − | 78 | ||||
| Team Avg. Transcendence | −0.022 | 70 | −0.008 | 70 | −0.081 | 70 | 0.070 | 80 | 0.262 * | 78 | ||||
| Team Avg. Ethical Risk Likelihood | − | 70 | − | 70 | − | 70 | 0.011 | 80 | − | 78 | ||||
| Team Avg. Ethical Risk Perceived | 0.076 | 70 | −0.576 *** | 70 | 0.149 | 70 | − | 80 | −0.147 | 78 | ||||
| Team Avg. Recreational Risk Likelihood | 0.057 | 70 | −0.322 ** | 70 | −0.041 | 70 | −0.285 * | 80 | − | 78 | ||||
| Team Avg. Social Risk Likelihood | −0.419 *** | 70 | 0.561 *** | 70 | −0.569 *** | 70 | 0.205 | 80 | −0.202 | 78 | ||||
| Team Avg. Social Risk Perceived | 0.141 | 70 | −0.503 *** | 70 | 0.240 * | 70 | 0.157 | 80 | − | 78 | ||||
| Team Avg. Total Risk Likelihood | −0.265 * | 70 | −0.297 * | 70 | −0.081 | 70 | 0.068 | 80 | −0.267 * | 78 |
Appendix C


References
- Brandstätter, H. Personality Aspects of Entrepreneurship: A Look at Five Meta-Analyses. Personal. Individ. Differ. 2011, 51, 222–230. [Google Scholar] [CrossRef]
- Bello, S.M. Impact of Ethical Leadership on Employee Job Performance. Int. J. Bus. Soc. Sci. 2012, 3, 228–237. [Google Scholar]
- Pentland, A.S. Honest Signals: How They Shape Our World; MIT Press: Cambridge, UK, 2008. [Google Scholar]
- Gloor, P.A. Sociometrics and Human Relationships: Analyzing Social Networks to Manage Brands, Predict Trends, and Improve Organizational Performance, 1st ed.; Emerald Publishing Limited: Bingley, UK, 2017; ISBN 9781787147256. [Google Scholar]
- Gloor, P.A.; Zylka, M.P.; Colladon, A.F.; Makai, M. “Entanglement”—A New Dynamic Metric to Measure Team Flow. Soc. Netw. 2022, 70, 100–111. [Google Scholar] [CrossRef]
- Gloor, P.A.; Colladon, A.F.; Grippa, F. The Digital Footprint of Innovators: Using Email to Detect the Most Creative People in Your Organization. J. Bus. Res. 2020, 114, 254–264. [Google Scholar] [CrossRef]
- Sun, J.; Gloor, P. E-Mail Network Patterns and Body Language Predict Risk-Taking Attitude. Future Internet 2021, 13, 17. [Google Scholar] [CrossRef]
- Gloor, P.A.; Colladon, A.F. Heart Beats Brain: Measuring Moral Beliefs Through E-Mail Analysis. In Digital Transformation of Collaboration. Proceedings of the 9th International COINs Conference; Przegalinska, A., Grippa, F., Gloor, P.A., Eds.; Springer Proceedings in Complexity: Cham, Switzerland, 2020; pp. 85–93. ISBN 978-3-030-48993-9. [Google Scholar]
- Gloor, P.A.; Fischbach, K.; Fuehres, H.; Lassenius, C.; Niinimäki, T.; Olguin, D.O.; Pentland, S.; Piri, A.; Putzke, J. Towards “Honest Signals” of Creativity—Identifying Personality Characteristics Through Microscopic Social Network Analysis. Procedia-Soc. Behav. Sci. 2011, 26, 166–179. [Google Scholar] [CrossRef] [Green Version]
- McCrae, R.R.; Costa, P.T. A Contemplated Revision of the Neo Five-Factor Inventory. Personal. Individ. Differ. 2004, 36, 587–596. [Google Scholar] [CrossRef]
- Schwartz, S.H. Are There Universal Aspects in the Structure and Contents of Human Values? J. Soc. Issues 1994, 50, 19–45. [Google Scholar] [CrossRef]
- Graham, J.; Nosek, B.A.; Haidt, J.; Iyer, R.; Koleva, S.; Ditto, P.H. Mapping the Moral Domain. J. Personal. Soc. Psychol. 2011, 101, 366–385. [Google Scholar] [CrossRef]
- Weber, E.U.; Blais, A.-R.; Betz, N.E. A Domain-Specific Risk-Attitude Scale: Measuring Risk Perceptions and Risk Behaviors. J. Behav. Decis. Mak. 2002, 15, 263–290. [Google Scholar] [CrossRef]
- Bavelas, A. Communication Patterns in Task-Oriented Groups. J. Acoust. Soc. Am. 1950, 22, 725–730. [Google Scholar] [CrossRef]
- Hadley, B.; Gloor, P.A.; Woerner, S.L.; Zhou, Y. Analyzing VC Influence on Startup Success: They Might Not Be Good for You. In Collaborative Innovation Networks; Grippa, F., Leitão, J., Gluesing, J., Riopelle, K., Gloor, P.A., Eds.; Springer: Cham, Switzerland, 2018; pp. 3–14. [Google Scholar]
- Gloor, P.; Fronzetti Colladon, A.; de Oliveira, J.M.; Rovelli, P. Put Your Money Where Your Mouth Is: Using Deep Learning to Identify Consumer Tribes from Word Usage. Int. J. Inf. Manag. 2020, 51, 101924. [Google Scholar] [CrossRef]
- Gloor, P.A. Happimetrics: Leveraging AI to Untangle the Surprising Link Between Ethics, Happiness, and Business Success; Edward Elgar: Cheltenham, UK, 2022. [Google Scholar]
- Müller, A.C.; Guido, S. Introduction to Machine Learning with Python, 1st ed.; Schanafelt, D., Ed.; O’Reilly Media: Sebastopol, CA, USA, 2016; ISBN 9781449369415. [Google Scholar]
- Chawla, N.v.; Bowyer, K.W.; Hall, L.O.; Kegelmeyer, W.P. SMOTE: Synthetic Minority Over-Sampling Technique. J. Artif. Intell. Res. 2002, 16, 321–357. [Google Scholar] [CrossRef]
- Chen, T.; Guestrin, C. XGBoost: A Scalable Tree Boosting System. In Proceedings of the ACM SIGKDD International Conference on Knowledge Discovery and Data Mining, San Francisco, CA, USA, 13–17 August 2016; pp. 785–794. [Google Scholar] [CrossRef] [Green Version]
- Intelligent Collaborative Knowledge Networks. Available online: http://www.ickn.org/ckntools.html (accessed on 15 January 2022).
- Galaxylens: Galaxy Sciences. Available online: http://www.galaxysciences.com/galaxylens.php (accessed on 15 January 2022).
- Zhao, Q.; Hastie, T. Causal Interpretations of Black-Box Models. J. Bus. Econ. Stat. 2021, 39, 272–281. [Google Scholar] [CrossRef] [PubMed]
- Batson, C.D.; Ahmad, N.; Powell, A.A.; Stocks, E.L. Prosocial Motivation. In Handbook of Motivation Science; Shah, J.Y., Gardner, W.L., Eds.; Guilford Press: New York, NY, USA, 2008; pp. 135–149. ISBN 1-59385-568-0. [Google Scholar]
- Hu, J.; Liden, R.C. Making a Difference in the Teamwork: Linking Team Prosocial Motivation to Team Processes and Effectiveness. Acad. Manag. J. 2015, 58, 1102–1127. [Google Scholar] [CrossRef]
- Grant, A.M. Relational Job Design and the Motivation to Make a Prosocial Difference. Acad. Manag. Rev. 2007, 32, 393–417. [Google Scholar] [CrossRef] [Green Version]
- Barrick, M.R.; Mount, M.K.; Strauss, J.P. Conscientiousness and Performance of Sales Representatives: Test of the Mediating Effects of Goal Setting. J. Appl. Psychol. 1993, 78, 715–722. [Google Scholar] [CrossRef]
- Barrick, M.R.; Mount, M.K. Autonomy as a Moderator of the Relationships Between the Big Five Personality Dimensions and Job Performance. J. Appl. Psychol. 1993, 78, 111–118. [Google Scholar] [CrossRef]
- Rothman, S.; Coetzer, E. The Big Five Personality Dimensions and Job Performance. SA J. Ind. Psychol. 2003, 29, 68–74. [Google Scholar] [CrossRef] [Green Version]
- Barrick, M.R.; Mount, M.K. The Big Five Personality Dimensions and Job Performance: A Meta-Analysis. Pers. Psychol. 1991, 44, 1–26. [Google Scholar] [CrossRef]
- Bing, M.N.; Lounsbury, J.W. Openness and Job Performance in U.S.-Based Japanese Manufacturing Companies. J. Bus. Psychol. 2000, 14, 515–522. [Google Scholar] [CrossRef]
- Johnson, J.A. Seven Social Performance Scales for the California Psychological Inventory. Hum. Perform. 1997, 10, 1–30. [Google Scholar] [CrossRef] [Green Version]
- Vinchur, A.J.; Schippmann, J.S.; Switzer, F.S.; Roth, P.L. A Meta-Analytic Review of Predictors of Job Performance for Salespeople. J. Appl. Psychol. 1998, 83, 586–597. [Google Scholar] [CrossRef]
- Jensen-Campbell, L.A.; Knack, J.M.; Gomez, H.L. The Psychology of Nice People. Soc. Personal. Psychol. Compass 2010, 4, 1042–1056. [Google Scholar] [CrossRef]
- Judge, T.A.; Livingston, B.A.; Hurst, C. Do Nice Guys—and Gals—Really Finish Last? The Joint Effects of Sex and Agreeableness on Income. J. Personal. Soc. Psychol. 2011, 102, 390. [Google Scholar] [CrossRef] [Green Version]
- Agras, S.; Ates, H. Investigating the Predictive Abilities of Schwartz’s Ten Universal Values on Five Work Performance Outcome Behaviors. Soc. Basic Sci. Res. Rev. 2015, 3, 16–31. [Google Scholar]
- Bradley, B.H.; Baur, J.E.; Banford, C.G.; Postlethwaite, B.E. Team Players and Collective Performance: How Agreeableness Affects Team Performance Over Time. Small Group Res. 2013, 44, 680–711. [Google Scholar] [CrossRef]
- Judge, T.A.; Higgins, C.A.; Thoresen, C.J.; Barrick, M.R. The Big Five Personality Traits, General Mental Ability, and Career Success Across the Life Span. Pers. Psychol. 1999, 52, 621–652. [Google Scholar] [CrossRef]
- Salgado, J.F. The Five Factor Model of Personality and Job Performance in the European Community. J. Appl. Psychol. 1997, 82, 30–43. [Google Scholar] [CrossRef]
- Heffernan, M. Don’t Wish for Obedient Employees. Available online: https://www.inc.com/margaret-heffernan/why-you-dont-want-obedient-employees.html (accessed on 1 January 2022).
- Heffernan, M. Just Following Orders. In Willful Blindness: Why We Ignore the Obvious at Our Peril; Heffernan, M., Ed.; Doubleday Canada: Toronto, ON, Canada, 2011; ISBN 9780385669009. [Google Scholar]
- Morris, J.; Mountfort, P. The Leader and the Team. Manag. Serv. Qual. Int. J. 1997, 7, 314–317. [Google Scholar] [CrossRef]
- Diehm, R.; Armatas, C. Surfing: An Avenue for Socially Acceptable Risk-Taking, Satisfying Needs for Sensation Seeking and Experience Seeking. Personal. Individ. Differ. 2004, 36, 663–677. [Google Scholar] [CrossRef]
- Weller, J.A.; Tikir, A. Predicting Domain-Specific Risk Taking With the HEXACO Personality Structure. J. Behav. Decis. Mak. 2011, 24, 180–201. [Google Scholar] [CrossRef]
- Ashton, M.C.; Lee, K. Empirical, Theoretical, and Practical Advantages of the HEXACO Model of Personality Structure. Personal. Soc. Psychol. Rev. 2007, 11, 150–166. [Google Scholar] [CrossRef] [PubMed]
- Fisk, S.R.; Overton, J. Bold or Reckless? The Impact of Workplace Risk-Taking on Attributions and Expected Outcomes. PLoS ONE 2020, 15, e0228672. [Google Scholar] [CrossRef] [Green Version]
- Farrell, M. Leadership Reflections: Extrovert and Introvert Leaders. J. Libr. Adm. 2017, 57, 436–443. [Google Scholar] [CrossRef]
- Dannar, P. If You Want Creativity in Your Organizations, Seek Out the Introvert. J. Leadersh. Stud. 2016, 10, 40–41. [Google Scholar] [CrossRef]
- Arthaud-Day, M.L.; Rode, J.C.; Turnley, W.H. Direct and Contextual Effects of Individual Values on Organizational Citizenship Behavior in Teams. J. Appl. Psychol. 2012, 97, 792–807. [Google Scholar] [CrossRef] [Green Version]
- Burt, R.S.; Hogarth, R.M.; Michaud, C. The Social Capital of French and American Managers. Organ. Sci. 2000, 11, 123–147. [Google Scholar] [CrossRef] [Green Version]
- Stachl, C.; Au, Q.; Schoedel, R.; Gosling, S.D.; Harari, G.M.; Buschek, D.; Völkel, S.T.; Schuwerk, T.; Oldemeier, M.; Ullmann, T.; et al. Predicting Personality from Patterns of Behavior Collected with Smartphones. Proc. Natl. Acad. Sci. USA 2020, 117, 17680–17687. [Google Scholar] [CrossRef]
- Marr, B. Data-Driven HR: How to Use Analytics and Metrics to Drive Performance; Kogan Page: London, UK, 2018. [Google Scholar]
- Bleidorn, W.; Hopwood, C.J. Using Machine Learning to Advance Personality Assessment and Theory. Personal. Soc. Psychol. Rev. 2019, 23, 190–203. [Google Scholar] [CrossRef]
- Blum, A.; Stangl, K. Recovering from Biased Data: Can Fairness Constraints Improve Accuracy? arXiv 2019, arXiv:1912.01094. [Google Scholar] [CrossRef]
- Suresh, H.; Guttag, J. A Framework for Understanding Sources of Harm throughout the Machine Learning Life Cycle. In Equity and Access in Algorithms, Mechanisms, and Optimization; Association for Computing Machinery: New York, NY, USA, 2021. [Google Scholar] [CrossRef]
- Santacreu, J.; Rubio, V.J.; Hernández, J.M. The Objective Assessment of Personality: Cattells’s T-Data Revisited and More. Psychol. Sci. 2006, 48, 53–68. [Google Scholar]
- Bird, C.; Gourley, A.; Devanbu, P.; Gertz, M.; Swaminathan, A. Mining Email Social Networks. In Proceedings of the 2006 International Workshop on Mining Software Repositories, Shanghai, China, 22–23 May 2006; pp. 137–143. [Google Scholar] [CrossRef]
- Wilson, K.G.; Sandoz, E.K.; Kitchens, J.; Roberts, M. The Valued Living Questionnaire: Defining and Measuring Valued Action within a Behavioral Framework. Psychol. Rec. 2010, 60, 249–272. [Google Scholar] [CrossRef] [Green Version]


| Signal | SNA/NLP Term | Definition | Calculation |
|---|---|---|---|
| Central Leadership | Degree Centrality | Number of actors each person is directly connected within a network [4] | Number of nearest neighbors from an actor both as senders and receivers in the network [4] |
| Betweenness Centrality | Measure of the extent to which each actor acts as an information hub [4] | Likelihood to be on the shortest path between any two actors in the network [4] | |
| Closeness Centrality | Measure of the mean distance from a node to other nodes [7] | Mean shortest distance from one node to each other node [14] | |
| Reach2 | Proxy for individual social capital [7] | Number of nodes an actor can reach in two steps [15] | |
| Rotating Leadership | Betweenness Centrality Oscillation | Measure of how frequently actors change their network position in the team, from central to peripheral, and back [4] | Number of local maxima and minima in a node’s betweenness centrality curve [4] |
| Balanced Contribution | Contribution Index | Balance of communication in terms of sent and received messages [4] | Subtracting messages received from the messages sent and then dividing the result by the messages sent added to the messages received [4,7] |
| Rotating Contribution | Contribution Index Oscillation | Measure of how frequently actors change the balance of their communication [7] | Number of local maxima and minima in a node’s contribution index curve [7] |
| (Rapid) Response | Ego ART | Average number of hours sender takes to respond to emails [4] | Time until a frame is closed for the receiver after he has sent an email [4] |
| Ego Nudges | Average number of follow-ups that the sender needs to send to receive a response from the receiver [4] | Number of pings until sender responds [4] | |
| Alter ART | Average number of hours receiver takes to respond to emails [4] | Time until a frame is closed for the sender, after he has sent an email [4] | |
| Alter Nudges | Average number of follow-ups that the receiver needs to send to receive a respond from the sender [4] | Number of pings until receiver responds [4] | |
| Honest Language | Average Sentiment | Indicates positivity and negativity of communication [4] | Sentiment scores which are predicted through ML model trained on twitter data are averaged [4,16] |
| Average Emotionality | Indicates the deviations from neutral sentiment [4] | Standard deviation of sentiment [4] | |
| Shared Context | Average Complexity | Measure of complexity of word usage [4] | Information distribution using Term Frequency Inverse Document Frequency (TF/IDF), independent of single words [4] |
| Average Influence | Measure of influence of word usage averaged over all messages—defined as speed with how quickly newly introduced words are picked up by others, normalized by TF/IDF [17] | Counting the popularity of a word within a message compared to all other messages in the community (using TF/IDF) [17] | |
| Total Influence | Measure of influence of word usage—the individual influence per message summed up over all messages of an actor [17] | Summing up influence measure (described above) over all messages of an actor [17] |
| Survey | Data Source | Percentage | N |
|---|---|---|---|
| NEO FFI | Multinational university course | 18.51% | 15 |
| Professional service firm | 2.47% | 2 | |
| Personal email boxes | 79.01% | 64 | |
| Total | 100% | 81 | |
| Moral Foundations | Multinational university course | 25.46% | 14 |
| Professional service firm | 1.82% | 1 | |
| Personal email boxes | 72.73% | 40 | |
| Total | 100% | 56 | |
| Schwartz’s Values | Multinational university course | 22.95% | 14 |
| Professional service firm | 3.28% | 2 | |
| Personal email boxes | 73.77% | 45 | |
| Total | 100% | 61 | |
| DOSPERT | Multinational university course | 30.61% | 15 |
| Professional service firm | 4.08% | 2 | |
| Personal e-mail box | 65.3% | 32 | |
| Total | 100% | 49 |
| Data Source | Object of Study | Target |
|---|---|---|
| Health care | 70 employees in 11 innovation teams | Team performance, learning behavior, and innovation behavior |
| Professional services | 82 managers | Employee ratings (of two years) |
| Professional services | 78 managers in 17 teams | Team net promoter score |
| Multinational university course | 80 master’s students in 20 teams | Student Teams Grades |
| Target | Predictors | Accuracy (CV) | Macro F1 (CV) | Macro Precision (CV) | Macro Recall (CV) | ROC AUC (CV) | Accuracy (Holdout) | Macro F1 (Holdout) | Macro Precision (Holdout) | Macro Recall (Holdout) | Cohen’s Kappa (Holdout) | ROC AUC (Holdout) |
|---|---|---|---|---|---|---|---|---|---|---|---|---|
| Agreeableness | Betweenness C. Oscillation, Contribution Index, Total Influence | 0.7 | 0.679 | 0.712 | 0.719 | 0.848 | 0.667 | 0.643 | 0.667 | 0.639 | 0.491 | 0.897 |
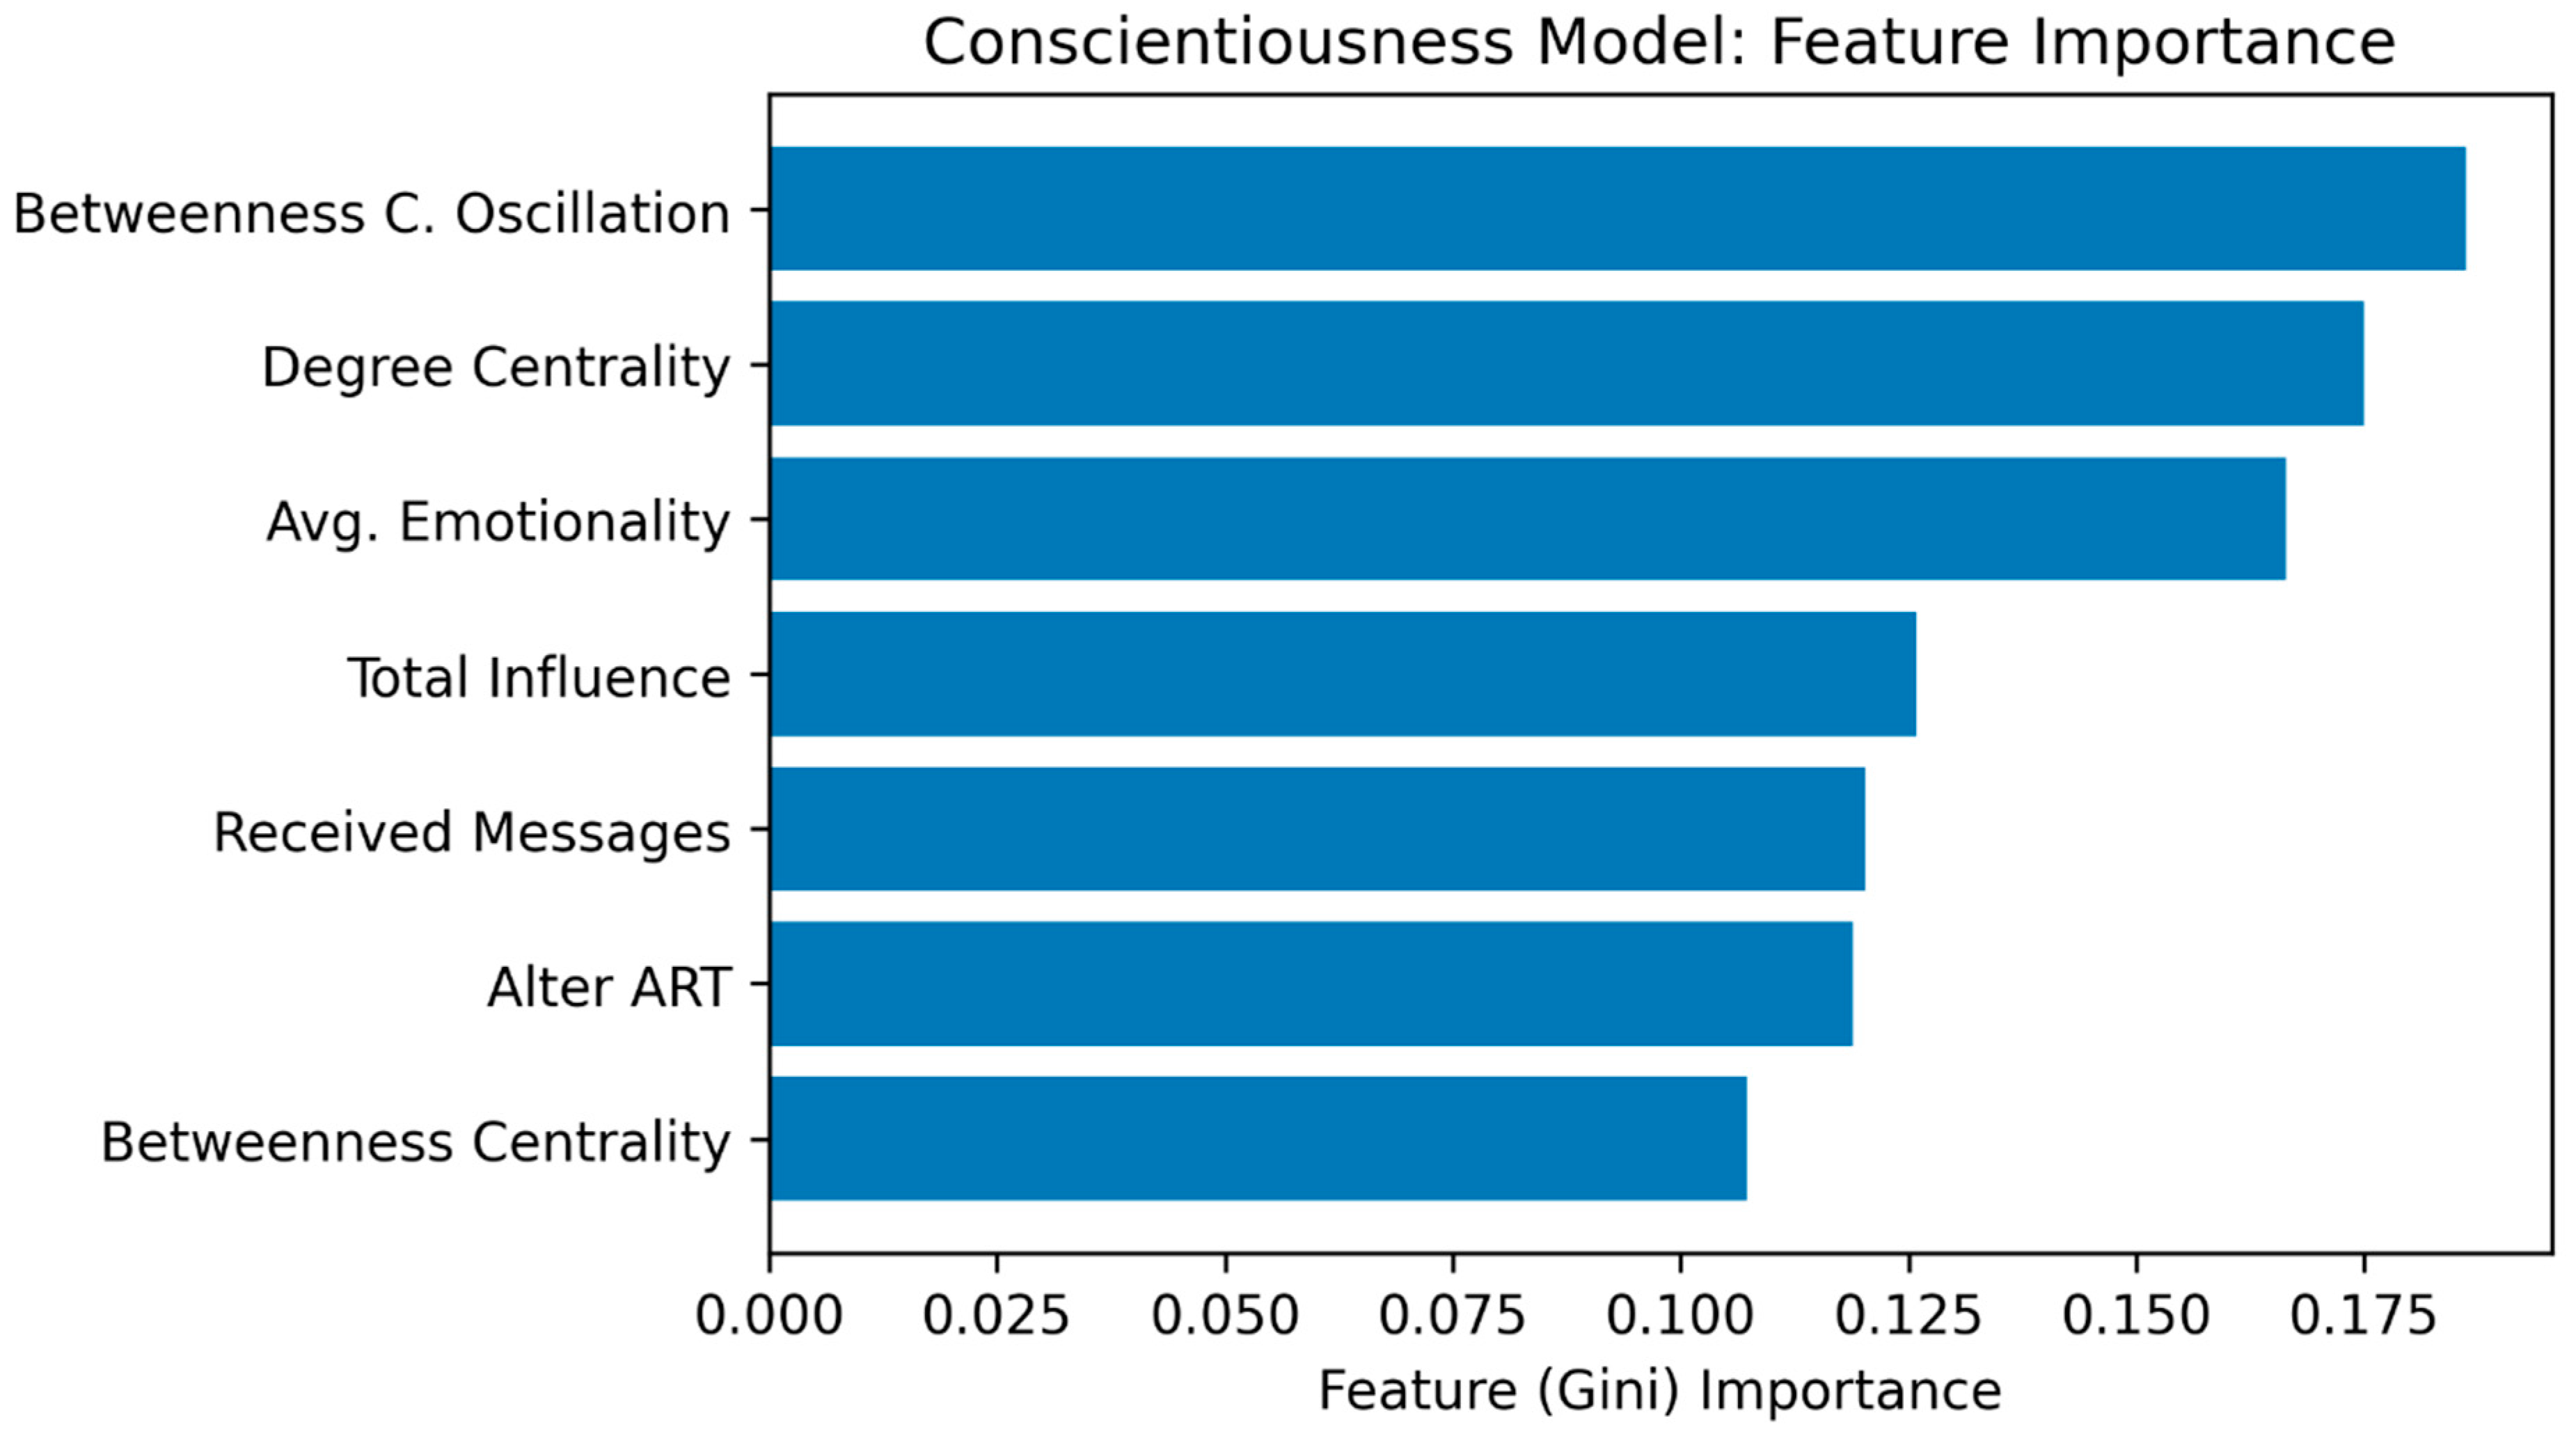
| Conscientiousness | Betweenness C. Oscillation, Degree Centrality | 0.797 | 0.785 | 0.794 | 0.804 | 0.911 | 0.889 | 0.863 | 0.952 | 0.833 | 0.75 | 0.86 |
| Extraversion | Betweenness Centrality, Ego ART | 0.681 | 0.658 | 0.674 | 0.688 | 0.8 | 0.667 | 0.6 | 0.6 | 0.6 | 0.438 | 0.621 |
| Neuroticism | Betweenness C. Oscillation, Total Influence, Avg. Sentiment | 0.785 | 0.763 | 0.791 | 0.778 | 0.894 | 0.667 | 0.631 | 0.711 | 0.722 | 0.413 | 0.823 |
| Openness to Experience | Avg. Complexity, Ego Nudges, Reach2 | 0.687 | 0.648 | 0.67 | 0.674 | 0.848 | 0.667 | 0.631 | 0.6 | 0.722 | 0.4 | 0.794 |
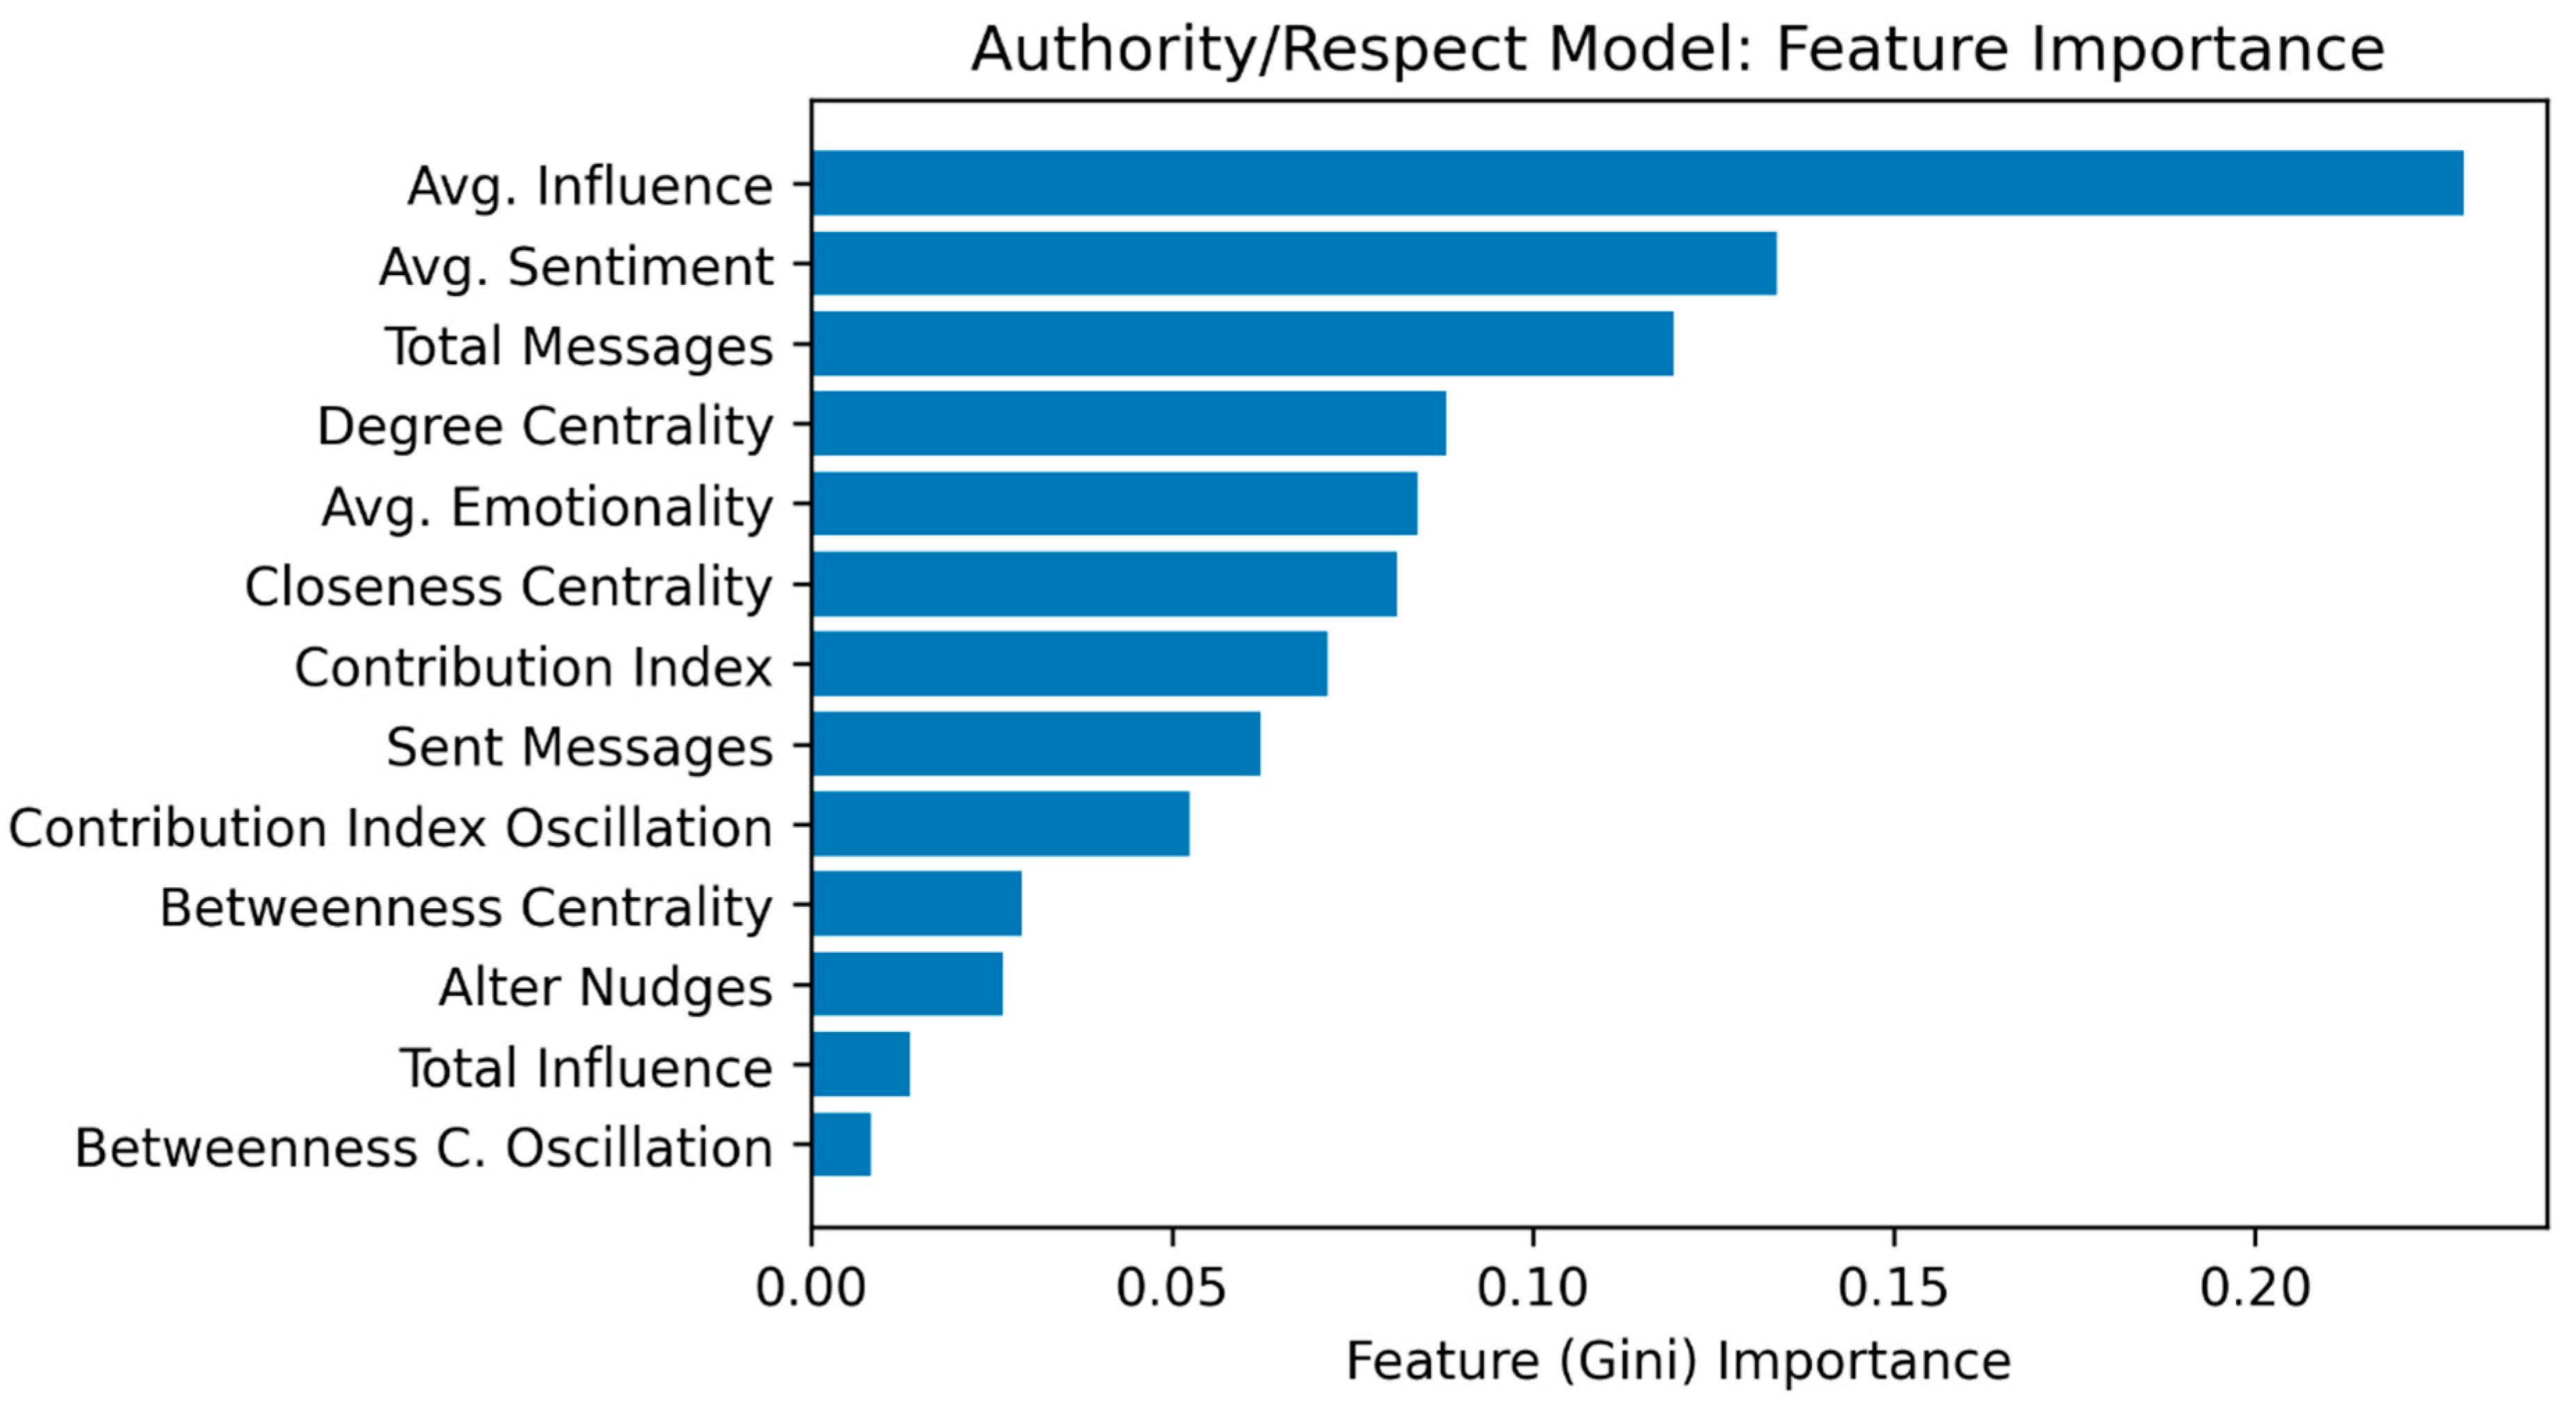
| Authority/Respect | Avg. Influence, Avg. Sentiment | 0.707 | 0.683 | 0.721 | 0.74 | 0.901 | 0.833 | 0.841 | 0.917 | 0.833 | 0.714 | 0.843 |
| Fairness/Reciprocity | Avg. Emotionality, Reach2, Ego Nudges | 0.648 | 0.612 | 0.634 | 0.648 | 0.799 | 0.667 | 0.722 | 0.778 | 0.833 | 0.5 | 0.754 |
| Harm/Care | Alter Nudges, Total Influence, | 0.752 | 0.739 | 0.758 | 0.778 | 0.889 | 0.667 | 0.722 | 0.833 | 0.778 | 0.5 | 0.917 |
| Avg. Sentiment | ||||||||||||
| Power | Avg. Complexity, Avg. Emotionality, Avg. Influence | 0.858 | 0.849 | 0.875 | 0.874 | 0.968 | 0.714 | 0.6 | 0.6 | 0.6 | 0.364 | 0.7 |
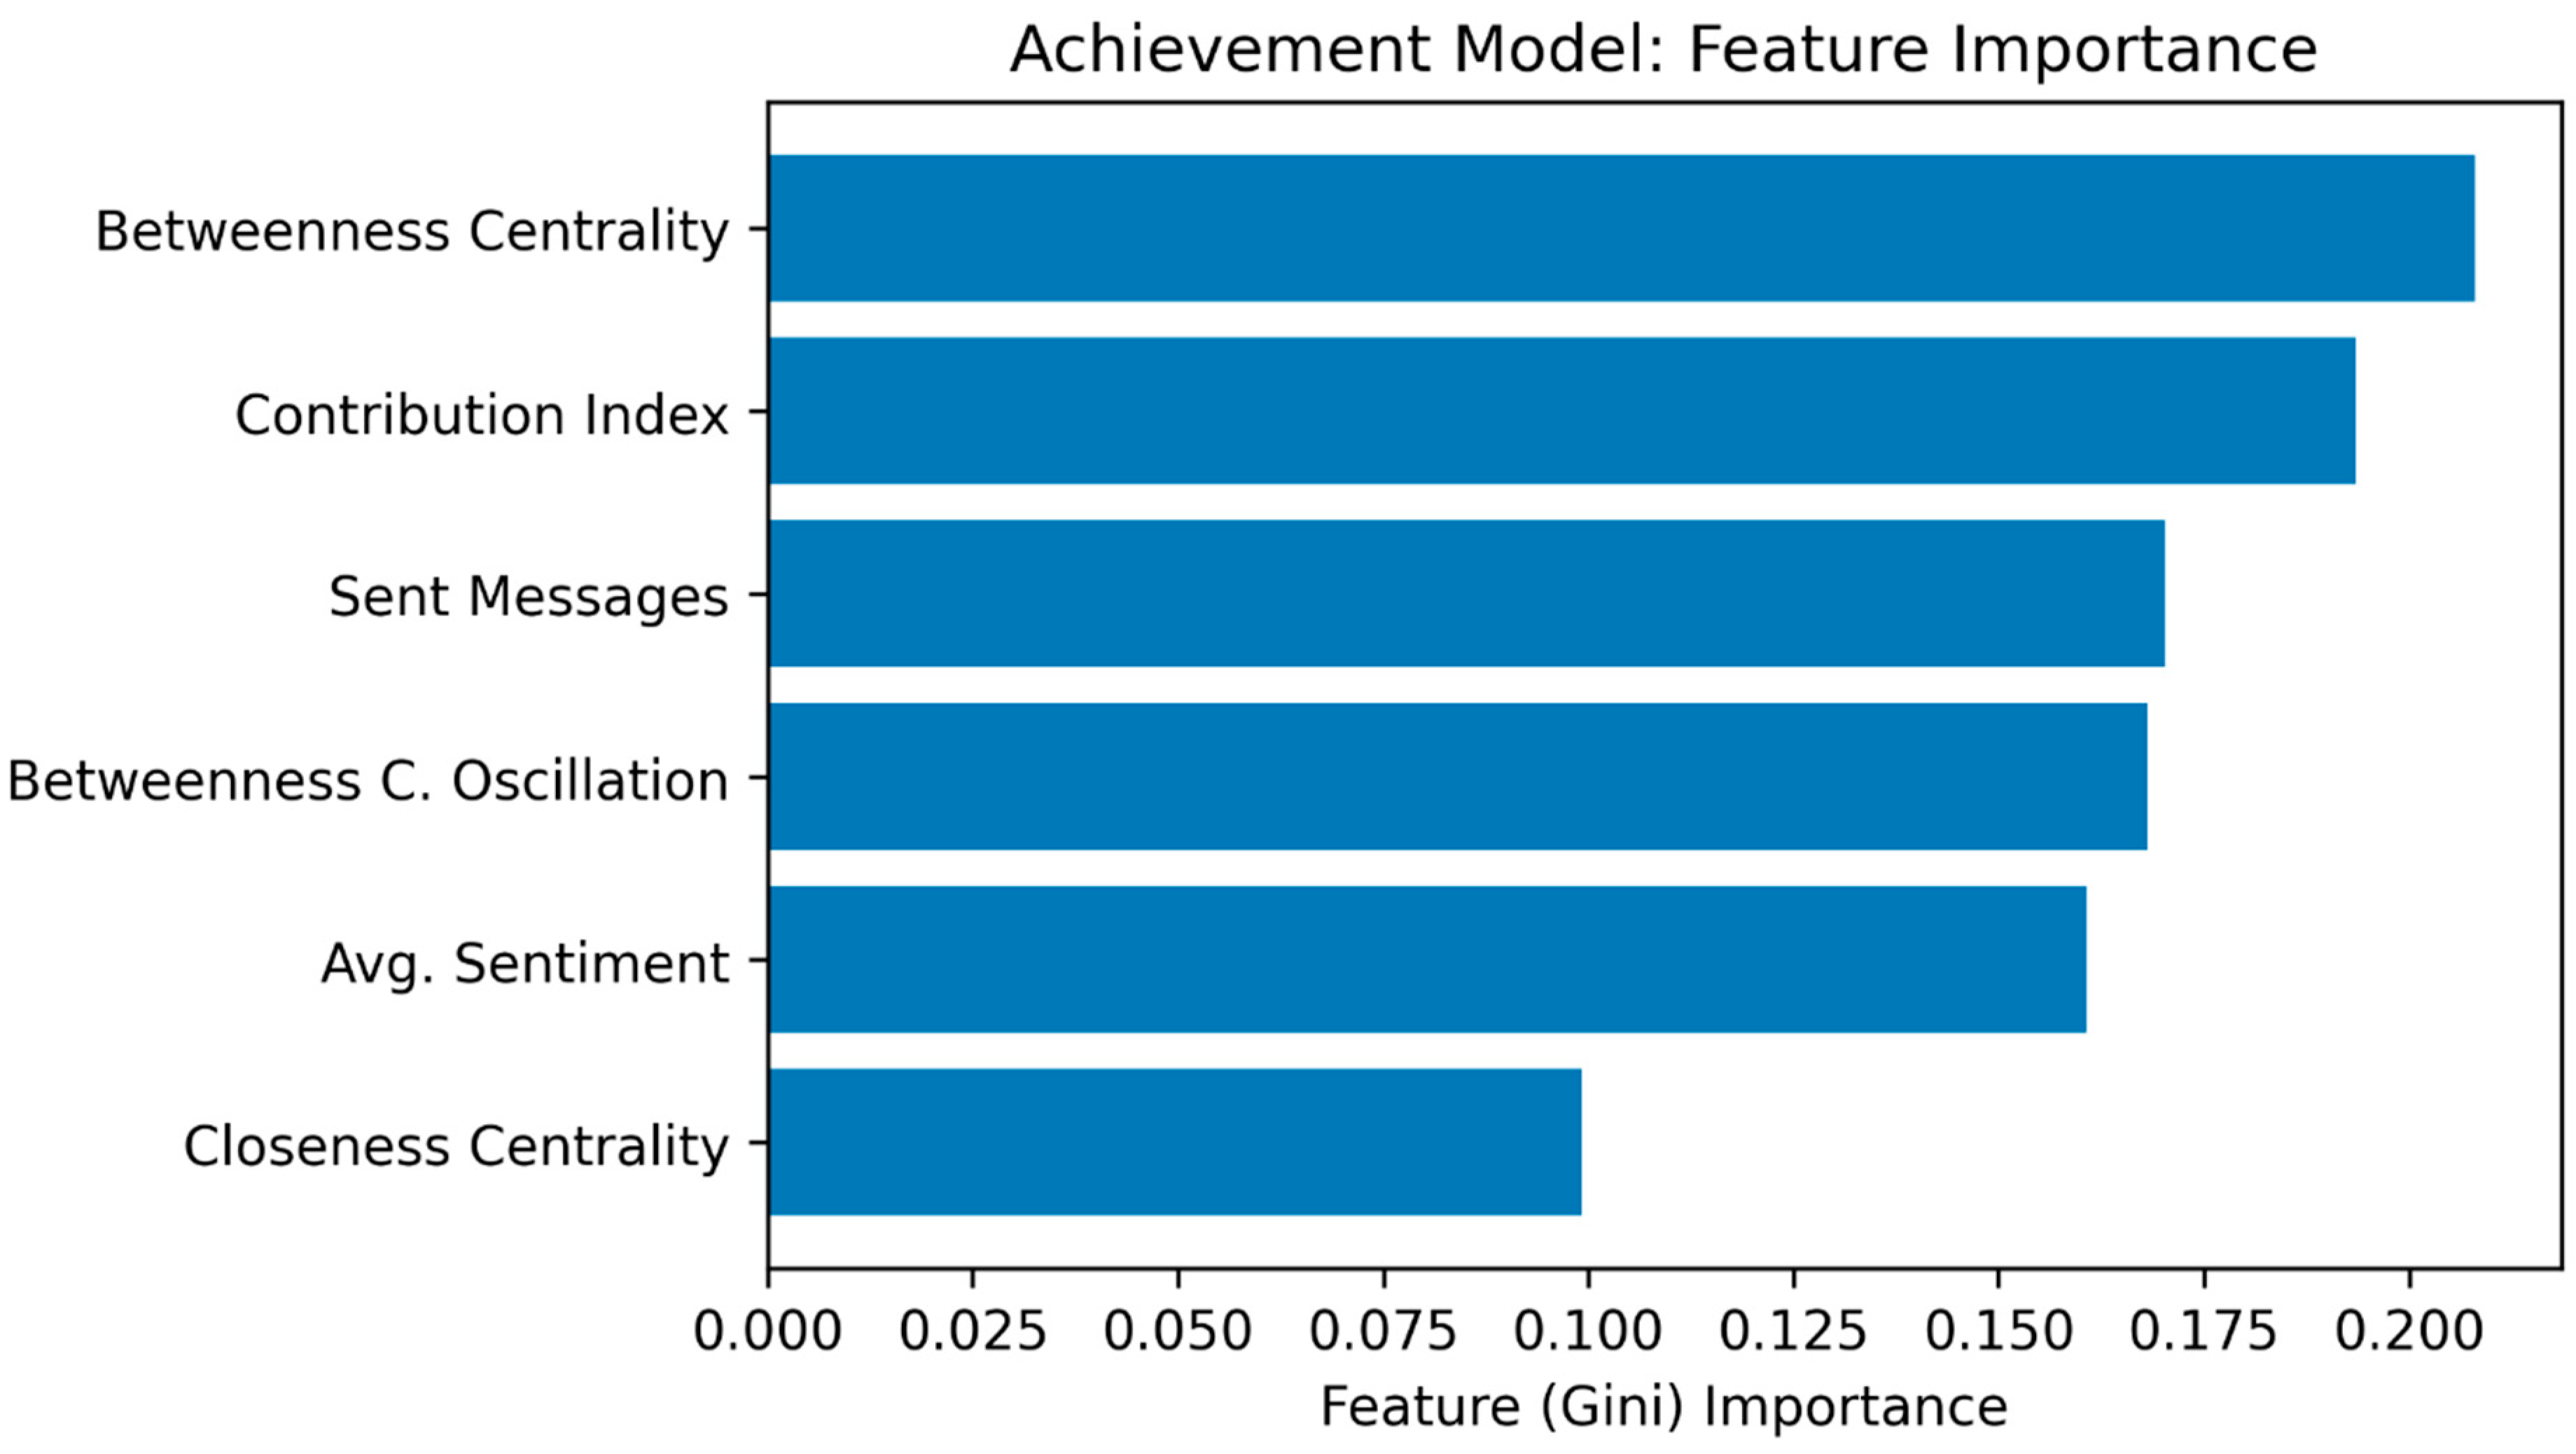
| Achievement | Betweenness Centrality, Contribution Index, Sent Messages | 0.793 | 0.776 | 0.798 | 0.812 | 0.897 | 0.714 | 0.694 | 0.667 | 0.867 | 0.533 | 0.756 |
| Transcendence | Degree Centrality, Avg. Emotionality, Total Influence | 0.748 | 0.707 | 0.718 | 0.75 | 0.887 | 0.714 | 0.711 | 0.722 | 0.778 | 0.562 | 0.694 |
| Recreational Risk Likelihood | Betweenness Centrality, Avg. Complexity, Contribution Index | 0.814 | 0.798 | 0.813 | 0.813 | 0.912 | 0.8 | 0.822 | 0.833 | 0.889 | 0.688 | 0.98 |
| Social Risk Likelihood | Alter ART, Alter Nudges, Betweenness Centrality | 0.733 | 0.719 | 0.739 | 0.757 | 0.908 | 0.8 | 0.822 | 0.833 | 0.889 | 0.688 | 0.98 |
| Social Risk Perceived | Alter Nudges, Closeness Centrality | 0.623 | 0.594 | 0.666 | 0.633 | 0.762 | 0.8 | 0.556 | 0.5 | 0.667 | 0.643 | 0.75 |
| Ethical Risk Likelihood | Betweenness C. Oscillation, Received Messages, Betweenness Centrality | 0.67 | 0.655 | 0.68 | 0.693 | 0.834 | 0.8 | 0.822 | 0.833 | 0.889 | 0.688 | 0.944 |
| Ethical Risk Perceived | Betweenness C. Oscillation, Avg. Complexity, Avg. Emotionality | 0.803 | 0.779 | 0.806 | 0.822 | 0.931 | 0.8 | 0.822 | 0.833 | 0.889 | 0.688 | 0.98 |
| Total Risk Likelihood | Contribution Index, Betweenness C. Oscillation, | 0.752 | 0.723 | 0.745 | 0.759 | 0.932 | 0.8 | 0.822 | 0.833 | 0.889 | 0.69 | 0.944 |
| Total Influence |
| Target | Predictors | Accuracy (CV) | Macro F1 (CV) | Macro Precision (CV) | Macro Recall (CV) | ROC AUC (CV) | Accuracy (Holdout) | Macro F1 (Holdout) | Macro Precision (Holdout) | Macro Recall (Holdout) | Cohen’s Kappa (Holdout) | ROC AUC (Holdout) |
|---|---|---|---|---|---|---|---|---|---|---|---|---|
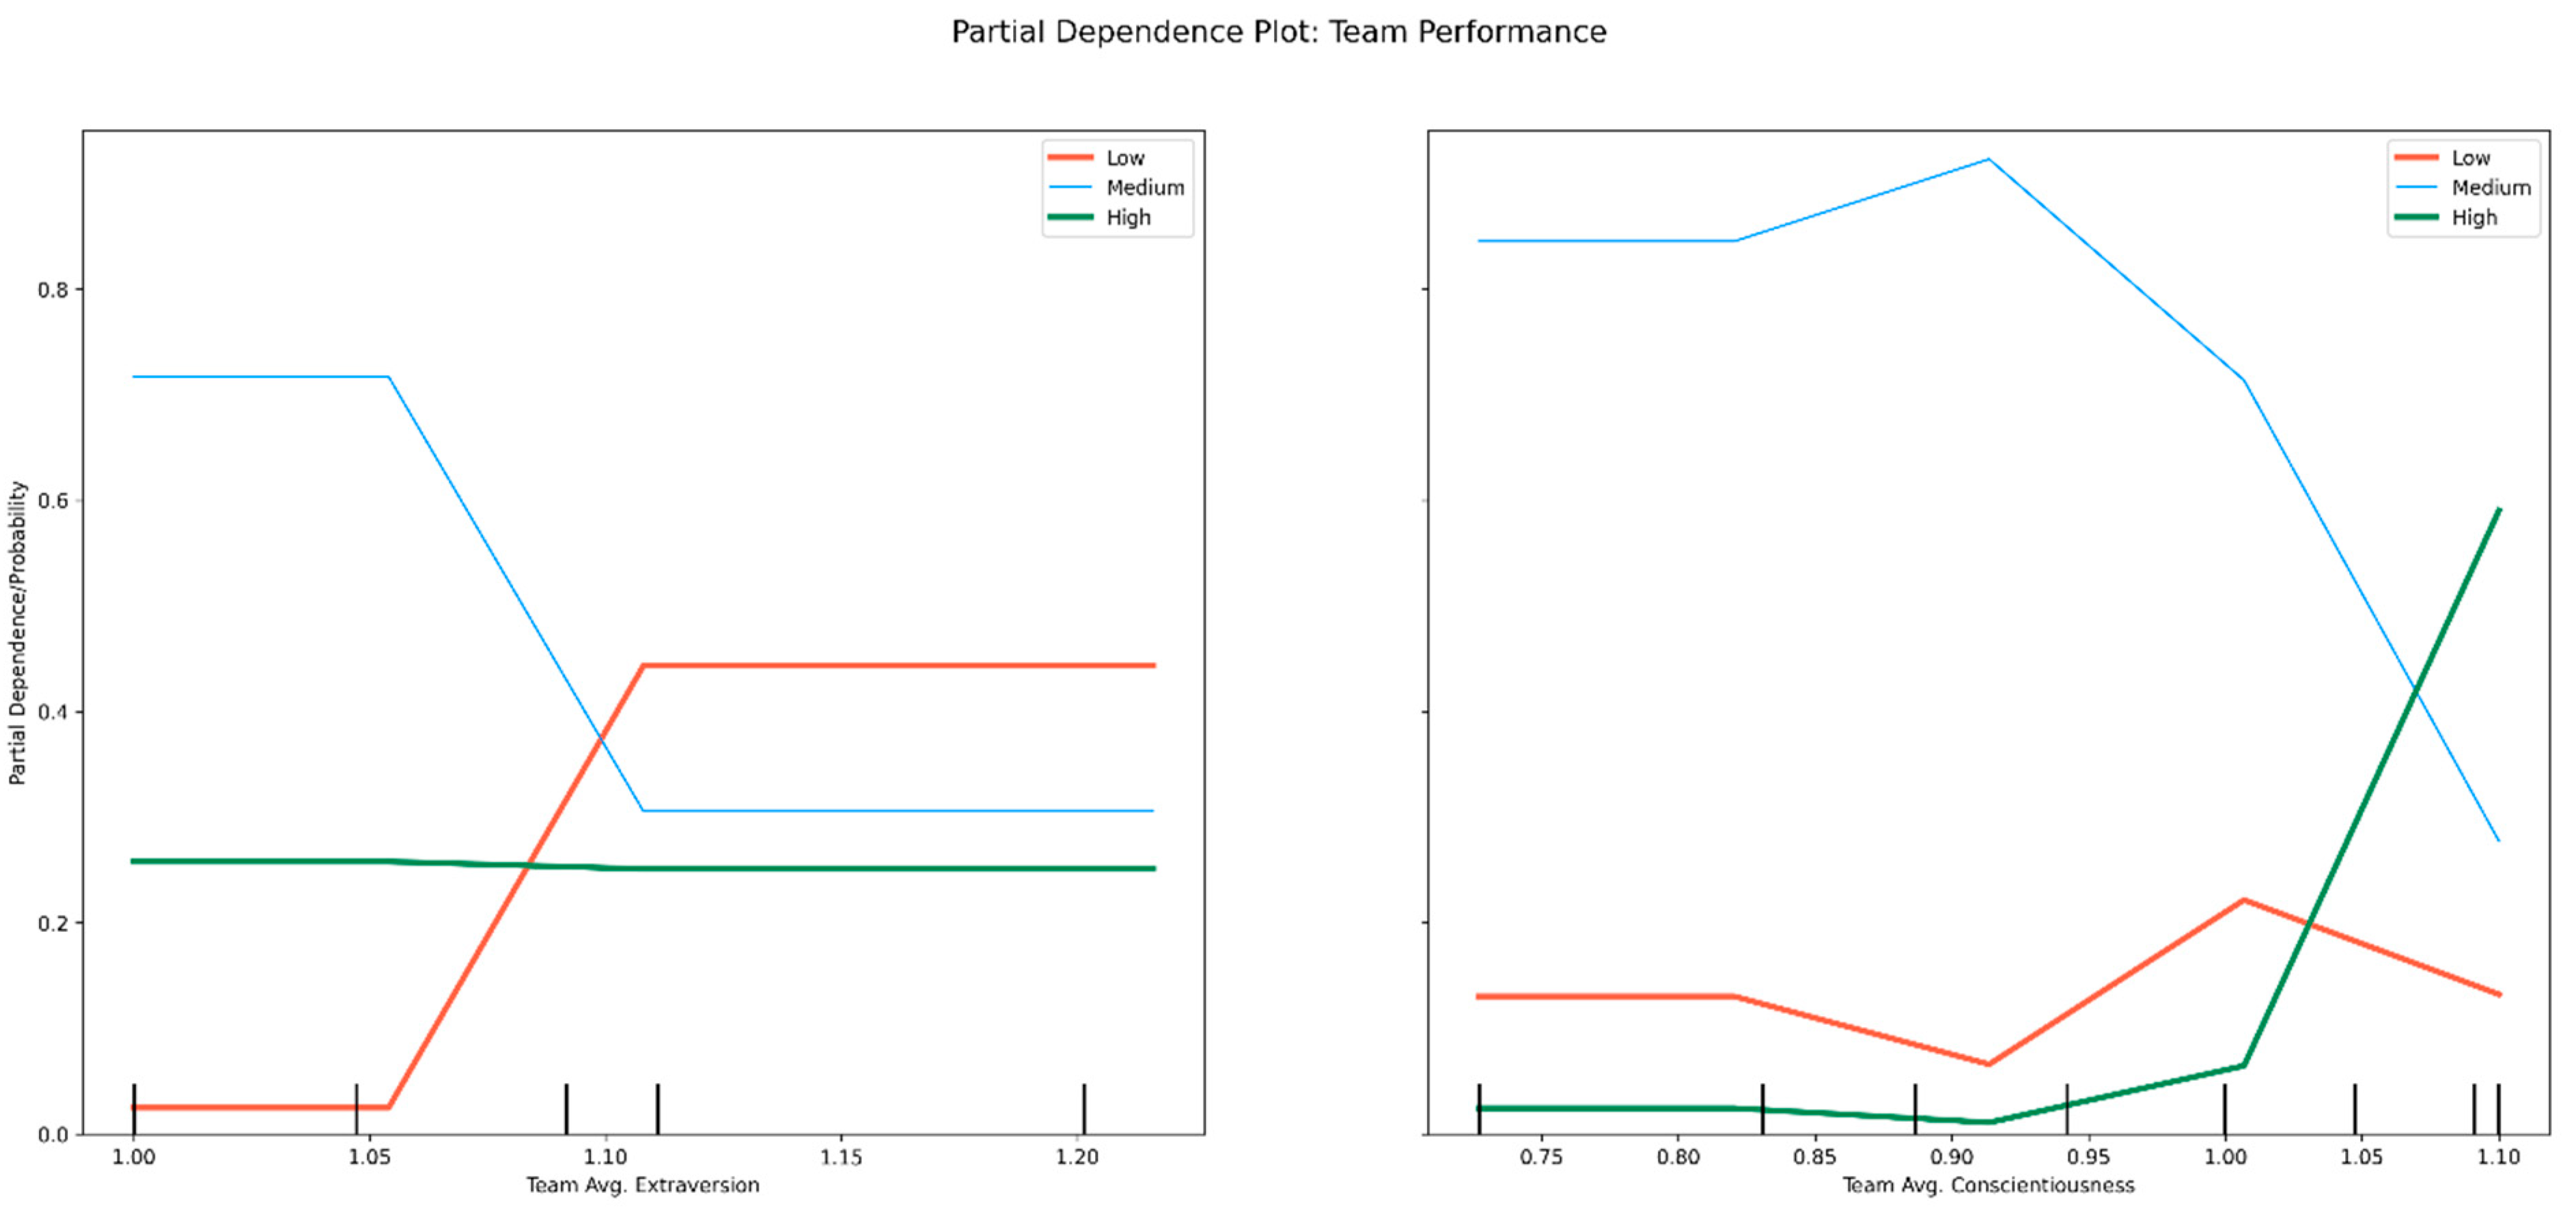
| Team Performance | Team Avg. Extraversion, Team Avg. Conscientiousness | 0.916 | 0.913 | 0.93 | 0.928 | 0.984 | 0.857 | 0.867 | 0.889 | 0.889 | 0.788 | 0.98 |
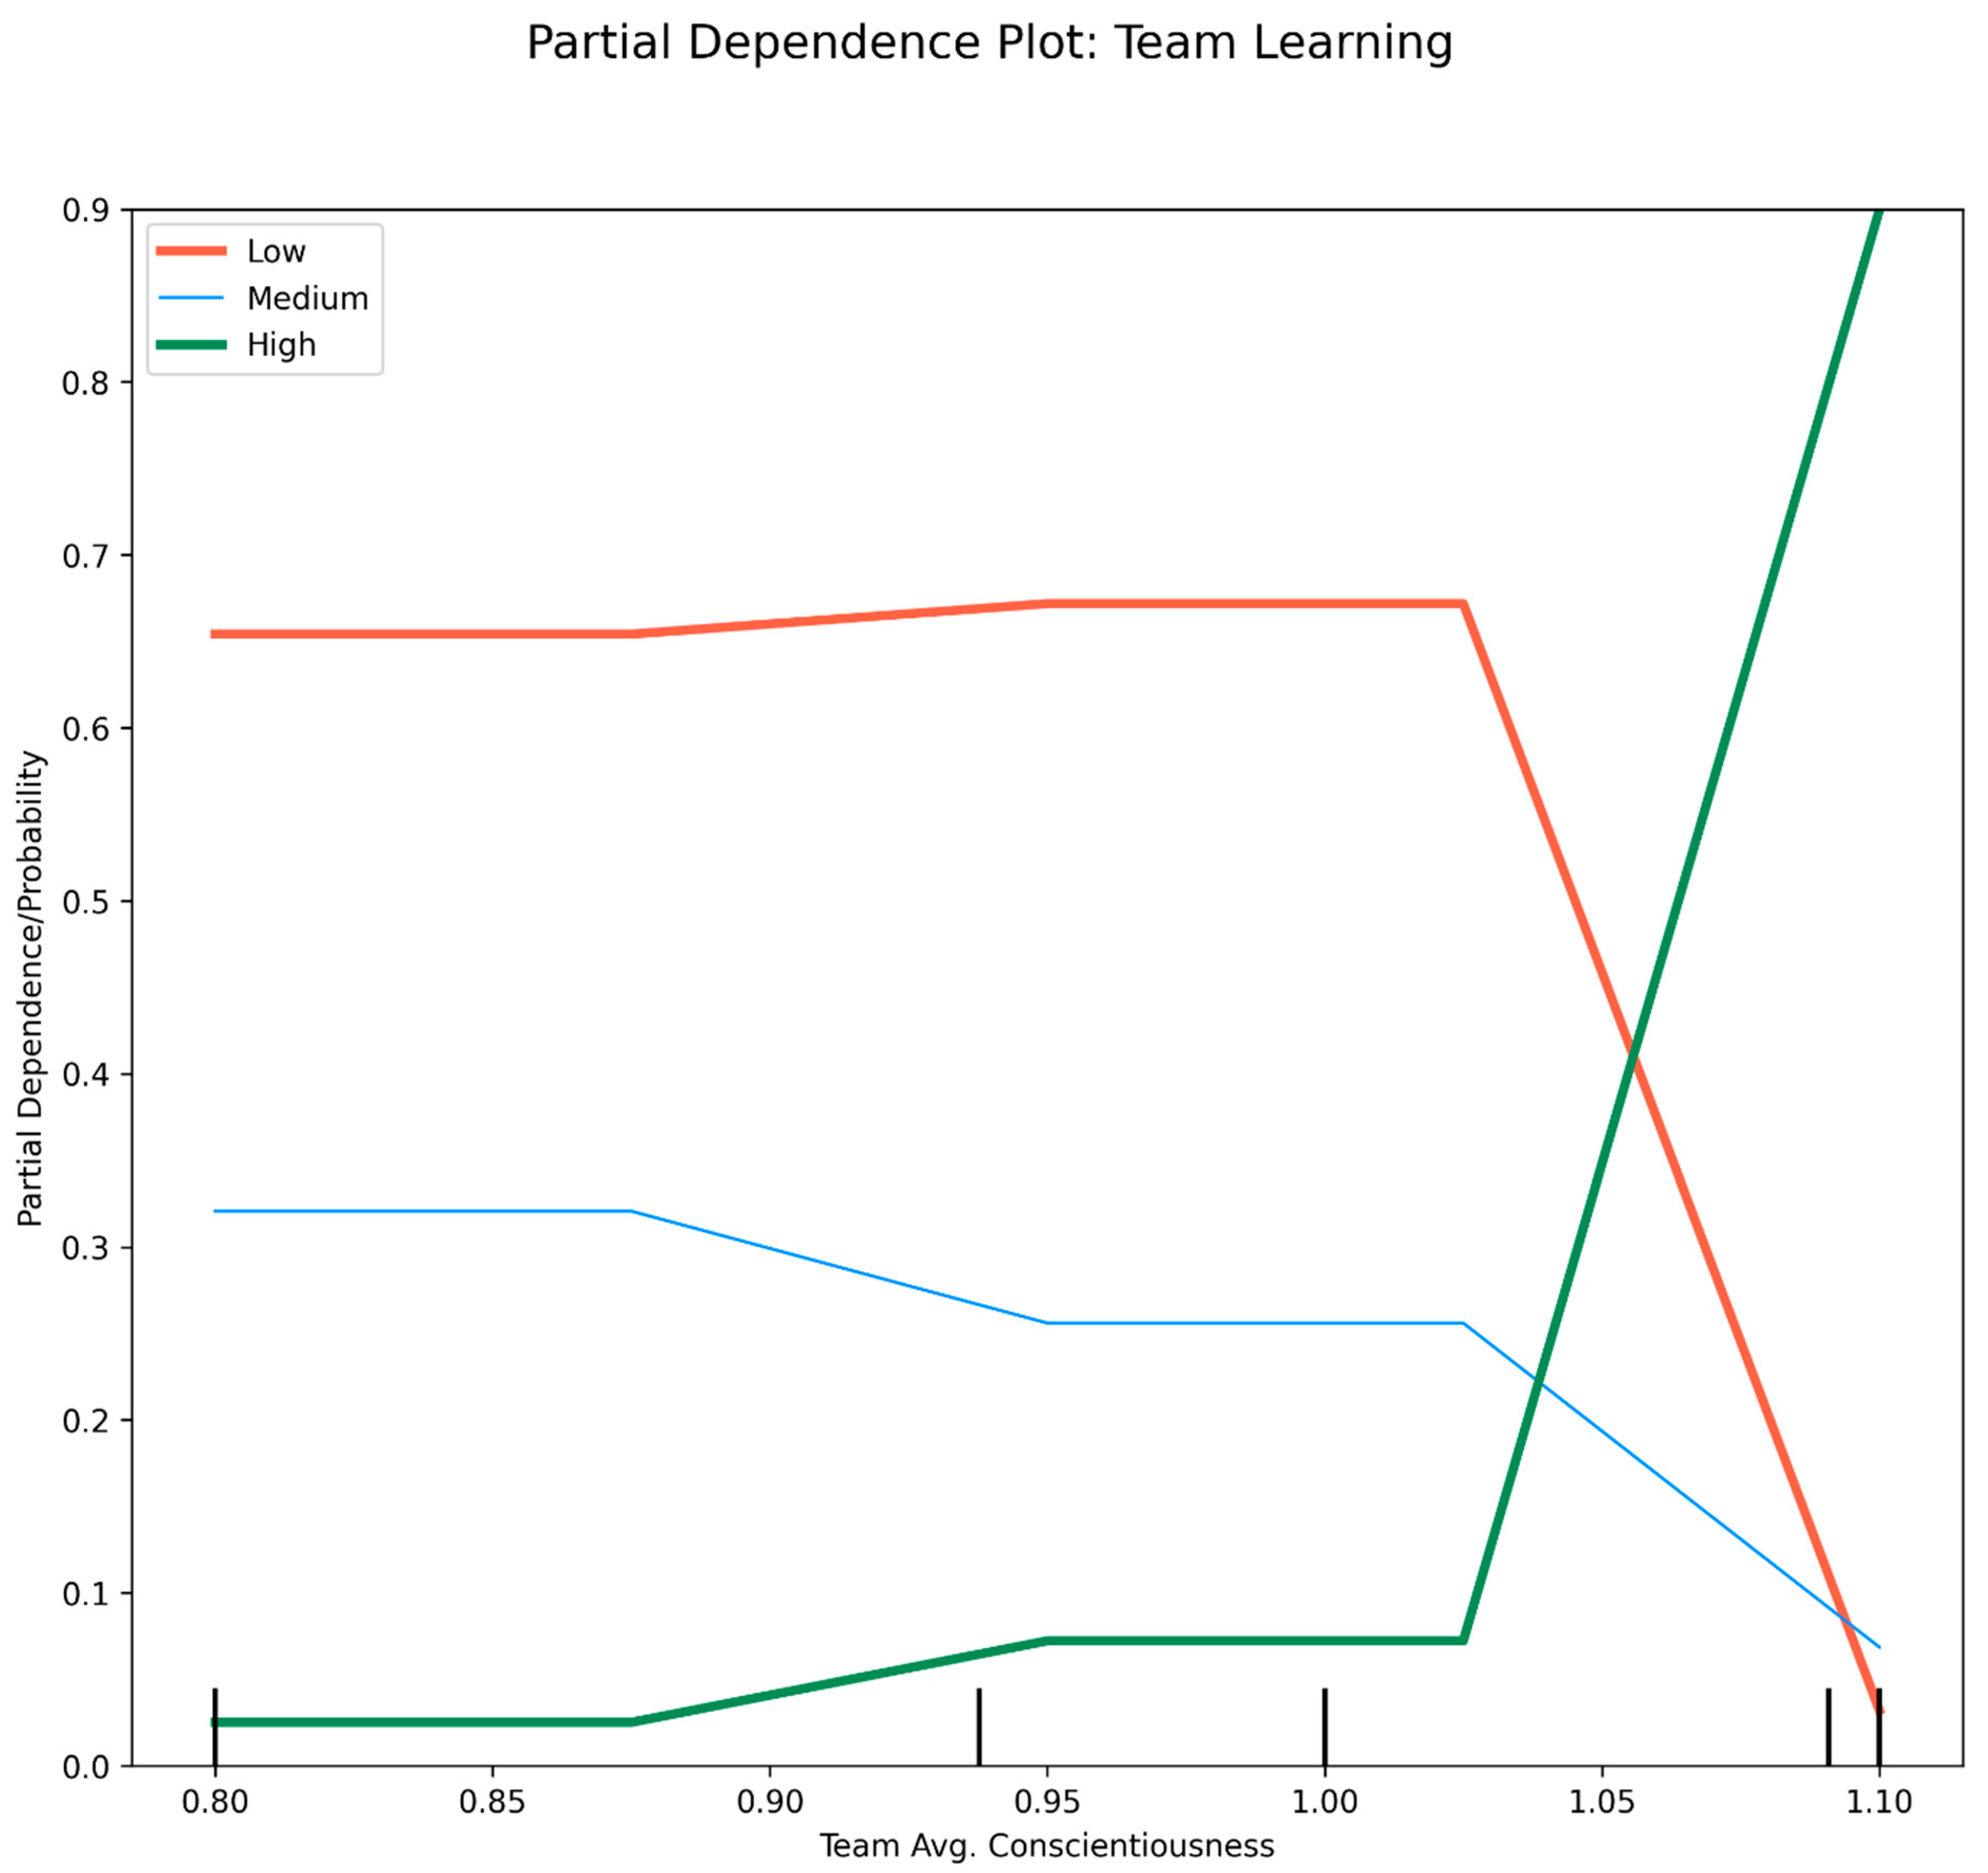
| Team Learning | Team Avg. Conscientiousness | 0.926 | 0.914 | 0.916 | 0.931 | 0.98 | 0.857 | 0.867 | 0.889 | 0.889 | 0.788 | 0.939 |
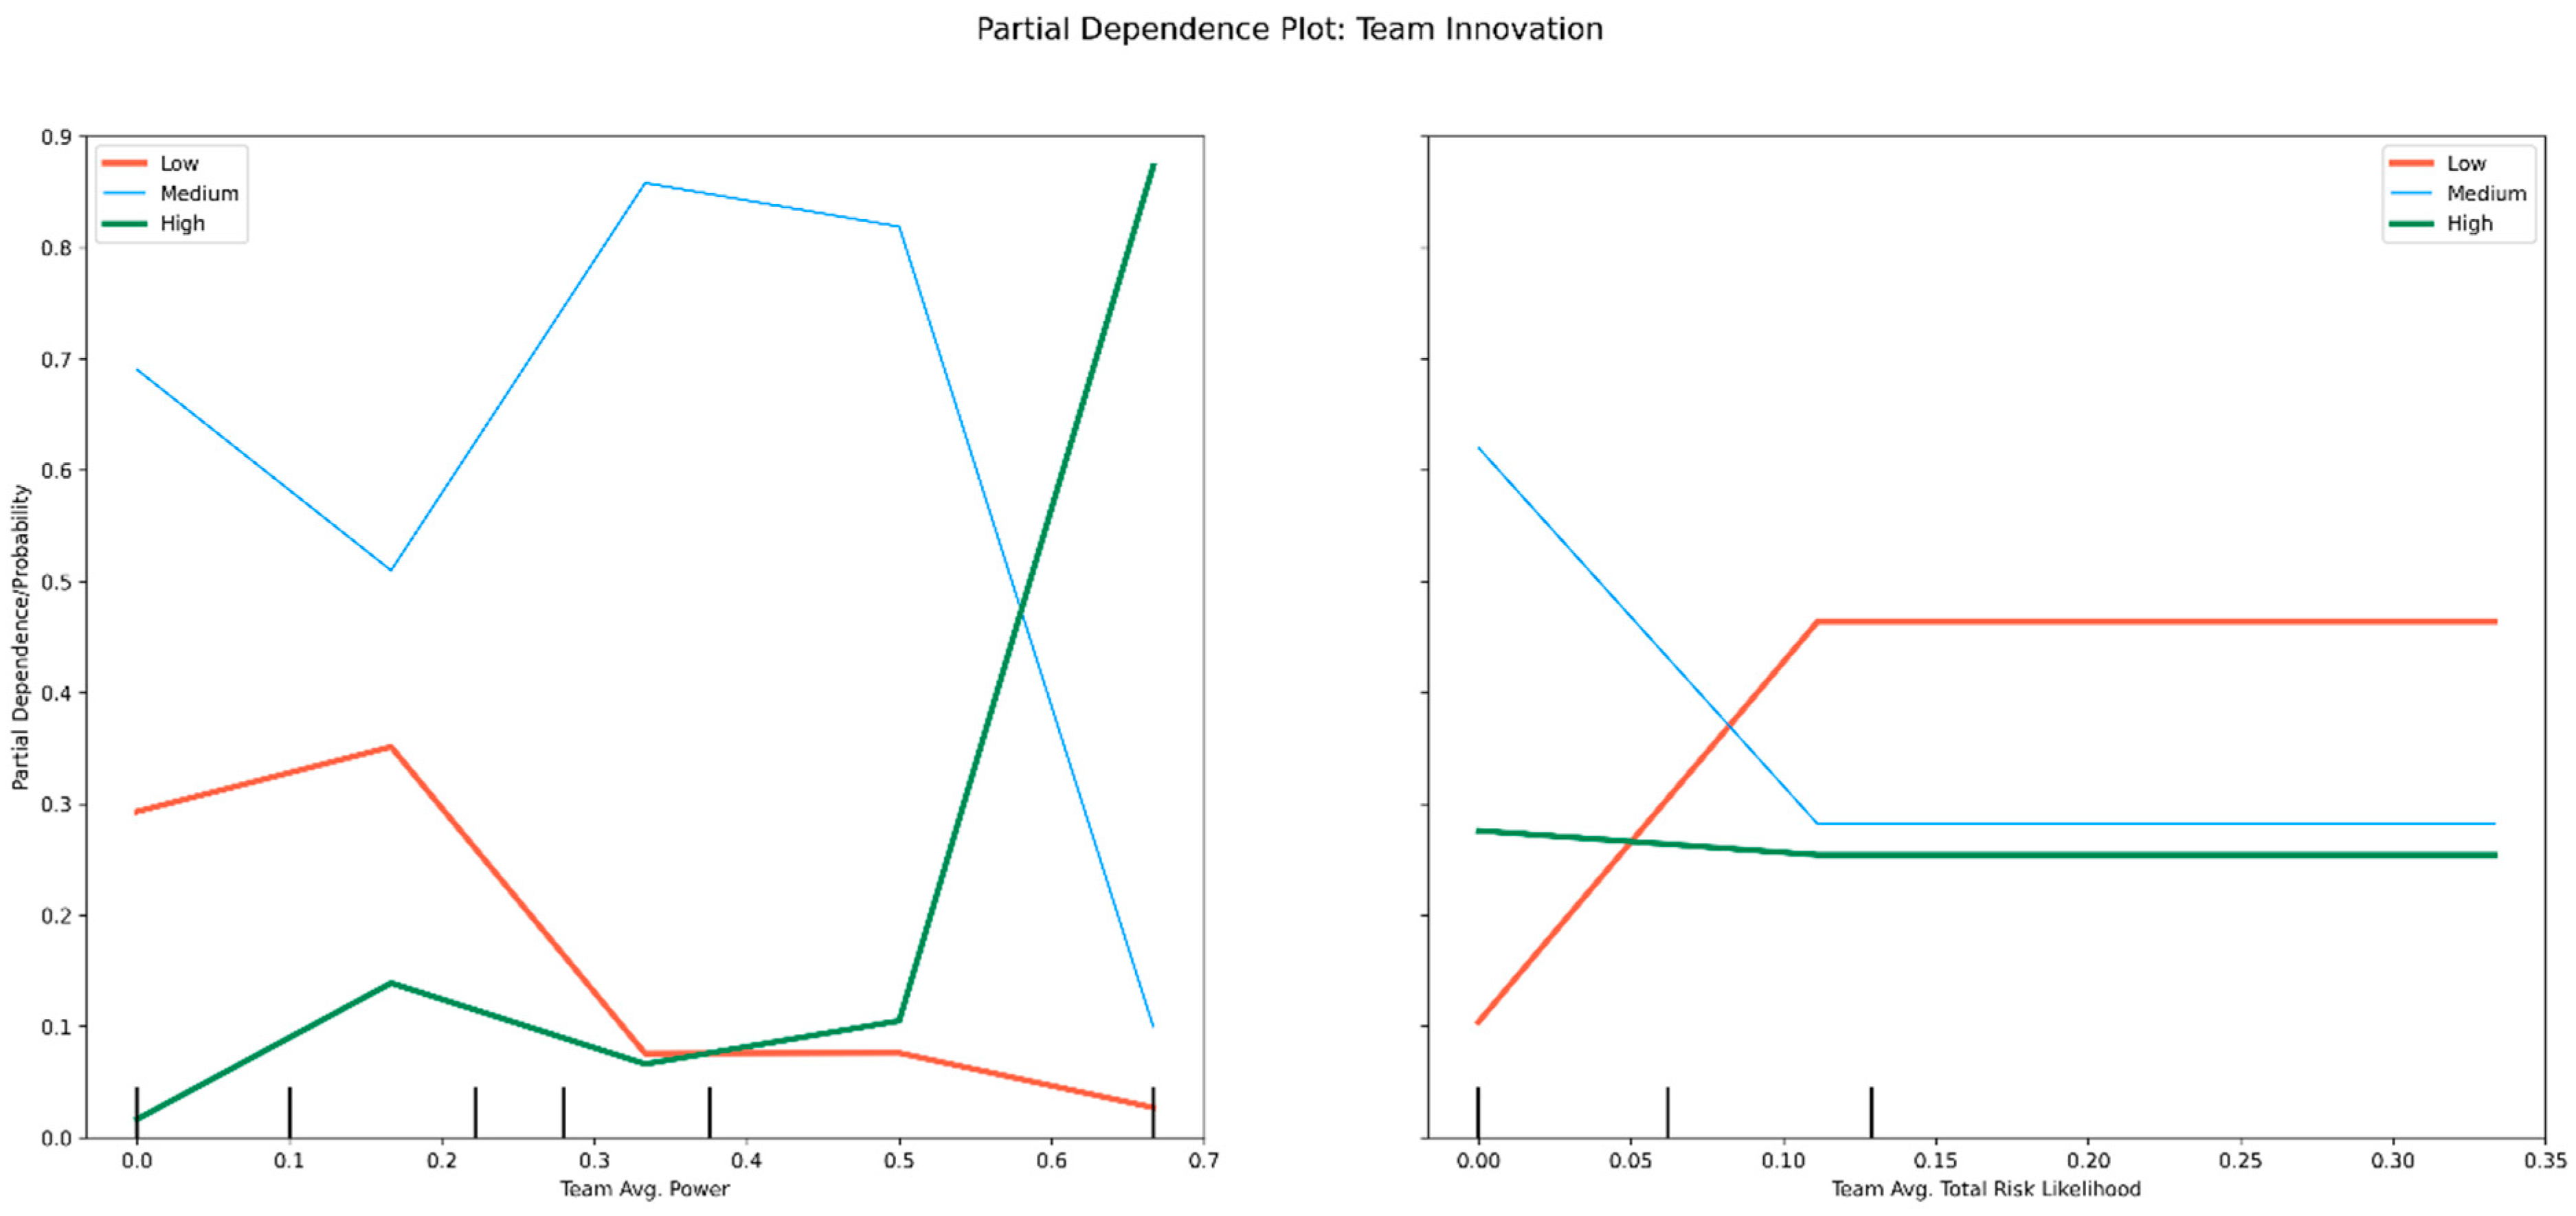
| Team Innovation | Team Avg. Power, Team Avg. Total Risk Likelihood | 0.83 | 0.809 | 0.852 | 0.86 | 0.969 | 0.857 | 0.852 | 0.933 | 0.833 | 0.731 | 0.969 |
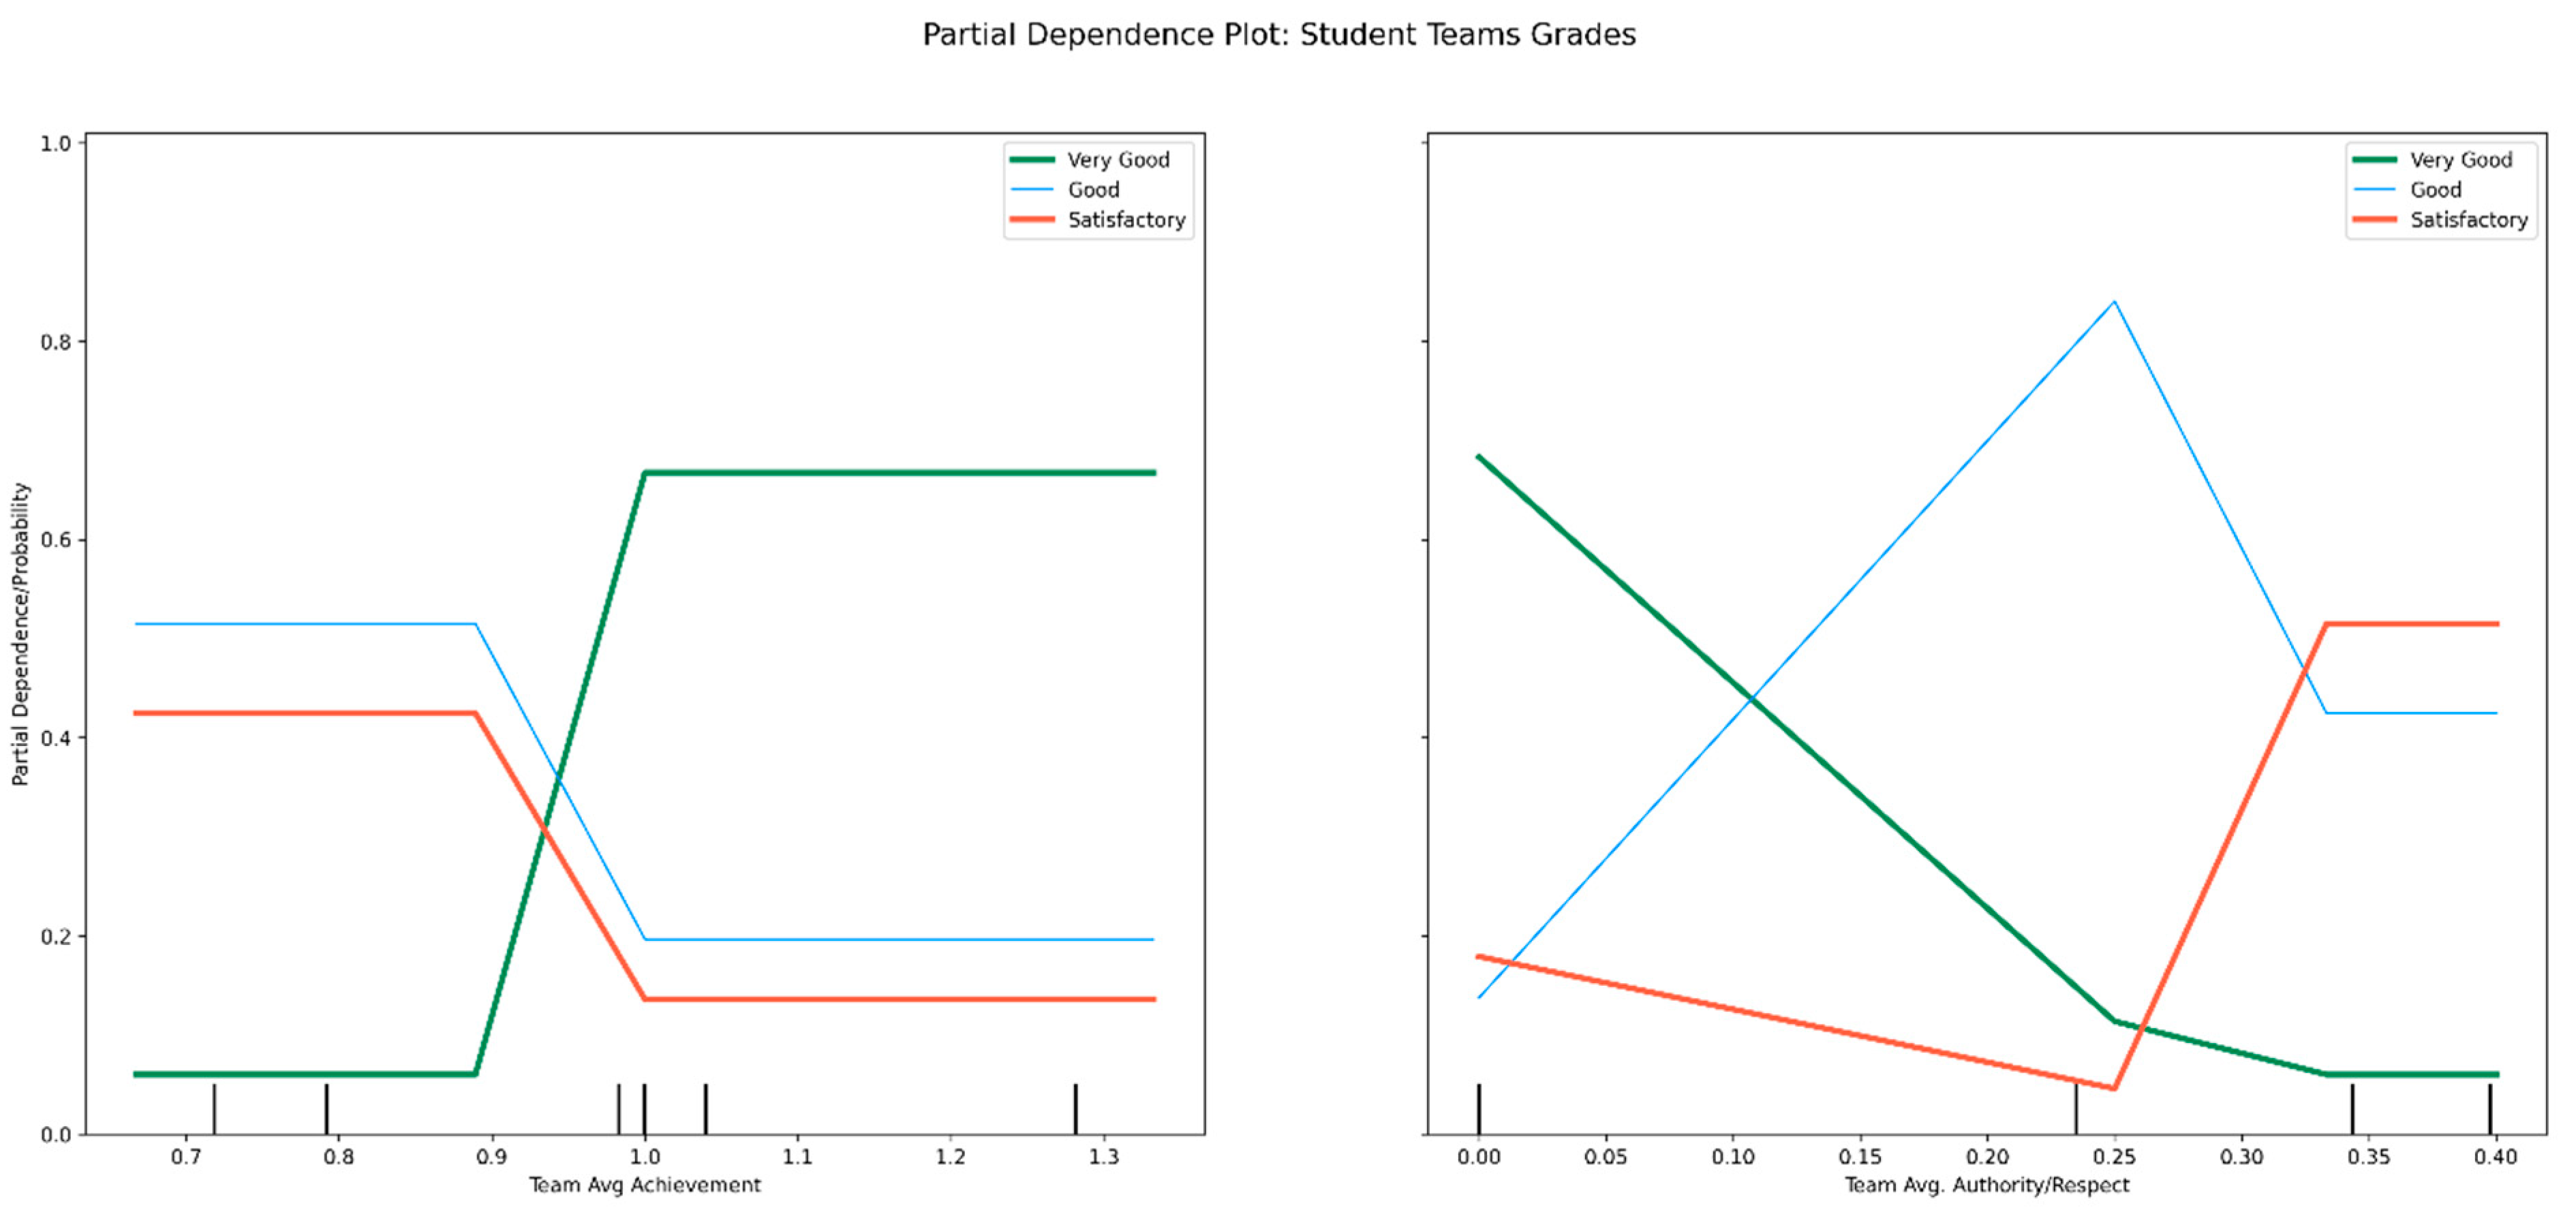
| Student Teams Grades | Team Avg. Achievement, Team Avg. Authority/Respect | 0.702 | 0.676 | 0.776 | 0.72 | 0.854 | 0.75 | 0.767 | 0.889 | 0.778 | 0.556 | 0.828 |
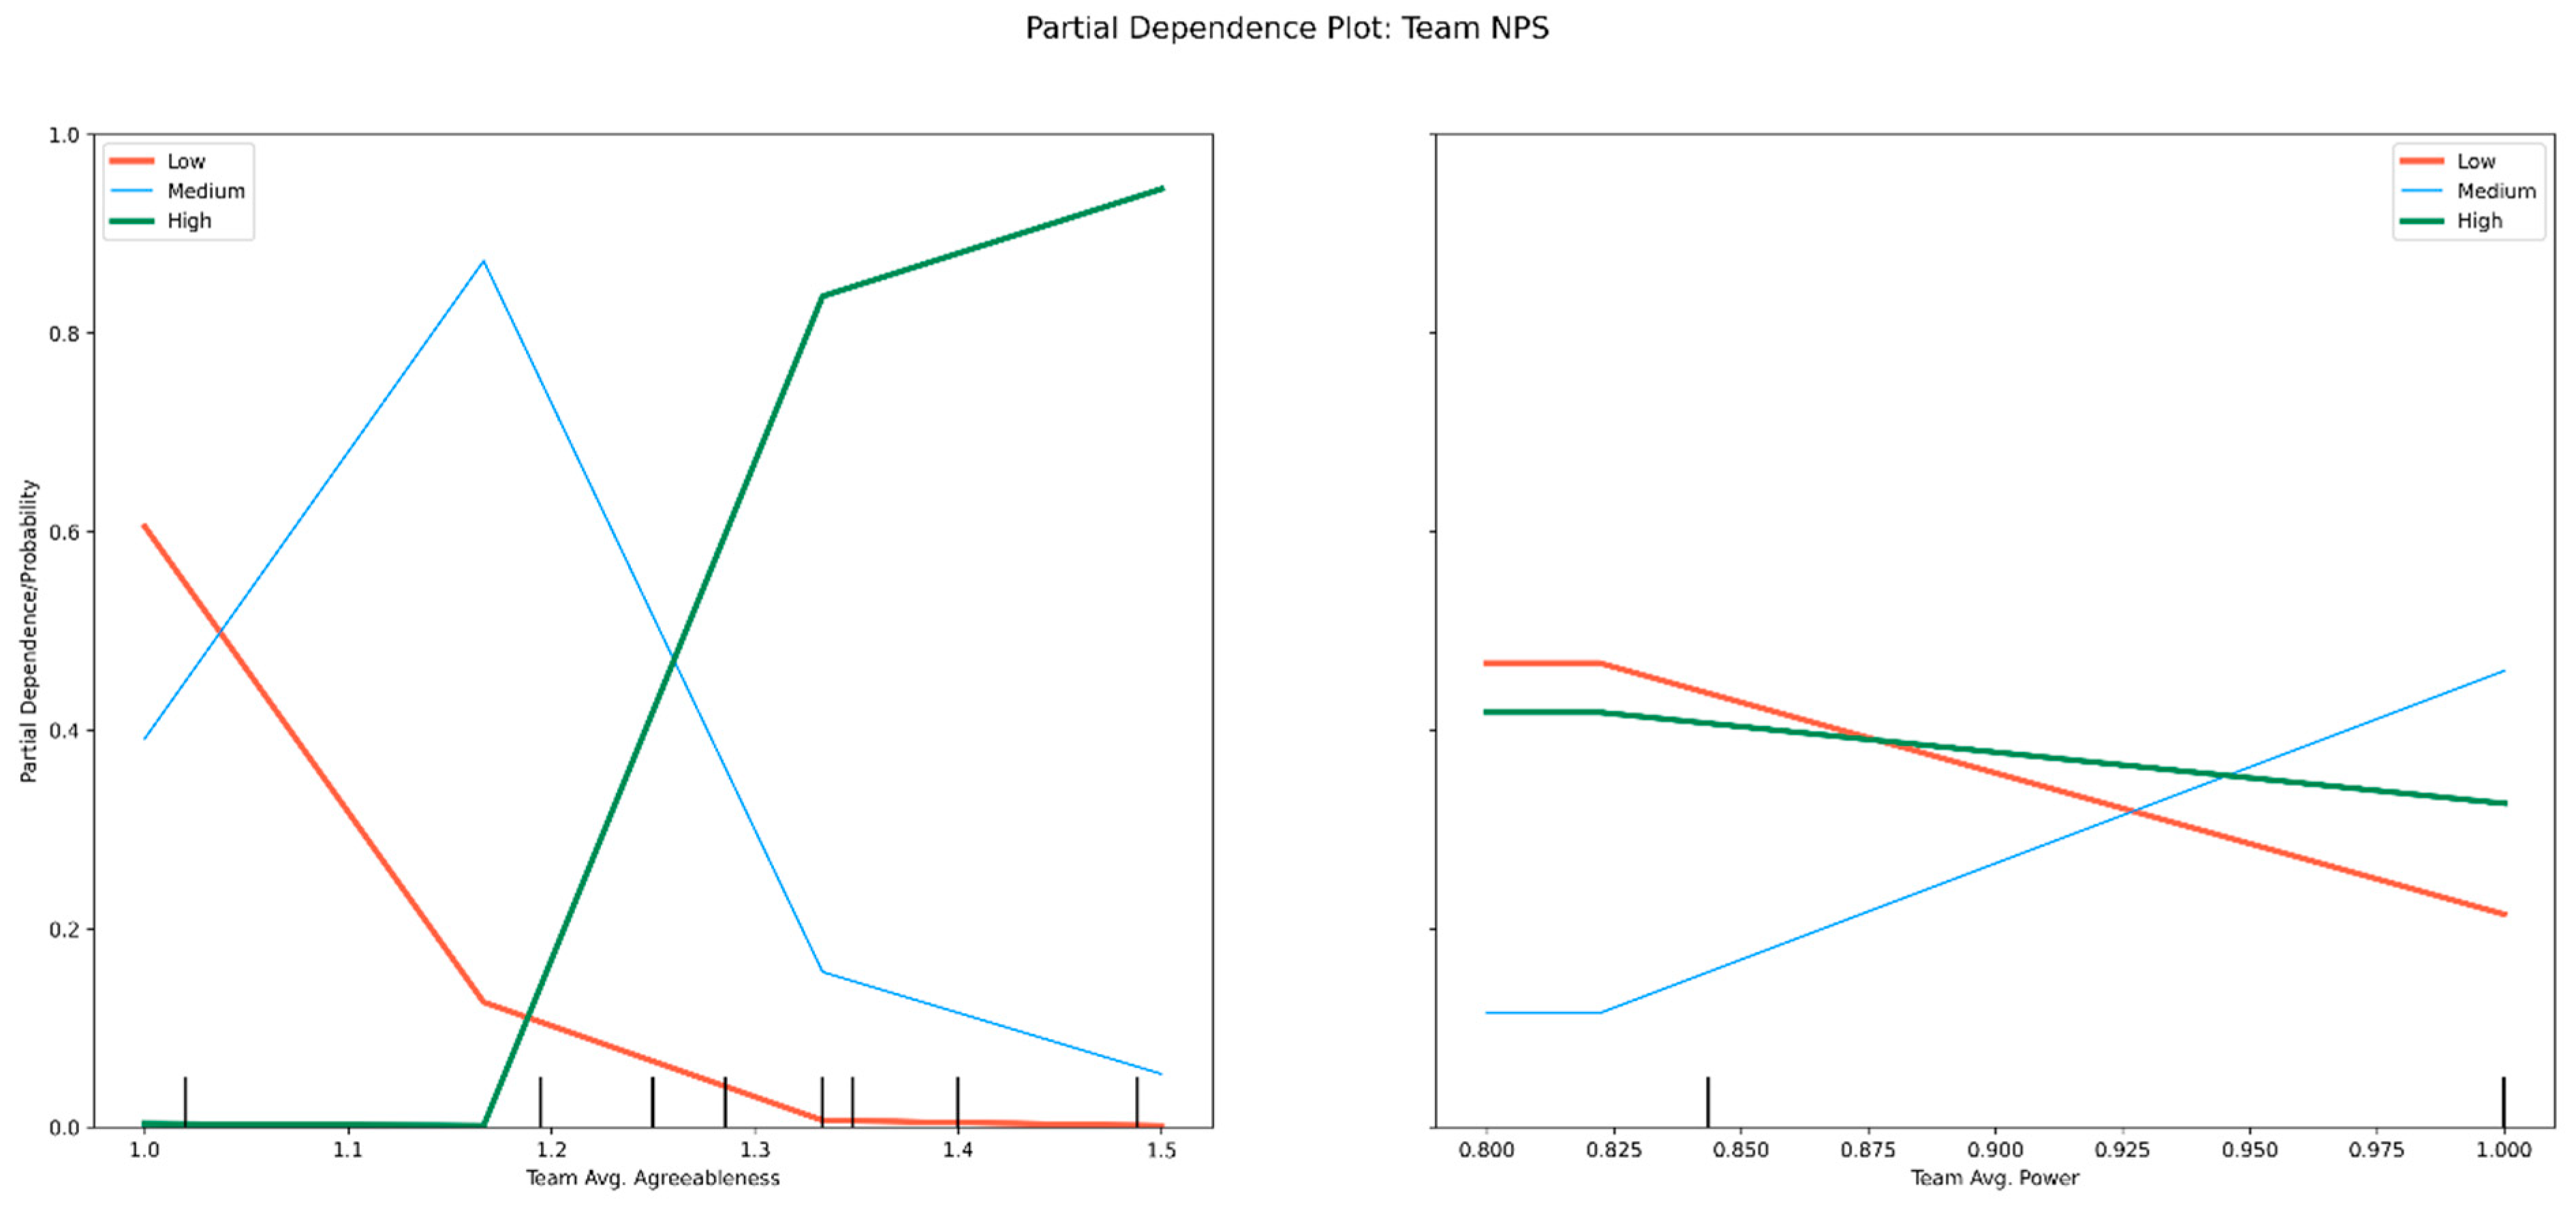
| Team NPS | Team Avg. Agreeableness, Team Avg. Power | 0.807 | 0.767 | 0.796 | 0.809 | 0.92 | 0.75 | 0.756 | 0.778 | 0.833 | 0.636 | 0.861 |
| First-Year Rating | Harm/Care, Total Risk Likelihood | 0.652 | 0.623 | 0.667 | 0.657 | 0.657 | 0.778 | 0.775 | 0.8 | 0.833 | 0.571 | 0.833 |
| Second-Year Rating | Harm/Care, Total Risk Likelihood | 0.66 | 0.619 | 0.677 | 0.653 | 0.653 | 0.778 | 0.75 | 0.75 | 0.857 | 0.526 | 0.857 |
Publisher’s Note: MDPI stays neutral with regard to jurisdictional claims in published maps and institutional affiliations. |
© 2022 by the authors. Licensee MDPI, Basel, Switzerland. This article is an open access article distributed under the terms and conditions of the Creative Commons Attribution (CC BY) license (https://creativecommons.org/licenses/by/4.0/).
Share and Cite
Altuntas, E.; Gloor, P.A.; Budner, P. Measuring Ethical Values with AI for Better Teamwork. Future Internet 2022, 14, 133. https://doi.org/10.3390/fi14050133
Altuntas E, Gloor PA, Budner P. Measuring Ethical Values with AI for Better Teamwork. Future Internet. 2022; 14(5):133. https://doi.org/10.3390/fi14050133
Chicago/Turabian StyleAltuntas, Erkin, Peter A. Gloor, and Pascal Budner. 2022. "Measuring Ethical Values with AI for Better Teamwork" Future Internet 14, no. 5: 133. https://doi.org/10.3390/fi14050133
APA StyleAltuntas, E., Gloor, P. A., & Budner, P. (2022). Measuring Ethical Values with AI for Better Teamwork. Future Internet, 14(5), 133. https://doi.org/10.3390/fi14050133