Article

ReSQoV: A Scalable Resource Allocation Model for QoS-Satisfied Cloud Services

by
Hassan Mahmood Khan
,
Fang-Fang Chua
* and
Timothy Tzen Vun Yap
Faculty of Computing and Informatics, Multimedia University, Cyberjaya 63100, Malaysia
*
Author to whom correspondence should be addressed.
Future Internet 2022, 14(5), 131; https://doi.org/10.3390/fi14050131
Submission received: 18 March 2022 / Revised: 16 April 2022 / Accepted: 19 April 2022 / Published: 26 April 2022

Abstract

:
Dynamic resource provisioning is made more accessible with cloud computing. Monitoring a running service is critical, and modifications are performed when specific criteria are exceeded. It is a standard practice to add or delete resources in such situations. We investigate the method to ensure the Quality of Service (QoS), estimate the required resources, and modify allotted resources depending on workload, serialization, and parallelism due to resources. This article focuses on cloud QoS violation remediation using resource planning and scaling. A Resource Quantified Scaling for QoS Violation (ReSQoV) model is proposed based on the Universal Scalability Law (USL), which provides cloud service capacity for specific workloads and generates a capacity model. ReSQoV considers the system overheads while allocating resources to maintain the agreed QoS. As the QoS violation detection decision is Probably Violation and Definitely Violation, the remedial action is triggered, and required resources are added to the virtual machine as vertical scaling. The scenarios emulate QoS parameters and their respective resource utilization for ReSQoV compared to policy-based resource allocation. The results show that after USLbased Quantified resource allocation, QoS is regained, and validation of the ReSQoV is performed through the statistical test ANOVA that shows the significant difference before and after implementation.

1. Introduction

In cloud computing, the issue of Quality of Service (QoS) is significant. Cloud service providers supply infrastructure for cloud applications to be hosted and accessed online via a subscription rather than being purchased and installed on individual computers. These hosted applications on the infrastructure are called Software as a Service (SaaS). In practice, it is challenging to ascertain the offered QoS as specified in Service Level Agreements (SLA). Cloud infrastructure contains resources that include storage, memory, processor, and bandwidth allocated to virtual machines (VM). In resource allocations to VM, there are many factors that influence optimum resource allocation. Service providers emphasize energy utility, profit generation, SLA, load balancing, and resource utilization. Cloud consumers focus on QoS, availability, service cost, and many other factors. Examination of the dynamics that influence the appropriate allocation of cloud resources from both the service provider and user viewpoints is challenging [1,2].
It is observed that the quantities of different resources in VMs are predefined, and the varieties of VMs are limited. However, consumer tasks and workloads vary, which necessitate various resource allocations. VMs cannot fulfill all types of customer demand, and consumers cannot wholly utilize all resources in a balanced manner [1,3]. A study by [4] presented an autonomous resource management approach that works to configure cloud-based applications and required cloud resources themselves. The presented professional approach to QoS management has the potential to self-heal through unexpected setbacks and performance issues. It focuses on QoS parameters in SLA, and resource management is conducted based on workload management. The QoS sensor detects a violation of QoS as a performance control, and the autonomous service manager works for scheduling tasks and managing resources. Typically, cloud auto-scaling solutions are built on reactive policy-based rules that scale-up or scale-down the resources when a particular metric changes. A fundamental challenge for cloud service providers is efficiently provisioning a diverse range of services on their physical infrastructure. They often provide quality of service assurances by enabling the number of VM instances to scale up or down to ensure that QoS requirements are satisfied. Numerous predictive and reactive techniques for dynamically distributing VMs to various services have been proposed [5,6,7,8].
Many approaches have been proposed for scalability and resource allocation using replication without considering the system’s performance overheads that include serialization (contention) and resource sharing delay (coherence). Such overheads cause a non-linear relationship between the resources and cloud QoS. It is an important aspect to consider these overheads while adapting the scalability mechanism to maintain QoS in the cloud environment. In this work, we have considered non-linearity, scalability, and performance overheads in our approach. An adaptive framework is proposed to monitor QoS parameters response time, throughput, and availability to verify compliance with the associated SLA and QoS agreed values. This paper presents a model that includes remedial action against possible violations of the QoS metrics. The proposed Resource Quantified Scaling for QoS Violation (ReSQoV) model is based on the Universal Scalability Law (USL), which considers scalability overheads and provides cloud service capacity for specific synthetic workloads and generates a capacity model as output. Contention and coherence are measured, and resource allocation in auto-scaling is triggered accordingly. ReSQoV has been validated using response time and availability scenarios that demonstrate remedial action in QoS violation scenarios. As the QoS violation detection decision is Probably Violation and Definitely Violation, the remedial action is initiated, and required resources are added to the virtual machine as vertical scaling.
Our contribution can be summarized as follows.
  • A QoS remediation model (ReSQoV) using response time and throughput parameters.
  • Cloud Service capacity model generation using Universal Scalability Law.
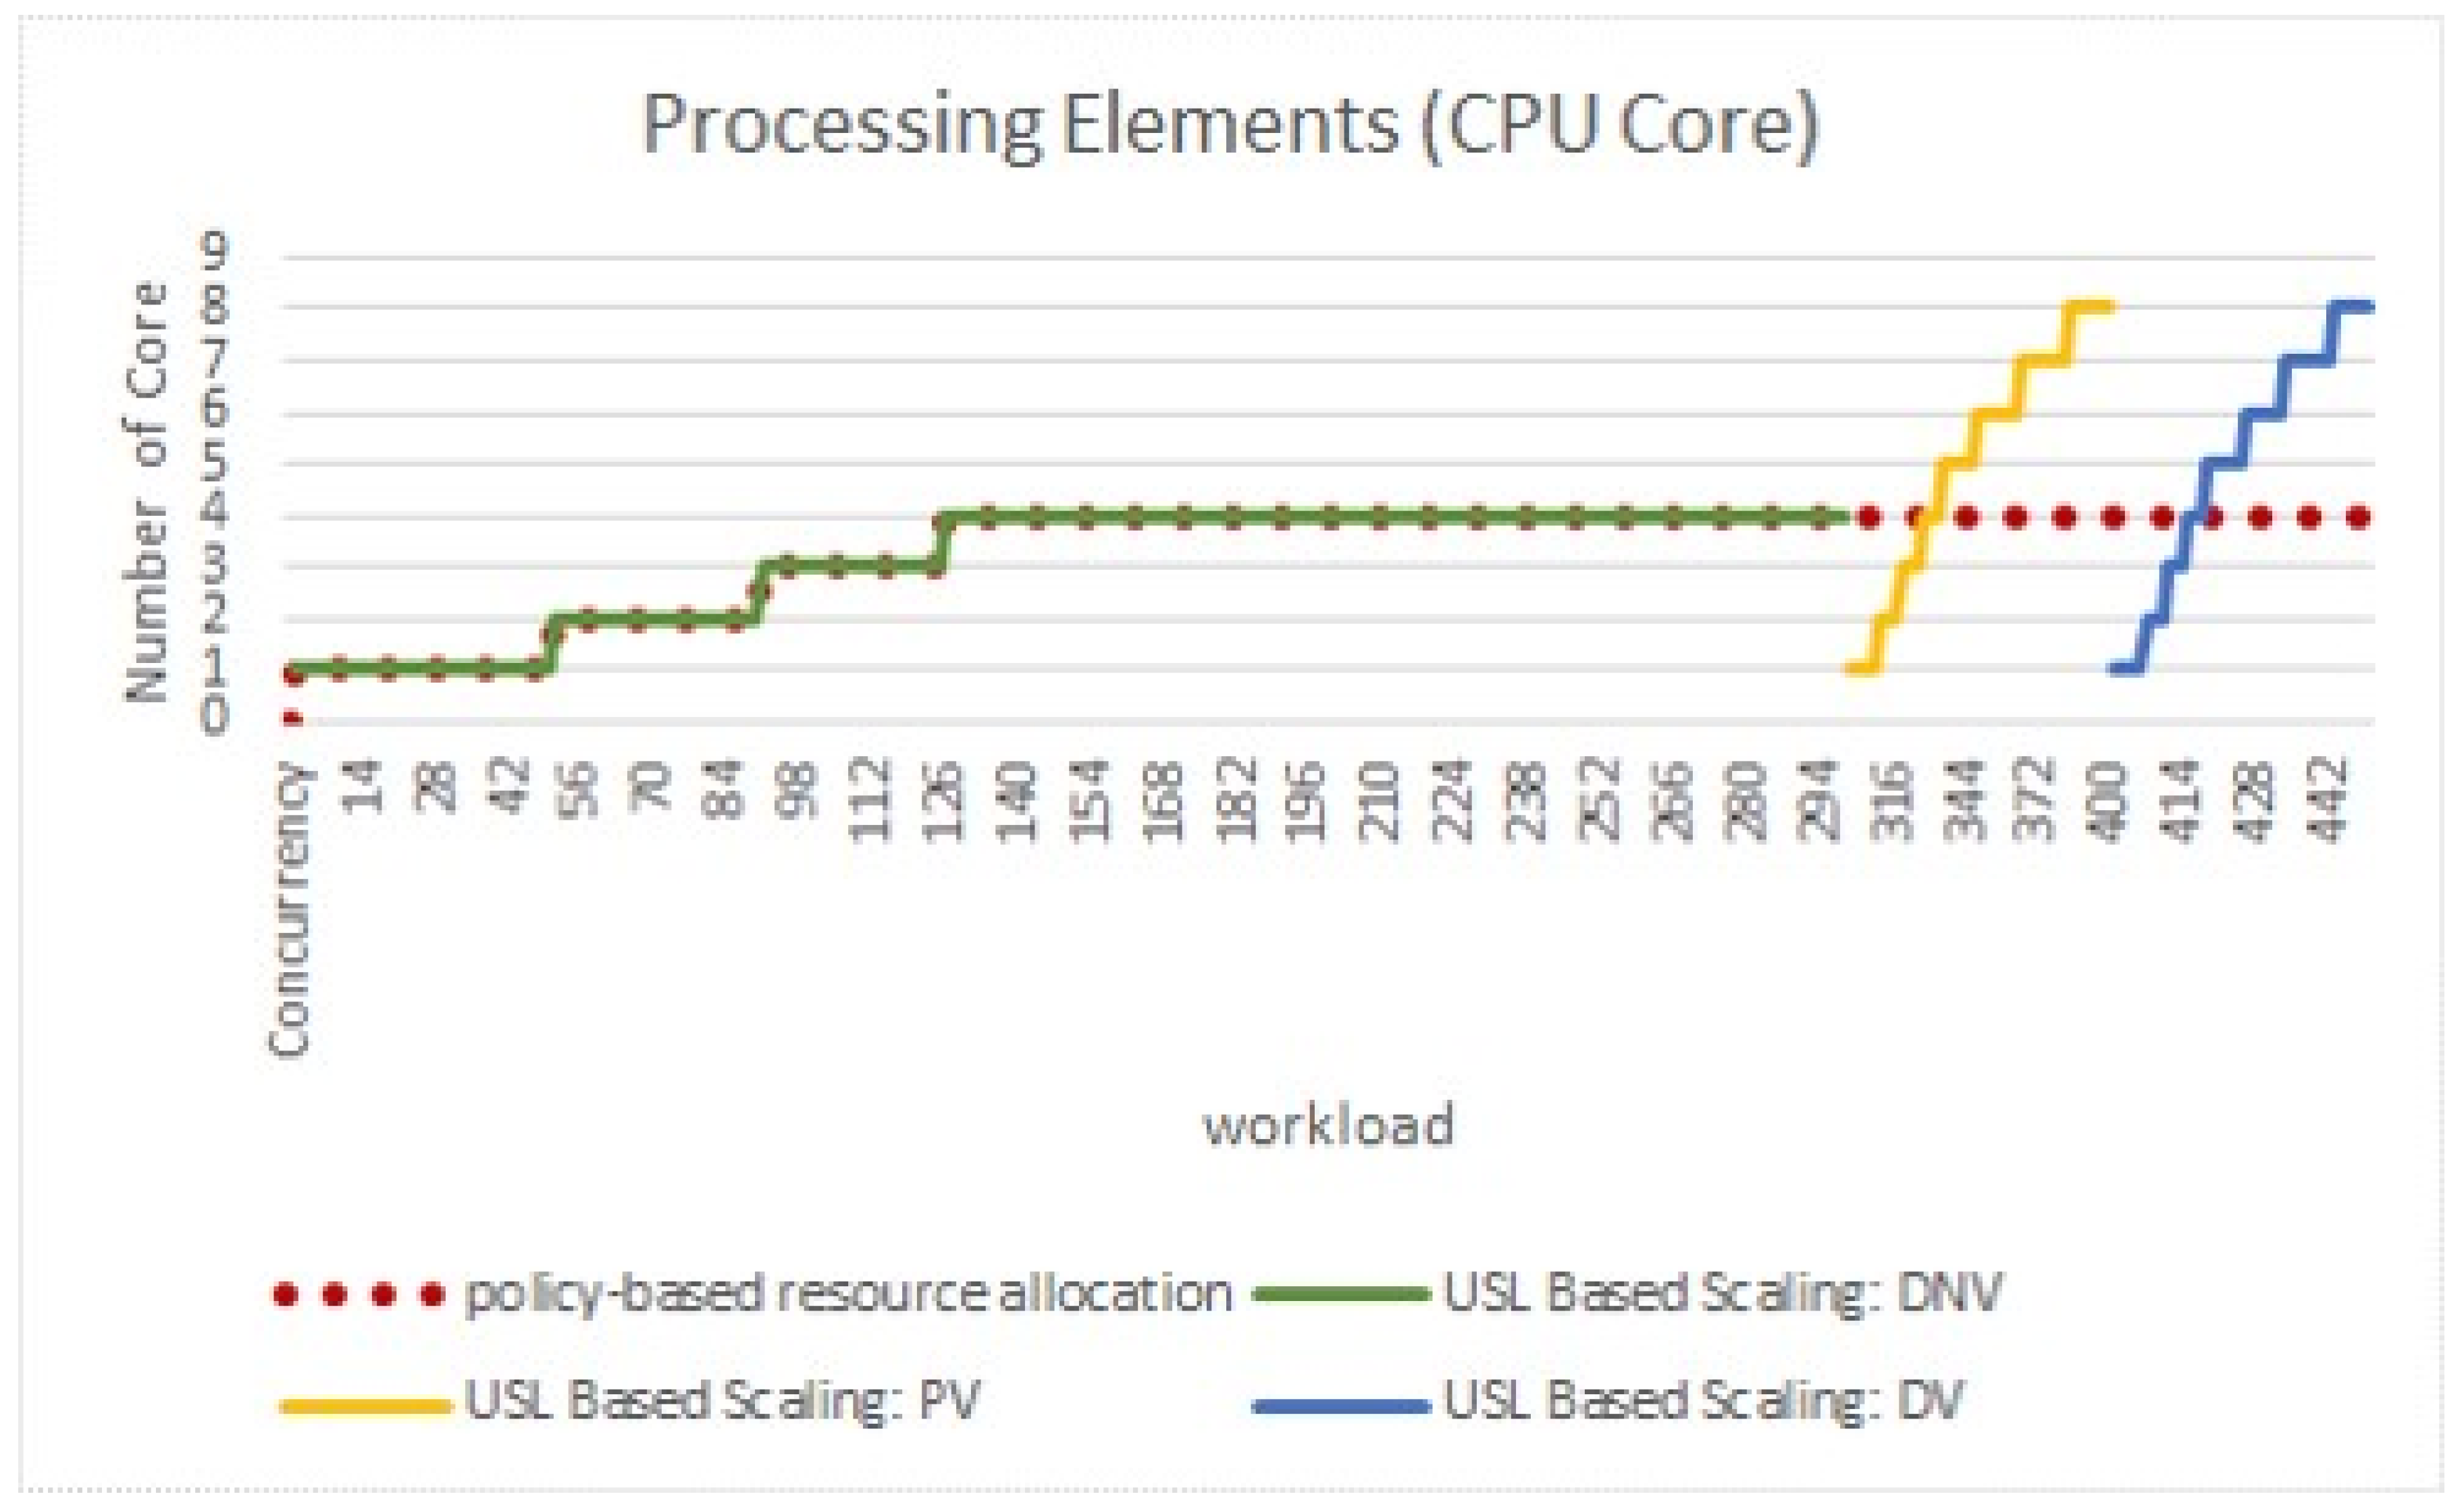
  • Demonstrate the better performance of the model through simulation and comparison with other policy-based resource allocations.
  • Validation of the Significance difference through the statistical test ANOVA.
The following sections comprise the paper: Section 2 discusses relevant works; in Section 3 the proposed approach is explained; Section 4 presents the experimental setup and scenarios for evaluating the proposed model, while Section 5 presents the performance results and evaluations.

2. Related Work

Platform scalability is characterized as a cloud platform’s capability to provision as many additional resources as an application desires or specific requests [9]. Application scalability implies that the platform maintains its performance as stipulated in the SLAs, even when its workload exceeds. The universal scalability law may be exploited to organize and measure the output of a system for a concurrent workload. The association concerning workload and cloud resources is non-linear due to resource requests and data access delays queuing. To maximize scalability, these variables should be measured and addressed. Therefore, scalability is the ability of the cloud service provider systems to handle requests, operations, or transactions from more users within a specified recurrent period. The scalability should be aligned with the cloud ‘resources’ provision time and performance. A significant aspect of cloud computing is able to forecast potential consumer requests and associated cloud resource provision requirements.
Furthermore, it is necessary to have a dynamic and fluctuating user load mechanism that ensures the accepted QoS and efficiency. Researchers showed how vital resource prediction is in maintaining QoS [9]. An adaptive structure for the workload prediction is provided in another study [10]. The resource usage prediction work combines machine learning clustering with stochastic theory. The research in [11] provides a workload prediction model for automated resource provision centered on the ‘server’s prior use history and the ‘study’s central goal is to reduce power usage in virtualized environments and allied networks. A study by Ref. [12] examines an online auction-based system for a cloud-based virtual machine, CPU, and storage resource allocation. The proposed prediction technique emphasizes service availability, placement, and resource updates according to cloud consumer requirements. The system calculates costs for users and resource usage based on the services needed. In [13], the researchers devised an algorithm for reserving cloud resources that takes the SLA into account. Firstly, it tests the availability of required resources to assign to the user locally. It examines the allocation of the projected reserved resource if the workload increases or if the resource is unavailable. Dynamic resource allocation is an essential feature of cloud computing that matches cloud resource distribution based on cloud ‘customers’ desire for QoS maintenance, including service availability, fault tolerance, reaction time, service dependability, and throughput [14].
MQLB-RAM [15], which stands for Multi-QoS Load Balance Resource Allocation Method, is presented to allocate resources and load balancing. The MQLB-RAM operates as follows: step (1) it selects and finds outs the multiple dimension QoS, in which the customer utilized the pay-per-use services and QoS parameters containing the memory size, processing speed of CPU, and storage size, and; (2) it deals with the resource scheduling problems as well as reduce the cost in terms of both CPU and operations cost. The use of resources is focused on historical data from VMs on resource allocation and utilization, power use, and workload effects in [16]. Algorithms that account for operational expenses to decrease SLA breaches are also mentioned. The presented algorithms also demonstrate a trade-off between service performance and energy usage. The proposed resource allocation approach is tested on the first-come first-serve basis on the CloudSim [17] simulator, and the results of the experiments satisfied the utilized resource and cost ratio [16].
Related Work comparison on cloud scalability and resource provisioning techniques is shown in Table 1. A MAPE-k control loop-based autonomous resource provisioning solution for fog-based IoT applications was presented. It uses a mix of time series prediction models and Bayesian learning-based techniques to analyze and design the MAPE-k control loop. Researchers created a three-tier resource provisioning strategy for a fog environment. The solution’s efficiency was tested on two simulated and real-world workloads. Cost, resource usage, and delay violation measures were significantly improved over alternative techniques [18]. In another study [19], in a cloud environment, a framework autonomously manages the data center resources. Using the ANFIS workload prediction model, FA can reliably forecast future game demands. It adjusts a prediction model’s parameter based on the latest measured workloads. Then, utilizing a fuzzy decision tree approach as a decision maker, improved the planner component’s performance. The performance of the analyzer component and the overall performance of the autonomic resource provisioning approach are evaluated and compared. The experiment used both real and synthetic workloads to validate the evaluations. The ANFIS prediction model’s findings and the experimental data demonstrate a strong correlation. ANFIS’s developed model has a high coefficient of determination and a low coefficient for other criteria, indicating an excellent fit to the data and excellent prediction ability. The proposed approach reduces resource rental costs for the MMOG provider while meeting player QoS requirements, especially response time.
The authors [20] offer an autonomous resource provisioning strategy. Using an RBF neural network to forecast user behavior generated a technique that is aware of past, present, and future fluctuations. While ensuring QoS, the suggested approach leveraged providence to minimize resource provisioning costs (50%) and prevent hasty judgments (70%) while increasing load resistance (42%). The authors also covered how to choose excess VM. As such, the cost-aware algorithm alone saved 1%. The suggested technique is also flexible and customizable. The ASP may utilize the flexibility feature to adjust the mechanism’s performance for his gain or to boost end-user satisfaction. Its capability allows ASPs without a resource management specialization to apply their policy risk Lesley on resource capacity. Unlike other mechanisms, the mechanism tended to the ASP and eventual user’s demands efficiently and equitably. The researchers presented a model [21] that predicts the cloud resource bundle using real workload and resource demand data; a maximum probability probabilistic model that predicts resource selection. The suggested OKNB model outperformed the GMP-SVM model by 3.15–8.04% on res, cpu, and mem model, respectively. The suggested model reduces waiting time by 16.83–58.5 s when applied to the cloud selection technique simulated on CloudSim. It also addressed the weighted probabilistic cloud service selection approach that uses resource bundle weights. As the cloud is elastic, it can manage changing workloads and their consumption. The researchers [22] presented resource provisioning for cloud applications using workload clustering. Their method combined BBO with K-means clustering to split cloud workloads based on QoS requirements. The Bayesian learning approach was used to identify resource provisioning activities that fulfill user QoS criteria. The suggested method decreases time, SLA violation ratio, cost, and energy use compared to current resource provisioning systems.
Autonomous and smart systems are desired with high precision and accuracy in cloud capacity management resource allocation and provision domains. As a result, study [23] presented a resource strategy based on cloud service ‘providers’ smart agents and cloud user services. With a minimum commitment to VMs, the strategy stresses low-cost maximum resource usage and QoS guarantee. The classic Best Fit algorithm gives service providers and users the best cost and VM-placement ratio. The suggested approach also specifies the optimal VM resource allocation, flexibility, scalability, and dependability in data centers regarding performance and energy consumption. A neural network is employed in a study [24] to find the optimal and proper platform for hosting virtual machines. The primary information for the predictor is resource information and recipient load. The neural network predicts potential workload and resource requirements from past data and system resource details. It lets the VM allocator correctly select the appropriate virtual machine. Using Ant Colony Optimization, the resource-efficient distribution, use, and management are described [24]. It meets the criteria of employing a suggested algorithm that predicts existing resources and forecasts future resource requirements.
Table 1. Survey of studies related to Cloud Scalability and resource provisioning techniques.
ReferenceTechnique UsedEvaluation MetricsWorkload DatasetVirtualizationEnvironmentAuto-Scaling Strategy
M. Etemadi [18]Bayesian learningCPU utilization, costrea
world IoT workload trace
VMFogProactive
M. Ghobaei [19]ANFISResponse Time, Costsynthetic workloadsVMsCloudProactive
M.S. Aslanpour [20]Radial basis function neural network (RBFNN)Response Time, SLA Violations CostWeb server workload HPVMCloudReactive
N. Chauhan [21]Naive bayesCPU utilization, response time, and memory utilizationreal-time workloadVMCloudReactive
M. Ghobaei [22]biogeography-based optimization (BBO), K-means, Bayesian learningSLA violation ratio, cost, energy consumptionClustering workloadVMCloudProactive
S. Agarwal [25]Naïve Bayes (NB) and Random Forest (RF)Memory, CPU usageGoogle’s cluster trace datasetVMSOAReactive
M. Hani [26]Support Vector Regression modelAvailability,
response time, and throughput
Private Cloud datasetVMCloudReactive
R. Hemmet [27]Naive Bayes and Random Forest Models availability, throughput, response timeGoogle clusterVMCloudReactive
The work in Reference [28] showed resource management and scalability as possible remedial measures for QoS violations. One of the most essential modern cloud computing research objectives is managing and allocating resources effectively to prevent Quality of Service (QoS) violations. Consequently, several researchers have suggested strategies in the cloud setting that discuss the question of QoS breach. Many of these studies describe scalability in terms of workload and machine resource allocation.
Scalability is critically relevant to the system’s increased workload and cloud resource allocation. Scalability may be defined by available resources and how applications or services handle data flow, according to Ref. [28]. Improper data flow management can result in resources under-provisioning, leading to long response times or low throughput, or resource over-provisioning, resulting in high expenses and low resource utilization. There are two types of scalability. Horizontal scaling controls computational nodes to the system that includes replication of virtual machines. In contrast, vertical scaling manages to add more computing resources to an existing virtual machine. Several studies have focused on resource management based on user load or instruction workload estimates. The relation between both workload and resource is non-linear, however, if several concurrent users use cloud services, the serialization issue and the delay in accessing data will occur. The system then predicts the actual resource requirements for various operations and transactions. As a result, research focuses on the required resources while considering factors that influence the workload ratio of the resources.

3. Proposed Approach

3.1. Scalable Resource Allocation

Cloud resources are expensive, and identifying QoS violations is essential to assist the cloud administrator in monitoring the virtualized environment cloud application’s potential violations. QoS violation detection can be performed using the “Adaptive Neuro-Fuzzy Inference System” (ANFIS) using fuzzy-if-then rules Ref. [29]. If the decision for QoS violation detection is “Normal” (N) or “Definitely No Violation” (DNV), then resource scaling is not essential. The “Probably Violation” (PV) decision is a warning to signal the system that it would need system check and resource modification to return the system to normal condition. The “Definitely Violation” (DV) decision triggers the allocation of resources to VM. The amount of resource allocation depends on the framework configuration, and the metrics being tracked are decided at SLA. Further resource allocation is based on resource monitored logs, VM and Software status, and monitoring parameters. For example, a continuous decision stream that indicates ‘normal’ response time but ‘low’ throughput will indicate the need for increased cloud resources to maintain QoS in the normal state.
ReSQoV emphasizes VM vertical scalability for cloud application QoS violation using the “Universal Scalability Law (USL),” which offers a formal definition of scalability as well as a conceptual framework for comprehending, assessing, comparing, and improving it. It accomplishes this by simulating the effects of crosstalk-induced linear speedup, contention delay, and coherency delay reference [30]. Equation (1) presents the USL with variables.
C c s w = U 1 + σ U 1 + λ U U 1
where C(csw) denotes cloud computing scalability, U denotes system resource load, and σ is the contention-delay parameter characterizing the waiting and queuing of shared resources. The coherence-delay parameter λ represents the penalty for keeping shared writable data consistent. As a result, the scalability efficiency is affected by the values of σ and λ.
The parameter values are 0 < σ, λ < 1. Yet if λ = 0, then (1) is transformed as follows
C c s w = U 1 + σ U 1
Coherence is equal to or near zero, as indicated in (2), which excites enhanced scalability, the primary purpose of a scalable architecture design. When the QoS decision is PV or DV, our proposed approach seeks to scale-up resources to VM to maintain the QoS metrics for all process nodes. The system or application has a greater demand for process nodes in these phases, necessitating the provision of extra resources to the virtual machine. It is in line with Equation (1), where machine resources are proportionate, and with the number of processes. Furthermore, Equation (2) indicates that when contention and coherence are null in an ideal scenario, the process node is optimized to its best QoS, resulting in linear scalability. As consistency is defined as the exchange of data across non-local resources, it is most likely to decrease coherence (λ) to zero, where each process node only works with a single resource.
There is nearly always some efficiency loss in the real world, and if the reason for this loss can be figured out, remediation is possible. The real-world systems lag behind linear scalability a little and display retrograde scalability at some point. When we calculate this overhead, we discover a significant efficiency loss. Linearity is best thought of as a ratio of the system’s performance at a size of one. Neil Gunther [31] refers to this as efficiency. If a single node produces 1800 transactions per second, then four nodes should yield 7200 transactions per second. That would be completely efficient. If the system loses a little efficiency with each node and four nodes producing 6500 transactions per second, then the system is around 90% efficient. Figure 1a demonstrates that both λ and σ are zero so as to achieve linear scalability or maximum efficiency. Figure 1b indicates λ is zero, while σ is more significant than zero, which leads to non-linear scalability or some efficiency loss.
Cloud applications transactions are relatively small and independent, ideally working in parallelism on multi-core cloud infrastructure. The capacity function C(p) is throughput achieved using p-cores Xp, relative to throughput on a single-core X1. Ideally, the scale-up capacity is given by the ratio
C p = X p X 1
Suppose single-core performs operations at 100% utilization (i.e., no Contention and coherence-delay) and completes N1 transactions with response time T1. The single-core throughput is as follows
X 1 = N 1 T 1
The effect of scale-up on response time means that, while double the size of the workload and twice the number of Pes, the dual-cores capacity is expected to be twice the value.
C 2 = 2 C 1  
However, from the contention σ and coherence-delay (λ), and from the measurements on real multi-core systems, it can be seen that the dual-core processor performs transactions slightly less than 2N1 in time T1. I suppose that the increase in response time alpha ( α ) for the multi-core is some fraction σT1 of the single-core response time: following Figure 2 shows that in multi-core processors additional time added for coherence delay, contention and serialization that doesn’t exist in single-core processor.
T 2 = T 1 + α T 1  
Since the dual-core time T2 is longer than T1, it will impact throughput and be less than expected. The following equations derive the explicit dual-processor throughput.
X 1 = N 2 T 2
X 2 = 2 C 1 T 1 + α T 1
X 2 = C 1 T 1   2 1 + α
Which is simplified as
X 2 = 2   X 1 1 + α
It proves that for any nonzero value of α , the dual-core throughput capacity is less than twice that of the single-core system. Assuming that α is only 4% of T 1 , then the dual-core processor scale-up capacity C   2 = X 2 / X 1   is only 1.92 of the capacity of the single-core. Consequently, if a single-core is capable of 100 transactions/sec, the dual-core will accomplish 192 transactions/sec instead of 200 transactions/sec as the expected result of naive parallelism. By expending the argument analogy with (11), the four-core response time increases each time for every core increment α T1
T 4 = T 1 + α T 1 + α T 1 + α T 1 = T 1 + 3   α T 1
So the corresponding throughput for X4 would be
X 4 = 4   X 1 1 + 3   α  
By generalizing Equation (13), the throughput for a p-core system would be as follows
X p = p C 1 T 1 + p 1   α T 1
X p = p X 1 1 + α p 1
And the p-core scale-up is derived as
C p = p 1 + α p 1
It is, therefore, possible to evaluate the optimum scalability by using Equation (2) by adjusting the values of contention and coherence presented in Equation (16). However, the viability of the USL method are detailed in section three onwards, after the identification and resource allocation processes.

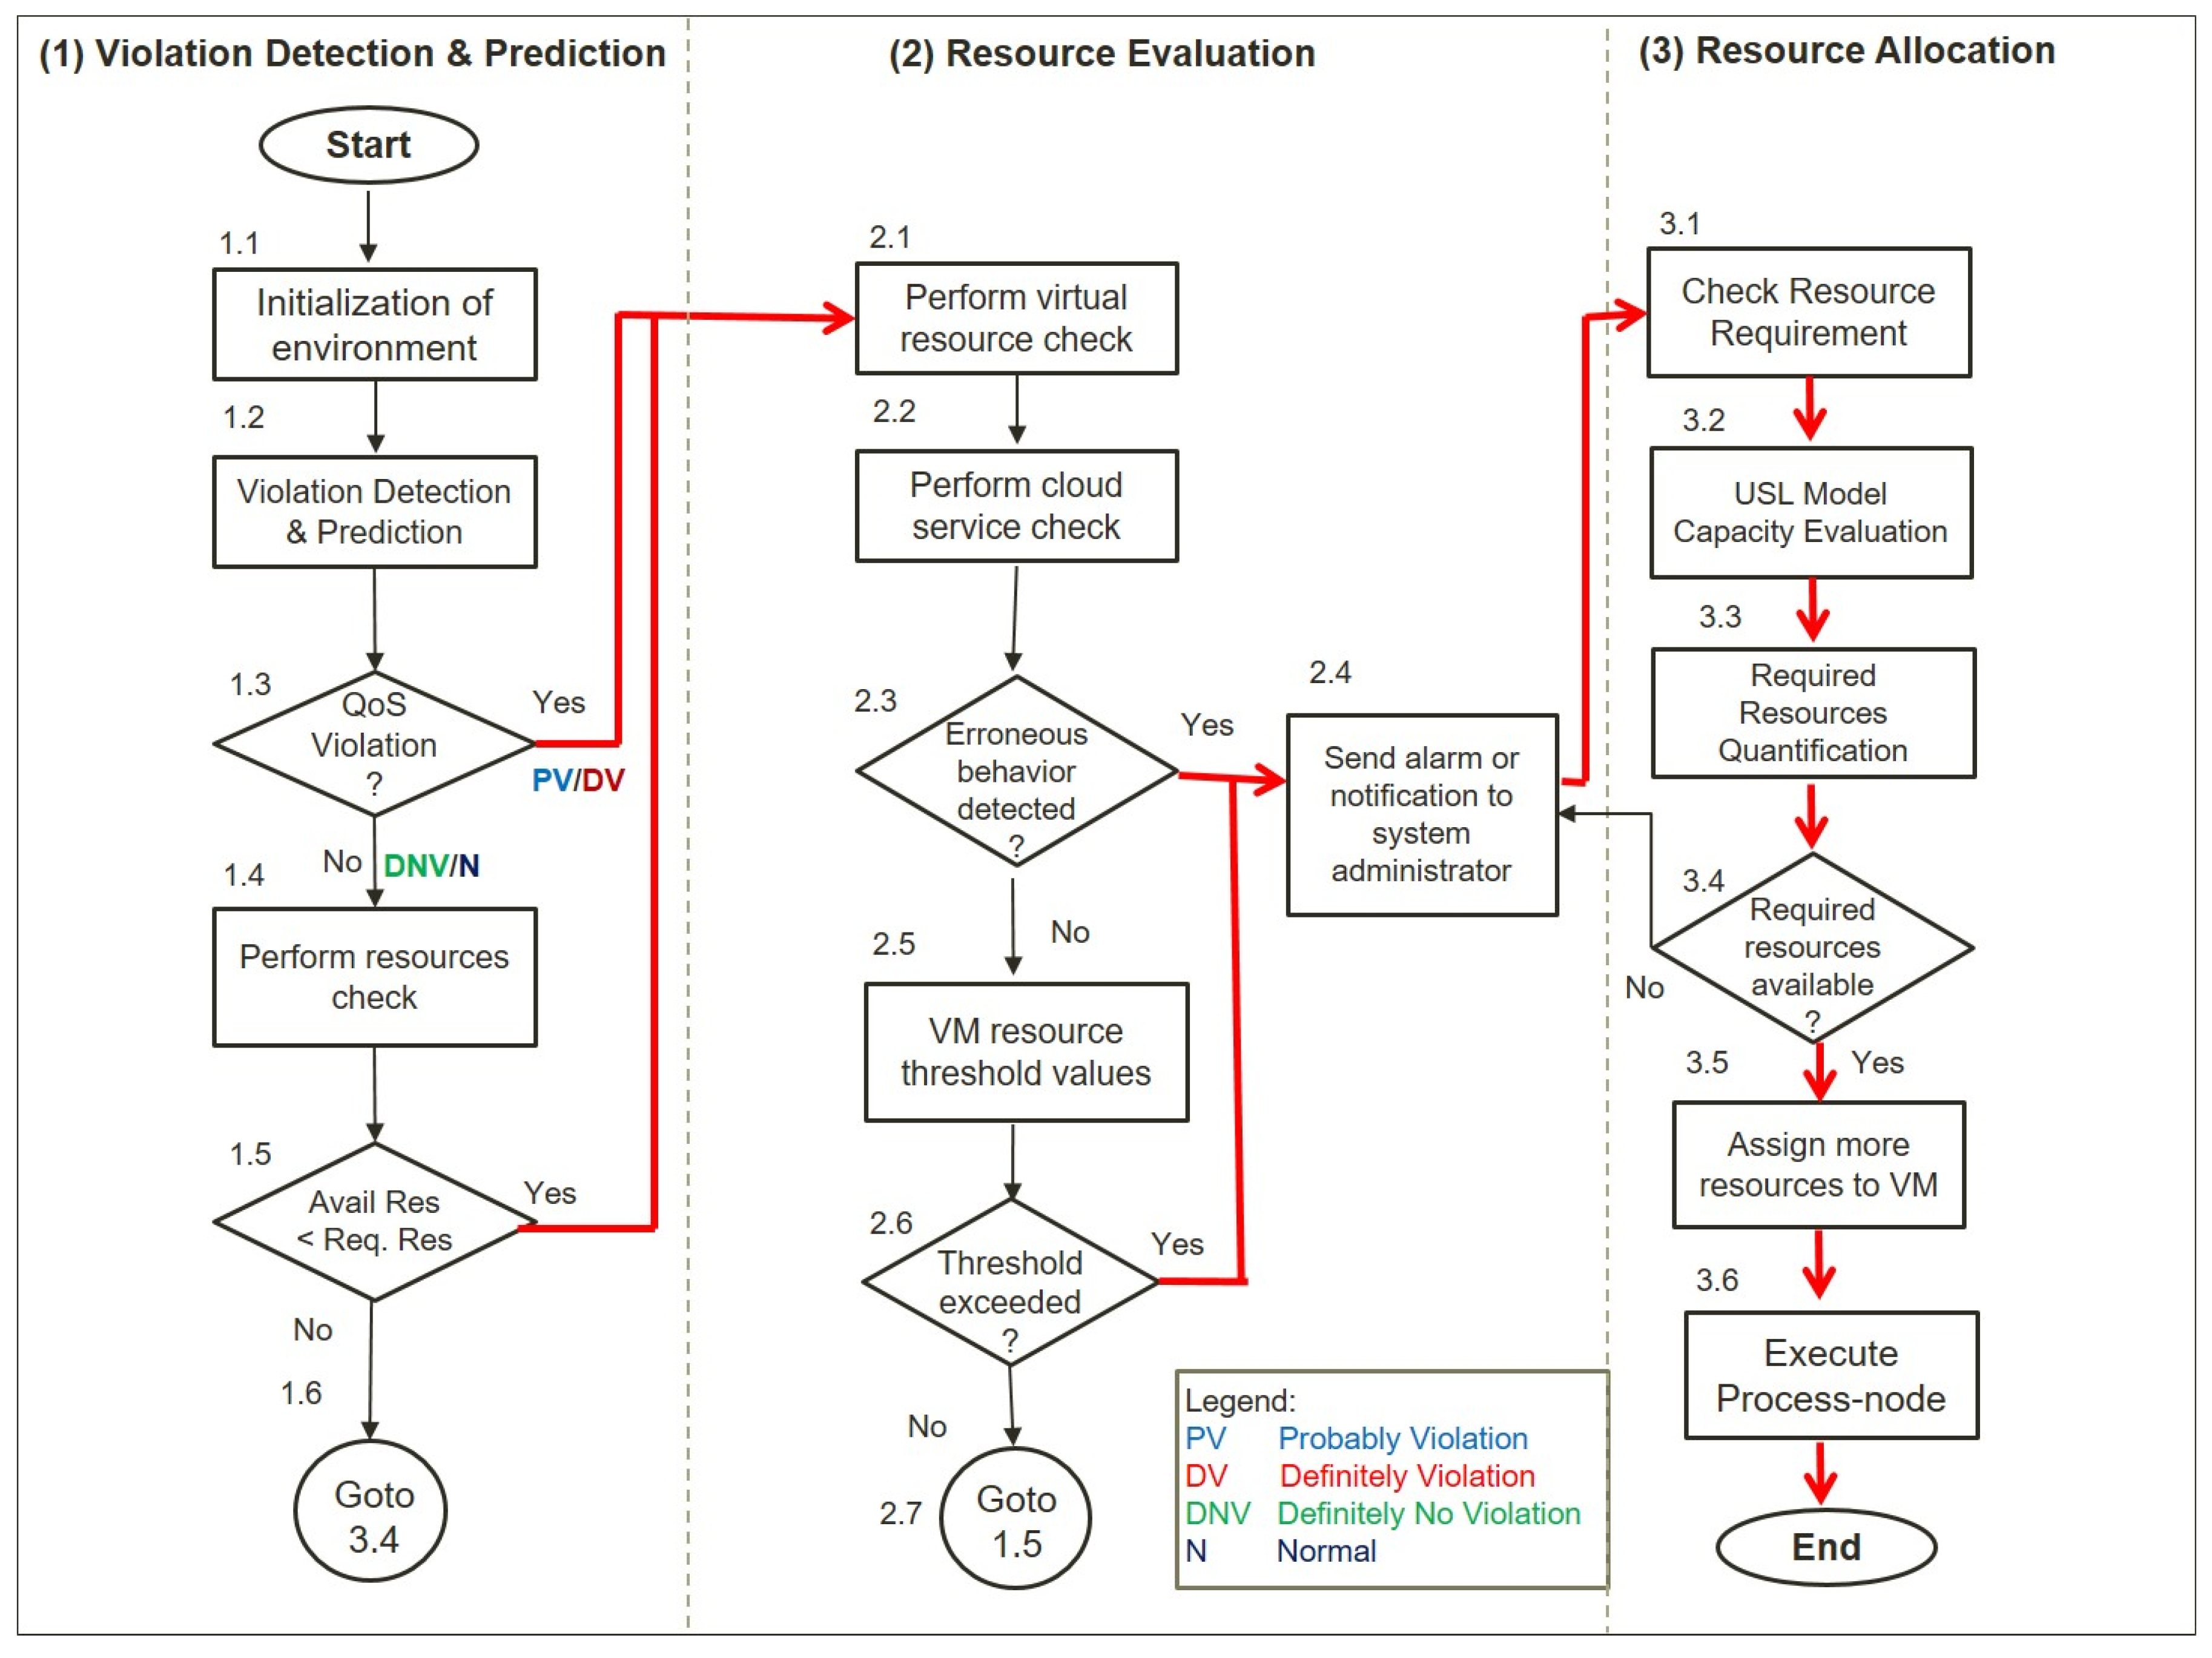
3.2. Elaboration and Flow of Proposed Approach

This section uses a flow diagram to demonstrate the intricacies of the QoS violation detection process using ANFIS fuzzy-if-then rules. The evaluation focuses on erroneous system behavior against threshold values and in the end, optimal scalable resource allocation.
Details of the ReSQoV are explained in reference [28]. There are three primary processes, as indicated in Figure 3 (sequenced from left to right from numbers 1.1, 1.2, and so on): (1) “violation detection and prediction;” (2) “resource evaluation;” and (3) “resource allocation.” Sub-processes exist under each major process; for example, process (1) has sub-processes 1.1 to 1.6. Process (2) has sub-processes 2.1 to 2.7, and process (3) has sub-processes 3.1 to 3.6. These steps are summarized below.
  • Violation Detection and Prediction: the initialization of the environment, which includes keeping a log of the present status of the available resources. QoS monitored values of each process node are then compared to the fuzzy-if-then rules. If there is definitely no violation (DNV) or if the state is normal (N), then normally perform execute; otherwise, if there is a probably violation (PV) or a definitely violation (DV), then perform resource evaluation.
  • Resource Evaluation: to find the corresponding defects, a resource evaluation is conducted. It searches for newly added cloud resource nodes and any other changes. A resource check is necessary to avoid performance deterioration, maximize resource use, and eliminate defects. To find flaws in the application, it runs software checks. It looks through the logs for any application-related events. The type of event (error, critical), the event id, and the time stamp are all stored. Check the following settings for resource thresholds: The program tracks memory and CPU consumption. The system generates notifications when the memory and CPU consumption values exceed the threshold.
Resource Allocation: the resource requirement is determined by the value of the contention and coherence parameters. As more workload is assigned, it fluctuates (serialization or queuing). The serialization and queuing occur when more workloads are executed on certain resources and the required resources are less than available. During the resource scheduling process, resource contention is measured using USL. Increasing the number of resources (CPU cores, RAM) boosts throughput while lowering response time. The base for the additional resource allocation is the ideal contention value. The USL model and its prediction outputs will calculate resource requirements, and when the required resources are available, resources are assigned to VM. The following Algorithm 1 presents the intents of the proposed mechanism for resource allocation.
Algorithm 1. Resource Allocation after modelling Universal Scalability Law
(1) USL_Model_Generation with current Resources
(2) For (All Process_ node)
(3) Resource_Repository == USL_model_desired_resource
(4) if Violation_Decision != Normal && Definitely_No_Violation
(5) { if process_nodecurrent != Active Then
(6) process_nodecurrent == dead, log_data}
(7) elseif (process_nodecurrent == Active)
(8) { process_nodecurrent = assign_resources
(9) End if
(10) End If
(11) End for

4. Experimental Setup and Scenario-Based Simulation

This section describes the experimental setups and simulations used to evaluate the proposed mechanism. Algorithms are implemented, and scenarios are simulated using CloudSim Plus [32], a toolkit for modeling and simulating infrastructures and facilities in cloud computing. The proposed algorithms are analyzed from users’ and SaaS providers’ viewpoints. It assesses how many requests are accepted while maintaining the QoS and how many user requests are handled effectively in a unit of time (it calls average response time). From the viewpoint of the SaaS vendors, it shows how fewer resources can be used to operate the workload version. Consequently, three performance assessment metrics, namely the average response time for requests, the throughput, and the PE cores, are used during vertical scalability.

4.1. Dataset Generation

There are a few publicly available traces on measuring QoS of cloud services due to protecting business confidentiality and consumers’ privacy in commercial clouds. Therefore, to simulate a real cloud computing environment, there is a need to have different workloads to achieve more realistic behaviors reflecting real-world cloud services. A synthetic dataset is generated by deploying an open-source e-commerce SaaS application Magneto on a virtualized private cloud environment. The “Windows Server 2012R2” and “System Center 2012 Virtual Machine Manager” serve as IaaS, as synthetic workload real-time transactions are emulated on the e-commerce client website. QoS metric response time and throughput are monitored and recorded using Apache Jmeter, an open-source monitoring tool. The PlanetLab and Google cluster data consist of the traces of CPU, memory, disk, and network utilization, which are low-level metrics and do not address user load and performance metrics. The WS-DREAM dataset, which is available to the public, contains traces of performance measure response times and throughput, which are also analyzed. Sub-datasets are derived from the primary dataset to generate workloads corresponding to response time and throughput under different decision rules, as discussed in our previous work Reference [33] for simulation. Table 2 shows the gradually increasing workload parameters that include workload length (Columns 2), generated response time, and Throughput (Columns 3–4) for the corresponding workload distribution percentile (Column 5). Table 2 lists the workload percentage distribution of workload defined by the decision rules (Column 6) and the percentage distribution of each decision rule (Column 7).
The workload length is specified as the number of million instructions (MI) to be executed by the CPUs. The size of the workload to be processed is selected as the input size. For example, items 9–12 represent the different lengths of workload (278,800~312,400 MI) with a workload size of 0.8 kb to produce the corresponding ranges of response time (0.407~0.663 s) and throughput (10.843~6.235 kbps) for the Probably Violation decision rule. Likewise, items 13–16 reflect the specific workload duration (313,200~320,000 MI) with a workload size of 0.8 kb to produce the corresponding response time ranges (0.782~1.115 s) and throughput (5.808~4.958 kbps) for the Definitely Violate (DV) decision rule.
A sub-dataset is used for analysis to further explain the percentage distribution of the workload according to each decision rule. For example, item five of Table 2 (column six) accounted for 20% of the workload frequency distribution under the Normal (N) decision rule, and (item thirteen, column six) accounted for 15% of the workload frequency distribution under the Definitely Violation (DV) decision rule. Overall, the Definitely No Violation decision rule (DNV) accounted for 5%, Normal (N) 80%, 14% Probably Violation and Definitely violation includes 1%. These clusters closely approximate real-world Cloud services QoS values.

4.2. USL Model Generation Based on Concurrency and Throughput/Response Time

Making big, quick, and robust systems is one of the most interesting and rewarding things. Eliminating a bottleneck is crucial and amazing, especially when one realizes how inefficient operations were before the change and can observe a substantial improvement in scale efficiency. It is preferable to solve scalability problems than to design systems that scale first. Although linear scalability is desirable, systems that scale linearly are uncommon, despite the promises. Knowledge of non-linearity is critical since a thorough understanding of scalability and the causes, and sources of sub-linear scaling, are essential for building more scalable systems.
This section determines the appropriate dimensions for a formal scalability model that seems to behave as existing systems do, and uses Neil Gunther’s USL Refs. [30,31], which closely fits the structure and yields a scaling equation. The Universal Scalability Law is beneficial and may be used almost anywhere. The equation is straightforward, and the variables listed are usually specific to get. By working backward from observable system behavior and calculating likely coefficients, USL is used to predict the system’s scalability. It requires a set of workload or size metrics for the design (typically concurrency or node count) and the associated throughput. Then non-linear least squares regression is used to fit the USL model to the dataset. It is a mathematical method for determining the optimum coefficient values to produce the best fit line across the data. The data is cleaned and filtered, and maintained as a consistent collection by being displayed in both scatterplot and time series forms. It also removes specific points or changes the period required to experiment with data, averaging across time to obtain adequate findings. It determines the suitable dimensions for a formal scalability model that appears to behave as real-world systems do and then applies the USL of Reference [30], which closely matches the structure and yields a scalability equation. The equation is not complicated, and the variables described are generally simple to obtain. The USL is used to model the system’s scalability by operating backward from the observed system behavior and estimating probable coefficients. To accomplish this, it needs a collection of workload or size measurements (usually concurrency or node count) of the system and the corresponding throughput. Then the USL model is fitted to the dataset, using non-linear least squares regression. A mathematical technique determines the optimal coefficient values to determine the best fit line across the measurements. The product is the values of λ, σ, and κ. By visualizing the data in scatterplot and time series formats, it has cleaned and curated the data and maintained a reasonably consistent data collection. Individual points are eliminated or modified within the timeframe needed to experiment with data and averaged over time to achieve satisfactory results.

4.3. Scenario-Based Simulation

The simulator CloudSim Plus [7,21] is used to present and simulate the scenarios to assess the proposed algorithm and methodology. For the simulation, a virtual host with a Virtual Machine setup matching the instances of Amazon T2.medium is used. The processor used in EC2 T2 is a 2nd Gen Intel Xeon Scalable processor Ref. [33]. Table 3 displays the reference setup for the VM as used in the simulation.
One VM is used as a baseline at the beginning of the simulation that is kept constant for all experiments. The power unit for processing the CPU is calculated in Million per second instruction (MIPS). The Geekbench-5 Ref. [34] calculates the MIPS of Amazon EC2 T2. medium instances based on the Moravec guidelines Ref. [35]. The provisioning policy is a time-shared policy for both VMs and workloads. The approach equally shares the computing power into workloads simultaneously in a VM.
The first scenario is to submit a workload (Table 2, Rows 1–4, and Rows 5–8) for ten instances handled by the VM every 15 s. For the first and second case, where “Definitely No Violation” and “Normal” were the QoS criteria, the calculated decisions rule. In this case, no scalability algorithms were triggered. The experiment is replicated 20 times, with random workload submissions reaching 200.
The second scenario is to submit a workload (Table 2, Rows 9–12) for ten occurrences, processed by the VM every 15 s. The experiment is replicated 20 times with the submission of variant workloads at random reaching 350. The third option is to apply a workload (Table 2, Rows 13–16) for ten occurrences handled by the VM every 15 s. For this third case, the role of prevention is assigned by the scalable resource allocation followed by the USL model generation for handling the workload resulting in QoS “Definitely Violated” due to the under-provisioning. The experiment is replicated 20 times with a minimum of 500 instances of the random workload resulting in a “Definitely Violation” decision rule.

4.4. USL Model Generation

The system is an artifact using the USL package Ref. [36] in R. The data shows the throughput for variant workload and concurrency for future resource estimation. The effect of the continuous increase in workload on the throughput for switching can be easily seen. A simple scatterplot visualizes the raw data in Figure 4: Throughput to concurrency, showing the system’s throughput for consistent concurrency increases. The diagram reflects a typical example of the diminishing return effects. At the same time, Figure 5: response time to concurrency represents the system’s response time concerning concurrency.
The next step is to build the Universal Scalability Law (USL) model based on the generated dataset. For model generation the usl() function is used, which creates an object that encapsulates the computation. One argument is a symbolic description of a formula, i.e., “throughput” changes concerning the concurrency or users in the system. The second argument is with regard to the dataset containing the measured values. For the dataset, the USL model is generated for its concurrency, and the response time is shown in Figure 5.

4.5. Experiment Scenarios

The first scenario is to submit a workload (Table 2, Rows 1–4, and Rows 5–8) for ten instances handled by the VM every 15 s. The calculated decision rule was the first and second case, where “Definitely No Violation” and “Natural” were the QoS criteria and no scalability algorithms were triggered. The experiment is replicated 20 times, with random workload submissions reaching 200.
The second scenario is to submit a workload (Table 1, Rows 9–12) for ten occurrences, processed by the VM every 15 s. The self-checking and healing may be triggered during the simulation runtime due to “probably violation” of QoS. In the second scenario, the preventive USL based resource allocation algorithm will assign the task of rectifying cloud QoS violation by applying self-checking and healing techniques through task re-submission for handling faulty VM task calculation.
The third scenario is to apply a workload (Table 1, Rows 13–16) for ten occurrences handled by the VM every 15 s. For the third case, the role of prevention is assigned for handling workload resulting in QoS “Definitely Violated”, due to the under-provisioning. The experiment is replicated 20 times with a minimum of 500 random workload instances resulting in the “Definitely Violation” decision rule.

5. Experiment Results

Universal Scalability Law (USL) Model Is Generated Based on Dataset. It Provides the following Efficiency Output for the System under Evaluation.

5.1. USL Model Efficiency

Efficiency is the ratio of useful work performed in a unit Pe. Calculating the ratio of the workload handled by one unit of resources should usually be less or equal to one. However, the maximum distribution is not always one, which is caused by the regression model when the anticipated value differs slightly from the measured value. The minimum calculated efficiency is 0.00002, and the maximum is 1.00000 for the USL model.
To calculate the coefficients, regression is run on the data. The residuals for the fitted values are calculated as a result. The residuals’ distribution is shown in Table 4.
Contention σ and Coherence λ are the magnitudes of the contention and coherency effects within the system. The third coefficient γ calculates the throughput of a workload. The regression also causes the difference between the value of γ and the measurement. As a result, a single unit of resource measurement is available. The disparity between the value of and the measurement is also attributable to regression. The change should be modest if the regression yields a good model. Table 5 shows the values of contention and coherence calculate the non-linear relationship and help to compute the additional resources required for the enhanced concurrent user load. All three coefficients marked with starts are significant. All three coefficients’ p-value is <0.05, marked with stars are statistically significant.

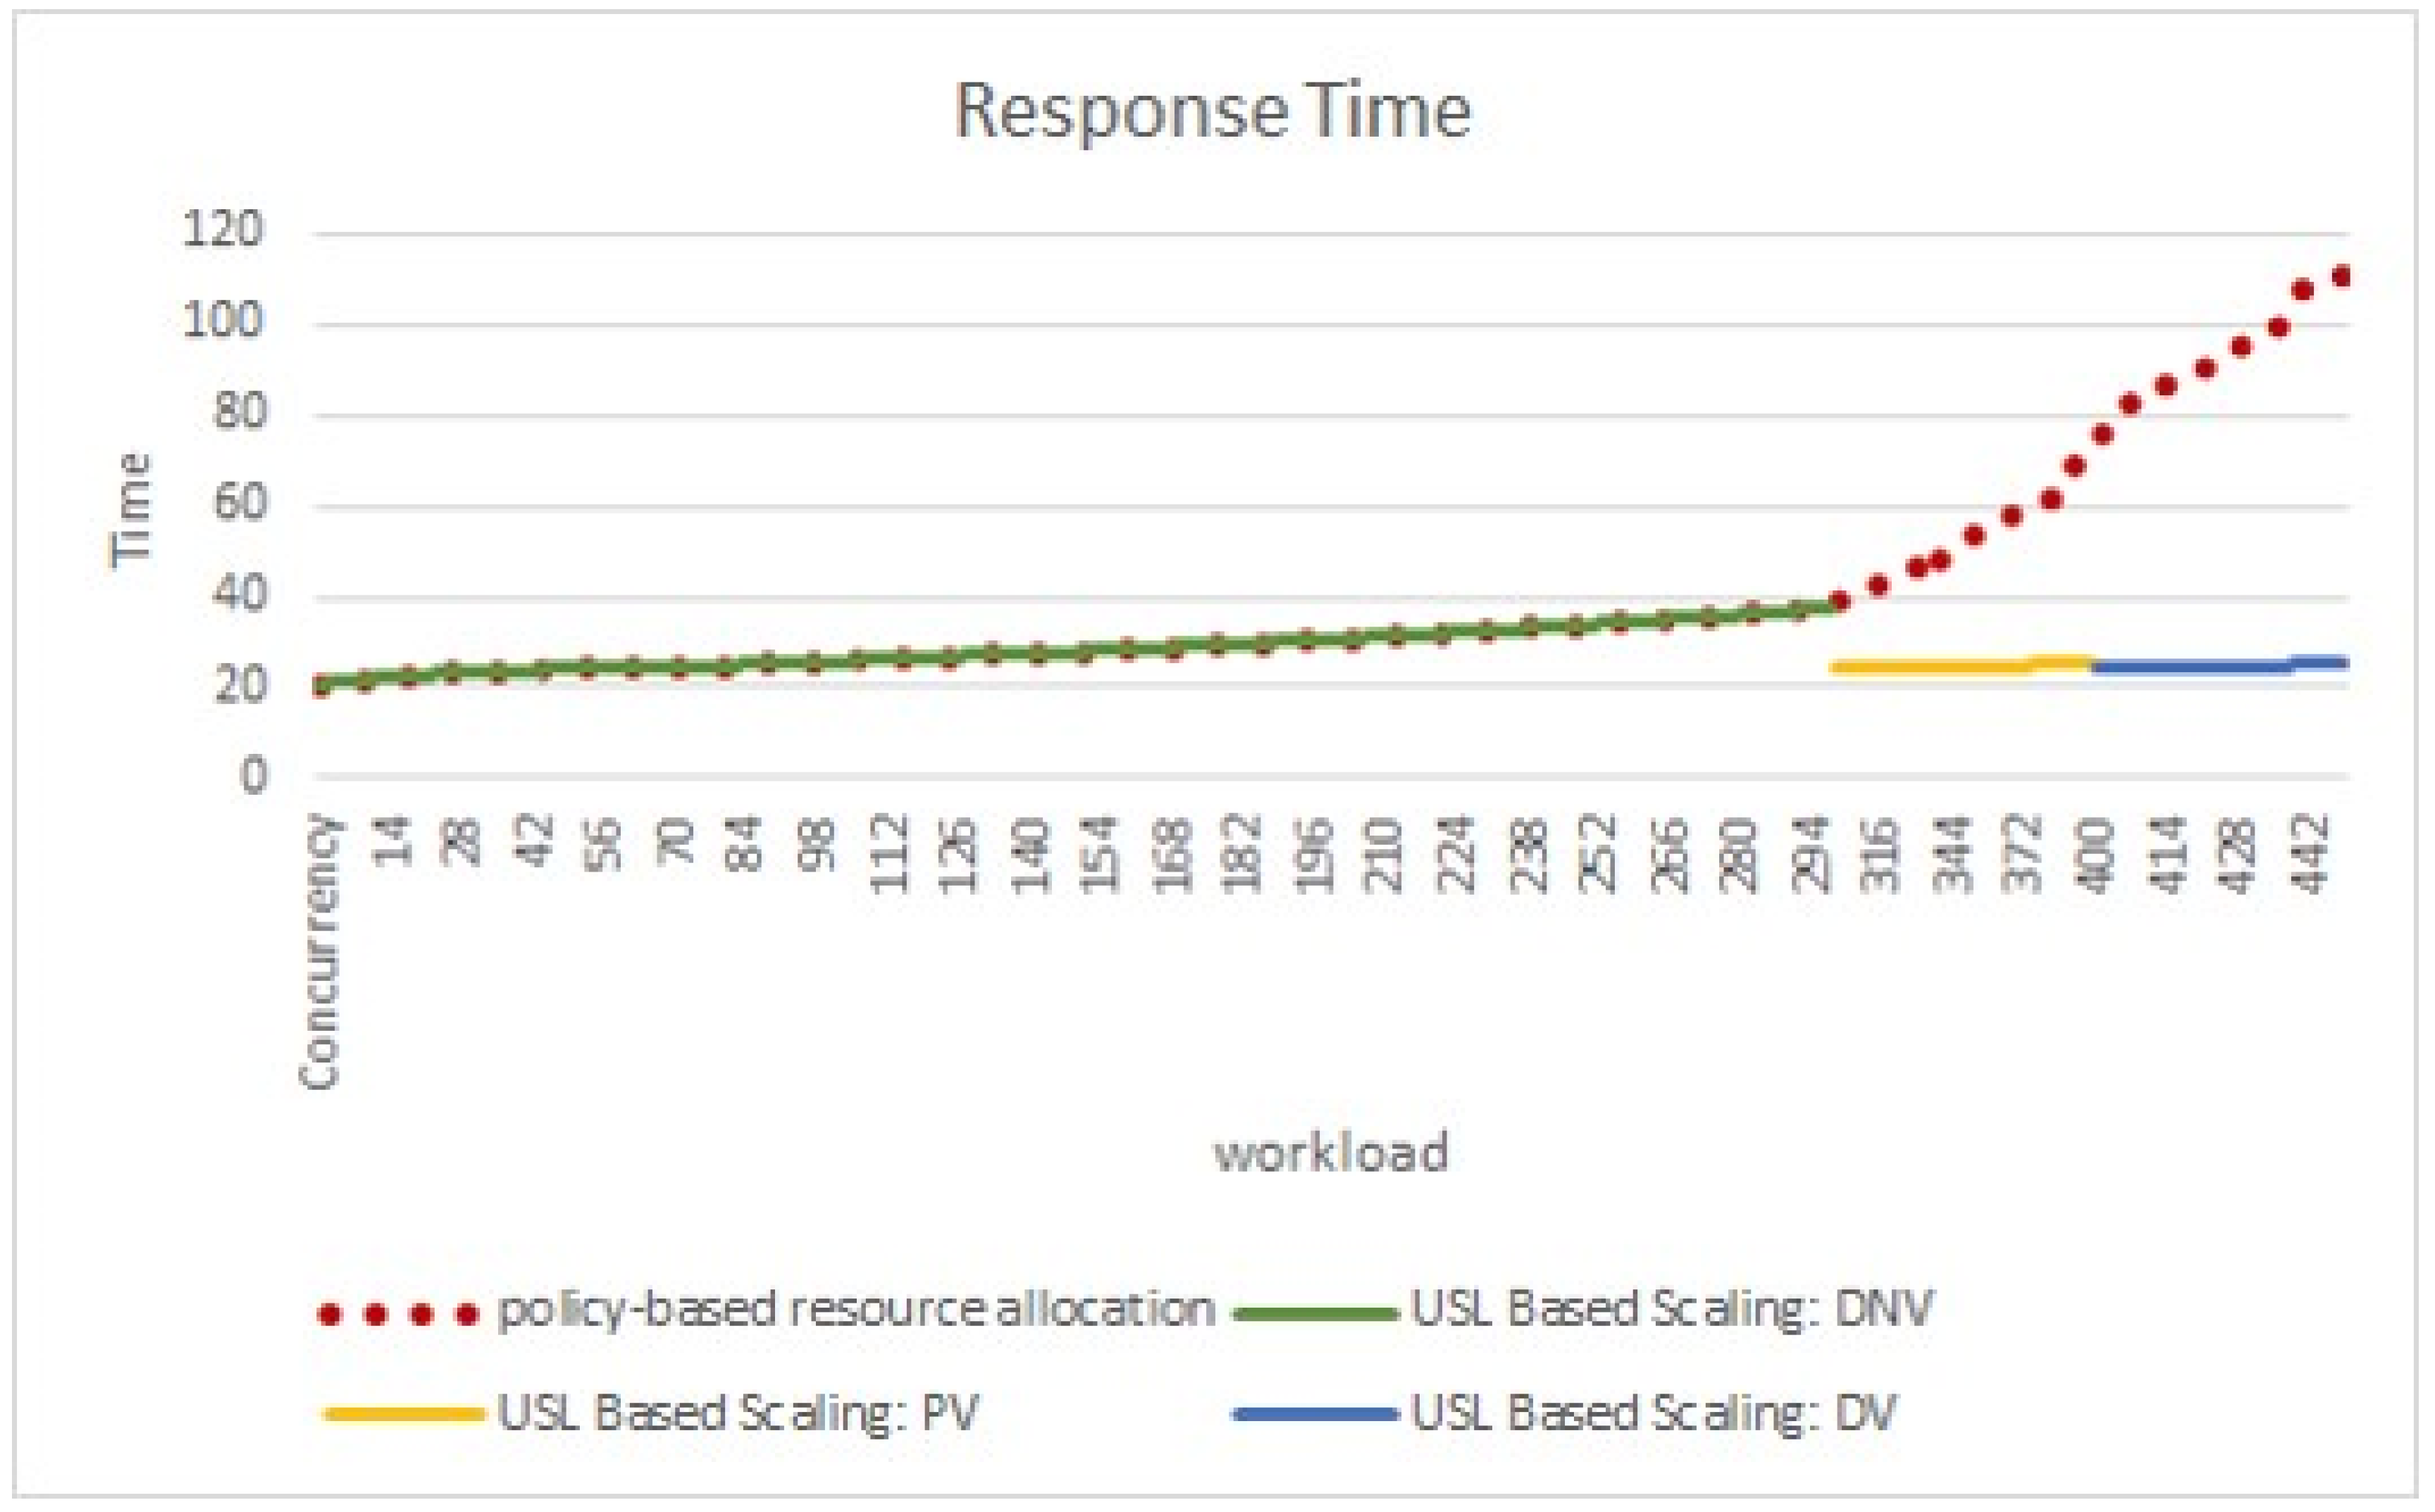
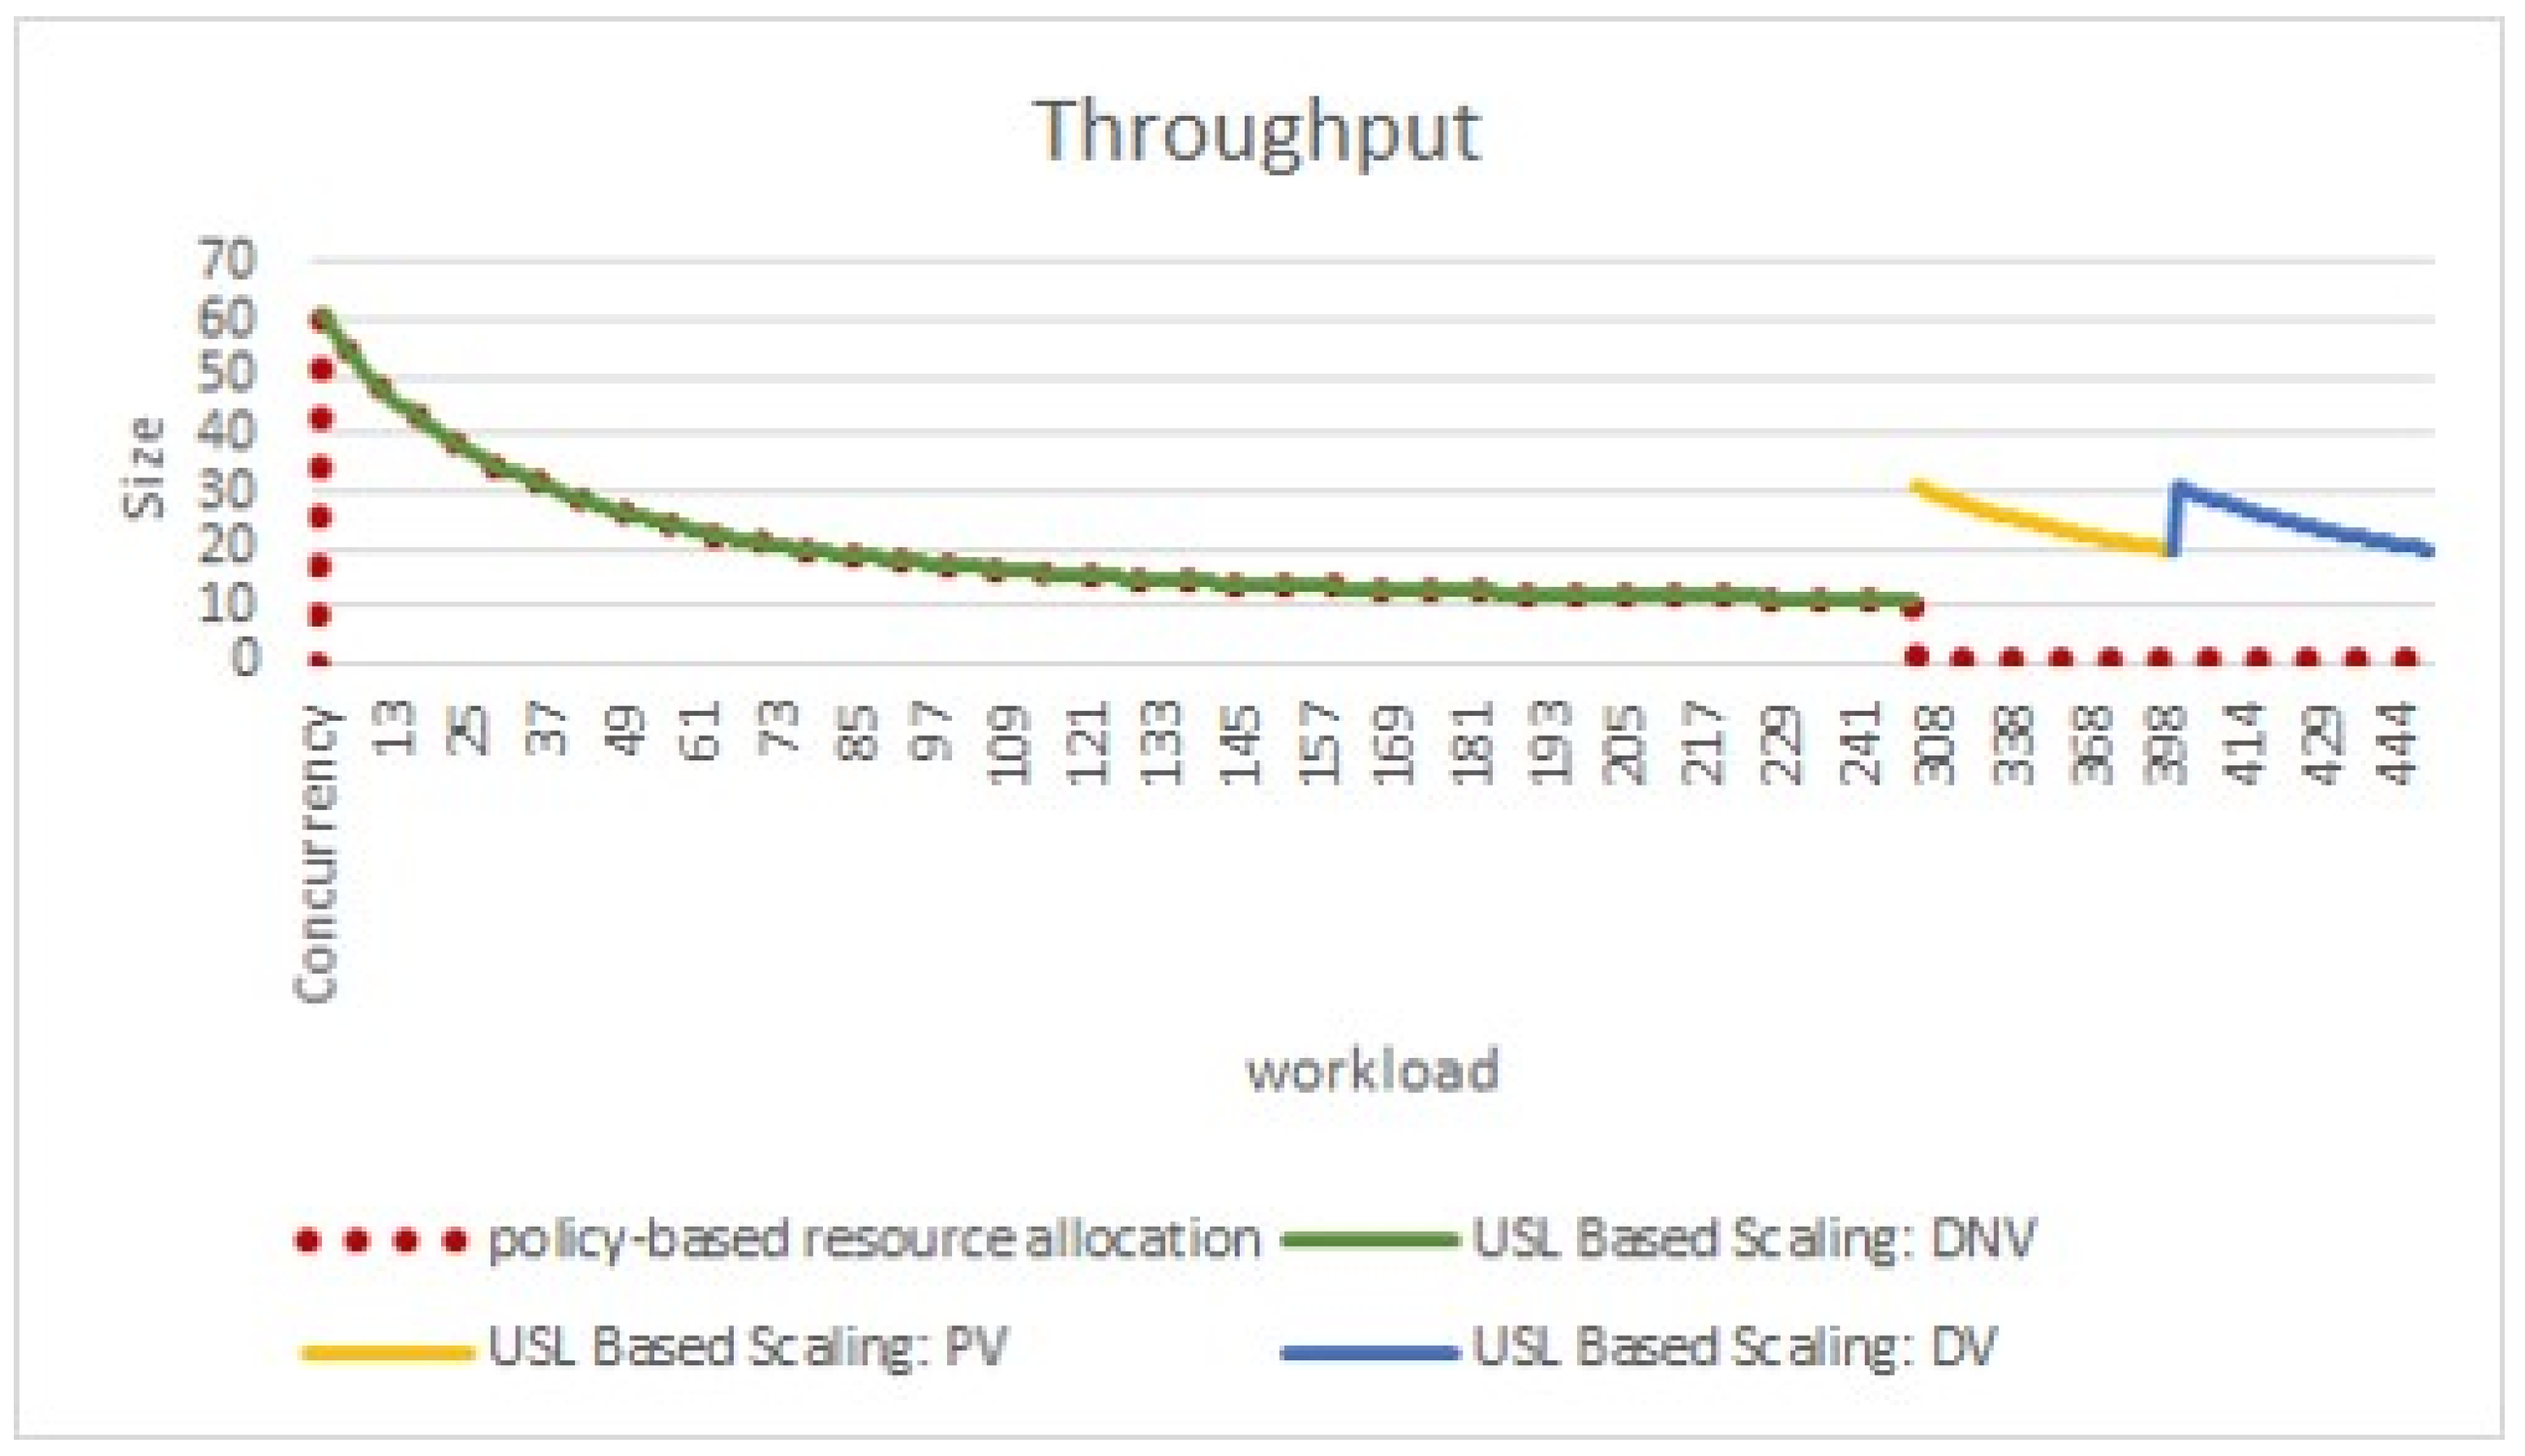
5.2. Scenarios Experiment Results

This section first compares ReSQoV with the policy-based, time-sharing scheduling by vertical scalability defined by the varying number of users in the CloudSim Plus simulator [17]. It also measures the effect of QoS parameters on efficiency metrics. Finally, an analysis of our algorithm’s robustness is presented. All the findings reflect the average of the five experiment runs that were collected. One workload parameter is randomized in each experiment on varying processing elements (PE, CPU cores), where other resources RAM, Bandwidth, and memory, are given constant values.
Four metrics are considered for each scenario to assess the efficiency of ReSQoV for QoS parameters (response time, throughput, number of PE used). The response time is calculated based on a Virtual Machine’s length of workload (MI) and the Millions of Instructions Per Second (MIPS). Throughput is calculated based on working load size and response time. To obtain a statistically representative calculation, results are based on the 50 repeated experiments, average readings are determined based on the output metrics of response time, throughput, and number of PE (Processing Elements, CPU cores) for each stage during simulation runtime.
Referring to Figure 6; the red dotted line represents the CloudSim policy-based scaling where it is observed that the response time of higher workload increases. At the same time, the other three color lines depict the workload and system behavior with ReSQoV. The model triggers to allocate required resources to VM and maintains the agreed or expected response time. As shown in Figure 6, ReSQoV waits for 15 s before inserting new PEs usable in scalable processors. The Response Time in Definitely No Violation or Normal decision rule in a particular concurrent user load, no resource allocation was triggered and after Probably Violation (PV) and Definitely Violation (DV) more resources were allocated. Results are similar for all repeated experiments. These results show that policy-based scaling response time increased after a certain load (red dotted lines); on the contrary, after adding resources, the response time decreased in the limits as agreed.
Figure 7 presents the QoS agreed throughput using USL based ReSQoV compared to policy-based resource allocation. The red dotted line represents the CloudSim policy-based scaling where after a certain workload, throughput decreases. At the same time, the other three lines depict the workload and system behavior with ReSQoV. That adds the required resources and increases and maintains the throughput in defined and expected limits. As shown in Figure 7, ReSQoV waits 15 s before inserting new PEs usable in scalable processors. The throughput in the Definitely No Violation or Normal decision rule in a particular concurrent user load is similar, and no resource allocation is triggered. However, as the user load increases and for Probably Violation and Definitely Violation, more resources are needed to allocate.
Figure 8 shows the behavior of the resource allocation to VM. In the policy-based scaling, resources are allocated gradually (red dotted lines) without considering the QoS values. At the same time, ReSQoV allocates resources more rigorously and appropriately. The VM works with the new assigned PEs when needed. It is observed that QoS parameters are not considered in policy-based resource allocation. A maximum of four PEs are allocated even though twelve scalable PEs were allocated to the VM. The results show that ReSQoV focuses on the QoS, and after allocating the required resources by considering the parallelism and serialization overheads, it ensures QoS is maintained.

5.3. Analysis of Variance (ANOVA)

The ANOVA Reference [37] is used to validate the simulation findings, which is a statistical test. It analyzes if a particular set of conclusions statistically differs from another data set in a meaningful manner. The null hypothesis (H0) and the alternative hypothesis (H1) are tested, and are defined as
H 0 : = U 1 = U 2 = U 3 = U n
H 1 :   U 1 U 2 U 3 U n   M e a n s   a r e   n o t   e q u a l
As a result of the test, it fails to reject the null hypothesis since F statistical is more diminutive than F critical, p-value is less than 5% (0.05) and accepts the alternative hypothesis if, on the other hand, F statistical is greater than F critical. In this study, a three-factor ANOVA was undertaken to examine the system, response time, and throughput effects on resources (Pes). The difference in true mean responses for a given category of QoS parameters and the system is the use of resources. The ANOVA test indicates the interaction between the different QoS factors of the cloud by the resources.
The ANOVA test was employed to examine any significant differences in the system with policy-based resource allocation. It quantified resource allocation attributed to the system, response time, throughput, and Processing Elements (PEs). Results of the T-test, shown in Table 6, indicated a significant difference in the Systems and throughputs (1, 3) where p-value is less than 5%. The interactions of the system with the throughput and interaction among the system, response time, and throughput (5, 7) are significant. The results show that the system behavior has been changed after assigning the Quantified resources, as shown in the table. The F statistical is more diminutive than the F critical (p-value) of System, Throughput, System: Throughput, and System: Res_Time: Throughput, which shows a significant difference and rejects the null hypothesis. It indicates that ReSQoV performs better to satisfy QoS than the policy-based resource allocation.

5.4. Threats to Validity

Experiments are conducted in the virtualized environment and simulator. Although appropriate model assumptions are made based on experiment design and prior literature, we can only offer conjecture on the causes of any variability that we detect. We considered only medium instance types in this study. A follow-up study is needed to determine whether the outcomes of variability and detectability improve with bigger instance size and more resourceful cloud infrastructure. Another threat to our study’s internal validity is that we chose to execute all experiments in 20 iterations, which may be regarded as a low number of iterations. As the public clouds act as a black box whereby we have no control over resource orchestration, we cannot generalize the results to the public cloud. Other QoS measures, such as memory use, power consumption, or cost, should be investigated in the future. Furthermore, any performance research conducted on cloud infrastructure is essentially aimed at a moving target. We believe the fundamental conclusions and consequences of our work will stay steady as long as virtualization and resource allocation in the private environment are handled.

6. Conclusions

This paper focuses on the cloud QoS violation rectification process incorporated with scalable resource utilization. The ReSQoV aims to prevent or rectify cloud QoS violations caused by under or over-provisioning events, maintaining resources at a certain level to avoid certain or probable violation conditions. We focused on the estimation of resource utilization to ensure QoS. The ReSQoV is proposed based on the Universal Scalability Law (USL), which helps to predict the service capacity for a specific load. The model coefficients show the contention and coherence quantified values, while the p-values show the model fitting. As the QoS violation detection decision is Probably Violation and Definitely Violation, the remedial action is triggered, and required resources are added to the virtual machine as vertical scaling. Experiments show that the ReSQoV was able to present the calculation and modeling of serialization and parallelism overheads, which help allocating ample resources to VM so that QoS is not compromised, which is an important aspect of cloud services. The statistical test ANOVA shows the difference between the policy-based and quantified scaling systems due to the generated QoS parameter values and their interactions.

Author Contributions

Conceptualization, H.M.K. and F.-F.C.; methodology, H.M.K.; software, H.M.K.; validation, H.M.K., F.-F.C. and T.T.V.Y.; formal analysis, H.M.K.; investigation, H.M.K.; resources, H.M.K., F.-F.C. and T.T.V.Y.; data curation, H.M.K.; writing—original draft preparation, H.M.K.; writing—review and editing, H.M.K., F.-F.C. and T.T.V.Y.; visualization, H.M.K.; supervision, F.-F.C. and T.T.V.Y.; project administration, F.-F.C.; funding acquisition, F.-F.C. All authors have read and agreed to the published version of the manuscript.

Funding

This research was funded by Multimedia University, Malaysia.

Data Availability Statement

Not applicable.

Conflicts of Interest

The authors declare no conflict of interest.

References

  1. Kan, Y. A Cloud Computing Resource Optimal Allocation Scheme Based on Data Correlation Analysis. In Proceedings of the 4th International Conference on Electronics, Communications and Control Engineering, Seoul, Korea, 9–11 April 2021; ACM: New York, NY, USA; pp. 26–31. [Google Scholar] [CrossRef]
  2. Adnan Khan, M.; Kanwal, A.; Abbas, S.; Khan, F.; Whangbo, T. Intelligent Model for Predicting the Quality of Services Violation. Comput. Mater. Contin. 2022, 71, 3607–3619. [Google Scholar] [CrossRef]
  3. Khalil, M.I.K.; Ahmad, I.; Shah, S.A.A.; Jan, S.; Khan, F.Q. Energy Cost Minimization for Sustainable Cloud Computing Using Option Pricing. Sustain. Cities Soc. 2020, 63, 102440. [Google Scholar] [CrossRef]
  4. Gill, S.S.; Chana, I.; Singh, M.; Buyya, R. CHOPPER: An Intelligent QoS-Aware Autonomic Resource Management Approach for Cloud Computing. Cluster Comput. 2018, 21, 1203–1241. [Google Scholar] [CrossRef]
  5. Psychas, K.; Ghaderi, J. A Theory of Auto-Scaling for Resource Reservation in Cloud Services. ACM SIGMETRICS Perform. Eval. Rev. 2021, 48, 27–32. [Google Scholar] [CrossRef]
  6. Qu, C.; Calheiros, R.N.; Buyya, R. Auto-Scaling Web Applications in Clouds. ACM Comput. Surv. 2019, 51, 1–33. [Google Scholar] [CrossRef]
  7. Fuerst, A.; Ali-Eldin, A.; Shenoy, P.; Sharma, P. Cloud-Scale VM-Deflation for Running Interactive Applications On Transient Servers. In Proceedings of the 29th International Symposium on High-Performance Parallel and Distributed Computing, Stockholm, Sweden, 23–26 June 2020; ACM: New York, NY, USA, 2020; pp. 53–64. [Google Scholar]
  8. Santos, G.; Paulino, H.; Vardasca, T. QoE-Aware Auto-Scaling of Heterogeneous Containerized Services (and Its Application to Health Services). In Proceedings of the 35th Annual ACM Symposium on Applied Computing, Brno, Czech Republic, 30 March–3 April 2020; pp. 242–249. [Google Scholar]
  9. Lehrig, S.; Eikerling, H.; Becker, S. Scalability, Elasticity, and Efficiency in Cloud Computing. In Proceedings of the 11th International ACM SIGSOFT Conference on Quality of Software Architectures, Montréal, QC, Canada, 4–8 May 2015; pp. 83–92. [Google Scholar]
  10. Dabbagh, M.; Hamdaoui, B.; Guizani, M.; Rayes, A. Energy-Efficient Resource Allocation and Provisioning Framework for Cloud Data Centers. IEEE Trans. Netw. Serv. Manag. 2015, 12, 377–391. [Google Scholar] [CrossRef]
  11. Vasu, R.; Nehru, E.I.; Ramakrishnan, G. Load Forecasting for Optimal Resource Allocation in Cloud Computing Using Neural Method Senior Technical Director, National Informatics Centre, Chennai, India. Middle East J. Sci. Res. 2016, 24, 1995–2002. [Google Scholar] [CrossRef]
  12. Mashayekhy, L.; Nejad, M.M.; Grosu, D.; Vasilakos, A.V. An Online Mechanism for Resource Allocation and Pricing in Clouds. IEEE Trans. Comput. 2016, 65, 1172–1184. [Google Scholar] [CrossRef]
  13. Goutam, S.; Yadav, A.K. Preemptable Priority based Dynamic Resource Allocation in Cloud Computing with Fault Tolerance. In Proceedings of the 2015 International Conference on Communication Networks (ICCN), Gwalior, India, 19–21 November 2015; pp. 278–285. [Google Scholar]
  14. Abdelmaboud, A.; Jawawi, D.N.A.; Ghani, I.; Elsafi, A.; Kitchenham, B. Quality of service approaches in cloud computing: A systematic mapping study. J. Syst. Softw. 2015, 101, 159–179. [Google Scholar] [CrossRef]
  15. Ardagna, D.; Casale, G.; Ciavotta, M.; Pérez, J.F.; Wang, W. Quality-of-service in cloud computing: Modeling techniques and their applications. J. Internet Serv. Appl. 2014, 5, 11. [Google Scholar] [CrossRef] [Green Version]
  16. Katyal, M.; Mishra, A. Application of Selective Algorithm for Effective Resource Provisioning in Cloud Computing Environment. Int. J. Cloud Comput. Serv. Arch. 2014, 4, 1–10. [Google Scholar] [CrossRef]
  17. Calheiros, R.; Ranjan, R.; Beloglazov, A.; De Rose, C.A.F.; Buyya, R. CloudSim: A toolkit for modeling and simulation of cloud computing environments and evaluation of resource provisioning algorithms. Softw. Pr. Exp. 2011, 41, 23–50. [Google Scholar] [CrossRef]
  18. Etemadi, M.; Ghobaei-Arani, M.; Shahidinejad, A. Resource provisioning for IoT services in the fog computing environment: An autonomic approach. Comput. Commun. 2020, 161, 109–131. [Google Scholar] [CrossRef]
  19. Ghobaei-Arani, M.; Khorsand, R.; Ramezanpour, M. An autonomous resource provisioning framework for massively multiplayer online games in cloud environment. J. Netw. Comput. Appl. 2019, 142, 76–97. [Google Scholar] [CrossRef]
  20. Aslanpour, M.S.; Dashti, S.E.; Ghobaei-Arani, M.; Rahmanian, A.A. Resource Provisioning for Cloud Applications: A 3-D, Provident and Flexible Approach; Springer: Manhattan, NY, USA, 2018; Volume 74. [Google Scholar]
  21. Chauhan, N.; Agrawal, R. Probabilistic Optimized Kernel Naive Bayesian Cloud Resource Allocation System. Wirel. Pers. Commun. 2022, 1–20. [Google Scholar] [CrossRef]
  22. Ghobaei-Arani, M. A workload clustering based resource provisioning mechanism using Biogeography based optimization technique in the cloud based systems. Soft Comput. 2021, 25, 3813–3830. [Google Scholar] [CrossRef]
  23. Shyam, G.K.; Manvi, S.S. Resource allocation in cloud computing using agents. In Proceedings of the 2015 IEEE International Advance Computing Conference (IACC), Banglore, India, 12–13 June 2015; pp. 458–463. [Google Scholar]
  24. Radhakrishnan, A.; Kavitha, V. Trusted Virtual Machine Allocation in Cloud Computing IaaS Service. Res. J. Appl. Sci. Eng. Technol. 2014, 7, 2921–2928. [Google Scholar] [CrossRef]
  25. Agarwal, S. An Approach of SLA Violation Prediction and QoS Optimization using Regression Machine Learning Techniques. Electron. Theses Diss. 2020, 1–93. [Google Scholar]
  26. Hani, A.F.M.; Paputungan, I.V.; Fadzil, M.H.; Vijanth, S.A. Manifold Learning in SLA Violation Detection and Prediction for Cloud-Based System. In Proceedings of the ICC ’17 Second International Conference on Internet of things, Data and Cloud Computing, Cambridge, UK, 22–23 March 2017; ACM: Cambridge, UK; pp. 1–5. [Google Scholar] [CrossRef]
  27. Hemmat, R.A.; Hafid, A. SLA Violation Prediction in Cloud Computing: A Machine Learning Perspective. 2016. Available online: https://www.researchgate.net/publication/311222705_SLA_Violation_Prediction_In_Cloud_Computing_A_Machine_Learning_Perspective (accessed on 10 March 2022).
  28. Chan, G.Y.; Khan, H.M.; Chua, F.F. Resource Scalability as Preventive and Remedial Measures for Cloud Service Violation. In Proceedings of the 2018 IEEE 6th International Conference on Future Internet of Things and Cloud (FiCloud), Barcelona, Spain, 6–8 August 2018; pp. 428–435. [Google Scholar]
  29. Khan, H.M.; Chan, G.Y.; Chua, F.-F. A Fuzzy Model for Detecting and Predicting Cloud Quality of Service Violation. J. Eng. Sci. Technol. 2018, 13, 58–77. [Google Scholar]
  30. Gunther, N.J. A General Theory of Computational Scalability Based on Rational Functions. arXiv 2008, arXiv:0808.1431. [Google Scholar]
  31. Gunther, N.J. Guerrilla Capacity Planning: A Tactical Approach to Planning for Highly Scalable Applications and Services. 2007. Available online: https://www.researchgate.net/publication/220689673_Guerrilla_capacity_planning_A_tactical_approach_to_planning_for_highly_scalable_applications_and_services (accessed on 10 March 2022).
  32. Filho, M.C.S.; Oliveira, R.L.; Monteiro, C.C.; Inacio, P.R.; Freire, M.M. CloudSim Plus: A Cloud Computing Simulation Framework Pursuing Software Engineering Principles for Improved Modularity, Extensibility and Correctness. In Proceedings of the 2017 IFIP/IEEE Symposium on Integrated Network and Service Management (IM), Lisbon, Portugal, 8–12 May 2017; pp. 400–406. [Google Scholar]
  33. Amazon Web Services, Inc. Amazon EC2 Instance Types—Amazon Web Services. 2019. Available online: https://aws.amazon.com/ec2/instance-types/ (accessed on 10 March 2022).
  34. Geekbench. Available online: https://browser.geekbench.com/v5/cpu (accessed on 10 March 2022).
  35. Cohen, E.A.; Moravec, H.P. Robot: Mere Machine to Transcendent Mind. Foreign Aff. 1999, 78, 131. [Google Scholar] [CrossRef]
  36. Möding, S. Using the Usl Package, Analyze System Scalability in R with the Universal Scalability Law. 2020. Available online: https://cran.r-project.org/web/packages/usl/vignettes/usl.pdf (accessed on 10 March 2022).
  37. Muller, K.E.; Fetterman, B.A. Regression and ANOVA: An Integrated Approach Using SAS Software; John Wiley & Sons, Inc.: Hoboken, NJ, USA, 2003. [Google Scholar]
Figure 1. Scalability performance for throughput: (a) linear scalability; (b) non-linear scalability.
Futureinternet 14 00131 g001
Figure 2. Effect of multiuser scale-up increases response time in accordance to multi-core processors.
Futureinternet 14 00131 g002
Figure 3. Flow diagram of the ReSQoV model.
Futureinternet 14 00131 g003
Figure 4. Response time, Throughput to Concurrency.
Futureinternet 14 00131 g004
Figure 5. USL Model for Concurrency and Response Time.
Futureinternet 14 00131 g005
Figure 6. QoS satisfied Response Time.
Futureinternet 14 00131 g006
Figure 7. QoS Satisfied Throughput.
Futureinternet 14 00131 g007
Figure 8. Resource Utilization.
Futureinternet 14 00131 g008
Table 2. QoS Metrics, Workload with Decision Rules.
1. Serial #2. Workload length
(MIPS)
3. Response Time (sec)4. Throughput (kbps)5. Workload Distribution (%age)6. ANFIS Decision Rules7. Decision Rule Distribution Percentile (%age)
128,0000.20961.26115%Definitely No Violation
(DNV)
5%
232,0000.21655.27840%
335,2000.22051.13635%
436,0000.22150.22710%
564,8000.24031.61220%Normal
(N)
80%
6123,6000.26718.04330%
7205,6000.32212.96040%
8264,0000.37411.60710%
9278,8000.40710.84315%Probably Violation
(PV)
14%
10296,8000.5347.96235%
11302,4000.5717.16630%
12312,4000.6636.23520%
13317,2000.7825.80815%Definitely Violation
(DV)
1%
14318,4000.9165.41230%
15319,2001.0045.18535%
16320,0001.1154.95820%
Table 3. Base Configuration of Virtual Machine.
Virtual Machine Configuration
CPU1 Unit, Scalable Processor up to 56 Core
CPU Processing Power93,000 MI
RAM8 GB
Network Bandwidth100 Mbps
Table 4. Residual Values for the USL Model.
Min1QMedian3QMax
−5.8866−1.13960.13462.01164.3765
Table 5. USL Coefficients; Contention, Coherence modeled values.
EstimateStd. Errort-ValuePr (>|t|)
Contention σ10.05324918.78<2 × 10⁻¹⁶***
Coherence λ0.0258870.00111123.29<2 × 10⁻¹⁶***
coefficient γ61.1590172.58804123.63<2 × 10⁻¹⁶***
Sig: Significance codes: 0 ’***’ 0.001 ’**’ 0.01 ’*’ 0.05 ’.’ 0.1 ’ ’ 1.
Table 6. Result of Statistical Analysis of Variance.
S # DfSum SqMean SqF valuePr (>F)
1System161.661.61236.281<2 × 10⁻¹⁶***
2Response Time10.10.12.3960.123
3Throughput1515.5515.510,345.388<2 × 10⁻¹⁶***
4System:Response Time1000.0760.783
5System:Throughput11.71.734.052.252 × 10−8***
6Response Time:Thtoughput10.10.11.1350.288
7System:Res_Time:Throughput10.80.816.5726.84 × 10−5***
Residuals1929.60
SD: Sources of Deviation, DF: Degree of Freedom, SS: Sum of Squares; Sig: Significance codes: 0 ’***’ 0.001 ’**’ 0.01 ’*’ 0.05 ’.’ 0.1 ’ ’ 1.
Publisher’s Note: MDPI stays neutral with regard to jurisdictional claims in published maps and institutional affiliations.

