1. Introduction
Autonomous vehicles are poised to change the future of transportation. They have the capability of increasing mobility for non-drivers and mobility independence for the less affluent [
1]. They should result in reduced traffic, enhanced safety, reduced energy consumption, and lower pollution [
1]. They may also enhance transportation access equity [
2], provide greater public transportation options, reduce transit system costs [
3], and reduce commuting time [
4].
To provide these benefits, the technology must work and be perceived by users as being safe. Concerns surrounding the impact of autonomous vehicles on existing transportation systems, system performance compared to human drivers, the interaction of autonomous and non-autonomous vehicles, and usability have been raised [
4]. Potential users are also concerned regarding how the vehicles will operate when placed in unusual traffic situations [
5].
Consumer trust in autonomous vehicle systems is integral to their adoption [
6]. Kalra and Paddock [
7] contend that the level of operations needed to empirically prove safety numbers is in the millions or billions of miles; thus, consumer trust must be built in other ways [
7]. Additional operations may be needed for validating capabilities beyond basic autonomous operations.
Some of the largest benefits of autonomous vehicles can only be enjoyed when they participate in a cooperative network [
8]. Systems for vehicle sharing [
9,
10] and reservations [
9] are one component of this interconnectedness. Vehicles can also exchange data about road network conditions, hazards, their current and planned maneuvers, and other topics [
11].
In order to provide these benefits, autonomous vehicles’ communications and system decision-making must be secure [
12]. The reputation of individual vehicles is crucial to the integrity of a network of autonomous vehicles (AVs). A vehicle’s reputation may be used to inform other vehicles’ decisions about which details and transactions to accept. It also has potentially broader uses, such as for rating purposes by insurance companies, where premium prices might be decreased for vehicles that demonstrate stable performance.
This paper presents and evaluates a reputation management system for AVs, based on the use of blockchain technology. The system is proposed and assessed, via simulation, to characterize its efficacy at performing its primary function: accurately identifying malicious vehicles under various environmental conditions.
It continues by reviewing prior related work, in
Section 2. Then, in
Section 3, the system design is presented. Following this, the operational environment is explored with a traffic simulator. Next, the experimental design that is used for this work is discussed. In
Section 6, the trust model that is used for this work is assessed. Following this, the results of the experimentation are presented and evaluated. Finally, the paper concludes with a discussion of the work presented herein and key topics for future study.
2. Background
This section presents a review of prior work that informs the current study. First, current developments in autonomous vehicles and vehicle-to-vehicle (V2V) communications are discussed. Then, attacks and defensive measures for autonomous vehicles are reviewed. Finally, current limitations are considered.
2.1. Autonomous Vehicless
Autonomous, or driverless, vehicles enable the replacement of some or all human interaction by electronic devices [
13]. Advancements in the sensing and decision-making capabilities of autonomous vehicles have allowed for significant improvements to be made in transportation [
14]. A major capability that distinguishes autonomous vehicles from traditional ones is their advanced external sensing capabilities [
15]. One of the most critical technologies in autonomous vehicles is LiDAR, which is used to remotely sense obstacles’ distance [
16]. This proves to be critical for autonomous vehicles to sense and interpret their surroundings, including nearby vehicles and road obstacles [
16]. Other key technologies that autonomous vehicles leverage include radar, cameras, and ultrasonic sensors, which are most effective when paired with each other [
17].
Another component that is key to successful autonomous vehicle deployment is the communication methods between vehicles and the network infrastructure [
18]. Communications between vehicles may be classified as single- or multi-hop. The single-hop system is ideal for short-range communication, while multi-hop is better for long-range communication [
19]. Each these is dependent on the nature of connectedness in the system, which is discussed further below. Both forms of connectivity are also critical for applications such as collision avoidance and passing assistance [
19].
2.2. Vehicle-to-Vehicle Communications
The planned deployment of vehicle-to-vehicle (V2V) technology relies on an ad-hoc mesh network using a decentralized connection system [
20]. The vehicles in this system can either be fully or partially connected. In a fully connected system, each vehicle is connected for direct communication, whereas a partially connected system is comprised of only a few vehicles that are connected to all of the nodes, with the remaining being connected to high traffic nodes. Both of these technologies are possible to implement because of wireless communication and wireless personal area networks (WPANs) [
20]. The ability to efficiently communicate allows vehicles to gain a better understanding of their surrounding environment, enabling them to proactively adapt to crash threats and other irregularities [
21].
2.3. Attacks on Autonomous Vehicles
Malicious actors may seek to interfere with the operations of a transportation system network through attacks, such as traffic sign modification, GPS spoofing, distributed denial of service attacks, and injecting false information. As a vehicular network grows in size, the interconnected nature of the network increases the number of attack surfaces for malicious vehicles to exploit and magnifies the impact of attacks [
22].
There are three classification parameters to consider, according to Raya et al., when determining the capabilities and intentions of an attacker vehicle: insider versus outsider, malicious versus rational, and active versus passive [
23]. These are summarized in
Table 1.
The different types of attacks, which might be carried out by malicious actors, also bear consideration. Key attack types, which are relevant to autonomous vehicle systems, include:
Fabrication: A vehicle intentionally spreads falsified warnings, road traffic information, and certificates. This type of attack also occurs when the sender pretends that they are somebody else [
24]. An instance of this is a sybil attack. In this type of attack, a vehicle is able to impersonate multiple vehicles to send false data [
25]. A recipient vehicle trusts the data because it is being received from numerous sources, making it more likely to be trustworthy [
26].
Denial of Service (DoS): An attacker sends large amounts of irrelevant data to other vehicles to occupy communication channels and consume computational resources [
27]. The end goal of a DoS attack is to substantially interfere with or crash the network, which would significantly hamper the capability of vehicles to make decisions and navigate through their surrounding environment [
28].
Impersonation: An attacker assumes the identity of a normal vehicle in the network to inject false information [
29]. By gaining control of the identity of a vehicle in the network, the attacker is able to spread malicious information by leveraging the vehicle’s pre-existing reputation. This also typically results in the non-malicious vehicle being removed from the network, further impairing system operations [
30].
Eavesdropping: The goal of this attack is to steal information on other vehicles, such as location, by listening to network communications [
31]. Although this does not consume the computational and communication resources of a network, like a DoS attack, it is able to access private information. This gives the attacker a significant amount of information about the vehicles in the network, which can be leveraged by other attacks [
32].
Data modification: This attack is similar to eavesdropping. However, instead of passively listening to information, attackers may also modify the data before it is received or prevent the data from reaching the intended recipient altogether [
33].
Wormhole: An attacker funnels captured packets from one area of the network to another. This creates confusion for affected vehicles by altering their sense of position [
34].
Hardware: This attack tampers with sensors or components of roadside units (RSUs) and base stations. This allows an attacker to control the events or information being transmitted by network infrastructure [
35].
2.4. Defensive Measures
In this subsection, the methods and approaches used by existing vehicles for cybersecurity are reviewed.
Thing and Wu [
36] discussed how cyber-attacks may be prevented through the use of secure communications, firewalls, and device authentication. Through encryption methods, secure communications can ensure the confidentiality of data and prevent malicious actors from interacting with it. Some encryption schemes may also rely on key pairs to verify the identity of the sender [
36]. A firewall is a networking system component that controls incoming and outgoing connections using a set of rules. In AV security, firewalls may block malicious communications from being sent within the vehicle-to-everything (V2X)—communications between AVs and infrastructure, vehicles, and others [
37]—domain. Wolf et al. [
38] noted that device authentication protocols are another way of authenticating nodes using a controller certificate, which includes a controller identifier, public key, and list of authorized actions.
Several studies have also been conducted on controller area network (CAN) and electronic control unit (ECU) security architectures. Oguma et al. [
39] proposed an architecture for securing internal communications. The system utilized a proof-based architecture to address time-constraints presented by a vehicle operating in the real world. Another approach to securing the CAN was designed by Herrewege et al. [
40]. This system, CANAuth, was designed to ensure the data being transmitted across the CAN is secured. It can be applied to existing nodes to effectively defend against injection attacks. Wang and Sawhney [
38] also proposed a framework for detecting and mitigating injection attacks by calculating the latency of messages between a sender and receiver.
Over the past several years, there has been growth in vehicular ad hoc network (VANET) security research. Islam et al. presented a password-based conditional privacy-preserving authentication and group-key generation protocol. This protocol aims to maintain privacy, while leveraging a hashing function to securely exchange data, allowing the system to defend against impersonation attacks [
41]. Shrestha and Nam [
42] explored the application of regional blockchain implementations in VANETs, which they found secured their system from 51% of attacks. Along with this, they evaluated factors such as puzzle calculation and message-delivery time and their impact on reducing the success rate of attacks [
42].
This assessment of the benefits and drawbacks of current defensive measures for vehicle cybersecurity provides a useful framework upon which to base current research.
2.5. Trust in Autonomous Vehicle Systems
Implementations of trust mechanisms for autonomous vehicles have been demonstrated in smart cities. Chowdhury et al. [
43] examined the trustworthiness of vehicles based on their on-board unit (OBU) components (which are lidar, acoustic, radar, and camera sensors). They described how metrics, evaluating the functionality of these components, may be used to assess the overall reputation of the vehicle. Similarly, Chuprov et al. [
44] explored the use of data quality (DQ) metrics to determine trust among AVs. High-quality data is defined as being “fit for consumers”. Data quality influences the aggregation of trust in their AV system [
44]. Another study addressed data integrity concerns in AVs by imitating vehicle traffic on a roadway intersection and observing how faulty information, communicated by unreputable sources, may provoke vehicle collisions [
45]. Finally, Ying et al. [
46] used reputation for vehicle platoons, where vehicles temporarily organize themselves to travel together in a group. Based on reputation, these vehicles elect a platoon leader, which is responsible for expending computational resources to direct group efforts and coordinate movements [
46].
2.6. Blockchain
This section provides an overview of the blockchain technology in
Section 2.6.1. Then, blockchain’s limitations are discussed in
Section 2.6.2.
2.6.1. Blockchain Technology
Blockchain is a distributed digital ledger system that is both immutable and auditable. This technology enables users to keep track of transactions in a shared ledger that is not controlled by a central authority. The ledger is comprised of blocks, which consist of two key components: headers and data [
47]. The block header contains information, including the block number, the previous block’s hash value, a hash representation of the data within the block, a timestamp, and the size. The remaining elements in the block include a list of transactions and miscellaneous information, which make up the block data. Every block stores the hash of the one before it, forming a chain-like structure. This structure ensures immutability on the blockchain, since altering data in a block alters its hash, invalidating all subsequent blocks. Blocks are added to the chain using a consensus algorithm, which is a computationally intensive algorithm, to validate the incoming data [
47]. Applications of blockchain technology can be seen in access management for internet of things (IoT) devices [
48], ride sharing [
49], and managing healthcare records [
50]. Numerous other applications also exist.
2.6.2. Blockchain’s Current Limitations
In contemporary blockchain implementations in IoT devices, most devices (such as Raspberry Pis and Arduinos) cannot efficiently perform computations for the proof-of-work consensus algorithm, since they are constrained by available resources. Furthermore, as the number of nodes within the blockchain increases, the minimum storage requirements to store the entire ledger increases, as well—a mandate that is infeasible for most IoT devices. Although autonomous vehicles possess significantly more computational power than a microcontroller, most of their resources are dedicated to performing on-board functionality, such as object recognition and communication broadcasting, within vehicle-to-vehicle (V2V) transactions; therefore, the problem of computational and storage limitations is relevant to AVs, too [
51].
3. System Design
This section presents an overview of the system that is proposed and evaluated in this paper. First, an overview of the system’s design is provided. Then, the process used for assessing transaction credibility is discussed. Next, aggregation techniques for credibility assessment are presented. Following this, the process used for the calculation of vehicle reputation is covered. Finally, potential methods for using vehicle reputation metrics are discussed.
3.1. Overview of System Design
The proposed system is based on a blockchain network, which is composed of a two-tier structure to allow reputation data to propagate at local and interlocal levels. While the proposed system, as described herein, utilizes blockchain, any decentralized database would also work with the proposed trust management system. The comparison of the performance of different methods of data storage and transmission is a key topic for potential future work.
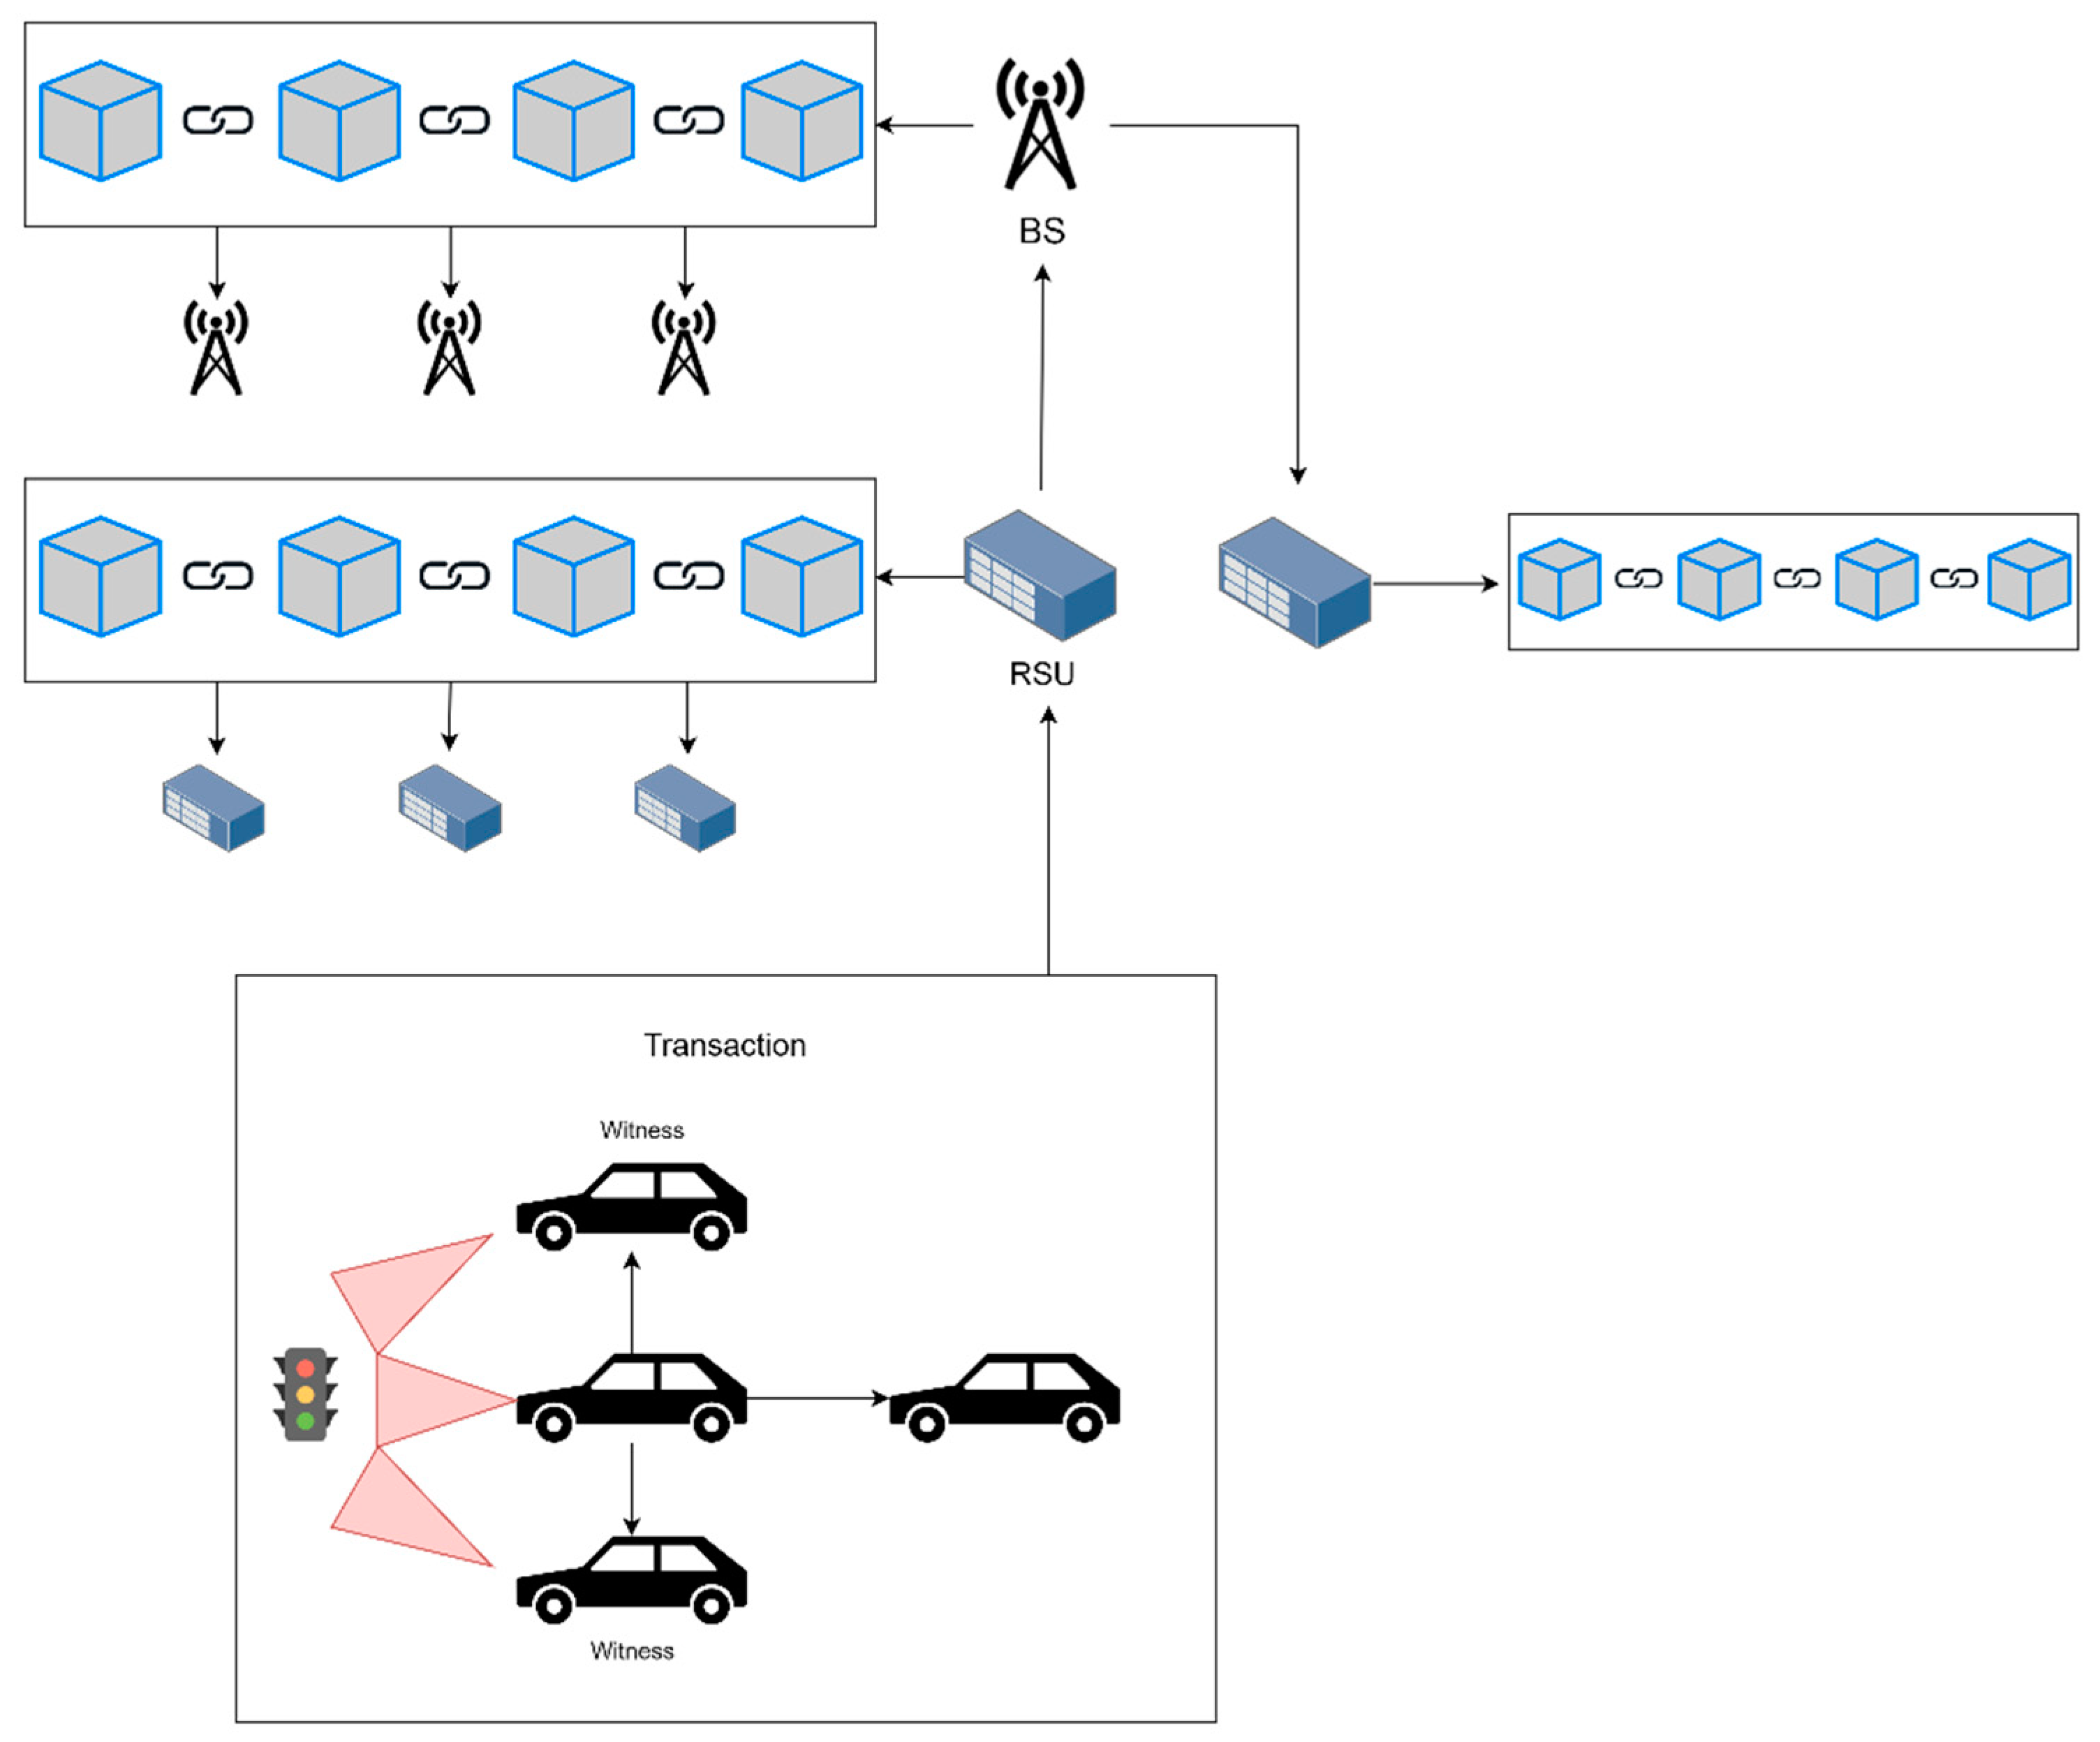
The blockchain network is designed to store reputation scores, determined from communication data, without replacing or facilitating communications themselves. At the local tier, information pertaining to V2X transactions are shared between vehicles and mined by nearby RSUs on a blockchain network, shown in
Figure 1. After being stored, the RSUs process the data to create a reputation assessment digest of individual vehicles. On the regional tier, this digest is communicated between RSUs, from which the resulting transaction is mined by base stations (BSs) and stored on the unary blockchain network, which spans across an entire geographical land mass. The proposed system aims to alleviate or reduce computational and storage concerns by implementing a hierarchical blockchain structure. Within this architecture, computationally capable RSUs and base stations are responsible for mining and appending data to the blockchain ledger, as well as abstracting these functionalities from vehicles. Furthermore, blockchain networks on the local tier are divided by geographic region to store only relevant, proximate data. These regions are dynamically defined by the RSUs, which are also responsible for handling movement of vehicles between networks. RSUs may redistribute vehicles if the number of nodes across networks becomes too unbalanced; however, frequent travel across boundaries induces networks to remain relatively static despite vehicle movement.
3.2. Assessment of Transaction Credibility and Aggregation
On the local tier, neighboring vehicles are grouped as a cluster to be a blockchain subnetwork. Vehicles use their local sensors to make observations and predictions about their environment and broadcast this data to other vehicles within their cluster. Witness vehicles exist that can confirm or deny the vehicle’s broadcasted data using their own local sensors and, subsequently, ascribe a reputation score—0 to denote a noncredible transaction and 1 to denote a credible one—to the given communication. All witness vehicles contribute a reputation score to the broadcasted communication, impacting its credibility by skewing its averaged reputation score, which is a floating-point number between 0 and 1. The sender and witness vehicles all sign the transaction with their private key, which is packaged along with the transaction contents into a block by the RSU.
3.3. Aggregation of Transaction Credibility
The implementation of how the data is processed by the RSU uses a list of dictionaries, where each dictionary in the list corresponds to the overall reputation of a specific vehicle (e.g., vehicle A); each key in the dictionary corresponds to a different vehicle (e.g., vehicle B), and the value of the key is vehicle B’s opinion of vehicle A (vehicle B’s aggregated witnesses/receipts of vehicle A). This mitigates the effect of any vehicle recurrently giving another poor ratings, as it will only affect a single key-value pair on the dictionary which holds the same weight as each other vehicle’s opinion.
3.4. Calculation of Vehicle Reputation
In the intermediary stage, before reputation information travels from the local to regional tier, the RSU creates a digest of the reputation information for specific vehicles. For each vehicle within its subnetwork, the RSU will iterate through all of the transactions that the vehicle has participated in. This includes transactions in which the vehicle was the sender, as well as transactions in which the vehicle was a witness vehicle and provided a reputation score (either 0 or 1). The RSU quantifies the reputation of each vehicle by calculating two scores: one representing its operating credibility and the second representing its reporting credibility. The operating credibility score for a vehicle represents how often the vehicle broadcasts legitimate data. This is computed by averaging the reputation scores of transactions in which the vehicle was the sender. The reporting credibility score represents how often the vehicle rates transactions accurately and is calculated by the extent of differences (i.e., the deviation) between the individual vehicle’s assessment and overall reputation score of the transaction (as determined by all witness vehicles).
Both of these scores utilize weighted mathematical averages, valuing recent transactions over older transactions. There are several ways to potentially implement this. The selected method uses an arbitrary weight,
v, which is assigned to the most recent transaction that is received. A weight of (1 −
v) is assigned to all prior transactions. This weight, referred to as ‘velocity’, serves as a multiplier for the score of the most recent transaction, in the context of a vehicle’s reputation. As the velocity value increases, more weight is ascribed to vehicles’ most recent transaction and, conversely, less weight is ascribed to their prior transactions. This way, the recency of transactions can be weighted accordingly. Across multiple transactions, the overall reputation score can be calculated using the equation:
where
v represents the velocity,
t represents the newest transaction score, and
p represents the previous reputation score.
Including the recency of transactions, several different weighting schemas are tested in the experimental simulation to determine optimal parameters for various scenarios. The operating and reporting reputation scores also rely on factoring in witness reputation, to reduce the weight that malicious vehicles have in the network. To accomplish this, the reporting reputation of each witness is divided by the sum of all the witnesses’ reporting reputations. This assigns each vehicle a weight from 0 to 1, with the sum of all weights equal to 1. A witness that is more reputable will have a higher weight, while less reputable witnesses have lower weights. Then, each weight is multiplied by the witness’s initial score for the transaction and summed to determine the overall reputation of the transaction. This same method is used in calculating the reporting reputation of each witness.
An alternate weighting scheme, that was evaluated for calculating reputation scores, uses the number of vehicles that witness a transaction, since the reputation derived from a transaction with a greater number of witnesses may be perceived as more credible. To implement this, the difference between the number of witnesses in the current transaction and average number of witnesses across all previous transactions is calculated. Then, this difference is normalized. This value is used as a multiplier for the score from the transaction when updating the operating and reporting reputations of participating vehicles. This way, transactions with fewer witnesses than average have a lesser impact on the reputations of participating vehicles, and transactions with more witnesses have a greater impact.
3.5. Usage of Vehicle Reputation
The aggregated list of vehicle reputations, which takes the form of a list of tuples (where the operating and reporting credibility scores are the two data elements of the tuple), is processed on the regional tier by base stations, which package the digests into blocks and serve as blockchain miners. This hierarchical structure allows local RSUs to later request the reputation score of unrecognized vehicles from base stations in a top-down approach.
4. Traffic Simulator
To assess the efficacy of the proposed system, it is necessary to characterize the level and frequency of vehicle transactions that occur. The results of the simulation of the proposed technique were evaluated, in the context of simulated traffic patterns.
The simulation system used is based on data from Gueriau and Dusparic [
52], who captured historical traffic data from Irish roads to measure the efficiency and safety of various traffic networks. Autonomous vehicles are modeled using cooperative-adaptive cruise control (C-ACC) at level 2 automation on sections of a network that covers 5 km × 3.5 km of the center of Dublin, including 435 signalized intersections, national and 2-way roads, and 4-lane motorway stretches. Traffic flows were generated using an urban network from the Dublin SCATS dataset, which counts the number of vehicles every 6 min across 480 locations in the city.
Gueriau and Dusparic’s traffic simulator in the Eclipse Simulation of Urban MObility (SUMO) [
52] was used to inform the frequency of transactions used in the model presented in
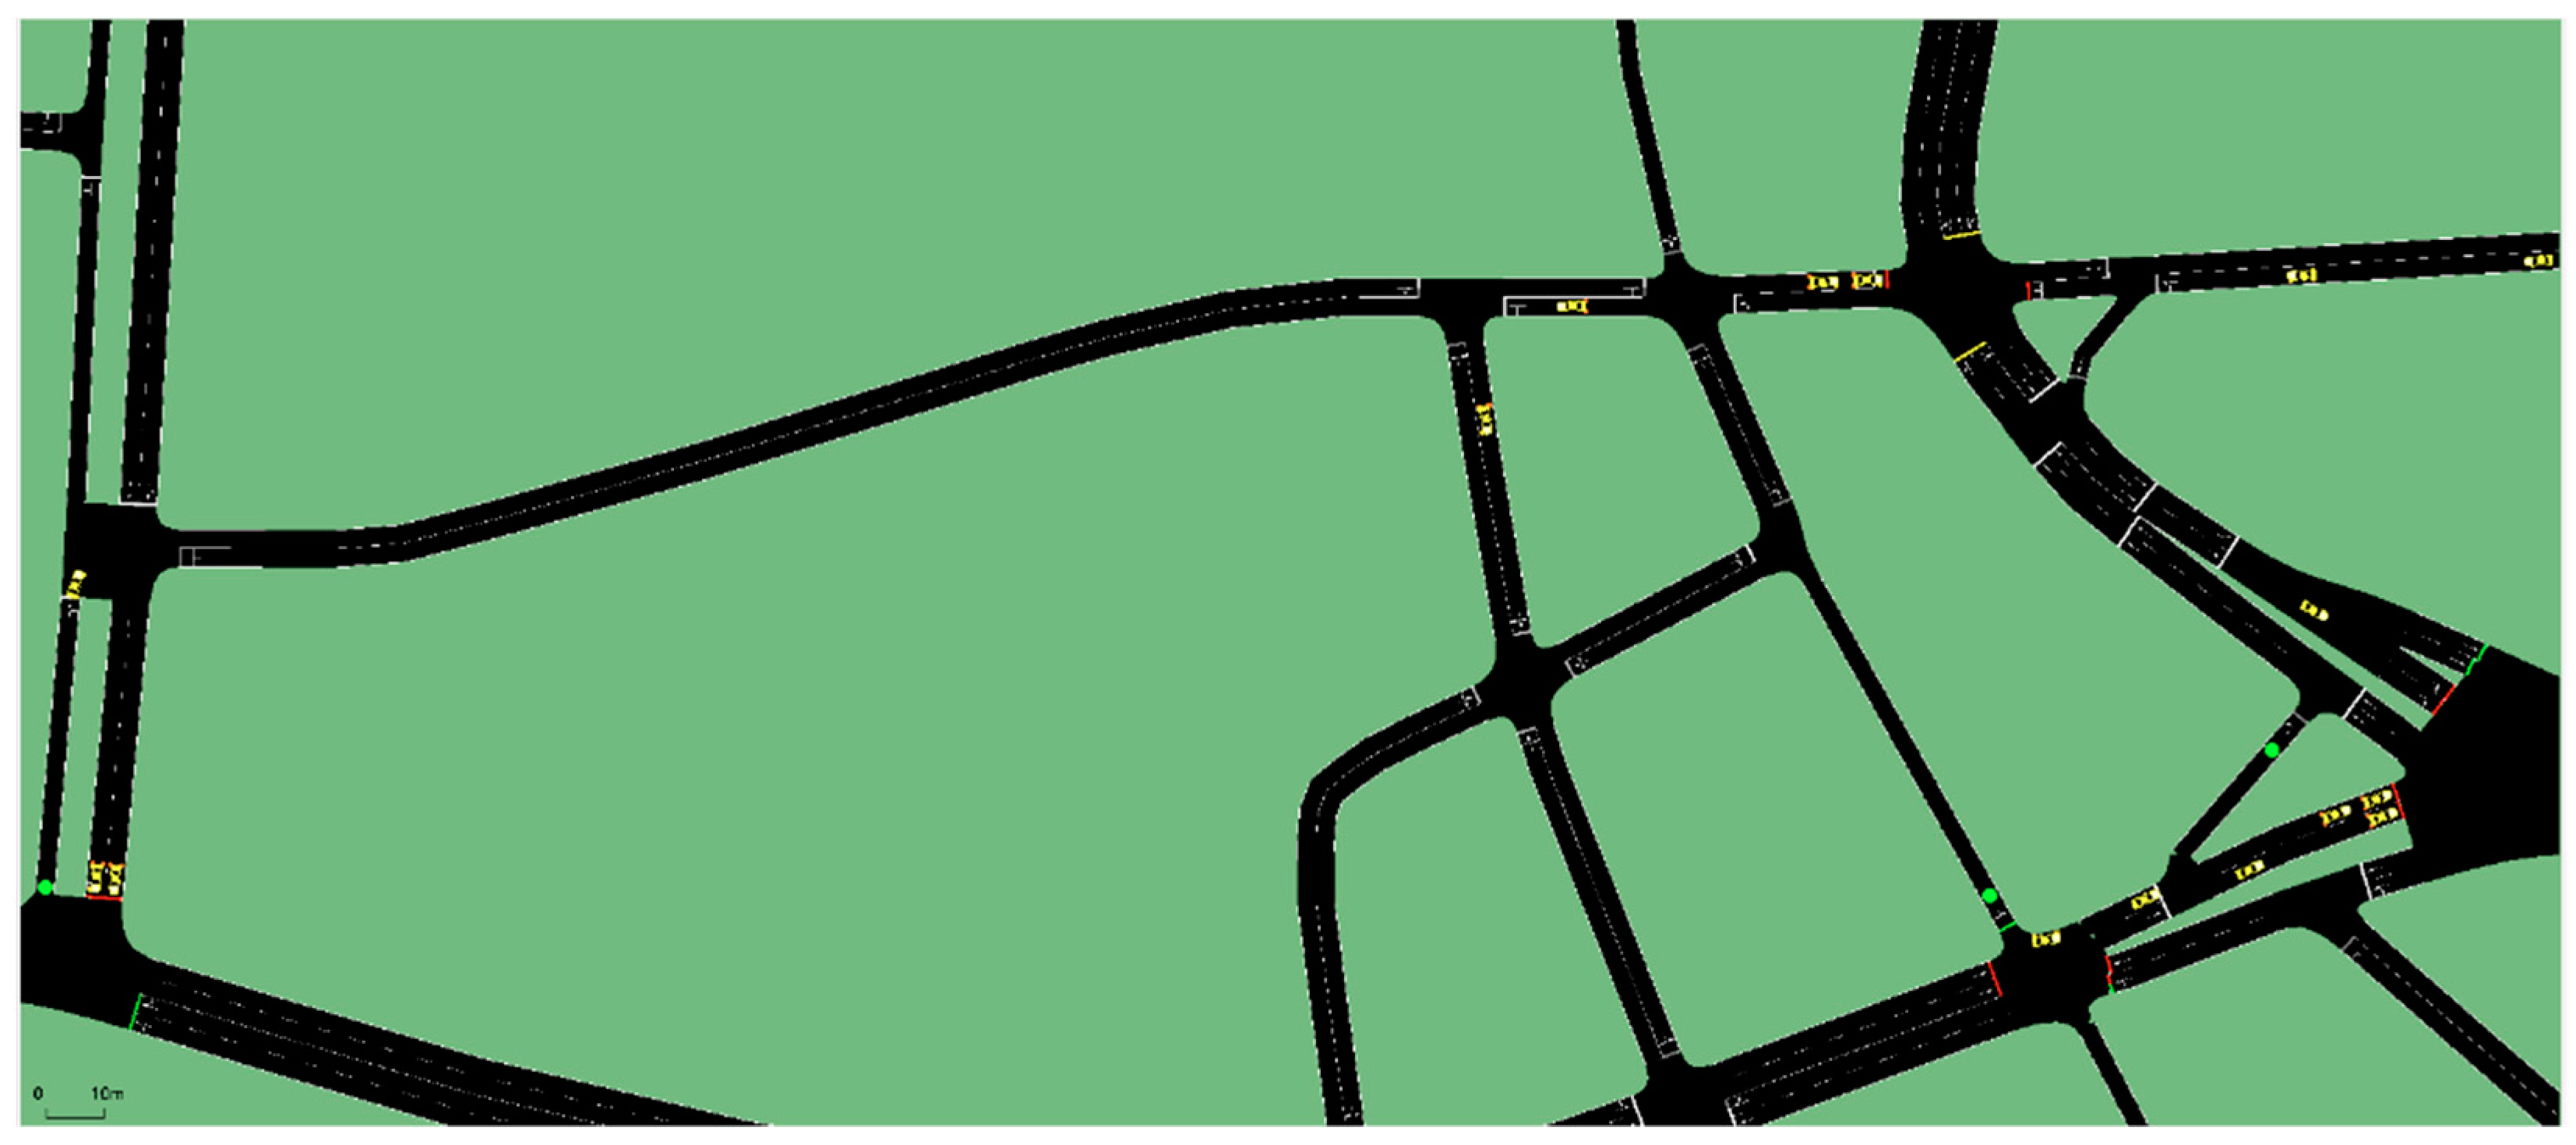
Section 5. At 1000 s intervals, 25 frames were captured from three different regions, each covering 0.44 km × 0.19 km.
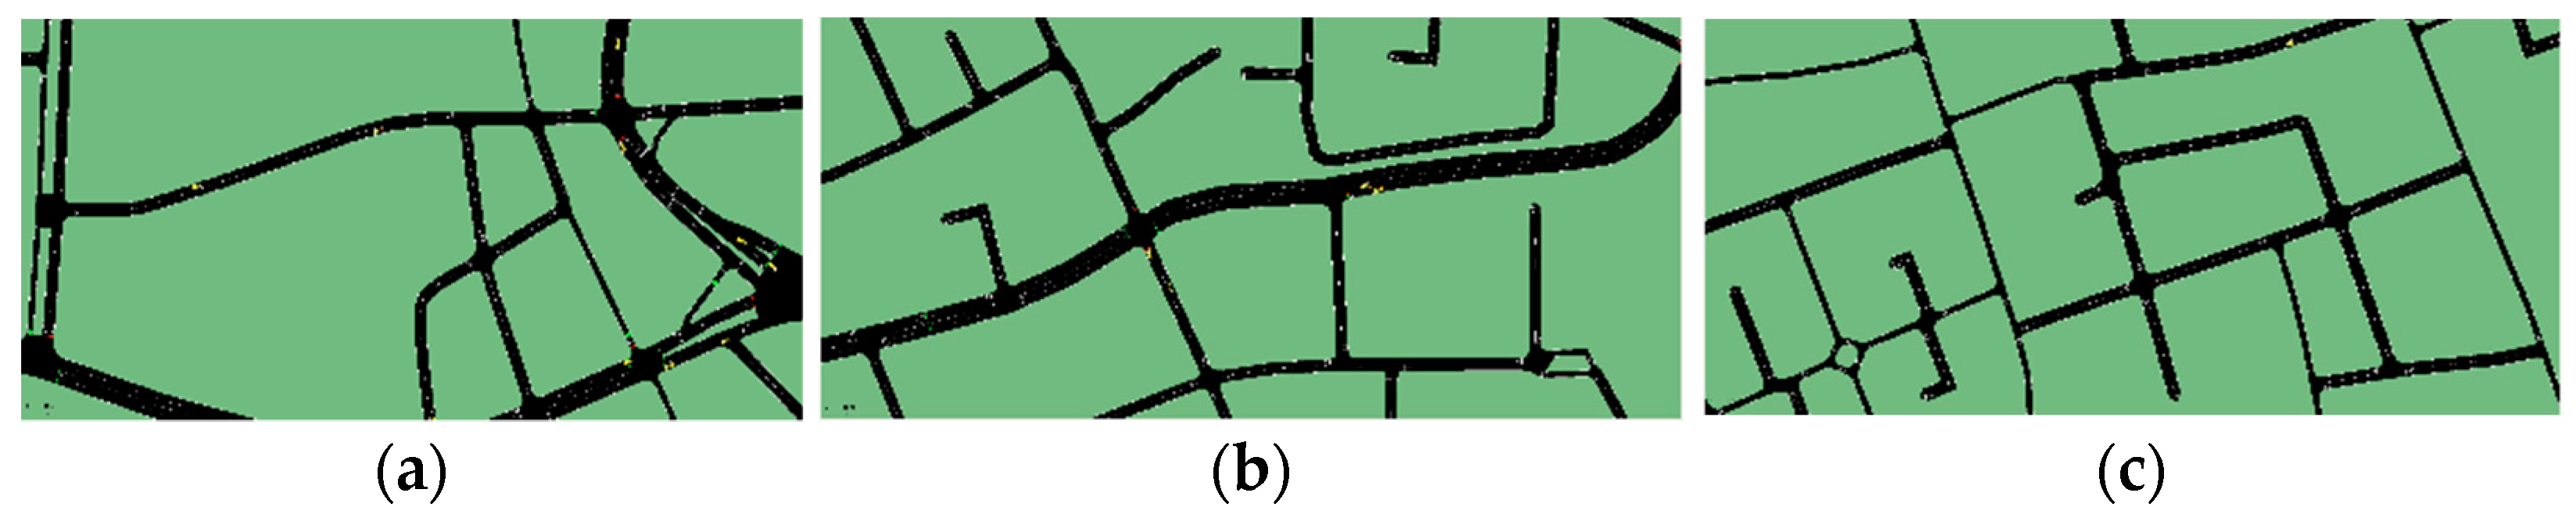
Figure 2 shows the three regions from which frames were captured, and a single frame is presented in
Figure 3. Then, vehicles within proximity (25 m) of each other’s communications were recorded in
Table 2 to determine which vehicles could witness each other’s transactions. At least one transaction occurred in 86.7% of frames, with 59.2% of vehicles in a frame participating in a transaction on average. Within the simulation, presented in subsequent subsections, these values can be used to inform the probability for a turn to include a transaction, as well as the number of recipients for each transaction. While data pertaining to traffic in Dublin was used herein, alternative simulators could be used to model traffic in other locations with varying levels of traffic congestion and AV density.
5. Experimental Design
To evaluate the proposed system, an agent-based model was implemented, where several autonomous vehicle nodes are instantiated along with the default parameters specified in
Table 3. Nodes are randomly assigned to a status: a small number become malicious operating vehicles, who send malicious communications and have a predetermined operating credibility of 0. Another small number are malicious reporting vehicles, who report dishonestly when acting as witnesses and have a predetermined reporting credibility of 0. The majority are normal vehicles, who send and report honestly (with occasional inaccuracies, as determined by the noise parameters) and will have a predetermined credibility of 1 for both fields. The predetermined credibility scores are stored in the simulation but do not influence vehicle reputation assessment decisions or initial reputation.
The simulation is run, and vehicles are allowed to randomly interact with one another, in alignment with their initial state. A random sample of vehicles nearby are selected to witness transactions and report on their reputation. The simulation is run with the aforementioned system design for a fixed period of time. After its termination, the empirically calculated credibility scores for each vehicle (based on all of their operating and reporting throughout the simulation) are compared to their initial predetermined credibility (for malicious vehicles, 0; for normal vehicles, 1). The data presented herein characterizes a variety of operating conditions to fully assess the proposed method. Those seeking to assess the prospective performance of the system in a specific environment could perform traffic analysis, as discussed previously, and use this data to inform their simulation settings choices.
5.1. Model Initialization
The process begins with the distribution of vehicle statuses, based on the given proportion of normal vehicles. For all non-normal vehicles, three equally sized subsets are made, consisting of malicious reporting, malicious operating, and complete malicious vehicle statuses. Each of these statuses corresponds to a different state of actions, when broadcasting and witnessing transactions.
Normal: A vehicle that broadcasts credible transactions and, as a witness, scores transactions accurately.
Malicious Operating: A vehicle that broadcasts non-credible transactions and, as a witness, scores transactions accurately.
Malicious Reporting: A vehicle that broadcasts credible transactions and, as a witness, scores transactions inaccurately.
Complete Malicious: A vehicle that broadcasts non-credible transactions and, as witness, scores transactions inaccurately.
The system iterates through the array of vehicles and each node is instantiated with a default operating and reporting credibility, based on its status. Additionally, an array storing all active RSUs is created. For experimental purposes, only one RSU was initialized. The simulation operates under a turn-based structure, for a number of turns given at initialization. For each turn, a randomly generated floating point value is used to determine if a maneuver-event or sensing-based report will occur; if so, subsequent probabilistic determinations control whether a malicious or normal vehicle will broadcast the transaction.
5.2. Model Operations
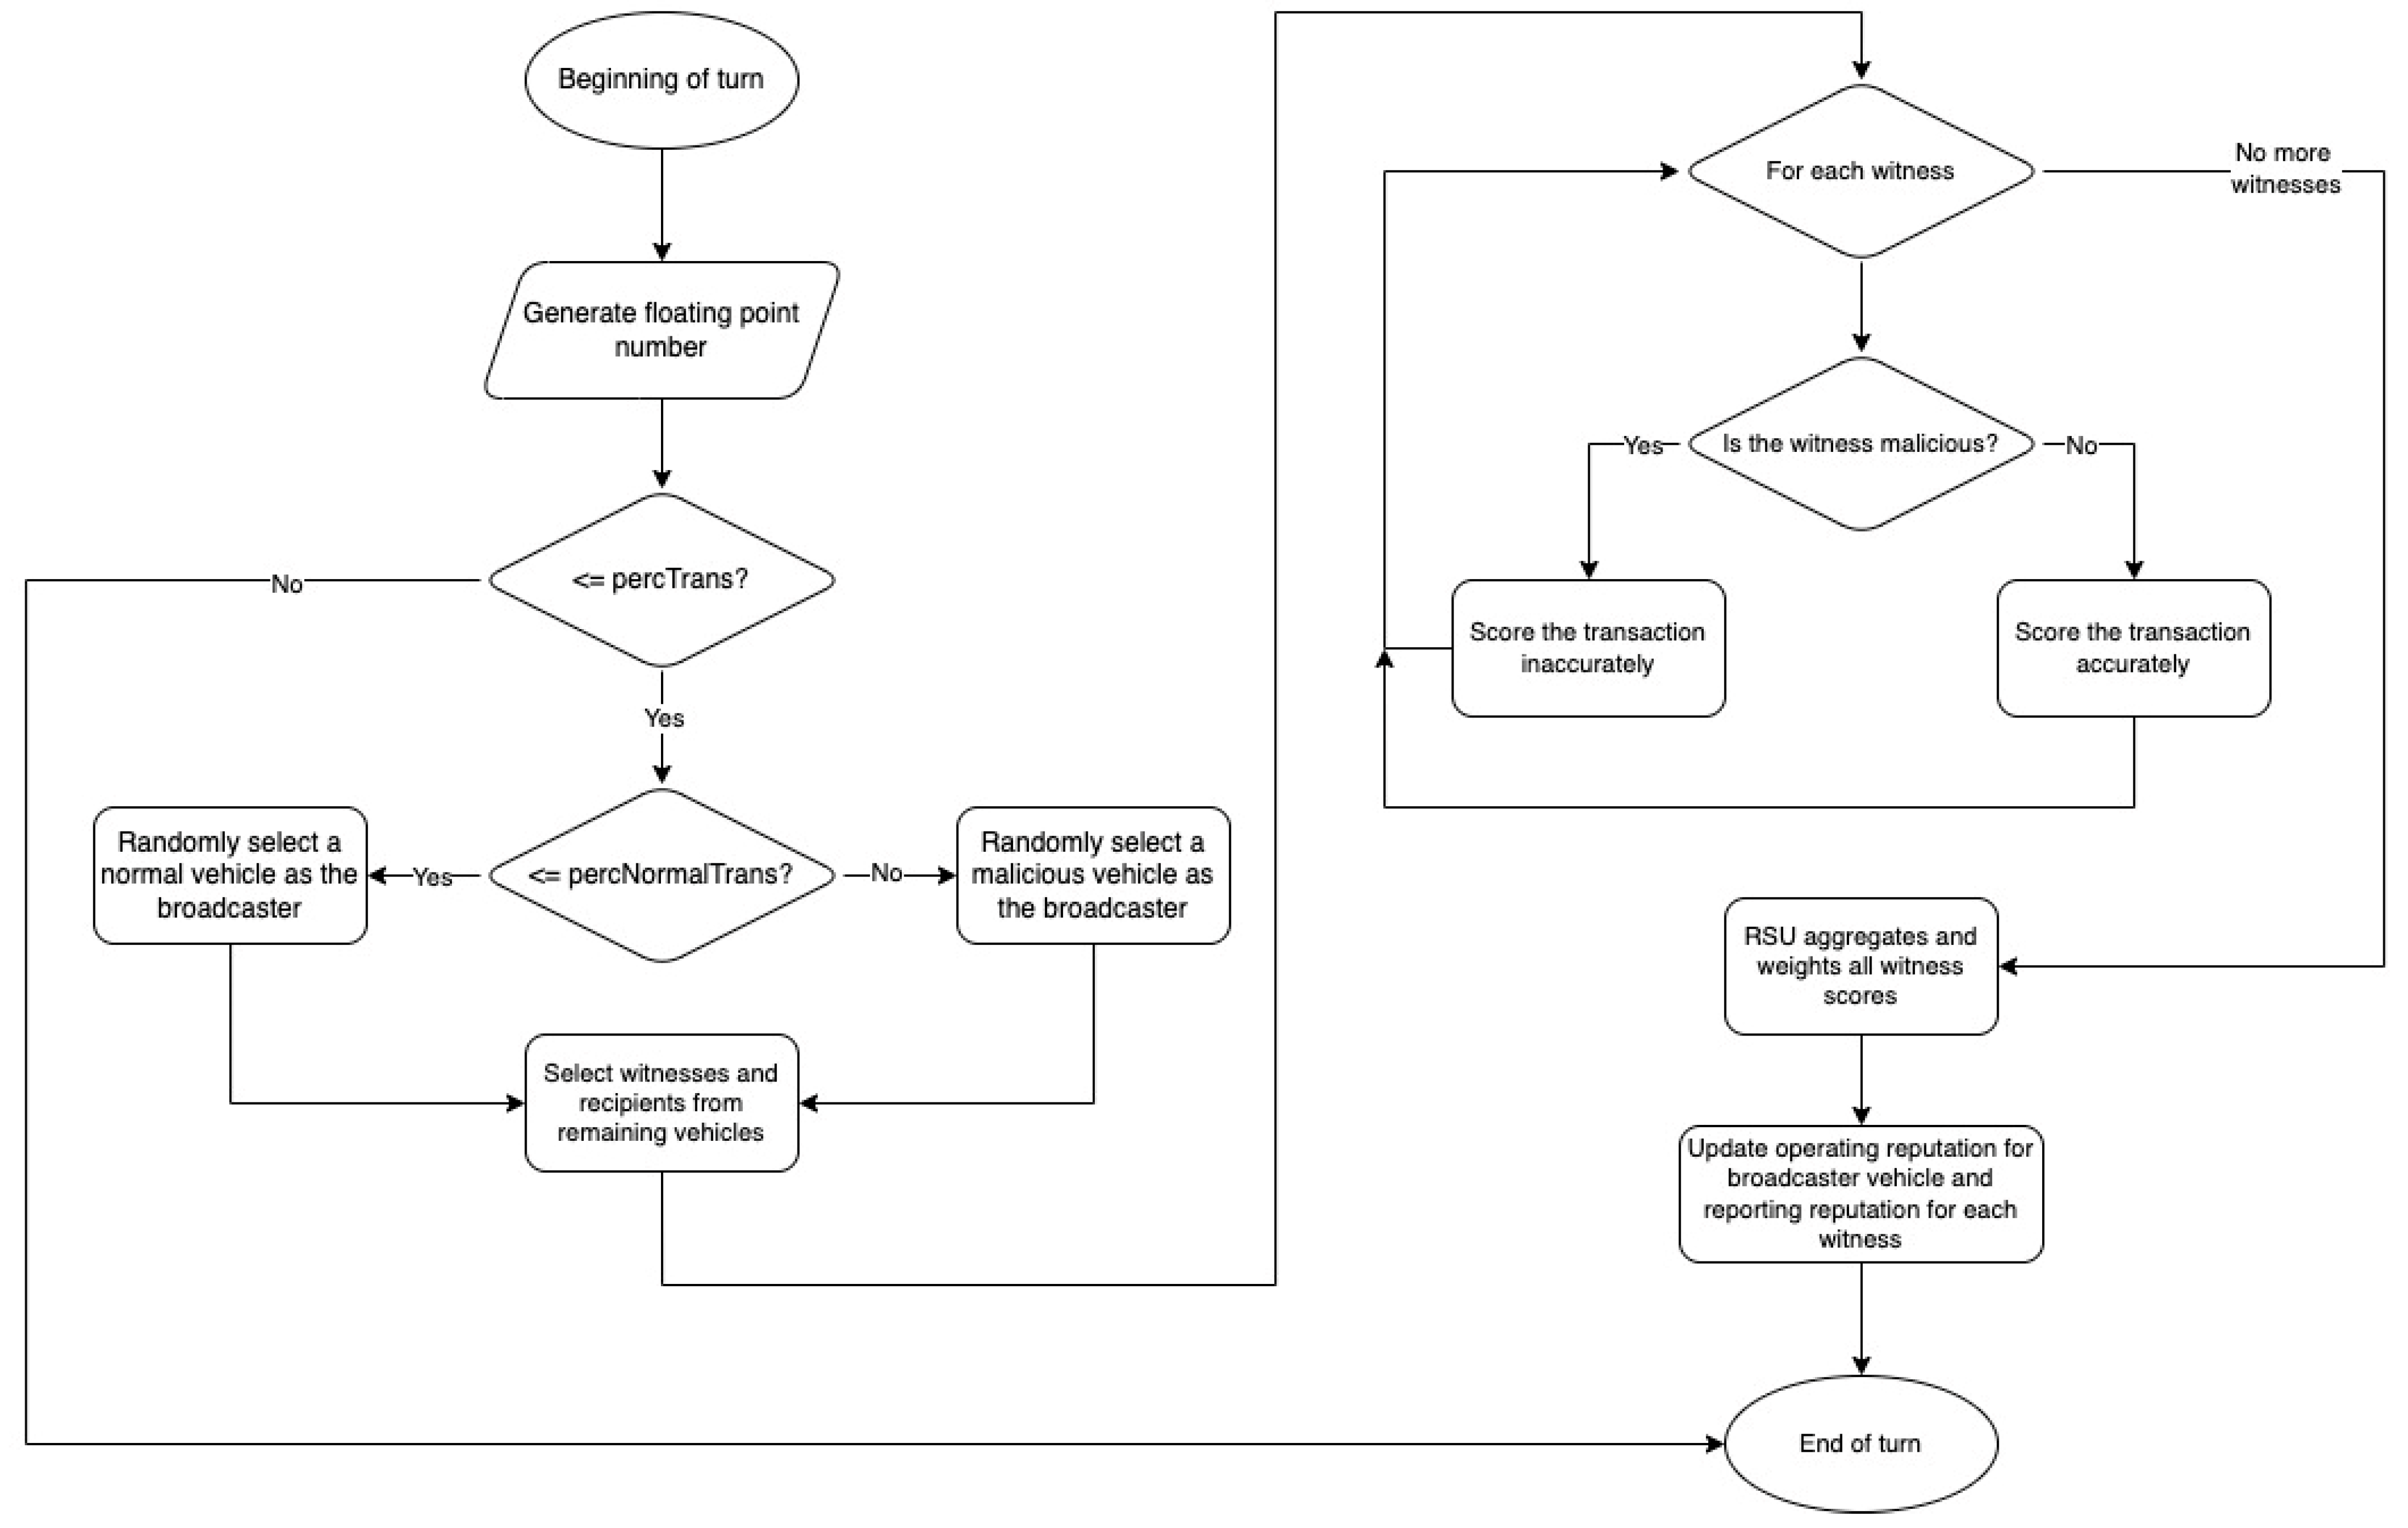
The model runs for a given number of turns, which represents the time component of the simulation.
Figure 4 illustrates the lifecycle of a turn. For each turn, a randomly generated floating point value is used to stochastically determine if a maneuver-event or sensing-based report will occur. Once this first determination is made as to whether such an event will occur or not during the turn, subsequent determinations are made, regarding what type of vehicle initiated the event. The recipients of the transaction are randomly selected from the remaining vehicles; the number of recipients is constrained by fixed lower and upper bounds. A proportion of these recipients are randomly chosen as witnesses to validate the transaction. Along with this, an RSU is selected to store the transaction and witness scores.
The expected value of a transaction is based on the status of the sender: malicious operating and complete malicious vehicles are expected to broadcast non-credible transactions; normal and malicious reporting vehicles are expected to broadcast credible transactions. Conversely, the status of the witness determines how it scores the transaction, where normal and malicious operating vehicles are expected to score the transaction accurately, and malicious reporting and complete malicious vehicles are expected to score the transaction inaccurately. However, the expected behavior of a vehicle is inverted for a small proportion of transactions, where malicious vehicles will operate and report credibly while normal vehicles will operate and report incredibly. This accounts for real-life noise that introduces inaccuracies in vehicle behavior.
Each witness then assigns a score to the transaction, which is either 0 or 1, to denote a non-credible or credible transaction. Alternatively, a quartile system can be used, in which either 0, 0.25, 0.5, 0.75, or 1.0 denotes the credibility of a transaction with varying levels of confidence. Both were tested and are discussed herein.
After the transaction is scored by all of the witnesses, it is then stored by the RSU in a running list of transactions. The RSU then updates the operating reputation of the sender and the reporting reputation of each witness using weighted averages.
6. Model Evaluation
After the simulation concludes, the accuracy of the results is evaluated to determine the efficacy of the system. There are two metrics to do this: the operating error and reporting error. Every vehicle is initialized with a status that corresponds to a predetermined credibility score. Complete malicious vehicles and normal vehicles are ascribed credibility scores of 0 and 1, respectively, for both their operating and reporting reputation. Malicious operating and reporting vehicles are designed with more specificity: malicious operating vehicles are expected to broadcast non-credible transactions but report accurately, and malicious reporting vehicles are expected to broadcast credible transactions but report inaccurately. Therefore, malicious operating vehicles have a predetermined operating score of 0 and reporting score of 1, while malicious reporting vehicles have a predetermined operating score of 1 and reporting score of 0.
Throughout the simulation, vehicle interactions are constantly altering the operating and reporting reputations of participating vehicles. By termination, each vehicle possesses an operating and reporting reputation that may approach their assigned status, depending on the efficacy of the system. To determine the system’s operating and reporting error, the analysis process iterates through each vehicle and compares its empirically calculated reputation to its predetermined score. Thus, the operating error is calculated to be the average deviation of vehicles from their predetermined operating scores, and the reporting error is calculated as the average deviation from their predetermined reporting scores.
Additional tests were run with varied parameters to determine the optimal system settings. The parameters listed in
Table 3 delineate every setting that was altered. For each combination of parameters, the simulation was run 1000 times and the operating and reporting scores for each vehicle were aggregated, and the operating and reporting error were calculated for the entire run.
7. Results
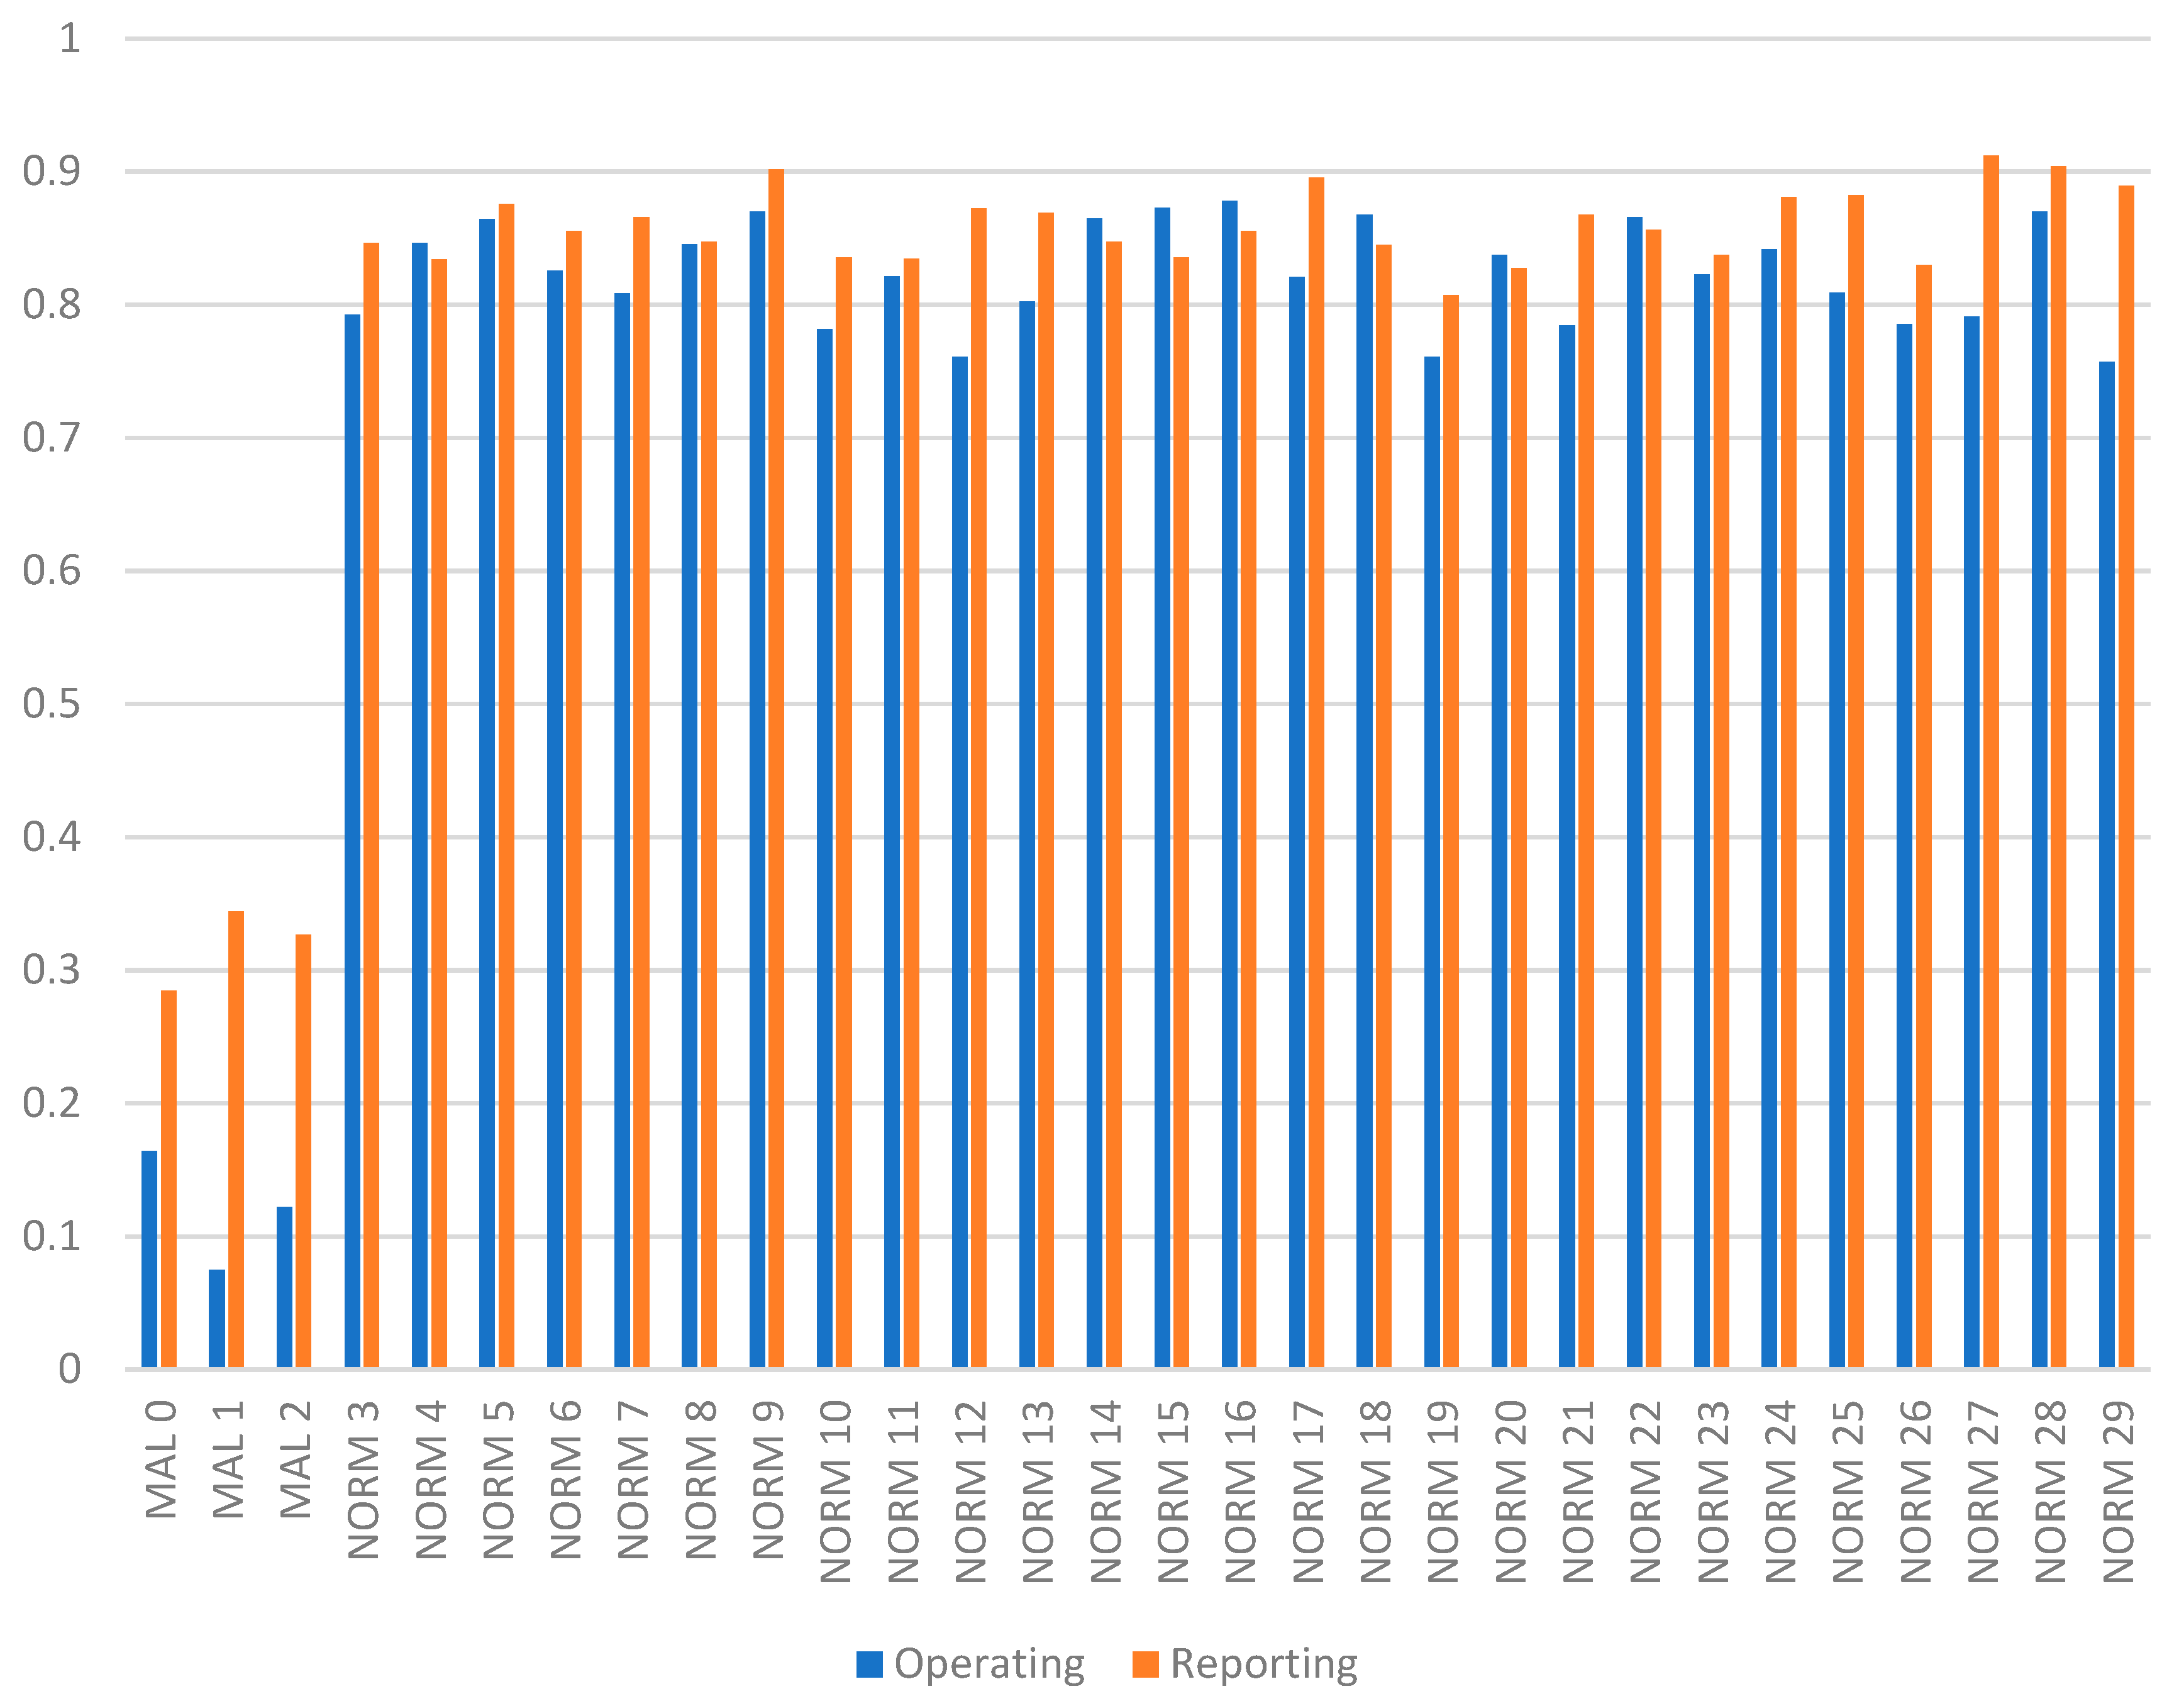
The results demonstrate the efficacy of the system. The three malicious vehicles all received significantly lower operating and reporting scores than the normal vehicles. These results are depicted in
Figure 5, which shows the average operating and reporting scores that were generated from running the base model 1000 times for 5000 turns with 30 vehicles. Notably, the operating score for the malicious vehicles was much lower than the reporting score. This is likely due to the fact that the methods for calculating operating reputation are more punitive against non-credible transactions. With an average operating error of 0.175 and reporting error of 0.160, the data indicates that the simulation was able to effectively distinguish malicious vehicles from normal ones.
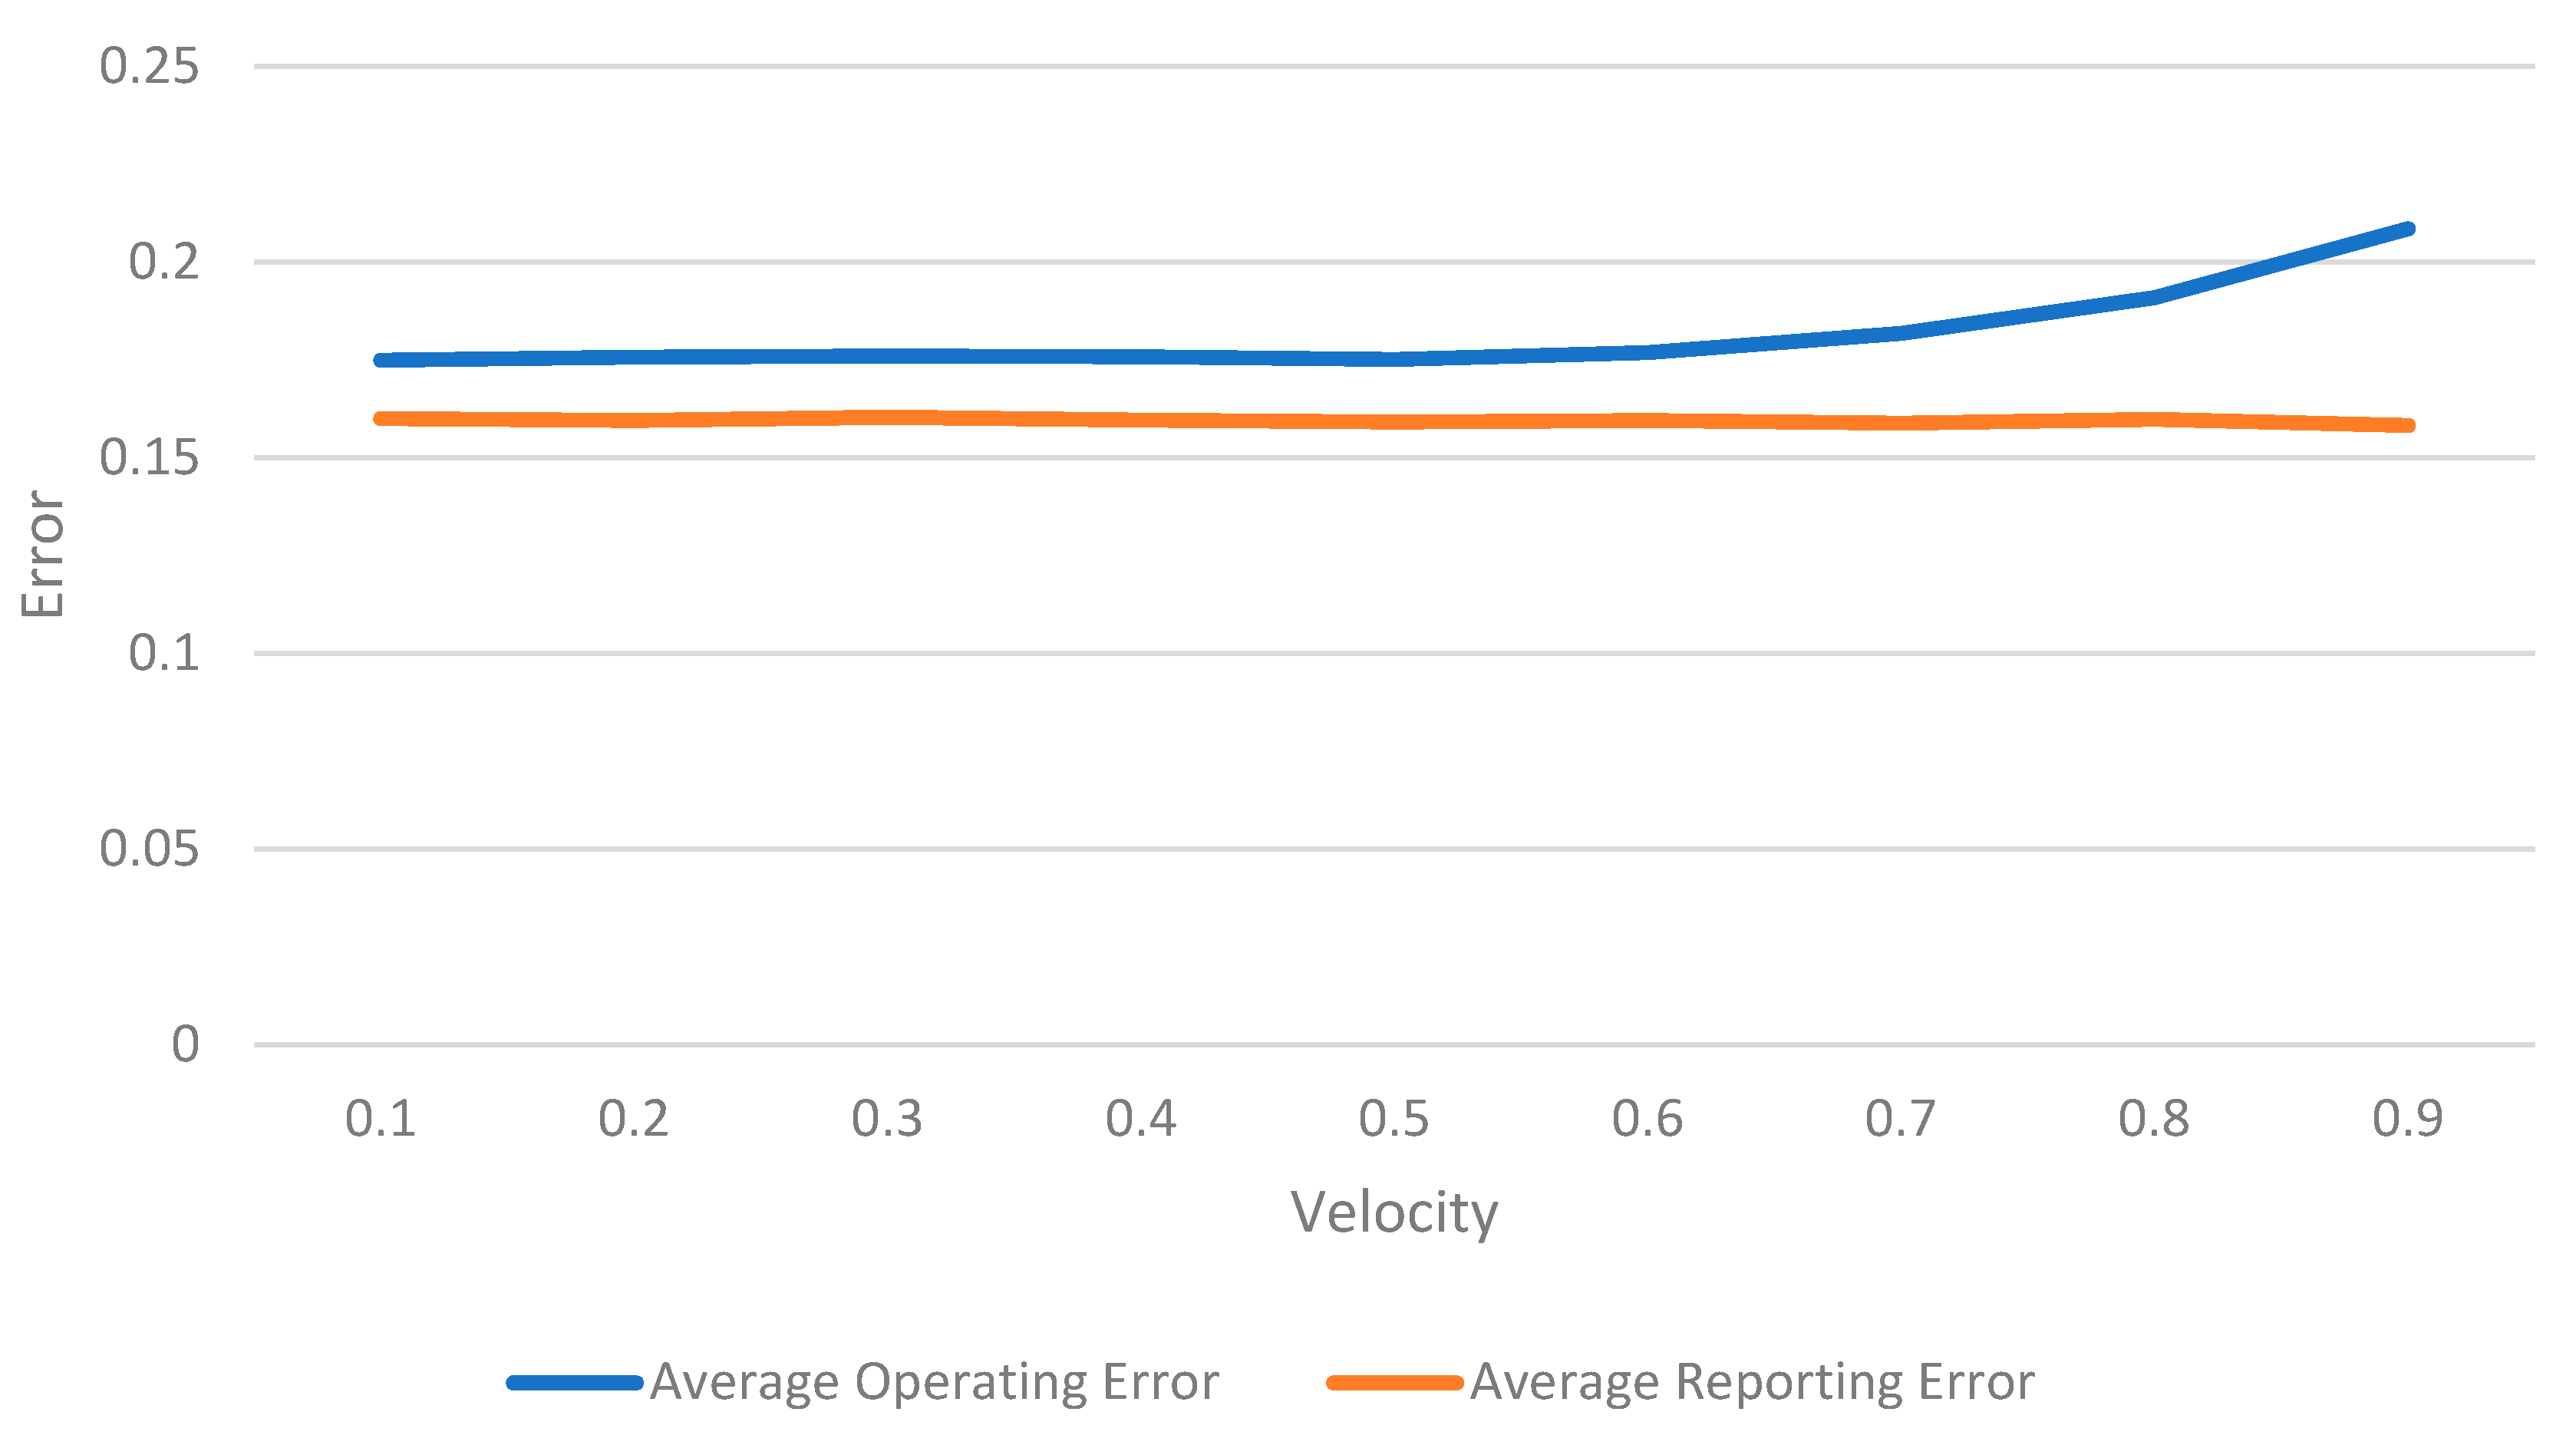
Focus now turns to analyzing the impact of system parameters. First, the impact of velocity is assessed.
Figure 6 shows that error remains relatively steady for velocities from 0.1 to 0.7, but operating error exhibits a noticeable increase once velocity goes beyond 0.7. For vehicles whose most recent transactions were rated poorly, a high velocity will adversely affect their reputation. The inverse applies as well, with high velocities having the potential to greatly increase a vehicle’s reputation if its last transactions were rated positively. As a result, an increased velocity creates higher variability in the reputation of vehicles since it is more dependent on the most recent transactions, regardless of the vehicle’s prior history.
The reporting error was less affected by increased velocity because it is unlikely that the few malicious witnesses will outweigh the score of the other normal witnesses. This is due to the randomization and distribution of vehicles. The velocity parameter was effective at aggregating reputation across multiple transactions since the average operating and reporting error were both below 0.2 for a majority of velocity values. While the difference in error remains negligible for velocities below 0.7, this is likely due to the lack of variability in the simulation. Since vehicles did not exhibit any sporadic change in status (e.g., from normal to malicious), their most recent transactions were relatively representative of their behavior throughout the entire simulation. Future work may include the introduction of vehicle nodes that spontaneously (or over time) change their status by broadcasting more or fewer malicious transactions. This could reflect the real-world possibility of a vehicle having a change in ownership or being compromised by a cyber-criminal.
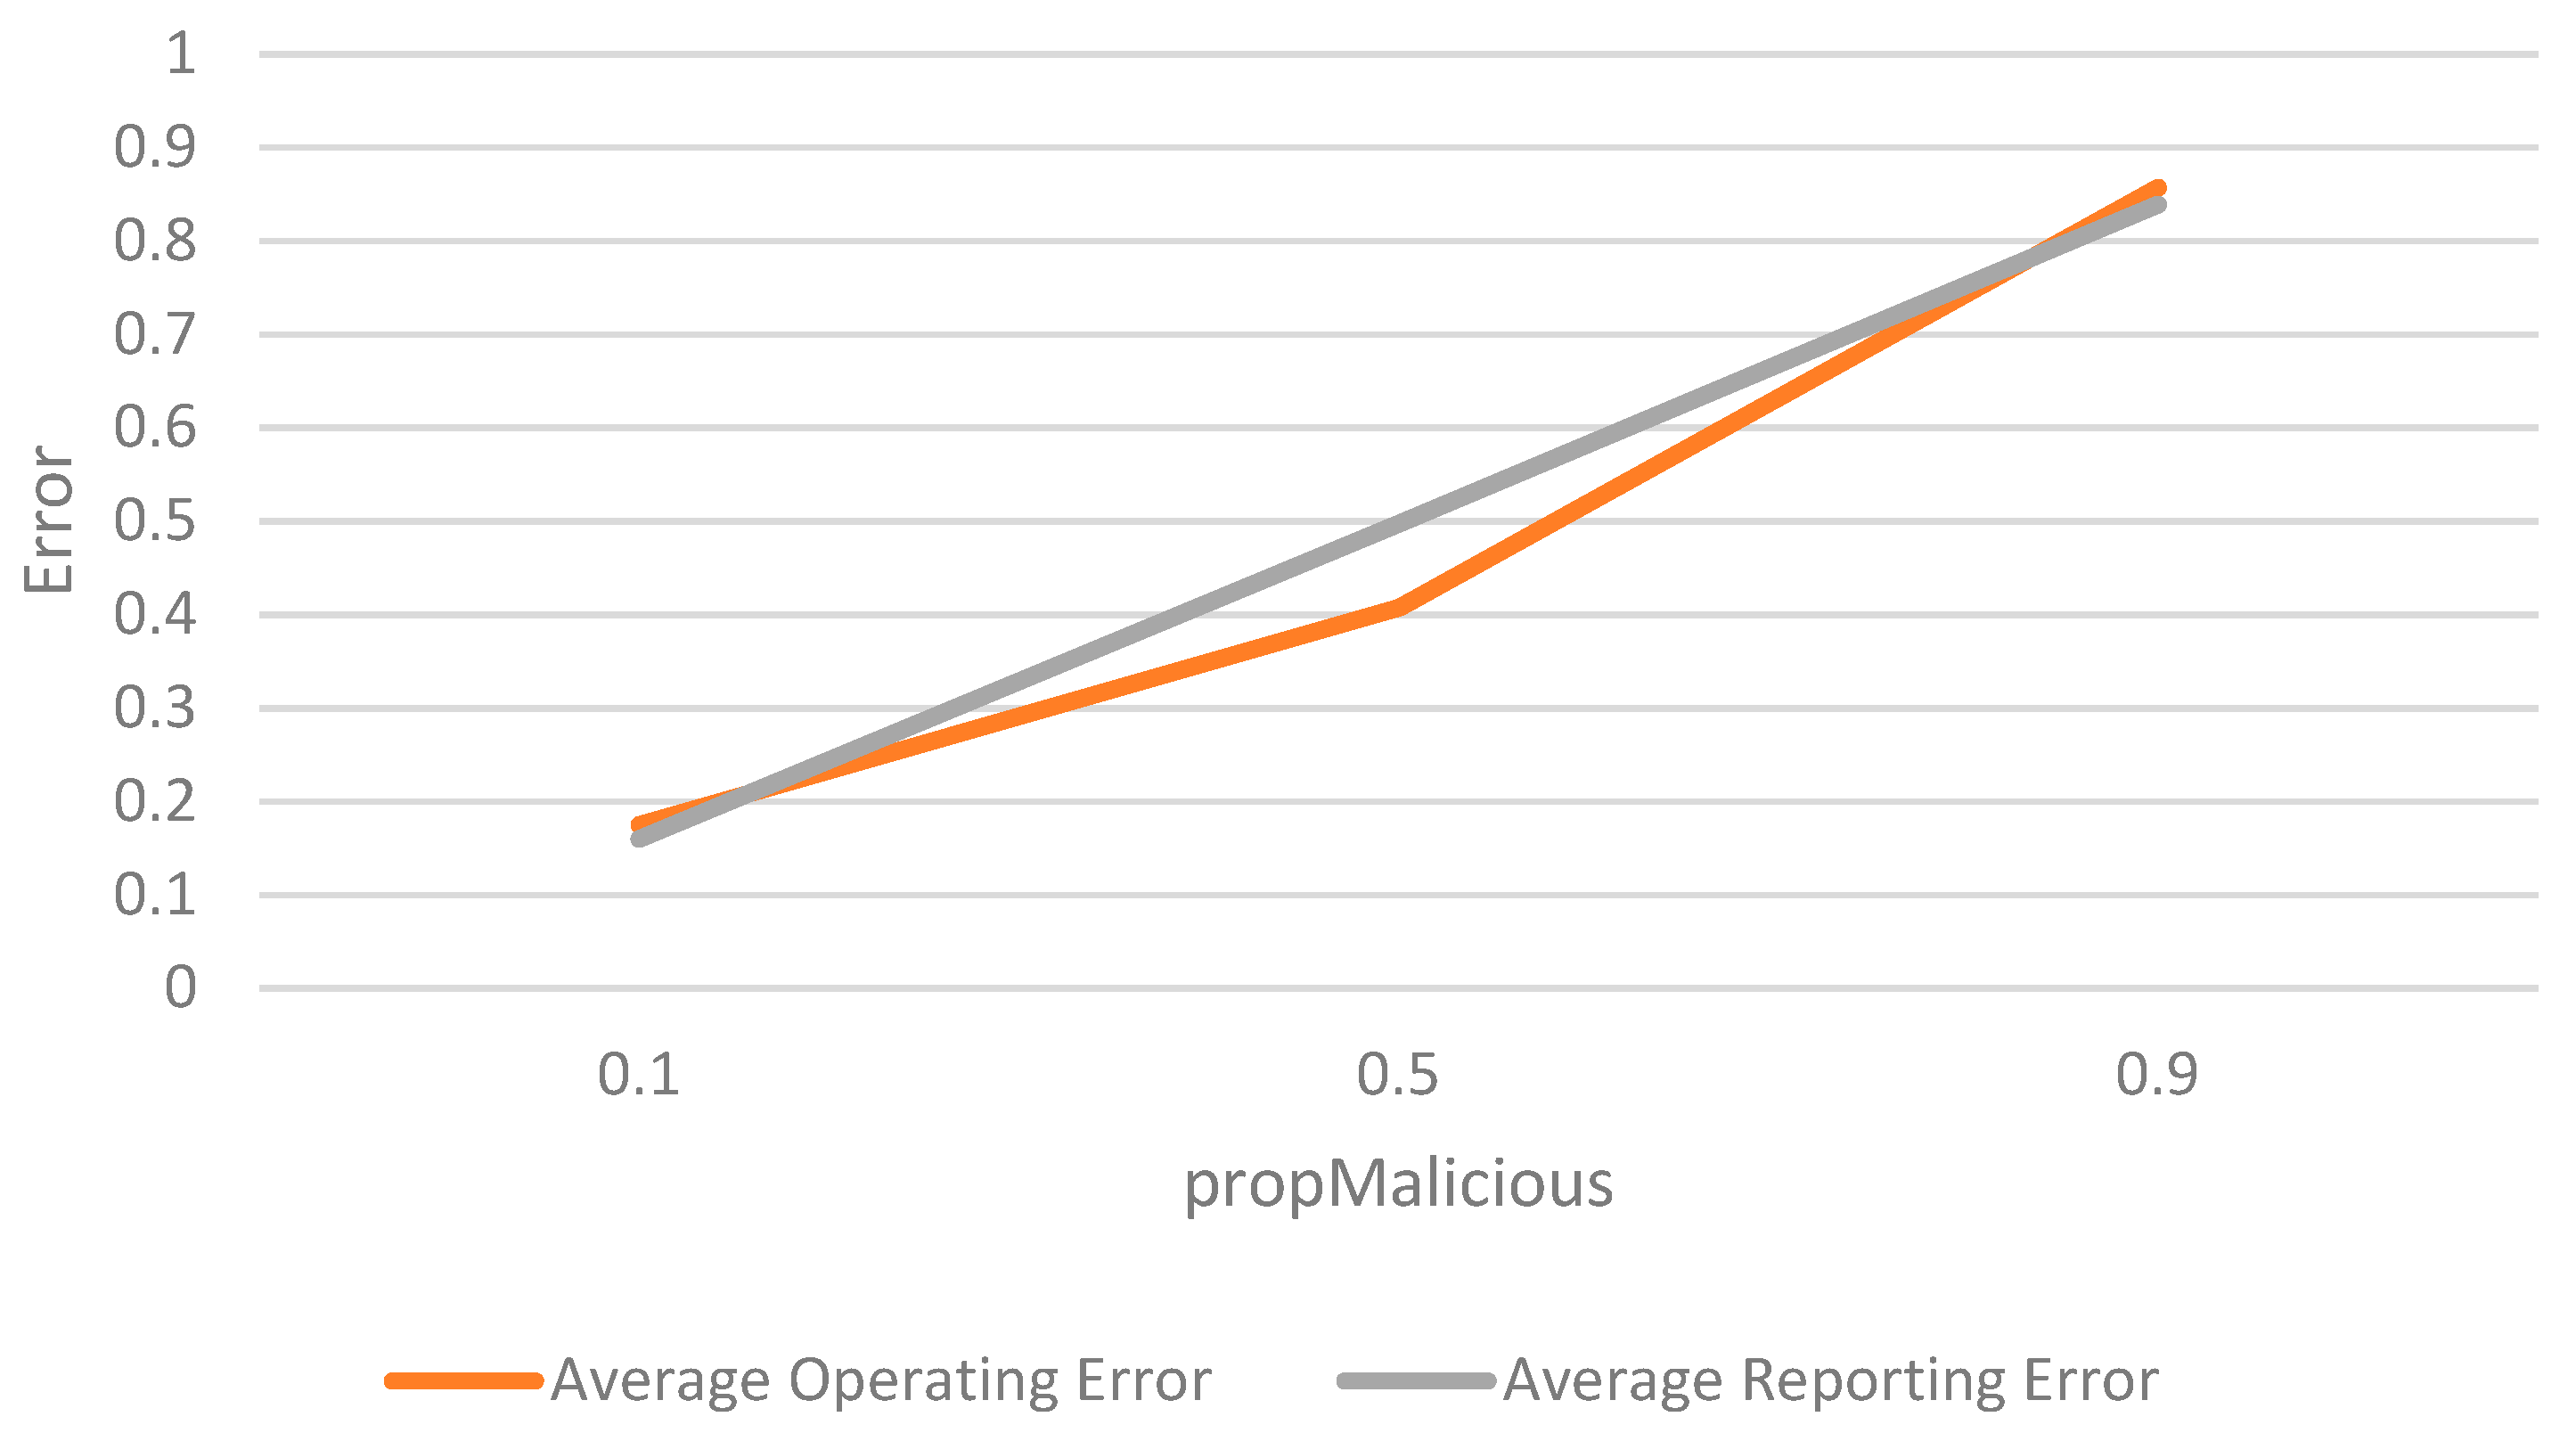
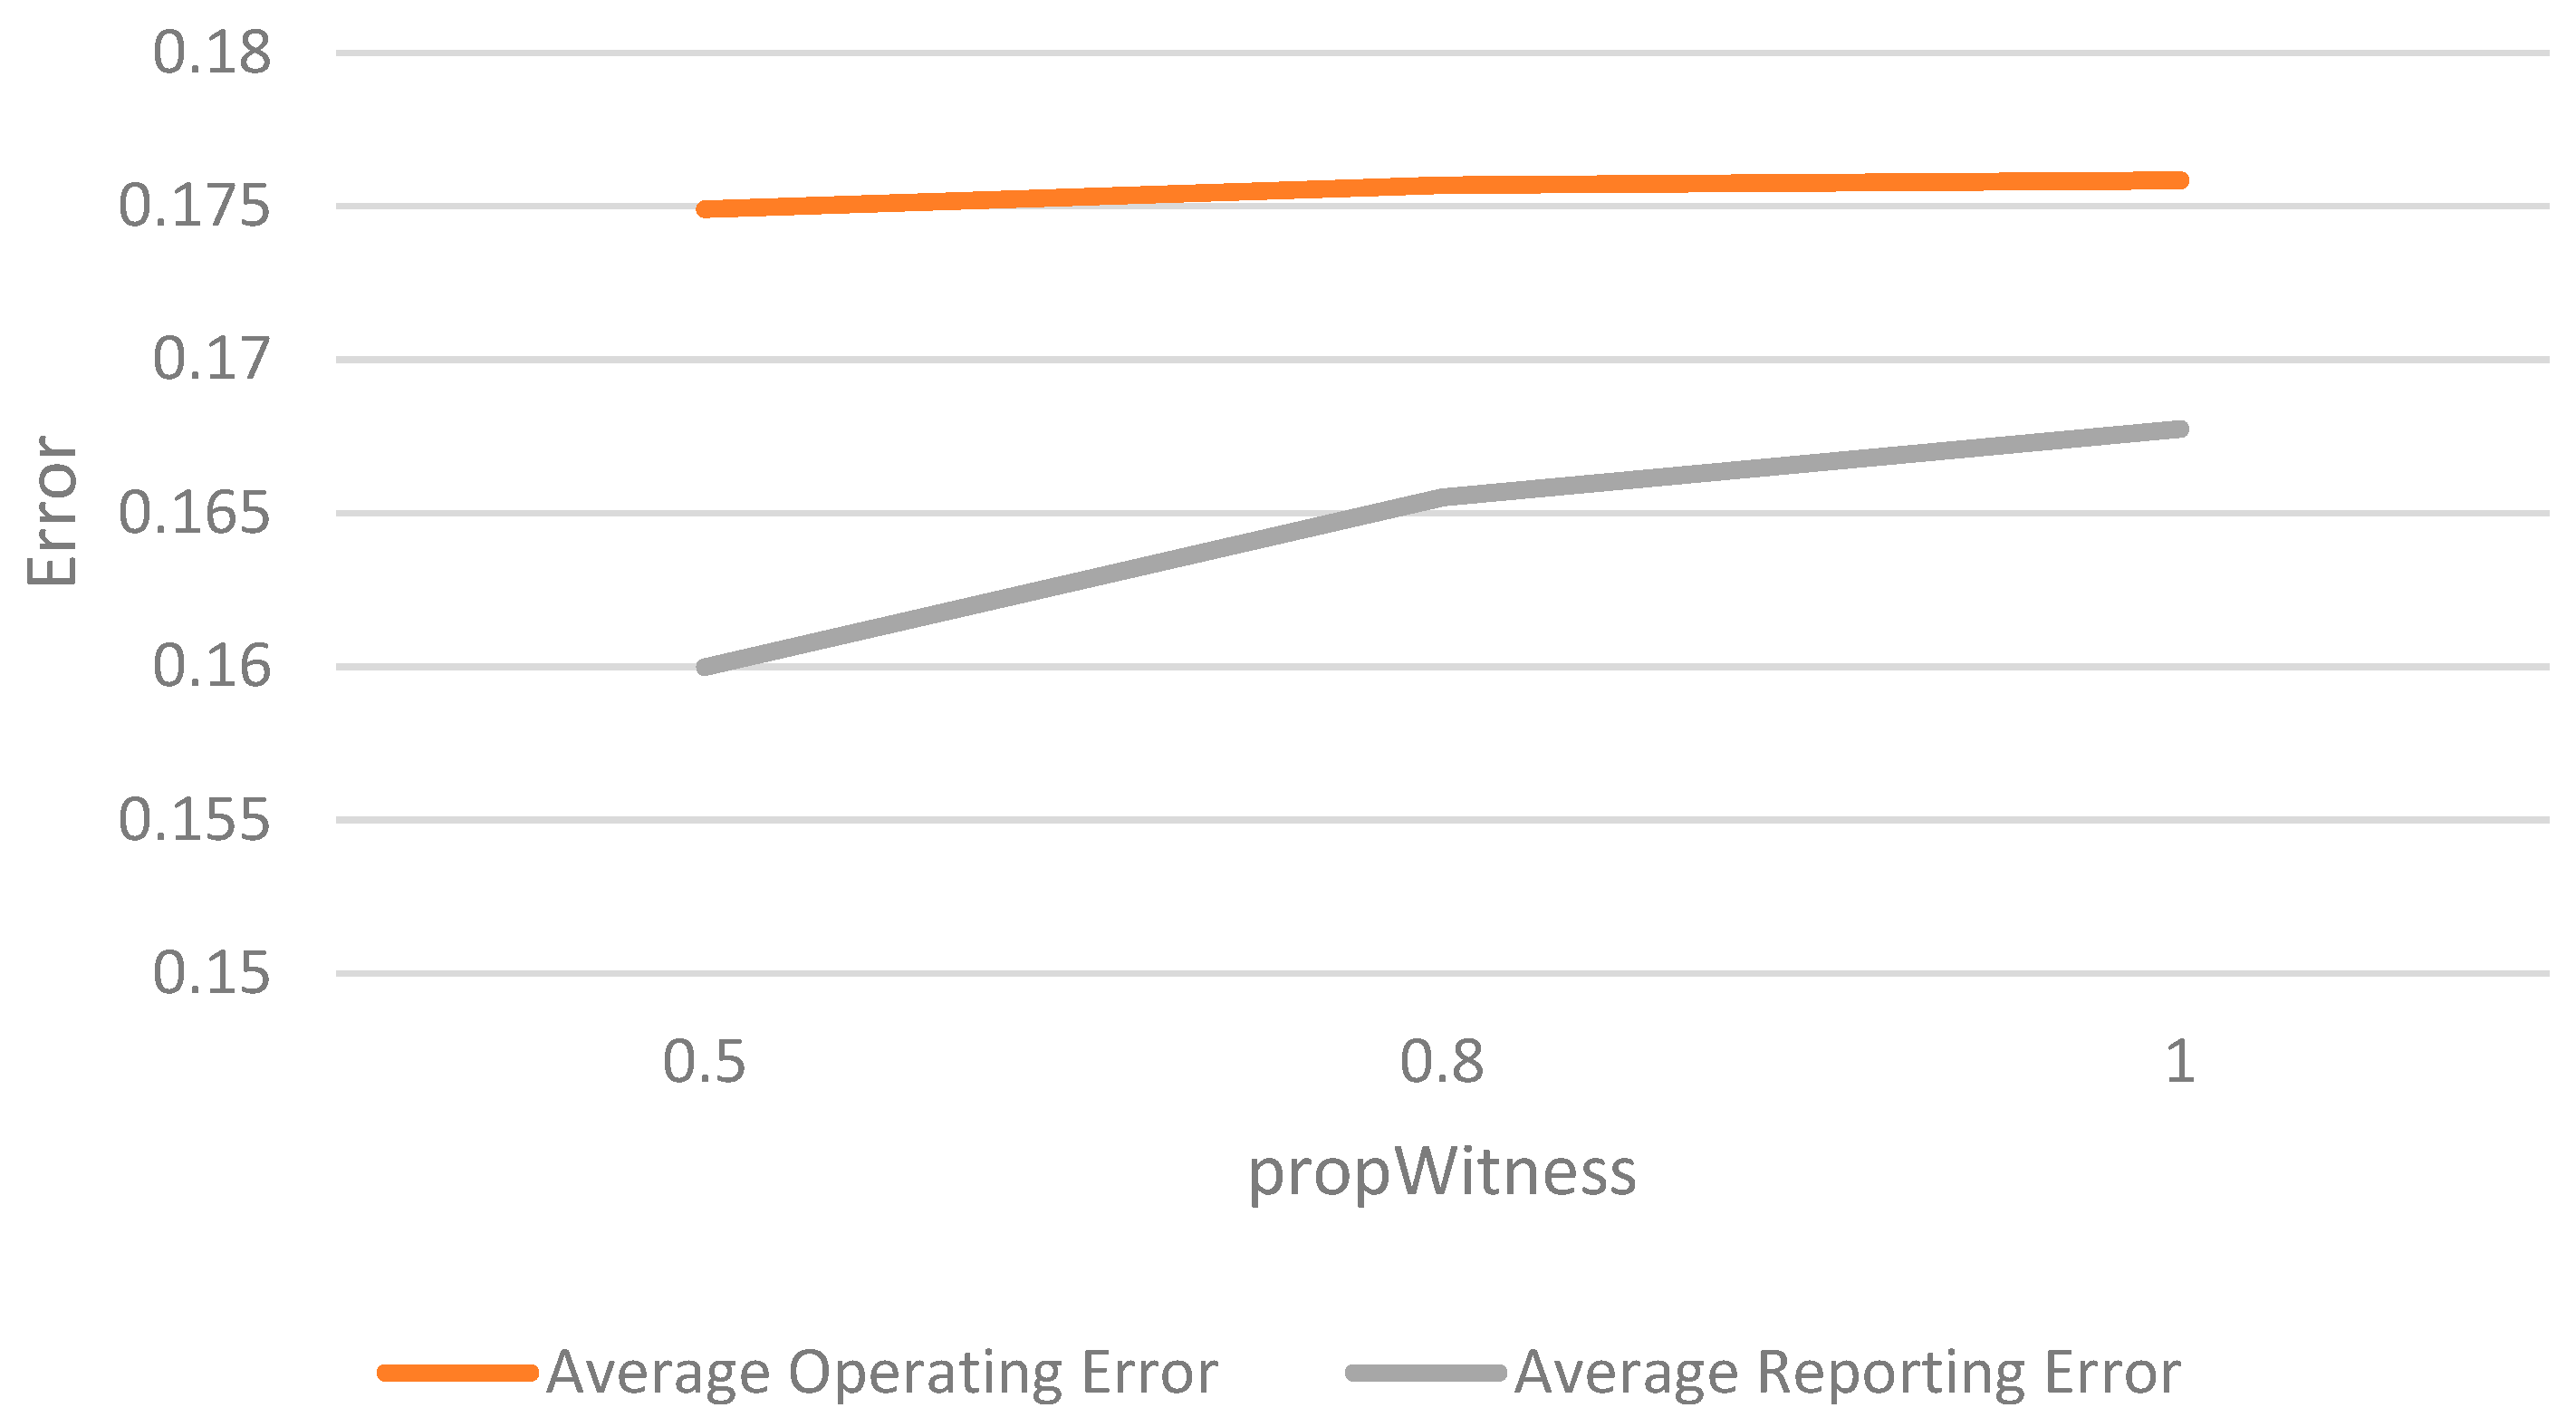
Next, the impact of different levels of malicious vehicles is assessed.
Figure 7 shows the results of the simulation with 10%, 50%, and 90% of the vehicles being malicious while the remaining 90%, 50%, and 10%, respectively, are normal. The proportion of malicious vehicles demonstrates a distinct positive correlation to the error of the simulation. At a propMalicious of 0.9, the network is dominated by malicious vehicles, normalizing this type of behavior. As a result, the error values are much closer to 1, as malicious vehicles are intentionally scoring transactions inaccurately. Observing the propMalicious at values of 0.5 and 0.9 shows that the effectiveness of the weighting mechanisms quickly deteriorates as the concentration of malicious vehicles in the network increases. These findings indicate that the model does not perform well in environments that are highly concentrated with malicious vehicles. This may indicate susceptibility to the system being vulnerable to mob-of-vehicle attacks. This result is due to the consensus-based approach to calculating reputation that heavily relies on a majority of witnesses being normal. While large-scale autonomous vehicle environments do not currently exist, the likelihood of a majority of vehicles being malicious is negligible, absent a wide-spread attack. This may be mitigated using other techniques to detect and respond to malicious users.
Now, the impact of the number of witnesses is assessed. This considers the impact of a key variable that would change from environment to environment.
Figure 8 shows that having greater numbers of witnesses results in a negligible change in operating error but an increase in reporting error. While it was initially hypothesized that increasing the number of witnesses would diminish both operating and reporting error, this was not the case; in fact, the reporting error had a noticeable increase. The implication from these results is that having more witness introduces a greater risk of including a malicious vehicle as a witness. Even a single malicious vehicle can influence the operating and reporting error from a transaction, since malicious vehicles intentionally score transactions inaccurately and reputation is calculated using weighted averages. We observe that having a malicious vehicle misreport a transaction has a greater effect on the reporting error than on the operating. This can be attributed to the fact that, for operating error, malicious vehicles may only influence the reputation of the broadcasting vehicle who sent the transaction; however, for reporting error, malicious vehicles have an influence of equal magnitude on every witness, since reporting reputation is based on a witness’s deviation from the average score of the transaction. For this reason, a single malicious vehicle also has a larger impact on the reporting error than the inclusion of another normal vehicle.
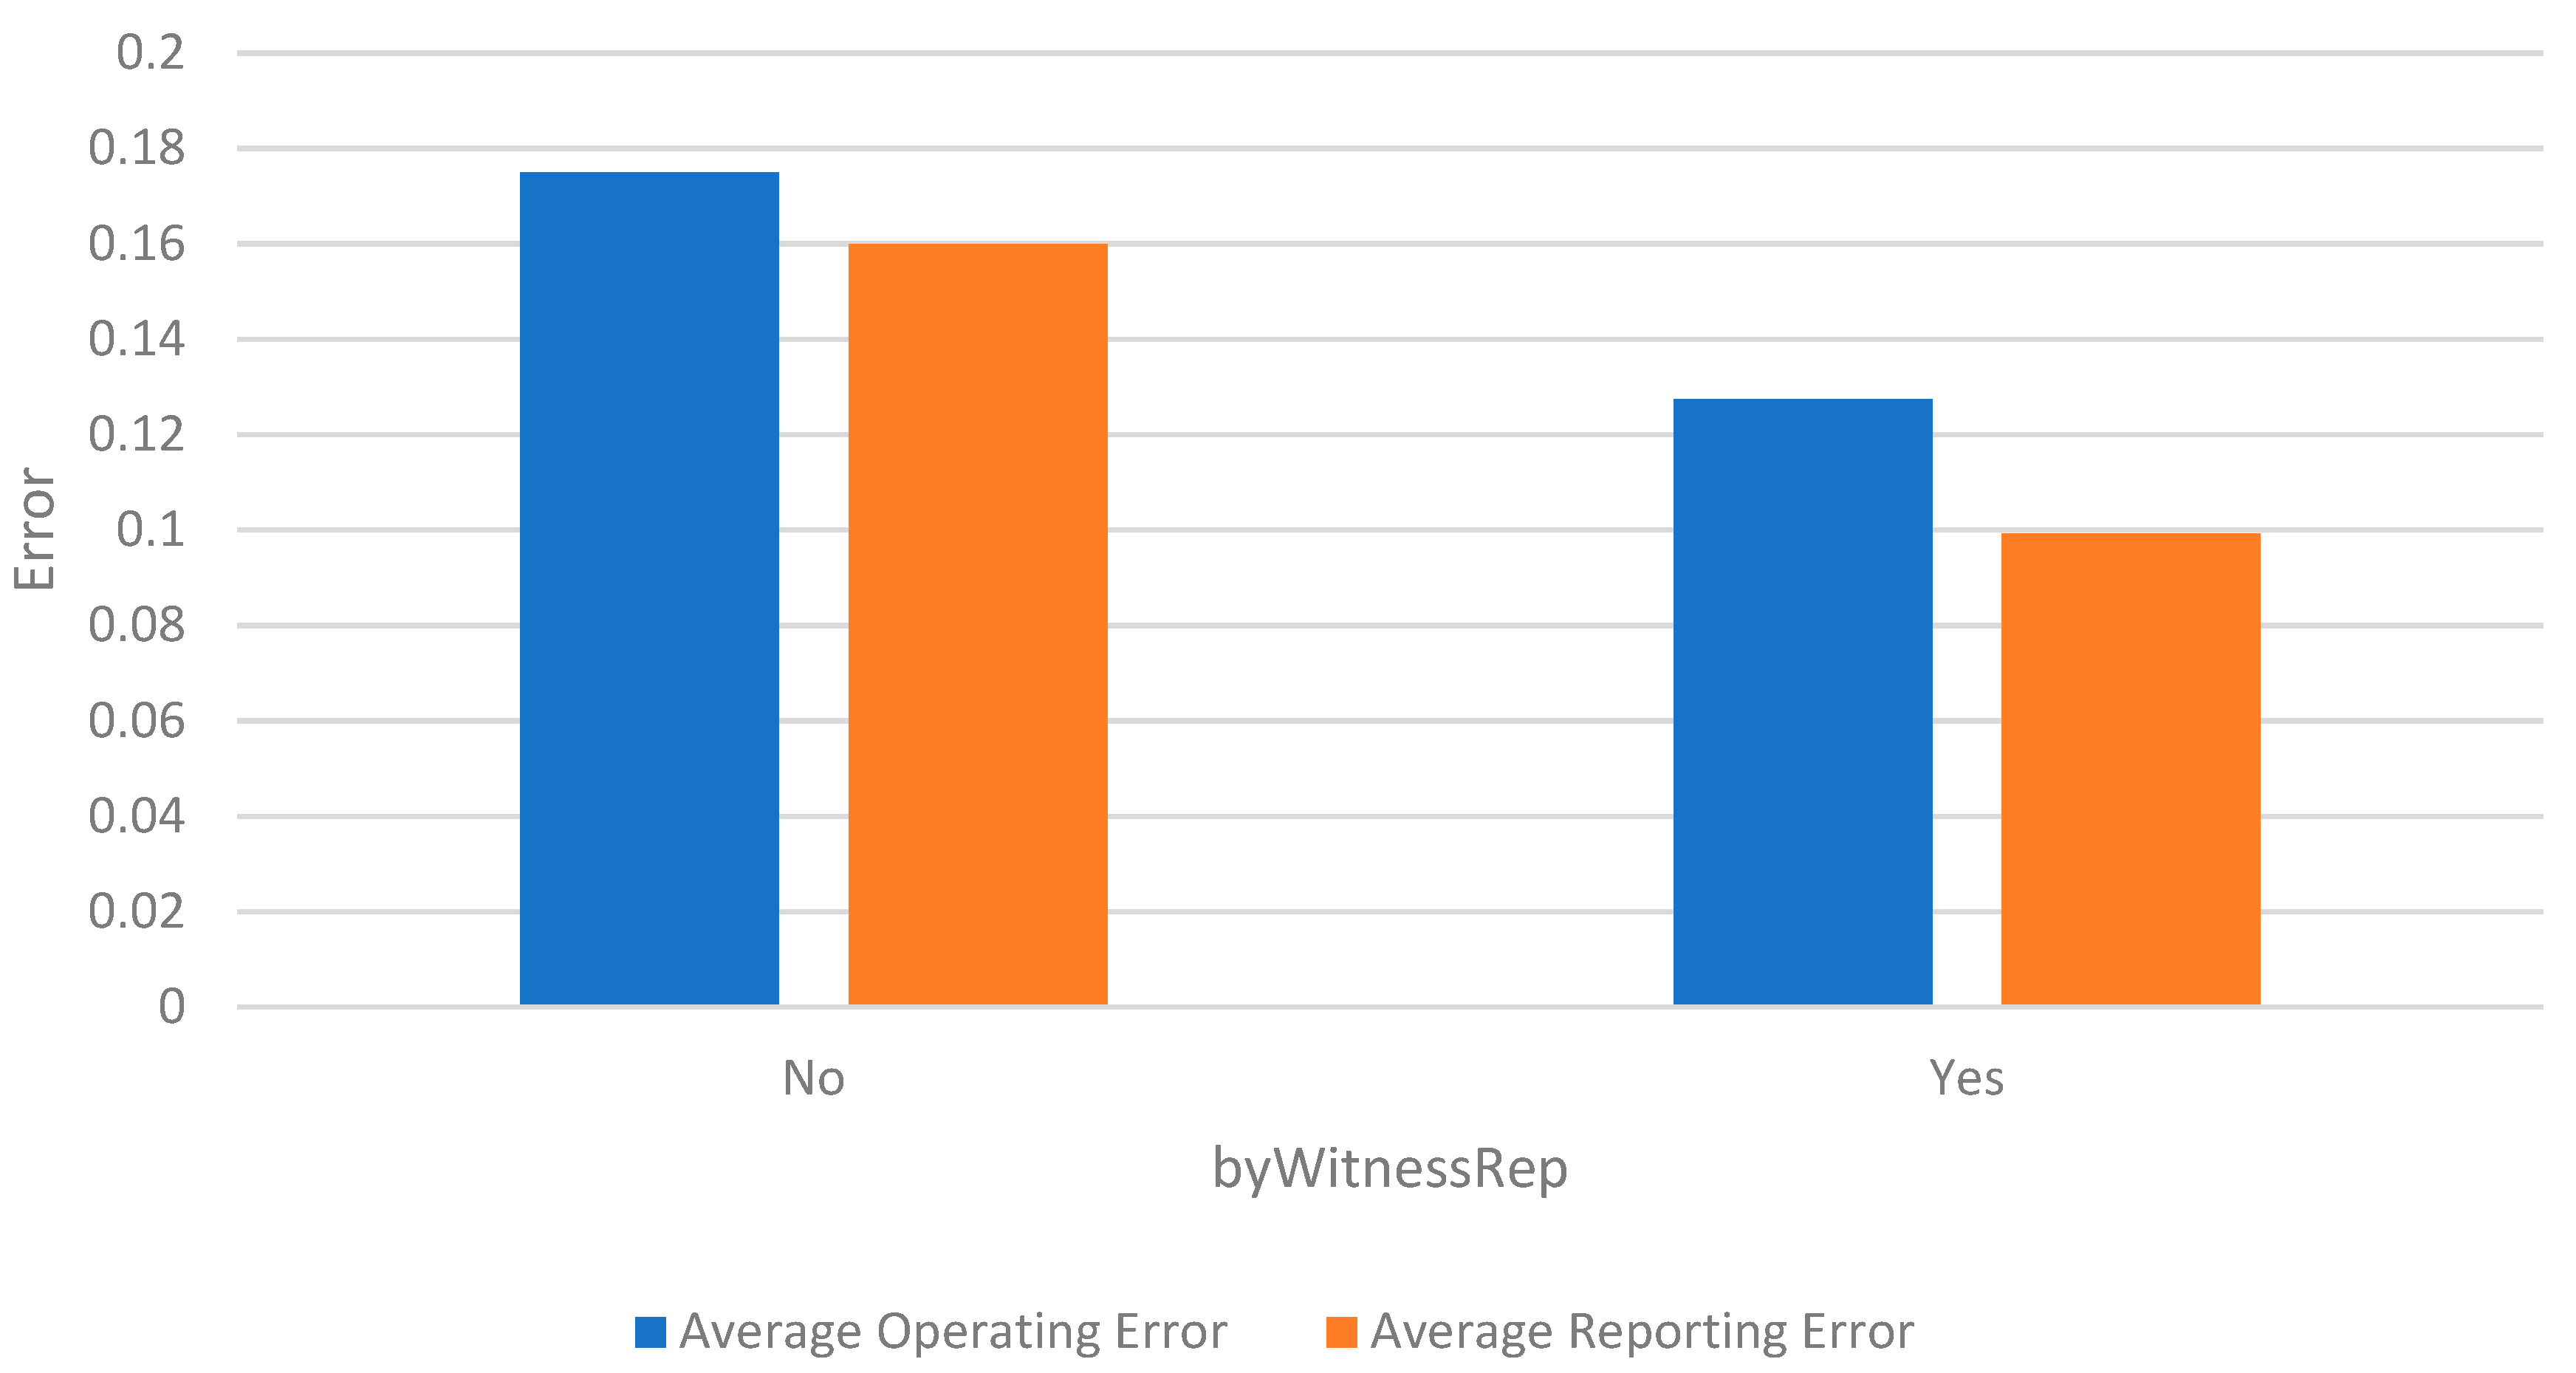
Next, the impact of considering witness reputation was explored.
Figure 9 shows the results of the simulation being run with the reputation of witnesses factoring into the overall score of each transaction. Under this approach, witnesses with lower reputations had a reduced impact on the transactions they scored, while witnesses with higher reputations had a greater impact. When implementing this weighting method, there was a noticeable decrease in both operating and reporting error in the simulation. This highlights the value of reducing the effect that lower reputation vehicles have on the network by proactively devaluing their input. Furthermore, once the reputation of malicious vehicles decreases, they no longer possess the same effect on the reputations of other vehicles.
A possible addition to the model would be to nullify the effect that vehicles who fall below a fixed reputation threshold have on the scoring of subsequent transactions. In doing so, malicious (or even faulty) autonomous vehicles would have a minimal effect on the reputation of other nodes, once their own reputation is low enough. However, this implementation would need a remediation mechanism for vehicles that cease to behave maliciously. For example, a successful impersonation attack has the potential to tarnish the reputability of a normal vehicle. To ensure normal vehicles, such as these, are not permanently penalized, which would hinder the consensus-based integrity of the model, vehicles could be allowed re-entry after consistent demonstration of normal behavior.
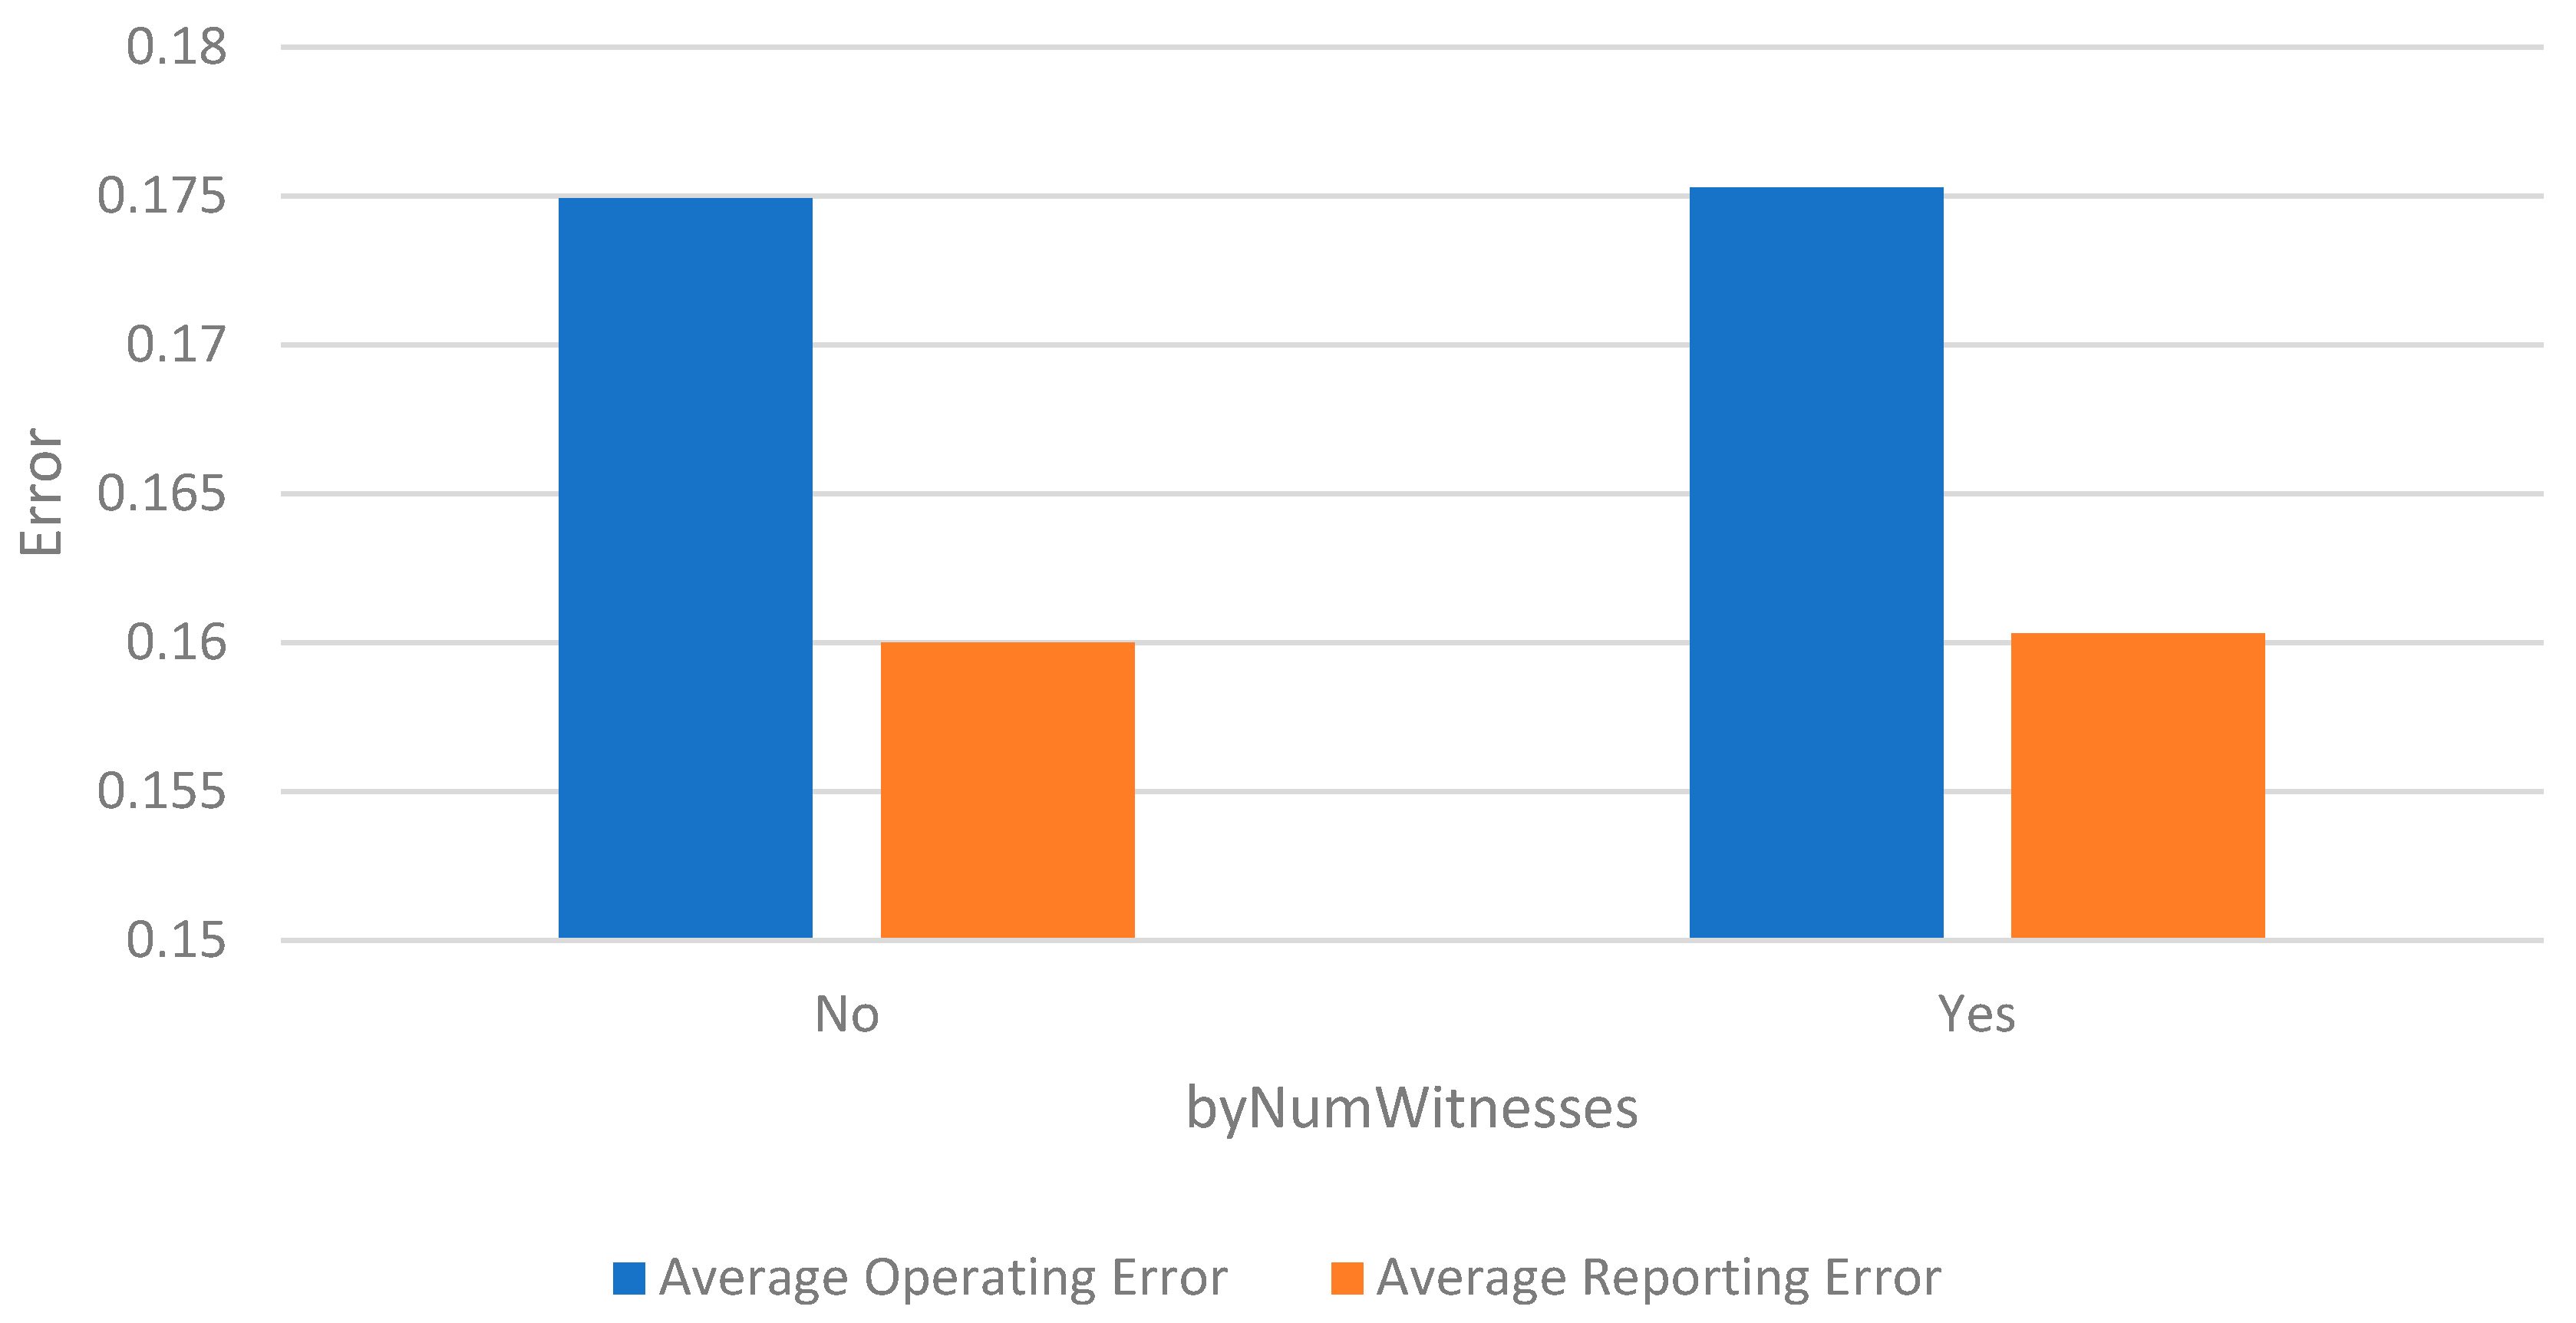
Focus now turns to the impact of considering the number of witnesses in ratings.
Figure 10 shows the results of the simulation being run with and without the byNumWitnesses parameter. This parameter, when true, weights the transactions, in averaging, based on their number of witnesses. In the context of the simulation, this causes transactions with a larger number of witnesses to have a greater effect on the operating and reporting reputations of the participating vehicles. For example, a transaction that was rated poorly by a large number of vehicles will have a comparatively greater effect on the broadcasting vehicle’s reputation than a poorly rated transaction with fewer witnesses. Weighting transactions by the number of witnesses produced a negligible change in operating and reporting error. It was hypothesized that enabling the parameter would result in a decrease in operating and reporting error, since transactions with more witnesses should, theoretically, hold more credibility; however, this was not the case. This is likely due to the stochastic nature of the simulation, in which transactions with a low number of witnesses are invariably balanced out by transactions with an equally high number of witnesses. Furthermore, there may not have been enough variability in the number of witnesses for transactions, as each transaction ranged from having 10 to 20 witnesses, which may not have produced as significant of an effect as might be possible with other values. However, these are realistic settings for many regions.
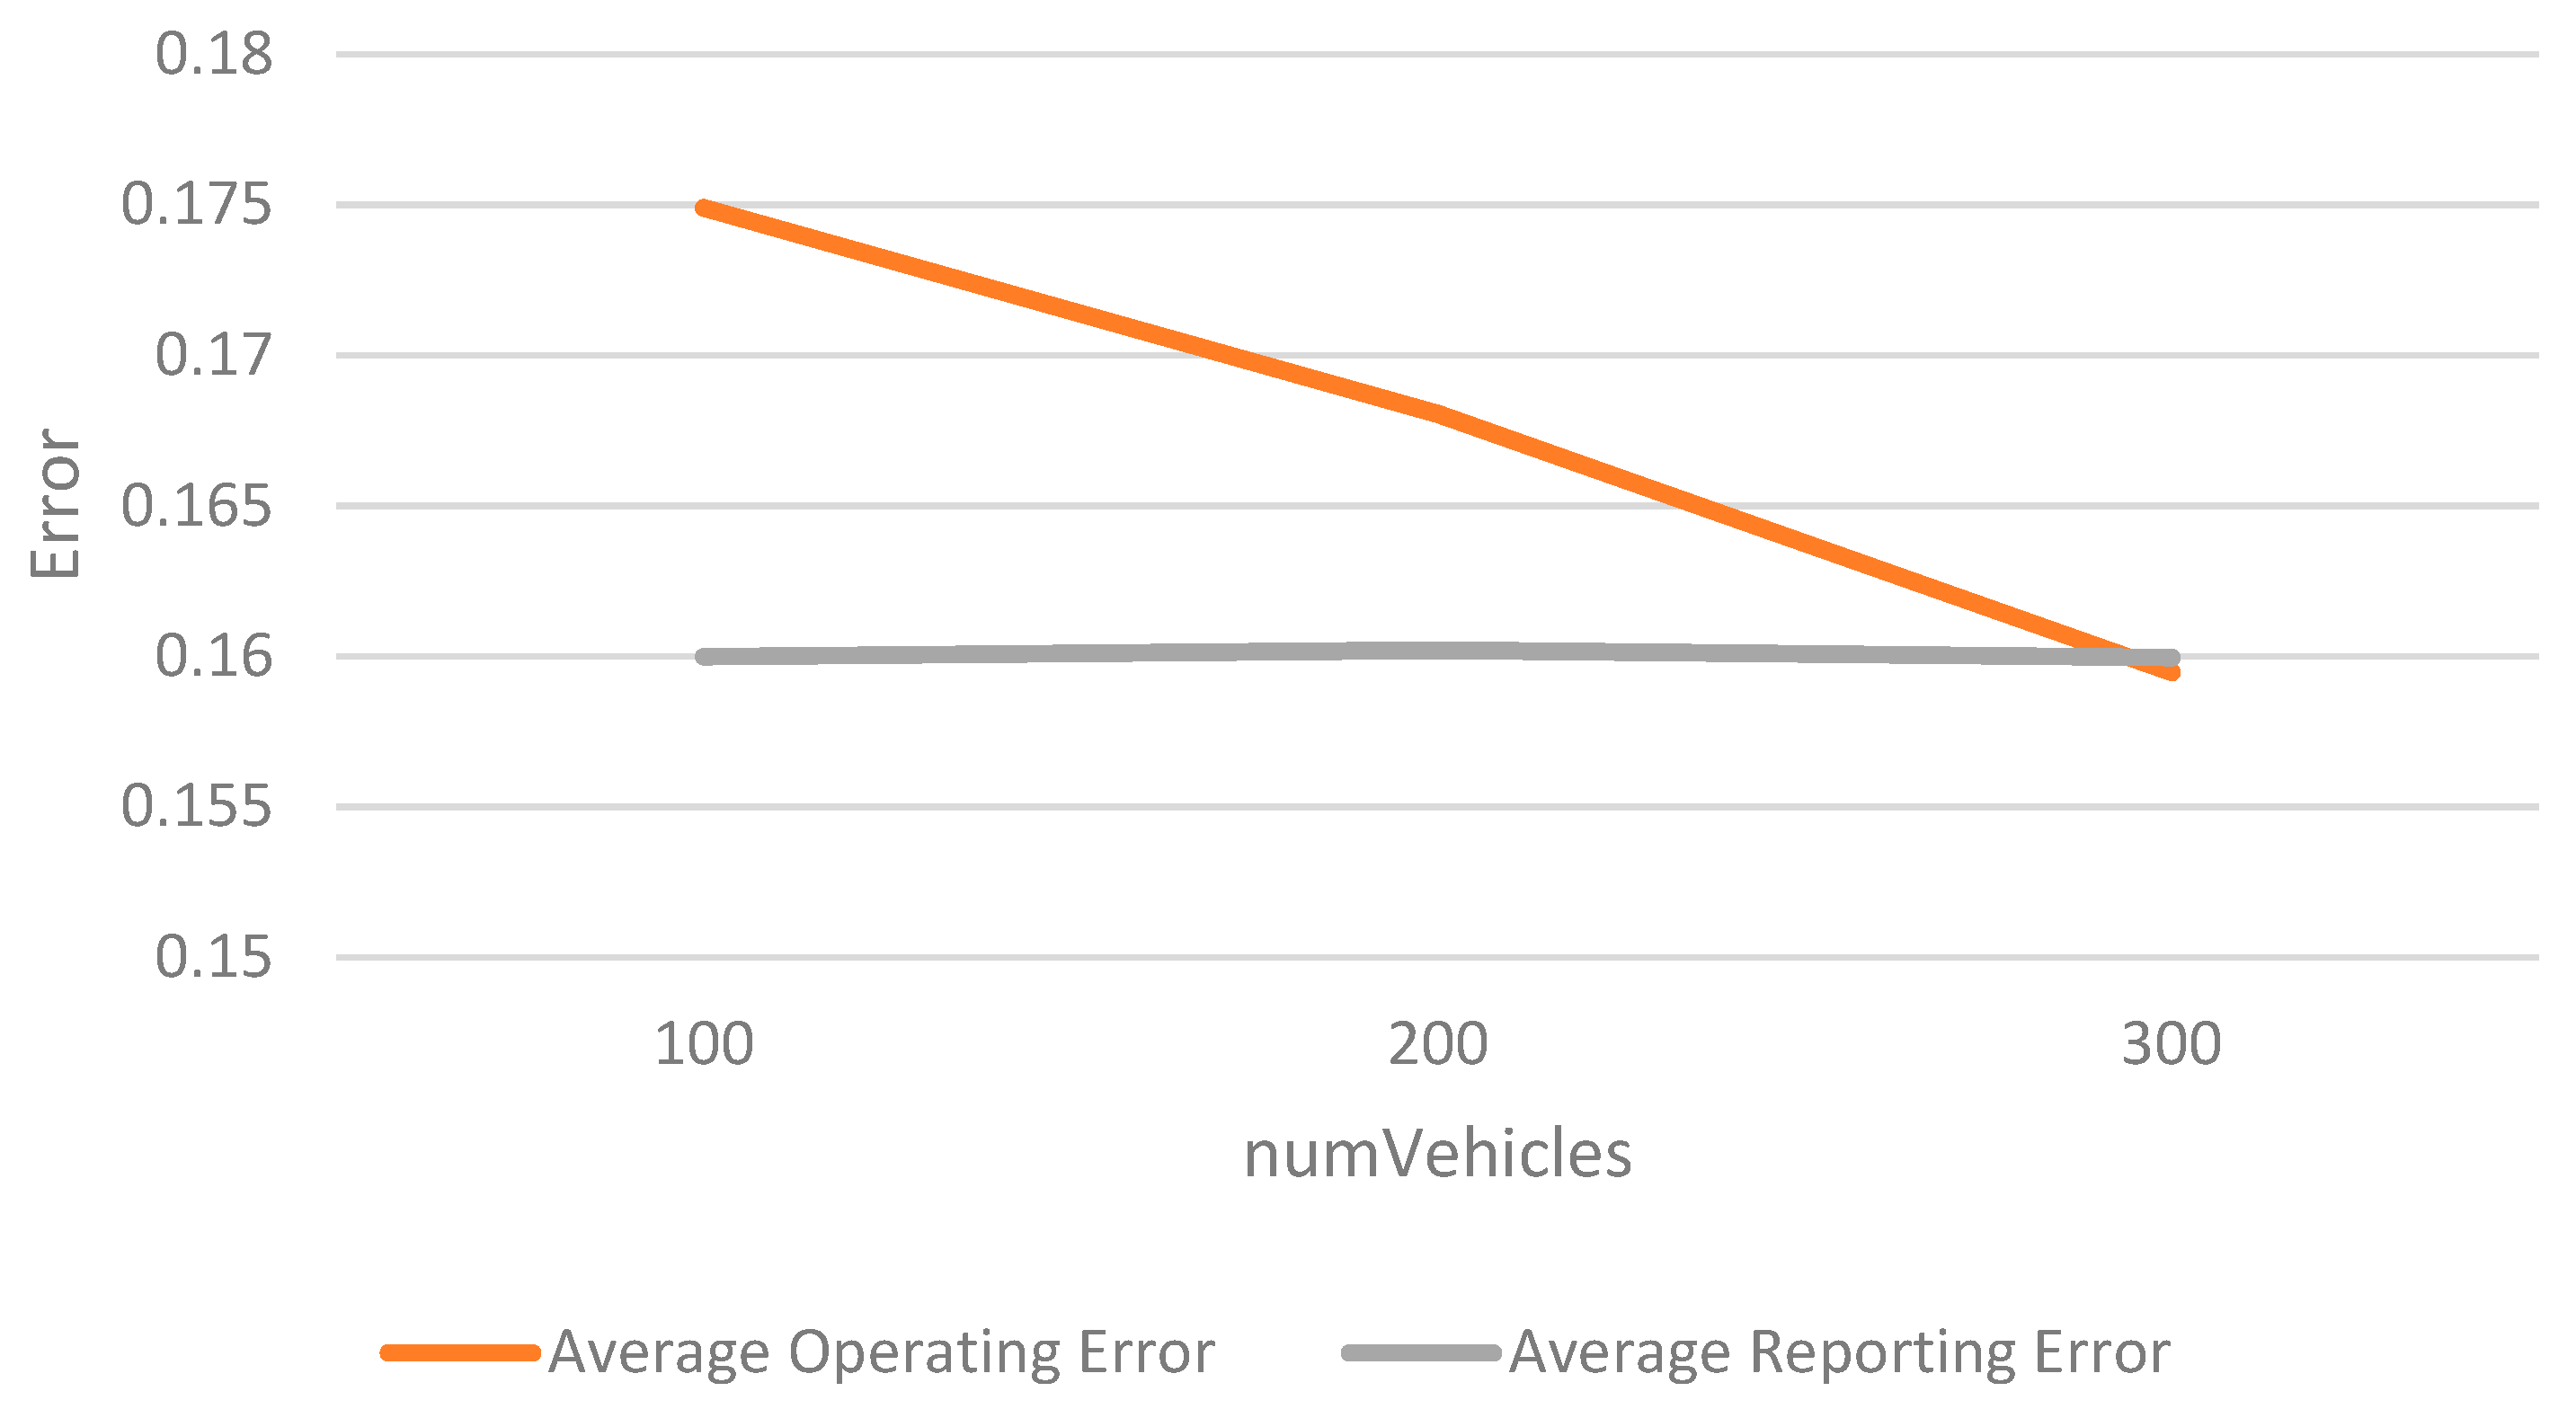
Finally, the impact of the AV population size on model performance was evaluated.
Figure 11 shows that the reporting error did not exhibit any significant change between populations of sizes
n = 100 and
n = 300, and the operating error of the system had a limited linear reduction in error. This reduction may be attributed to the consensus-based nature of the model, which reinforces the credibility or non-credibility of vehicles as the sample size increases. These results indicate the scalability of the model, presented herein, and that it is reasonably capable of operating in real-world environments with different levels of autonomous vehicles present. While the efficacy of the system for population sizes, in an increasing linear series, was evaluated, further tests on sizes of increasing magnitude could be performed for enhanced understanding.
8. Conclusions
This paper has explored the use of a potential reputational management system for autonomous vehicles and employed an experimental simulation system to test the components of this reputation management system. From the simulation, it was shown that reputation management can be a reliable method to identify malicious behavior in autonomous vehicles.
Figure 5 depicts the stark contrast in operating and reporting scores between vehicles that were classified as malicious and normal. Notably, the model provided additional nuance by measuring both the operating and reporting score of vehicles, as opposed to using a single metric for reputation. Parameters such as the proportion of witnesses (in
Figure 8) exhibited a minimal change in operating error, but an increase in reporting error, with more witnesses; these findings would not have been captured if operating and reporting scores were conflated.
From this work, several conclusions, pertinent to constructing a robust AV reputation management system, can be drawn. First, accounting for the reputation of witnesses is imperative in determining the credibility of transactions. Enabling this functionality resulted in a dramatic decrease in both operating and reporting error, as evidenced in
Figure 9. Systems must be scalable and perform adequately in larger populations, which the proposed system was demonstrably able to accomplish. There was a noticeable decrease in operating error, as there were more vehicles in the simulation, whose results are presented in
Figure 11. While the model performed well, under realistic conditions of having 10% of participating vehicles as malicious and 90% as normal,
Figure 7 shows how its performance deteriorated as the proportion of malicious vehicles increased.
Several other parameters were shown to have a minimal impact on the efficacy of the system. The weighting of recent transactions and number of witnesses, as shown in
Figure 6 and
Figure 10, both resulted in a negligible change in error. The recency of transactions did not produce a significant change because vehicle behavior was relatively consistent throughout the whole simulation, as a consequence of vehicles’ status as malicious or normal remaining static. Vehicles initialized as normal and malicious remained normal and malicious, respectively, for the entire simulation. Therefore, the credibility of a vehicle’s transactions towards the end of the simulation was not different from their transactions earlier. The number of witnesses also did not play an impactful role in the calculation of vehicle reputation, since transactions with few witnesses were invariably balanced out by transactions with a greater number of witnesses.
Notably, the simulation did not reflect malicious group behaviors, such as vehicle-herding, where a few malicious vehicles travel together to attempt to harm the reputation of other vehicles. Had the simulation included such behaviors, the number of witnesses may have been more impactful in weighting the credibility of transactions.
The current limitations of autonomous vehicle research, due to the absence of full-scale autonomous vehicle environments in the real world, have made it difficult to identify a consensus on the model parameterization. While many of the simulation settings were varied to determine the most optimal parameters, other settings, such as the concentration of malicious vehicles, require more research to determine realistic values.
It is important to note that the proposed system is most effective when all autonomous vehicles on the road are participating. However, this is more of a policy problem because establishing a widely accepted security protocol for autonomous vehicles would contribute to the growth of their use. The system will still be somewhat effective if it is not adopted by all vehicles (lower population), based on the data from
Figure 11.
9. Future Work
There are many directions that work in this area could take in the future. For example, the model’s complexity could be enhanced to simulate more realistic interactions. The model assumed vehicles to perform consistently throughout the duration of the simulation, with normal and malicious vehicles invariably sending mostly credible and incredible transactions, respectively. Real-world occurrences, such as vehicle electronic hijacking or changes in ownership, may violate that assumption, as a vehicle’s behavior may change spontaneously or over time. While these occurrences were considered by weighting transactions by their recency, such occurrences were not implemented in the simulation; therefore, it was not possible to evaluate whether the system addressed these concerns adequately.
The model performed well in environments with a low concentration of malicious vehicles; however, the possibility of abnormalities arising necessitates that a cybersecurity system for AVs vehicles remain robust under other conditions. For example, botnet attacks, in which infected nodes exponentially reproduce malware to infect other nodes [
53], or even manufacturing blunders that cause a large number of AVs to be defective, may cause networks to have a large proportion of malicious vehicles. Future work can also add additional simulation system complexity to model abnormal behavior, such as vehicle-herding, in which a small group of malicious vehicles travel together to reinforce their own reputations and depreciate others’. The parameter to weigh transactions based on the number of witnesses had a negligible impact in the simulation but may have been more relevant if applied to conditions like vehicle-herding, in which a few malicious vehicles can have a disproportionately harmful effect.
Additional research is planned to assess the efficacy of using a blockchain backend to circulate reputation information in a decentralized framework among RSUs and base stations. The efficacy of the blockchain implementation could also be compared to that of other data storage systems, transmission methods, and decentralized database systems. The system could also be integrated with the ECLIPSE urban mobility simulation system to evaluate more complex scenarios. Additional research, regarding the implementation of the trust management technology, as part of real world and prototype roadside unit and regional systems, would also be beneficial. It will be needed to further assess the technology, over time, as the hardware and software used for these systems mature.
The development of an effective reputation management system plays a crucial role in preserving the integrity of data in a network of autonomous vehicles. Reputation and, more broadly, trust have key implications on the functionality of autonomous vehicles in the real world. Trust is key to enhancing vehicles’ decision-making capabilities to distinguish the information that should be reasonably utilized from communications that can be safely discarded. This may be crucial in preventing vehicular collisions and other traffic accidents at the hands of malicious actors. Autonomous vehicle pathfinding is another process that may be corroborated or altered, depending on the credibility of the roadside information the vehicle receives, such as traffic and weather reports. Furthermore, insurance companies may find the reputation of their insureds pertinent to influencing vehicle owners’ premium rates, since having a history of credible transactions may imply a lower likelihood of being involved in traffic accidents. However, a vehicle’s reputation is not necessarily indicative of its intentions. Manufacturing errors, faulty firmware updates, and other innocuous mishaps may all affect the reputation of a vehicle. Therefore, preserving a reliable ledger of reputation information may also aid in identifying such oversights and making subsequent improvements, without vehicle owners being penalized.


