Article

IoT-Based System for Improving Vehicular Safety by Continuous Traffic Violation Monitoring

by
Yousef-Awwad Daraghmi
1,*,
Mamoun Abu Helou
2,
Eman-Yasser Daraghmi
3 and
Waheeb Abu-ulbeh
2
1
Computer Systems Engineering Department, Palestine Technical University-Kadoorie, Tulkarm p305, Palestine
2
Faculty of Information Technology, Al Istiqlal University, Jericho 4728, Palestine
3
Applied Computing Department, Palestine Technical University-Kadoorie, Tulkarm p305, Palestine
*
Author to whom correspondence should be addressed.
Future Internet 2022, 14(11), 319; https://doi.org/10.3390/fi14110319
Submission received: 7 October 2022 / Revised: 28 October 2022 / Accepted: 28 October 2022 / Published: 2 November 2022
(This article belongs to the Special Issue IoT in Intelligent Transportation Systems)

Abstract

:
The violation traffic laws by driving at high speeds, the overloading of passengers, and the unfastening of seatbelts are of high risk and can be fatal in the event of any accident. Several systems have been proposed to improve passenger safety, and the systems either use the sensor-based approach or the computer-vision-based approach. However, the accuracy of these systems still needs enhancement because the entire road network is not covered; the approaches utilize complex estimation techniques, and they are significantly influenced by the surrounding environment, such as the weather and physical obstacles. Therefore, this paper proposes a novel IoT-based traffic violation monitoring system that accurately estimates the vehicle speed, counts the number of passengers, and detects the seatbelt status on the entire road network. The system also utilizes edge computing, fog computing, and cloud computing technologies to achieve high accuracy. The system is evaluated using real-life experiments and compared with another system where the edge and cloud layers are used without the fog layer. The results show that adding a fog layer improves the monitoring accuracy as the accuracy of passenger counting rises from 94% to 97%, the accuracy of seatbelt detection rises from 95% to 99%, and the root mean square error of speed estimation is reduced from 2.64 to 1.87.

1. Introduction

Traffic violations, including vehicle over-speeding, overloading of passengers, and seatbelt unfastening, are among the causes of serious injuries and fatalities among passengers in the event of accidents. These violations reduce safety and result from the individual characteristics of drivers [1]. Therefore, traffic violation monitoring is important because it assists authorities to improve the safety of passengers. While some countries still depend on the traditional monitoring methods, such as monitoring by police officers, Intelligent Transportation Systems (ITS) have achieved considerable results in improving safety on roads by providing different vehicle monitoring technologies, such as visual perception [2], wheel damage detection [3], and accident prediction and recommendation systems [4]. Most advanced monitoring methods are based on the Internet of Things (IoT), utilizing different sensors and different types of computing, processing, and storage.
The recently proposed IoT traffic violation monitoring methods can be classified into sensor-based monitoring and image-processing-based monitoring. Sensor-based monitoring incorporates different types of sensors, e.g., RADAR [5] and LIDAR [6,7], for speed estimation. Moreover, infrared sensors, gas sensors, and a thermopile matrix are used to count the number of passengers [8]. Further, magnetic sensors, pressure sensors, and seat mats are used for seatbelt detection [9,10]. On the other hand, the image-processing-based methods depend on the use of a camera onboard or on roads. This approach utilizes different algorithms for estimating speed [11], counting passengers [12], or detecting seatbelts [13,14]. Examples of these algorithms are derived from neural networks and deep learning [15,16]. However, these techniques have shortcomings, which can be summarized as low accuracy, because the entire road network is not covered by these systems, and they are sensitive to weather and obstacles [17]. Moreover, image processing algorithms usually require long computation times, which causes delays in estimation and makes a real-time response more difficult [18]. Therefore, systems that can monitor violations on the entire road network accurately and enable a real-time response are needed.
This research proposes a traffic violation monitoring system consisting of an edge computing layer, a fog computing layer, and a cloud computing layer. The novelty of the system is the combination of the three layers for the first time in traffic violation monitoring, and the combination of the monitoring of speed, passenger counts, and seatbelt fastening. The edge layer consists of a microcontroller connected to a GPS sensor, infrared sensors, and limit switch sensors. The edge layer aggregates data collected from sensors and forwards the data to the fog layer. The fog layer contains algorithms for speed estimation, passenger counting, and seatbelt detection. The fog layer inputs the GPS data to the Haversine algorithm, which estimates the speed. The system compares the speed of a vehicle with the permitted value on a certain road. Moreover, the system counts the number of passengers using infrared sensors and compares it with the permitted value. Further, the system determines the status of seatbelts using limit switches. A warning message will be displayed by the controller if the speed or number of passengers exceeds the permitted value and a seatbelt is unfastened. The fog layer will send the violation information to the cloud if the driver does not reduce their speed, put a seatbelt on, or reduce the number of passengers within a period of time or after a number of warnings. In addition, the fog layer aggregates data collected from the edge layer and sends the data to the cloud periodically to allow for a second phase of violation checking. The cloud side is responsible for communicating with the fog nodes, storing data, processing data, searching for violating vehicles, and updating vehicles with the permitted speed based on the location. The cloud also communicates with traffic stations to notify them if any vehicle violates the law.
The system was evaluated using real-life data by evaluating its components on vehicles to estimate speed, passenger counts, and seatbelt status. To determine the effect of adding the fog layer to the violation monitoring system, the proposed system was compared to the system proposed in [12]. The proposed system with the fog layer outperforms the system with the edge layer alone, because the accuracy of speed, passenger count, and seatbelt estimation is higher. We conclude that adding a fog layer improves the system’s functionalities because the computational load is distributed on both layers. While the edge layer prepares and aggregates the data, the fog layer operates the algorithms and also prepares the data for the cloud layer. Therefore, the contributions of this research are as follows.
  • An IoT-based system for the continuous monitoring of traffic violations, including over-speeding, passenger overloading, and seatbelt unfastening, is presented. This contribution includes both the architecture, consisting of edge computing, fog computing, and cloud computing, and the algorithms used for the monitoring. This system benefits the safety of autonomous vehicles.
  • Empirical proof shows that adding a fog layer between the edge and cloud layers improves the estimation accuracy, because the fog layer provides the system with more computational resources for operating the estimation algorithms.
  • Empirical proof shows that the sensor-based approach achieves high accuracy in speed estimation, passenger counting, and seatbelt fastening checks, while maintaining a low computational demand on the edge side.

2. Related Work

Different methods and systems have been proposed in the literature for monitoring vehicle violations. This research focuses on speed monitoring, passenger number monitoring, and seatbelt status monitoring through the use of edge, fog, and cloud computing.
The edge computing approach has been recently used extensively because of its ability to share computational and communication resources with terminal devices, and it consequently improves the overall performance [19,20]. In the vehicular context, edge computing has the potential to support efficient traffic management and monitoring. However, this field still faces challenges, including the amount of data, cooperation among vehicles, and privacy, and these challenges can be tackled by different methods, such as federated learning [21]. Edge computing has been used for traffic management (e.g., [22,23]), but with little focus on traffic violation monitoring (e.g., [12,24,25]). Similarly, fog computing has been used for traffic management (e.g., [19,26]) but with little focus on monitoring violations (e.g., [27]). The proposed edge and fog computing systems are dominated by the monitoring of speed and traffic signals, while passenger counting and seatbelt status checks have not been addressed within these computing approaches. To the best of our knowledge, this is the first study that combines speed estimation, passenger counting, and seatbelt status checks using IoT with edge, fog, and cloud computing.

2.1. Speed Monitoring Systems

There are two categories of vehicle speed estimation techniques. The first category is speed estimation using sensors, and the second is speed estimation using computer vision.
In the sensor-based speed monitoring category, such systems use different types of sensors. For example, surveillance systems usually estimate vehicle speeds using sensors, such as RADAR [5] and LIDAR [6,7]. These systems are usually expensive, and they are only effective over small distances and are less precise [5]. In [28], the authors utilize information from the Global Positioning System (GPS) and an inertial measurement unit to eliminate the noise produced by sensors and the bias in determining the speed of an electric vehicle. In [29], the authors utilized data from an accelerometer, an angle sensor, and a Holzer sensor to estimate the vehicle speed. An Inertial Navigation System, GPS, and Dead Reckoning based on an Anti-Lock Braking System were also used in [15] to estimate a vehicle’s speed. Moreover, an in situ pavement sensor is used to estimate vehicle speed in [30]. The aforementioned systems demonstrate that data extracted from accelerometers and GPS can be used to estimate the speed of a vehicle.
Recently, researchers have employed the sensors in smartphones to evaluate different parameters of a vehicle, including acceleration, vibration, and speed [31]. In [32], the authors developed a surveillance system for buses, using an Android-based phone and a Raspberry Pi controller to track speed and trajectory. In [33], the authors proposed a system to track the speed and location of a vehicle using mobile networks and GPS. Moreover, the authors in [34] proposed a system to monitor speed bumps and the speed of a vehicle. Given the large number of vehicles and the processing required, cloud computing combined with IoT is essential for the deployment of vehicle speed tracking [34,35].
On the other hand, computer vision vehicle monitoring was founded in the 1990s as vehicle surveillance systems were proposed in [5]. Techniques for image processing have been extensively utilized to estimate speed from a video or a collection of images [36]. Segmentation, classification, and calibration algorithms are shared by all of these techniques, although each technique employs a distinct methodology to reflect the implementation context. For instance, artificial neural networks have been shown to be the most effective and accurate among other classification algorithms [37]. In [38], in order to recognize a vehicle in a video stream and compute its speed, a Convolutional Neural Network (CNN) was employed. In [39], a competitive system with respect to a sensor-based speed monitoring system was developed using inductive loops. This system extracts the license plate from an image, tracks vehicle features, and compares the trajectories of the tracked features to known real-world measures for estimating vehicle speeds.
However, the main limitation in adopting these computer-vision-based methods is that they are constrained by three main assumptions. First, they assume that vehicles are moving at a constant speed, and, secondly, they operate a straight trajectory technique within a single image. The third assumption is that they assume that the surfaces on which the vehicles are moving are flat, or that they move on planar surfaces. To overcome these limitations, 3D modeling would be required, which would make the process more complex and less effective. Furthermore, further efforts and studies are required to estimate the speed of the vehicle in crowded scenarios.

2.2. Passenger Number Monitoring Systems

Most research focuses on passenger flow, e.g., [40,41], while little research addresses the number of passengers in a vehicle. Identifying the number of passengers in vehicles has been proposed in different systems. The first approach is based on sensors. Seat occupancy detection sensors using seatbelt detection can be used to count passengers onboard [8]. Another method is by detecting the amount of CO2 inside a vehicle using gas sensors [8]. Infrared sensors are also used to detect the number of passengers passing between an emitter and a receiver [8]. Further, a matrix of thermopile sensors is used to capture the emission of passenger bodies [8].
The second approach is based on image processing with a camera mounted inside the vehicle. For accurate detection, deep learning and neural-network-based methods have extensively been used. The research in [12] uses Kinect with a Bayesian tracking network for passenger counting. The 3D LIDAR video is used to count passengers entering a train when the train doors are opened [42].

2.3. Seatbelt Monitoring Systems
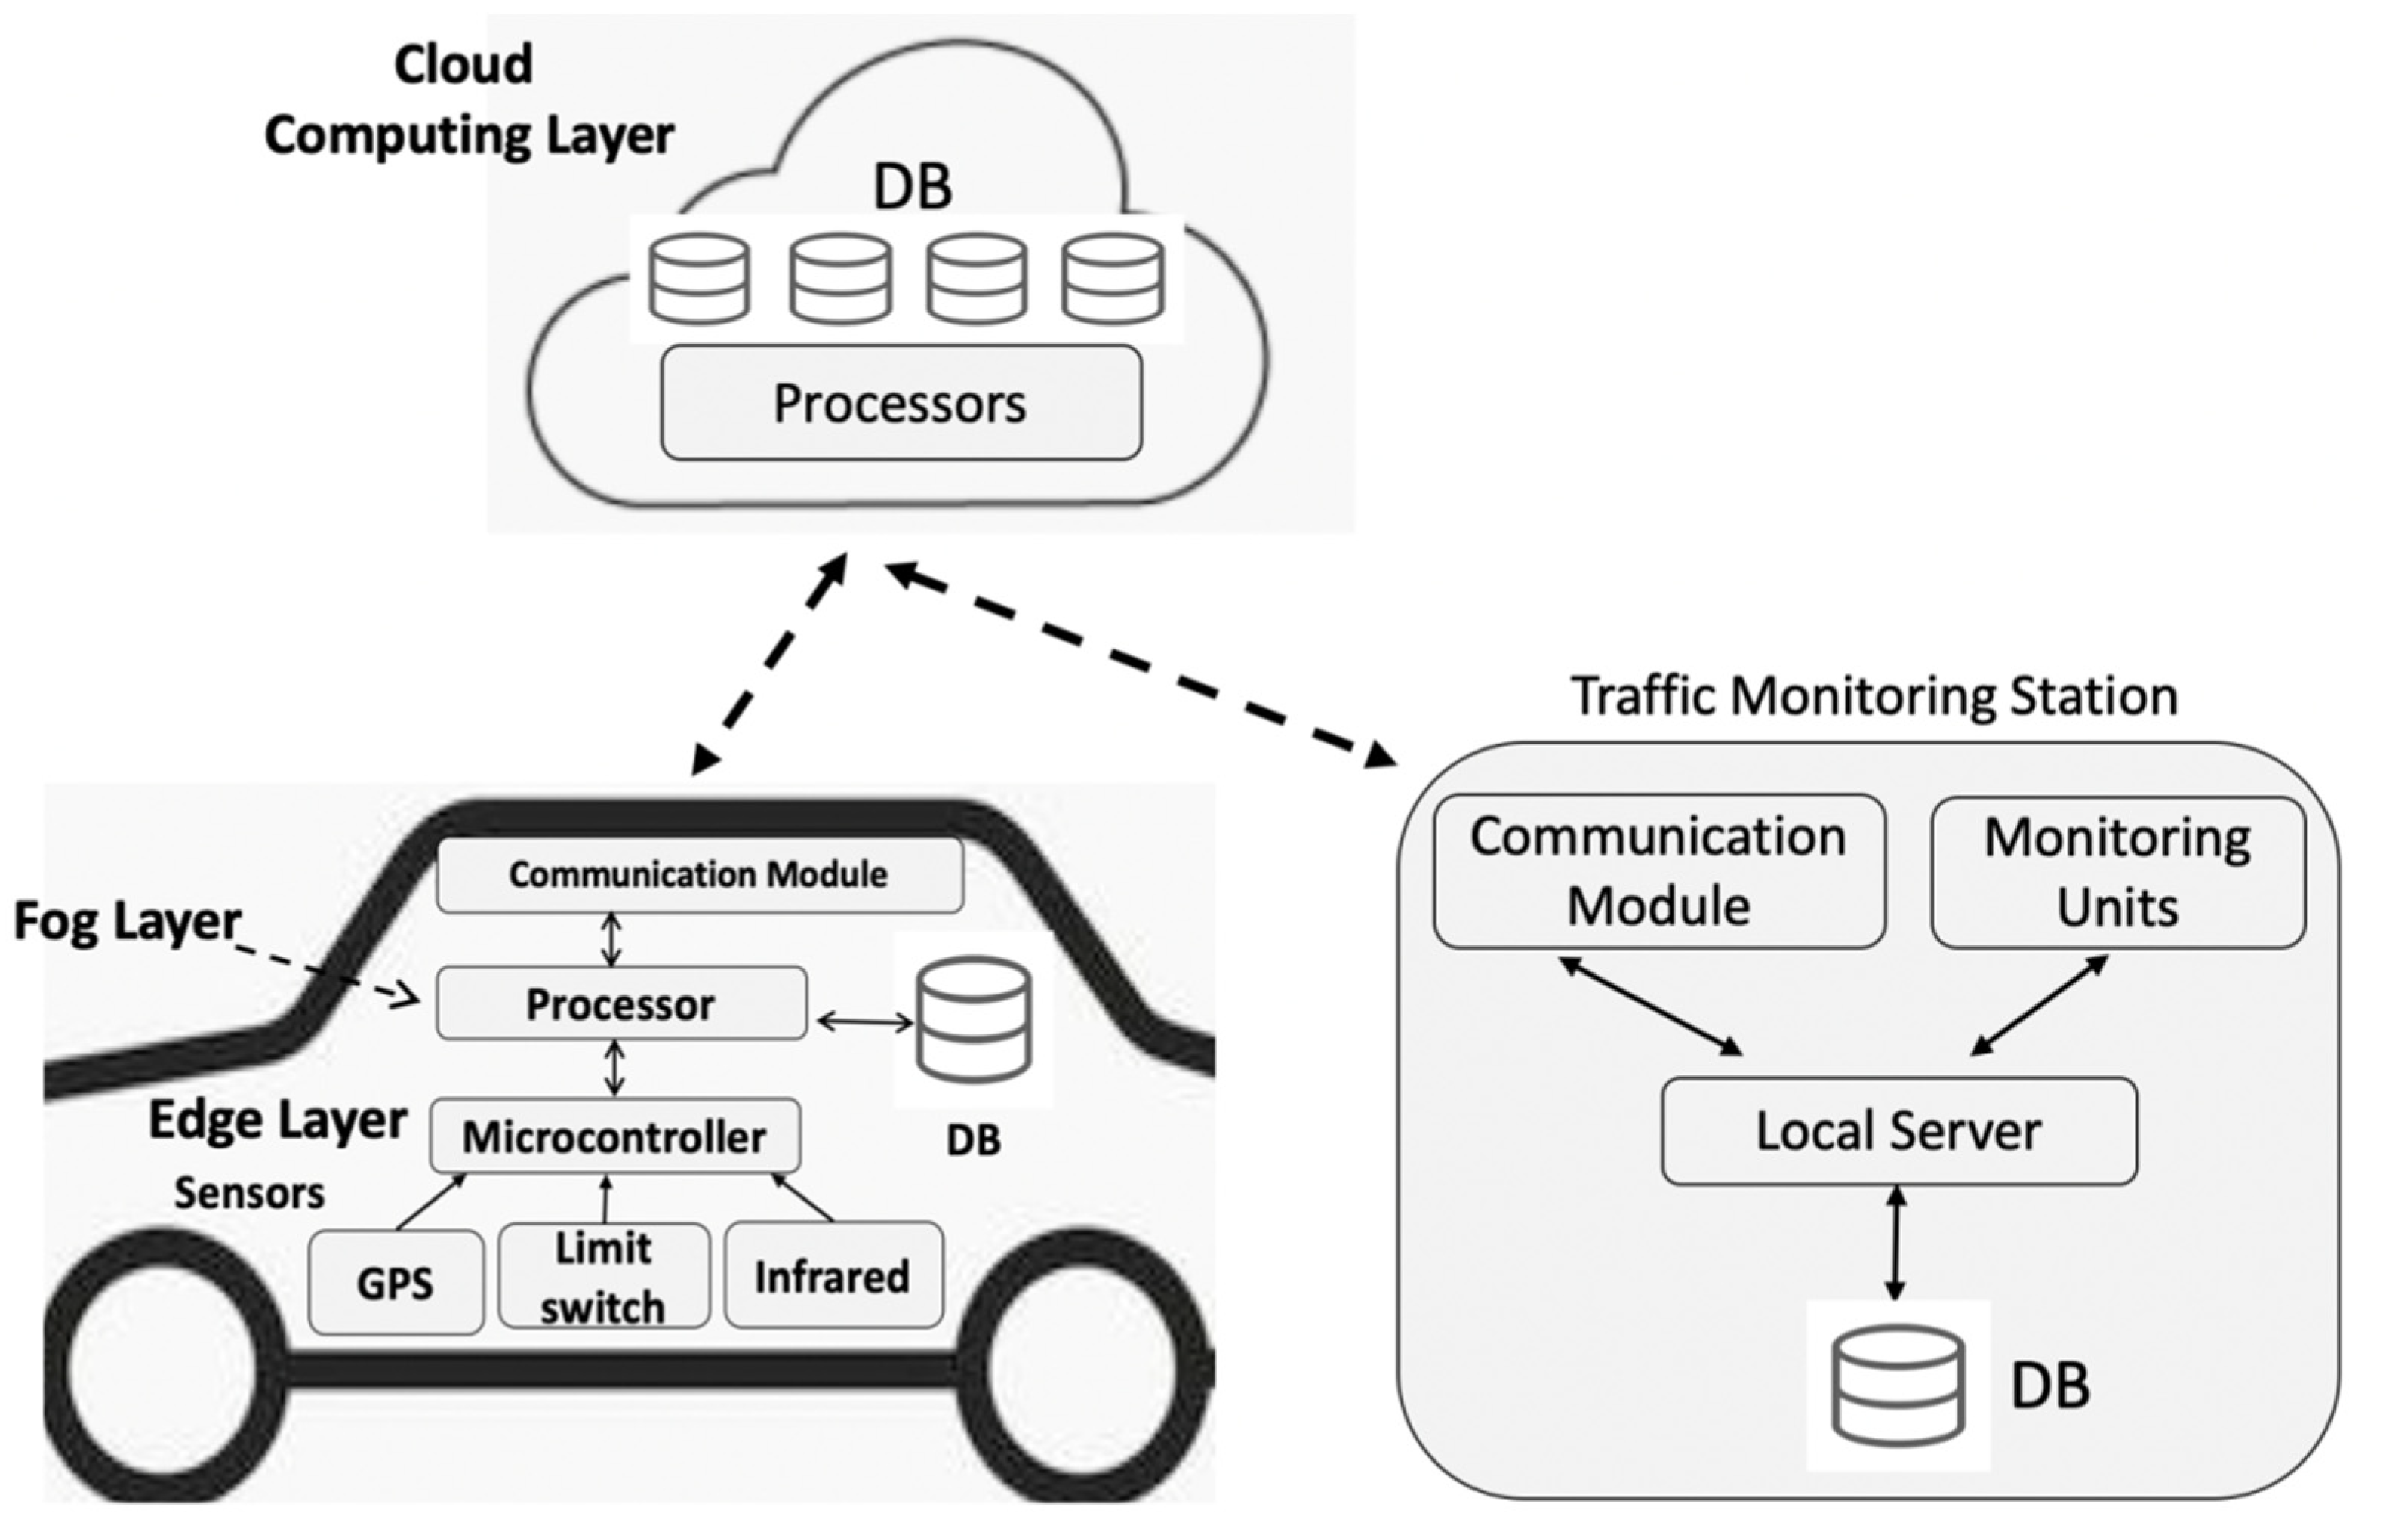
Different onboard seatbelt monitoring systems have been proposed for improving passenger safety. The first monitoring approach is based on sensors, such as the seatbelt reminder proposed in [43]. To detect the presence of passengers on seats, sensor mats for sensing pressure can be installed on the seat heater or on the seat cushion foam [9]. The authors in [10] used a reed-based sensor to produce a signal regarding the status of the seatbelt, where the signal is generated due to a magnetic component installed on the male buckle. Another method is by installing a sensor inside the female buckle to detect the male buckle plate and send a Bluetooth signal to a smartphone [44,45].
The second approach for onboard monitoring of seatbelts is based on image processing, such as [13,14,46]. In these systems, different image processing techniques are used, including neural networks and deep learning. These algorithms consume a lot of computational time and may not be compatible with real-time applications, so researchers need to propose faster algorithms. For example, faster R-CNN (proposed in [47]) can be a solution to increase the efficiency of seatbelt detection [48,49]. Moreover, seatbelts can be detected from the outside of the vehicle using cameras installed on roads [50]. This image processing approach is affected by light, window reflection, rain, and snow, and computation time is still an issue that needs improvement [48].
In summary, vehicular speed monitoring, passenger counting, and seatbelt fastening detection can be estimated using the sensor-based approach or the computer-vision-based approach. The aforementioned studies do not focus on covering the entire road network or connecting with authorities in real time. Moreover, the computer vision approach has limitations, including the high computational demand and the effects of the surrounding environment. Therefore, this paper proposes a novel system that combines the monitoring of over-speeding, overloading of passengers, and seatbelt unfastening through the use of edge, fog, and cloud computing. This system is important to improve safety in vehicles and reduce the harm caused by accidents. Table 1 shows a summary describing the classification of the related studies based on the objectives and the technologies used to achieve the objectives.

3. Proposed System

This section presents the hardware and software design of the proposed system, which aims at counting the number of passengers and monitoring the vehicle’s speed and seatbelt status, in order to improve safety in vehicles. These functionalities are performed by the components of the system, which are shown in Figure 1.

3.1. The Edge and Sensor Layer

This layer consists of the GPS sensor, infrared sensor, and limit switch sensor. The GPS sensor, which is considered the primary component of this layer, uses the communication module to communicate with the satellite system. Vehicle speed is estimated using the vehicle’s coordinates, provided by GPS. The GPS coordinates are also used to determine the location of traffic violations. The location is necessary for traffic authorities to identify places with more violations and determine future control methods.
Another option for obtaining vehicle speed is through the CAN bus, which is available in modern cars. However, the proposed system does not include this option because of the likelihood that the CAN bus would not be present in most cars in developing countries. The CAN bus requires a different interface for each car brand, which increases the cost. Moreover, the proposed system has another two important functions, passenger counting and seatbelt checking, and these functions depend on data that are beyond the scope of the CAN bus.
The other sensor is the infrared sensor, which is composed of an emitter and a receiver and is activated when a passenger interferes with the signal by entering or leaving the vehicle. Double infrared sensors are used in parallel for each door to determine the direction of movement when entering or leaving the vehicle. Thus, the controller records the movement in the local database with a timestamp for each movement.
Another type of sensor is the limit switches that are distributed on the seatbelt buckles. All vehicles nowadays have these sensors to check whether seatbelts are fastened or not. However, due to the difficulties of connecting with the vehicle’s internal computer system, we installed extra limit switches to verify the functionality of the proposed system. The limit switch essentially generates a high output (binary one) when the seatbelt is fastened. The change in seatbelt status is stored in the local database with a timestamp and the vehicle speed at the time of the change. Moreover, the sensor ID is stored to enable the monitoring of which seatbelt is unfastened and to determine the passenger location. The limit switch sensors are accompanied by pressure sensors to detect whether seats are occupied or not.
The sensors are connected to the edge layer, consisting of a microcontroller that is responsible for receiving the data from the sensors, aggregates these data, and sends them to the fog layer.

3.2. The Fog Computing Layer

The fog computing layer consists of a processor that is used to count the number of passengers, estimate the vehicle speed, and check the seatbelt status. This layer also has a storage capacity for storing important files, including the local database, the algorithms, and the map. The control unit, in each fog computing node, uses the aggregated data from the edge layer and runs the corresponding estimation algorithms. The output of this layer includes the A JSON format file containing the number of passengers, the aggregated vehicle speeds, the status of seatbelts, and the locations of the vehicles. This file is transmitted to the cloud for additional processing. The second format is a sound format that sends alerts to the drivers if the number of passengers, vehicle speed, or seatbelt use is not in compliance with the rules. Every time a vehicle changes lanes or roads, the control unit obtains the new road’s speed limit from the map stored on the fog node. The local database, which is SQLite, assists in storing the vehicle’s location, speed, status, and other unprocessed data. Moreover, 3G communication is used between the fog layer and the cloud layer.
This layer is responsible for running the estimation algorithms. The passenger count algorithm is illustrated in Figure 2, and it operates when any of the doors are opened, instead of performing continuous counting. This reduces the computational load on the edge. This algorithm reads the movement data from the local database, decides whether a passenger is entering or leaving, counts the number of passengers (n) in the vehicle, and finally compares the result with the permitted number (limit). If the number of passengers exceeds the permitted value, the algorithm plays a warning message. The algorithm sends a fine request to the traffic station after three warning messages, with three minutes between each consecutive message.
The second algorithm is the speed estimation algorithm, and its flow chart is shown in Figure 3. To avoid re-estimating the vehicle speed using the same GPS coordinates, this procedure will be initiated as soon as the GPS data for the new coordinates are available in the local database. The speed estimation method is also allowed to run every ten seconds, which makes the speed estimation much easier and reduces the computational load on the processor.
The simplest way to calculate speed is to divide the distance traveled by the time. However, because of the altering road topology, it is difficult to calculate the distance between two positions for a moving object with varying speed. Thus, in order to estimate the vehicle’s speed accurately, this study uses the Haversine function, H.
The Haversine algorithms calculate the distance between two coordinates on a sphere [51]. Thus, the distance d between two consecutive latitudes (lat) and longitudes (lon) can be determined as
d = 2 r arcsin [ sqrt ( H ( lat 2 lat 1 ) cos ( lat 1 ) cos t ( lat 2 ) H ( lon 2 lon 1 ) ) ] ) ,
where r refers to the radius of the sphere, lat1 is the first latitude, lat2 is the second latitude, lon1 is the first longitude, lon2 is the second longitude, and the Haversine function H can be computed as
H ( x ) = ( 1 c o s ( x ) ) / 2 ,
where x is the central angle between the two radiuses reaching the first and the second coordinates. Once d is determined, the speed is computed by dividing d by the travel time between the two coordinates.
The flow chart in Figure 3 further indicates that if the speed s exceeds the speed limits on the road, the warningCount is incremented and the driver will receive a sound warning message. If the driver receives three warning massages, with five seconds between each two consecutive warnings, the vehicle will be considered in violation and the algorithm will request a fine from the traffic station. Furthermore, if no violations occur within a period of 30 s, data will be transferred to the cloud. In this way, the cloud software subsystem can check for violations again, utilizing the coordinates and the travel time between two coordinates. If the system identifies a violation case, the data will be recorded in the database in the cloud layer.
The third algorithm is the seatbelt status check algorithm, which is responsible for checking whether seatbelts in the vehicle are fastened or not. The algorithm flow chart is shown in Figure 4. This algorithm is triggered by the change in seatbelt status. The algorithm essentially verifies that the seatbelt change from fastened to unfastened occurs when the vehicle is moving and when the pressure sensor is active (pressure = 1). We set the threshold speed at 20 Km/h to avoid requesting fines at very low speeds or in parking situations. The algorithm can identify the seatbelt locations based on the limit switch sensor ID. Thus, the algorithm warns the driver and the passenger three times using voice messages, with ten seconds between each two consecutive warnings. If the seatbelt is kept unfastened during the trip, the algorithm requests a fine.
In this algorithm, we made an assumption that the driver is responsible for the violation of seatbelt laws. However, some countries place the responsibility on the passenger, and others on both the driver and the passenger.

3.3. The Cloud Computing Layer

The cloud layer contains processors and storage capacity. In this layer, data from edges through the fog layer are processed and stored in a database. This layer employs an algorithm that monitors the speed of edges and identifies those that exceed the defined limits. Moreover, this layer sends updates to the monitoring stations concerning the status of all edges on the roads.
The cloud-layer software consists of services that receive the estimation data from vehicles. The data initially are stored on the cloud. Since the cloud subsystem considers multiple edges (the number of vehicles), a map-reduce method is utilized to distribute the load on the servers in such a way that allows the efficient handling of data coming from all edges (vehicles). A map-reduce function reads the data from the cloud storage and aggregates the data based on the vehicle ID. Then, any fine requested by the edge-layer algorithms is verified and transferred to the monitoring station’s notification service. The cloud also re-estimates the vehicle speeds and compares them with the permitted speeds on the roads to allow a double check of speed. If the speed limit is violated, the cloud notifies the driver and the traffic station using a speed notification service.
Other services include sending data to the fog layer to update vehicles with data related to their locations, such as the permitted speed on the current road. We assume that the digital map has the speed limit of each road—for example, the open-source map [52]. Each vehicle downloads the map when it registers to use the system. The time required to download the map on the 3G network is approximately three minutes. The cloud updating service sends updates about speed changes if, for some reason, e.g., maintenance, the speed at a road segment has been altered by the authorities. The update message is a JSON file of size 1.5 KB. This design is based on the main objective of fog computing, which is to bring the computation closer to the edge devices so as to reduce the number of transmissions and the amount of transmitted data.

3.4. Monitoring Station

The monitoring station is controlled by the authorities who are responsible for managing and controlling the traffic or transportation. For instance, this station should be accessible to traffic officers so that they can monitor vehicles’ speeds and identify violators. The station has a communication module that connects to the cloud, which is often accomplished over the internet. Some local computations are managed by the local servers, such as issuing fines when exceeding the number of permitted passengers, speed violation fines, and seatbelt-related fines. The local server also responds to other inquiries made by traffic authorities.
The traffic monitoring station’s software subsystem includes the user interface. The user interface is an important part of the system because it enables users to view the data of the road and edges (vehicles), carry out administrative functions, and issue fines for vehicles that violate the rules. For example, the station receives a notification that a vehicle has committed a violation, and consequently the station confirms the fine. This subsystem allows users to make queries and generates reports about roads and vehicles. Moreover, authorized users can view and update the map settings, user accounts, and system parameters on the cloud. The MySQL local database is also a part of this subsystem, and this enables the local server to efficiently handle the majority of the computations on this subsystem.

4. Experiment and Results

In order to evaluate the effectiveness of the proposed system, different experiments are designed to test the system’s accuracy in counting passengers, estimating speed, and detecting the seatbelt status. The hardware used in the experiments includes an Arduino Mega 2560 as a gateway connected to the sensors. This microcontroller is used as an edge for the preprocessing of data and aggregation of the data. The edge sends the data to a smartphone, which represents the fog layer, because smartphones possess processing power, local storage, and GPS sensors. We modified the work published in [17] to allow the speed estimation process to run on the fog layer. Table 2 lists the specifications of the three smartphones (smartphone 1 (s1), smartphone 2 (s2), and smartphone 3 (s3) that were utilized to evaluate the proposed system. In Table 1, CPU refers to the central processing unit specification, GPU identifies the Adreno graphical processing unit, and the last column defines the size of memory in gigabytes.
We used CloudSim [53] to simulate the cloud layer, and it was operated on a server connected to the internet and hosting a MySQL database. The CloudSim simulation parameters are shown in Table 3. The edge and fog side are real devices, but the cloud is simulated due to resource limitations.
To test the connectivity between the cloud and the traffic monitoring station, the web pages for the monitoring station’s website were developed using PHP, and the database was created using MySQL. Other web pages will also open once a user logs in to the system using the log-in page, depending on the user’s privileges. The user can view the violations and generate different reports.

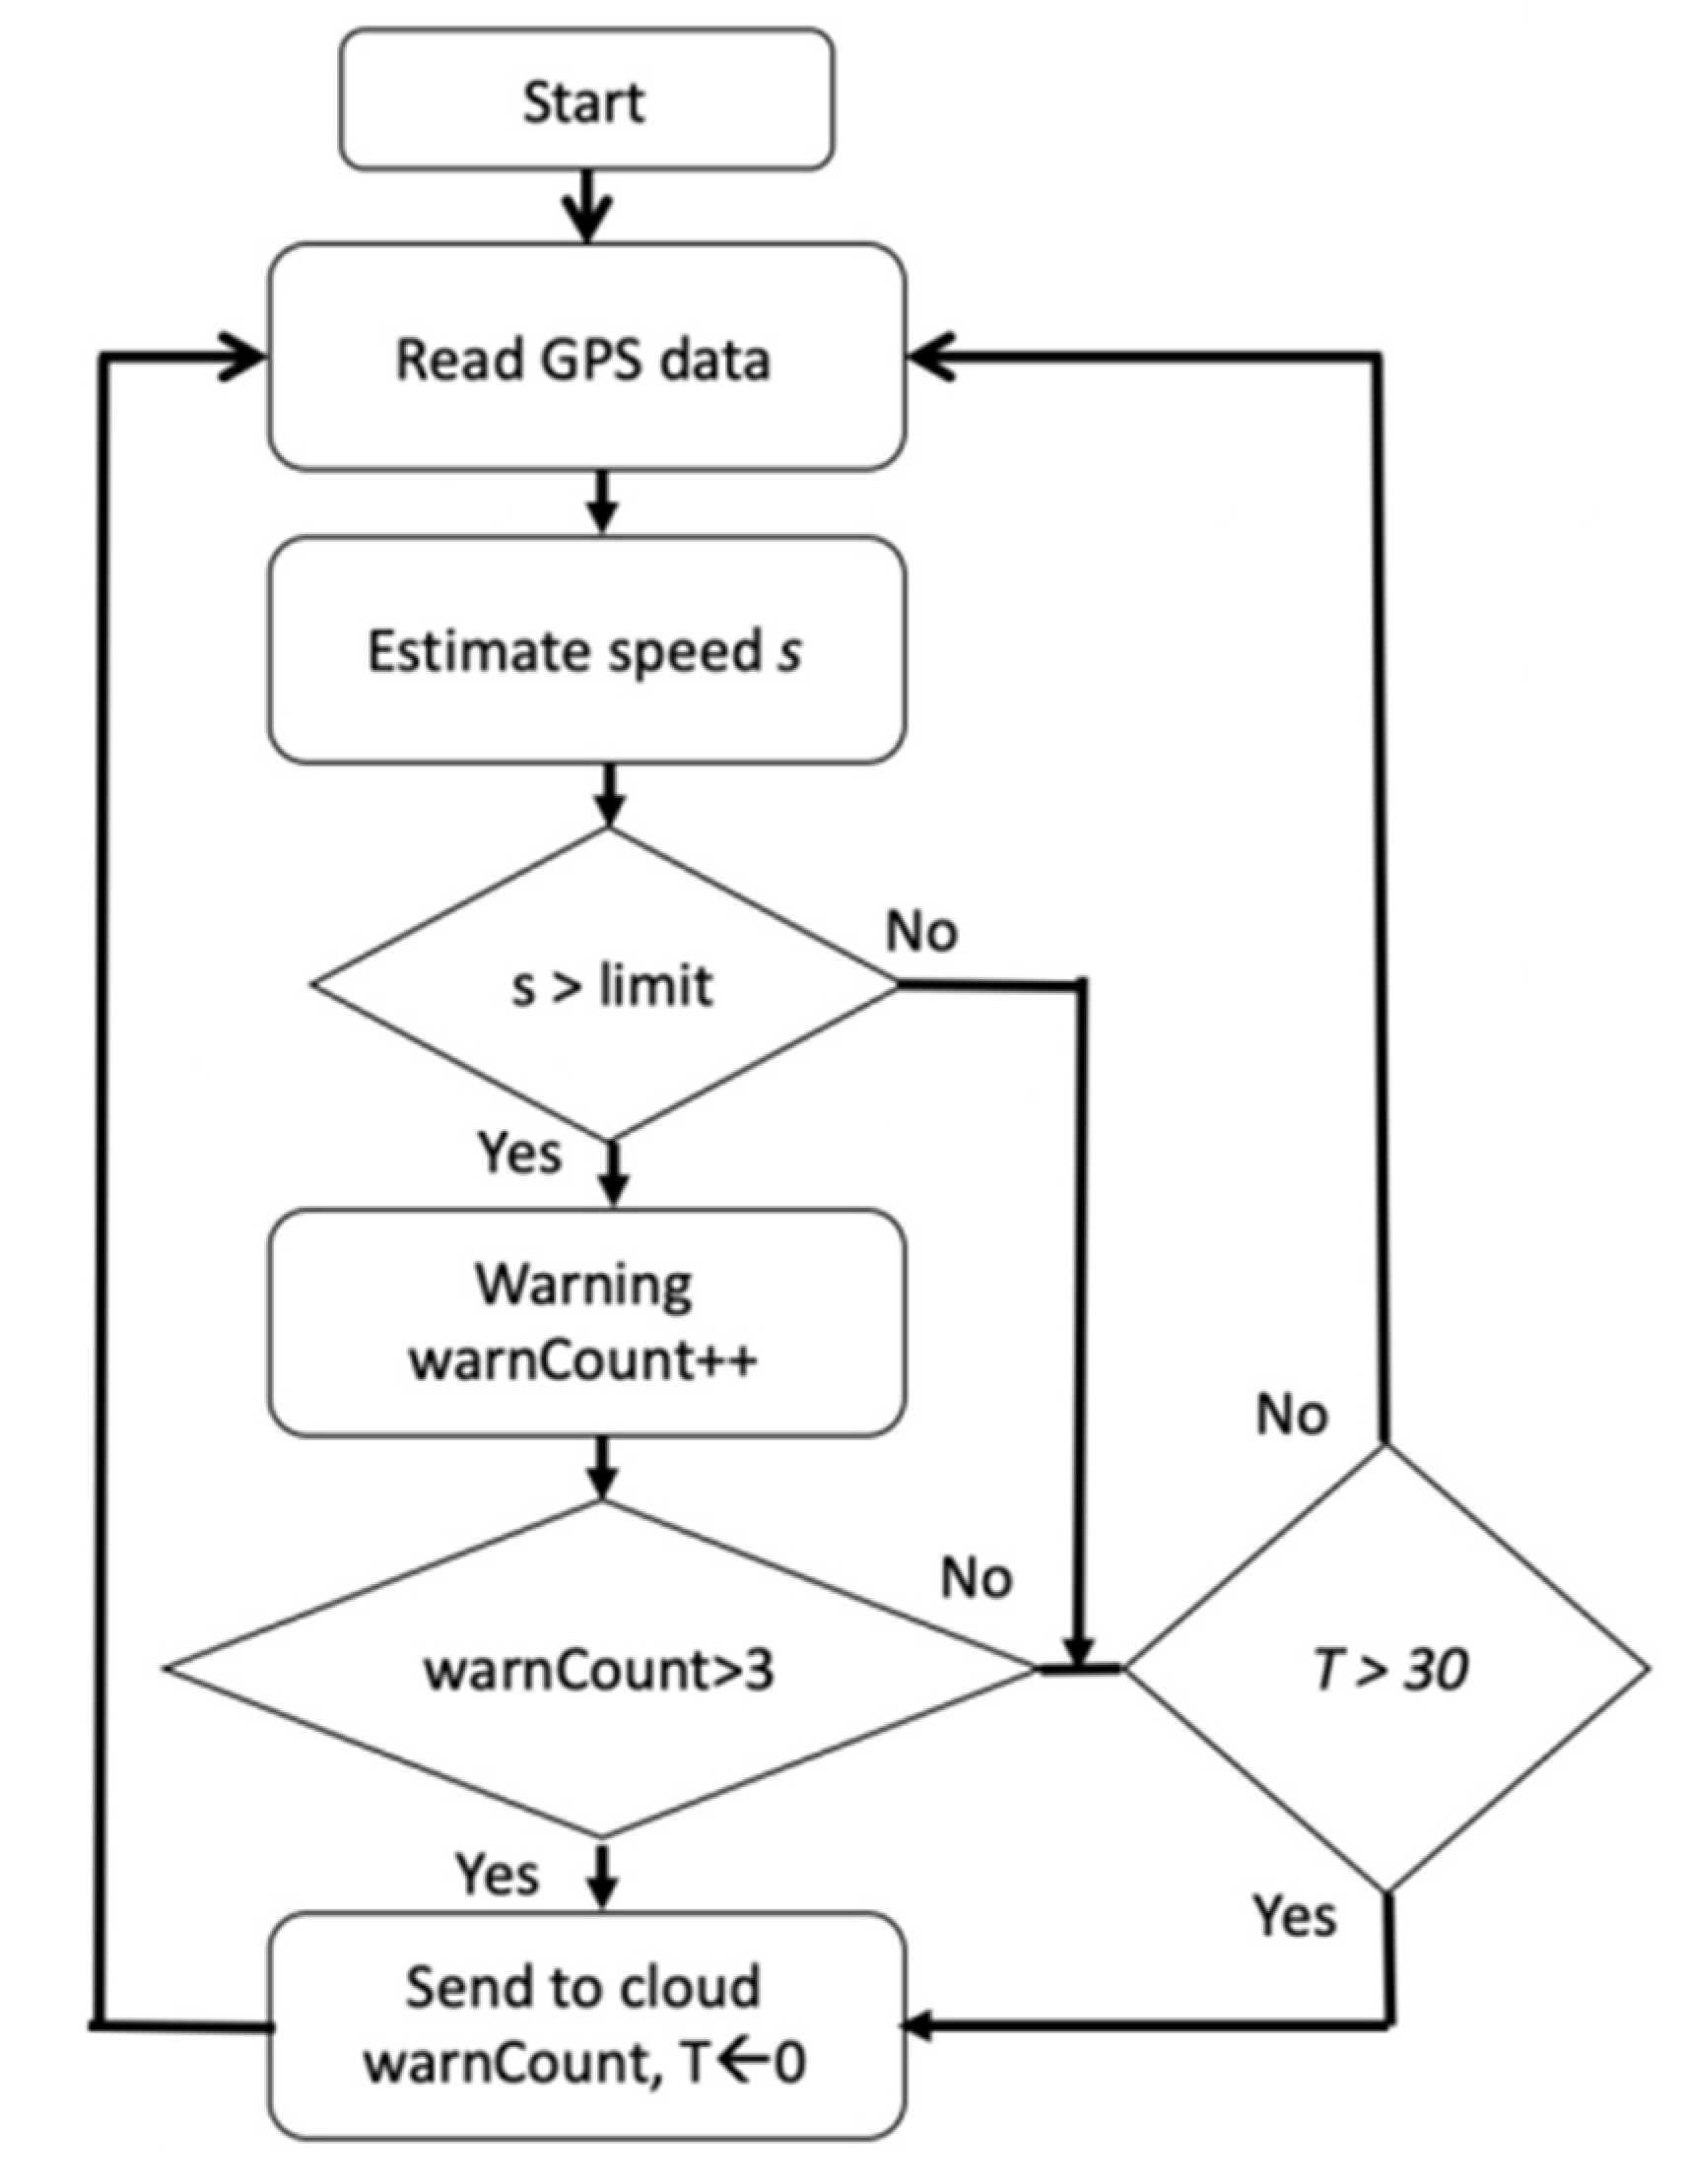
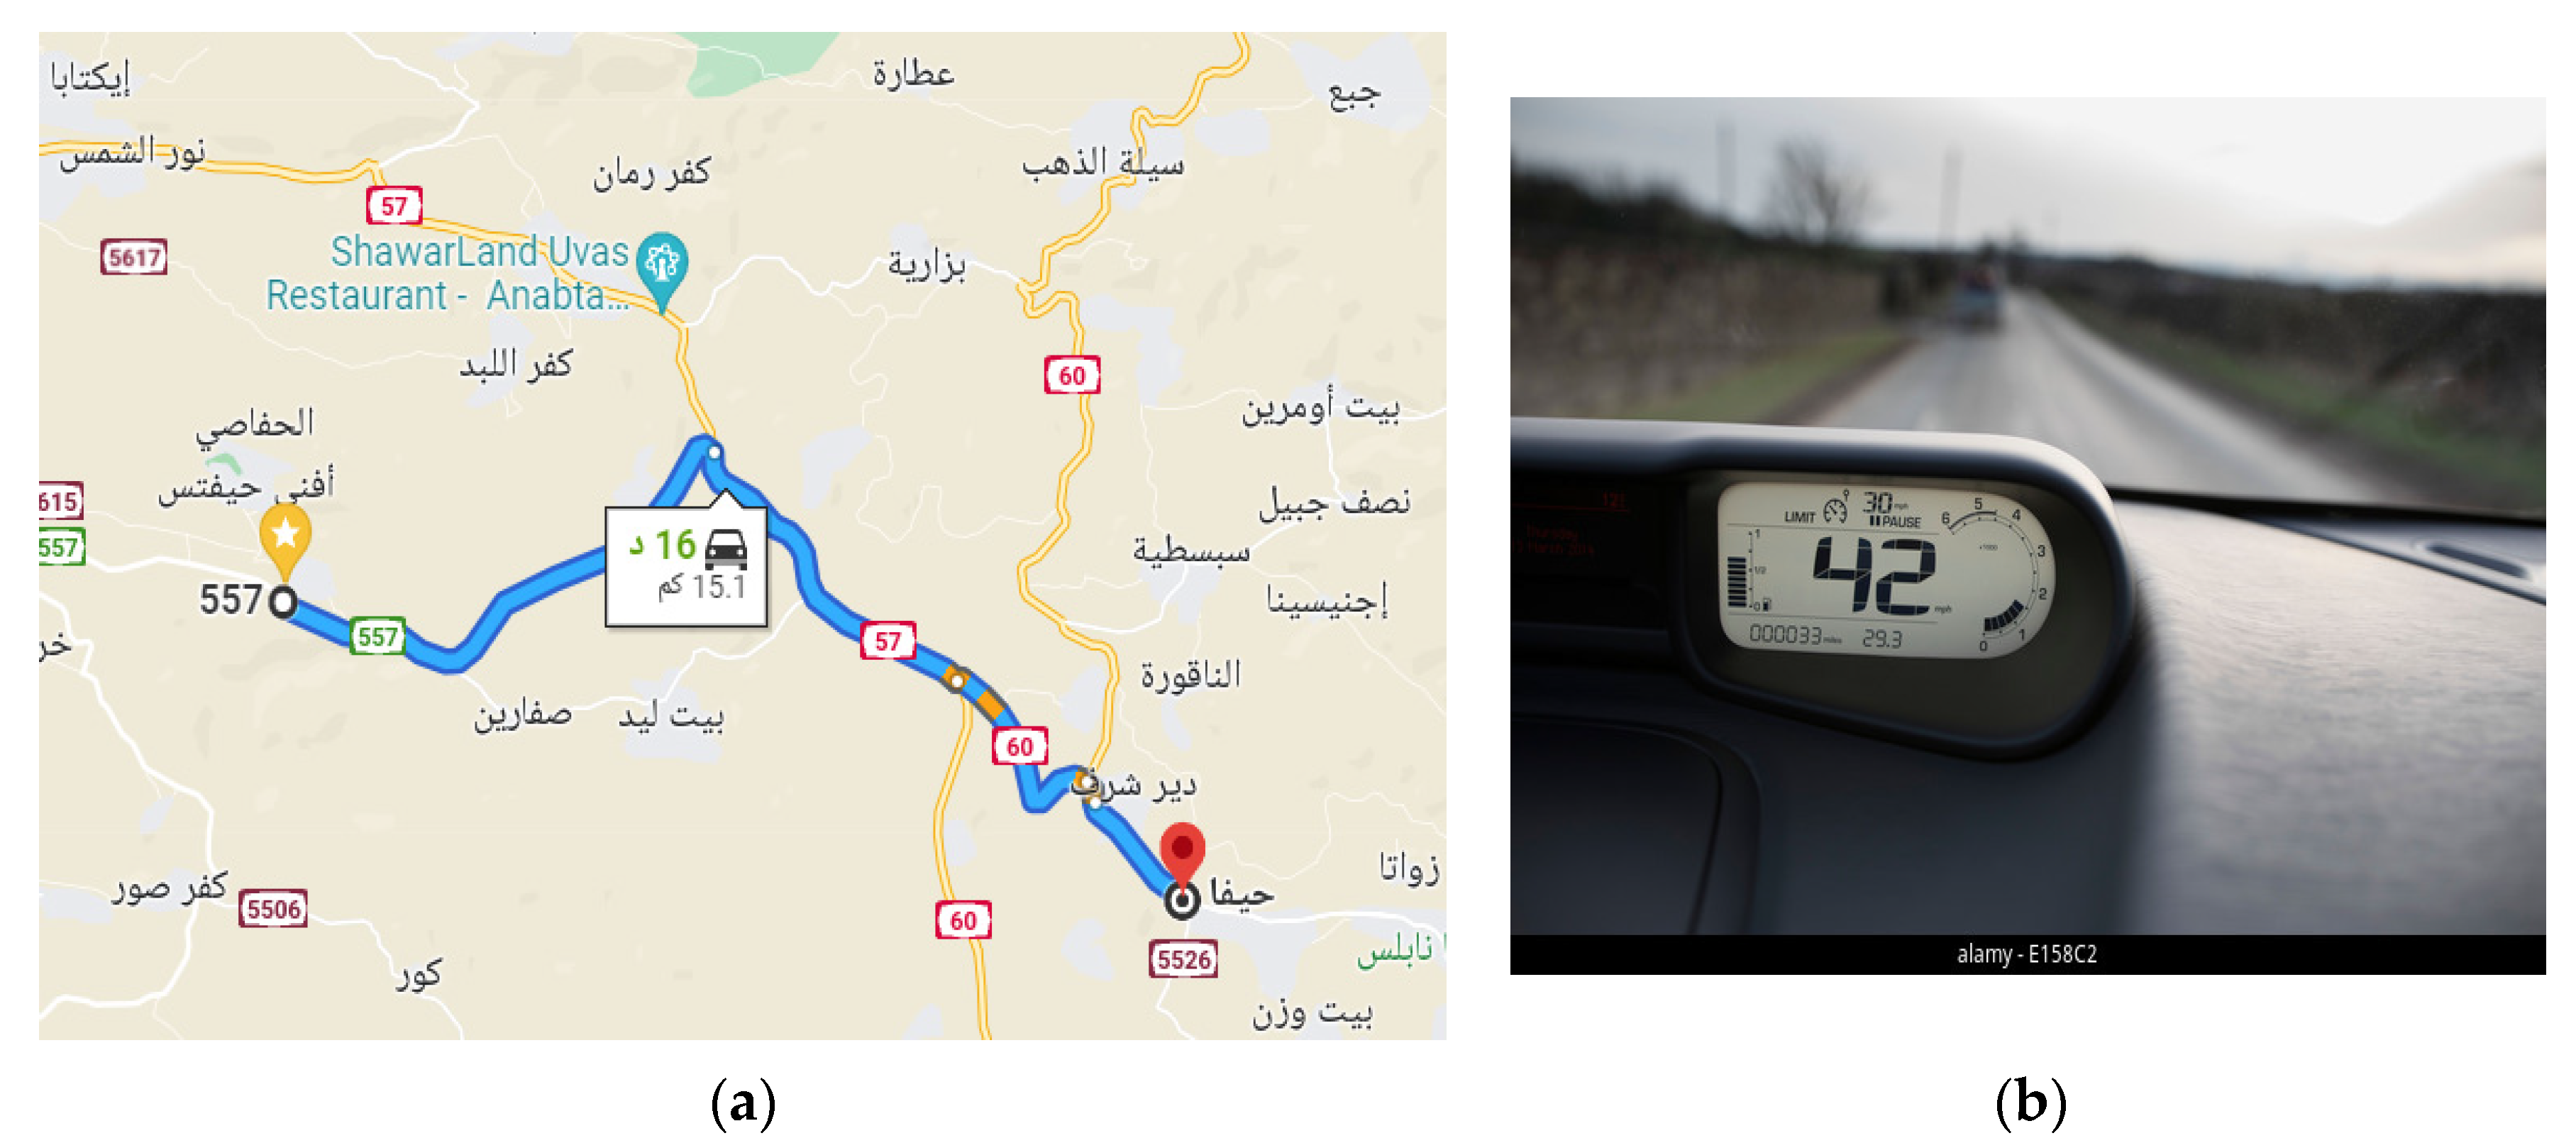
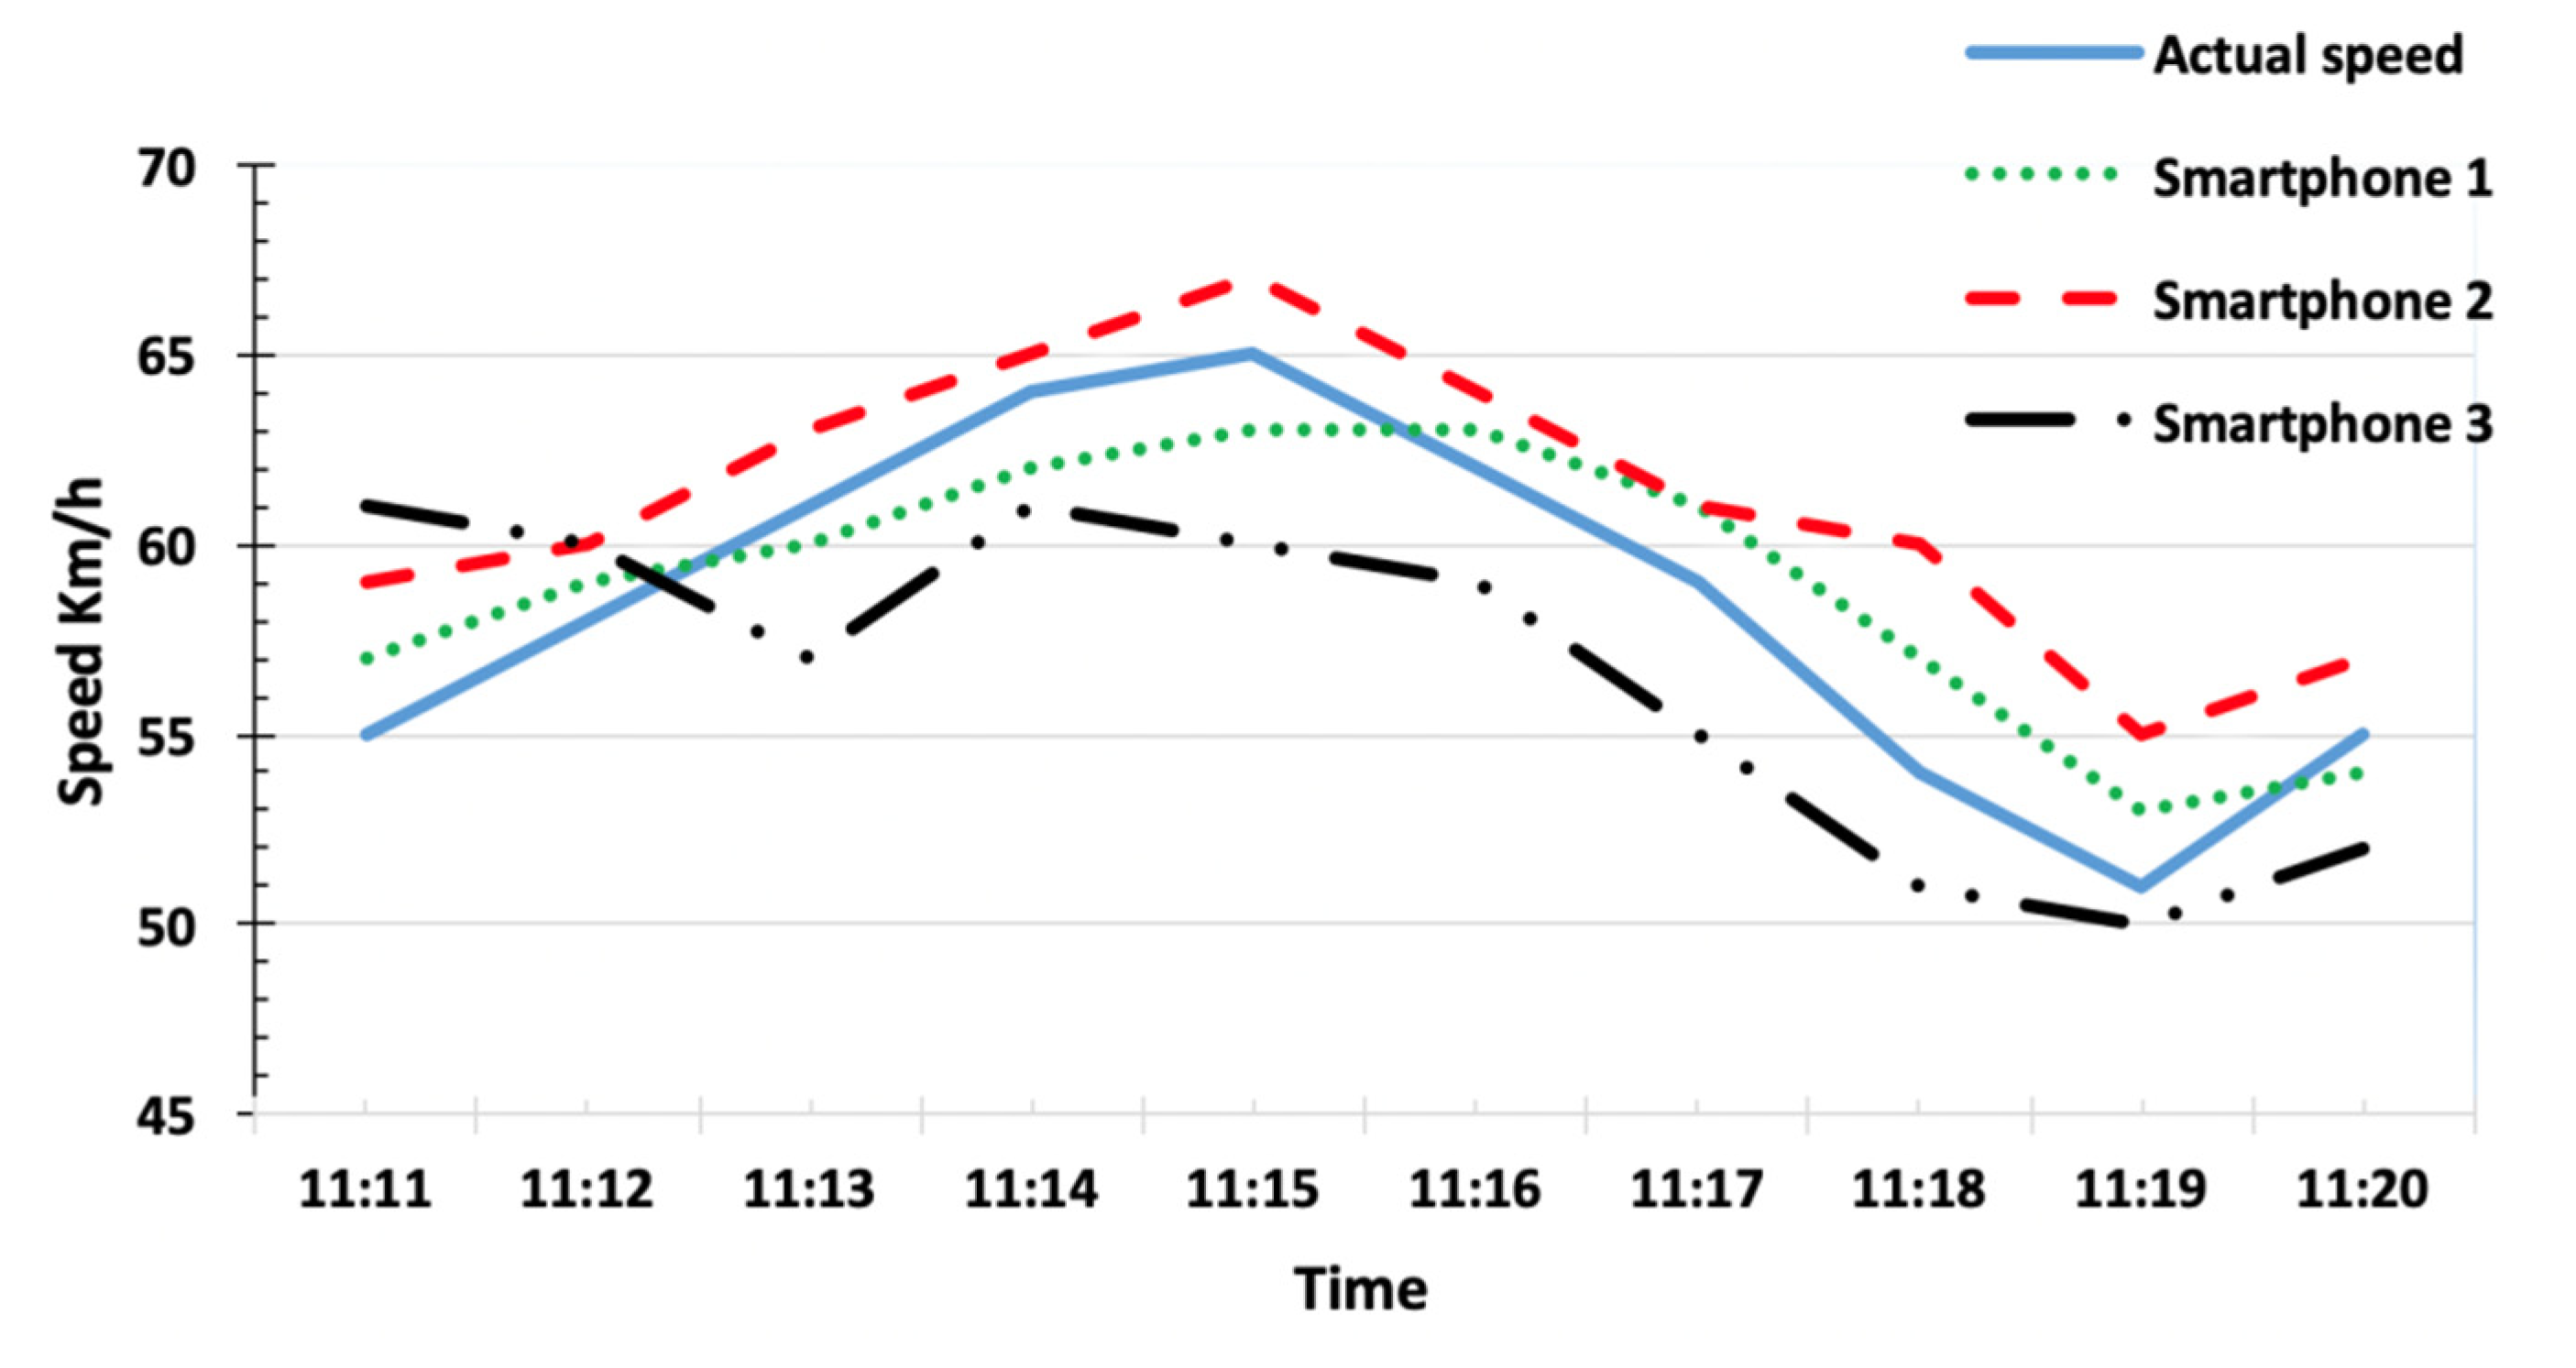
4.1. Speed Estimation Results

We performed the experiments for speed estimation by driving a car on the Tulkarem–Nablus route of 15.1 Km, as shown in Figure 5. A car with a digital speed meter, shown in Figure 5 on the right side, is used to record the vehicle speed, which is used as a baseline for comparisons. The speed meter data can provide the best option for monitoring speed, but the inability to digitally read this speed in all vehicle brands and send it to the cloud motivated us to use an external speed estimation. The three smartphones listed in Table 2 were used to evaluate the speed of the vehicle.
Figure 6 shows the results of the estimated speed. Although the devices can estimate speed at a higher frequency, the data in the figures are shown every minute to simplify the visual representation. The figure shows that there is a small difference between the actual speed, as measured by the vehicle speed meter, and the estimated speed. Smartphone 1 outperforms other devices in estimating the speed, while smartphone 3 provides the worst results.
The performance of the smartphone’s computations is what accounts for the accuracy difference. The speed of performing the Haversine method and retrieving data from memory are both impacted by the smartphone’s performance. Due to the low performance, there is a delay in estimating the speed, which causes the predicted speeds to be lower or greater than the actual speeds. Thus, a fog layer needs to possess sufficient computational resources to achieve high accuracy.
To evaluate the effect of the fog layer on the accuracy, we compare the results of speed estimation using the edge layer alone, as in [17], with speed estimation when the fog layer is added to the system. The approach with the edge layer alone, in [17], is used as a baseline for the comparison. We used smartphone 1, which had the highest accuracy, to compare both approaches. The results are shown in Figure 7.
Additionally, we evaluated the root mean square error (RMSE) for the speed estimation with and without the fog layer in order to better understand the accuracy at a wider data range. The RMSE values are presented in Table 4 and show that the estimation with the added fog layer has a lower RMSE, which means higher accuracy. The reason for the higher accuracy of the approach with the fog layer is that the edge prepares the data for the fog computing via preprocessing and aggregation. This means that both edge and fog computing cooperate in improving the accuracy by sharing the computational load.

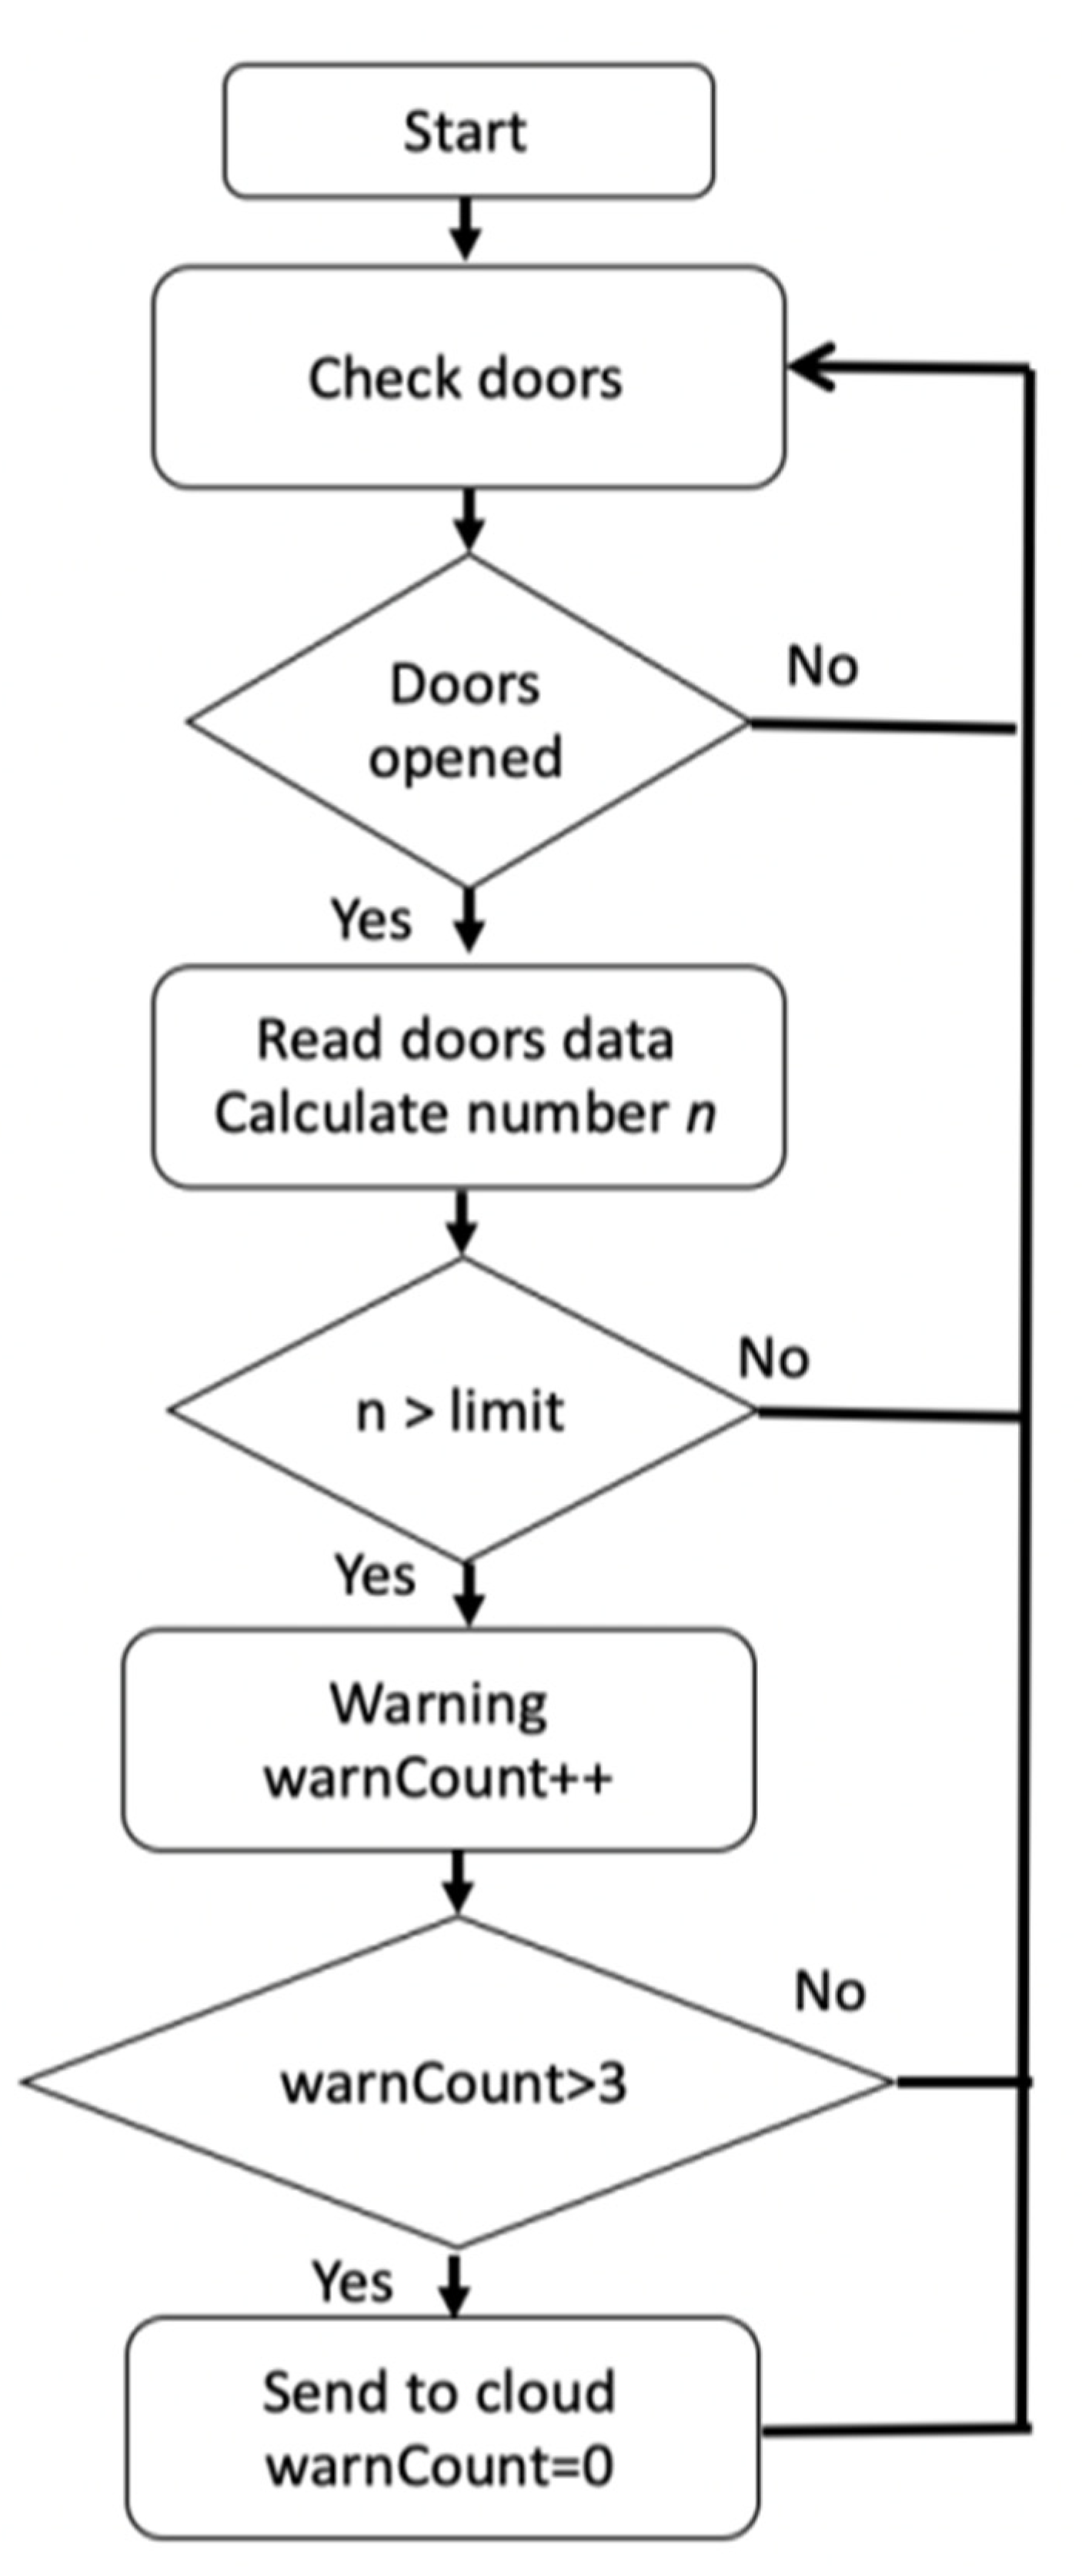
4.2. Passenger Number Monitoring Results

We tested the passenger counting algorithm by installing it on a vehicle. We used smartphone 1 in this experiment because it had the highest performance. The infrared sensors were installed at all doors of the vehicle to monitor the passengers entering through all doors. We allowed passengers to enter and leave the vehicle through all doors to monitor the change in the number of passengers. The experiment was repeated 50 times, in which the number of passengers within the legal limit was repeated 25 times, and the number of violating cases was repeated 25 times. The proposed systems (i.e., edge and fog layers) were compared with the system in [17] (i.e., edge layer alone), and the results are reported in Table 5.
At the traffic monitoring station, the accuracy was also the same, which means that the edge, fog, and cloud layers communicate well and no errors arose in the algorithms in these layers.

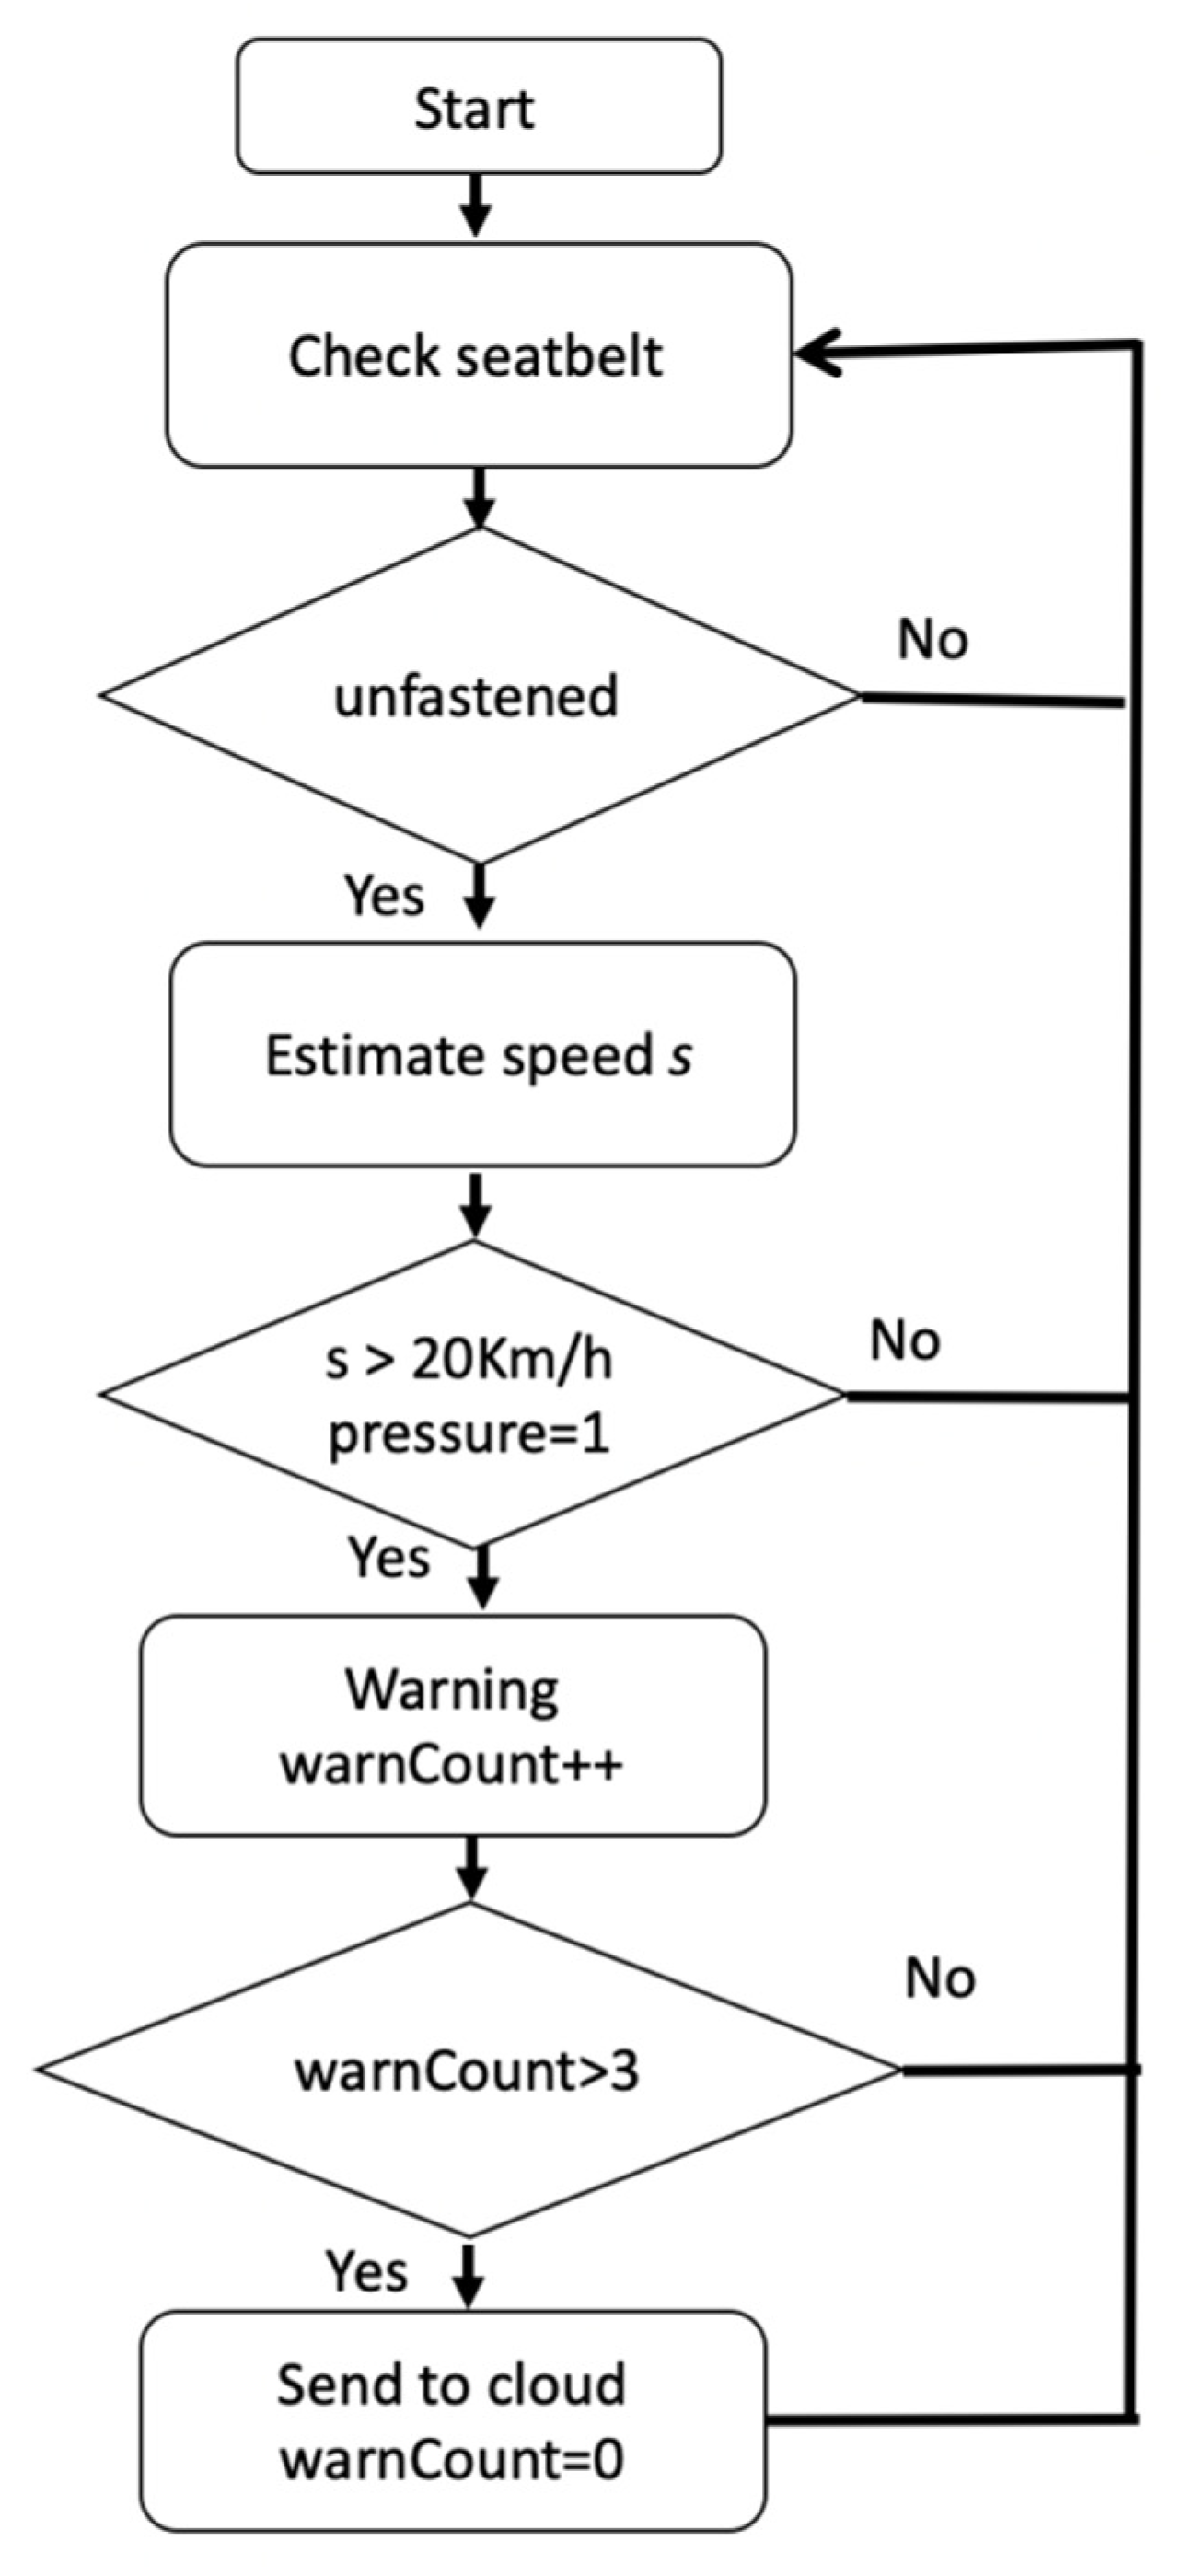
4.3. Seatbelt Monitoring Results

We tested the seatbelt monitoring algorithm by changing the status of the five seatbelts in the vehicle while driving. In this experiment, smartphone 1 was also used. Each seatbelt was unfastened 50 times while driving at a speed of over 20 Km/h. The proposed system (using an edge and a fog layer) was compared with the system in [17] (using only an edge layer) to determine the influence of adding the fog layer. The results of the seatbelt monitoring at the traffic station were as in Table 6. The accuracy of detecting seatbelts for the same vehicle status was high, which means that the proposed system can be used for seatbelt monitoring.

4.4. Latency Analysis

The most important advantage of fog computing is reducing the latency between the edge and the cloud. In our experiments, the latency from the edge to the cloud when the fog was not used was 1.7 s for the transmission of one 1.5 KB JSON file on the 3G network. This time is required when estimations are performed on the cloud and to warn the driver if a violation occurs. When the fog layer is used for the estimation, the warning message requires around 0.08 s, and transmission from the fog to the cloud for the violation double check requires 0.6 s. Thus, the fog layer reduces the time required for estimation and for violation warnings.

5. Limitations

This research has some limitations that affect its accuracy. The main limitation was the available resources for experimentations. We believe that the error in the speed estimation, passenger counting, and seatbelt fastening check can be reduced by improving the components used in the system. For example, the wiring problem can be solved by using printed circuits. Moreover, the microcontroller was slow and had limited computational power, and this can be overcome by using a more advanced microcontroller. Further, the inability to access the vehicle computer system, which depends on the vehicle manufacturer’s specifications, forced the researchers to use external components. Furthermore, the unavailability of a real cloud system forced the researchers to simulate the cloud by using CloudSim, which also caused an estimation error. Despite these limitations, the research achieved satisfying results, which can also be improved in future work.

6. Conclusions

This paper has proposed an IoT-based traffic violation monitoring system for the ubiquitous monitoring of the vehicle speed, number of passengers, and seatbelt fastening. The system aims at improving safety in vehicles and reducing the harm caused by traffic accidents. Such a system can benefit the field of autonomous vehicles. The system consists of three computing layers: the edge computing layer, the fog computing layer, and the cloud computing layer. The edge layer is connected to the sensors, and it is responsible for collecting data from the sensors and filtering and aggregating these data before sending them to the fog layer. The fog layer runs the speed estimation, passenger count, and seatbelt check algorithms and sends the results to the cloud layer. The cloud layer receives data from all vehicles and performs a second check for traffic violations before sending reports to the traffic stations. The paper concludes that adding the fog layer between the edge and cloud layers improves the accuracy of estimation, because this layer shares the computational load with the edge and sends the results to the cloud. Moreover, the paper concludes that the sensor-based monitoring approach can achieve high accuracy without requiring the same amount of computational resources as the image-recognition-based approach.
Our future work will include, firstly, improving the accuracy of the system by overcoming the limitations and investigating the effect of the system on other parameters, such as latency, throughput, and communication overhead. Secondly, future work will focus on improving the security and privacy of the system using blockchain and smart contracts. The authors in [21] show that security and privacy concerns limit the implementation of efficient vehicular traffic applications. Therefore, we will apply our proposed work in [54,55,56] using blockchain to address these challenges. This system can be integrated with traffic flow monitoring [57] and road quality detection [31] for the collection of data on road conditions. In addition to the sensor-based and vision-based approaches, social networking traffic data collection achieves accurate results in detecting accidents and traffic conditions [58]. This approach needs the support of big data analytics [59]. As blockchain is a distributed system, it can support the integration between data from sensors and data from social networks, enabling better traffic monitoring. Another future direction is to examine the proposed system’s performance in heterogeneous vehicular communication environments [60].

Author Contributions

Conceptualization, Y.-A.D.; methodology, Y.-A.D., M.A.H., E.-Y.D. and W.A.-u.; software, Y.-A.D.; validation, Y.-A.D., M.A.H., E.-Y.D. and W.A.-u.; formal analysis, Y.-A.D. and M.A.H.; investigation, Y.-A.D. and M.A.H.; resources, Y.-A.D. and E.-Y.D.; data curation, Y.-A.D. and E.-Y.D.; writing—original draft preparation, Y.-A.D., M.A.H. and E.-Y.D.; writing—review and editing, Y.-A.D., M.A.H., E.-Y.D. and W.A.-u.; visualization, Y.-A.D. and E.-Y.D.; supervision, Y.-A.D. and M.A.H.; project administration, Y.-A.D. and E.-Y.D.; funding acquisition, Y.-A.D., M.A.H., E.-Y.D. and W.A.-u. All authors have read and agreed to the published version of the manuscript.

Funding

This research received no external funding.

Institutional Review Board Statement

Not applicable.

Data Availability Statement

Not applicable.

Acknowledgments

The authors thank Palestine Technical University—Kadoorie (PTUK) and Al Istiqlal University (PASS) for their support.

Conflicts of Interest

The authors declare no conflict of interest. The funders had no role in the design of the study; in the collection, analyses, or interpretation of data; in the writing of the manuscript; or in the decision to publish the results.

References

  1. Wang, J.; Wu, J.; Li, Y. The Driving Safety Field Based on Driver–Vehicle–Road Interactions. IEEE Trans. Intell. Transp. Syst. 2015, 16, 2203–2214. [Google Scholar] [CrossRef]
  2. Ashraf, K.; Varadarajan, V.; Rahman, M.R.; Walden, R.; Ashok, A. See-Through a Vehicle: Augmenting Road Safety Information Using Visual Perception and Camera Communication in Vehicles. IEEE Trans. Veh. Technol. 2021, 70, 3071–3086. [Google Scholar] [CrossRef]
  3. Telawi, S.; Hayek, A.; Borcsok, J. Safe Detection of Wheels Spinning and Sliding in Vehicles. IEEE Trans. Veh. Technol. 2022, 71, 9410–9421. [Google Scholar] [CrossRef]
  4. Boujemaa, K.S.; Berrada, I.; Fardousse, K.; Naggar, O.; Bourzeix, F. Toward Road Safety Recommender Systems: Formal Concepts and Technical Basics. IEEE Trans. Intell. Transp. Syst. 2022, 23, 5211–5230. [Google Scholar] [CrossRef]
  5. Dhulavvagol, P.M.; Desai, A.; Ganiger, R. Vehical Tracking and Speed Estimation of Moving Vehicles for Traffic Surveillance Applications. In Proceedings of the 2017 International Conference on Current Trends in Computer, Electrical, Electronics and Communication (CTCEEC), Mysore, India, 8–9 September 2017; pp. 373–377. [Google Scholar] [CrossRef]
  6. Roriz, R.; Cabral, J.; Gomes, T. Automotive LiDAR Technology: A Survey. IEEE Trans. Intell. Transp. Syst. 2022, 23, 6282–6297. [Google Scholar] [CrossRef]
  7. Cui, Y.; Xu, H.; Wu, J.; Sun, Y.; Zhao, J. Automatic Vehicle Tracking with Roadside LiDAR Data for the Connected-Vehicles System. IEEE Intell. Syst. 2019, 34, 44–51. [Google Scholar] [CrossRef]
  8. Bonyar, A.; Geczy, A.; Harsanyi, G.; Hanak, P. Passenger Detection and Counting Inside Vehicles For eCall- a Review on Current Possibilities. In Proceedings of the 2018 IEEE 24th International Symposium for Design and Technology in Electronic Packaging (SIITME), Iasi, Romania, 25–28 October 2018; pp. 221–225. [Google Scholar] [CrossRef]
  9. IEE. Seat Belt Reminder Sensors. Available online: https://iee-sensing.com/automotive/safety-and-comfort/seat-belt-reminder/ (accessed on 28 September 2022).
  10. Standex Electronics. Seat Belt Sensor. Available online: https://standexelectronics.com/applications-markets/seat-belt-sensor/ (accessed on 28 September 2022).
  11. Beymer, D.; McLauchlan, P.; Coifman, B.; Malik, J. A real-time computer vision system for measuring traffic parameters. In Proceedings of the IEEE Computer Society Conference on Computer Vision and Pattern Recognition, San Juan, PR, USA, 17–19 June 1997; pp. 495–501. [Google Scholar] [CrossRef]
  12. Jianzhong, X.; Qiuyu, Z.; Sai, Y.; Wenjun, S. Passenger counting based on Kinect. In Proceedings of the 2014 International Conference on Audio, Language and Image Processing, Shanghai, China, 7–9 July 2014; pp. 405–409. [Google Scholar] [CrossRef]
  13. Guo, H.; Lin, H.; Zhang, S.; Li, S. Image-based seat belt detection. In Proceedings of the 2011 IEEE International Conference on Vehicular Electronics and Safety, Beijing, China, 10–12 July 2011; pp. 161–164. [Google Scholar] [CrossRef]
  14. Maduri, P.K.; Singh, G.; Sharma, S.; Mishra, R.K.; Mishra, N.K. Seat Belt And Helmet Detection Using Deep Learning. In Proceedings of the 2021 3rd International Conference on Advances in Computing, Communication Control and Networking (ICAC3N), Greater Noida, India, 17–18 December 2021; pp. 476–480. [Google Scholar] [CrossRef]
  15. Cui, Y.; Chen, R.; Chu, W.; Chen, L.; Tian, D.; Li, Y.; Cao, D. Deep Learning for Image and Point Cloud Fusion in Autonomous Driving: A Review. IEEE Trans. Intell. Transp. Syst. 2022, 23, 722–739. [Google Scholar] [CrossRef]
  16. Haydari, A.; Yilmaz, Y. Deep Reinforcement Learning for Intelligent Transportation Systems: A Survey. IEEE Trans. Intell. Transp. Syst. 2022, 23, 11–32. [Google Scholar] [CrossRef]
  17. Daraghmi, Y.-A. Vehicle Speed Monitoring System Based on Edge Computing. In Proceedings of the International Conference on Promising Electronic Technologies (ICPET), Deir El-Balah, Palestine, 17–18 November 2021. [Google Scholar]
  18. Islam, M.; Rahman, M.; Chowdhury, M.; Comert, G.; Sood, E.D.; Apon, A. Vision-Based Personal Safety Messages (PSMs) Generation for Connected Vehicles. IEEE Trans. Veh. Technol. 2020, 69, 9402–9416. [Google Scholar] [CrossRef]
  19. Chen, C.; Liu, B.; Wan, S.; Qiao, P.; Pei, Q. An Edge Traffic Flow Detection Scheme Based on Deep Learning in an Intelligent Transportation System. IEEE Trans. Intell. Transp. Syst. 2021, 22, 1840–1852. [Google Scholar] [CrossRef]
  20. Chen, X.; Wu, C.; Liu, Z.; Zhang, N.; Ji, Y. Computation Offloading in Beyond 5G Networks: A Distributed Learning Framework and Applications. IEEE Wirel. Commun. 2021, 28, 56–62. [Google Scholar] [CrossRef]
  21. Du, Z.; Wu, C.; Yoshinaga, T.; Yau, K.-L.A.; Ji, Y.; Li, J. Federated Learning for Vehicular Internet of Things: Recent Advances and Open Issues. IEEE Open J. Comput. Soc. 2020, 1, 45–61. [Google Scholar] [CrossRef] [PubMed]
  22. Xu, X.; Fang, Z.; Qi, L.; Zhang, X.; He, Q.; Zhou, X. TripRe. ACM Trans. Multimed. Comput. Commun. Appl. 2021, 17, 1–21. [Google Scholar] [CrossRef]
  23. Wan, S.; Ding, S.; Chen, C. Edge computing enabled video segmentation for real-time traffic monitoring in internet of vehicles. Pattern Recognit. 2022, 121, 108146. [Google Scholar] [CrossRef]
  24. Meghana, V.; Anisha, B.S.; Kumar, P.R. IOT based Smart Traffic Signal Violation Monitoring System using Edge Computing. In Proceedings of the 2021 2nd Global Conference for Advancement in Technology (GCAT), Bangalore, India, 1–3 October 2021; pp. 1–5. [Google Scholar] [CrossRef]
  25. Chen, N.; Chen, Y. Anomalous Vehicle Recognition in Smart Urban Traffic Monitoring as an Edge Service. Future Internet 2022, 14, 54. [Google Scholar] [CrossRef]
  26. Khan, O.; Ibrahim, A.; Mamlook, R. Fog Computing-Based Model for Mitigation of Traffic Congestion. Int. J. Simul. Syst. Sci. Technol. 2019, 19, 5.1–5.7. [Google Scholar] [CrossRef]
  27. Vergis, S.; Komianos, V.; Tsoumanis, G.; Tsipis, A.; Oikonomou, K. A Low-Cost Vehicular Traffic Monitoring System Using Fog Computing. Smart Cities 2020, 3, 138–156. [Google Scholar] [CrossRef] [Green Version]
  28. Ding, X.; Wang, Z.; Zhang, L.; Wang, C. Longitudinal Vehicle Speed Estimation for Four-Wheel-Independently-Actuated Electric Vehicles Based on Multi-Sensor Fusion. IEEE Trans. Veh. Technol. 2020, 69, 12797–12806. [Google Scholar] [CrossRef]
  29. Tan, G.; Gao, H. Vehicle state estimation of steer by wire system based on multi sensor fusion. In Proceedings of the 2017 Chinese Automation Congress (CAC), Jinan, China, 20–22 October 2017; pp. 6329–6333. [Google Scholar] [CrossRef]
  30. Xue, W.; Wang, D.; Wang, L. Monitoring the Speed, Configurations, and Weight of Vehicles Using an In-Situ Wireless Sensing Network. IEEE Trans. Intell. Transp. Syst. 2015, 16, 1667–1675. [Google Scholar] [CrossRef]
  31. Daraghmi, Y.-A.; Wu, T.-H.; Ik, T.-U. Crowdsourcing-Based Road Surface Evaluation and Indexing. IEEE Trans. Intell. Transp. Syst. 2022, 23, 4164–4175. [Google Scholar] [CrossRef]
  32. Singla, L.; Bhatia, P. GPS based bus tracking system. In Proceedings of the 2015 International Conference on Computer, Communication and Control (IC4), Indore, India, 10–12 September 2015; pp. 1–6. [Google Scholar] [CrossRef]
  33. Wei, J.; Chiu, C.-H.; Huang, F.; Zhang, J.; Cai, C. A cost-effective decentralized vehicle remote positioning and tracking system using BeiDou Navigation Satellite System and Mobile Network. EURASIP J. Wirel. Commun. Netw. 2019, 2019, 112. [Google Scholar] [CrossRef]
  34. Daraghmi, Y.-A.; Daadoo, M. Intelligent Smartphone based system for detecting speed bumps and reducing car speed. MATEC Web Conf. 2016, 77, 09006. [Google Scholar] [CrossRef] [Green Version]
  35. Koubaa, A.; Qureshi, B. DroneTrack: Cloud-Based Real-Time Object Tracking Using Unmanned Aerial Vehicles Over the Internet. IEEE Access 2018, 6, 13810–13824. [Google Scholar] [CrossRef]
  36. Kanhere, N.K.; Birchfield, S.T. A Taxonomy and Analysis of Camera Calibration Methods for Traffic Monitoring Applications. IEEE Trans. Intell. Transp. Syst. 2010, 11, 441–452. [Google Scholar] [CrossRef]
  37. Yabo, A.; Arroyo, S.; Safar, F.G.; Oliva, D. Vehicle classification and speed estimation using Computer Vision techniques. In Proceedings of the XXV Congreso Argentino de Control Automático, Buenos Aires, Argentina, 19–22 September 2016. [Google Scholar]
  38. Barth, V.; de Oliveira, R.; de Oliveira, M.; Nascimento, V.d. Vehicle Speed Monitoring using Convolutional Neural Networks. IEEE Lat. Am. Trans. 2019, 17, 1000–1008. [Google Scholar] [CrossRef]
  39. Luvizon, D.C.; Nassu, B.T.; Minetto, R. A Video-Based System for Vehicle Speed Measurement in Urban Roadways. IEEE Trans. Intell. Transp. Syst. 2016, 18, 1393–1404. [Google Scholar] [CrossRef]
  40. Zhong, G.; Wan, X.; Zhang, J.; Yin, T.; Ran, B. Characterizing Passenger Flow for a Transportation Hub Based on Mobile Phone Data. IEEE Trans. Intell. Transp. Syst. 2016, 18, 1507–1518. [Google Scholar] [CrossRef]
  41. Yuen, J.K.K.; Lee, E.W.M.; Lo, S.M.; Yuen, R.K.K. An Intelligence-Based Optimization Model of Passenger Flow in a Transportation Station. IEEE Trans. Intell. Transp. Syst. 2013, 14, 1290–1300. [Google Scholar] [CrossRef]
  42. Seidel, R.; Jahn, N.; Seo, S.; Goerttler, T.; Obermayer, K. NAPC: A Neural Algorithm for Automated Passenger Counting in Public Transport on a Privacy-Friendly Dataset. IEEE Open J. Intell. Transp. Syst. 2022, 3, 33–44. [Google Scholar] [CrossRef]
  43. Janitzek, T.; Achterberg, F. Seat Belt Reminders, Implementing Advanced Safety Technology in Europe’s Cars. ETC. 2006. Available online: https://etsc.eu/seat-belt-reminders/ (accessed on 6 October 2022).
  44. BuckleMeUp. Buckle Me Up Seatbelt Reminder and Alert. Available online: https://www.bucklemeup.com/ (accessed on 28 September 2022).
  45. FEI. Seat Belt Sensors. Available online: https://www.fab-ent.com/adl/alarms-sensors/seat-belt-sensors (accessed on 28 September 2022).
  46. Kashevnik, A.; Ali, A.; Lashkov, I.; Shilov, N. Seat Belt Fastness Detection Based on Image Analysis from Vehicle In-abin Camera. In Proceedings of the 2020 26th Conference of Open Innovations Association (FRUCT), Yaroslavl, Russia, 20–24 April 2020; pp. 143–150. [Google Scholar] [CrossRef]
  47. Ren, S.; He, K.; Girshick, R.; Sun, J. Faster R-CNN: Towards Real-Time Object Detection with Region Proposal Networks. IEEE Trans. Pattern Anal. Mach. Intell. 2017, 39, 1137–1149. [Google Scholar] [CrossRef]
  48. Wu, T.; Zhang, Z.; Liu, Y.; Guo, W.; Wang, Z. Driver Seat Belt Detection Based on YOLO Detection and Semantic Segmentation. J. Comput.-Aided Des. Comput. Graph. 2019, 31, 126. [Google Scholar] [CrossRef]
  49. Yang, D.; Zang, Y.; Liu, Q. Study of Detection Method on Real-time and High Precision Driver Seatbelt. In Proceedings of the 2020 Chinese Control And Decision Conference (CCDC), Hefei, China, 22–24 August 2020; pp. 79–86. [Google Scholar] [CrossRef]
  50. Artan, Y.; Bulan, O.; Loce, R.P.; Paul, P. Passenger Compartment Violation Detection in HOV/HOT Lanes. IEEE Trans. Intell. Transp. Syst. 2016, 17, 395–405. [Google Scholar] [CrossRef]
  51. Korn, G.A.; Korn, T.M. Appendix b: B9. plane and spherical trigonometry: Formulas expressed in terms of the haversine function. In Mathematical Handbook for Scientists and Engineers: Definitions, Theorems, and Formulars for Reference and Review, 3rd ed.; Mineola: New York, NY, USA, 2000. [Google Scholar]
  52. OpenStreetBrowser. Available online: https://www.openstreetbrowser.org/#map=13/32.2668/35.1126&categories=car_maxspeed (accessed on 22 October 2022).
  53. Buyya, R.; Ranjan, R.; Calheiros, R.N. Modeling and Simulation of Scalable Cloud Computing Environments and the CloudSim Toolkit: Challenges and Opportunities. Available online: https://arxiv.org/ftp/arxiv/papers/0907/0907.4878.pdf (accessed on 29 September 2022).
  54. Daraghmi, E.-Y.; Daraghmi, Y.-A.; Yuan, S.-M. MedChain: A design of blockchain-based system for medical records access and permissions management. IEEE Access 2019, 7, 164595–164613. [Google Scholar] [CrossRef]
  55. Daraghmi, E.Y.; Daraghmi, Y.A.; Yuan, S.M. UniChain: A Design of Blockchain-Based System for Electronic Academic Records Access and Permissions Management. Appl. Sci. 2019, 9, 4966. [Google Scholar] [CrossRef] [Green Version]
  56. Daraghmi, E.-Y.; Helou, M.A.; Daraghmi, Y.-A. A Blockchain-Based Editorial Management System. Secur. Commun. Netw. 2021, 2021, 9927640. [Google Scholar] [CrossRef]
  57. Daraghmi, Y.-A.; Yi, C.-W.; Chiang, T.-C. Negative Binomial Additive Models for Short-Term Traffic Flow Forecasting in Urban Areas. IEEE Trans. Intell. Transp. Syst. 2014, 15, 784–793. [Google Scholar] [CrossRef]
  58. Ali, F.; Ali, A.; Imran, M.; Naqvi, R.A.; Siddiqi, M.H.; Kwak, K.-S. Traffic accident detection and condition analysis based on social networking data. Accid. Anal. Prev. 2021, 151, 105973. [Google Scholar] [CrossRef]
  59. Bag, S.; Pretorius, J.H.C.; Gupta, S.; Dwivedi, Y.K. Role of institutional pressures and resources in the adoption of big data analytics powered artificial intelligence, sustainable manufacturing practices and circular economy capabilities. Technol. Forecast. Soc. Chang. 2021, 163, 120420. [Google Scholar] [CrossRef]
  60. Khasawneh, A.M.; Helou, M.A.; Khatri, A.; Aggarwal, G.; Kaiwartya, O.; Altalhi, M.; Abu-ulbeh, W.; AlShboul, R. Service-Centric Heterogeneous Vehicular Network Modeling for Connected Traffic Environments. Sensors 2022, 22, 1247. [Google Scholar] [CrossRef]
Figure 1. The proposed monitoring system architecture, which consists of a microcontroller connected to sensors as the edge layer, a processor as a fog layer, and a cloud layer connected to a traffic monitoring station.
Futureinternet 14 00319 g001
Figure 2. The flow chart of the passenger counting algorithm in the fog layer. The algorithm counts the number of passengers when the doors are opened, and warns the driver three times if the number exceeds the permitted value, before sending a fine request to the cloud.
Futureinternet 14 00319 g002
Figure 3. The flow chart of the speed monitoring algorithm in the fog layer. The algorithm estimates the speed using the Haversine function and warns the driver three times before sending the fine request to the cloud if the speed exceeds the permitted value.
Futureinternet 14 00319 g003
Figure 4. The flow chart of the seatbelt checking algorithm in the fog layer. The algorithm checks whether the seatbelt is fastened or not when the vehicle is moving and the seat is occupied. The algorithm warns the driver three times before sending the fine request to the cloud if the seatbelt is unfastened.
Futureinternet 14 00319 g004
Figure 5. (a): The trajectory of the vehicle during the experiments. The road is between Nablus city and Tulkarem city. The distance is 15 km. (b): The digital speed meter used to record the vehicle speed.
Futureinternet 14 00319 g005
Figure 6. Speed estimation using three smartphones. The speed estimated by smartphone 1 is higher than that of smartphones 2 and 3. This accuracy is due to the high performance of smartphone 1, since it can compute the estimation algorithm and fetch data from memory more quickly than smartphones 2 and 3.
Futureinternet 14 00319 g006
Figure 7. Speed estimation using smartphone 1, which shows a comparison of estimation between the baseline (edge computing alone) and the proposed system (edge + fog layers). The proposed system’s estimation is more accurate than that of the baseline.
Futureinternet 14 00319 g007
Table 1. Classification of related studies based on the objectives and technologies.
Sensor-Based ApproachComputer-Vision-Based Approach
Speed estimationProposed system [5,6,7,15,30,33,34][36,37,38,39]
Passenger countingProposed system [8][12,42]
Seatbelt detectionProposed system [43,44,45][13,14,46,48,49,50]
Table 2. The specifications of the smartphones used in the experiments.
SmartphonesCPUGPU (Adreno)Memory (GB)
s1Octa-core (2 × 2.3 GHz Kryo 465 Gold 6 × 1.8 GHz Kryo 465 Silver)618128
s2Octa-core (4 × 2.2 GHz Kryo 260 Gold 4 × 1.8 GHz Kryo 260 Silver)51264
s3Hexa-core (4 × 1.4 GHz Cortex-A53 2 × 1.8 GHz Cortex-A72)51016
Table 3. CloudSim simulation parameters.
ParameterValue
Number of data centers1
Number of hosts1
Number of data center brokers1
Number of virtual machines (VM)4
Number of processing elements (PE)1
MIPS of PE4000
MIPS of each VM400
VM RAM2048 MB
Data center schedulingSpace-shared
VM schedulingSpace-shared
Bandwidth1000
Number of cloudlets10
Cloudlet schedulingSpace-shared
CPU, RAM, BWFull utilization
Table 4. The root mean square error of the system with and without the fog layer.
SmartphoneRMSE
without Fog Layers
RMSE
with Fog Layers
s12.091.54
s22.791.82
s33.062.27
Average 2.641.87
Table 5. The accuracy of the passenger counting algorithm.
Accuracy
Doorwithout Fog Layerwith Fog Layer
Front left95%98%
Front right94%97%
Rear left93%98%
Rear right94%94%
Average 94%97%
Table 6. The accuracy of seatbelt detection with and without the fog layer.
Correct DetectionIncorrect DetectionAccuracy
Doorwithout Fog Layerwith Fog Layerwithout Fog Layerwith Fog Layerwithout Fog Layerwith Fog Layer
Front left47493194%98%
Front right48502096%100%
Rear left47493194%98%
Rear right48502096%100%
Average 95%99%
Publisher’s Note: MDPI stays neutral with regard to jurisdictional claims in published maps and institutional affiliations.

