Article

Evaluation of the Factors That Impact the Perception of Online Content Trustworthiness by Income, Political Affiliation and Online Usage Time

1
College of Innovation and Technology, University of Michigan-Flint, Flint, MI 48502, USA
2
Department of Computer Science, North Dakota State University, Fargo, ND 58105, USA
*
Author to whom correspondence should be addressed.
Future Internet 2022, 14(11), 320; https://doi.org/10.3390/fi14110320
Submission received: 13 September 2022 / Revised: 31 October 2022 / Accepted: 2 November 2022 / Published: 3 November 2022

Abstract

:
Intentionally deceptive online content represents a significant issue for society. Multiple techniques have been proposed to identify and combat its spread. To understand how to inform individuals most effectively about the potential biases of and other issues with content, this article studies factors that impact the perception of online content. Specifically, it looks at how these factors have similar or different impact depending on the income level, political affiliation and online usage time of Americans. A national survey was conducted that asked respondents about multiple factors that influence their and others’ perception of online content trustworthiness. It also asked what the ideal impact of these factors should be. This data is presented and analyzed herein, conclusions are drawn and their implications, with regard to preventing the spread of deceptive online content, are discussed.

1. Introduction

Deceptive online content presents numerous challenges to modern society. It has been blamed for numerous incidents ranging from election interference [1] to a standoff in a pizza parlor [2]. Manipulative online content, in particular, has been blamed for significantly contributing to the U.S. 6 January capitol riot [3]. The term “fake news” has become commonplace, in some instances referring to deceptive content and in others used to attack content that the speaker disagrees with [4,5].
While several pronounced examples of the problem have occurred in the United States, the phenomenon is far bigger than just in America. Interference with the British Brexit vote [6,7], for example, has been alleged. Brazilian president Bolsonaro [8] explicitly used the term “fake news” in reference to a Reuters report regarding communications between the CIA and Brazilian officials. Disinformation has also been argued to have had a key role in the Russia-Ukraine conflict [9]. Examples of the “fake news” and online deceptive and manipulative content phenomena have been documented in at least 20 countries [10]. Lee [11], most pronouncedly, contends that “fake news” represents a threat to democracy itself.
Numerous responses to deceptive and allegedly deceptive online content have occurred. Cogent Communications disconnected internet backbone service into Russia to prevent “the Russian government from using the company’s networks for cyberattacks and propaganda” [12]. Russia, conversely, passed a law against so-called “fake news”, blocked Facebook, limited Twitter access and threatened to “block” Wikipedia due to “’false messages’ about the [Ukraine] war” [12]. The Russian “fake news” law threatens violators with up to fifteen years of jail time and fines of over a million rubles [13] and has caused some organizations to cease Russian operations, while others have changed to align with the Russian government’s dictates [14].
Worldwide, prospective solutions for preventing the spread of misinformation, disinformation and other deceptive content have included techniques such as filtering content [15], content detection and removal [16], limiting access to the internet [17], and content labeling [18]. Problematically, many of these techniques could also be used for preventing the spread of accurate information that is disliked by or critical of various governments.
In prior work, the efficacy of online labeling has been assessed [18] and user perceptions of labels have been analyzed [19,20]. In particular, labels’ efficacy have been evaluated based on Americans’ income level, party affiliation and online use levels [21] and factors impacting Americans’ perception of the trustworthiness of online content have been analyzed based on age, education level and gender [22]. This paper seeks to further the understanding of how labeling can be used to mitigate the spread of fake news—as defined by Goldbeck et al. [23] as “information, presented as a news story that is factually incorrect and designed to deceive the consumer into believing it is true”. It builds on the aforementioned prior work by focusing on the impact of income, political affiliation and online usage time on the factors that impact Americans’ perceptions of online content trustworthiness.
A broad consensus, across the studied demographics, that each labeling metric considered should be used at least ‘a moderate amount’ is shown, suggesting the feasibility of an online content labeling system using these metrics. However, less consistency is shown when considering the higher standards of metric impact and use at the ‘a lot’ and ‘a great deal’ levels, particularly between respondents indicating different political affiliations. The level of use, for many labeling metrics, was shown to tend to increase with both average daily internet usage time and with reported income level, though exceptions to this trend were present at the highest and lowest income levels.
This paper continues, in Section 2, with a discussion of relevant prior work that provides a foundation for the analysis presented herein. Section 3 presents the instrument and techniques used for data collection and provides an overview of respondents’ demographic characteristics. In Section 4, the impact of articles’ title, author, publisher and metadata on trustworthiness perception are discussed as are the impact of article characteristics on trustworthiness perception. Section 5 analyzes the data presented and discussed in the previous sections, before the paper concludes and discusses future work, in Section 6.

2. Background

This section presents prior work in several areas which provide a foundation for the work presented herein. First, prior work related to deceptive online content and the issues that it poses is reviewed. Next, work related to deceptive online content identification is discussed. Finally, prior work related to deceptive content response techniques is presented.

2.1. Deceptive Online Content and the Issues It Causes

Keyes, in 2004, called the era one of “post-truth” [24], noting that “deception has become commonplace”. For many, though, it was events in 2016 that raised awareness of this deception. The U.S. presidential election and Brexit referendum on leaving the European Union both showcased how potentially susceptible some online channels of information, and their users, were to manipulation. Brexit influence attacks included the use of “hyperpartisan” content [6], foreign-source online content [25], Twitterbots [6] and illegal profiling [25]. The U.S. election brought the term “fake news” into the national vocabulary with numerous deceptive articles circulating on social media [26]. It has been estimated that 6% of all news during the election period was fake, but only 1% of the population received most of this content [1]. Tweets, on the other hand, were more problematic, with Bovet and Makse [27] finding that a quarter of tweets during the election were “fake or extremely biased news”, based on the websites they linked to. Allen et al. [28] though, found that—in general—fake news is only about 0.15% of Americans’ media consumption.
The consequence of this content proliferation is significant. Lee [11] proffers that “fake news” is a “sinister force” which is a threat to democracy itself. Monsees [29], similarly, characterized it as being “a war against truth”, nothing that the threat has risen from being “a very specific concern regarding the spread of information via social media” to becoming an actual “security concern”.
The impact of deceptive content is not uniform. It has been shown to have a more pronounced effect on some individuals due to “confirmation bias, selective exposure, and lack of analytical thinking” [30]. Its impact on youth is also pronounced. Several studies characterize the issues. A study conducted in the United States showed that only 11% of children were able to identify a hoax website, while a similar Netherlands study found this number to be only 7% [31]. When surveyed, college students indicated expecting social media news content to be inaccurate [32], despite the 18 to 29 age group using social media more frequently and trusting it more than those of other ages [32,33]. Other studies (e.g., [34,35,36]), though, have suggested that the impact on youth may be less pronounced and more nuanced.
The exact impact of deceptive content, both at present and into the future, thus, has been difficult to characterize. However, there have been some pronounced real-world impacts. The Pizzagate incident in the United States [2] and fake news-triggered assault in Mexico [30] show the specific harm that it can cause. It has also been shown to have impacted elections [1,27] and reduced public trust in traditional media [37]. Falsely labeling content as fake news has served to, Lees contents, “plant mistrust in the media, stop stories being published, and even imprison journalists” [38]. Furthermore, problematic is the fact that, according to Zucker [39], residual belief in the incorrect information remains, “even after individuals learn that a piece of information is false … because of the difficulty of removing information once it has been encoded in memory”.

2.2. Deceptive Online Content Identification

This paper focuses on understanding Americans’ perspectives regarding content trustworthiness, which contributes to the development and understanding of techniques to combat deceptive online content. Most techniques designed to combat the spread of deceptive online content require supporting techniques to identify that content. These techniques are the focus of this section.
To identify deceptive online content, a defining set of criteria is required. Zhang et al. [40] suggested that four elements be considered when determining whether content is “fake news” or not. The suggested elements were the content’s creator/spreader, target victims, social context, and the nature of the content itself. However, without identifying specific facts which are inaccurate and a proving a creator’s nefarious intent, the process is still inherently subjective. Most techniques focus on identification using correlating factors, as opposed to direct methods.
Content identification techniques can be manual, automatic, or a combination of the two. Zhou and Zafarani [41] proposed an approach which identifies content based on its style and the distributing party, while also using network analysis. Budak, Agrawal and Abbadi [42] also proposed a network analysis technique based on the identification of influential nodes. Others [43,44] have proposed techniques based on user analysis. Wang [45], alternately, discussed using a machine learning-based automation approach which utilizes manual annotations. Suchia et al. [46] developed an algorithm focusing on identifying “rumors” which “many people believe to be true” despite them drawing on misinformation.
Techniques based on technologies such as neural networks [47,48], natural language processing [49] and neural stacking [50] have also been proposed. Other techniques have focused on social science dimensions, such as those considering emotion cognizance [51], social context analysis [40,52], content and sentiment analysis [40] and signal detection [53].
Several approaches have already been implemented in practice. Twitter’s has introduced a “Birdwatch” system which involves manual user review of Twitter posts [54]. Wikipedia has a manually developed news source list which includes reliability assessment (See https://en.wikipedia.org/wiki/Wikipedia:Reliable_sources/Perennial_sources, accessed on 3 November 2022).
Beyond identifying deceptive content, several taxonomies for more precisely classifying it have been developed. Tandoc, Lim and Ling [55], for example, proposed a system which places content into six categories: “fabrication”, “manipulation”, “propaganda”, “satire”, “parody”, and “advertising”. Bakir and McStay [56] proposed a seven category system with the classifications of “false connection”, “false context”, “manipulated content”, “misleading content”, “imposter content (genuine sources are impersonated)”, “fabricated content”, “satire/parody”. Notably, these taxonomies may support the identification of deceptive content, in addition to classifying already identified content.

2.3. Deceptive Online Content Response Techniques

A variety of approaches have been proposed to respond to deceptive online content, once it is identified. Proposed and, in some cases, implemented technical solutions have included content filtering [15], limiting the effectiveness of botnets [57], removing content [16], limiting or preventing internet access [17], and labeling content [18].
Worldwide, a variety of policy approaches have also been utilized. Yadav et al. [58] have demonstrated how numerous different approaches to regulation have been implemented by analyzing over 100 national laws. The approaches taken vary significantly.
The European Union, for example, has utilized an approach that seeks to “facilitate digital platforms’ self-regulation to tackle misinformation and disinformation” [59]. Indonesia, on the other hand, has laws that impose jail sentences on those convicted of “spreading false information or news that intentionally causes public disorder” of up to a decade [59].
A Bangladesh law, despite the country’s constitutional free speech protections, seeks “to control the spread of online misinformation” and has, according to Haque et al. [60], been used to shut down publications and jail journalists.
The People’s Republic of China enacted a law, the Computer Information Network and Internet Security, Protection and Management Regulations of 1997, which prohibits “making falsehoods or distorting the truth, spreading rumors, destroying the order of society” on the internet. Misinformation, according to these regulations, should be removed [61].
Ethiopia prohibits certain types of “false accusations”, while Cote d’Ivoire prohibits “’false information’ that could harm the reputation of institutions” [62]. Malawi’s has a law that prohibits publishing “false statements that may ‘cause fear and alarm to the public or do disturb the public peace’” [62].
In addition to technical and legal solutions that seek to prevent the creation and/or dissemination of deceptive content, other approaches have also been utilized. Labeling is one such approach. Labeling approaches, which are discussed in more detail in [18], build on a variety of initiatives for other content types and products. In the United States, MPAA movie and V-Chip television ratings [63,64,65] are used to label video content, while explicit lyric warning labels [66] are applied to applicable music. Other labels include anti-piracy warnings [67], food nutrition facts labels [68] and cigarette health warning labels [69].
Labeling for online content has also been previously proposed. Fuhr et al. [23], for example, proposed labeling content with information in multiple categories such as its level of factuality (versus opinion content), virality, emotionality, controversy, source credibility, and reading level. Fairbanks et al. [70], on the other hand, developed a system that seeks to label content based on the types of words used, classifying some as “liberal words,” “conservative words,” and “fake news words”. Problematically, in this study [70], the system’s identification of fake news, based on the applicable words, was shown to be unreliable.

3. Data Collection and Respondents

This processes that were used for collecting and analyzing data and respondents’ characteristics are discussed in this section. The survey instrument and the data collection techniques are described in Section 3.1. Then, the implications of respondents’ answers are discussed in Section 3.2. Finally, respondents’ demographics are reviewed in Section 3.3.

3.1. Survey and Data Collection

This paper draws from the same data used in [20,21,22]. It utilized a survey instrument which is based on (modified from) the survey instrument which was used for data collection in [19]. There are several differences between the instrument used for this work and the instrument used in [19]. First, the questions from the three surveys used in [19], which were previously administered independently, were combined. After this, editing then focused on removing questions. Some questions were included on two or more of the three surveys and duplicates were thus removed. The survey was also edited to reduce the required response time. The project team and Qualtrics survey staff reviewed the revised survey instrument before its use.
Instrument reliability was enhanced through several efforts. First, an initial pilot was performed at two universities. As part of this effort, multiple students wrote and reviewed questions. These questions were also reviewed by other project team members prior to this initial pilot study, covering a variety of ages and other demographic characteristics. For the current study, the questions were reviewed again by the project team members and Qualtrics staff. Then, as part of Qualtrics’ standard procedure, a limited pilot study phase was used to validate the instrument, before the larger scale study commenced. Because no issues occurred during the pilot, these responses were applied to the demographic quotas and are included in the dataset which is analyzed herein.
Questions on the survey instrument ask respondents about their personal perceptions, their perceptions of others’ attitudes and beliefs, and their perceptions of what is ideal. These data were collected using a series of related questions:
  • How much of an impact does [topic] have on your personal perceptions of trustworthiness and or credibility of an article?
  • How much of an impact do you believe the [topic] has on other people’s perception of the trustworthiness and or credibility of an article?
  • If you were acting in an ideal manner, to what extent should [topic] impact your perception of the trustworthiness and or credibility of an article?
These three related questions facilitate conducting analysis that compares respondents’ own action and belief perceptions, respondents’ perceptions of others and their belief regarding what should be done. Respondents were asked to choose one of five responses which were presented, in the survey, on a Likert-like scale:
A great dealA lotA moderate amountA littleNone at all
Data was collected for analysis, in this paper, by Qualtrics International Inc. using a quota-based stratified sampling technique using the survey instrument described previously. Respondents were recruited to provide a population proportionate representation in terms several key demographic characteristics: gender, age, income level and political affiliation. The survey was conducted in October of 2021. From this, approximately 550 responses were received. Five-hundred of these responses were a part of the population representative sample. An incentive (such as airline miles or a gift card) was given to respondents who completed the survey; thus, most responses were complete. All responses, which include an answer to the relevant response question and demographics being analyzed, were considered in this paper. This includes some respondents who are not part of the population representative quotas. The responses for each question were analyzed, using Qualtrics and Microsoft Excel software, and the each of the three demographic characteristics’ impact are assessed herein.

3.2. Implications of Respondent Answers

The data that has been collected can be analyzed both individually, in terms of respondents’ perceptions of their own beliefs, perceptions of the beliefs of others and their perceptions of ideal beliefs. It can also be analyzed through the juxtaposition of these three perceptions. Table 1 presents the interpretation of different combinations of self, others and ideal perceptions for a given response. These belief paradigms are utilized in the analysis presented in Section 5.
Table 1. Interpretations of indications of self, others and ideal combinations [19].
SelfOtherIdealMeaning
Everyone does this, and we should.
I do this, and everyone else should.
Everyone else does this, and I should.
No one does this, but we all should.
Everyone does this, but we should not.
Only I do this, and I should not.
Everyone else does this, but they should not.
No one does this, and no one should.

3.3. Respondent Demographics

Data was collected to classify respondents based on several different demographic characteristics. Gender, age, educational attainment level, income and political party affiliation were traits that participants were recruited for, to be population-proportionate. For this study, all responses where the relevant demographic characteristic question and question being assessed were completed were utilized, including responses that were not part of the population-proportionate set. Because of the population proportionate recruiting, the participants are well distributed with regard to each characteristic.
In terms of gender, just under half of respondents (49%) were male and just over half (51%) were female. Respondents were also given the option to indicate a non-binary gender; however, less than 1% of respondents indicated a non-binary gender preventing further analysis, due to the small sample size.
Responses were received from respondents with ages across the spectrum. The distribution of respondents’ ages is presented in Table 2. The 18–24, 25–29 and 30–34 age groups each contained about 11% of respondents. Ten percent of respondents were aged between 35–39 and 9% of respondents were aged between 40–44. The 45–49 age group contained approximately 7% of respondents and the 50–54 age group contained approximately 6% of respondents. Fourteen percent of respondents were 55 between 59 years old. Finally, 12% of respondents were between 60 and 64 years old and 11% of respondents indicated being 65 and older.
Table 2. Respondents’ age distribution [20].
18–2425–2930–3435–3940–4445–4950–5455–5960–6465 and Older
10.57%10.93%11.29%10.04%8.96%6.63%6.09%12.54%12.19%10.75%
59616356503734706860
Respondents were also well distributed in terms of their educational attainment, as it was a demographic characteristic for which population-proportionality was targeted. The educational levels which were reported by participants are presented in Table 3. Of those responding, approximately 25% (each) have completed high school or completed some college but not completed a degree program. Just under a quarter (22%) have completed a bachelor’s degree. A smaller number (12%) of respondents have completed an associate’s degree. The number of respondents who have completed graduate degrees is much lower that other categories, with only 3% holding a Ph.D. and 12% holding a masters’ degree. A relatively small number of respondents (5%) indicated that they had not completed high school.
Table 3. Respondents’ education distribution [20].
Some High School (No Degree)High School DegreeSome College (No Degree)Associate’s DegreeBachelor’s DegreeMaster’s DegreeDoctoral Degree
4.68%25.72%23.20%11.51%22.12%10.25%2.52%
26143129641235714
Respondents’ income distribution is presented in Table 4. Just under a quarter of respondents earned less than $24,999, while just over a quarter of respondents earned between $50,000 and $74,999. This was the largest of the income groups. Just under 20% earned between $25,000 and $49,999 and just over 15% earned between $75,000 and $99,999. The highest earners, the $125,000 or more group, made up just under 10% of respondents. Finally, the smallest income group was earners between $100,000 and $124,999, who comprised 7% of respondents.
Table 4. Respondents’ income level distribution [20].
$24,999 or Less$25,000 to $49,999$50,000 to $74,999$75,000 to $99,999$100,000 to $124,999$125,000 or More
22%19%27%16%7%9%
121107153903750
The breakdown of respondents’ political affiliations is shown in Table 5. Just under 45% of respondents identified affiliating as independent or with a party other than the Republicans or Democrats. Democrats comprised 29% of respondents, while Republicans comprised 27%.
Table 5. Respondents’ political affiliation distribution [20].
Republican PartyIndependent/Other PartyDemocratic Party
27%44%29%
149247162
Finally, respondents’ daily online time (spent reading news websites and social media) distribution is presented in Table 6. The largest group was individuals who spent between one and three hours online, which comprised 41% of respondents. This was followed by those spending one or less hours, which comprised 39% of respondents. Thirteen percent spent between three and five hours consuming online content and 8% devoted more than 5 h daily to online content reading.

4. Results and Discussion

This section presents and discusses the survey results. The impact of the article’s title, author, publisher and metadata are discussed in Section 4.1. Section 4.2 considers the impact of article characteristics.

4.1. Article Title, Author, Publisher and Metadata Impact

This section describes the responses of the study participants with respect to the impact of the article’s title, publisher, publication date, author, sponsor, the author’s political alignment, the publisher’s political alignment, and the sponsor’s political alignment on their perceptions of the trustworthiness of the article. Each is discussed in the following subsections. Comparison between respondents’ perceptions of the impact of the attributes is discussed in Section 5.

4.1.1. Title

This section considers respondents’ perceptions regarding the usefulness of articles’ titles for judging the trustworthiness of an article. Respondents were asked to characterize their personal perception of the title’s utility for assessing article accuracy, their perception of how useful the title is to others, for gauging article accuracy, and their perception of what level of utility the title should ideally have in gauging article accuracy.
Figure A1, located in Appendix A, presents respondents’ perceptions of the utility of the title for their own accuracy assessment, in terms of their income level, party affiliation and internet usage level. In terms of income level (shown in Figure A1a), there is a notable increase in the level of title usage by respondents as income levels increase. At the income level of $24,999 or less, just under 80% of respondents indicate that they use the title at least a moderate amount and nearly 90% indicate using it a little. The percentage of respondents using the title at least a moderate amount increases between the two lowest income level groups and then fluctuates somewhat. However, the percentage of individuals using the title metric at least a little rises to over 95% at the highest income level.
With respect to party affiliation (see Figure A1b), Republican and Democrat respondents use the title at almost equal levels, at the ‘a lot’ level; however, Democrats report using it more at the moderate amount level and slightly more at the ‘a little’ level. Independents/other party affiliated respondents report the lowest level of self-usage at each level; however, over 70% percent of independent/other party respondents report using the title at the moderate amount level and approximately 90% report using it at least a little.
Respondents’ reliance on the title increases, at the moderate level, with internet usage time across all for levels of usage. However, a notably larger number of users report moderate use (as opposed to a great deal or a lot of use) at the highest internet usage levels (see Figure A1c). Those with 1 h or less of reported internet usage report the lowest usage of the title, across all use levels, with approximately 85% of respondents indicating at least a little use of the metric and just under 75% of respondents reporting at least moderate use. At the other internet usage levels, at least 90% of respondents reported at least a little use, with slightly greater use being reported for users using the internet between 1 and 5 h.
Figure A2 presents the respondents’ perceptions of the title’s impact on the decision making of others when considering the trustworthiness of an article.
In terms of income level (see Figure A2a), there is general increase in the perceived level of usage of the title by others with increasing income. At the two highest income levels, all respondents reported at least a little usage by others. At an income level of $24,999 or less, approximately 80% of respondents indicated that they thought that others used the title at least a moderate amount. This peaks at approximately 90% at both the $25,000 to $49,999 and $125,000 or more levels, with slightly lower levels of use (though still higher than reported by the $24,999 or less group) reported at the intervening income levels. The growth in, at least a little, usage is similar to the responses for self-perception (shown in Figure A1a).
With respect to party affiliation (see Figure A2b), Republican and Democrat respondents believe others use the title, at least a little, at almost equal levels. Republicans reported more use at the ‘a lot’ and ‘a little’ levels; however, over 50% of both groups indicated that others use the title a lot or a great deal and over 85% indicated use at least a moderate amount. Independents/other party affiliated respondents reported the lowest level of belief that others use the title; however, this is only slightly lower than the level reported by Republicans. Independents/other affiliation respondents reported a great deal of use at a level between Democrats and Republicans; however, they have the lowest level of respondents indicating a lot of usage and the highest level of respondents indicating moderate and little amounts of usage and no usage.
Perceived use by others tends to increase with respondents’ increased internet usage time (see Figure A2c); however, there is a slight drop between the three to five hours and more than five hours usage levels. Those reporting 1 h or less of internet usage indicated the lowest level of perceived title usage by others, with under 50% of these respondents reporting either ‘a lot’ or ‘a great deal’ of usage by others and just over 80% reporting at least a moderate amount of use. The highest use of the title by others was reported by the between 1 to 3 h and between 3 to 5 h of usage groups, with over 95% of both groups reporting at least a little usage and approximately 90% of both groups reporting at least a moderate amount of usage.
Figure A3 presents data regarding respondents’ perception of the title’s ideal impact on decision making when considering the accuracy of an article. This data is presented in terms of income level, party affiliation and online usage level.
In terms of income level (see Figure A3a), there is no clear trend in the perceived ideal level of usage for the title. Usage at the combined ‘a lot’ and ‘a great deal’ levels increase with income, up to the $75,000 to $99,999 income level, before declining. Usage of the title, at a moderate level or greater level, peaks at the $50,000 to $74,999 income level, as does usage a the ‘a little’ or greater level.
With respect to party affiliation (shown in Figure A3b), Republican and independents/other party affiliated respondents indicated an almost equal ideal level of usage, with approximately 75% of both groups responding that ideally the title ought to be used at least a moderate amount. Democrats, however, indicated higher ideal usage level of approximately 85%.
The perceived level of ideal usage of the title increases, at the combined great deal, a lot and moderate level with increased internet usage time (see Figure A3c), except at the highest level of internet usage, which reports moderate and greater usage levels similar to the 1 to 3 h group.

4.1.2. Publisher

This subsection considers the respondents’ perceptions regarding the usefulness of the publisher in judging the trustworthiness of an article. Figure A4a shows increasing support (at the combined great deal/a lot/moderate amount level) up to the $75,000–99,999 income range, after which there is a temporary drop in perceived utility. The $125,000 or more range returns to a similar level of use as the $75,000 to $99,999 income level.
The most notable data relates to respondents’ party affiliation. Overall, Democrats and Republicans view the publisher as being more important (at the combined great deal/a lot/a moderate amount level) then independents/other party members. Democrats also have greater combined great deal/a lot support than Republicans. Notably, while each political group views the publisher as being similarly important to others as themselves, this pattern does not hold with the ideal data, where the importance drops only for Republicans and independents/other party members.
Perceptions of the publisher’s importance across different levels of internet usage show a consistent trend. Except at the highest level of internet usage, importance in terms of self, others, and the ideal increases as internet usage increases.
Figure A4 considers respondents’ perceptions of the publisher’s impact on their personal decision making when considering the validity of an article. In terms of income level (Figure A4a), personal perception of importance increases up to the $75,000–99,999 income level, then drops, returning to a similar level at the $125,000 or more level. With respect to party affiliation (Figure A4b), Democratic Party members have more interest in the publisher, at the great deal/a lot levels, and similar interest to Republicans when the moderate amount level is also considered. Independents/other party members indicate the lowest level of interest, at the combined great deal/a lot/moderate amount levels, but slightly more than Republicans (and still notably less than Democrats) at the great deal/a lot level.
Respondents show an increase in the perceived efficacy of the publisher as their internet usage increases, from 1 to 5 h. Then, a slight decrease in importance is seen at the more than 5 h level (in Figure A4c).
Figure A5 considers respondents’ perceptions of the publisher’s impact on the decision making of others when considering the validity of an article. In terms of income level, use increases (at the combined great deal/a lot level) as income level rises until the $75,000–99,999 range, where it peaks and then flattens out. When the moderate amount responses are also considered, more fluctuation—but a general increase in level of use perception—is seen. When considering respondents’ political party affiliation (Figure A5b), there is once again more perceived support by members of the Democratic party, at the combined great deal/a lot level; however, all three groups have similar support at the combined great deal/a lot/moderate amount level.
Articles’ publishers show usage shows an increase in importance as internet usage increases from 1 to 5 h (for the combined great deal/a lot levels), with a notable reduction in importance at the more than 5 h usage level (Figure A5c). Much less variation, but a similar pattern, is seen when the moderate amount responses are also considered.
Figure A6 considers respondents’ perceptions of the publisher’s ideal impact on decision making when considering the validity of an article. In terms of income level, use increases (at the combined a great deal/a lot level) gradually as income level rises until the $75,000–99,999 range, before flattening out and declining at the $125,000 or more level. In terms of party affiliation (Figure A6b), Republicans and independents/other party members indicate a similarly lower level of use, at both the combined great deal/a lot and combined great deal/a lot/moderate amount levels, than Democrats. Democrats are relatively consistent amongst their self-perception, perception of others, and perception of the ideal level of use. Independents/other party members indicate having a similar level of use, at the combined great deal/a lot level and slightly less interest at the combined great deal/a lot level, to others. However, they view the ideal as being at a lower level (most notably, at the combined great deal/a lot level).
Articles’ publishers show an increase in importance to respond as internet usage increases from 1 to 5 h. The publisher then declines notably in importance, for the combined great deal/a lot level (while dropping less notably at the combined great deal/a lot/moderate amount level) at the more than 5 h usage level (Figure A6c).

4.1.3. Publication Data

This section considers the differences in respondents’ perceptions regarding the usefulness of the publication date in judging the trustworthiness of an article. While there is limited change in the level of reliance placed on articles’ publication dates by income level, the level of use tends to decrease as income level increases, up until the highest income level, at the combined great deal/a lot/moderate amount level. In terms of political affiliation, Democrats report the highest level of reliance on the article publication date, followed by Republicans, and then independents/other party members.
Each party reports a lower level of perceived reliance on articles’ publication date by others than by themselves, at the combined great deal/a lot levels (though results are more similar with the moderate amount responses are also included). Democrats indicate ideally having more reliance on publication date, while Republicans and independent/other party members’ perceptions of self-use and ideal use are much closer to each other.
In terms of internet usage, the lowest level of internet usage shows the lowest level of perceived utility of articles’ publication date for evaluating article credibility, at both the combined great deal/a lot and combined great deal/a lot/moderate amount levels. At the great deal/a lot/moderate amount level, perceived utility increases with increased internet usage. This trend is not present for the combined great deal/a lot level; however, it is also present when looking only at the great deal responses.
Figure A7 presents respondents’ perceptions of the publication date’s impact on their personal decision making when considering the validity of an article. While fluctuation is seen across income levels, at the combined great deal/a lot level in Figure A7a, the level of perceived utility appears to consistently decrease with increasing income across all income levels, except the $125,000 or more level (where it increases, as compared to the $100,000 to $124,999 income level, but is still below the $75,000 to $99,999 income level).
The political party affiliation data shows (in Figure A7b) the strongest perceived utility of the publication date coming from Democrats, followed by Republicans and then independents/other party members. All three groups show at least 60% of respondents seeing utility to using the publication date (at the combined great deal/a lot/moderate amount level). Limited variation is seen in perceived publication date utility due to internet usage levels (Figure A7c), at the combined great deal/a lot level, with the lowest usage being indicated at the 1 h or less internet usage level. There is notably more usage at the other three levels, which indicate similar perceived efficacy at the combined great deal/a lot level and show a moderate increase in publication date use with increased internet usage at the combined great deal/a lot/moderate amount level.
Figure A8 presents respondents’ perceptions of the publication date’s impact on the decision making of others when considering the validity of an article. Figure A8a shows variation between income levels at both the combined great deal/a lot and combined great deal/a lot/moderate amount levels. A general downward trend in usage with increasing income is shown at both levels. The highest income level, however, showed increased usage and some deviation from the trend present at the intervening levels. In terms of political affiliations, Democrats show the highest level of use, followed by Republicans and the independents/other party members, at both the combined great deal/a lot and combined great deal/a lot/moderate amount levels. The internet usage data shows an increase in publication date usage as internet usage increases from 1 to 5 h (at both the combined great deal/a lot and combined great deal/a lot/moderate amount levels); however, a decline in usage is indicated at the more than 5 h usage level in Figure A8c.
Figure A9 shows respondents’ perception of the publication date’s ideal impact on decision making regarding the validity of an article. The perceived ideal level of reliance, shown in Figure A9a, generally decreases with increasing income level, at the combined great deal/a lot level. A less clear version of this trend is present when the moderate amount responses are also considered. In both cases, the lowest and highest income levels are exceptions to this trend.
The political party affiliation data for ideal usage (shown in Figure A9b) is similar to self-perception, with Democrats showing the most ideal use of the article date (at both the great deal/a lot and great deal/a lot/moderate amount levels), followed by Republicans and then independents/other party members. Respondents from all three political party affiliations indicated support for the use of the publication date, at the combined great deal/a lot /moderate amount level of at least 65%.
The internet usage data is shown in Figure A9c. It shows increasing ideal importance placed on the article date, as internet usage increases from 1 to 5 h; however, a slight decline is present at the more than 5 h level.

4.1.4. Author

This section considers the impact of income level, political affiliation and online usage level on respondents’ perceptions regarding the usefulness of an article’s author for judging the trustworthiness of an article. While there is no clear pattern, in the income level or internet usage level data, the political party affiliation data shows the highest level of perceived utility amongst Democrats, followed by Republicans and independents/other party members. This pattern is also present in the perception of others’ data (at both the combined great deal/a lot and combined great deal/a lot/moderate amount levels). A similar relationship between Republicans and Democrats is also present in the perception of ideal data; however, the independents/other party members do not show the same lower level of perceived utility (with the independents/other party members tying with the Republicans). This is the case at both the combined great deal/a lot and combined great deal/a lot/moderate amount levels.
Figure A10 presents respondents’ perception of articles’ authors’ impact on their personal decision making regarding article validity. There is no clear pattern to the data related to income level (Figure A10a) or internet usage level (Figure A10c). In terms of political party (Figure 1), Democrats have the highest usage level, followed by Republicans and then independents/other party members. All three groups have at least 80% of respondents indicating usage at the moderate amount level or higher.
Figure A11 considers respondents’ perception of an article author’s impact on the decision making of others when considering the validity of an article. While there is, again, no clear pattern in terms of income level (Figure A11a), there is a gradual increase in reliance on the author, at the great deal level, as internet usage level increases (Figure A11c); however, this trend is not present in the a lot or moderate amount data. The political party affiliation data, again, shows the highest use by Democrats followed (only slightly) by Republicans and then independents/other party members (Figure 2). This trend is present at both the combined great deal/a lot and combined great deal/a lot/moderate amount levels.
Figure A12 presents data regarding respondents’ perception of an article author’s ideal impact on decision making when considering the validity of an article. There is, again, no clear pattern in terms of income level, with conflicting trends seen when considering the great deal, a lot and moderate amount responses (Figure A12a) or internet usage level (Figure A12c). The political party affiliation data, shown in Figure 3, shows the highest reliance among Democrats, followed by Republicans and independents/other party members, who have similar levels of reliance at both the combined great deal/a lot and combined great deal/a lot/moderate amount levels.

4.1.5. Sponsor

This section considers the impact of income level, political affiliation and online usage time on respondents’ perceptions regarding the usefulness of an article’s sponsor in judging the trustworthiness of an article. In this data, a relatively consistent pattern is shown between the political party affiliations across the self, others and ideal data. In each, Democrats have the highest level of perceived utility of the sponsor data. This is followed by Republicans and independents/other party members.
Figure A13 considers respondents’ perceptions of article sponsors’ impact on their personal decisions regarding article validity. In terms of income level (Figure A13a), there are conflicting trends. At the combined great deal/a lot/moderate level, the levels above $25,000 in income are very similar; however, when considering only the great deal and a lot data, there is a notable jump in the perceived utility of the sponsor between the first two income levels, and then a general decline with higher income. Political party affiliation, shown in Figure 4, shows a similar trend to some previous factors: Democrats show the most reliance on the sponsor, with Republicans and independents/other party members indicating a lower level of perceived utility. Republicans show more perceived utility, when considering the moderate amount data and nearly the same level when only the great deal and a lot data is considered. Increased perceived utility of articles’ sponsors is seen with increased internet usage levels in Figure A13c. Notably, the a lot level shrinks considerably between the 3 and 5 and more than 5 levels, with the adjacent great deal and moderate levels increasing notably.
Figure A14 presents respondents’ perceptions of article sponsors’ impact on others’ decision making regarding article validity. The income level data, shown in Figure A14a, shows limited variation and conflicting trends between the great deal, a lot and moderate amount response levels. At least 70% of all political party affiliations’ respondents indicating at least a moderate amount of perceived efficacy of the sponsor details; however, Democrats exhibit the most interest in using the metric, with Republicans and independents/other party members varying between second and third most interested between the combined great deal, a lot and moderate amount combination levels, as shown in Figure 5. An increase in perceived utility by others is present, as internet usage levels increase, as shown in Figure A14c. This trend is most pronounced at the great deal level. When the ‘a lot’ data is also included, the more than 5 h level is no longer included in this trend. When the moderate amount data is also considered, there is a notable drop at the 3 to 5 h usage level (with a subsequent increase at the more than 5 h level).
Figure A15 shows respondents’ perceptions of article sponsors’ ideal impact on decision making regarding the validity of an article. There is no readily noticeable correlation between the ideal level of reliance on sponsor details and respondents’ income level (as shown in Figure A15a). In terms of political affiliations, Democrats indicated the most perceived benefit of this metric, again followed by Republicans and then independents/other party members (at the great deal, combined great deal/a lot and combined great deal/a lot/moderate amount levels), as demonstrated in Figure 6. A gradual increase in perceived utility is shown as internet usage level increases. Figure A15c shows this being present across all four usage levels, at the great deal level, and across the lower three levels when the ‘a lot’ and moderate amount responses are also considered.

4.1.6. Author’s Political Alignment

This section considers the impact of income level, political party affiliation and internet usage level on perceptions regarding the usefulness of articles’ authors’ political alignment in judging their trustworthiness. Higher income levels are associated with increased perceived utility of authors’ political alignment for judging articles, for respondents and their perceptions of others, at the combined great deal/a lot level. However, no clear pattern is present with regard to the perceived ideal level of impact of the author’s political alignment on judging article credibility. Similar levels of perceived utility and fluctuations are present across income levels. This means that while higher income level respondents perceive themselves and others to use the author’s political alignment metric, there is similar agreement (at least 75% of all groups indicate a moderate amount) as to what is ideal
The data related to political party affiliation shows minimal variation between parties for self-perception and perception of others’ usage. However, for respondents’ ideal perception, more pronounced differences between political affiliations are present (particularly at the great deal level).
Figure A16 considers respondents’ perceptions of the impact of an article’s author’s political alignment on their personal decision making, when considering the validity of an article. In terms of income level (Figure A16a), there is a gradual increase in the level of importance placed on authors’ political alignments, as income level increases at the great deal and combined great deal/a lot levels. There is a noticeable drop at the $100,000 to $124,999 level, which is recovered from at the $125,000 or more level.
The political party affiliation data (Figure A16b) shows that party affiliation has little impact on respondents’ self-usage of authors’ affiliation, with independents/other party members showing slightly less self-usage at the combined great deal/a lot and combined great deal/a lot/moderate amount levels (though not at the great deal level by itself, where independents/other party members show slightly more usage than Republicans and a similar level to Democrats). Internet usage level (see Figure A16c) shows similarly little impact on self-usage.
Figure A17 depicts respondents’ perception of the impact of an article author’s political alignment on respondents’ perception of others’ decision making, when evaluating the validity of an article. Income level (Figure A17a) again shows a positive association with increased perception of others use of the metric. With some variation, this positive trend is visible at the great deal, combined great deal/a lot and combined great deal/a lot/moderate amount levels. The political affiliation data, shown in Figure A17b, does not evidence any notable trends. In terms of internet usage, a positive trend is visible, at both the great deal and combined great deal/a lot levels (and, less notably, when also including the moderate amount data) at the three lowest levels of usage (up to 5 h), as shown in Figure A17c.
Figure A18 presents data regarding respondents’ perception of the ideal impact of articles’ authors’ political alignment on article credibility decision making. Conflicting trends are present in the income level data shown in Figure A18a. At the great deal and combined great deal and a lot levels, the perceived ideal utility of author affiliation data initially rises with increased income, peaking at the $50,000 to $74,999 income level. However, this is one of the lowest levels of perceived utility at the combined great deal/a lot/moderate amount level. In terms of political party affiliation (as shown in Figure A18b), all three parties are close together, all having nearly 80% of respondents indicating at least a moderate level of ideal use of the metric. Democrats show the most support for this metric, followed by Republicans and then by independents/other party members. Results, in terms of internet usage levels, show no overt pattern (Figure A18c).

4.1.7. Publisher Political Alignment

This section considers the impact of income level, political party affiliation and online usage level on Americans’ perceptions regarding the usefulness of articles’ publishers’ political alignment for judging the trustworthiness of an article. Interestingly, there only limited variation by political party, income level, and internet usage level is shown for this metric.
Figure A19 shows respondents’ perceptions of the impact of an article’s publisher’s political alignment on their personal decision making when considering article validity. There is a notable increase in the perceived importance of the metric between the lowest income level and the $25,000–49,999 income level; however, after this level, the rate of increase in metric credence between successively higher levels of income declines and some variation is seen, as shown in Figure A19a. The peak levels of perceived efficacy occur at the $75,000 to $99,999 and $125,000 or more levels (at both the combined great deal/a lot and combined great deal/a lot/moderate amount levels).
The political party data shows limited levels of difference, with the highest level of perceived efficacy indicated by the Democrats, followed by the Republicans and the independents/other party members (at the great deal, combined great deal/a lot, and combined great deal/a lot/moderate amount levels), as shown in Figure A19b.
A slight increase in perceived efficacy of the publisher’s political alignment is seen (in Figure A19c) with growing levels of internet usage, at the great deal, combined great deal/a lot, and combined great deal/a lot/moderate amount levels. Notably, respondents in the more than 5 h usage level group indicate lower perceived efficacy of this metric (at each level) than the 1 h or less group, breaking from this trend.
Figure A20 presents respondents’ perceptions of the impact of an article’s publisher’s political alignment on others’ decision making, when considering article credibility. Overall, the perception that others will consider the publisher’s political alignment increases with increased income level, at the great deal and combined great deal/a lot levels (though the three highest income levels have similar perceived utility at the great deal level and fluctuation is present at the a lot level), as shown in Figure A20a.
No notable difference is present between the parties at the great deal and combined great deal/a lot levels. When also considering the moderate amount responses, Republicans show slightly less perceived efficacy than Democrats and independents/other party members, as shown in Figure A20b. In terms of internet usage, a similar trend to self-perception is shown where gradual growth is shown with increasing internet usage levels, in Figure A20c, with the highest level of usage breaking from this trend.
Figure A21 shows respondents’ perceptions of the ideal impact of an article’s publisher’s political alignment on article trustworthiness decision making. In the income level data, shown in Figure A21a, there is a notable increase between the lowest income level and the $25,000–49,999 income level, at the great deal and (less pronouncedly) combined great deal/a lot levels. The next three income levels are relatively consistent, before the perceived ideal efficacy declines slightly at the two highest income levels. This trend is also present, with more variation, at the combined great deal/a lot level; however, when the moderate amount data is also considered, no clear trend is present. In terms of the political alignment data, as shown in Figure A21b, Democrats indicate the highest level of ideal perceived efficacy, at the great deal, combined great deal/a lot, and combined great deal/a lot/moderate amount levels. Republicans have the second highest level of perceived utility at the great deal and combined great deal/a lot levels, with the difference at the great deal level being minimal. Independents/other party members are the second highest, in terms of perceived efficacy, when the moderate amount data is also considered. In terms of internet usage levels, an increase is seen (with limited variation) at the great deal level with increasing internet usage; however, this trend is not present at other levels, as shown in Figure A21c.

4.1.8. Sponsor Political Alignment

This section considers Americans’ perceptions regarding the usefulness of articles’ sponsors’ political alignment for judging their trustworthiness. There is a notable increase in perceived efficacy between the lowest income level and the $25,000–49,000 income level for all three perspectives (self, others and ideal). The self and others’ perspectives do not have clear trends, in terms of income level. The perceived efficacy starts by increasing to a limited peak, followed by limited decreases, within increasing income, in the ideal data.
All three political party affiliations indicate a similar perceived efficacy of the metric at the great deal, combined great deal/a lot, and combined great deal/a lot/moderate amount levels, for self-usage; however, this pattern does not hold for the perception of others’ and ideal usage.
Figure A22 presents respondents’ perceptions of the impact of an article’s sponsor’s political alignment on their personal decision making when assessing article credibility. In terms of income level (shown in Figure A22a), there is a notable increase from the lowest income level to the $25,000–49,999 income level, followed by a relatively consistent level of perceived efficacy, at the great deal and combined great deal/a lot levels. Notably, there is a large drop in the moderate amount level at the $100,000 to $124,999 income level; however, the $125,000 returns to a similar perceived efficacy level as the $75,000 to $99,999 income level.
The political party affiliation data shows a very slightly higher level of perceived efficacy among Democrats, in Figure A22b, at the great deal, combined great deal/a lot, and combined great deal/a lot/moderate amount levels. There is not a clear pattern to the internet usage level related data, which peaks with the between 1 and 3 h group, as shown in Figure A22c.
Figure A23 depicts respondents’ perceptions of the impact of articles’ sponsors’ political alignment on others’ decision making regarding the validity of an article. Again, there is an increase in perceived efficacy from the lowest income level to the $25,000–49,999 income level (as shown in Figure A23a). A fluctuating trend of increasing with increased income is shown at the combined great deal/a lot level, while the great deal data, by itself, shows a slight decline with increased income at some points. The moderate amount data shows an increasing trend, with fluctuations, at the lowest four income levels; however, there is a drop at the $100,000 to $124,999 that is not fully recovered from at the $125,000 or more income level.
In terms of political affiliations, Democrats showed the greatest perceived efficacy of the metric at the great deal, combined great deal/a lot, and combined great deal/a lot/moderate amount levels. Independents/other party members indicated higher perceived efficacy than Republicans at all of these levels (though only slightly at the great deal and combined great deal/a lot/moderate amount levels), as shown in Figure A23b. An increase in perceived efficacy of the sponsor’s political alignment with increasing internet usage is shown at the three lowest levels of internet usage (across the great deal, combined great deal/a lot, and combined great deal/a lot/moderate amount levels, excepting that there is a drop at the combined great deal/a lot level only, between the second and third internet usage levels); however, the highest internet usage level breaks from this trend, as shown in Figure A23c.
Figure A24 shows respondents’ perception of the ideal efficacy of articles’ sponsors’ political alignment on article trustworthiness decision making. A similar increase in perceived efficacy is again present between the lowest and the $25,000–49,999 income levels; however, the data is relatively consistent, at the combined great deal/a lot and combined great deal/a lot/moderate amount levels. It fluctuates at the great deal level, as shown in Figure A24a.
In Figure A24b, Democrats report the highest level of perceived ideal usage, followed by Republicans and then independents/other party members, at the great deal and combined great deal/a lot levels. Independents/other party members report slightly higher perceived efficacy than Republicans, when the moderate amount data is also considered, as shown in Figure A24b. In terms of internet usage levels, there is a general increase in perceived efficacy as internet usage level increases, as shown in Figure A24c; however, the more than 5 h usage level breaks from this trend, at the combined great deal/a lot and combined great deal/a lot/moderate amount levels. The second and third levels of internet usage also have nearly the same level of combined great deal/a lot perceived efficacy.

4.2. Article Characteristics

This section considers the responses of study participants, with respect to the impact of articles’ quantity of opinion statements, internet virality of the article or topic, controversy level of the topic, and the reading level of the article, on the trustworthiness of the article. Each of these is discussed, respectively, in Section 4.2.1 through Section 4.2.4. Analysis amongst and between these metrics is presented in Section 5.

4.2.1. Opinion Quantity

This section considers the perceptions of Americans regarding the usefulness of knowing the quantity of opinion statements in an article for judging its trustworthiness. In this data, the most interesting results are found amongst the political parties. Republicans and independents/other party members indicate using this metric too much (based on having a perception that is higher than ideal), when considering the combined great deal/a lot levels. Democrats, on the other hand, indicate using the metric too little (ideal perception greater than self-perception).
Figure A25 presents respondents’ perception of the impact of articles’ quantity of opinion statements on respondents’ personal decision making regarding article validity. In terms of income level (Figure A25a) there is no notable pattern as income level increases. Amongst the political parties, Democrats indicate the highest level of metric efficacy, followed by Republicans and then independents/other party members. Notably, over 65% of respondents in each group indicate the efficacy of the metric at the moderate amount level or greater, as shown in Figure 7. An increase with increased online time is shown at the combined great deal/a lot and combined great deal/a lot/moderate amount levels, for the lowest three levels of internet usage. This trend is also present in just the great deal level data at the first two levels, as shown in Figure A25c.
Figure A26 presents respondents’ perceptions of the impact of articles’ quantity of opinion statements on others’ article trustworthiness decision making. No clear pattern is present with respect to a correlation between perceived efficacy and income level, in the data shown in Figure A26a, or internet usage level, in the data shown in Figure A26c. Democrats show the greatest perceived efficacy of the metric, at the great deal, combined great deal/a lot and combined great deal/a lot/moderate amount levels. Republicans and independents/other party members show a similar level of efficacy when considering the a lot and great deal data; however, independents/other party members indicate higher efficacy at the great deal level, as shown in Figure A26b.
Figure A27 depicts respondents’ perception of the ideal impact of an article’s quantity of opinion statements when making trustworthiness decisions. There is no clear pattern in terms of income level shown in Figure A27a; however, an increase in perceived ideal efficacy of the metric is shown as internet usage level increases, in Figure A27c, at the three lowest usage levels at the combined great deal/a lot and great deal/a lot/moderate amount levels. Increasing efficacy perception with increased internet usage is shown at all four usage levels at the great deal level.
Interestingly, the three political party groups show different perceptions of ideal efficacy perception of the metric. Democrats indicate the highest perception of efficacy, which is particularly pronounced at the combined great deal/a lot level, but also present at the great deal and combined great deal/a lot/moderate amount levels. Republicans show the next highest level of efficacy perception, followed by independents/other party members, at the great deal, combined great deal/a lot, and combined great deal/a lot/moderate amount levels.

4.2.2. Virality

This section considers respondents’ perceptions regarding the usefulness of knowing an article’s level of virality when judging its trustworthiness. No notable trends are present in the income level data for self or others perception; however, one is visible in the ideal data. Again, Democrats (followed by Republicans and then independents/other party members) indicate the highest efficacy of the metric. As internet usage levels increase, the perceived efficacy of the metric increases for self-usage, the perceived usage of others, and the perception of ideal usage; meaning that virality generally is seen as more important as internet usage levels increase.
Figure A28 shows respondents’ perceptions of the impact of an article’s virality on their personal decision making when considering the validity of an article. Amongst income groups (as shown in Figure A28a), there is no clear pattern with regard to increased or decreased efficacy as income increases. With respect to political parties (Figure A28b), there is greater perceived efficacy of the metric amongst Democrats at the combined great deal/a lot and combined great deal/a lot/moderate amount levels (though more Republicans indicated there being a great deal of efficacy of the metric). Independents/other party members indicate the lowest level of perceived metric efficacy, which is notably lower than both the Democrats and Republicans at all levels. Across all groups, over 50% of respondents (only slightly more, in the case of independents/other party members) report at least a moderate amount of perceived metric efficacy.
The data related to the metric and internet usage levels shows a steady increase of the perceived importance of virality, at the great deal, combined great deal/a lot, and combined great deal/a lot/moderate amount levels, at the lowest three internet usage levels. The highest internet usage level (more than 5 h), breaks this trend, as shown in Figure A28c.
Figure A29 presents respondents’ perceptions of the importance of an article’s virality on others’ trustworthiness decision making. There is no consistent trend, with regard to others’ perception of metric efficacy, and income level, as shown in Figure A29a. Some variation is present, but overall the data is relatively consistent between levels, except for at the $100,000–124,999 income level which is an anomaly, as compared to the data surrounding it.
The political party affiliation perception data shows that Democrats think that others find the metric more important, as compared to Republicans and independents/other party members, as shown in Figure 8. Republicans indicated more importance of the metric at the great deal and combined great deal/a lot/moderate amount levels, as compared to independents/other party members. The two groups are tied at the combined great deal/a lot level.
In terms of internet usage levels, there is a notable increase in the perceived efficacy of the metric by others as internet usage level increase, up until the highest internet usage level, where there is a notable decrease, as shown in Figure A29c. Notably, this trend is present at the great deal, combined great deal/a lot, and combined great deal/a lot/moderate amount levels.
Figure A30 shows respondents’ perceptions of the ideal impact of an article’s virality on article trustworthiness decision making. As income levels increase, as shown in Figure A30a, there is a consistent decline in the level of ideal perceived efficacy of the virality metric. This trend is present at the combined great deal/a lot/moderate amount level in all but the highest of the income levels. It is also present in the combined great deal/a lot level, at the lowest four income levels. Notably, this trend is not present in only the great deal data.
Amongst political parties, as shown in Figure A30b, Democrats have the highest level of perceived metric utility, followed by Republicans and independents/other party members, at the combined great deal/a lot and great deal/a lot/moderate amount levels; however, Republicans and Democrats are approximately tied at the great deal level.
In terms of internet usage level, respondents’ perceptions of the ideal utility of the virality metric increase as internet usage levels increase. This trend is present at the great deal, combined great deal/a lot and combined great deal/a lot/moderate amount levels for the lowest three levels of internet usage. The highest level (more than 5 h) shows slightly more perceived utility than the next highest level, at the combined great deal/a lot/moderate amount level; however, it shows less perceived utility at the combined great deal/a lot level and approximately the same level of utility at the great deal level.

4.2.3. Controversy

This section considers Americans’ perceptions regarding the usefulness of knowing the controversy level of an article when judging its trustworthiness. There are no notable patterns in the income level data, though fluctuation is present. The internet usage level data shows several trends of increasing metric importance as internet usage levels increase.
Among political parties there are some notable differences. Democratic party members generally view the metric the most favorably, though the difference is much less pronounced with regard to their view of others’ perceptions of the metric’s efficacy. Republicans and independents/other party members exhibit less perceived efficacy for self-perception and ideal perception; however, others’ perception data is very similar amongst respondents from all three parties.
Figure A31 displays data regarding respondents’ perceptions of articles’ controversy level on individuals’ personal decision-making regarding article trustworthiness. These results are relatively uninteresting, with respect to income level, as shown in Figure A31a. No notable trends are present in the data. Democrats show the highest level of self-usage, with nearly 80% reporting that they use this metric a great deal, a lot, or a moderate amount. Republicans show a higher usage level than independents/other party members and are very close to Democrats at the combined great deal/a lot/moderate amount level (though there is more of a difference at only the great deal and a lot levels), as shown in Figure 9. Slight trends are shown in the internet usage level data, with the combined great deal/a lot/moderate amount level data showing the most pronounced differences. An increase in perceived efficacy, with increasing internet usage, is present at the three lowest usage levels, in Figure A31c. A decline in the perceived importance of the controversy level is shown at the highest level of internet usage.
Figure A32 considers respondents’ perceptions of the impact of an article’s controversy level on others’ decision making when evaluating articles. There is a notable increase in the perceived use by others, at the great deal level and the highest income level, shown in Figure A32a; however, otherwise perceived usage by others remains relatively consistent across income levels with no clear trends present.
The perceived usage by shows a slight difference between political parties, in Figure 10. Democrats indicate the highest perceived efficacy level followed by Republicans and independents/other party members. This trend is present at the great deal, combined great deal/a lot, and combined great deal/a lot/moderate amount levels.
The perceived usage of the metric by others shows a slight increase as internet usage level increases, in Figure A32c; however, it is only present in the lowest three levels at the combined great deal/a lot/moderate amount level. It is present in all four internet usage levels, at the great deal and the combined great deal/a lot levels; however, more variation is present.
Finally, Figure A33 shows respondents’ perceptions of the ideal impact of articles’ controversy level on article trustworthiness decision making. There is no notable pattern in ideal usage levels relative to income levels shown in Figure A33a.
Figure 11 shows that Democrats, again, view the metric to be most ideally valuable, followed by Republicans, and then independents/other party members. This trend is present at the great deal, combined great deal/a lot, and combined great deal/a lot/moderate amount levels.
A limited increase in metric importance is seen as internet usage levels increase in Figure A33c. This trend is present across all four usage levels at the combined great deal/a lot/moderate amount level and across only the three lower levels at the great deal and combined great deal/a lot levels.

4.2.4. Reading Level

This section considers the final metric, reading level, and its utility for judging article trustworthiness. No notable large-scale patterns are present in the income level data. The internet usage level data does not show a clear pattern in either the self- or others-perception data; however, an increase with increased usage trend is present in the ideal data. The most notable results are, thus, found in the political party related data.
Democratic party members generally report the highest level of usage—by themselves, others, and ideally—while independents/other party members report the lowest.
Figure A34 considers respondents’ perceptions of the impact of an article’s reading level on their personal decision making when considering articles’ credibility. Results are relatively consistent amongst income groups, as shown in Figure A34a; however, variation and conflicting minor trends are present in the data.
Amongst political parties, as shown in Figure A34b, Democrats report the highest level of self-usage, with nearly 80% reporting a moderate level or more of usage. Republicans follow behind the Democrats, with approximately 75% of respondents indicating at least a moderate amount of usage. Finally, independents/other party members report the lowest usage level of usage of approximately 65%. Similar trends are also present at the great deal and combined great deal/a lot levels. There is no clear pattern to the results, in terms of internet usage levels shown in Figure A34c, though variation is present.
Figure A35 considers respondents’ perceptions of the impact of an article’s reading level on others’ trustworthiness decision making. Results are relatively consistent and no notable trends are present across income levels (Figure A35a), though a negative correlation is shown at the lowest four income levels for the great deal level only (and not other levels). There are, similarly, no notable trends related to internet usage levels shown in Figure A35c.
Amongst political parties, all groups report high levels of metric usage, with at least 65% of respondents indicating at least a moderate amount of metric utility. Democrats have marginally higher perceived efficacy when moderate and above impact levels are considered. Both the Democrats and Republicans have similar levels of response at the great deal and combined great deal/a lot levels. Both are higher than the independents/other party members at the great deal, combined great deal/a lot and combined great deal/a lot/moderate amount levels, as shown in Figure A35b.
Figure A36 shows data regarding respondents’ perceptions of the ideal impact of an article’s reading level on article trustworthiness decision making. There is a downward trend shown with increasing income level in the ideal perception data, shown in Figure A36a, at the middle four income levels. This trend is also present at the combined great deal/a lot and combined great deal/a lot/moderate amount levels. It is also present at the great deal level, with a deviation at the $75,000 to $99,999 income level.
Ideal usage tends to increase as internet usage level increases, as shown in Figure A36c, at both the great deal and combined great deal/a lot levels. In both cases, a deviation exists. The lowest usage level has slightly higher perceived efficacy then the second lowest, at the great deal level. At the combined great deal/a lot level, the more than 5 h level does not show a notable increase over the next lowest level. The combined great deal/a lot/moderate amount data shows a minimal decline at the lowest three usage levels.
With respect to political parties, as shown in Figure A36b, Democrats and, then, Republicans report more usage than independents/other party members, at the great deal, combined great deal/a lot, and combined great deal/a lot/moderate amount levels.

5. Analysis

With only one exception, every demographic group reports majority perceived efficacy for at least a moderate amount of ideal use of every metric. The sole exception is the $100,000–124,999 income group, where virality has approximately 47% ideal perceived efficacy of at least ‘a moderate amount’ (Figure A30a). Furthermore, each demographic reports a majority of respondents using each metric at least ‘a moderate amount’ and the majority belief that others also use each metric at least ‘a moderate amount.’ This demonstrates a broad consensus, across political affiliations, income levels, and levels of internet use, that every metric serves as a useful tool in combating misinformation.
This section describes correlations amongst different metrics. It presents these findings in Table 7 and Table 8. Table 7 presents notable patterns in usage levels, as income and Internet usage levels increase. Table 8 utilizes the belief paradigms, presented in Table 1, to summarize the beliefs of each political party group for each metric. Because each political demographic considers each metric to be moderately useful, Table 8 considers a stricter requirement of preferring ‘a lot’ of usage for the metric in order to gauge respondents’ deeper level of enthusiasm for the metrics.
The results for internet usage are uniform, as shown in Table 7. For each metric, to some degree, the usage of the metric tends to increase as the Internet usage level increases. This shows that heavier internet users are more likely to use the various metrics. This is, perhaps, due to their heavy usage exposing them to misinformation more frequently and, thus, causing them to develop more skepticism leading to a more defensive style of internet browsing. This increase is present in their self-perception and, also, in their perception of the usage of others and in their perception of the ideal. This indicates that the higher internet usage level respondents believe that everyone is and should be more cautious about media consumption. In fact, at times the increase in usefulness is most pronounced when respondents report their perceptions of the use by others, as seen in the cases of articles’ authors’ political alignment (Figure A17c), articles’ publishers’ political alignment (Figure A20c), articles’ sponsors’ political alignment (Figure A23c), and virality (Figure A29c).
While many metrics show no significant patterns surrounding income levels (in Table 7), the title, publisher and all political alignment metrics show some increase in importance as income level increases. Interestingly, in the case of author’s political alignment and publisher’s political alignment, these results level out to a flat distribution across income levels. This shows that, while higher income level respondents perceive themselves and others to use politics more frequently, they tend to agree that, ideally, these metrics ought to be considered less frequently.
All political demographics reported majority support of each metric at the ‘a moderate amount’ or higher level. At the higher threshold of ‘a lot’ or ‘a great deal’, differences between groups are present.
The belief paradigms ‘no one uses this, and no one should’ and ‘everyone uses this, and we should’ both express a belief that the current usage of a metric is optimal. Republicans and independents/other party members both indicate ’no one uses this, and no one should’ with regard to the publication date, sponsor, and reading level categories ‘a lot.’ Republicans, additionally, believe that the sponsor’s political alignment is not and should not be used ‘a lot,’ while independents/other party members believe this about the publisher’s political alignment. Democrats never express this belief paradigm for any metric, though there are cases where Democrats believe that a metric should not be used ‘a lot’ in the ideal.
In the cases of the publisher, author, and sponsor, Democrats believe that everyone uses each of these metrics, and that this is ideal. Republicans and independents/other party members do not indicate this belief paradigm for any metric. Republicans and independents/other party members both believe that these categories should not be used, with Republicans tending to assert that others rather than themselves are more likely to use them. Republicans also believe that everyone else uses the publisher and author metrics, but should not. Independents/other party members believe that everyone, themselves included, uses the publisher category and should not, and that they themselves use the author category and should not. Republicans and independents/other party members believe the opposite of Democrats on the sponsor category: that no one uses the category, and no one should. This is of particular interest, as it indicates not only a divergent belief regarding what ‘should be’ but also with respect to ‘what is’. That is, Democrats believe that sponsorship information is widely used, Republicans and independents/other party members believe it is rarely used, and all groups feel that their perceived reality is ideal.
For a number of categories there is agreement on the belief paradigm between different political parties. In the case of the author’s political alignment, Democrats and Republicans agree that ‘everyone uses this, but we should not.’ Independents/other party members differ in that they believe that everyone else uses this metric. Democrats and independents/other party members agree that everyone else uses article virality, but should not. For this metric, Republicans differ in that they believe they also use this metric themselves. Finally, all political parties agree that ‘everyone else’ uses the controversy level metric and that they should not do so. It is notable that Democrats, Republicans, and independents/other party members blame everyone else for the problematic usage of the controversy level metric.
Across all metrics considered in the study, Republicans and independents/other party members indicated that none of the categories presented should be used to judge the trustworthiness of a news article ‘a lot’ ideally. Republican responses indicate that, in practice, they utilize the title, author, author’s political alignment, quantity of opinion statements, and virality ‘a lot’ in making judgements about news trustworthiness. Independents/other party members, meanwhile, consider themselves to only use the publisher and the author ‘a lot’ to determine whether a publication is trustworthy. However, as none of these are considered ideal metrics by either group, a question remains as to what metrics would be perceived as being better.
Democrats have expressed a higher level of enthusiasm for most metrics than Republicans or independents/other party members; however, they still express reservations about certain categories. While Democrats believe that most categories should be used ideally, exceptions to this are the author’s political alignment, publisher’s political alignment, article virality, controversy level, and reading level. Democrats express the belief that everyone, themselves included, uses the political alignments of the author and publisher, but that neither should be used. In the cases of article virality and controversy level, Democrats believe that everyone else incorrectly uses these metrics. In the case of reading level, Democrats believe that only they use this metric, when they should not.
Depending upon the paradigm, the respondent may be indicating that they consider themselves to be the problem individual, at odds with everyone else and the ideal. This occurs four times for Democrats with articles’ title, the sponsor’s political alignment, the quantity of opinion statements and the reading level. For Republicans, this occurs once with the title, but for the opposite reason of Democrats. Democrats indicated believing that they use the title too little, while Republicans indicated believing that they use it too much. For independents/other party members, this occurs once for the author category.
Some paradigms indicate that respondents consider that everyone, including me is the problem. This occurs two times for Democrats, with the author and publisher’s political alignment metrics. For Republicans, it occurs four times with the author, author’s political alignment, quantity of opinion statements, and virality metrics. For independents/other party members, this occurs only once with the publisher metric.
Yet, other paradigms indicate that the respondent considers everyone else to be the problem. This occurs three times for Democrats with the publication date, virality, and controversy level metrics. For Republicans, it occurs three times with the publisher, publisher’s political alignment and the controversy level metrics. For independents/other party members, this occurs six times with the title, author’s political alignment, sponsor’s political alignment, quantity of opinion statements, virality and controversy level metrics.
Overall, independents/other party members are the least likely to consider themselves at fault, either as part of the group or as an individual outlier. As such, there may be additional challenges in convincing independents/other party members to use labeling mechanisms, even as they report each metric to be at least of ‘moderate’ importance. Democrats are the most likely to consider themselves to be part of the problem and also support the largest set of labeling metrics. As such, Democrats may be the most likely early adopters of labeling mechanisms. Keeping these unique challenges in mind when designing and promoting labeling mechanisms will be crucial for their eventual adoption by the public. With each political group reporting a majority supporting using each labeling metric at least ‘a moderate amount,’ the prospects for broad adoption seem quite positive.

6. Conclusions and Future Work

This paper has analyzed the impact of Americans’ income level, political affiliation and online usage time on the level of credence that they pay to certain online article characteristics. It has shown that most Americans, in almost every case and across the demographic groups analyzed herein (with one notable exception discussed in Section 5), support the use of the discussed metrics for assessing online content. However, in many cases, different groups utilize a metric, believe others utilize a metric or believe that a metric should be used to a greater or lesser extent than other groups. Understanding which metrics are most effective for different demographic groups can help deliver individuals the most relevant information for their decision-making. It also aids understanding of online content consumption decision making and the factors that contribute to or limit the spread of deceptive online content.
In general, metric usage was stronger among Democrats with Republicans, in many cases, expressing more perceived efficacy in the metric than independents and members of other parties (but still less than Democrats). Many metrics also showed more interest from individuals with higher levels of internet usage. Not all metrics showed a trend related to income level; however, in many cases metric usage was positively associated with increased income levels.
In a number of cases, differences between respondents’ perceptions of their and others’ use of a metric and the ideal level of usage were detected. Cases where a metric would ideally be used more than it is may be opportunities for training or technological innovation to aid in the use of the metric. Cases where a metric is used more than what is perceived as ideal may be opportunities to expose individuals to other metrics that could be useful instead of or in addition to the one that they feel that they are excessively relying on. Metrics where use and ideal use are similar indicate key data that labeling system developers will want to ensure is readily available.
Overall, this paper has shown that the public is interested in improving their awareness of news article accuracy through the use of metrics such as the ones presented. While most Americans have at least some interest in most metrics, the exact manner that this data is presented and consumed remains a topic that must be resolved by future work. Additionally, future work will be needed to see how individuals’ projections of their and others behaviors match up with their actual behaviors when evaluating and consuming online content. The consensus, which has been demonstrated in this paper, of moderate-or-higher support across demographics suggests that content labeling could be a promising tool for combating misinformation, which would enjoy broad public support.

Author Contributions

Conceptualization, J.S. and M.S.; methodology, J.S. and M.S.; resources, J.S.; writing—original draft preparation, J.S. and M.S.; writing—review and editing, J.S. and M.S.; project administration, J.S.; funding acquisition, J.S. All authors have read and agreed to the published version of the manuscript.

Funding

Partial support for this work was provided by the NDSU Challey Institute for Global Innovation and Growth.

Institutional Review Board Statement

The study was conducted according to the guidelines of the Declaration of Helsinki, and approved by the Institutional Review Board of North Dakota State University (protocol IRB0003884, approved 23 September 2021).

Informed Consent Statement

Informed consent was obtained from all subjects involved in the study.

Data Availability Statement

A data release, via a data journal publication, is planned once initial analysis of all data is complete.

Acknowledgments

Thanks are given to Jade Kanemitsu from Qualtrics International Inc. for the management of the data collection process. Thanks are also given to Ryan Suttle, Scott Hogan and Rachel Aumaugher who developed many of the questions that were used in this study during their earlier work (which was presented in [19]). Thanks are given to Bob Fedor who generated an earlier set of figures using this data (which ended up not being used in this paper).

Conflicts of Interest

The authors declare no conflict of interest. The funders had no role in the design of the study; in the collection, analyses, or interpretation of data; in the writing of the manuscript, or in the decision to publish the results.

Appendix A

This appendix presents the data referred to in Section 4. Figure A1, Figure A2, Figure A3, Figure A4, Figure A5, Figure A6, Figure A7, Figure A8, Figure A9, Figure A10, Figure A11, Figure A12, Figure A13, Figure A14, Figure A15, Figure A16, Figure A17, Figure A18, Figure A19, Figure A20, Figure A21, Figure A22, Figure A23, Figure A24, Figure A25, Figure A26, Figure A27, Figure A28, Figure A29, Figure A30, Figure A31, Figure A32, Figure A33, Figure A34, Figure A35 and Figure A36 each have three components. The first, sub-figure a, presents the particular data in terms of income level. Part b of the figure presents the data in terms of political affiliation and, finally, part c presents the data in terms of online usage time.
Figure A1, Figure A2, Figure A3, Figure A4, Figure A5, Figure A6, Figure A7, Figure A8, Figure A9, Figure A10, Figure A11, Figure A12, Figure A13, Figure A14, Figure A15, Figure A16, Figure A17, Figure A18, Figure A19, Figure A20, Figure A21, Figure A22, Figure A23 and Figure A24 present data regarding the areas discussed in Section 4.1. Figure A1, Figure A2 and Figure A3 present data on the impact of the article title. Figure A4, Figure A5 and Figure A6 present data on the article publisher. Figure A7, Figure A8 and Figure A9 present data regarding articles’ publication dates. Figure A10, Figure A11 and Figure A12 present data on the impact of articles’ authors. Figure A13, Figure A14 and Figure A15 present data regarding article sponsors. Figure A16, Figure A17 and Figure A18 present data regarding articles’ authors’ political alignments. Figure A19, Figure A20 and Figure A21 present data on articles’ publishers’ political alignments. Figure A22, Figure A23 and Figure A24 present data on articles’ sponsors’ political alignments.
Each set of three figures includes one related to respondents’ personal self-perceptions of impact, on regarding the perceptions of others regarding the metric’s impact and one that asks what the ideal level of impact should be.
Figure A1. Article title—personal perception impact by: (a) income level (top left), (b) political affiliation (top right) and (c) online usage (bottom).
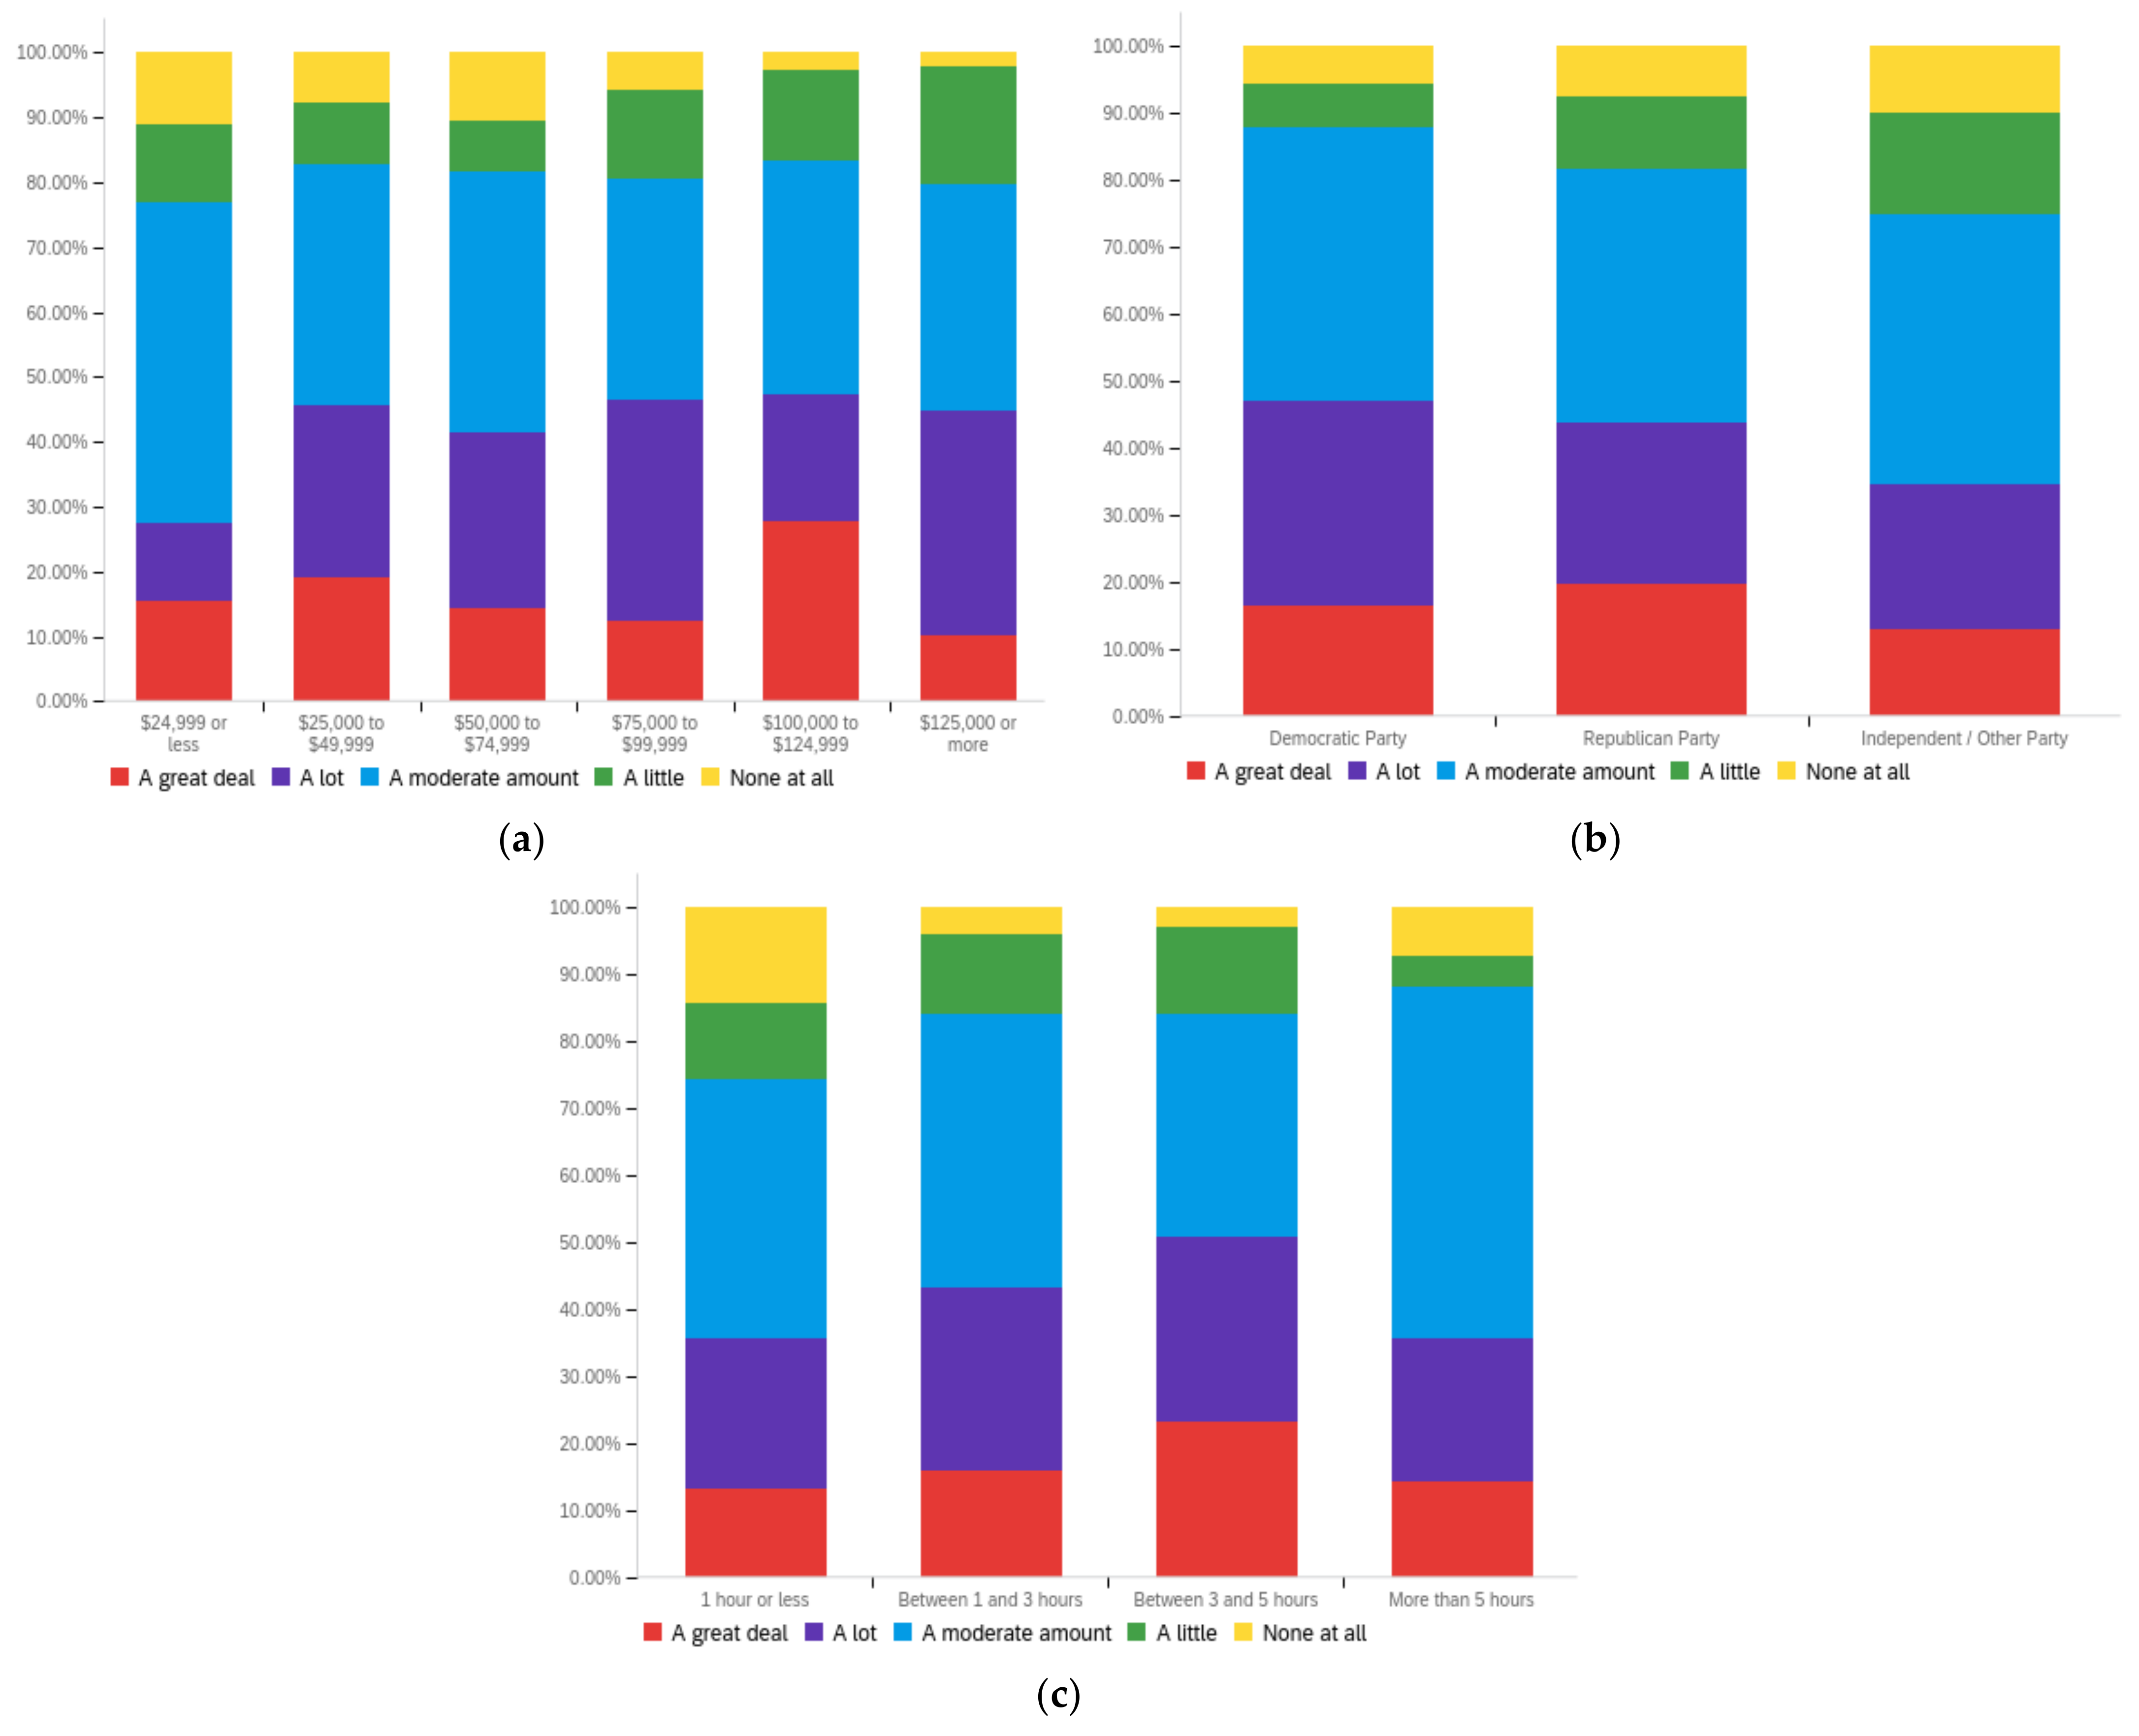
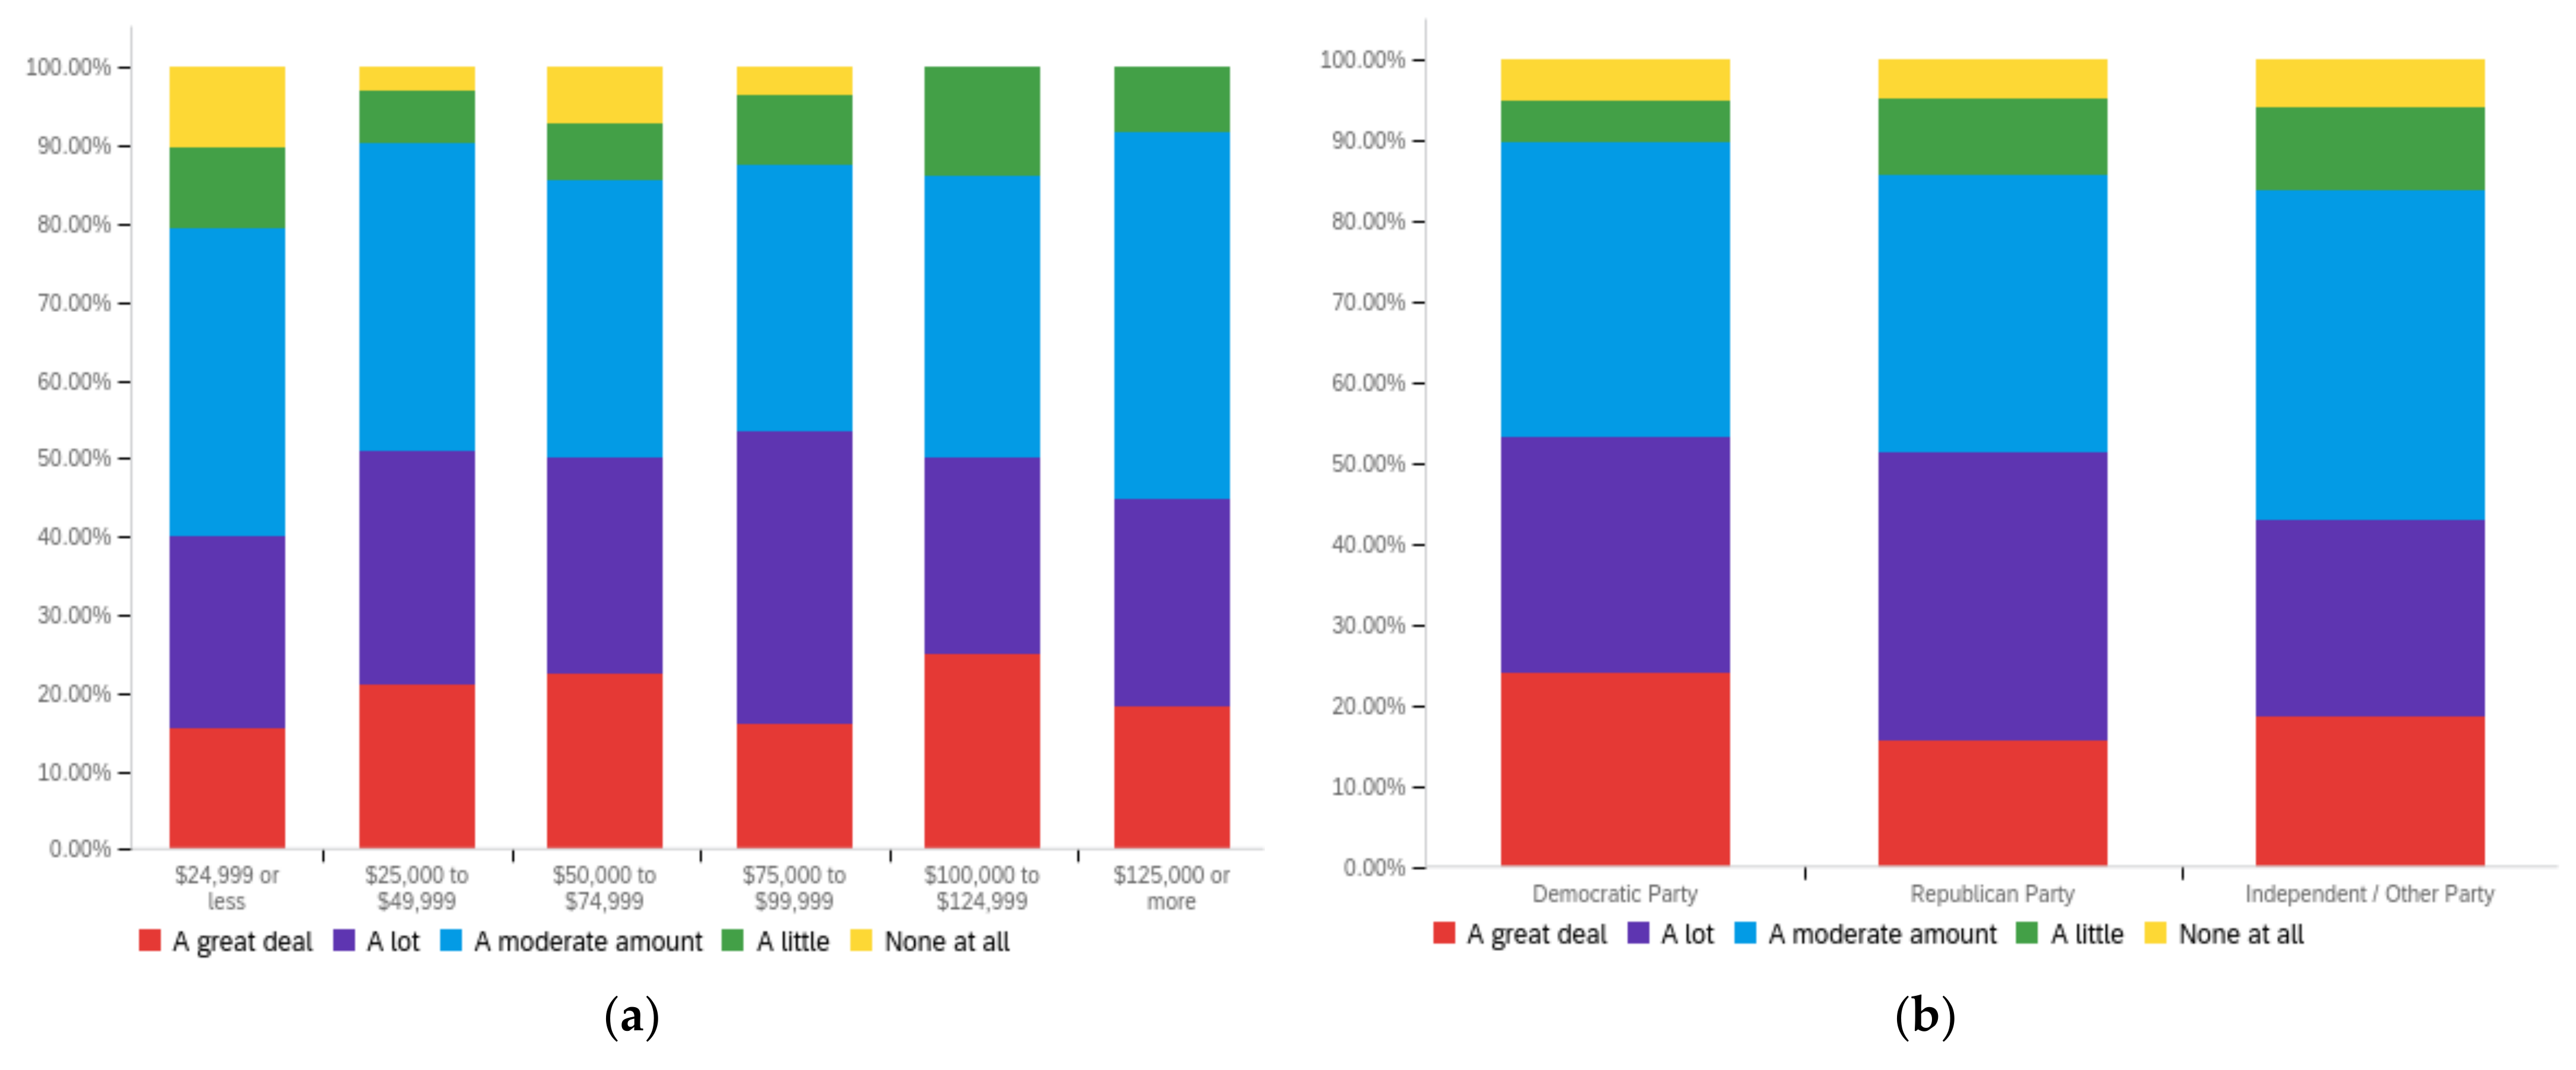
Futureinternet 14 00320 g0a1
Figure A2. Article title—others’ perception impact by: (a) income level (top left), (b) political affiliation (top right) and (c) online usage (bottom).
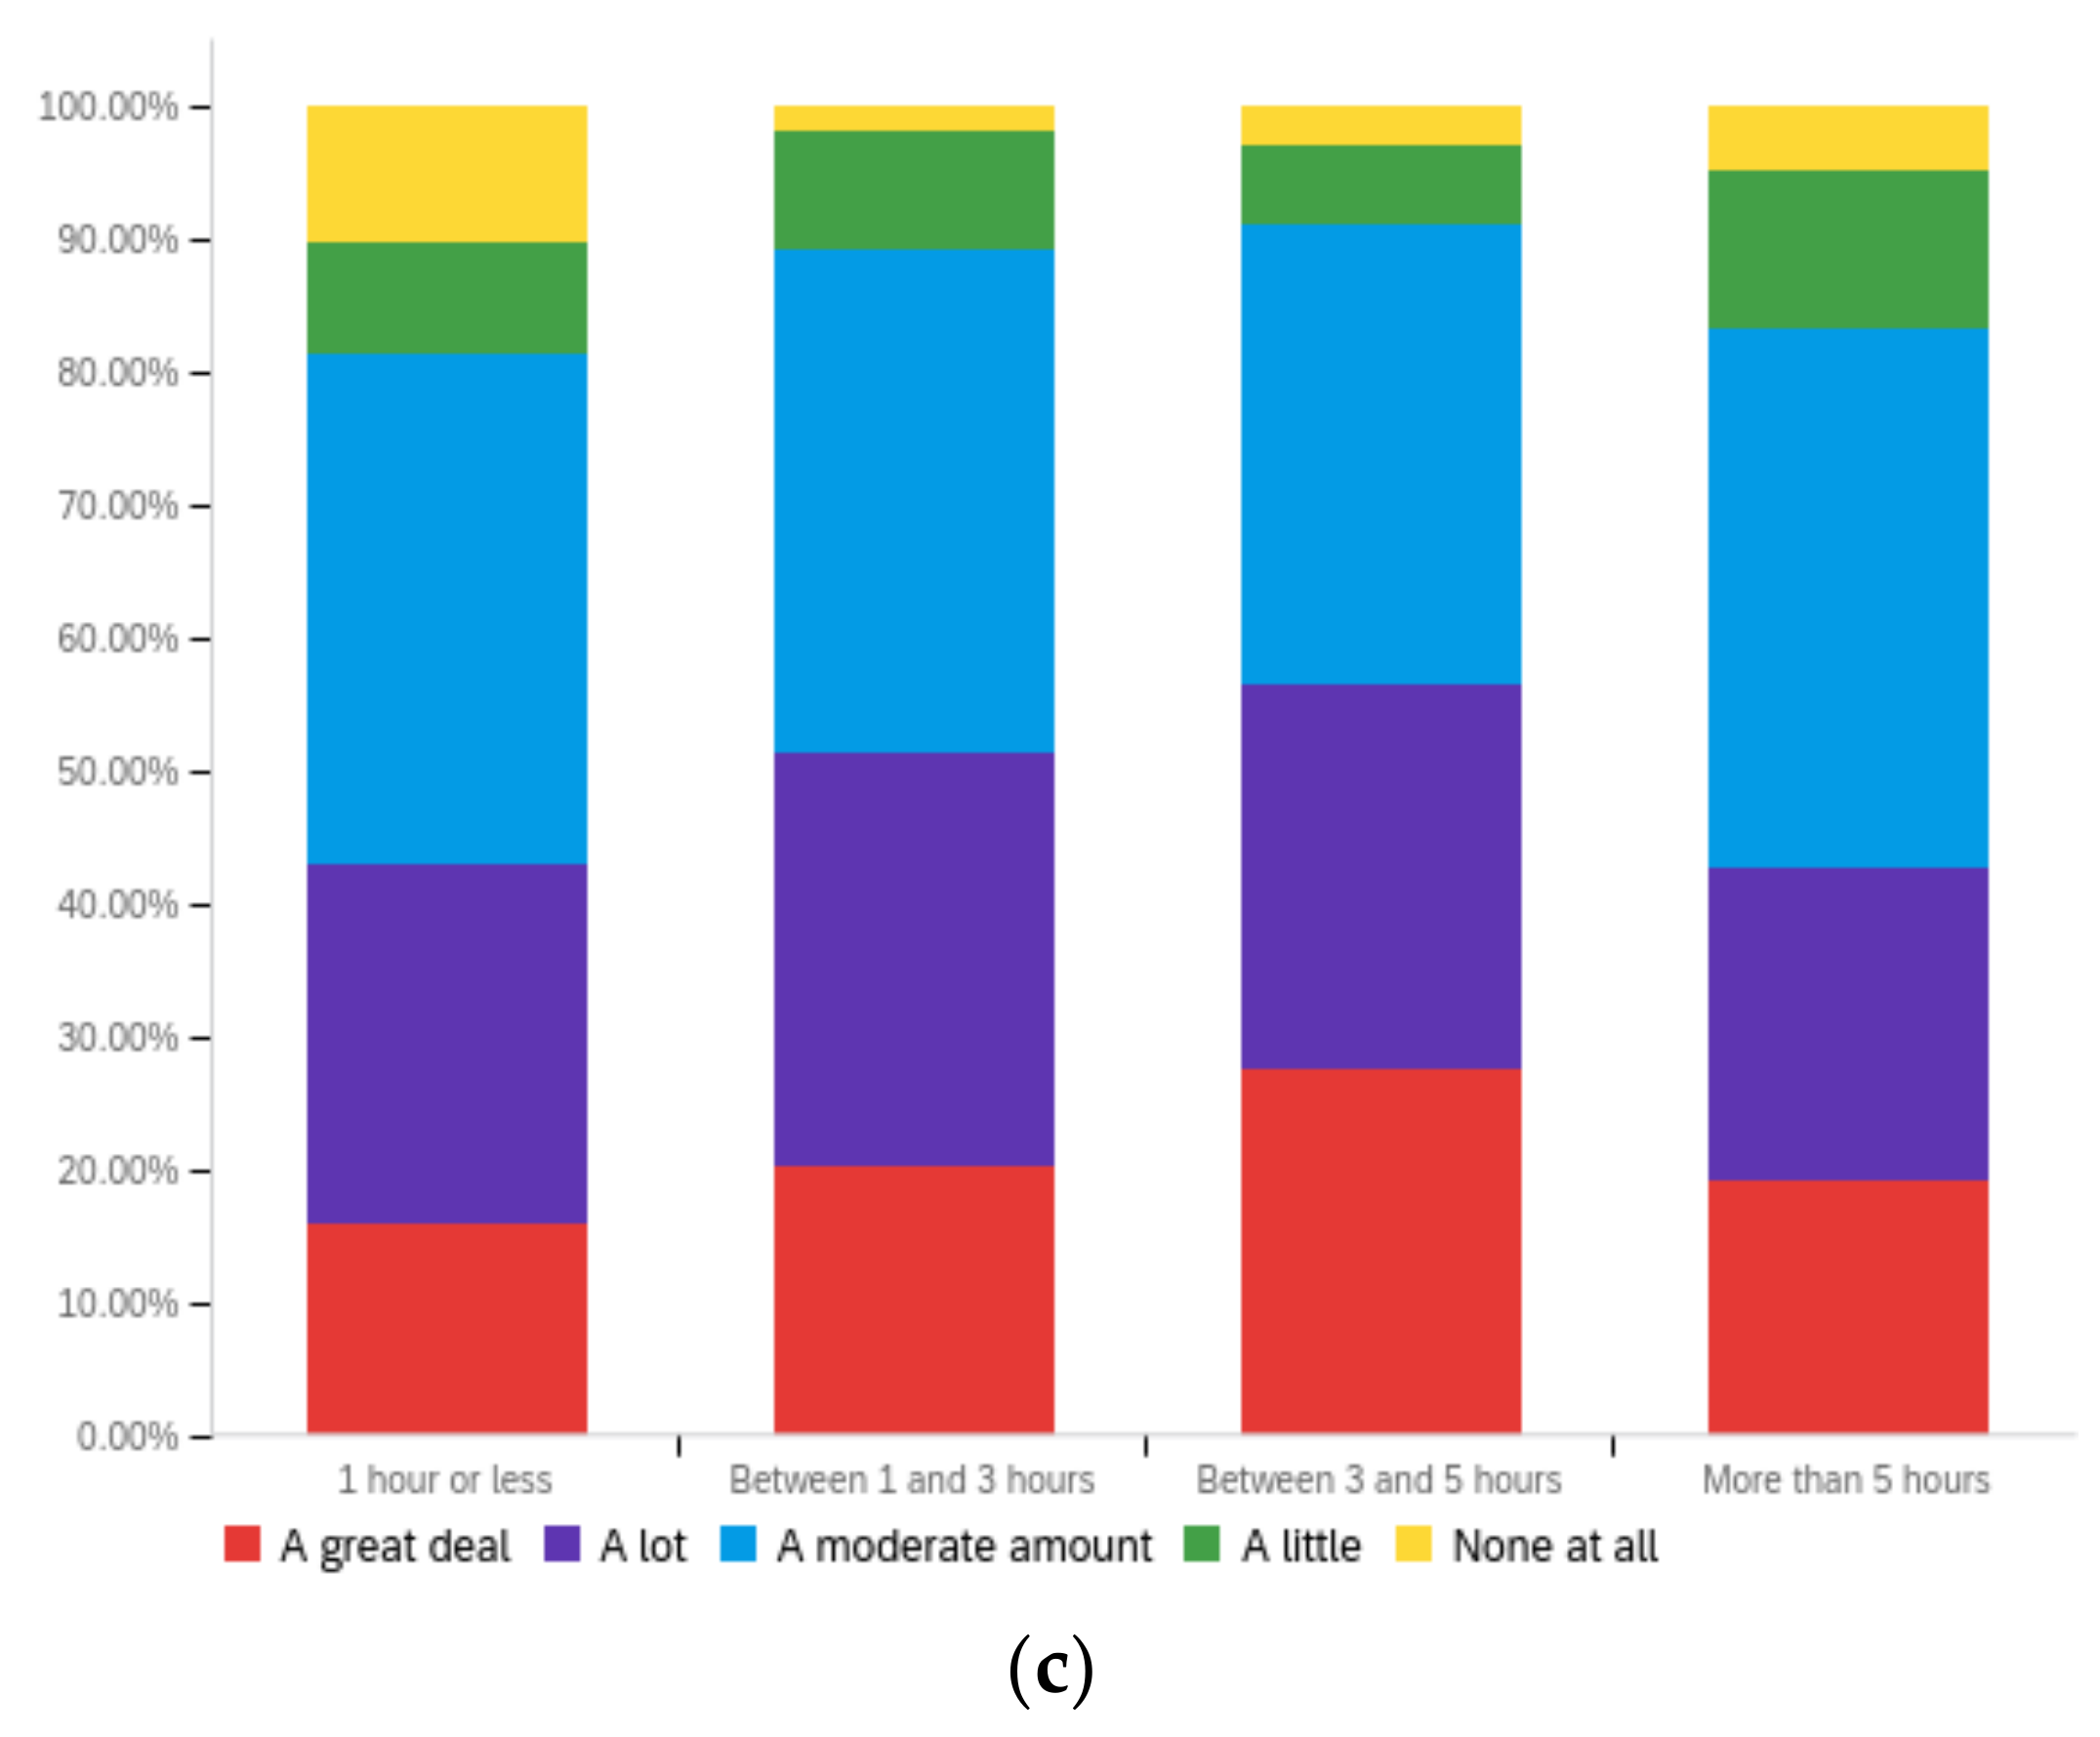
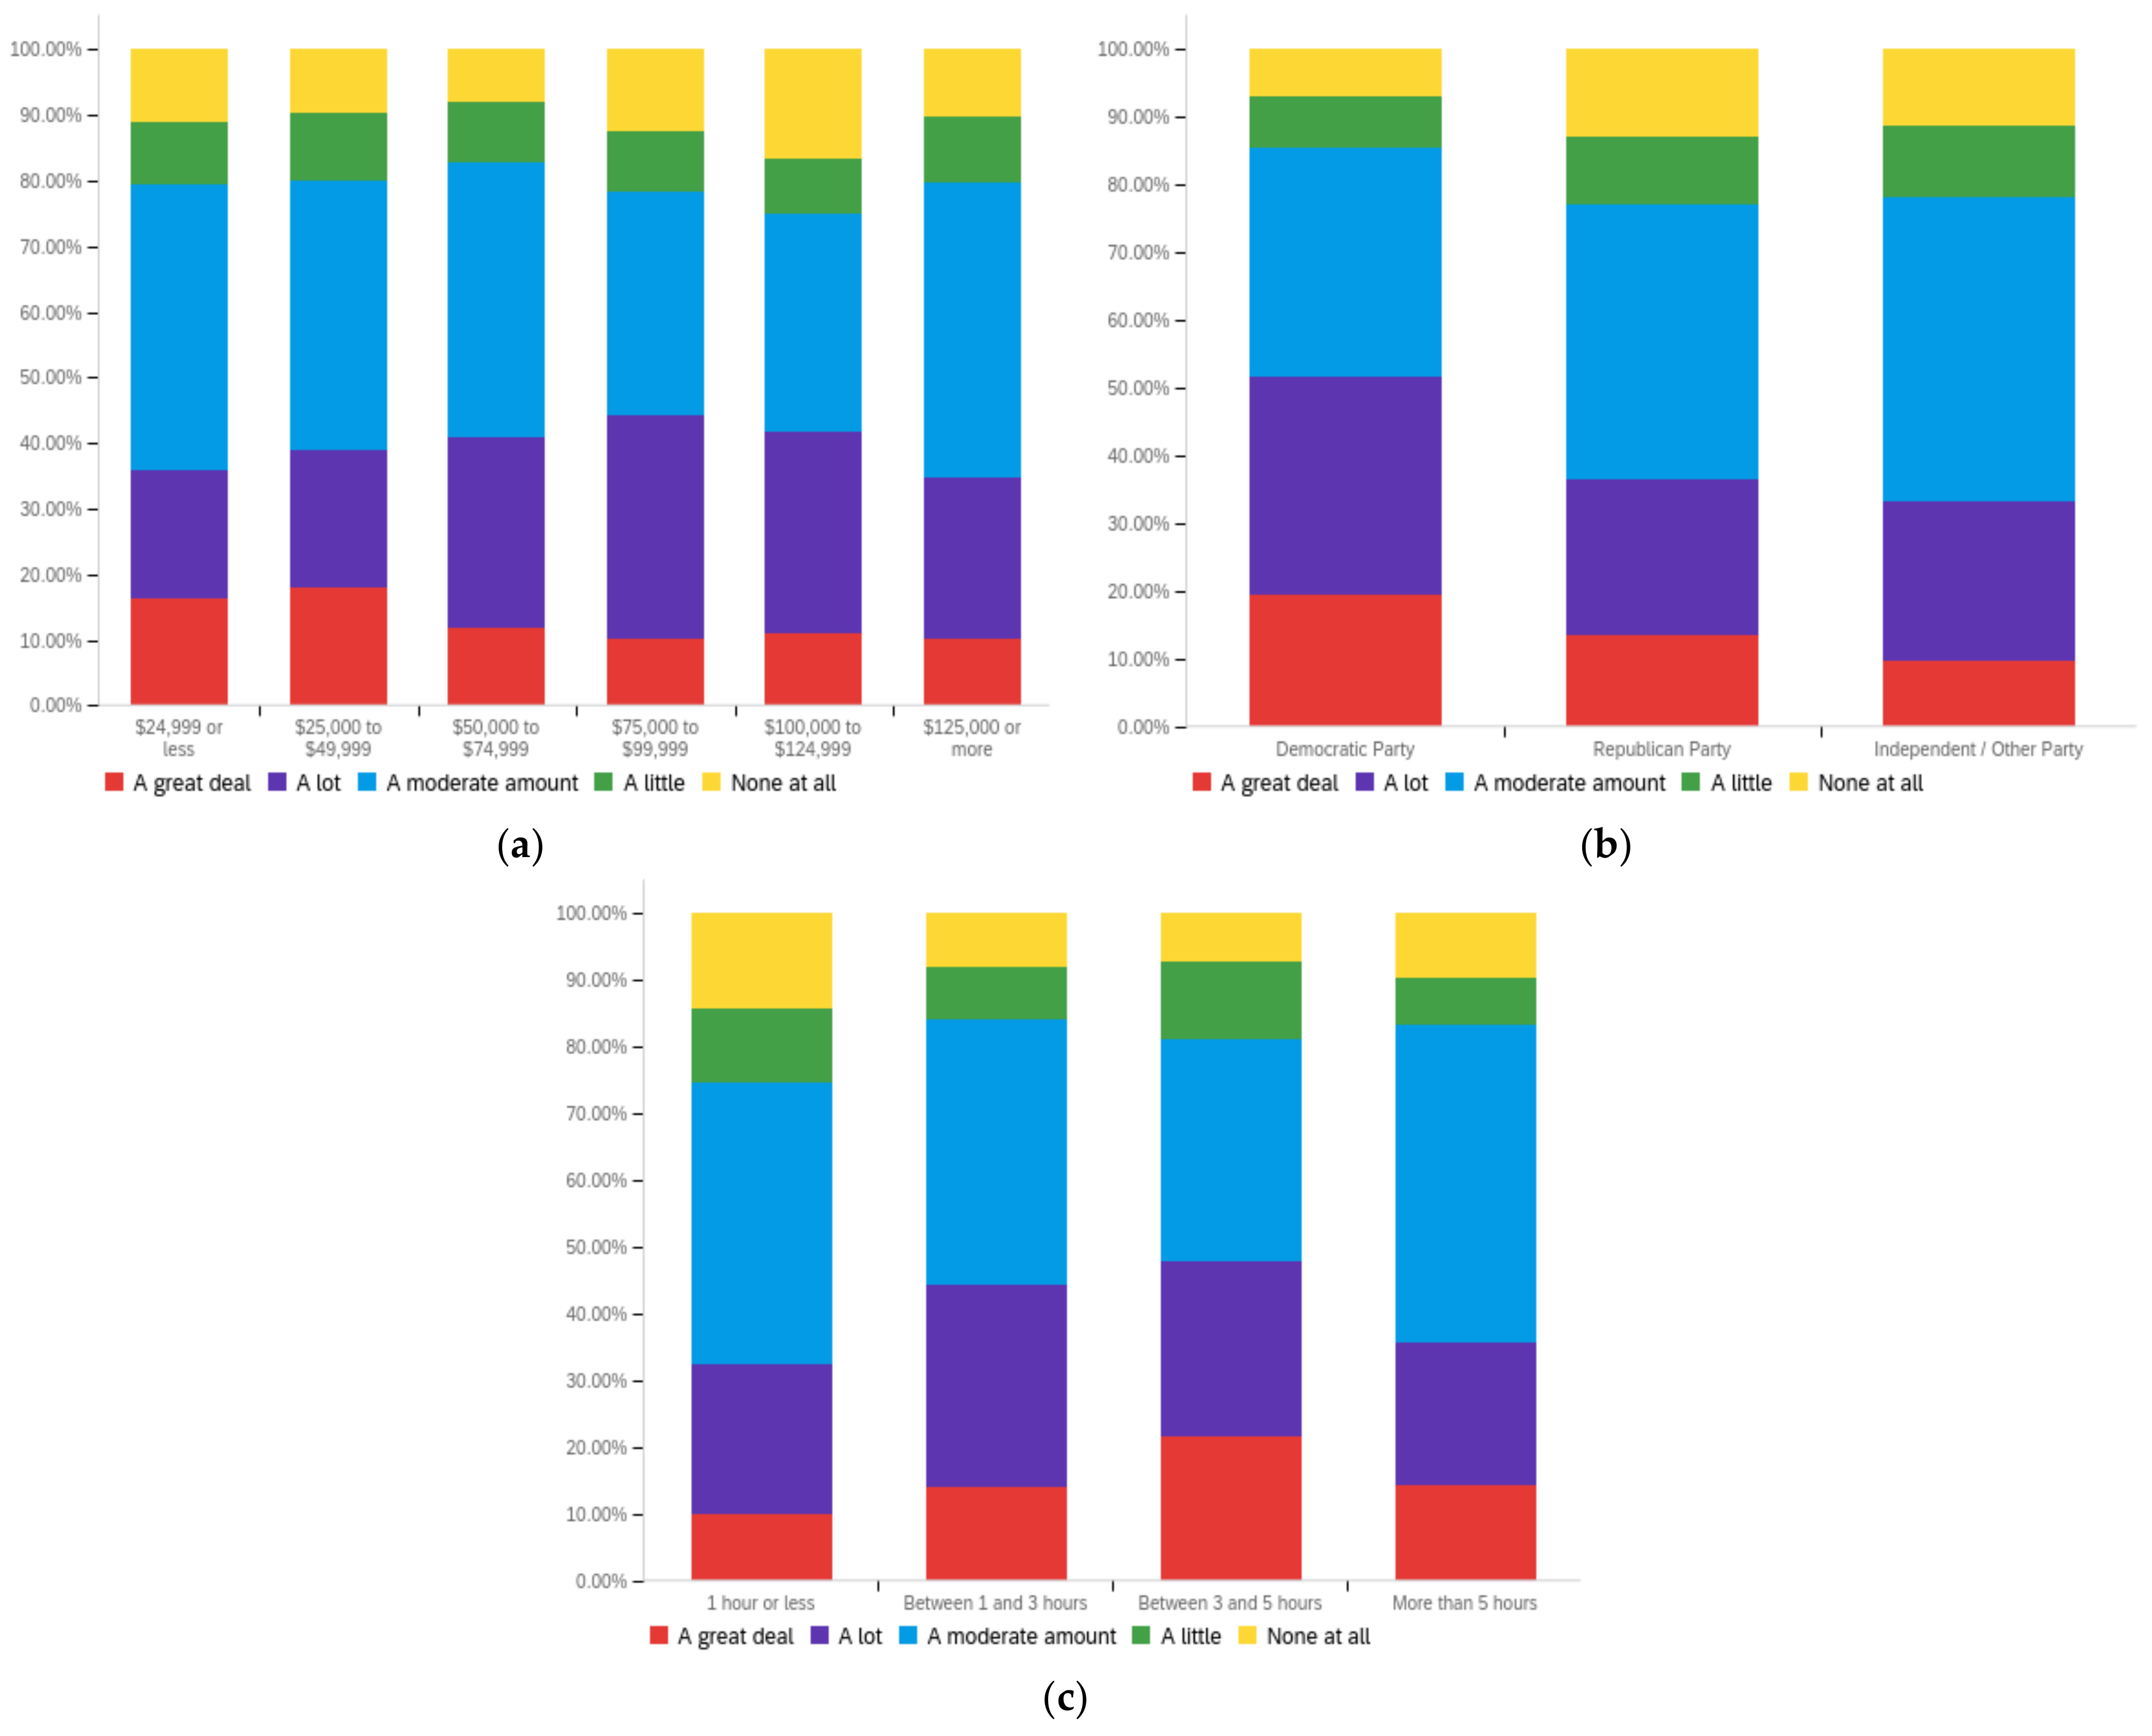
Futureinternet 14 00320 g0a2aFutureinternet 14 00320 g0a2b
Figure A3. Article title—ideal perception impact by: (a) income level (top left), (b) political affiliation (top right) and (c) online usage (bottom).
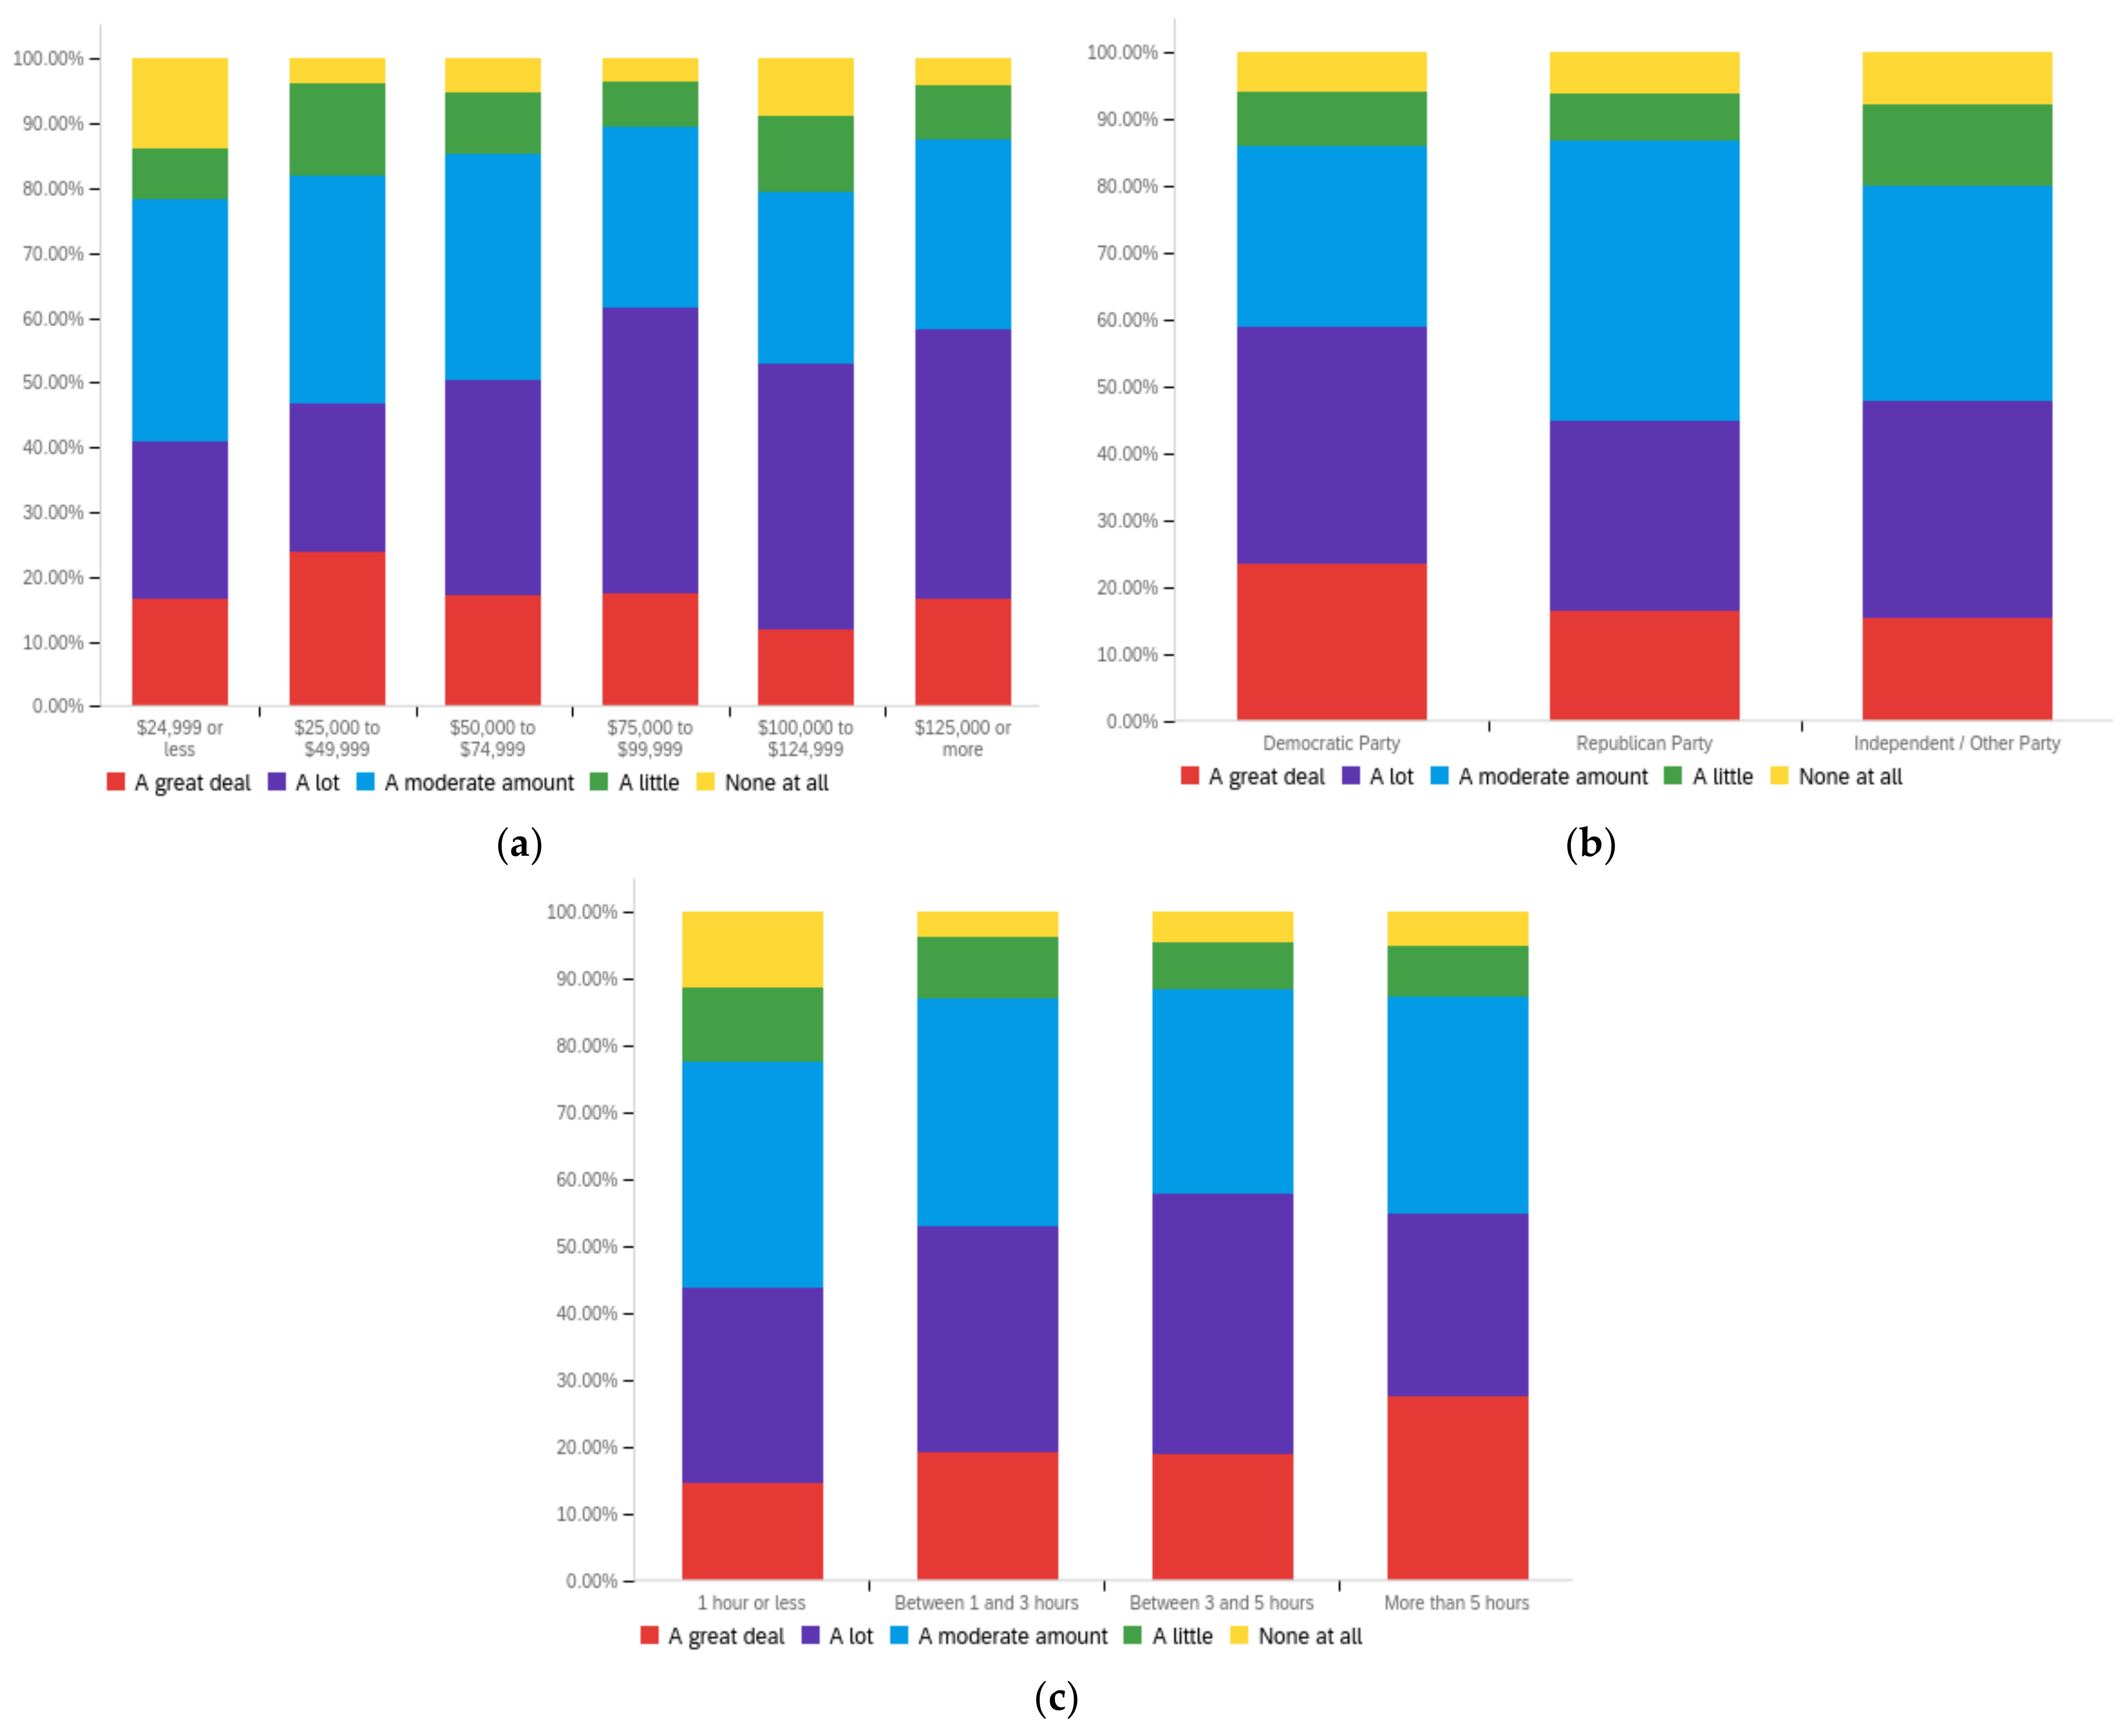
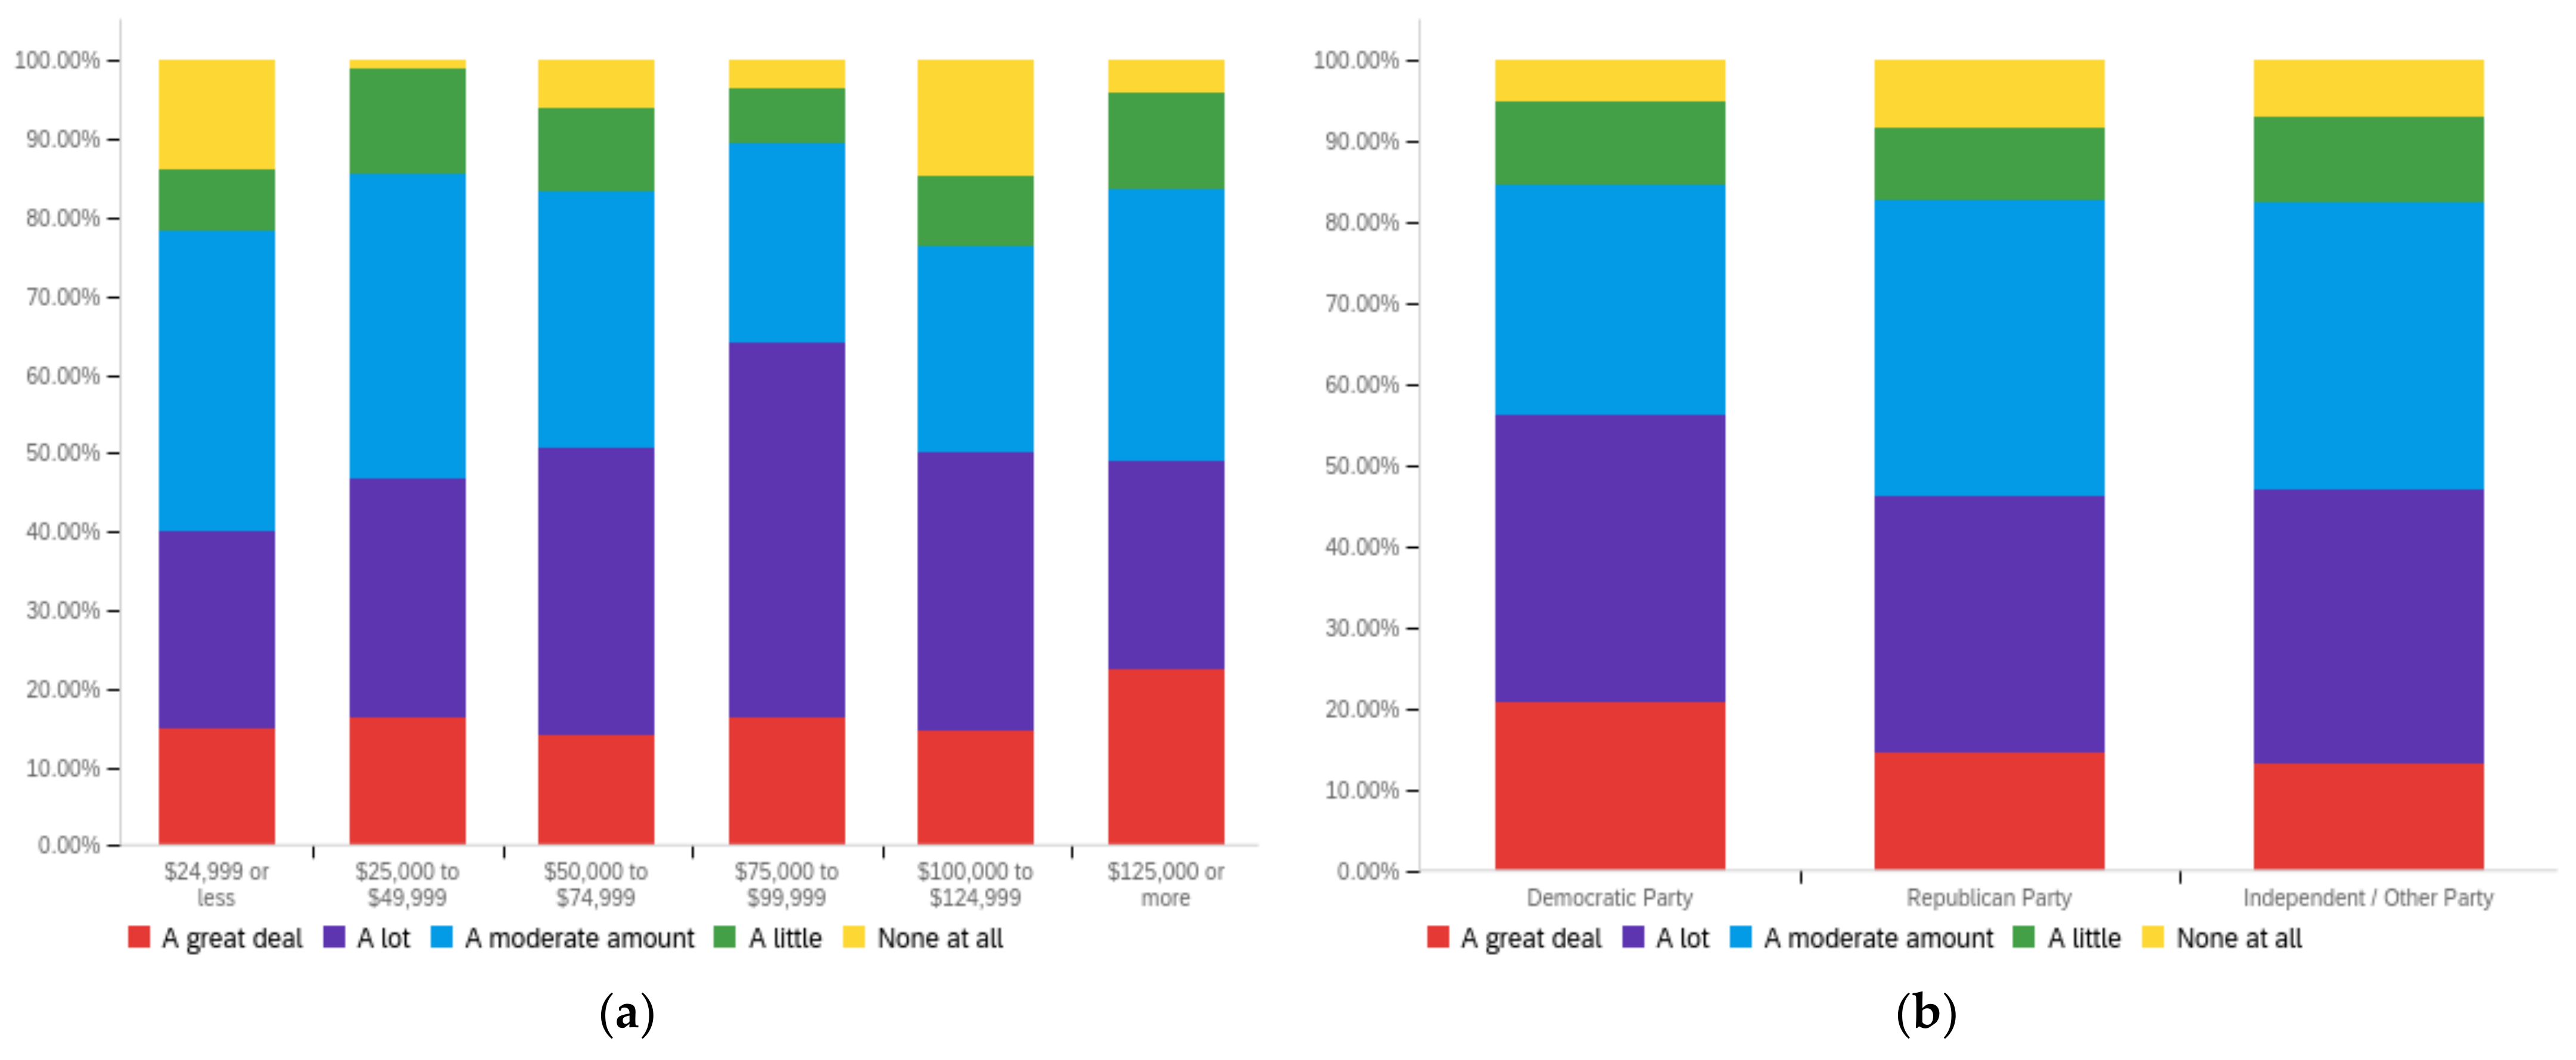
Futureinternet 14 00320 g0a3
Figure A4. Article publisher—personal perception impact by: (a) income level (top left), (b) political affiliation (top right) and (c) online usage (bottom).
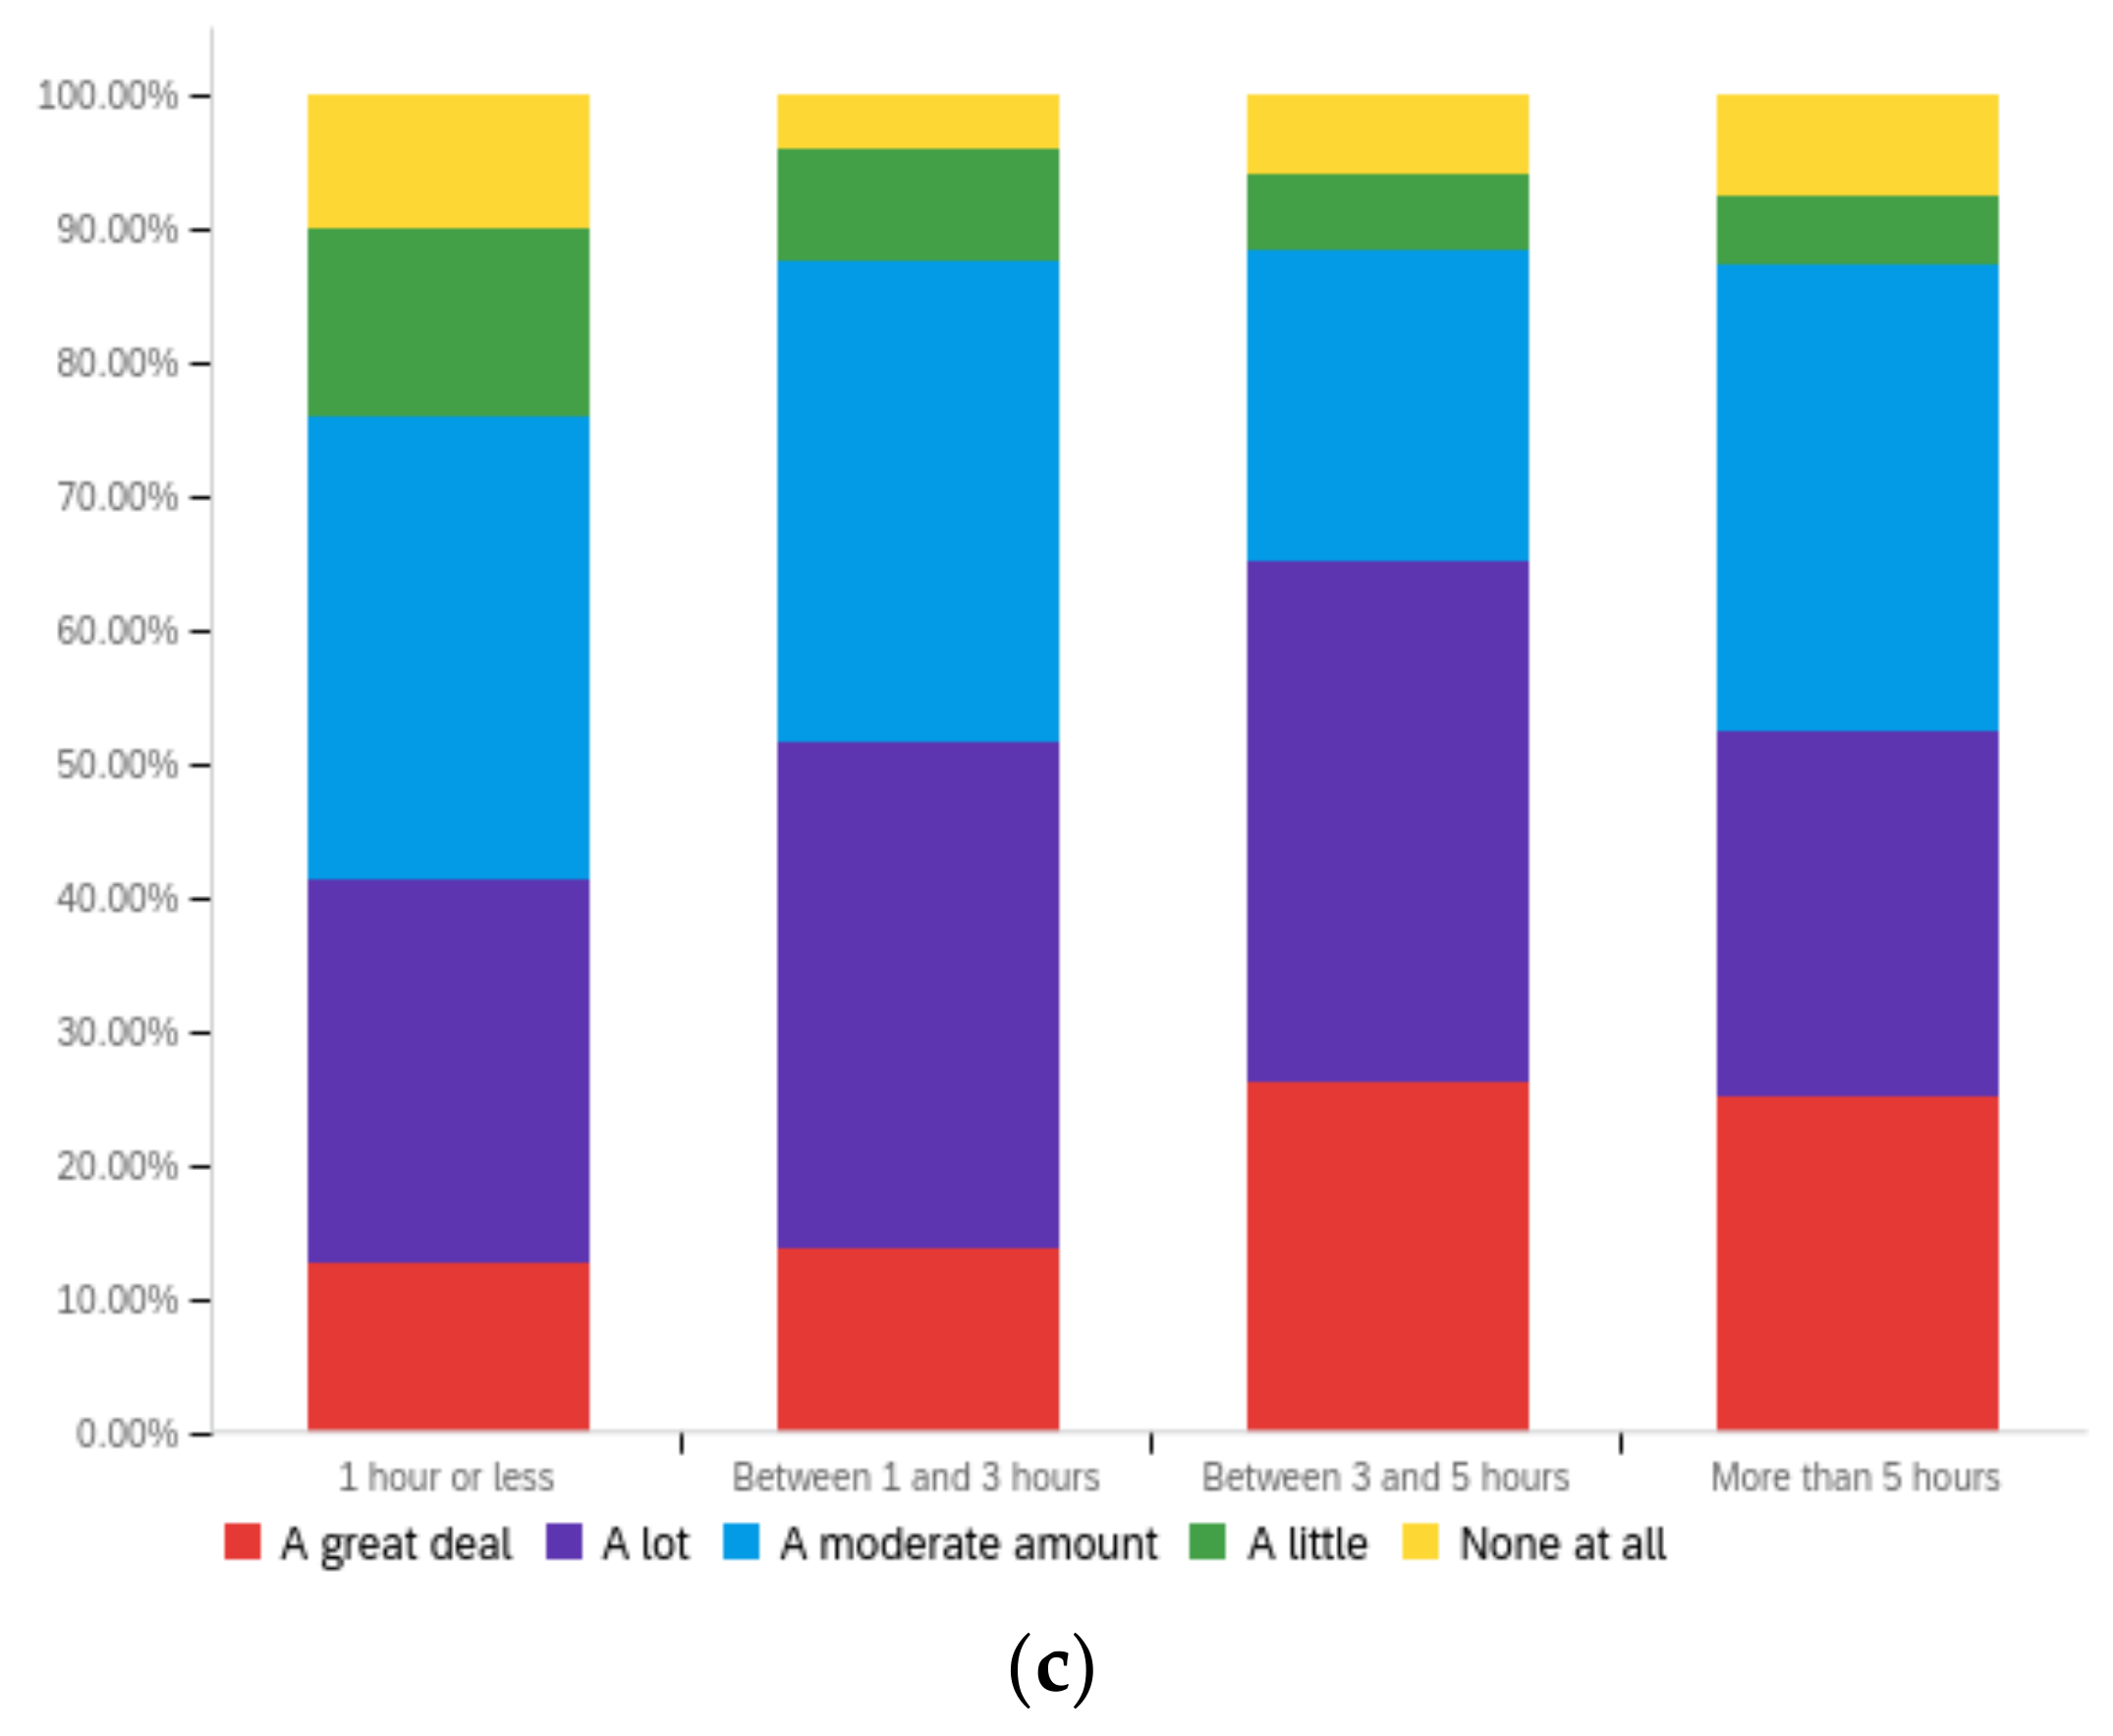
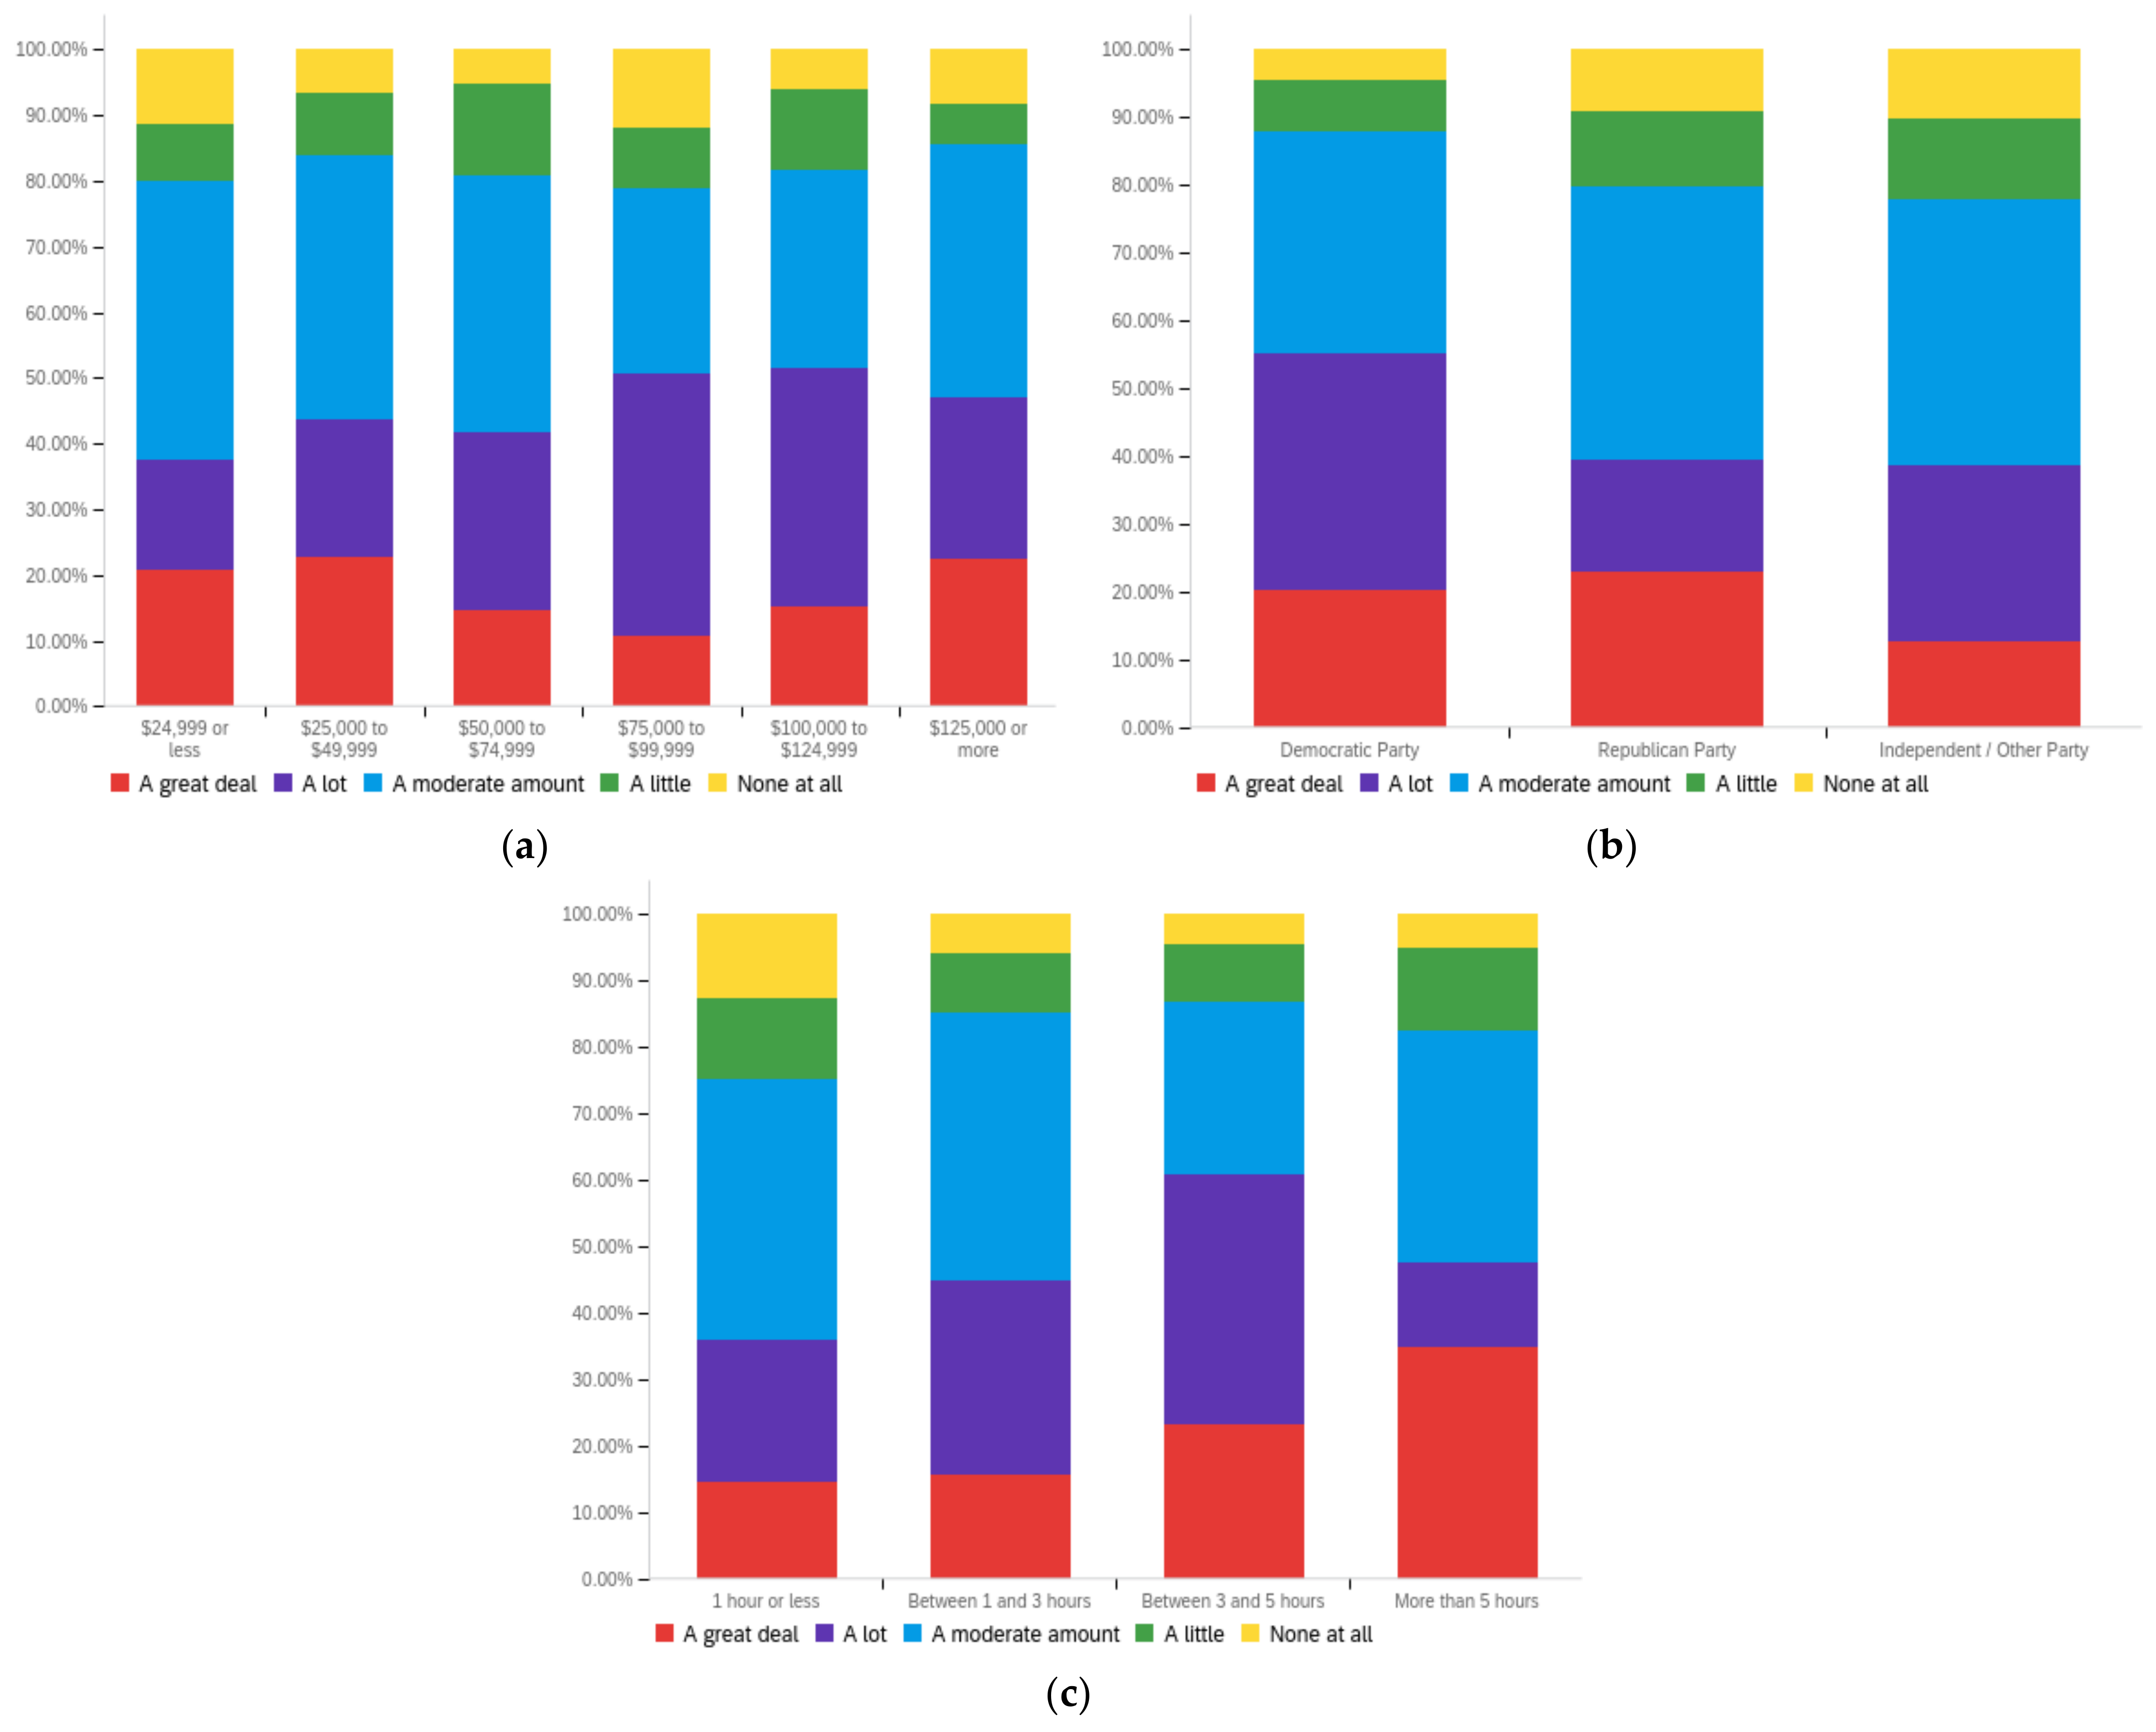
Futureinternet 14 00320 g0a4
Figure A5. Article publisher—others’ perception impact by: (a) income level (top left), (b) political affiliation (top right) and (c) online usage (bottom).
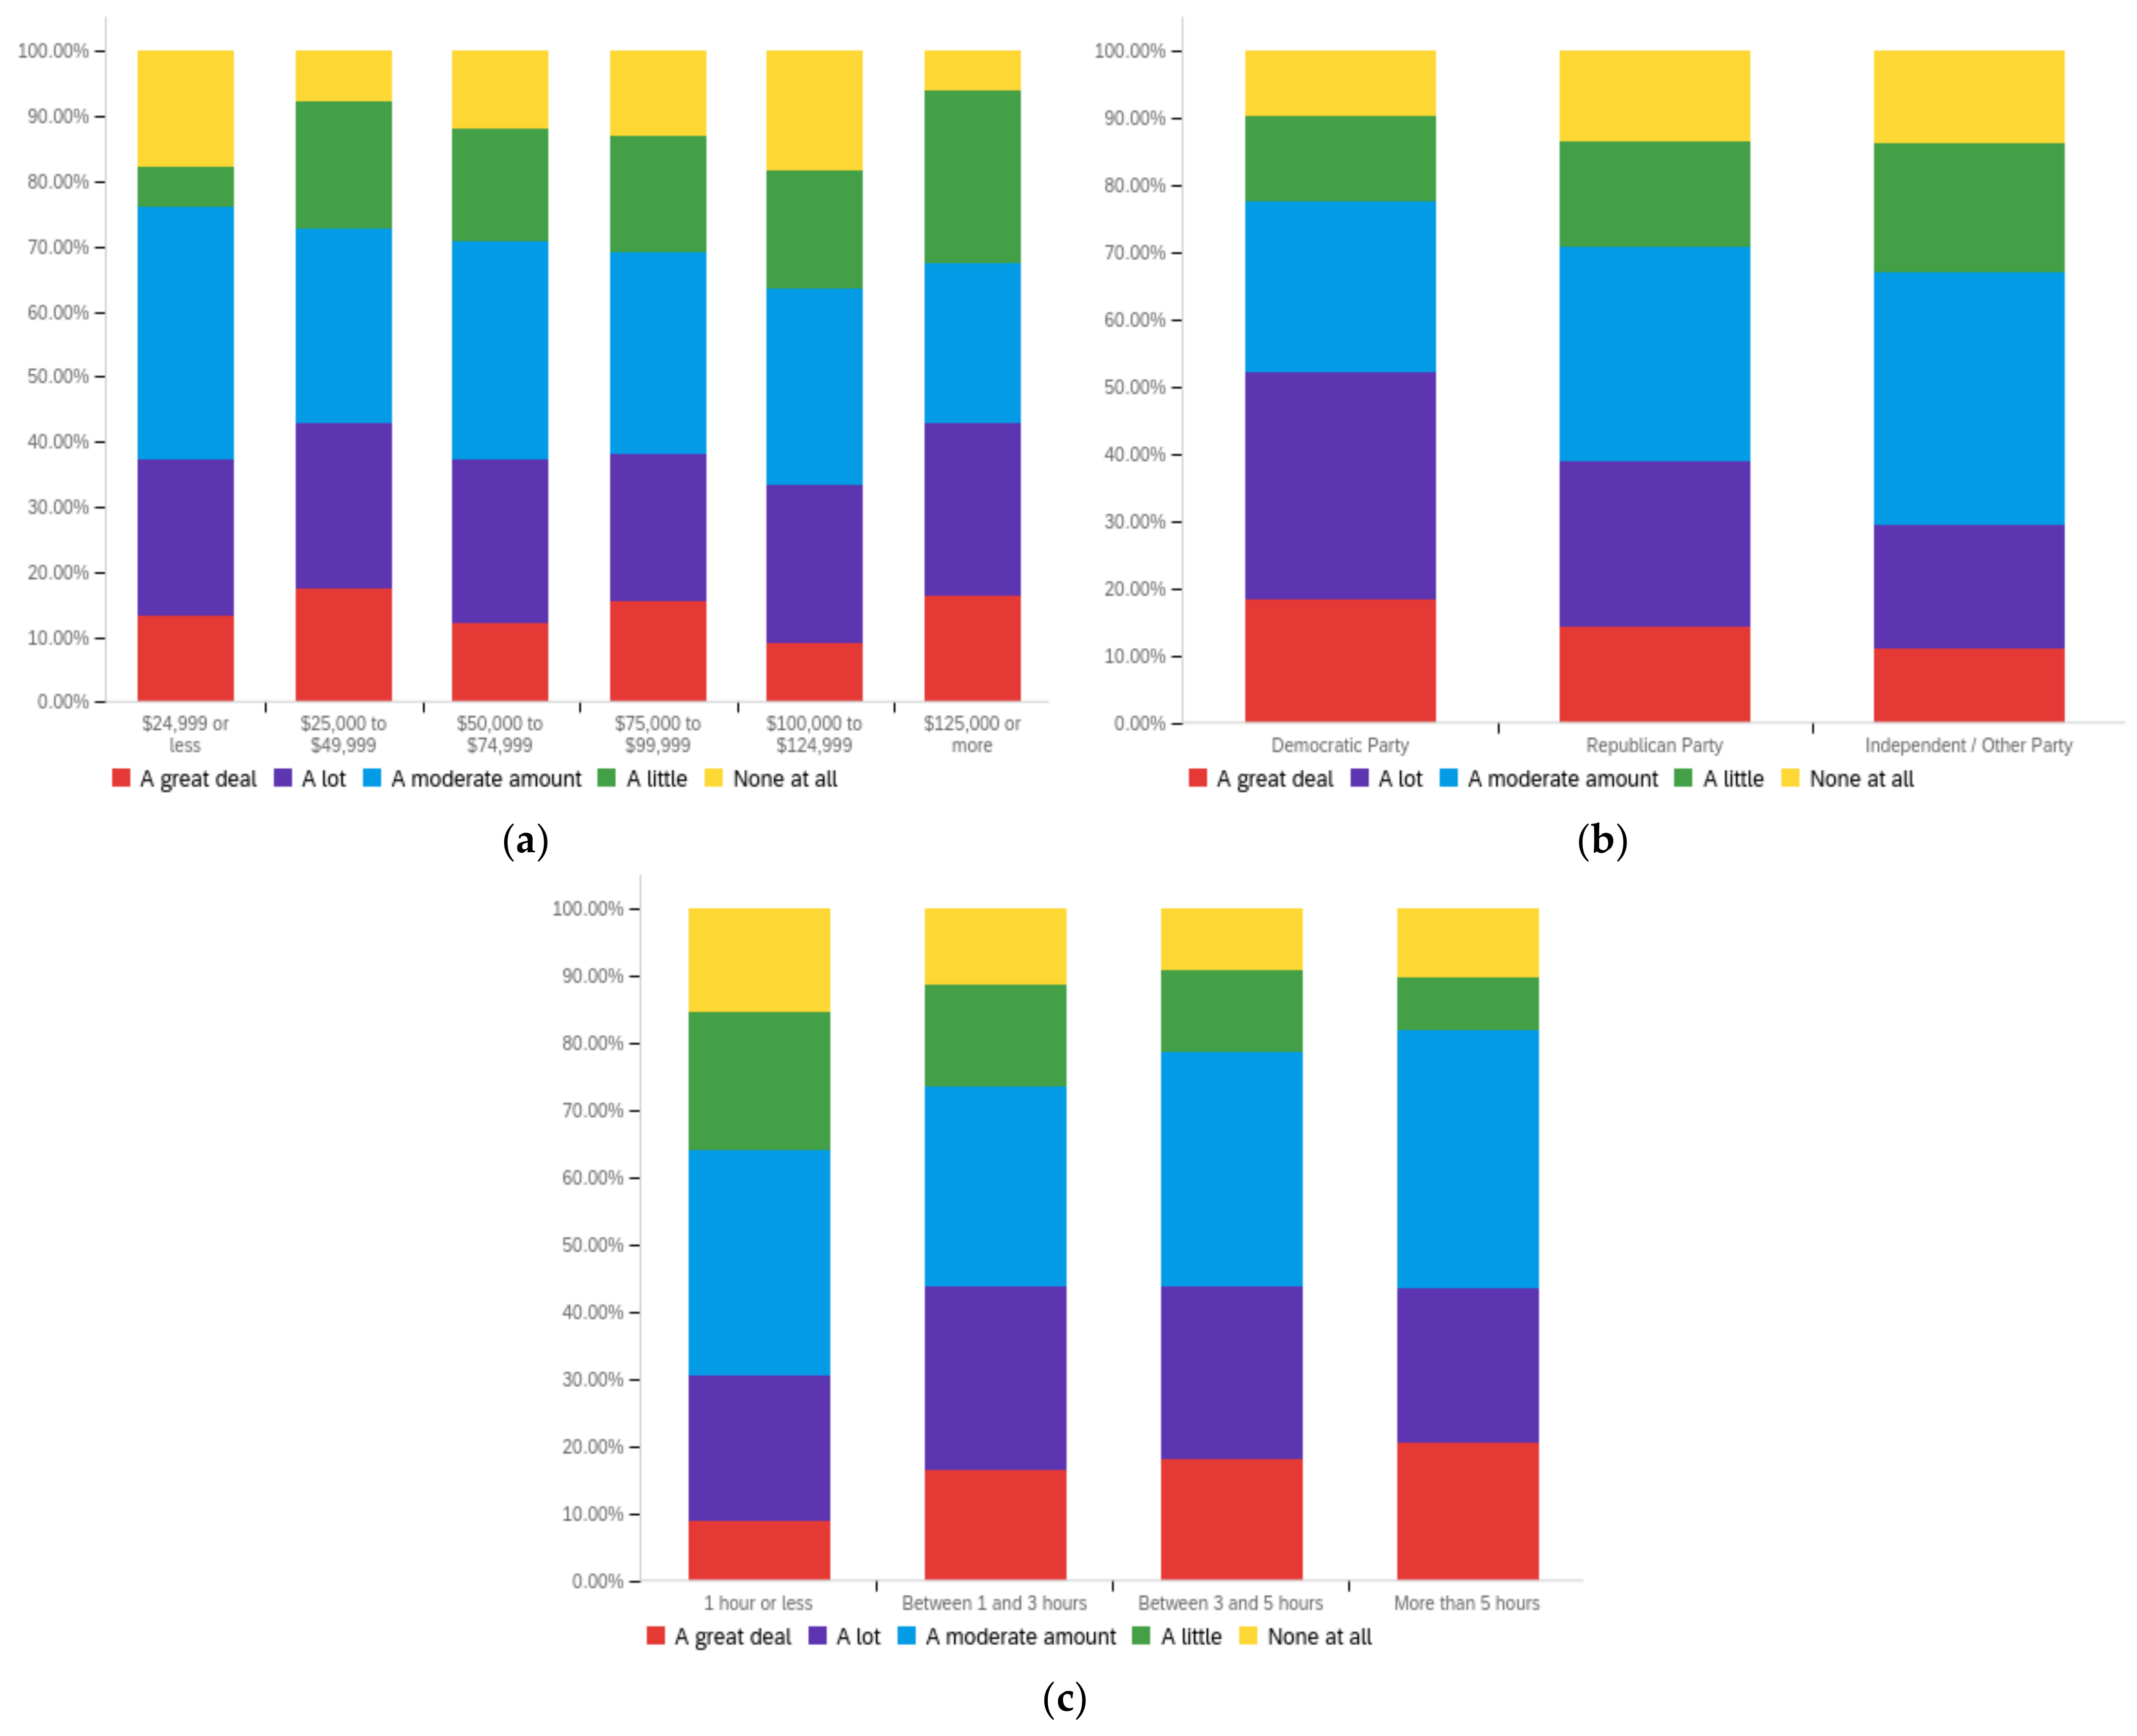
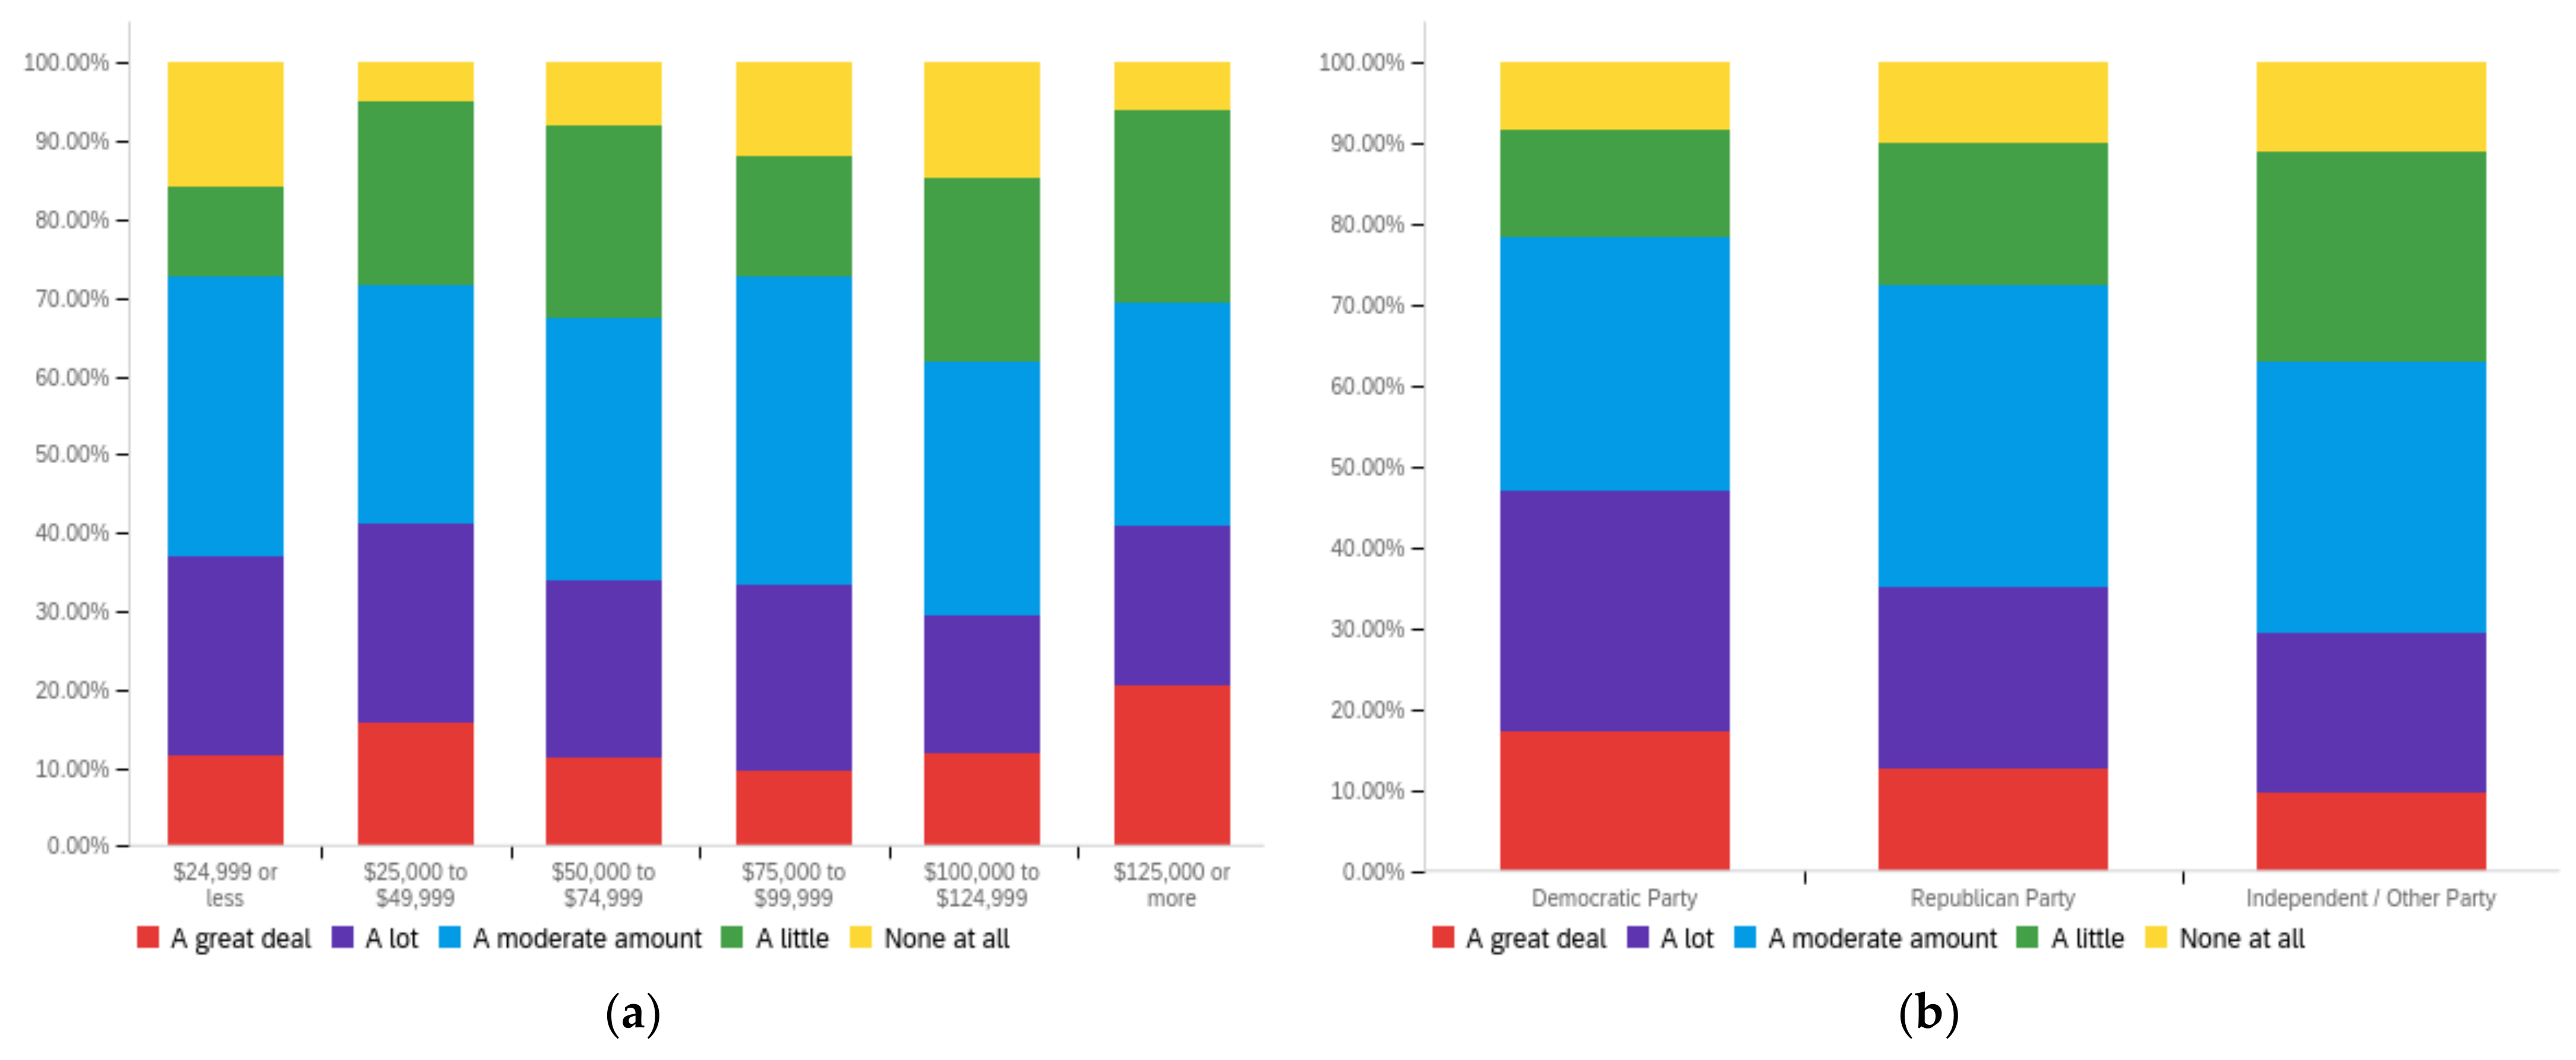
Futureinternet 14 00320 g0a5aFutureinternet 14 00320 g0a5b
Figure A6. Article publisher—ideal perception impact by: (a) income level (top left), (b) political affiliation (top right) and (c) online usage (bottom).
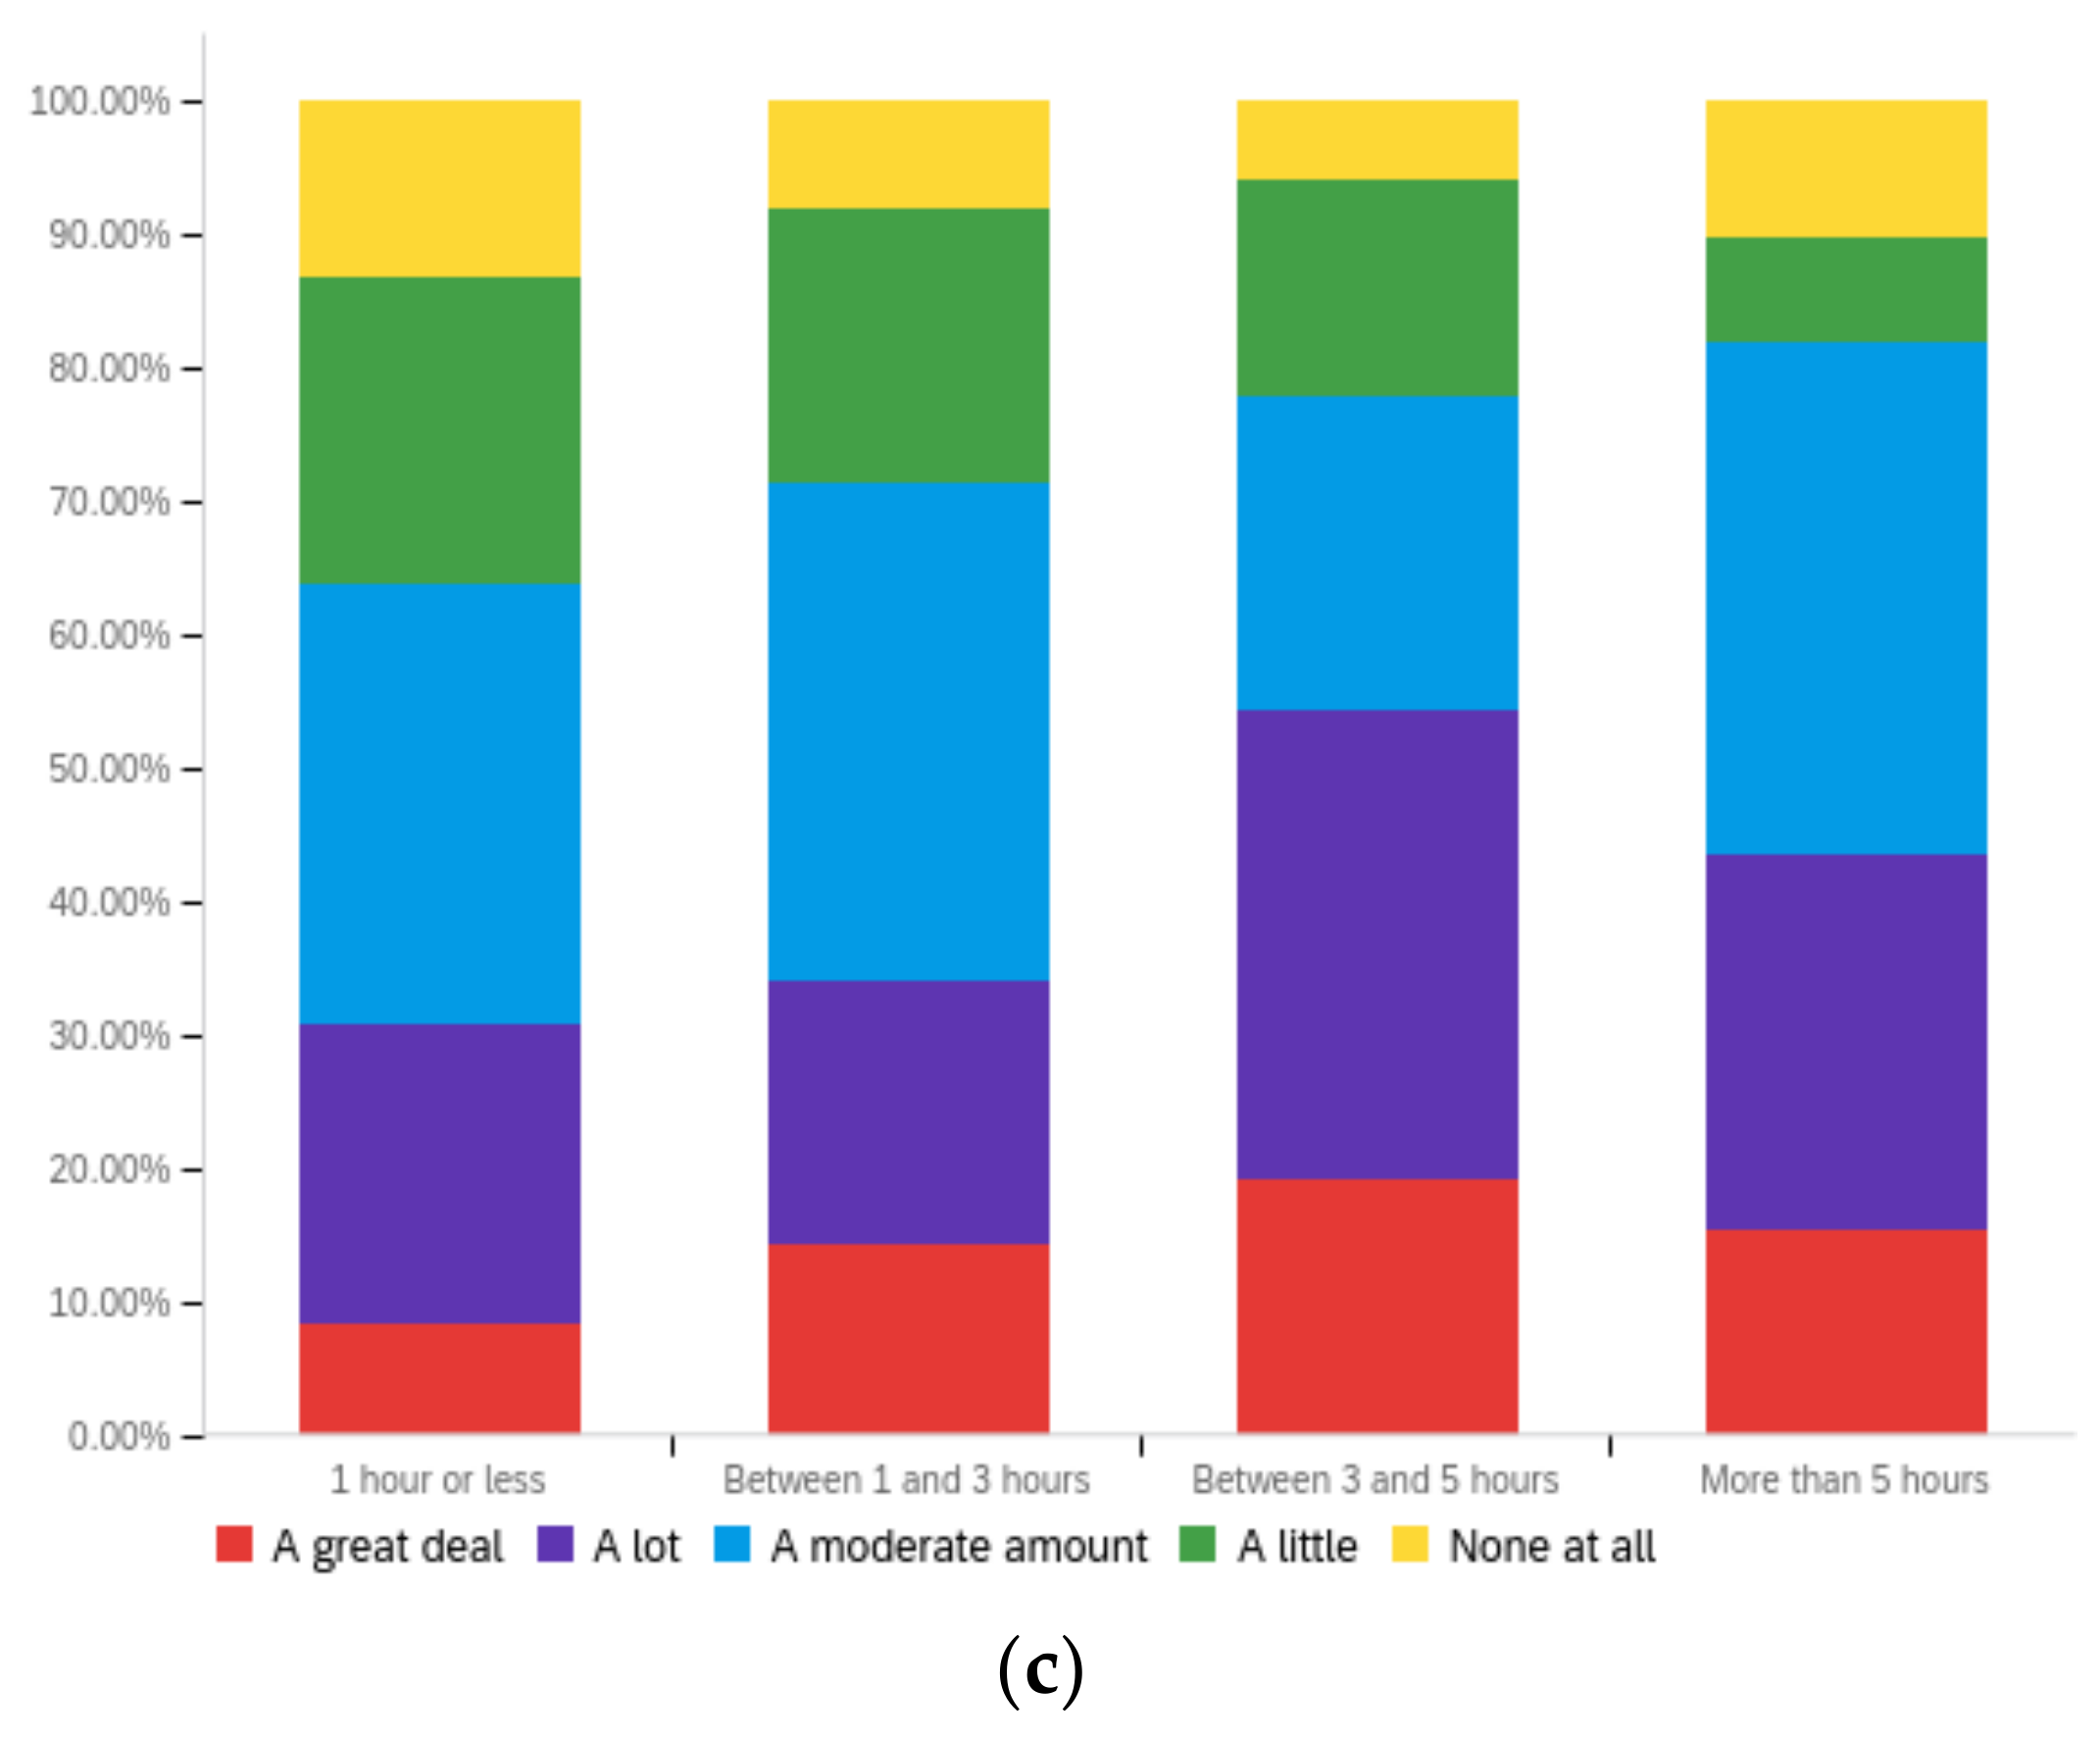
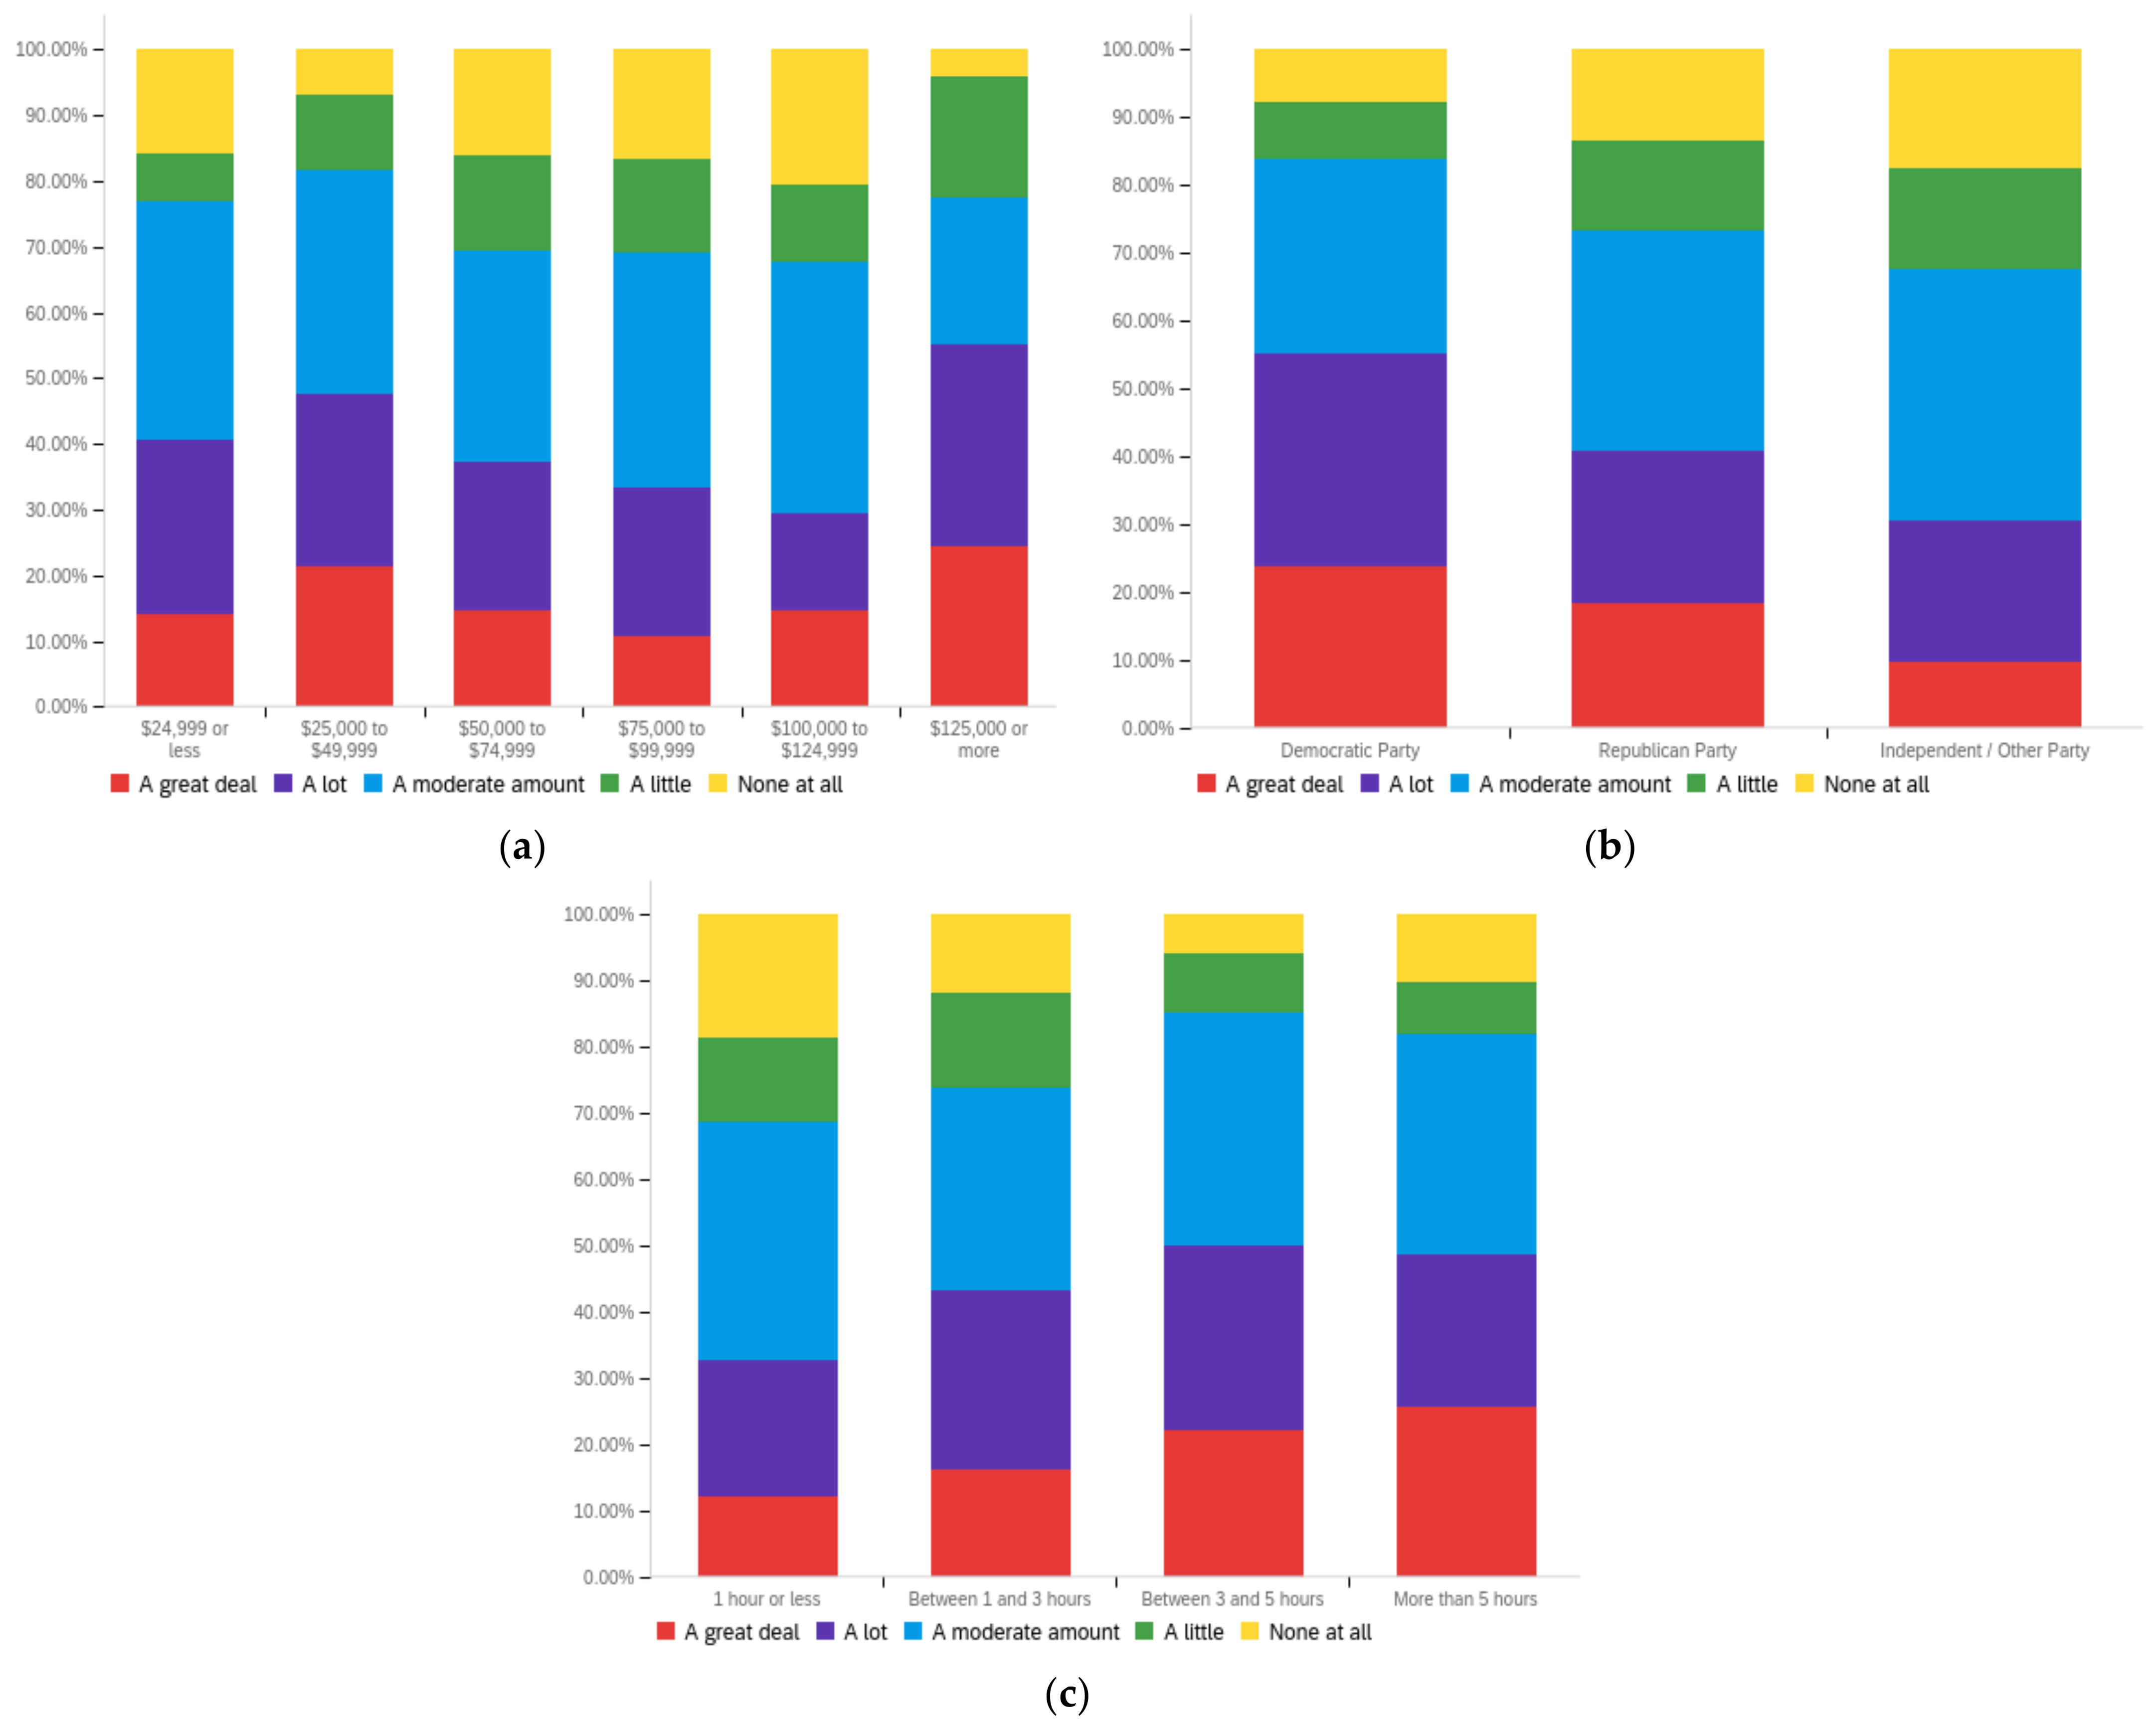
Futureinternet 14 00320 g0a6
Figure A7. Article publication date—personal perception impact by: (a) income level (top left), (b) political affiliation (top right) and (c) online usage (bottom).
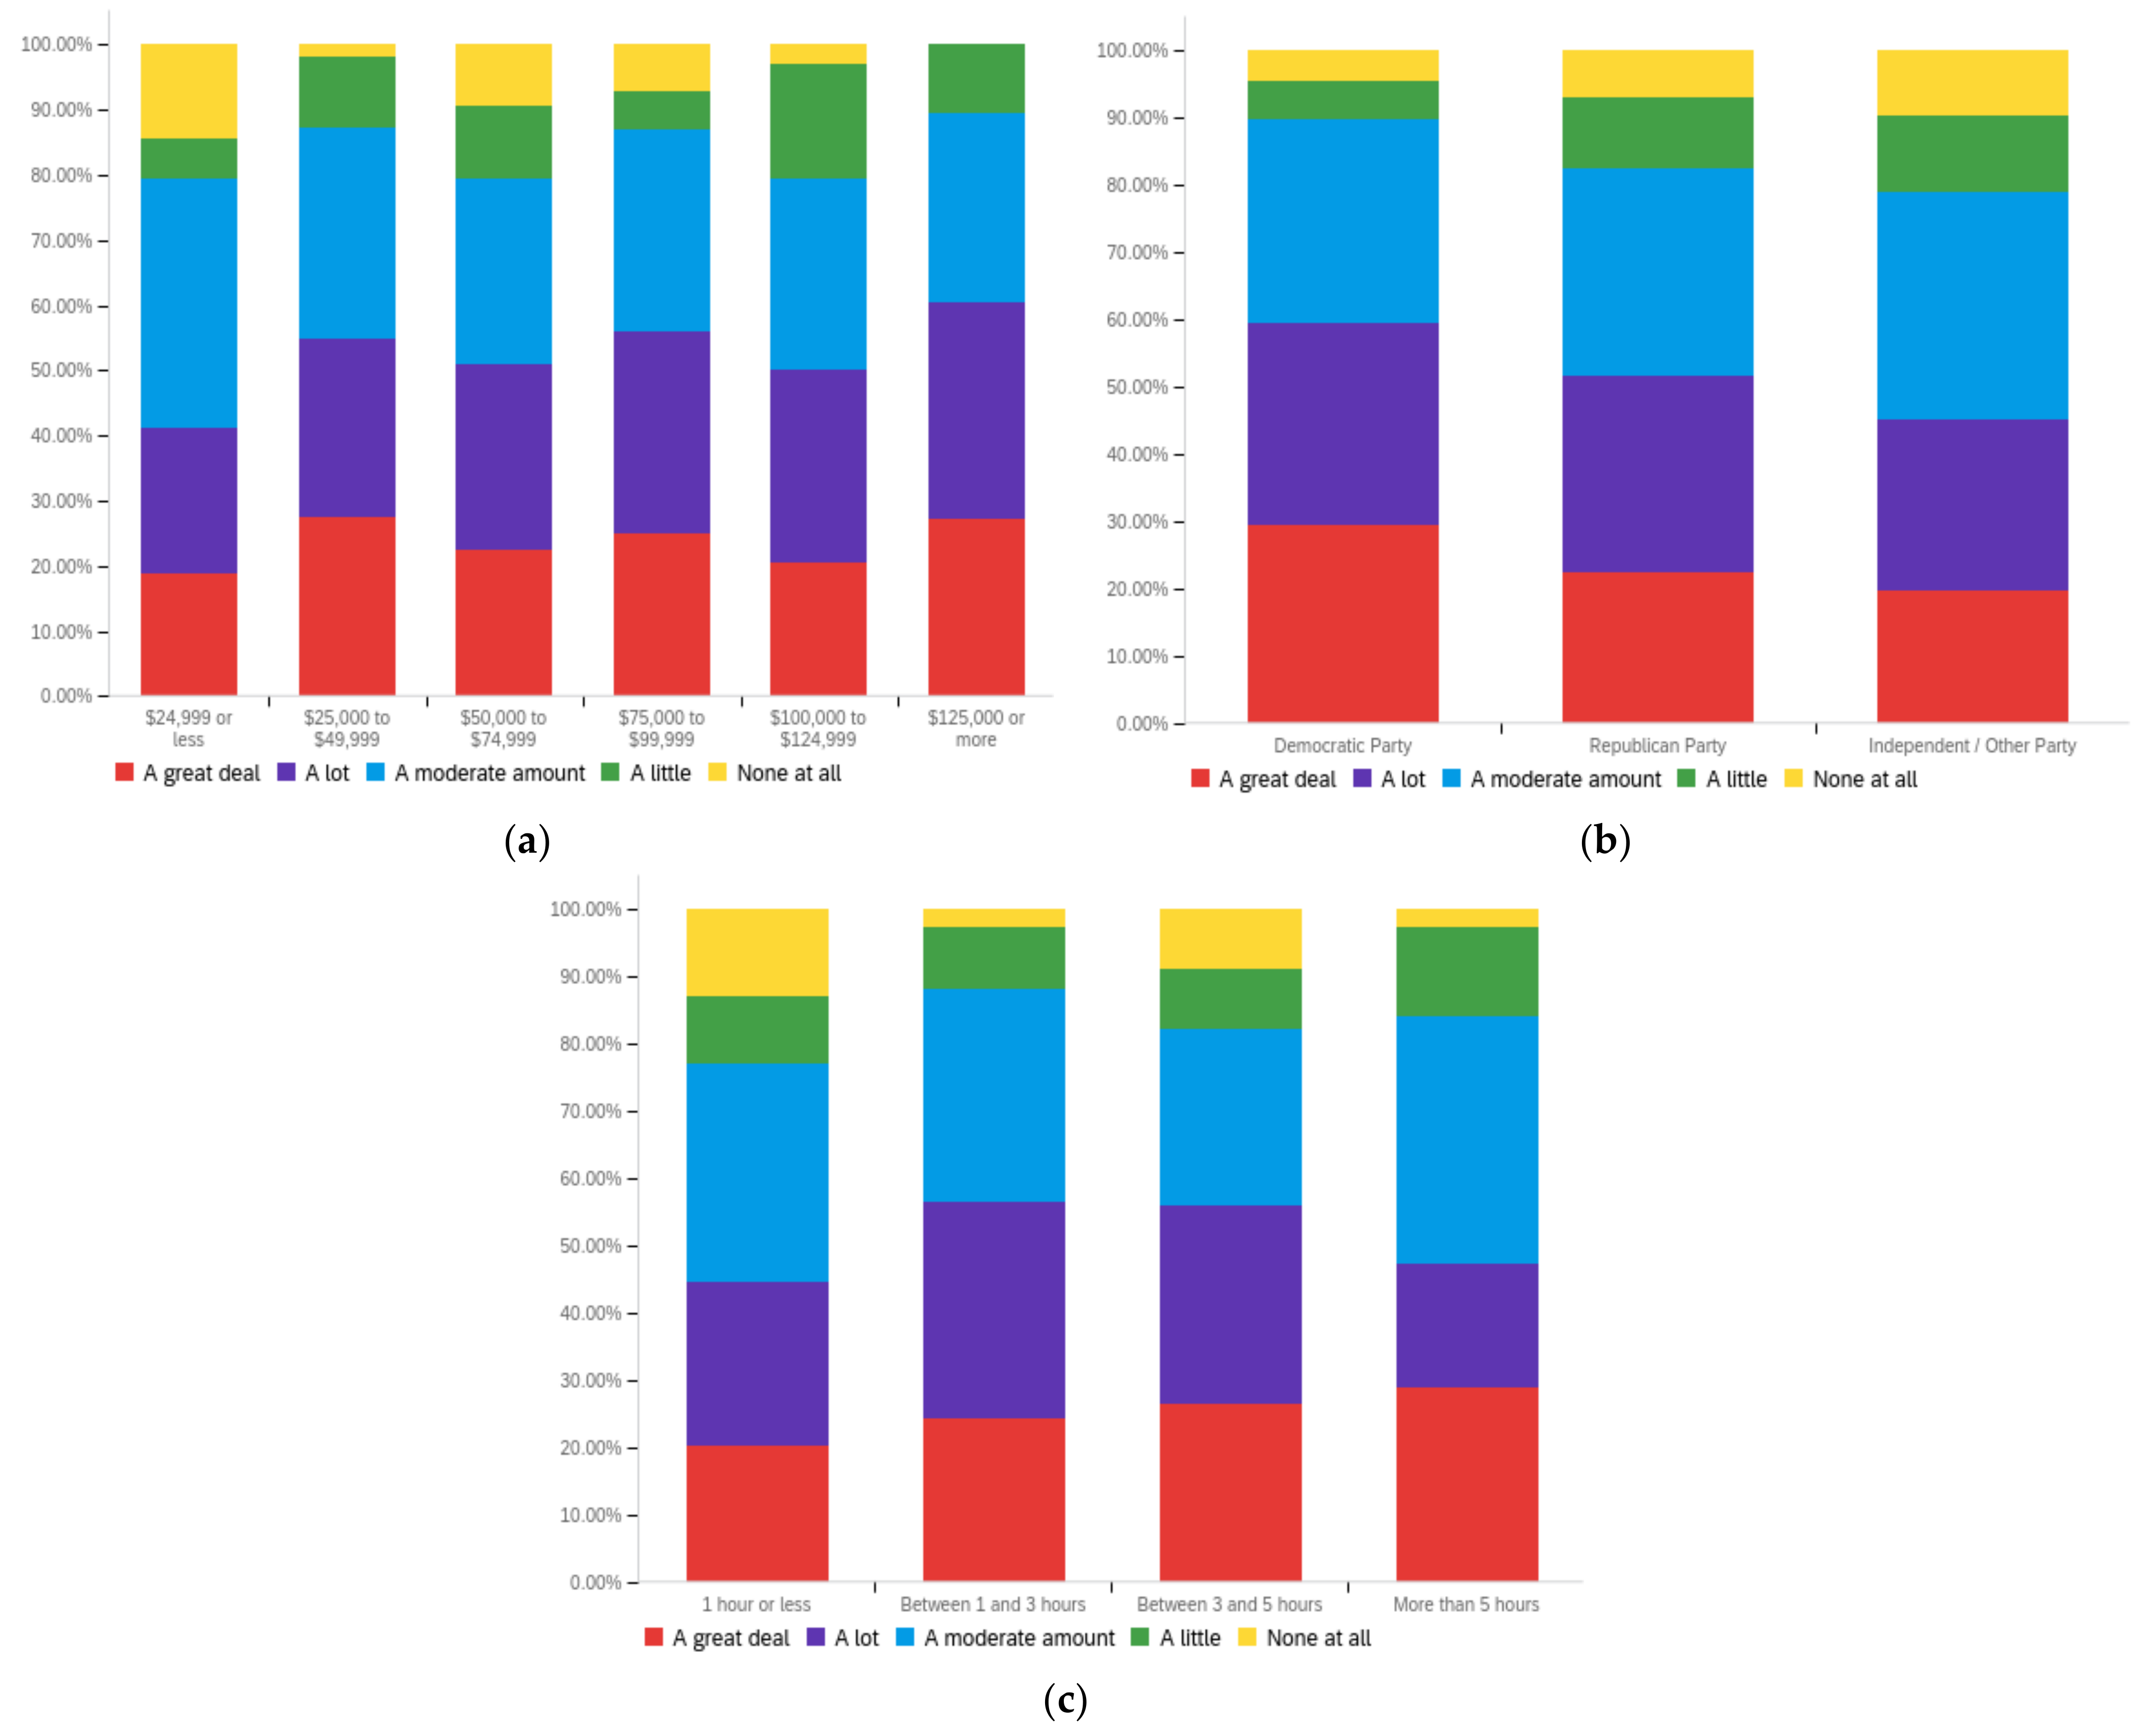
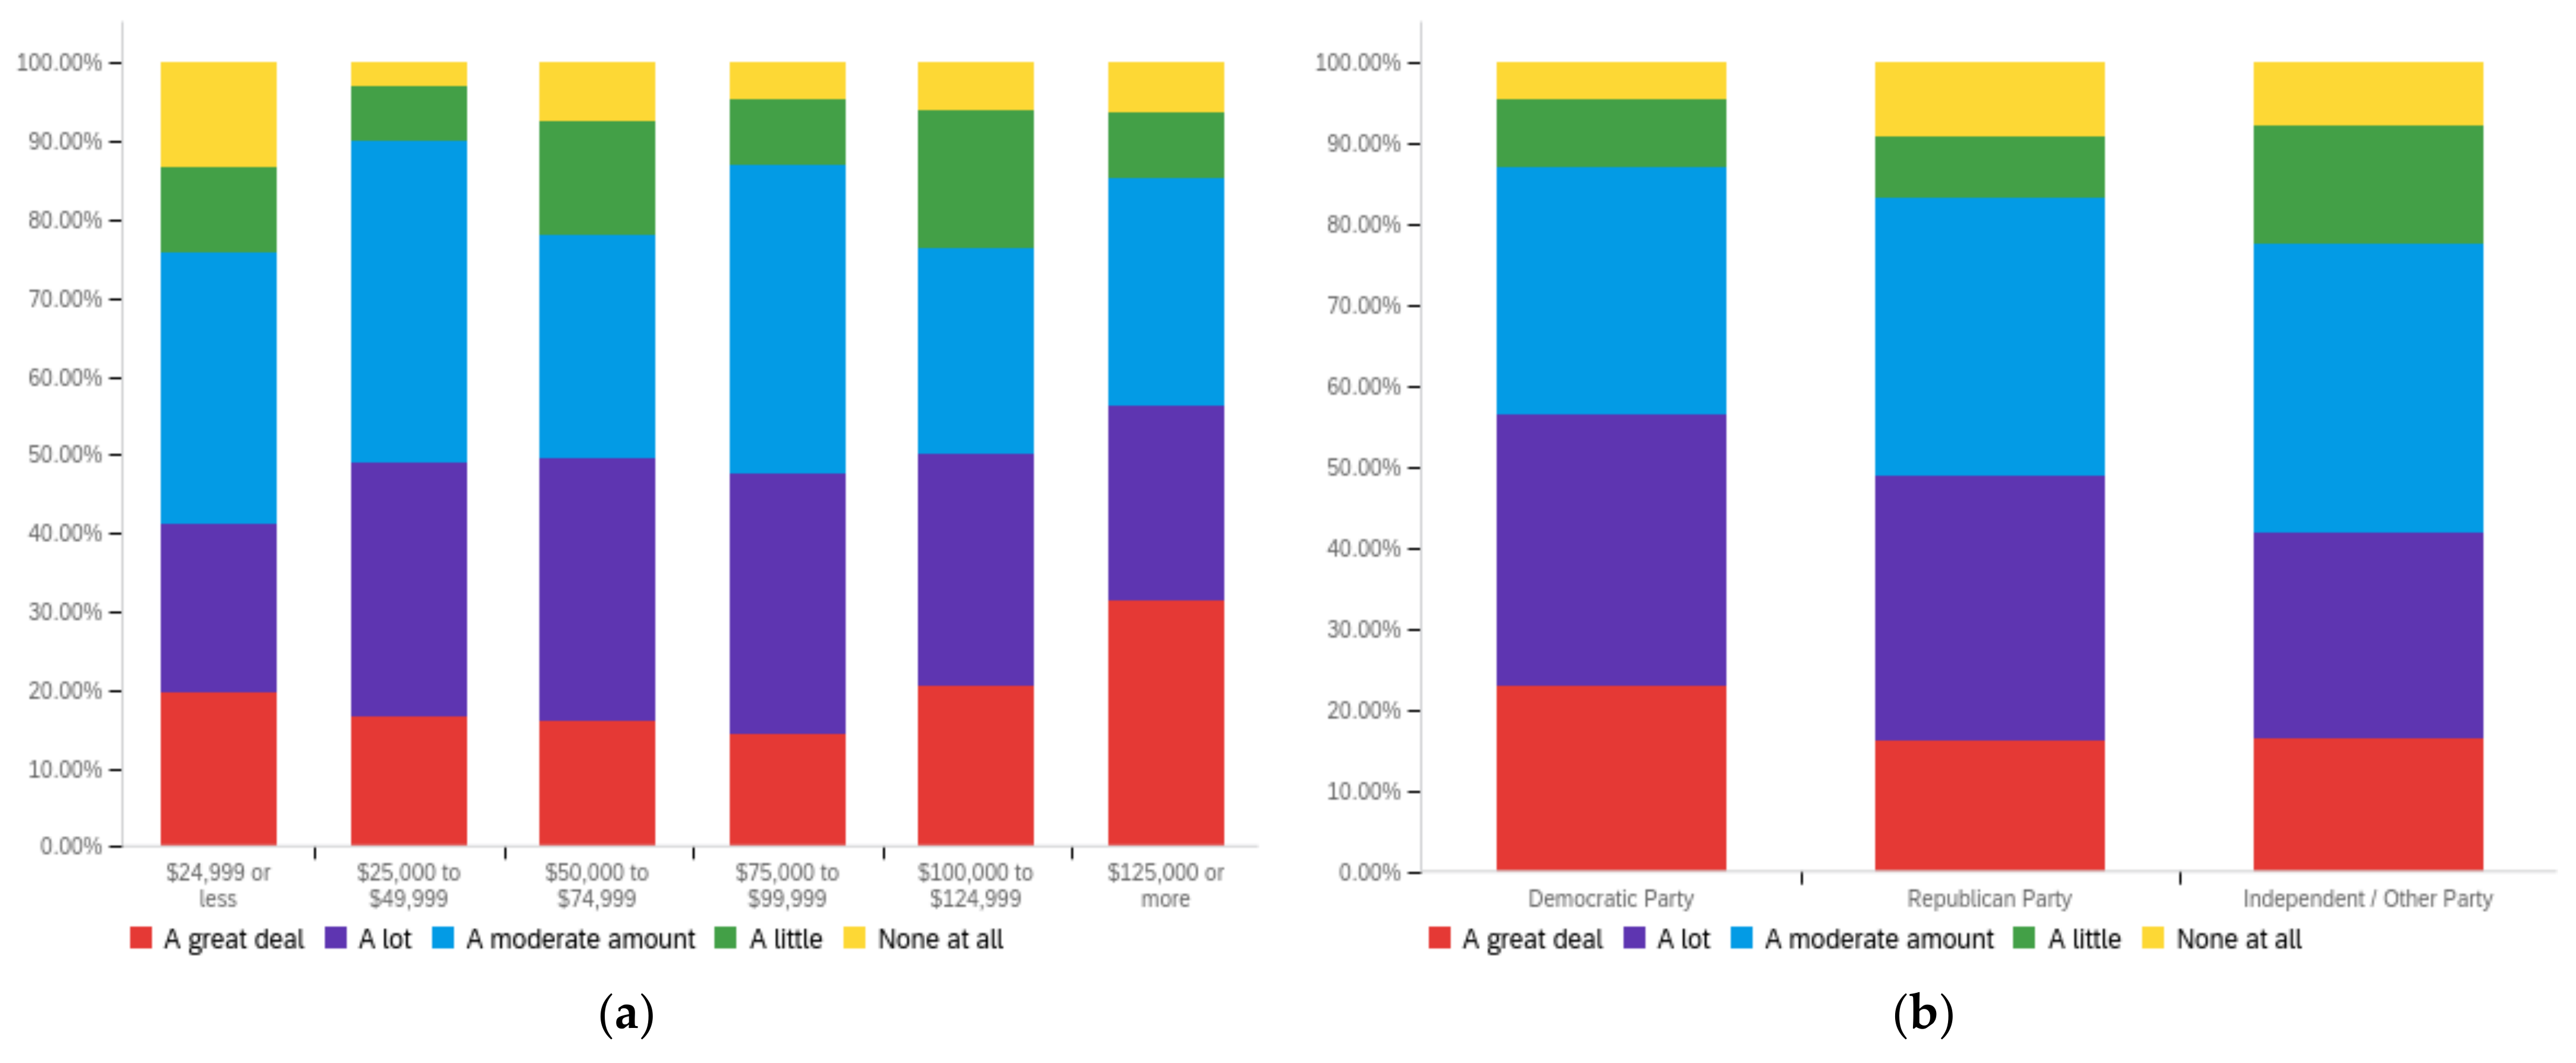
Futureinternet 14 00320 g0a7
Figure A8. Article publication date—others’ perception impact by: (a) income level (top left), (b) political affiliation (top right) and (c) online usage (bottom).
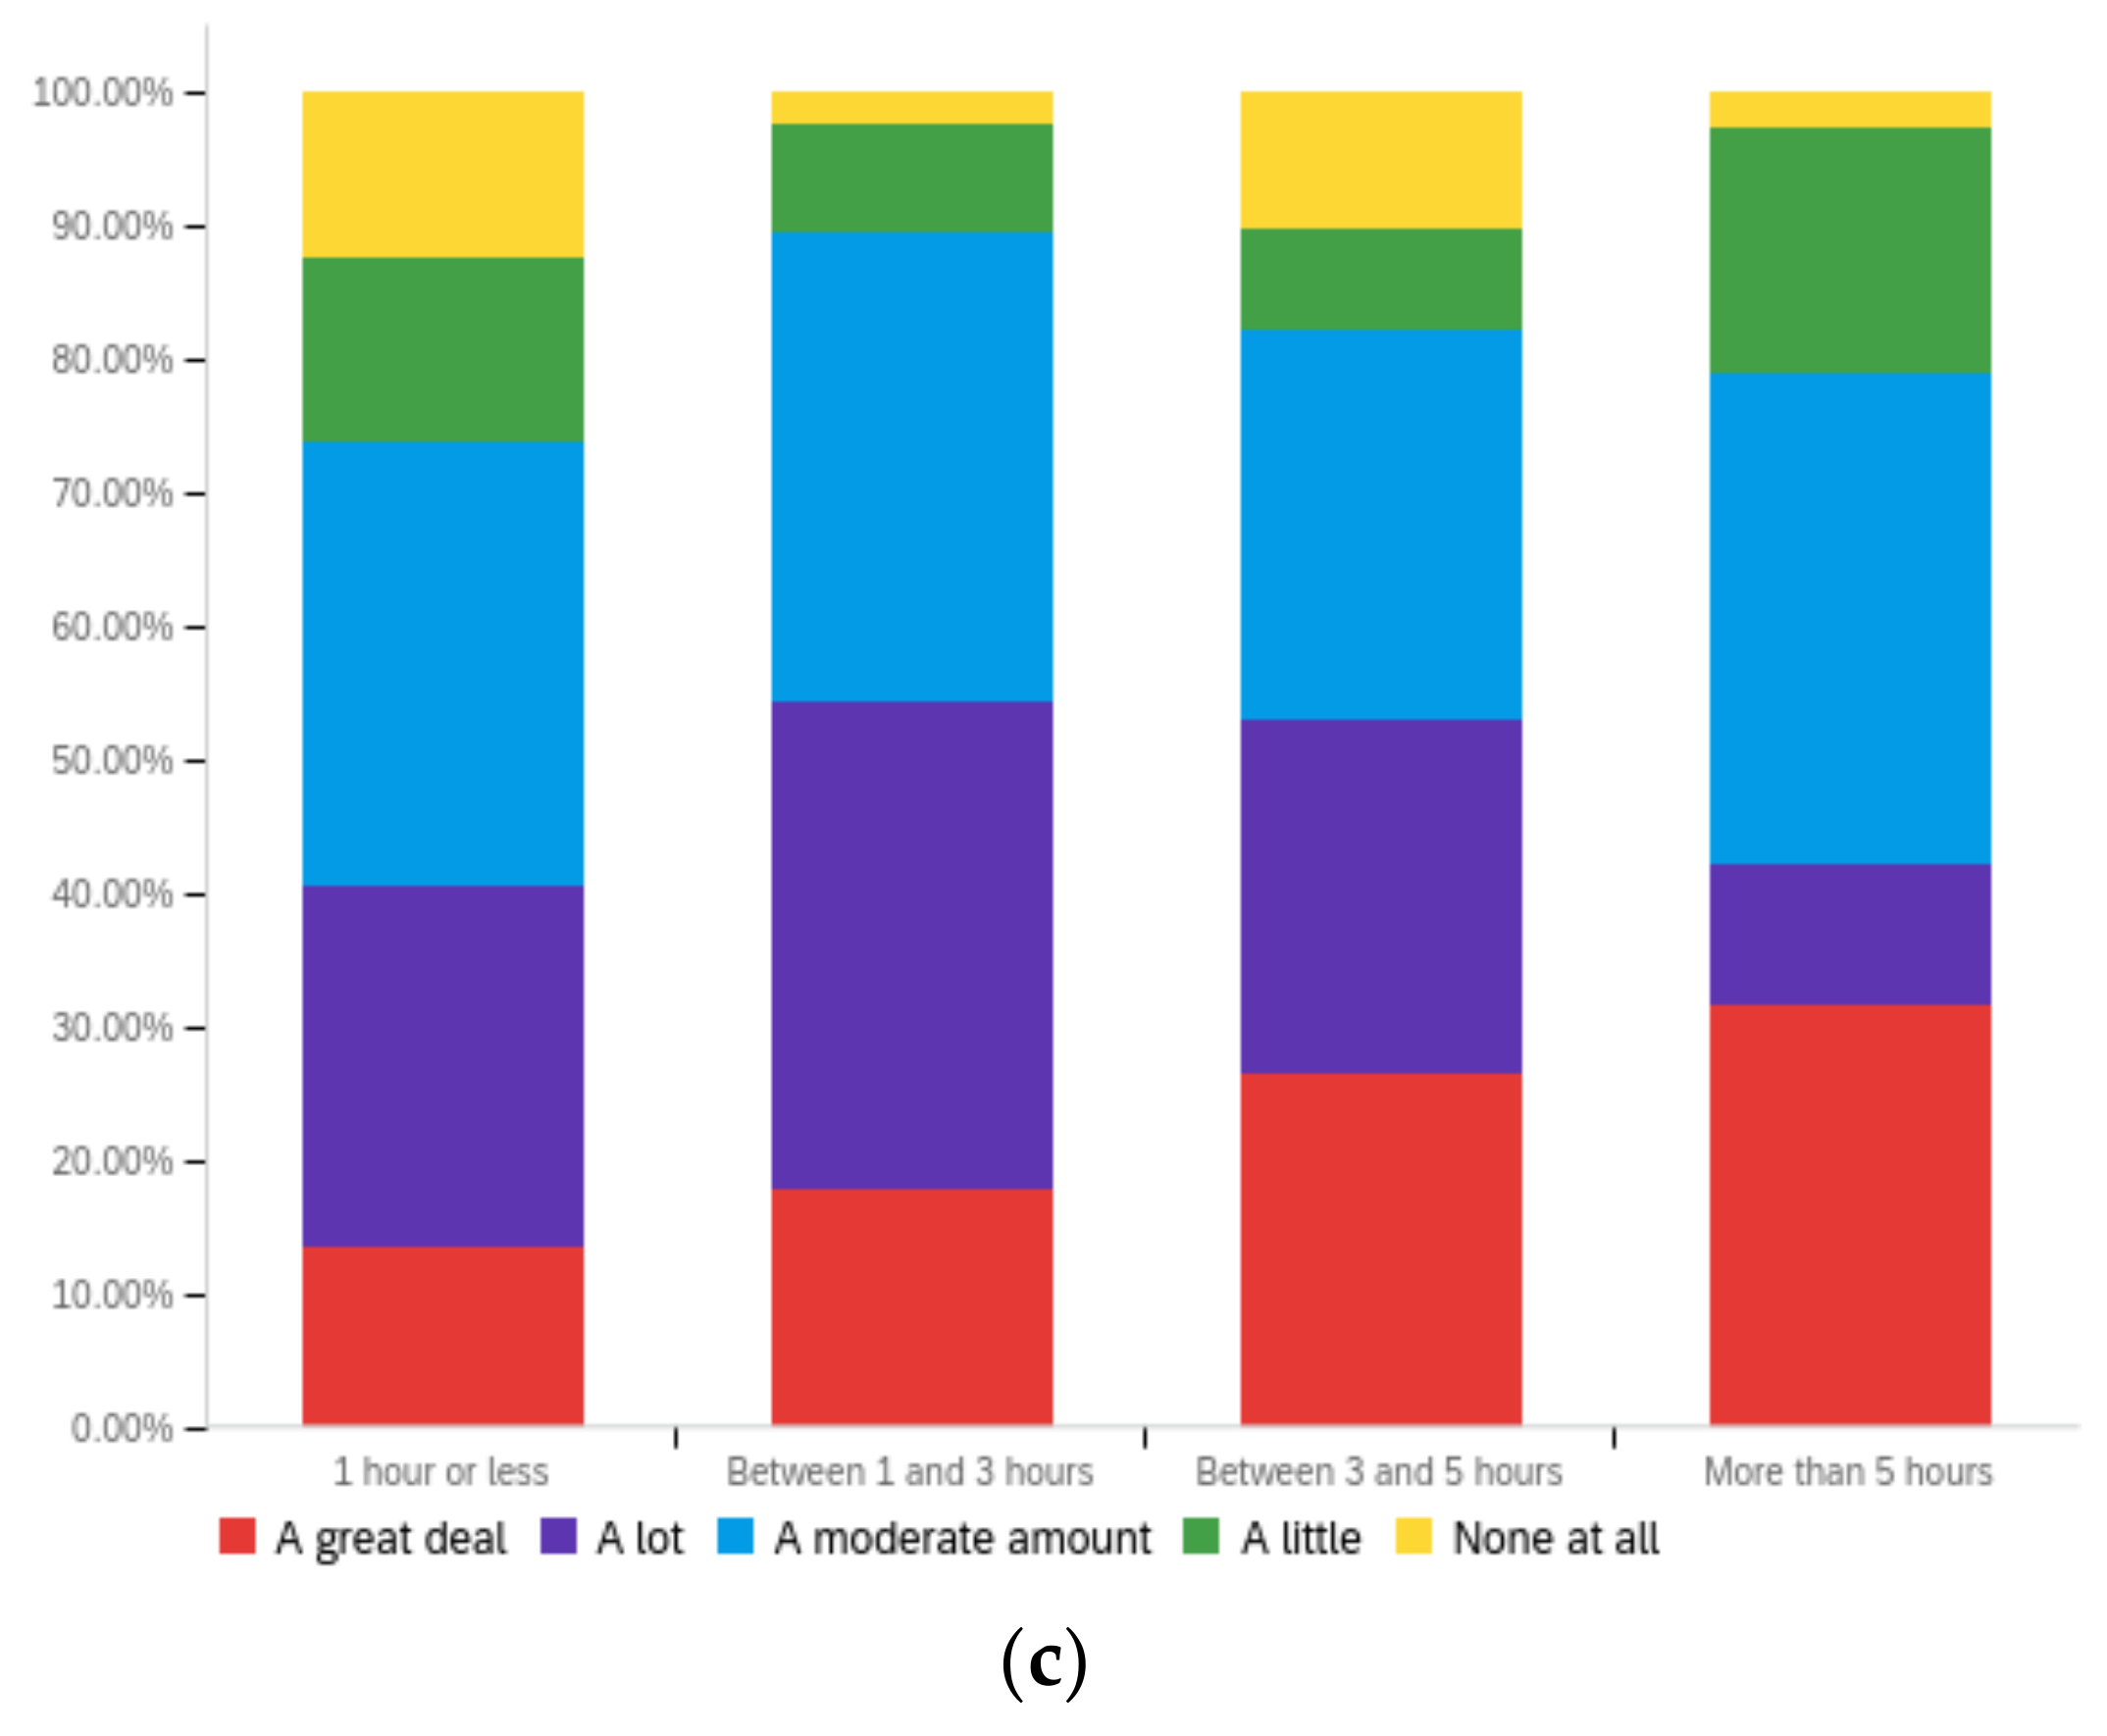
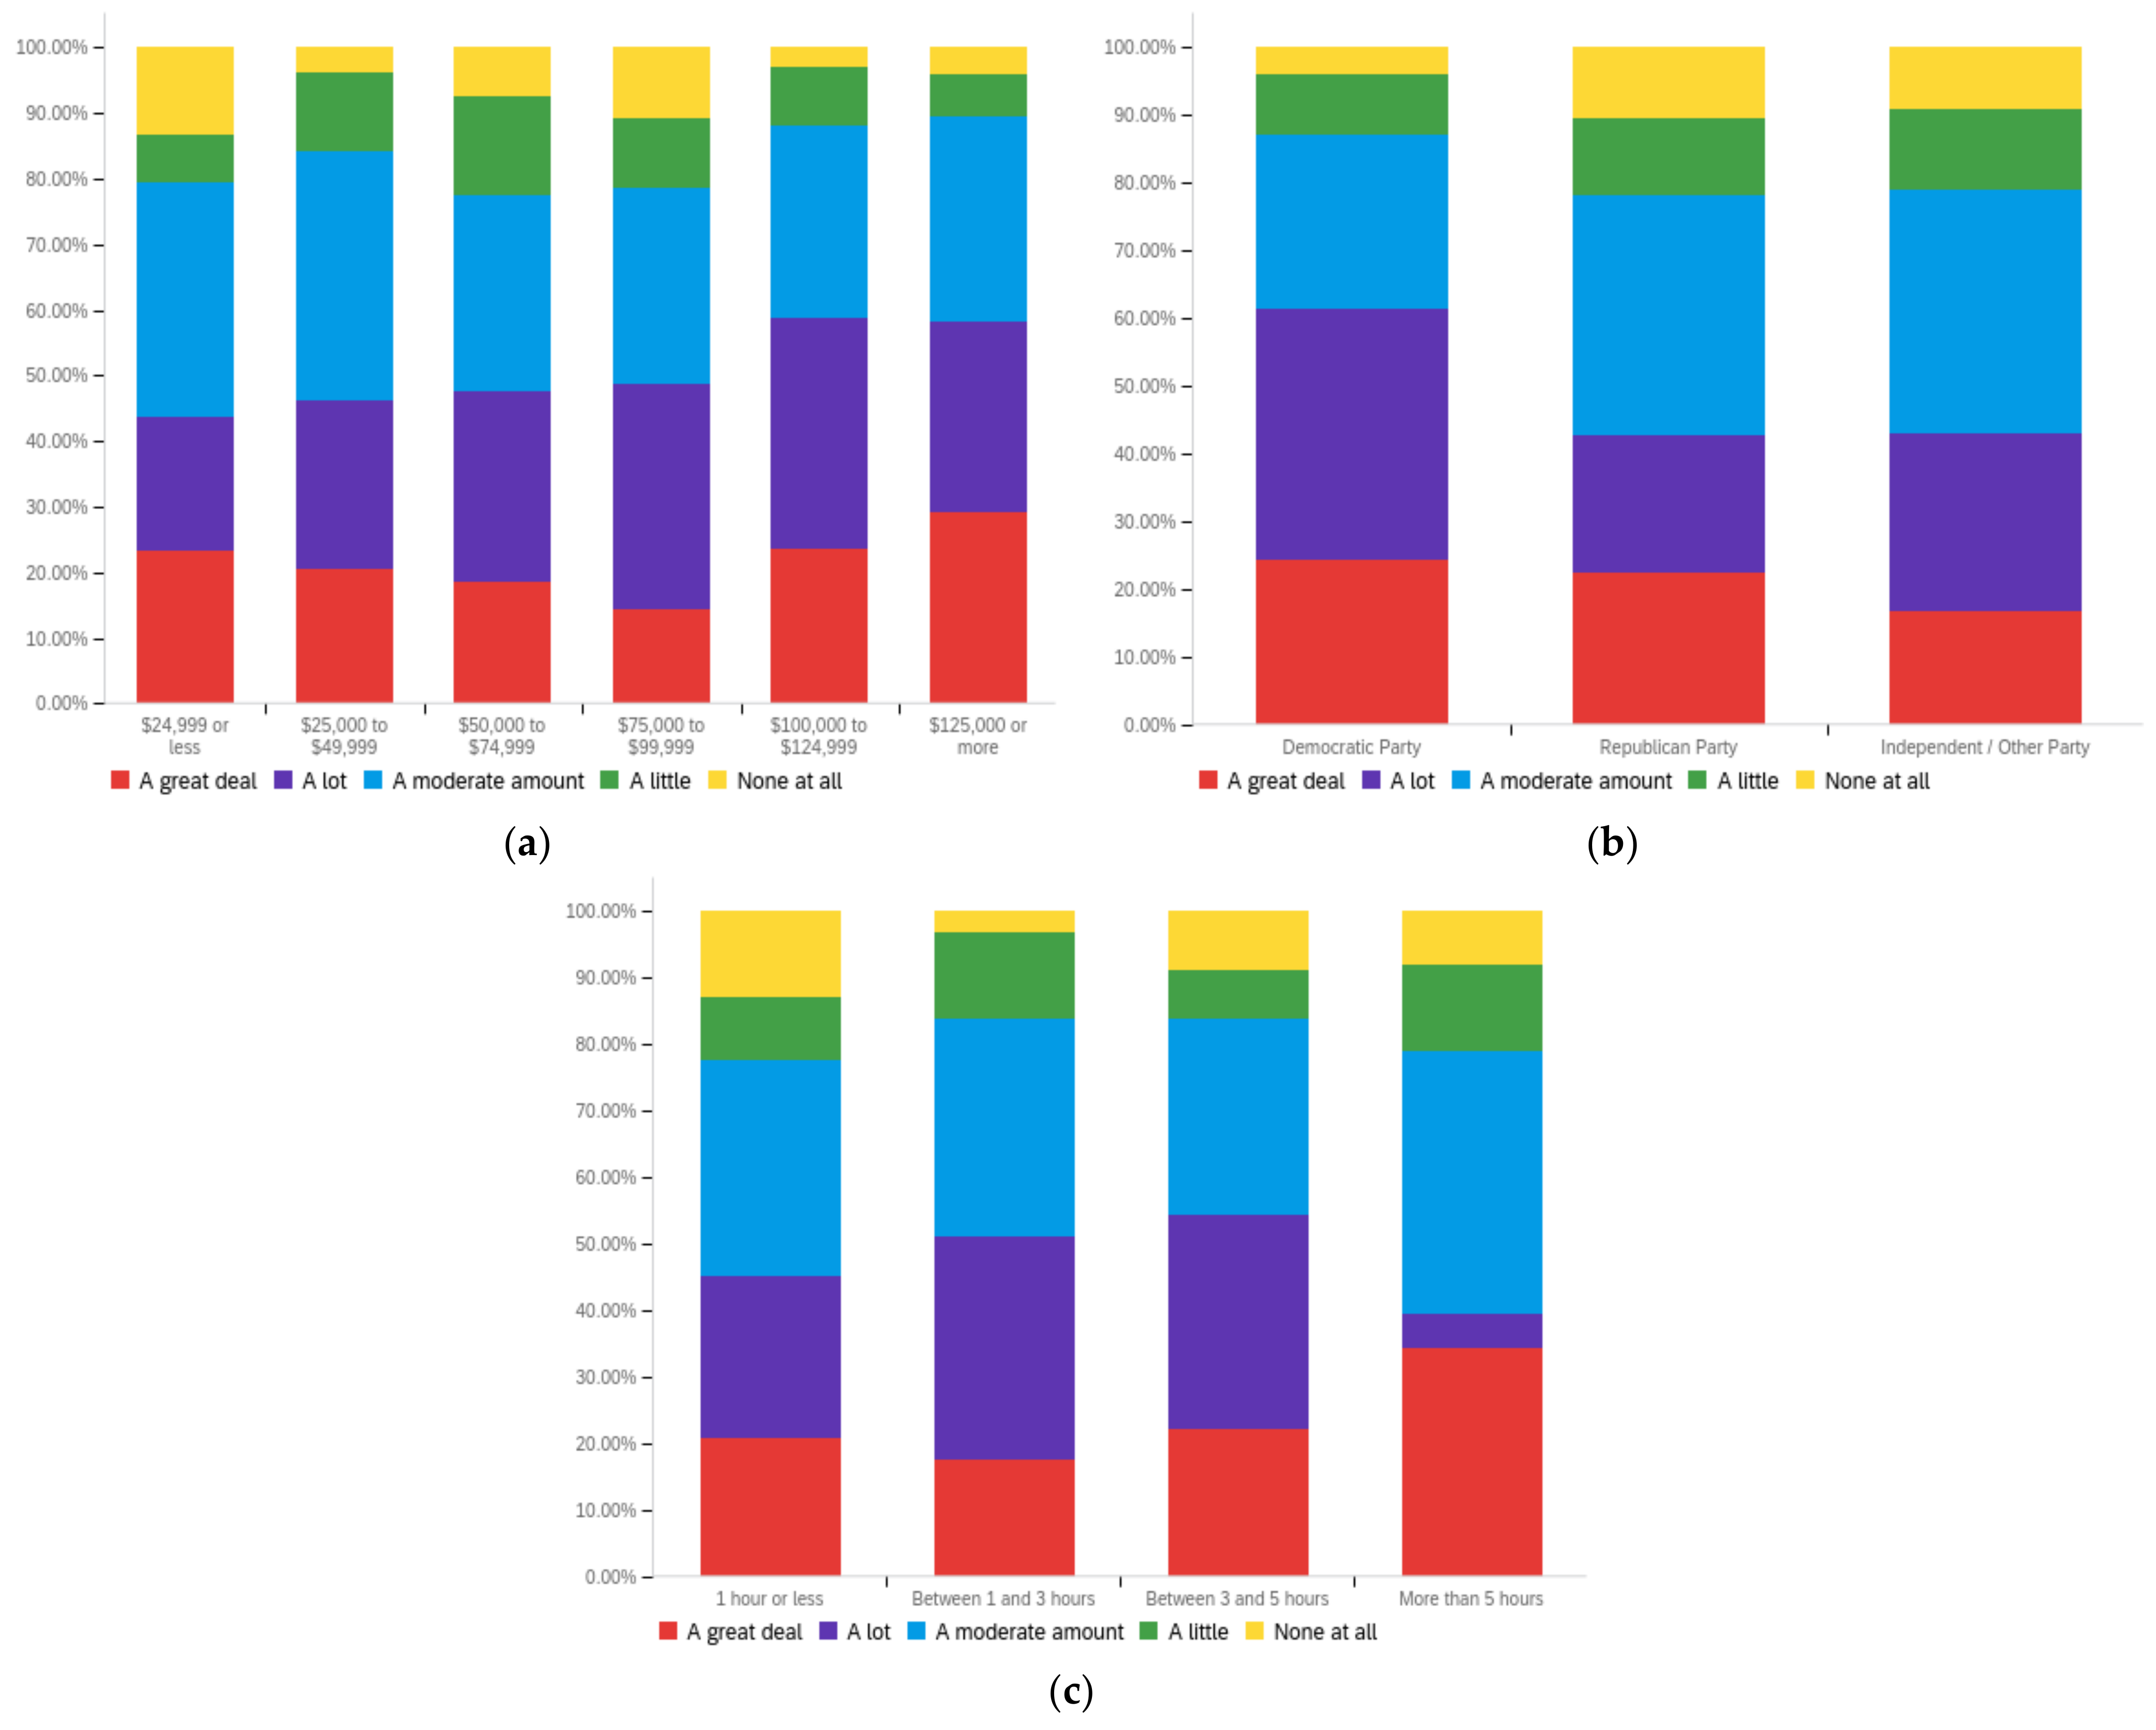
Futureinternet 14 00320 g0a8aFutureinternet 14 00320 g0a8b
Figure A9. Article publication date—ideal perception impact by: (a) income level (top left), (b) political affiliation (top right) and (c) online usage (bottom).
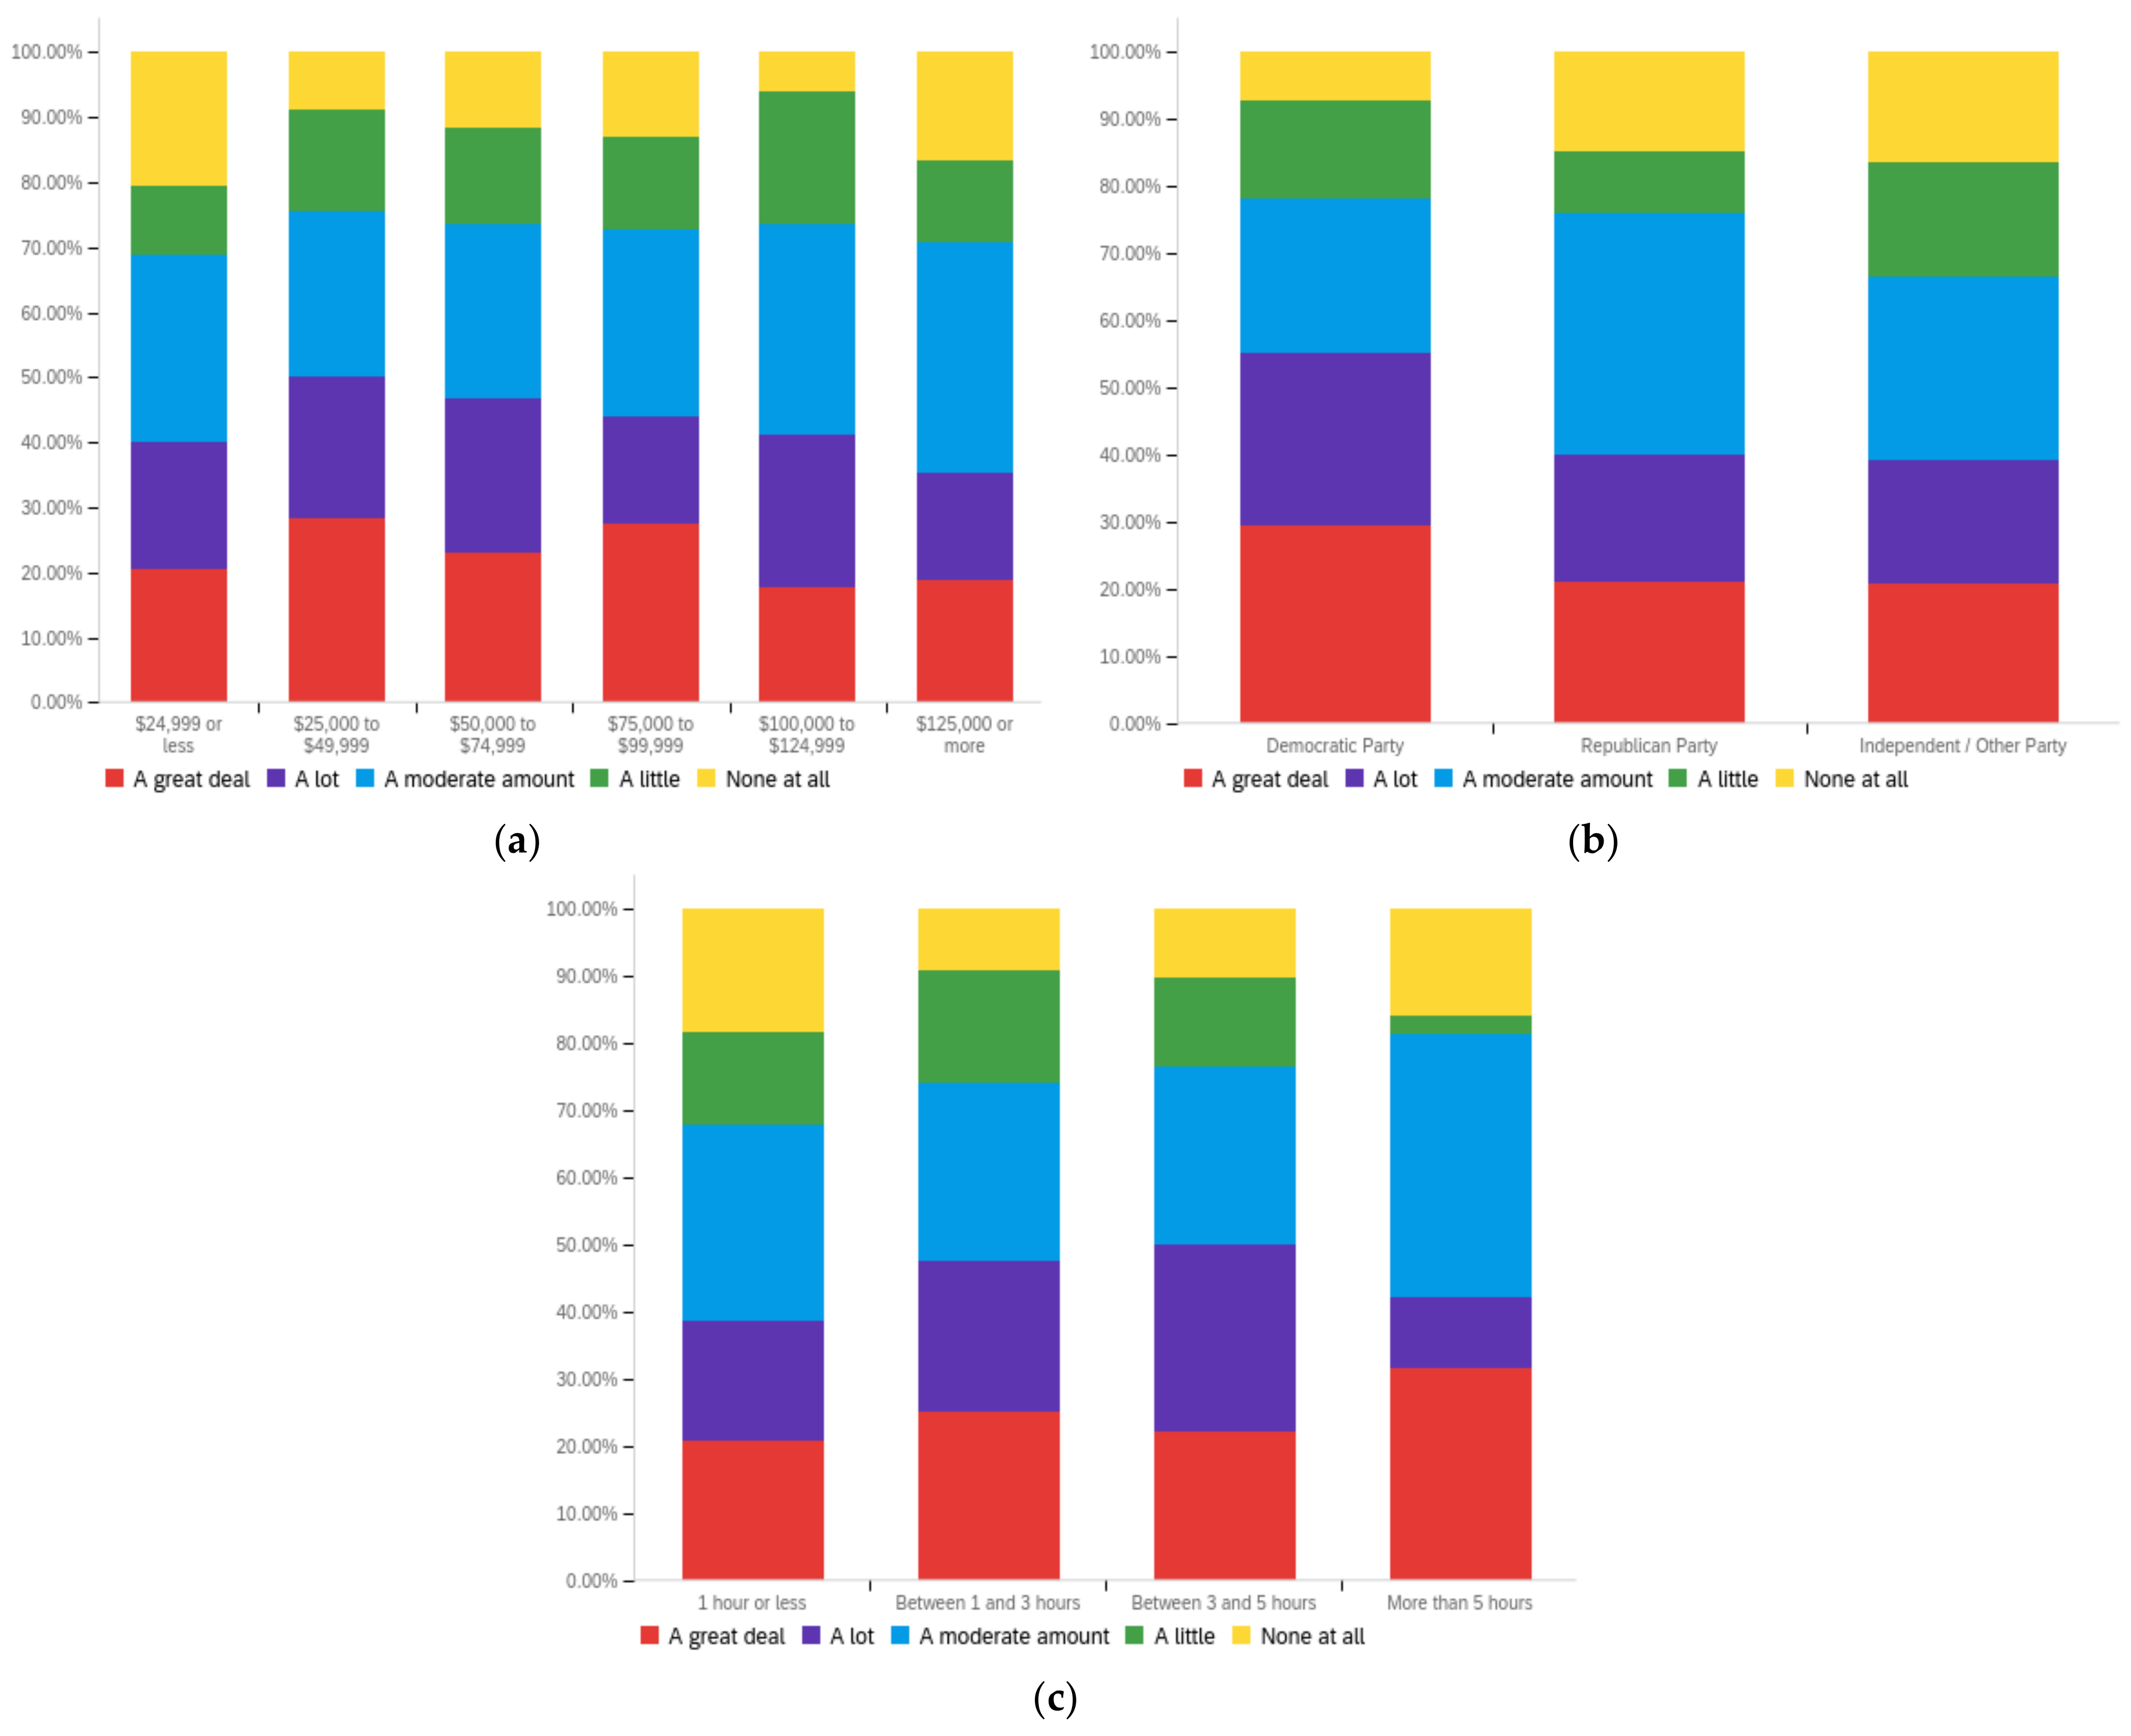
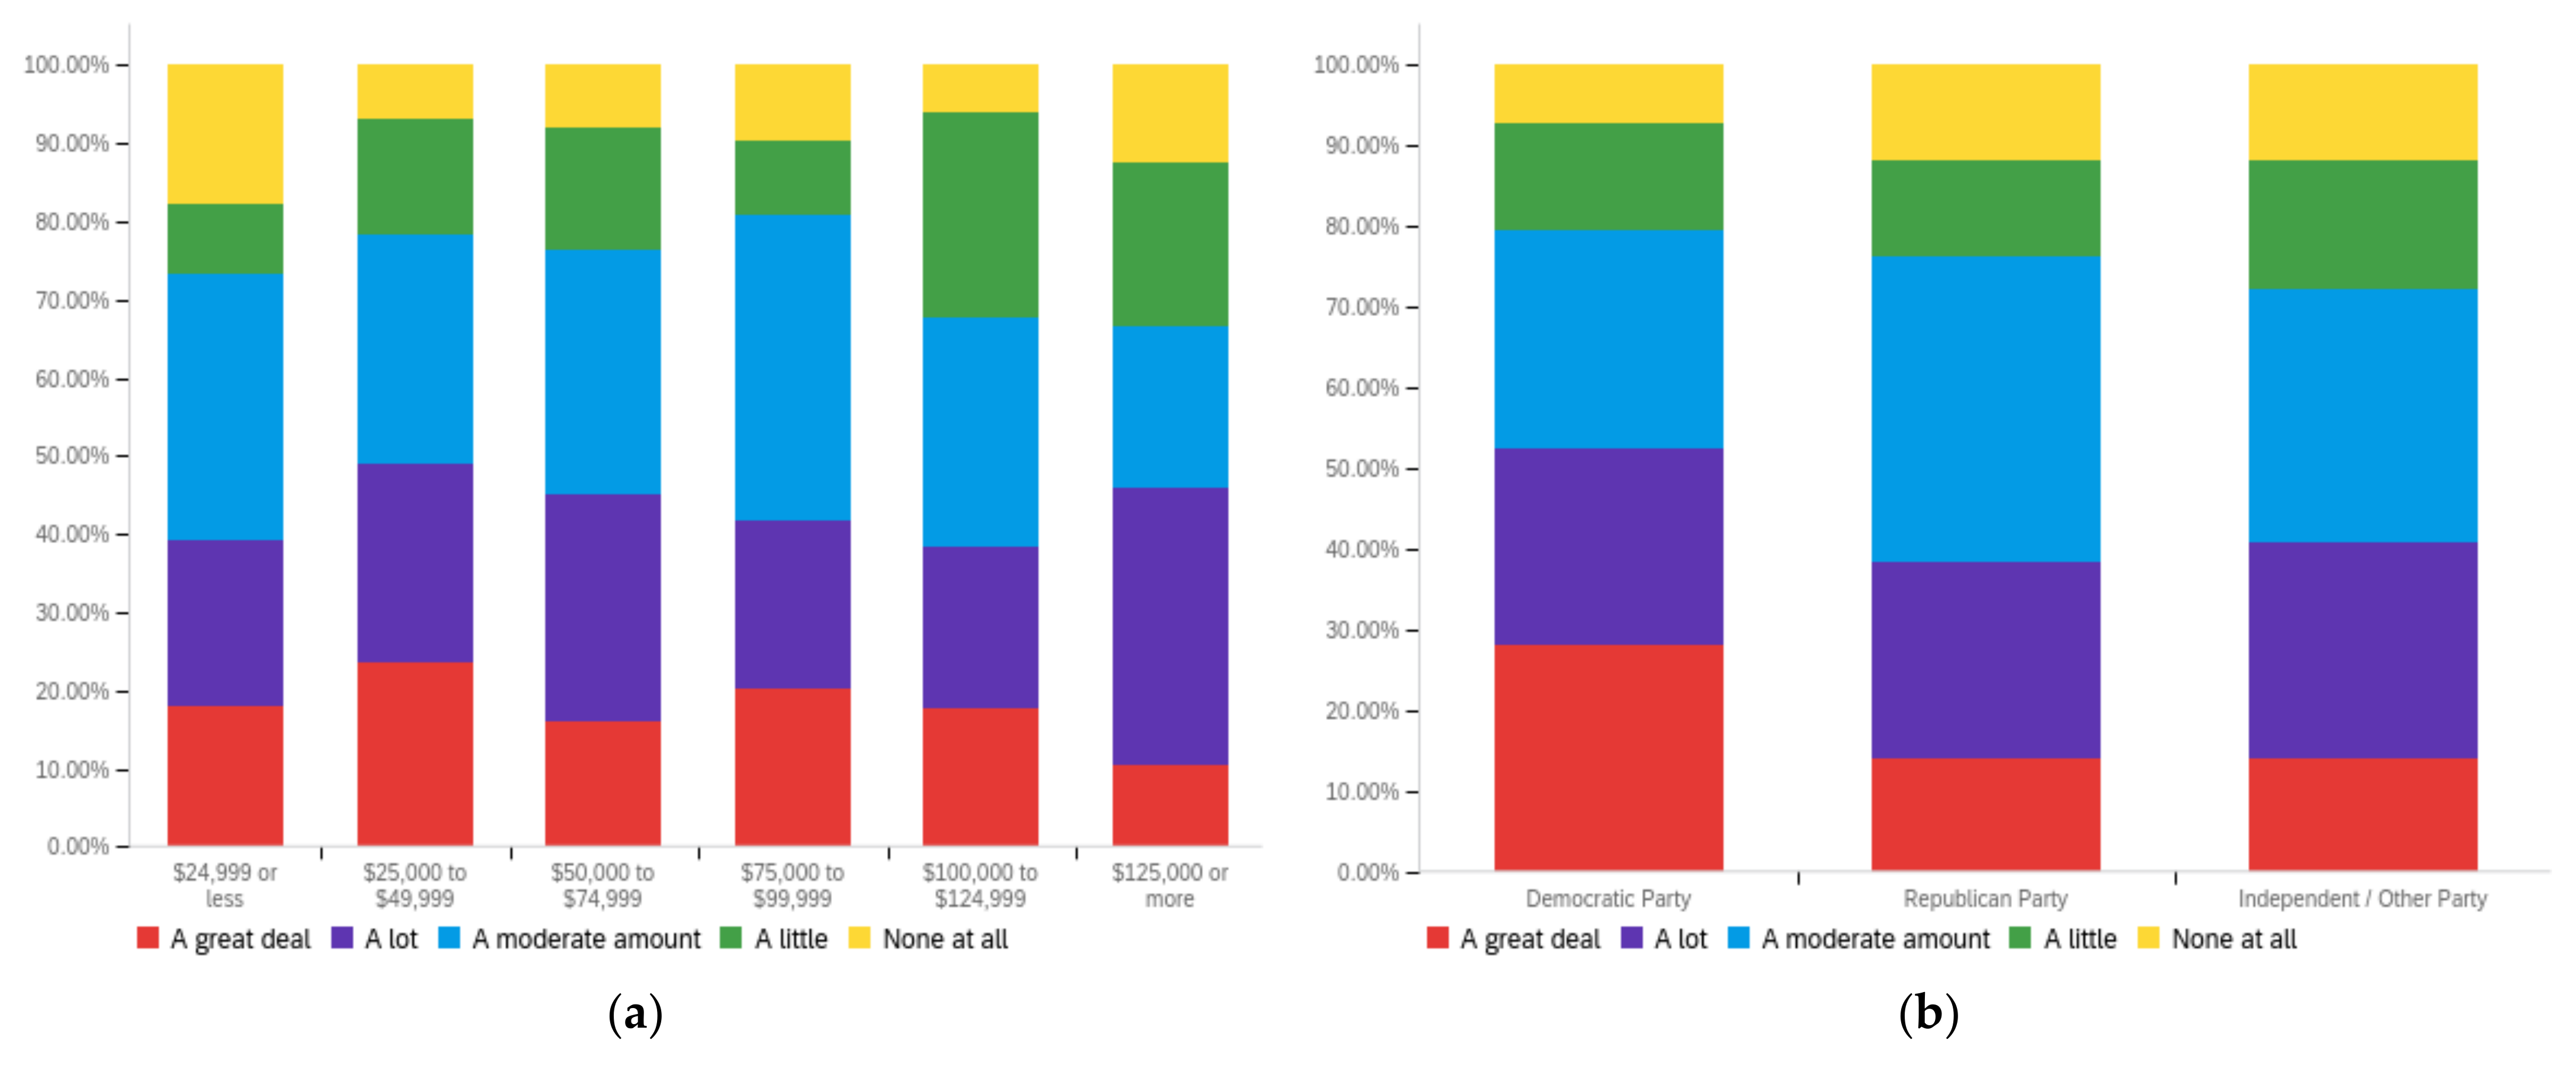
Futureinternet 14 00320 g0a9
Figure A10. Article author—personal perception impact by: (a) income level (top left), (b) political affiliation (top right) and (c) online usage (bottom).
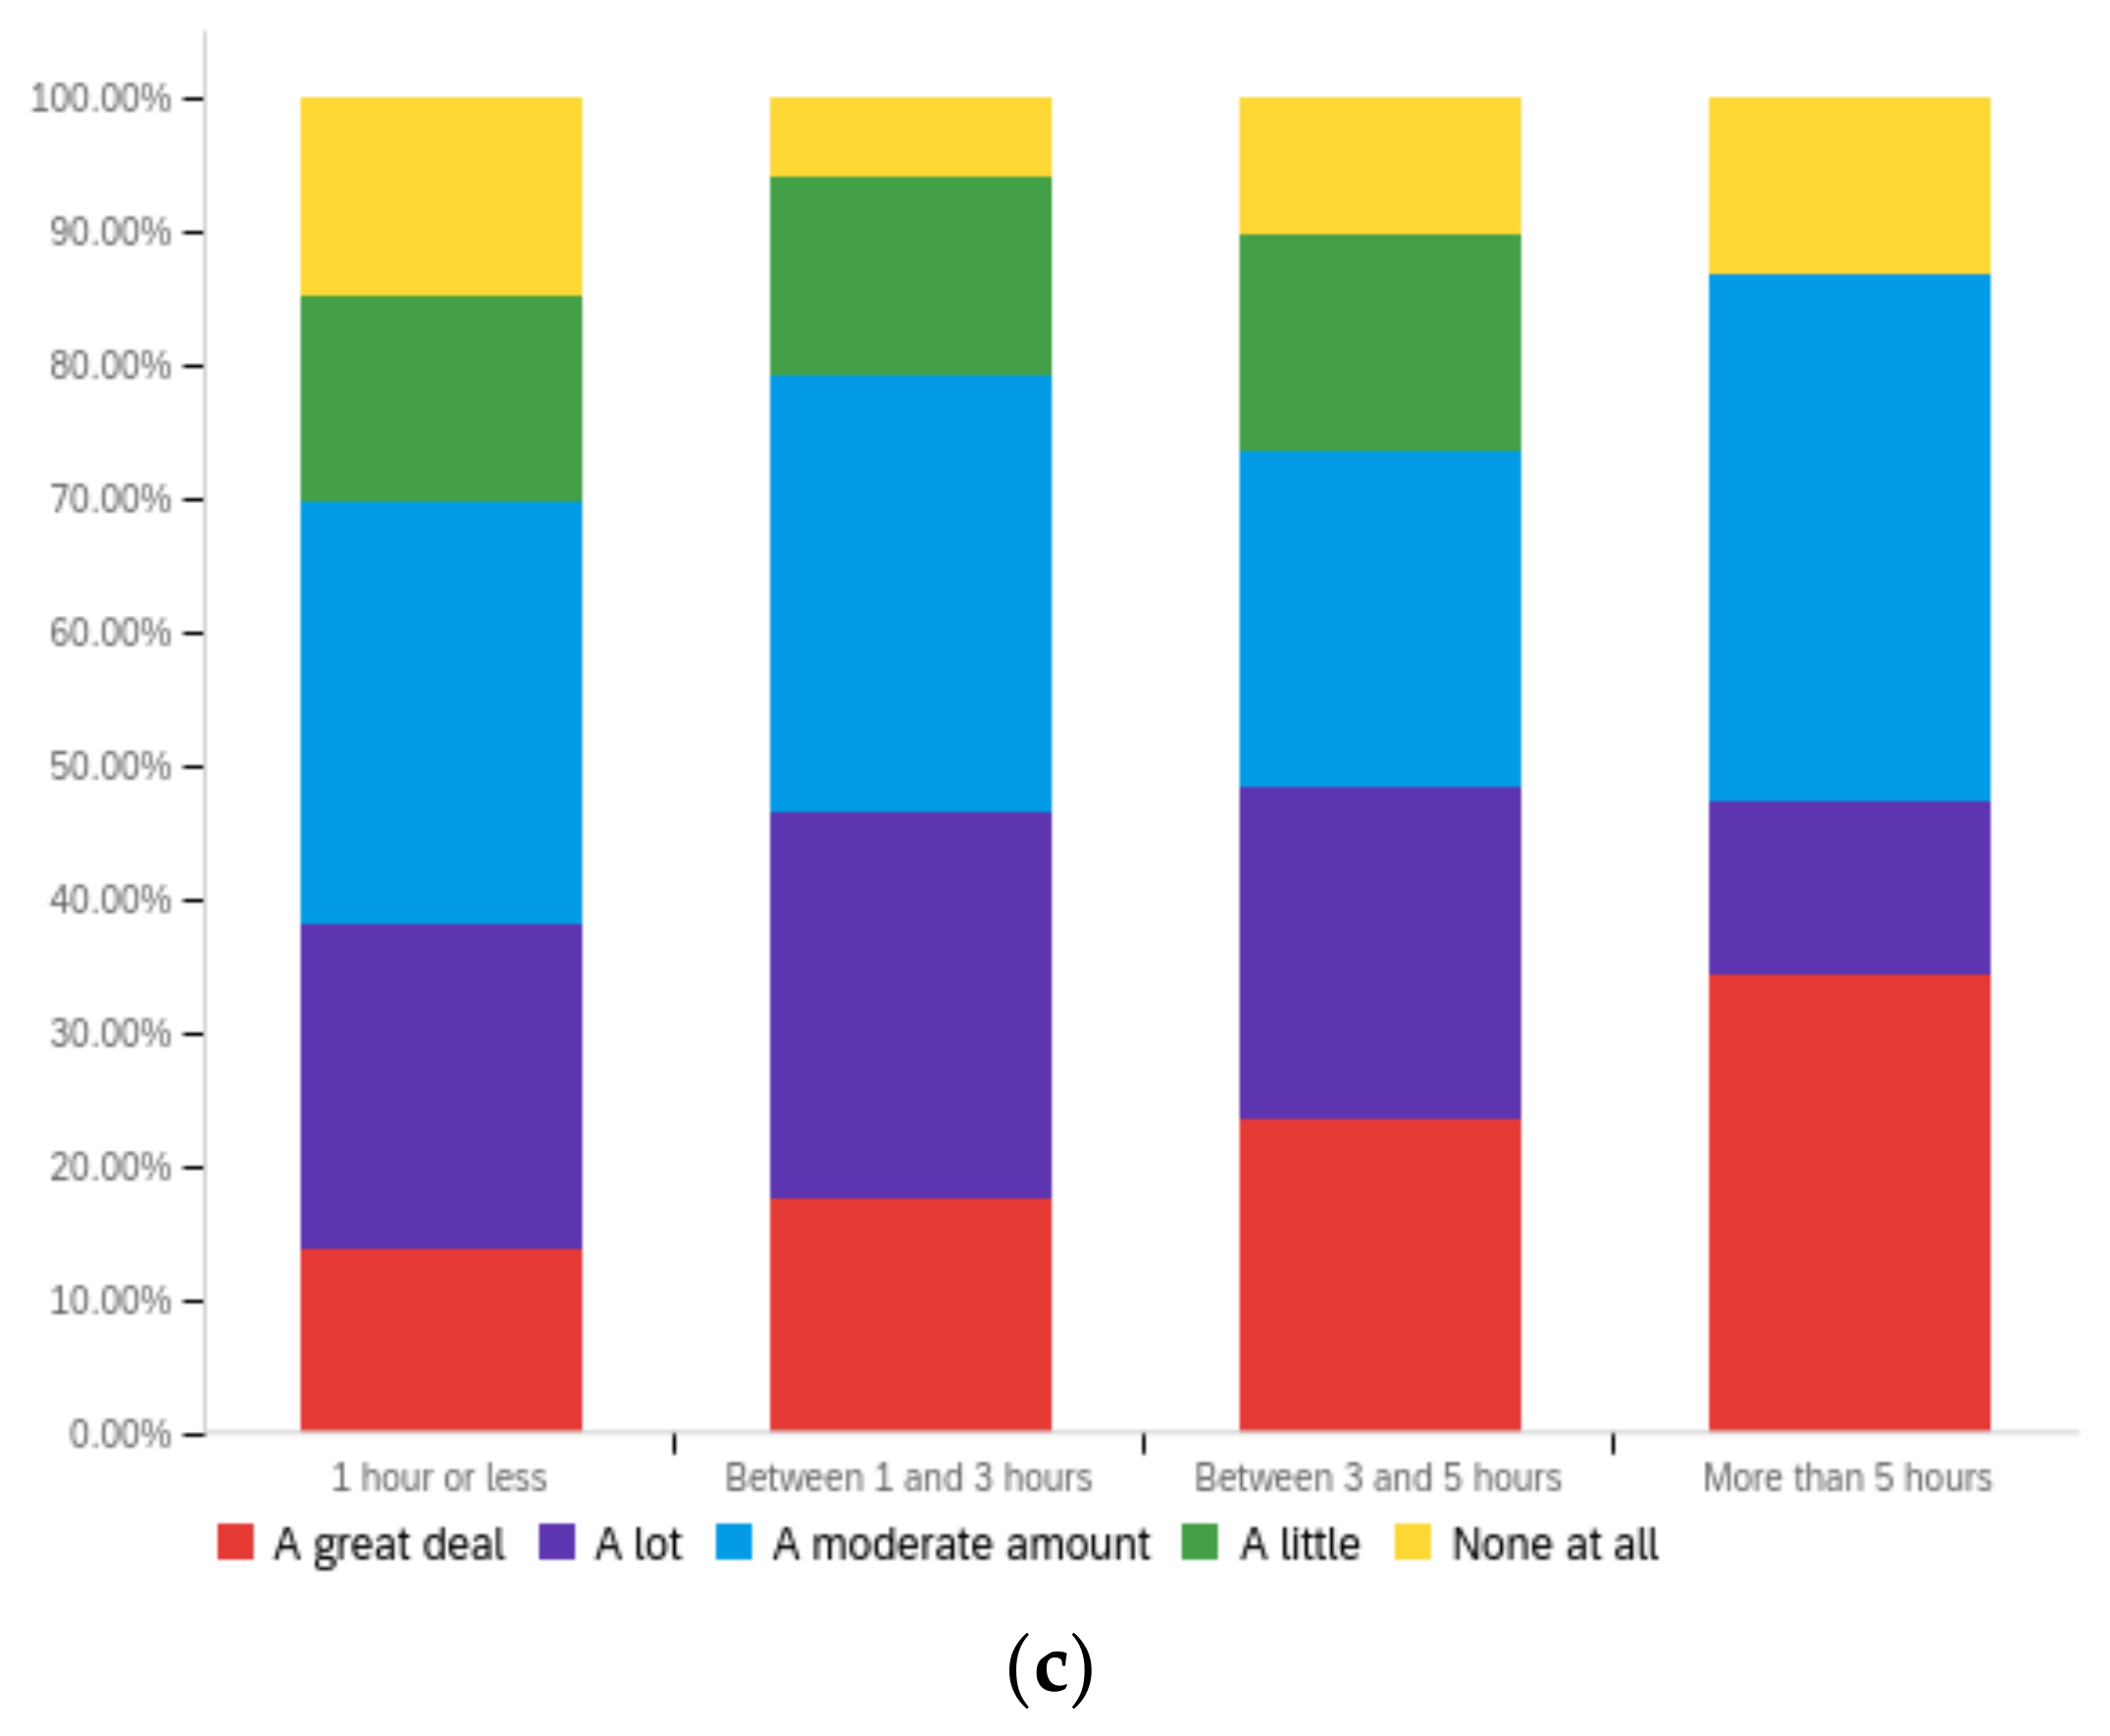
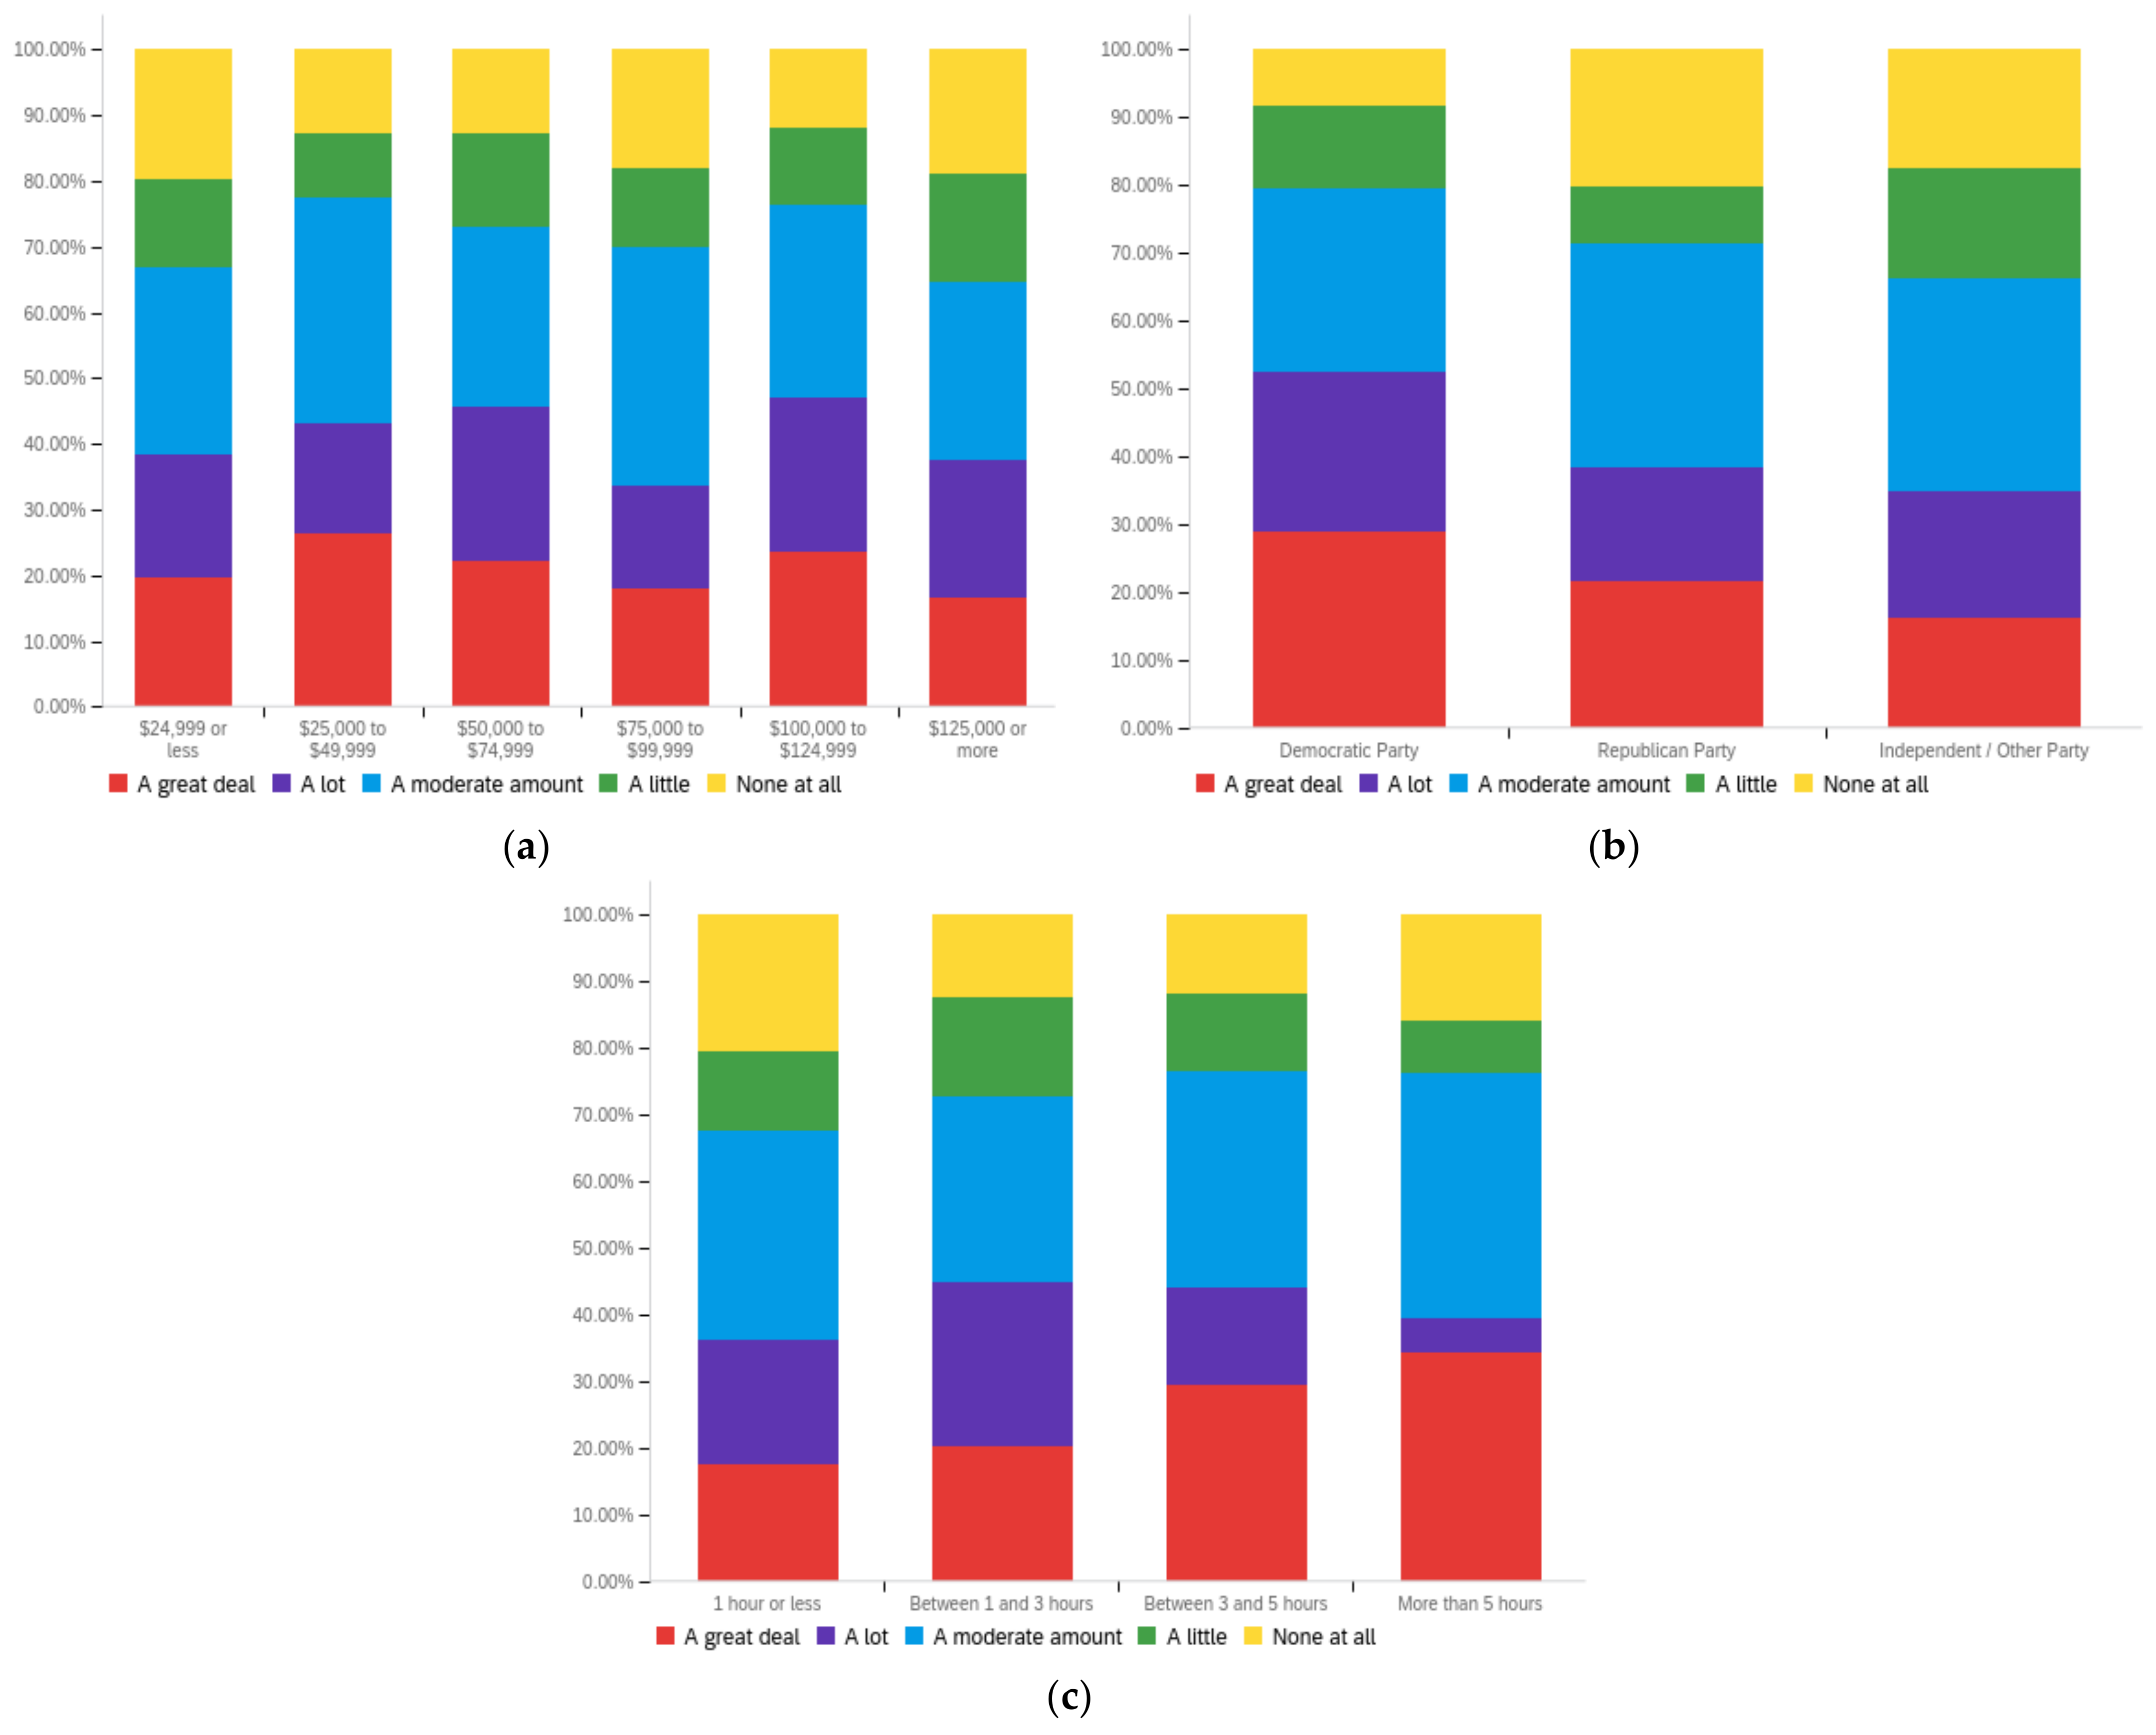
Futureinternet 14 00320 g0a10
Figure A11. Article author—others’ perception impact by: (a) income level (top left), (b) political affiliation (top right) and (c) online usage (bottom).
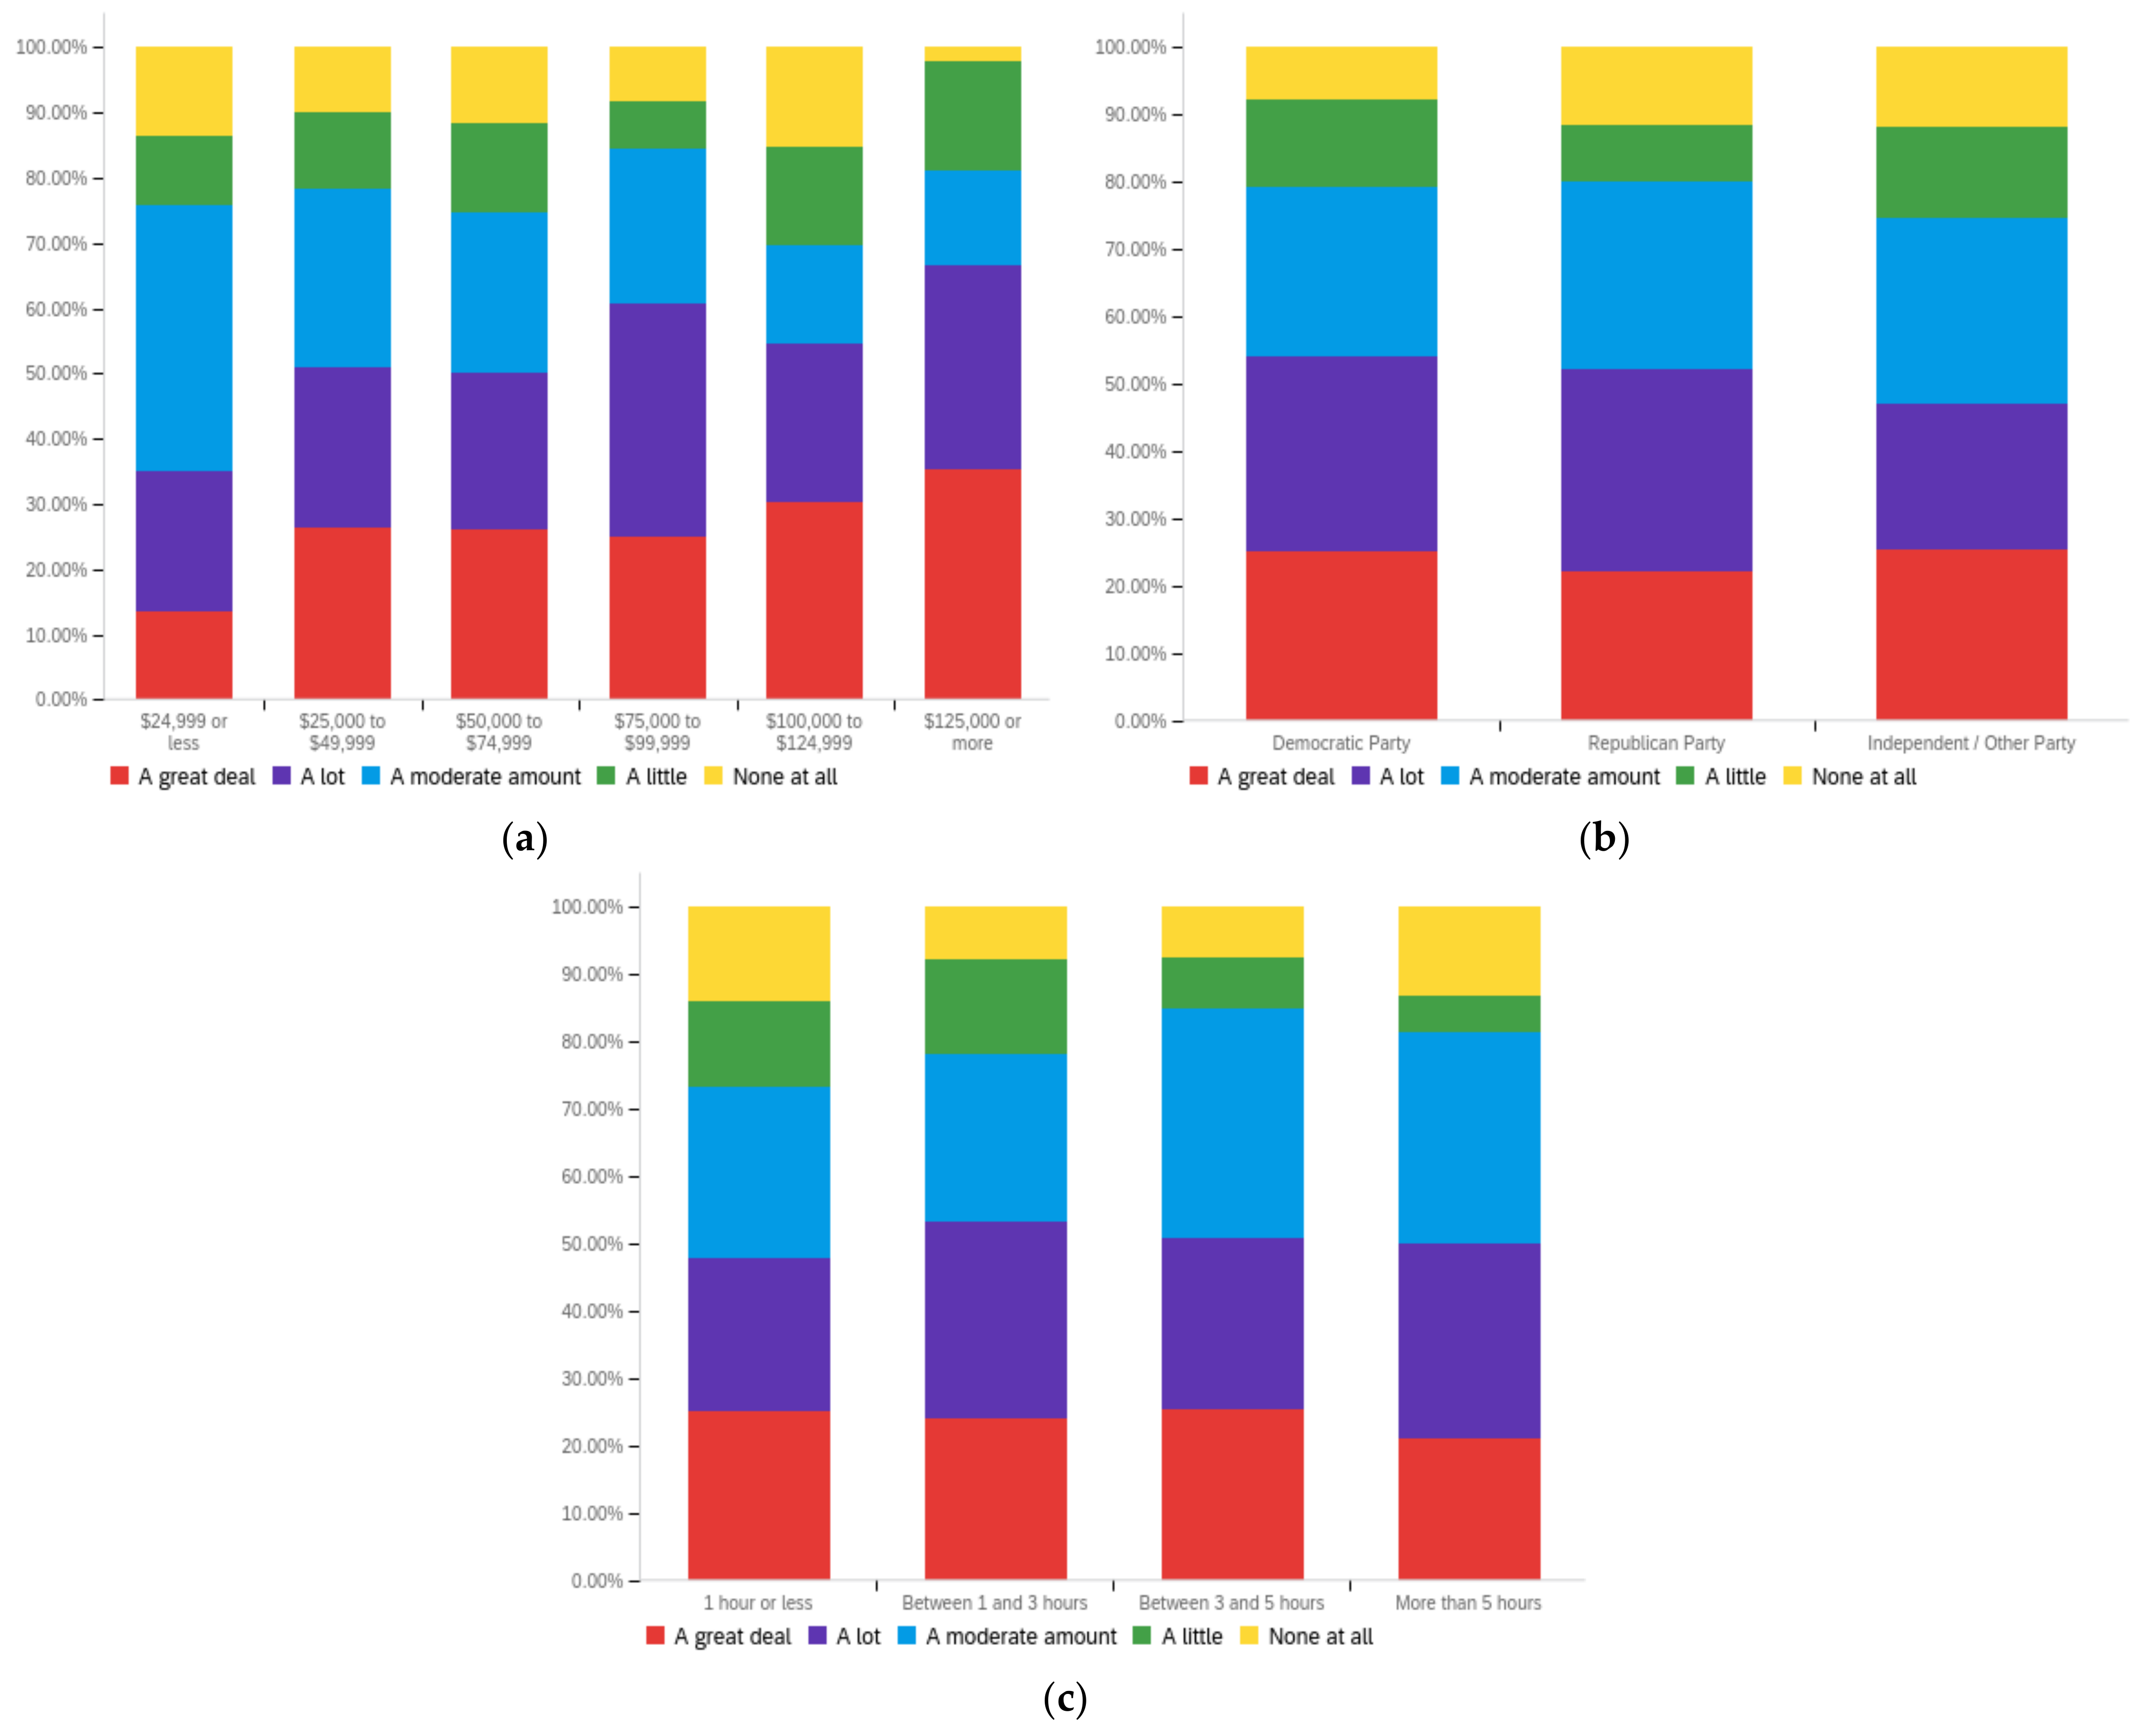
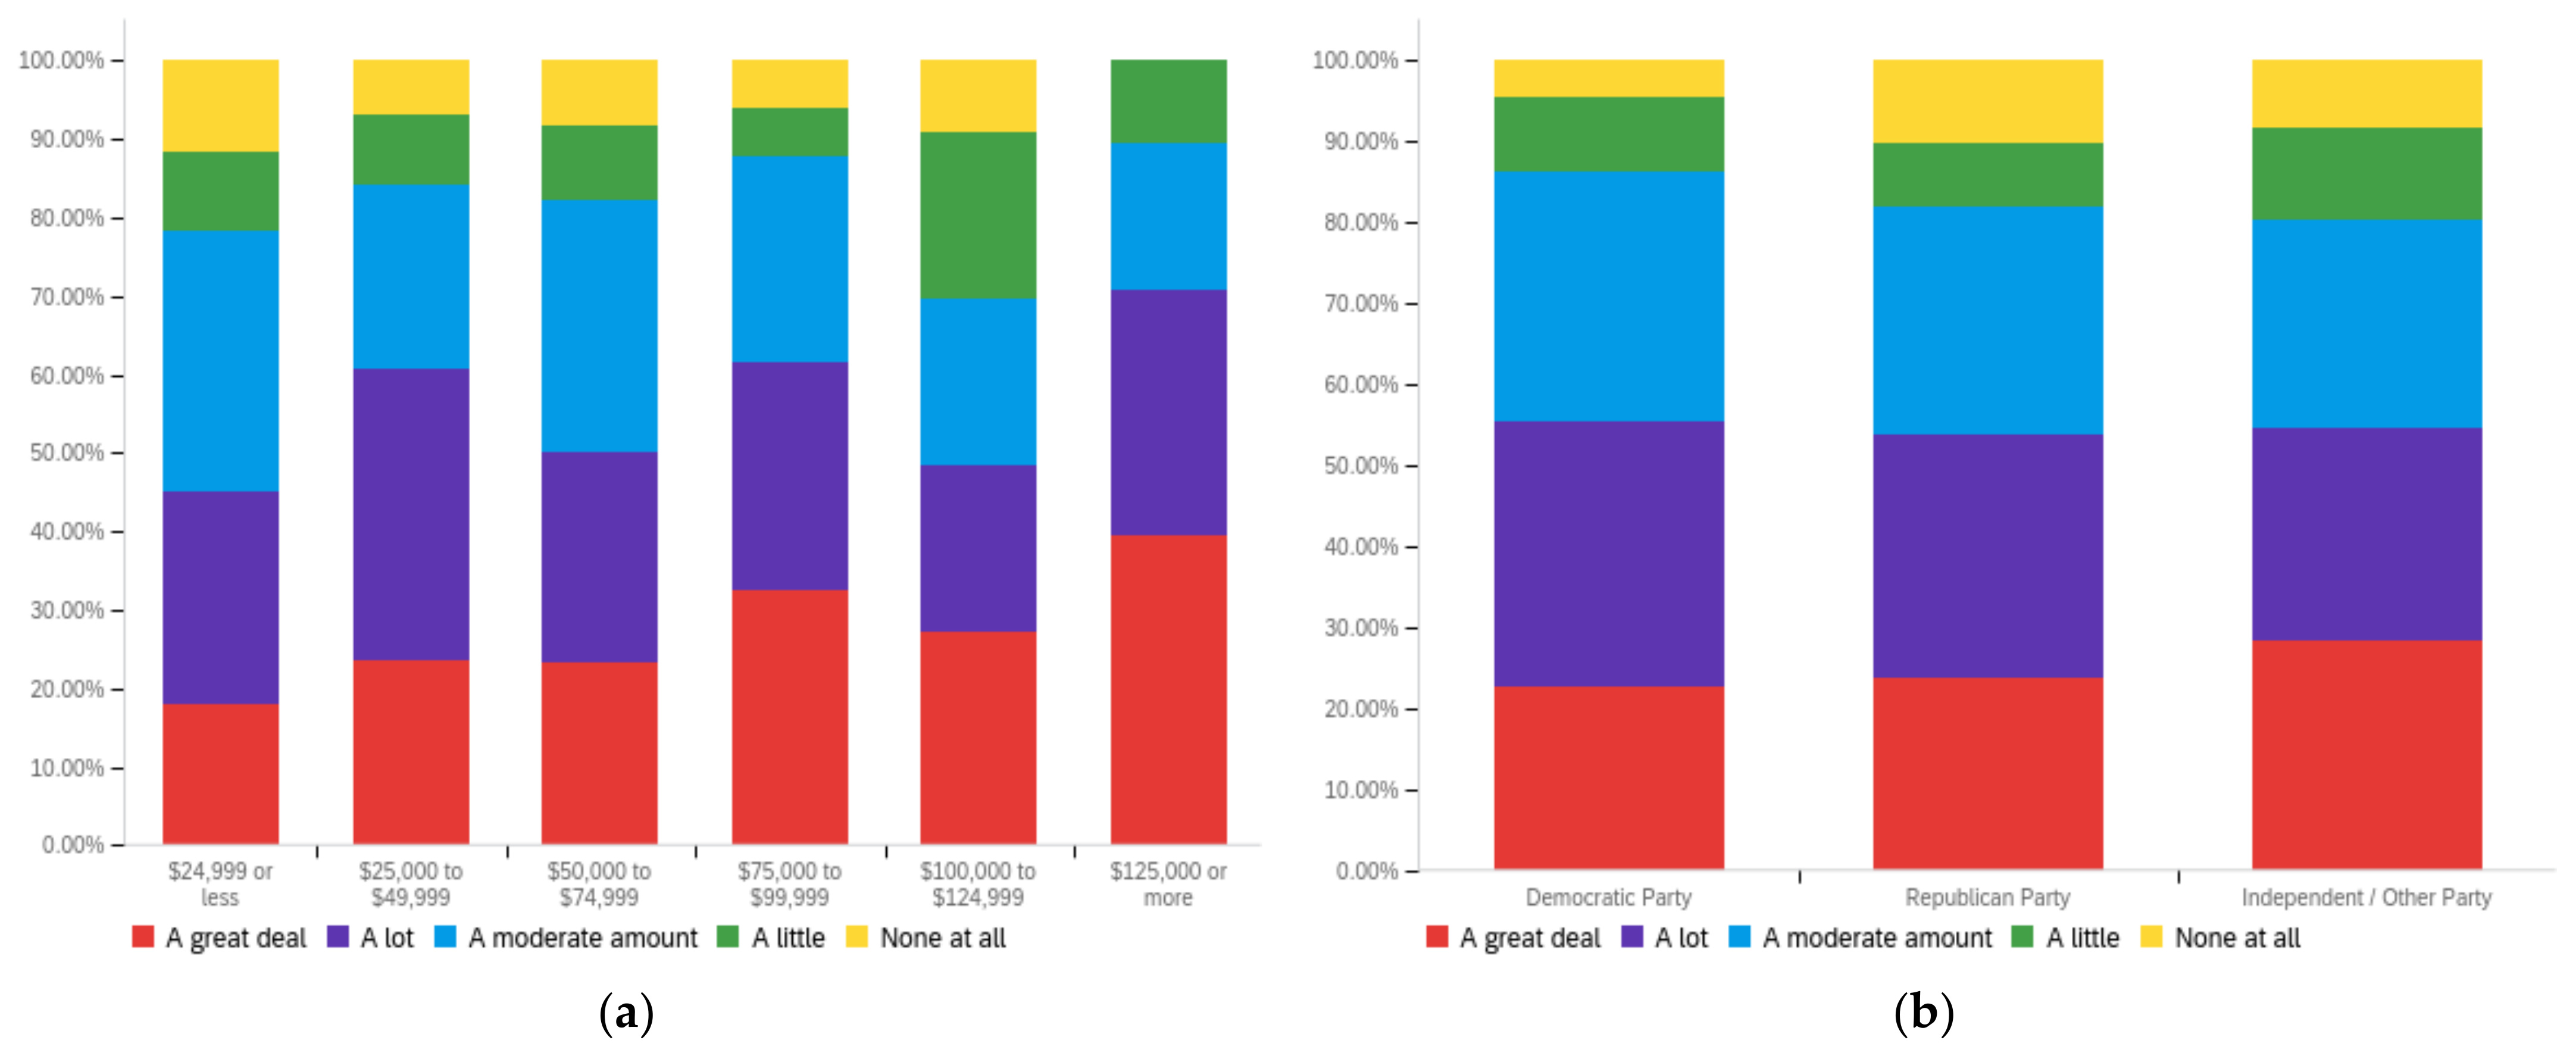
Futureinternet 14 00320 g0a11aFutureinternet 14 00320 g0a11b
Figure A12. Article author—ideal perception impact by: (a) income level (top left), (b) political affiliation (top right) and (c) online usage (bottom).
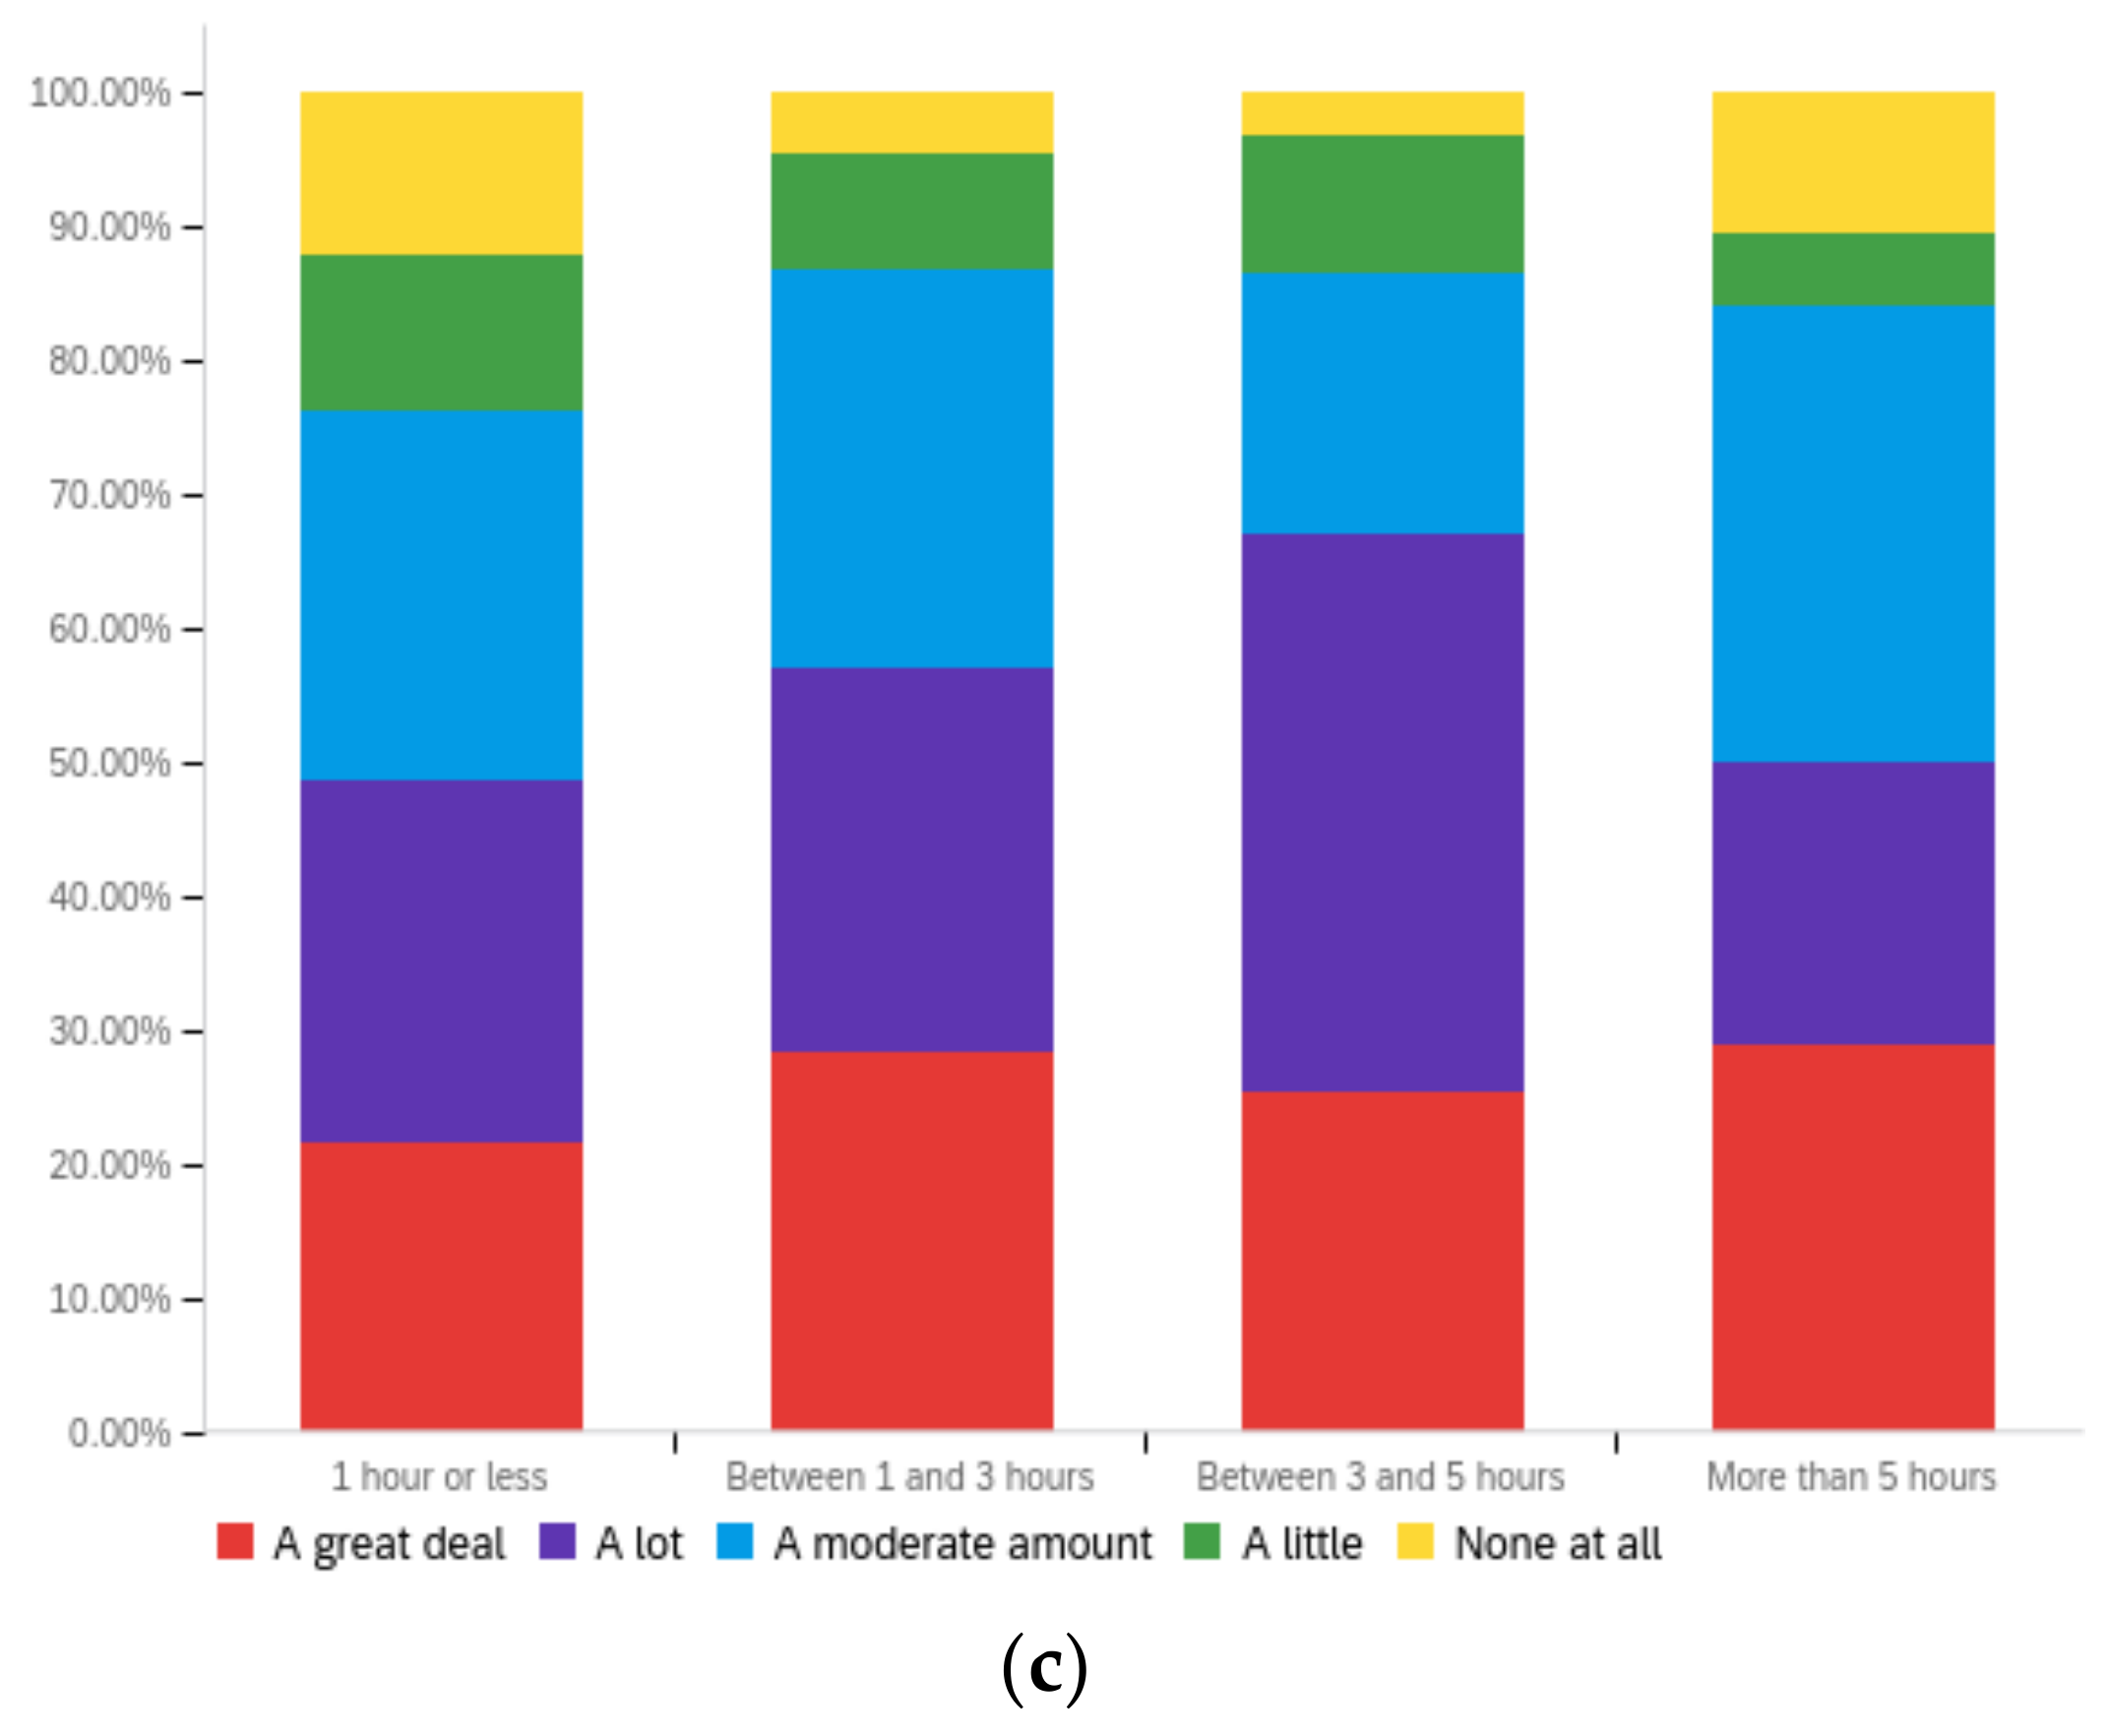
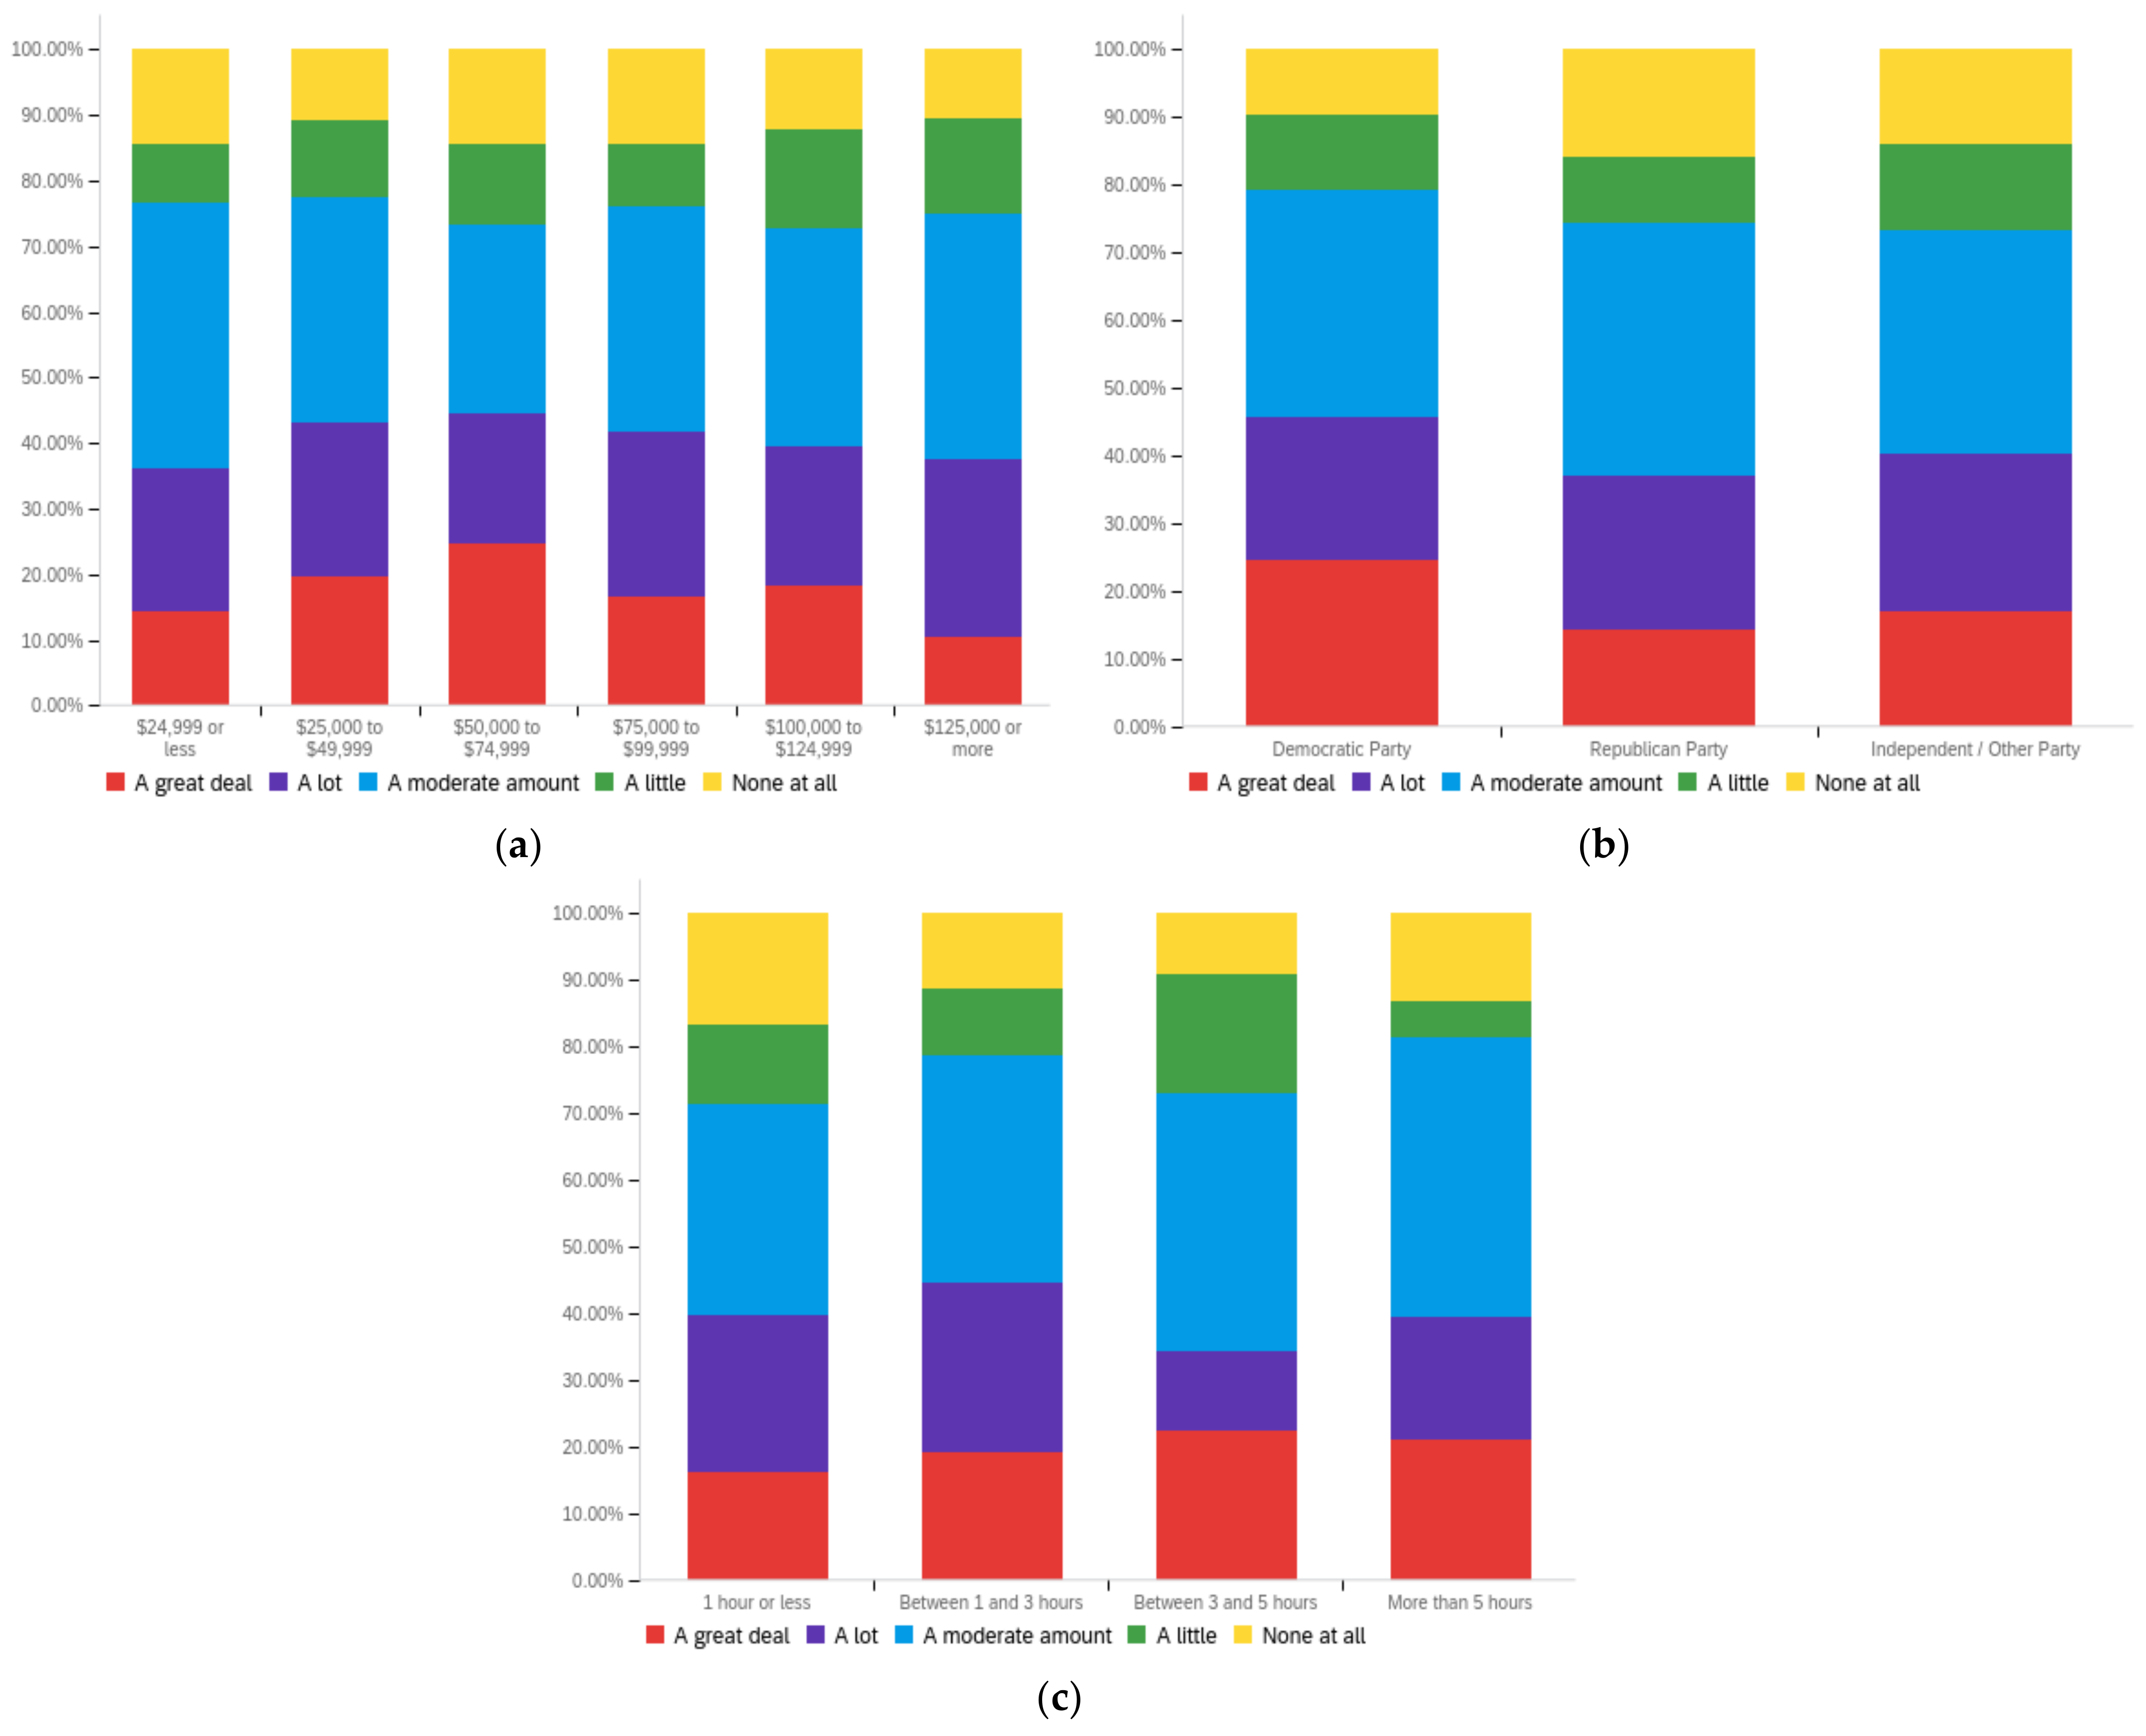
Futureinternet 14 00320 g0a12
Figure A13. Article sponsor—personal perception impact by: (a) income level (top left), (b) political affiliation (top right) and (c) online usage (bottom).
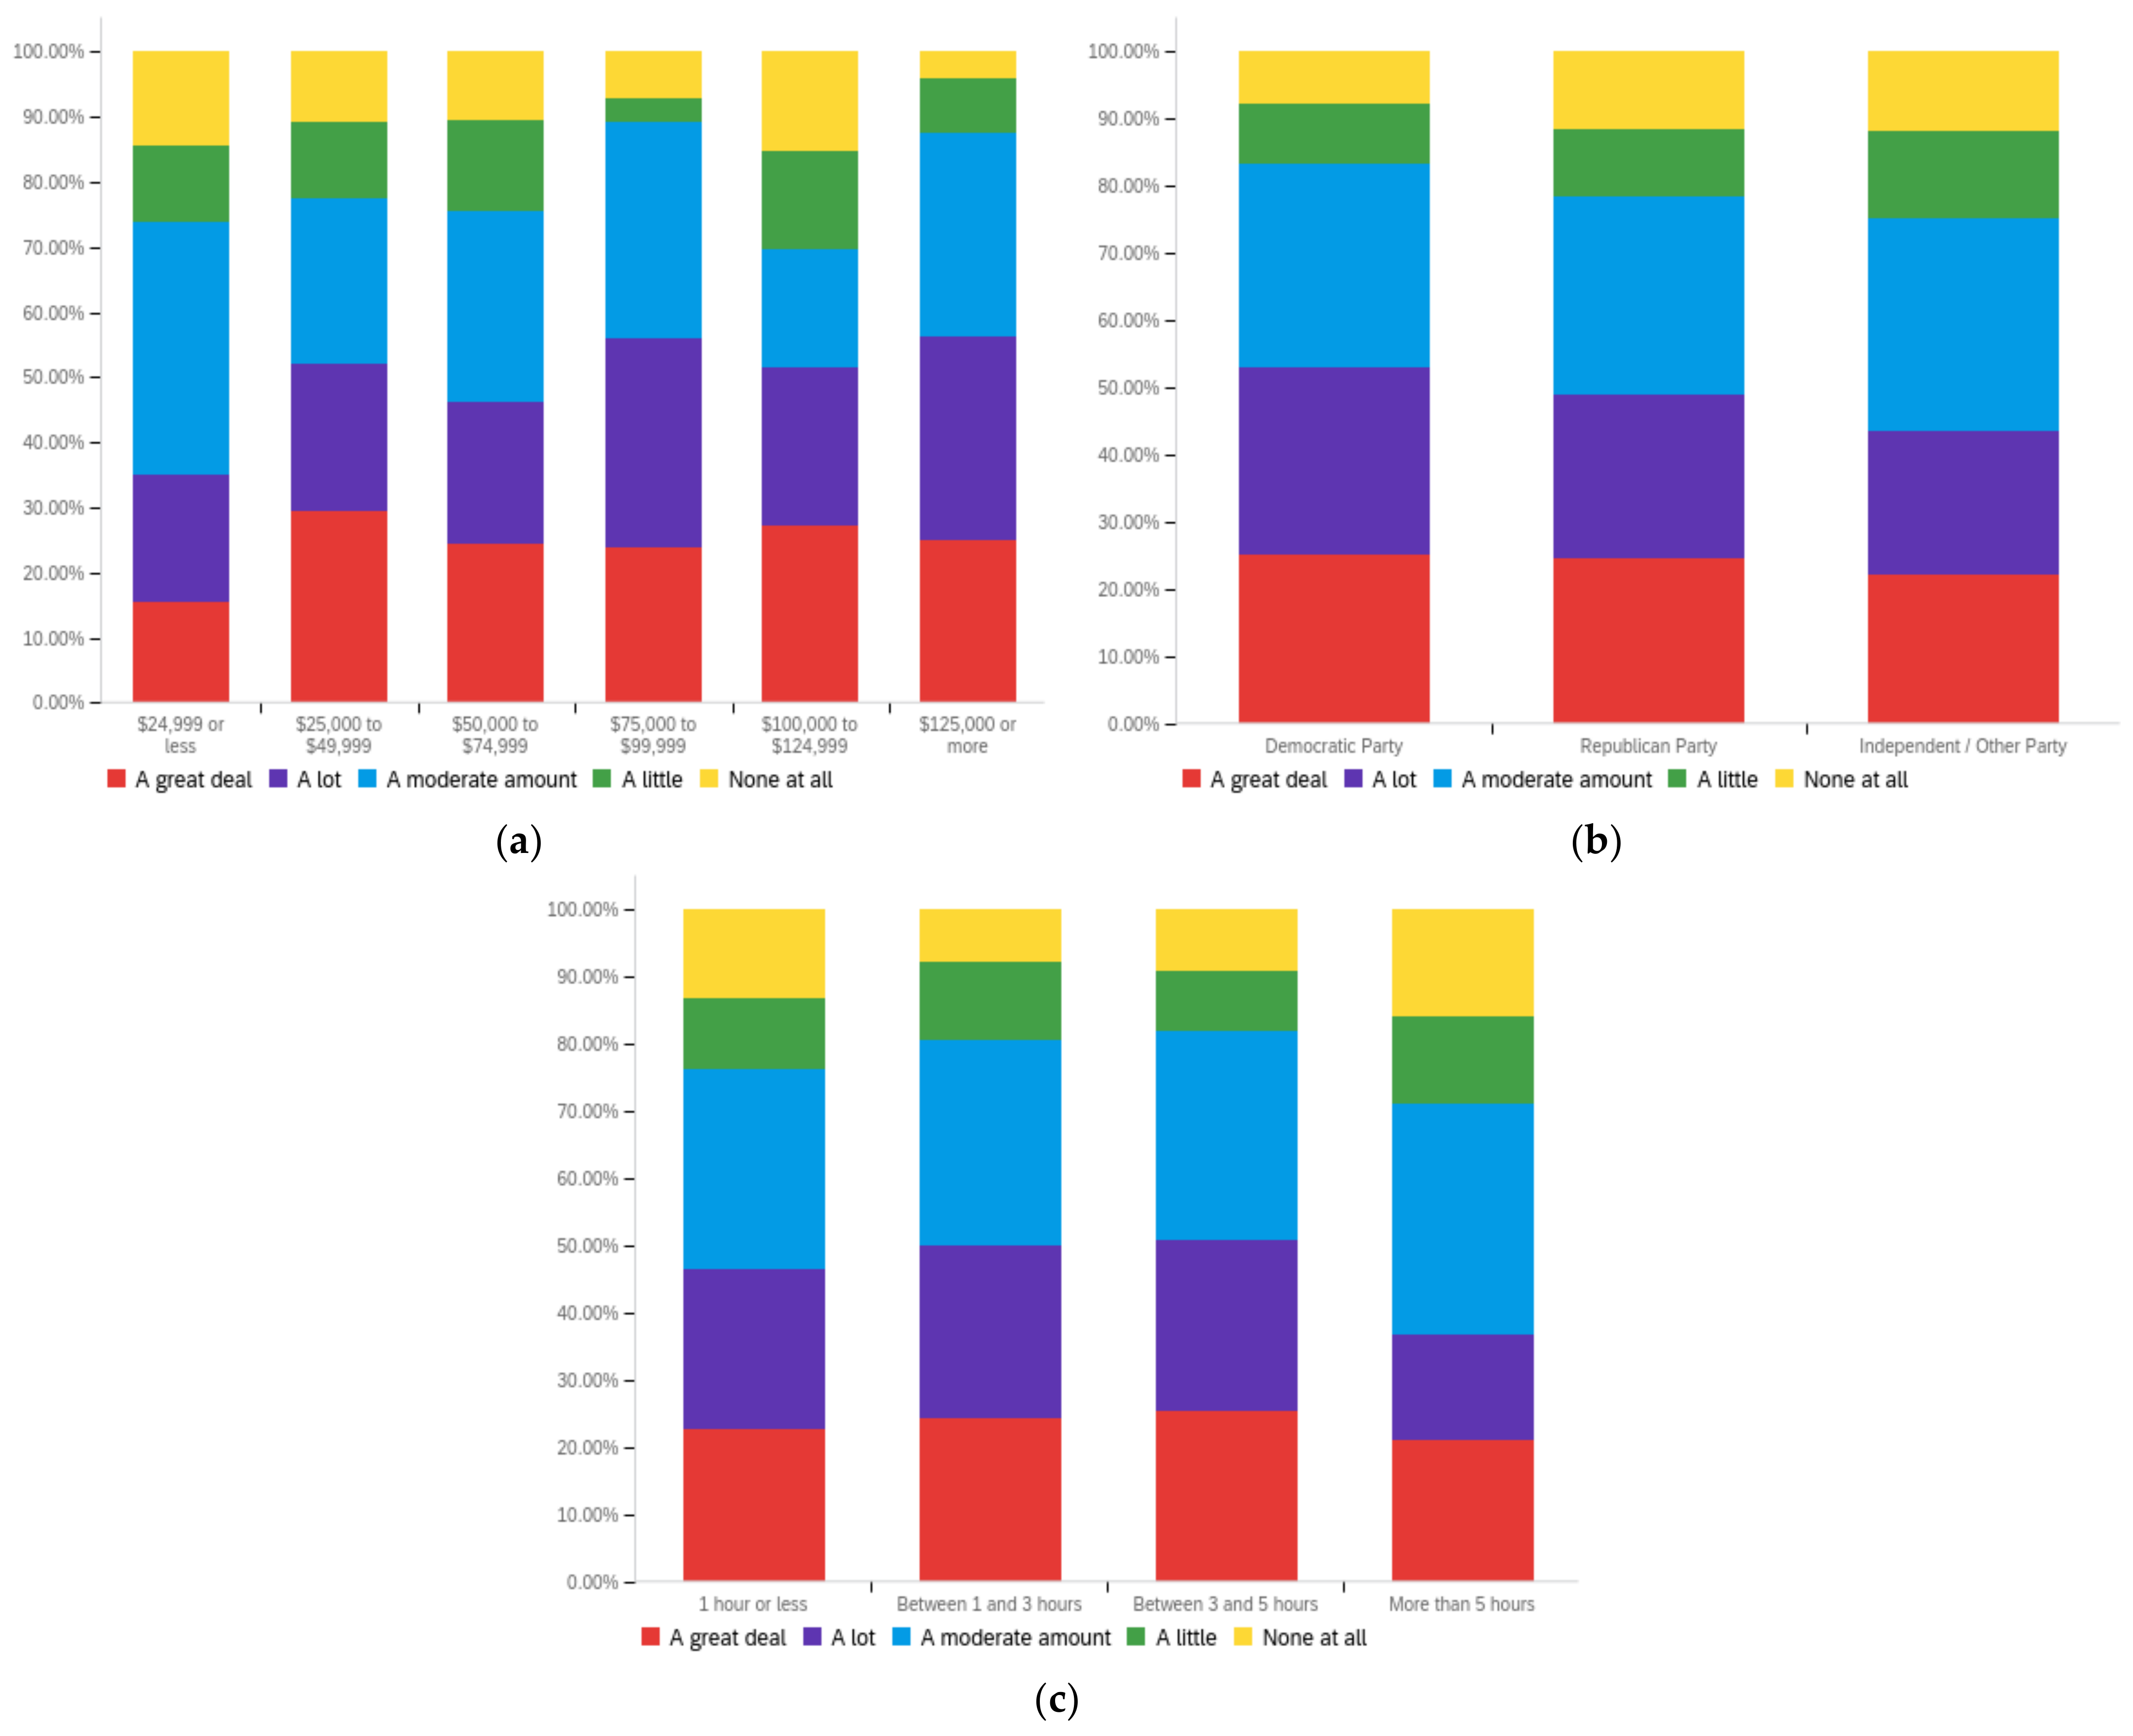
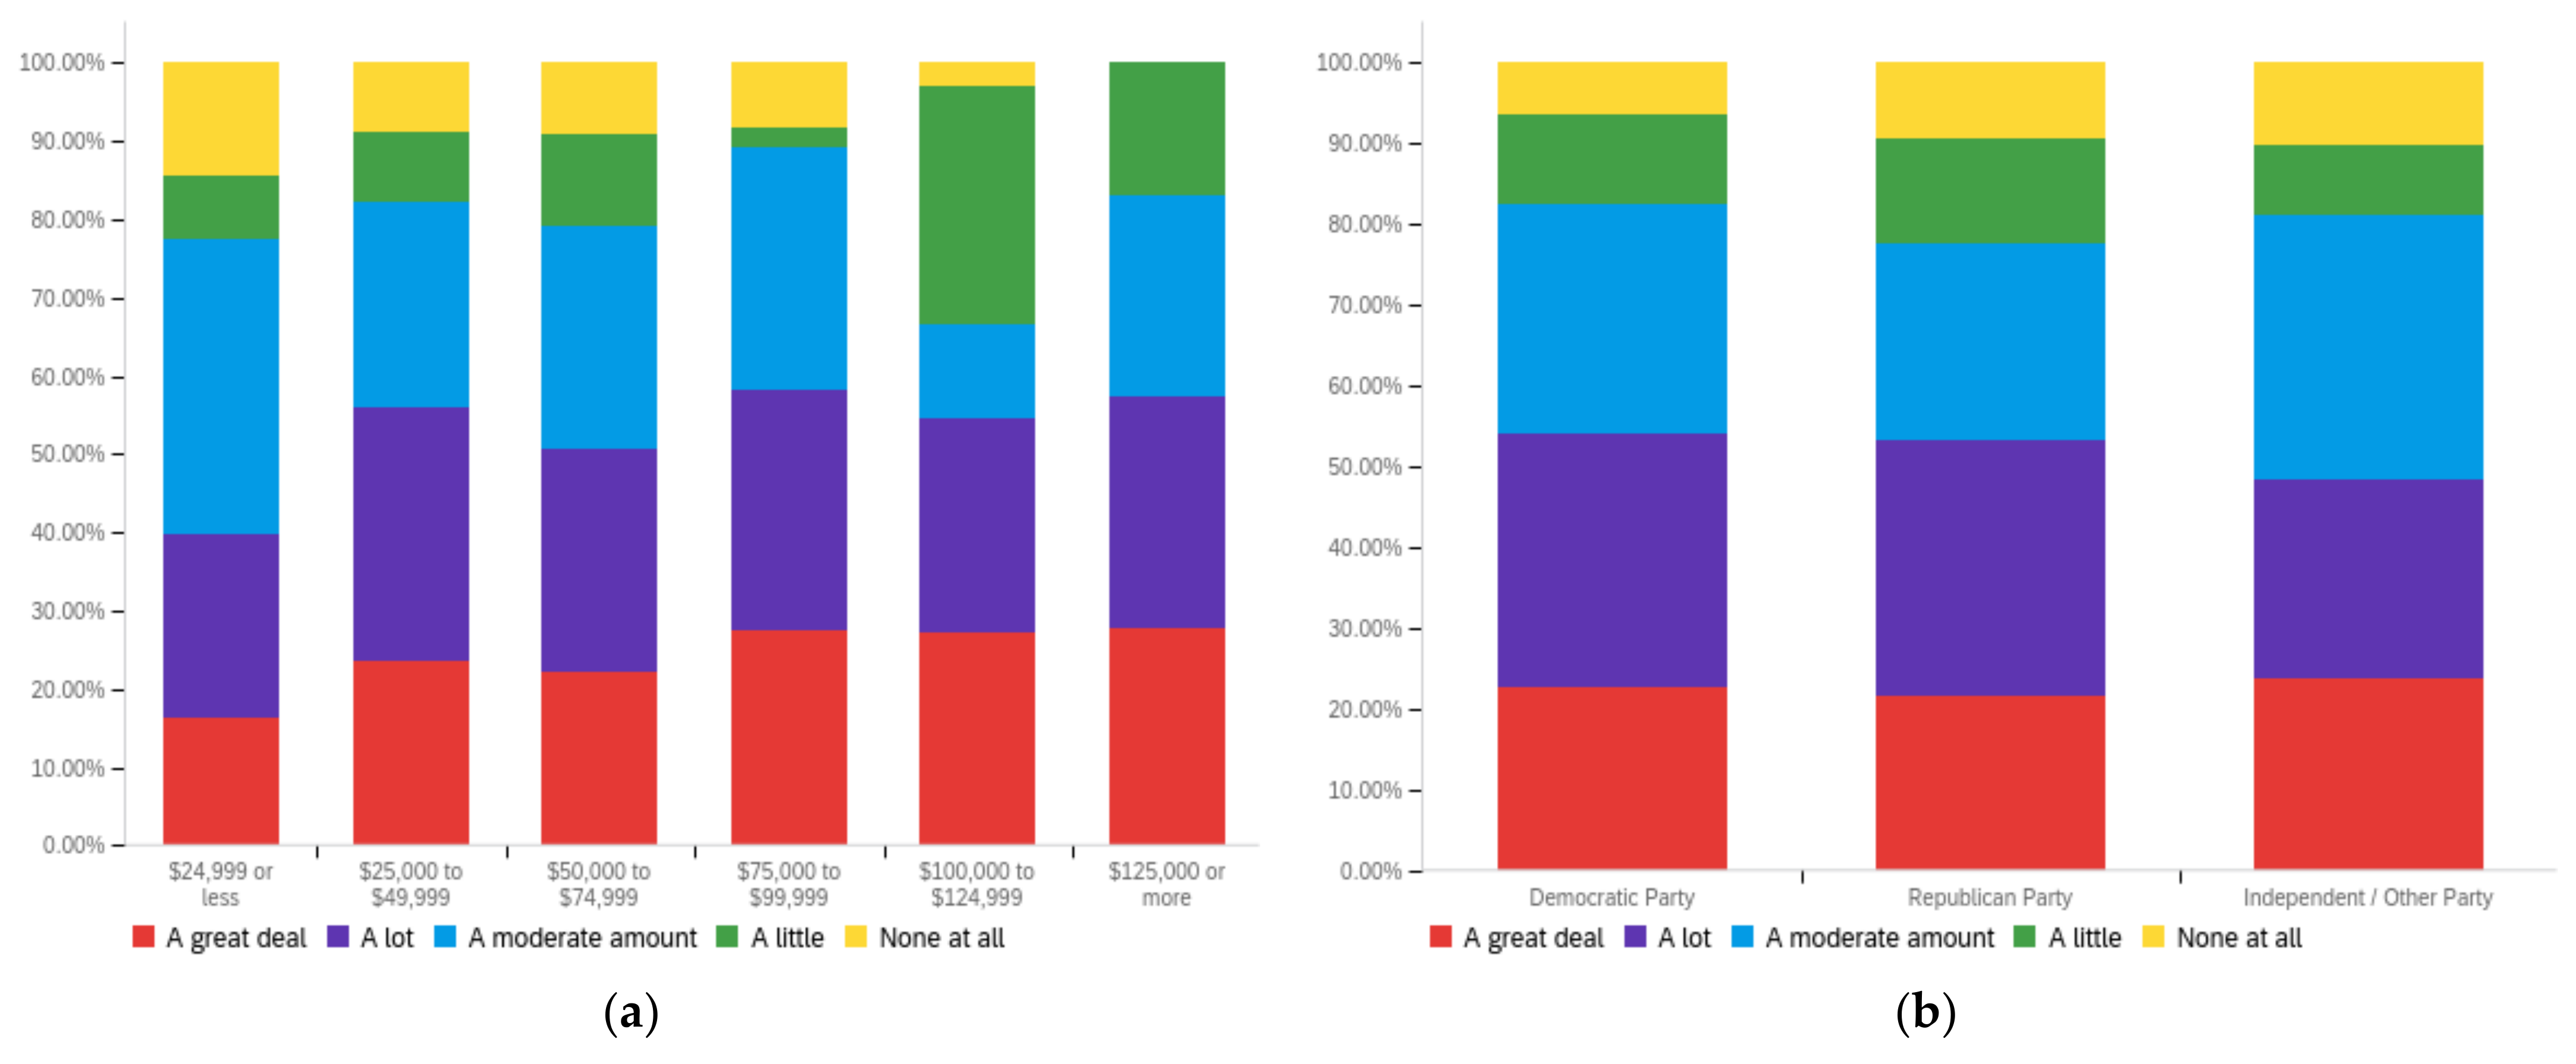
Futureinternet 14 00320 g0a13
Figure A14. Article sponsor—others’ perception impact by: (a) income level (top left), (b) political affiliation (top right) and (c) online usage (bottom).
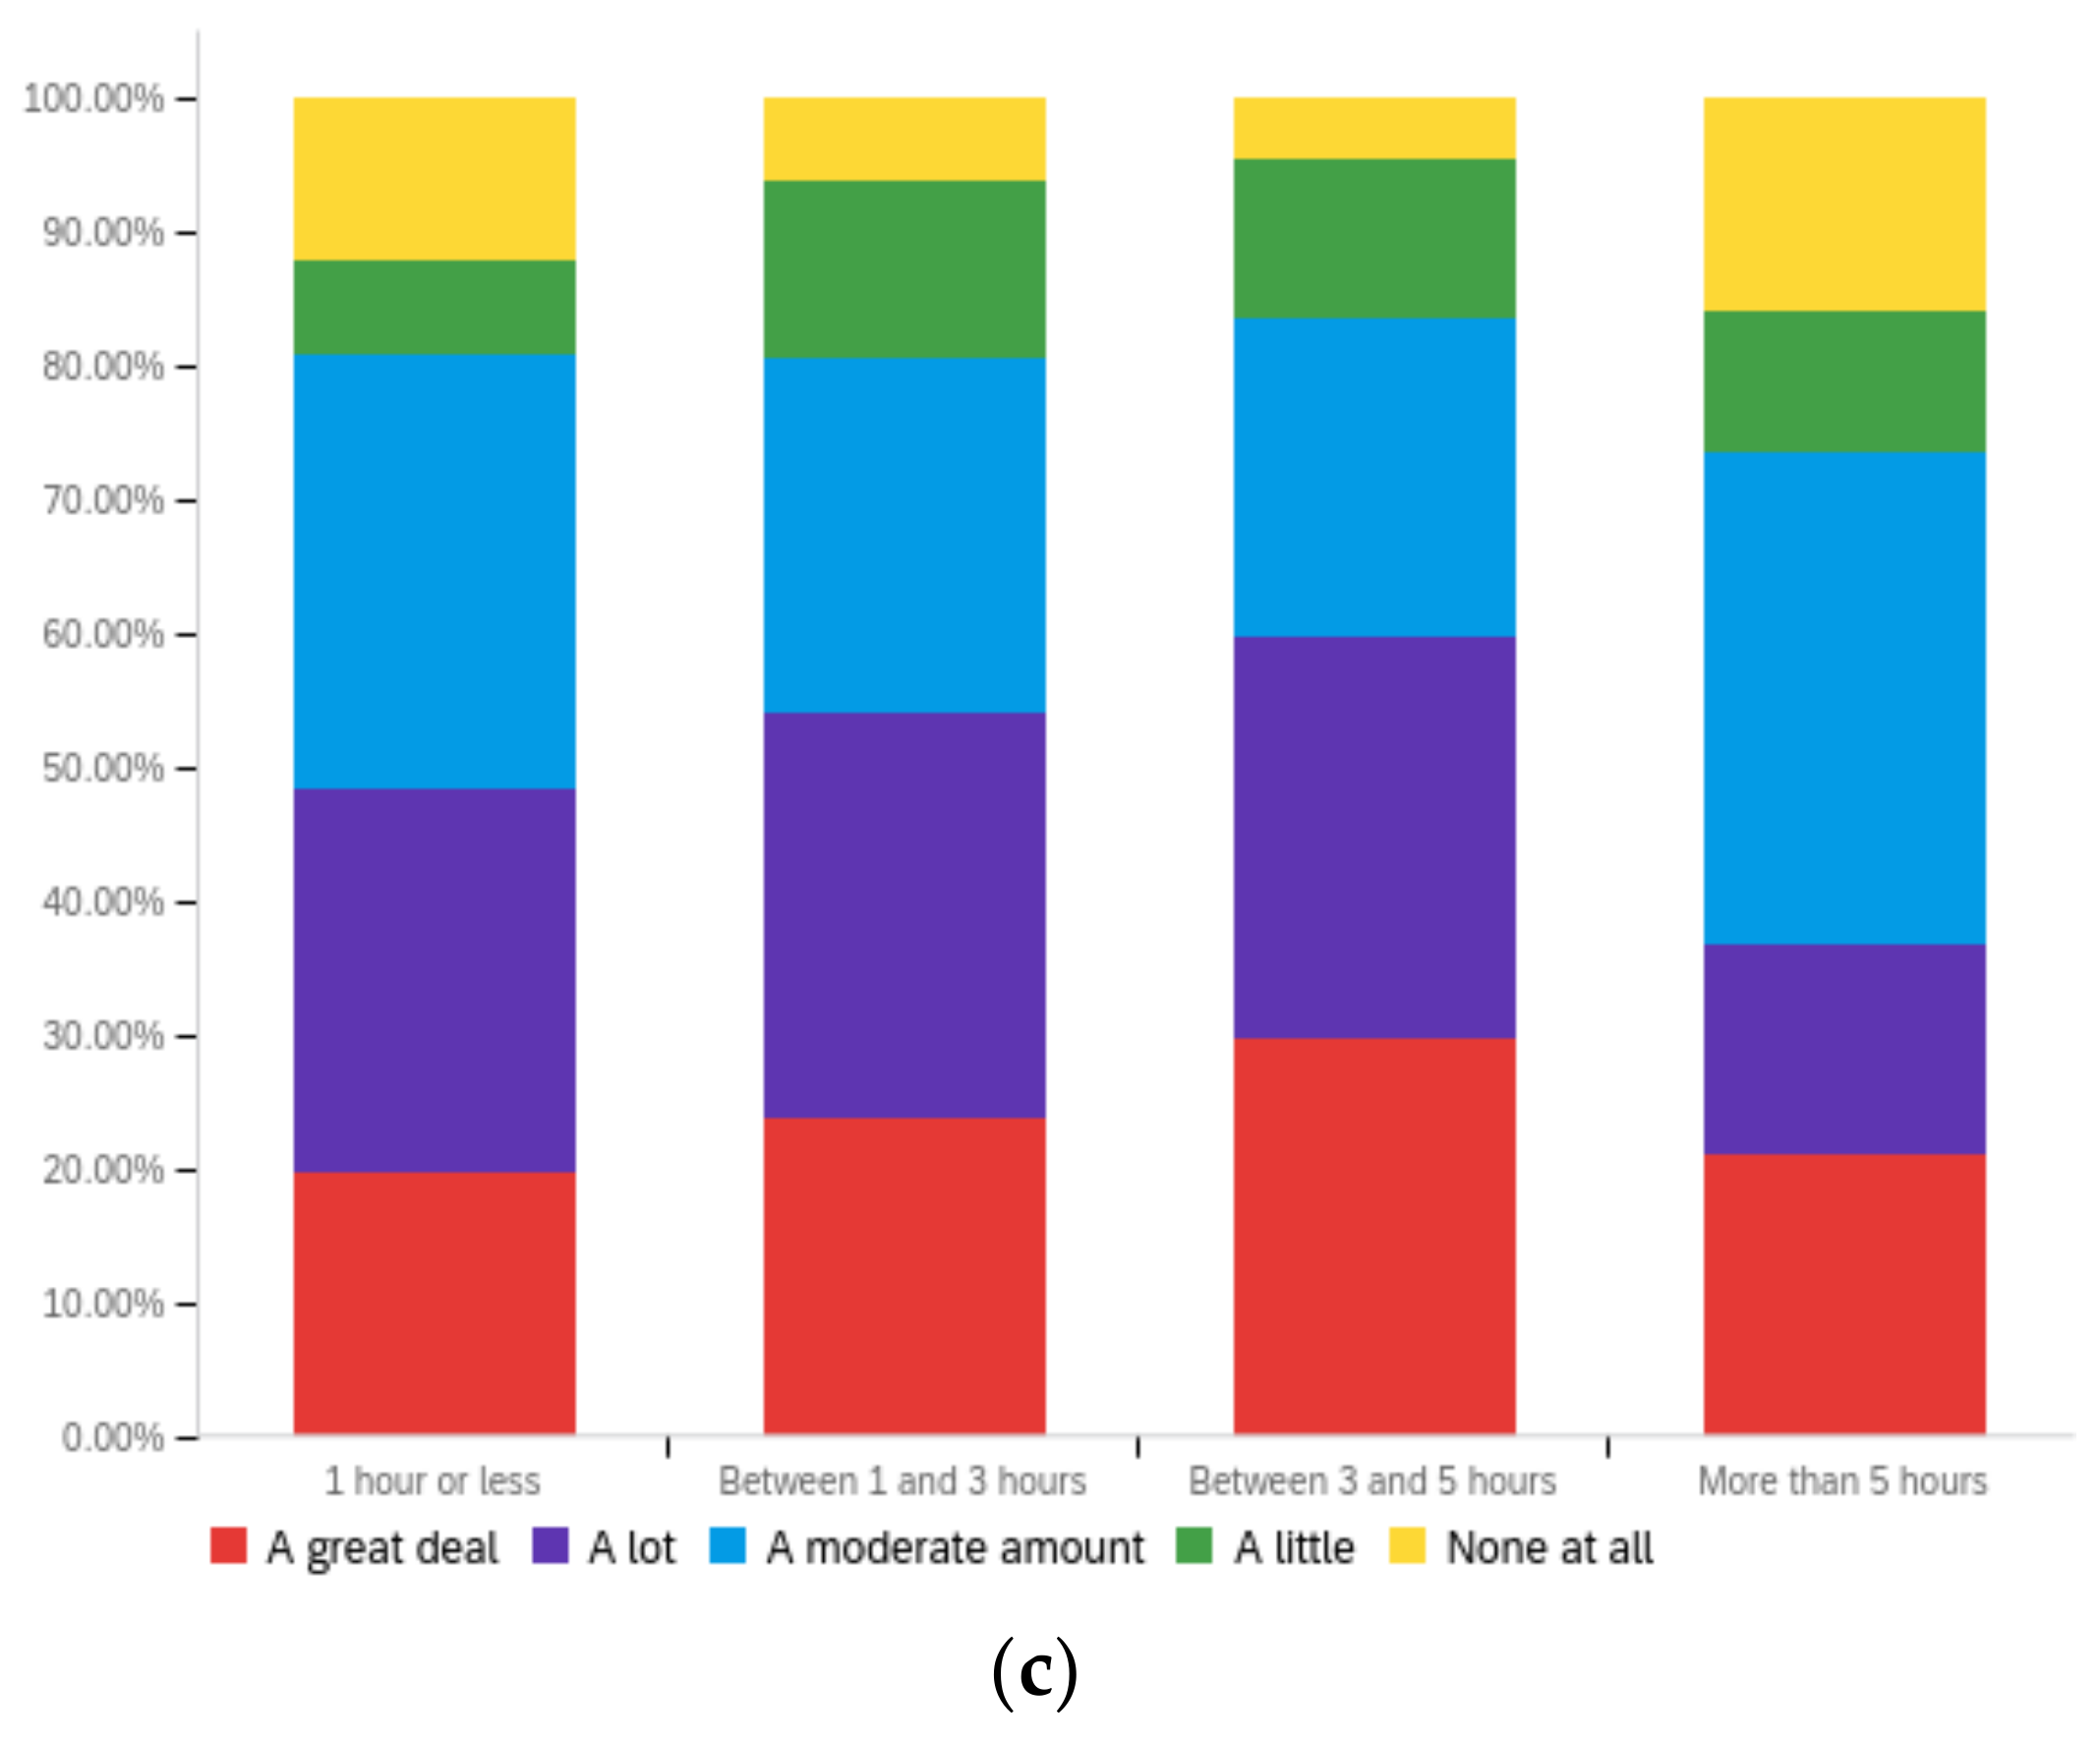
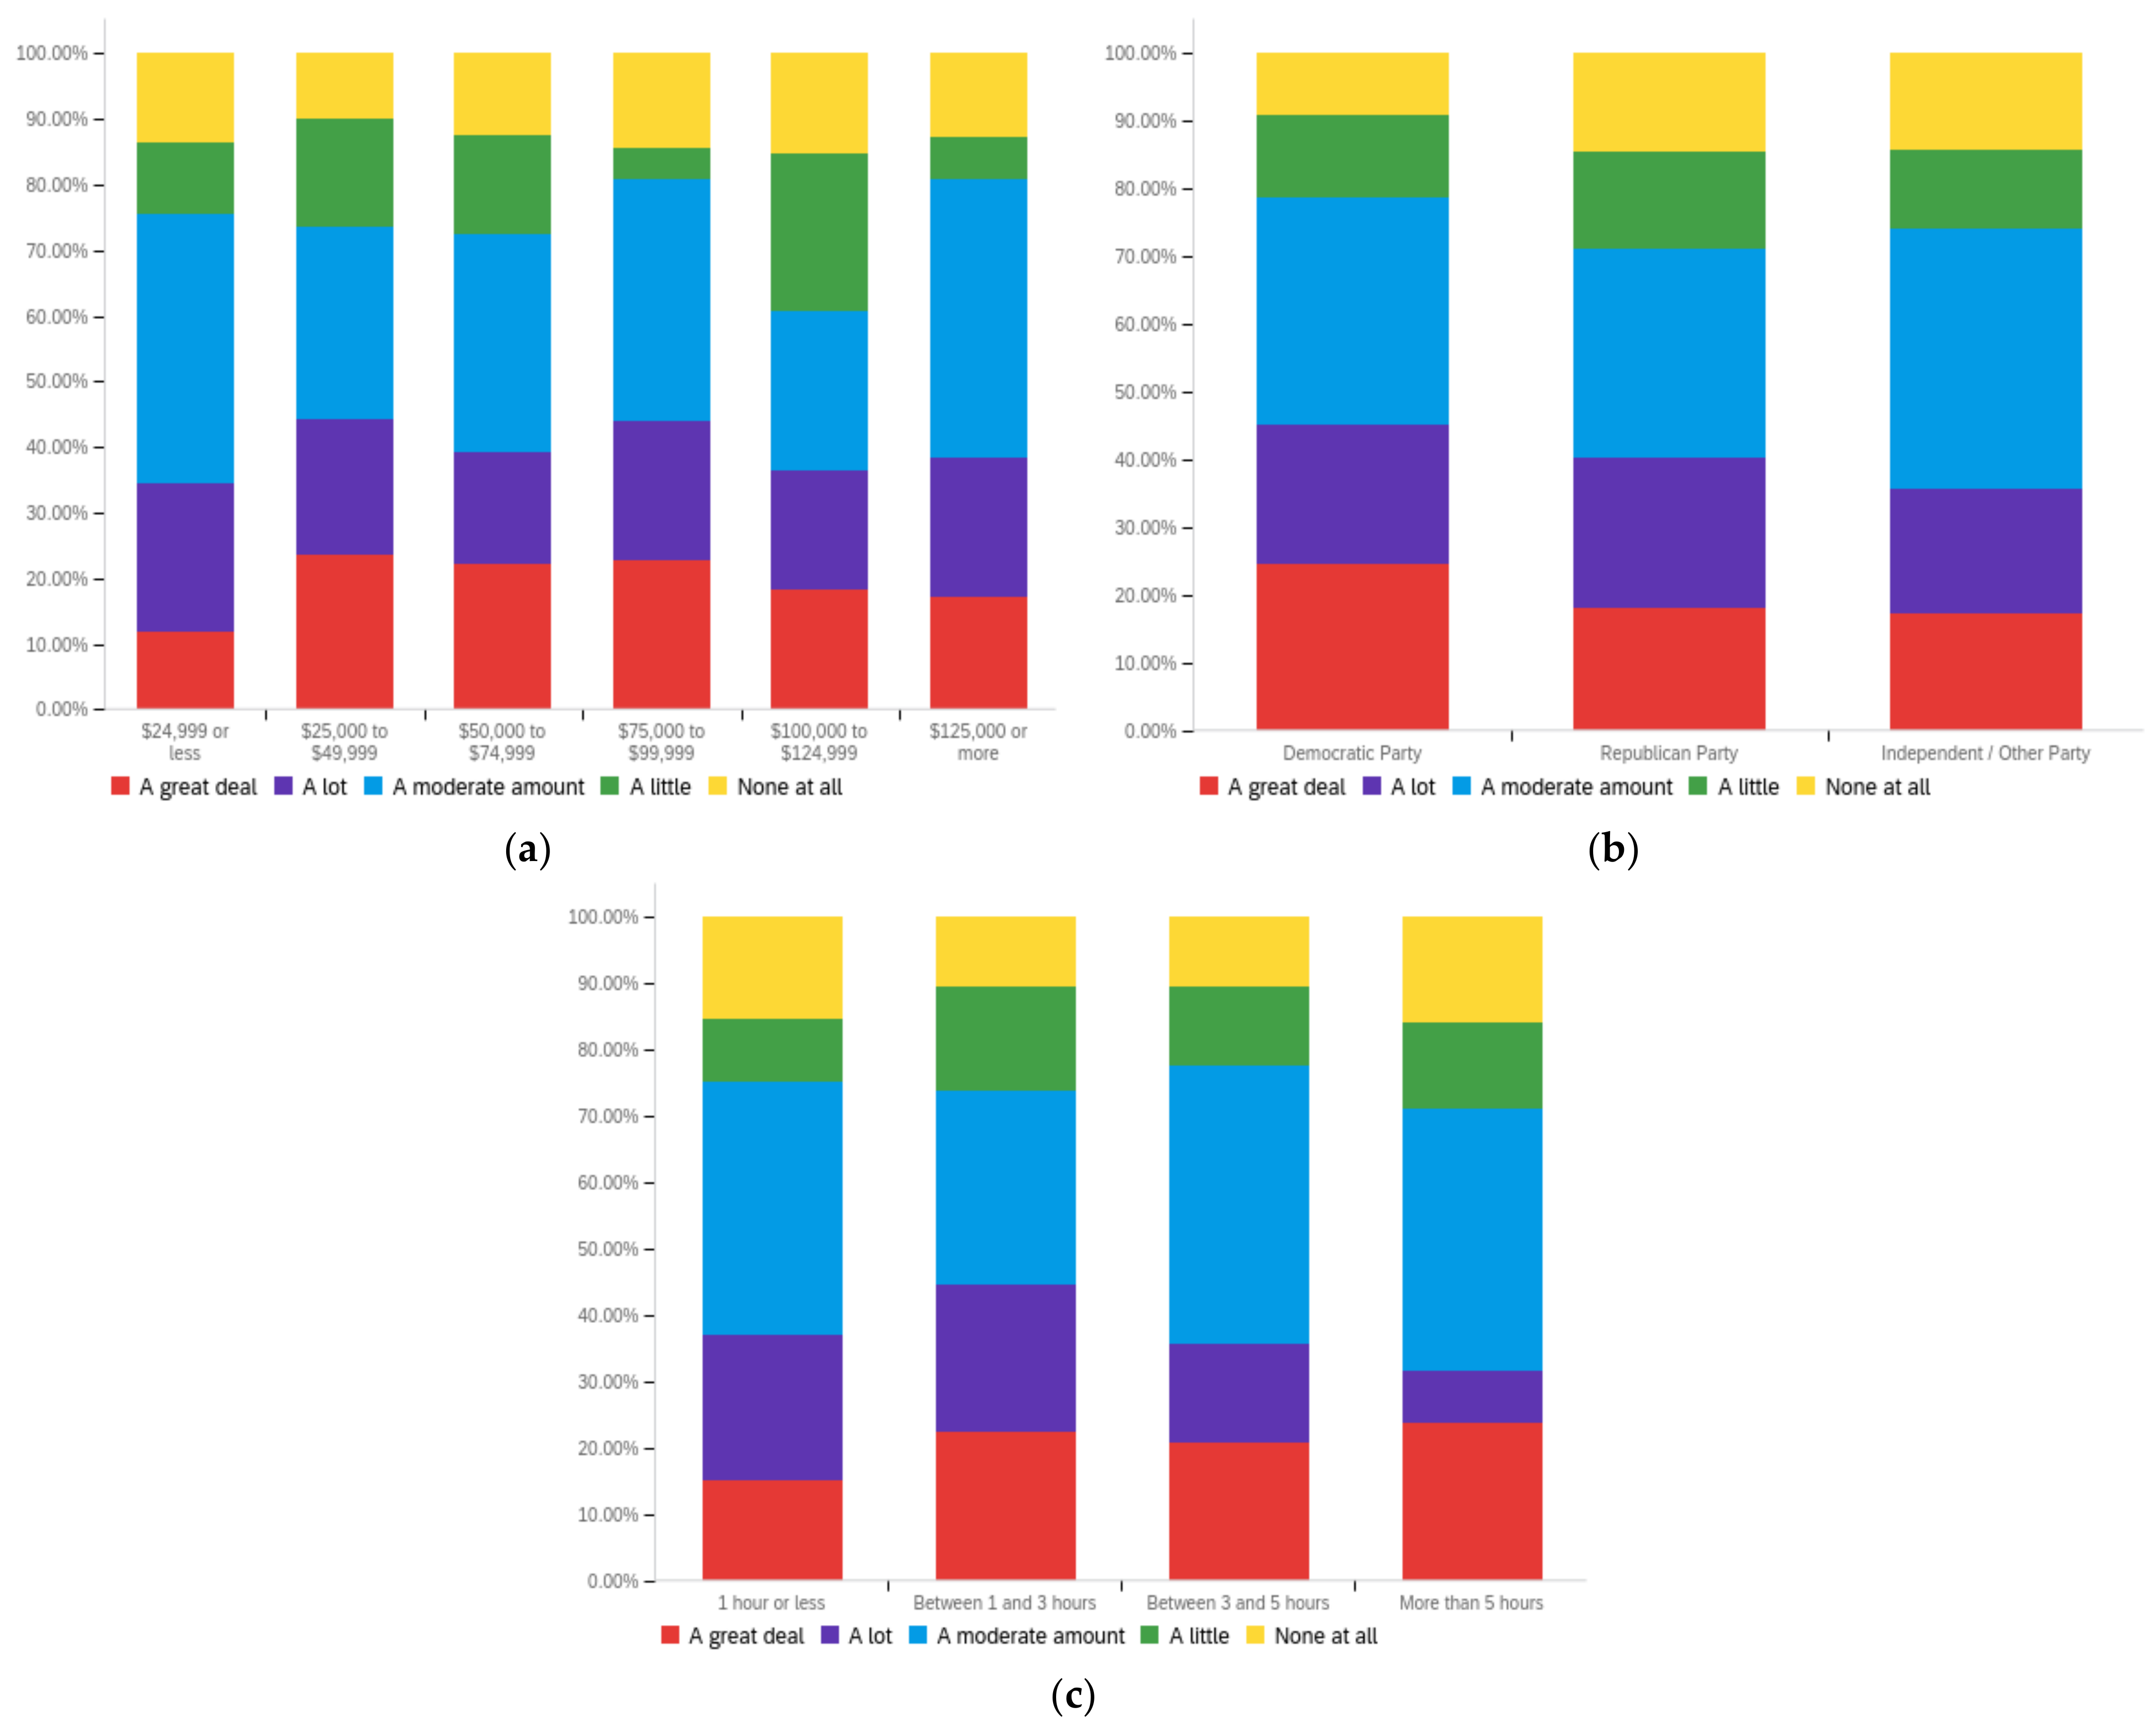
Futureinternet 14 00320 g0a14aFutureinternet 14 00320 g0a14b
Figure A15. Article sponsor—ideal perception impact by: (a) income level (top left), (b) political affiliation (top right) and (c) online usage (bottom).
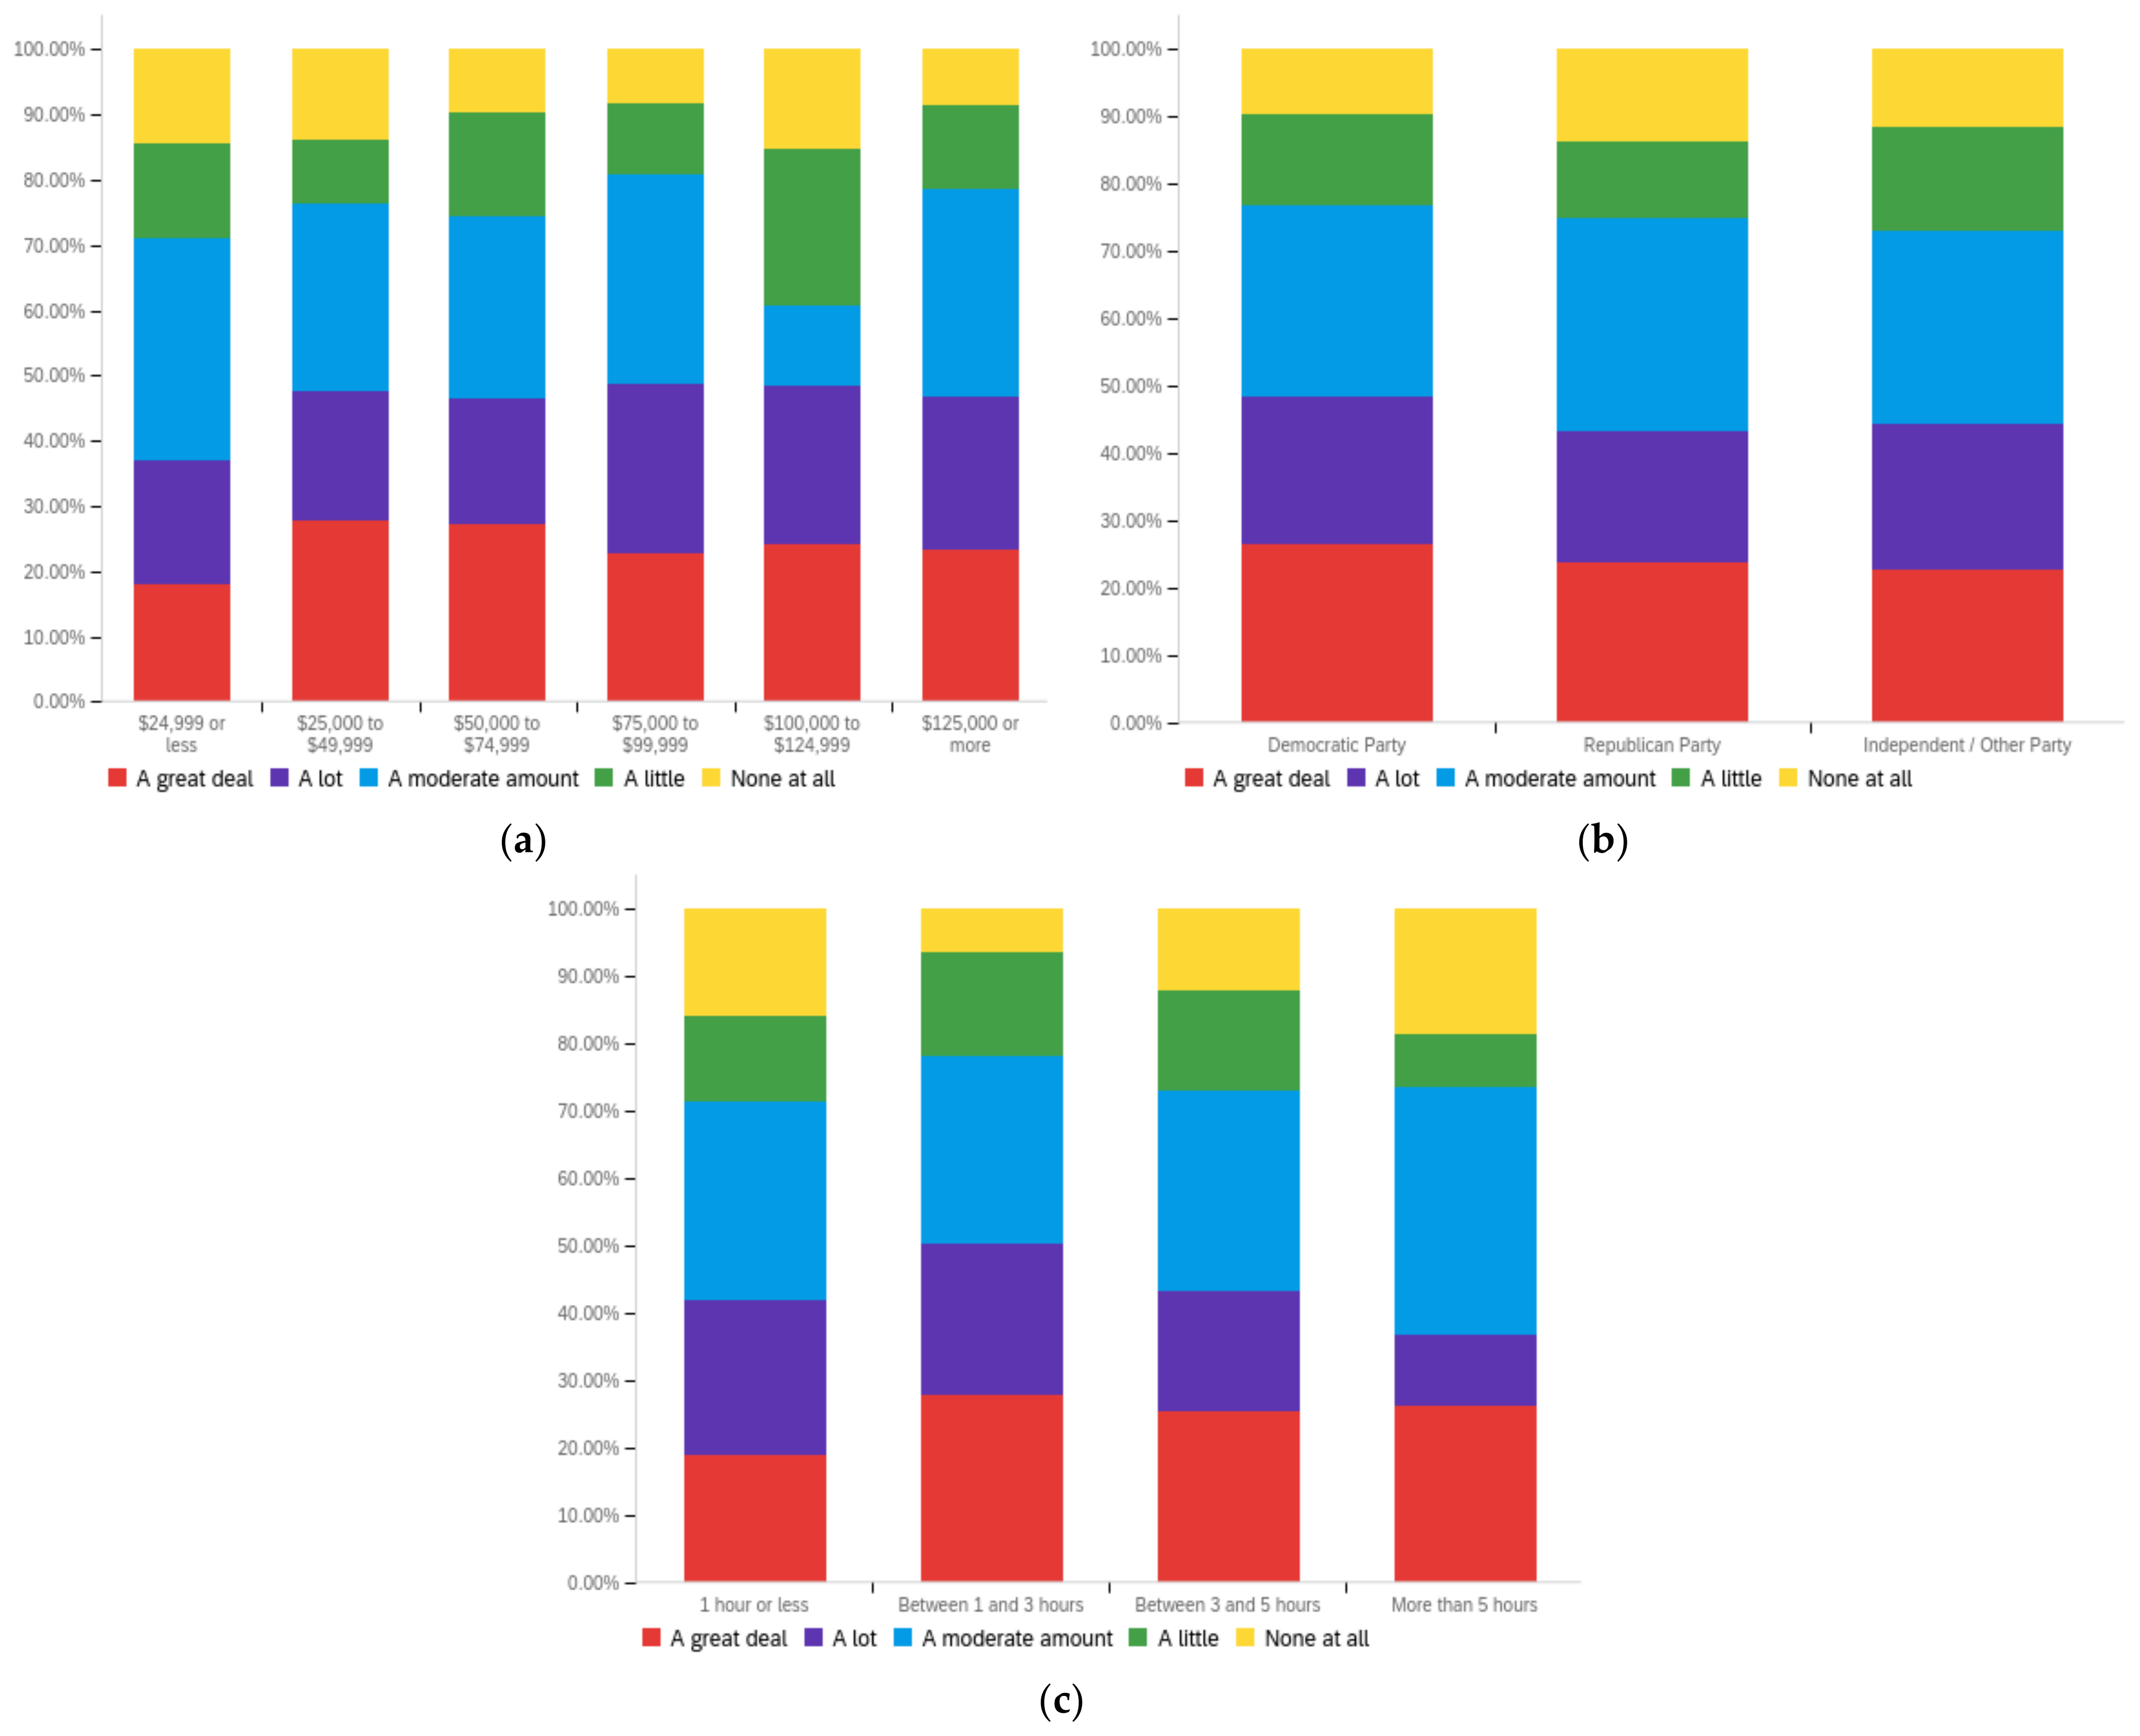
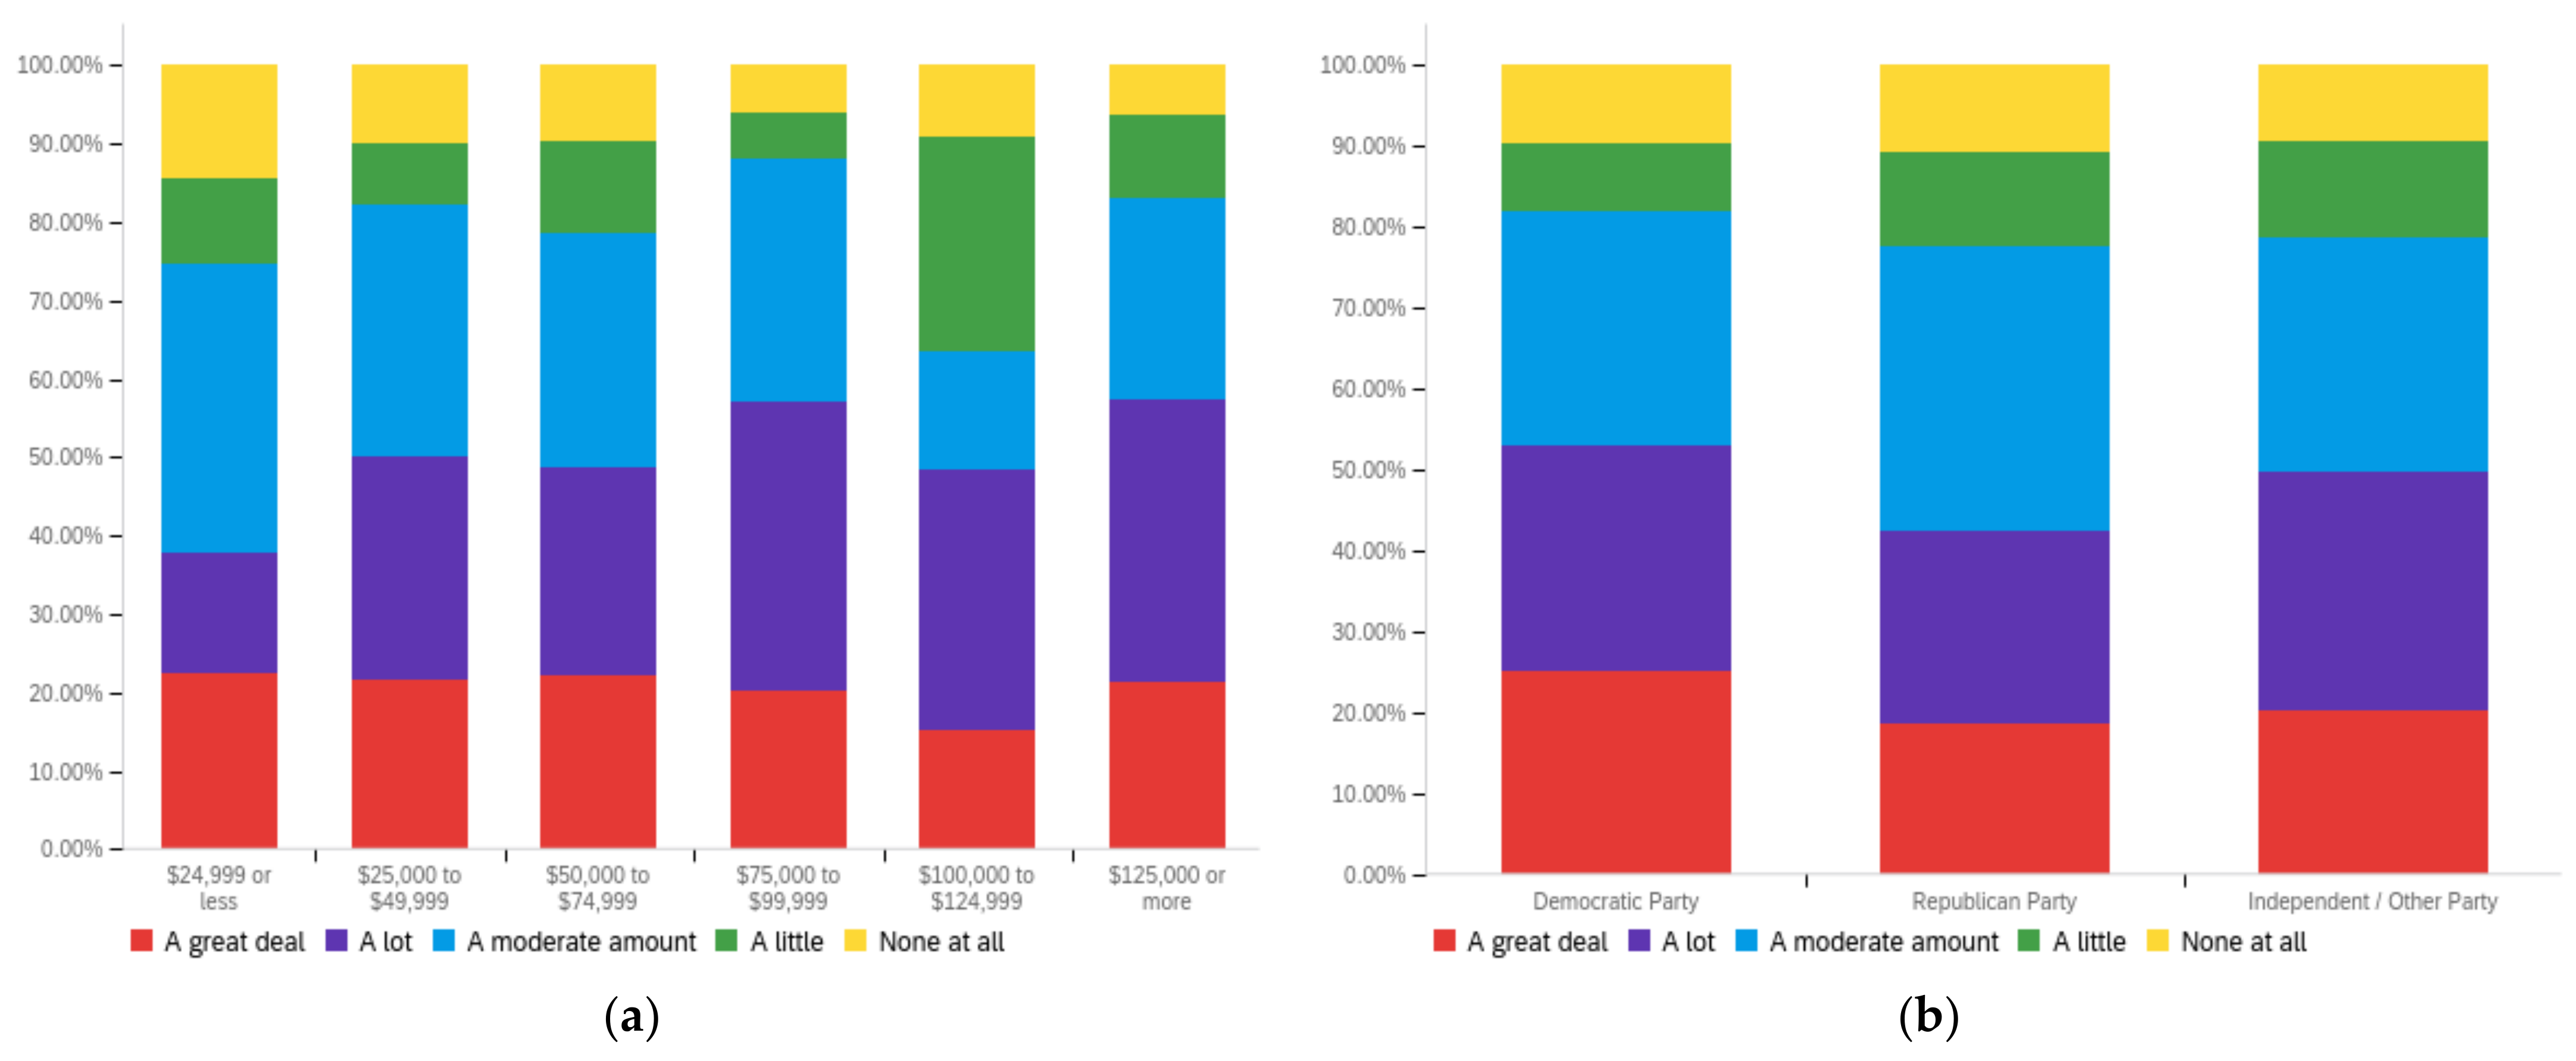
Futureinternet 14 00320 g0a15
Figure A16. Article author’s political alignment—personal perception impact by: (a) income level (top left), (b) political affiliation (top right) and (c) online usage (bottom).
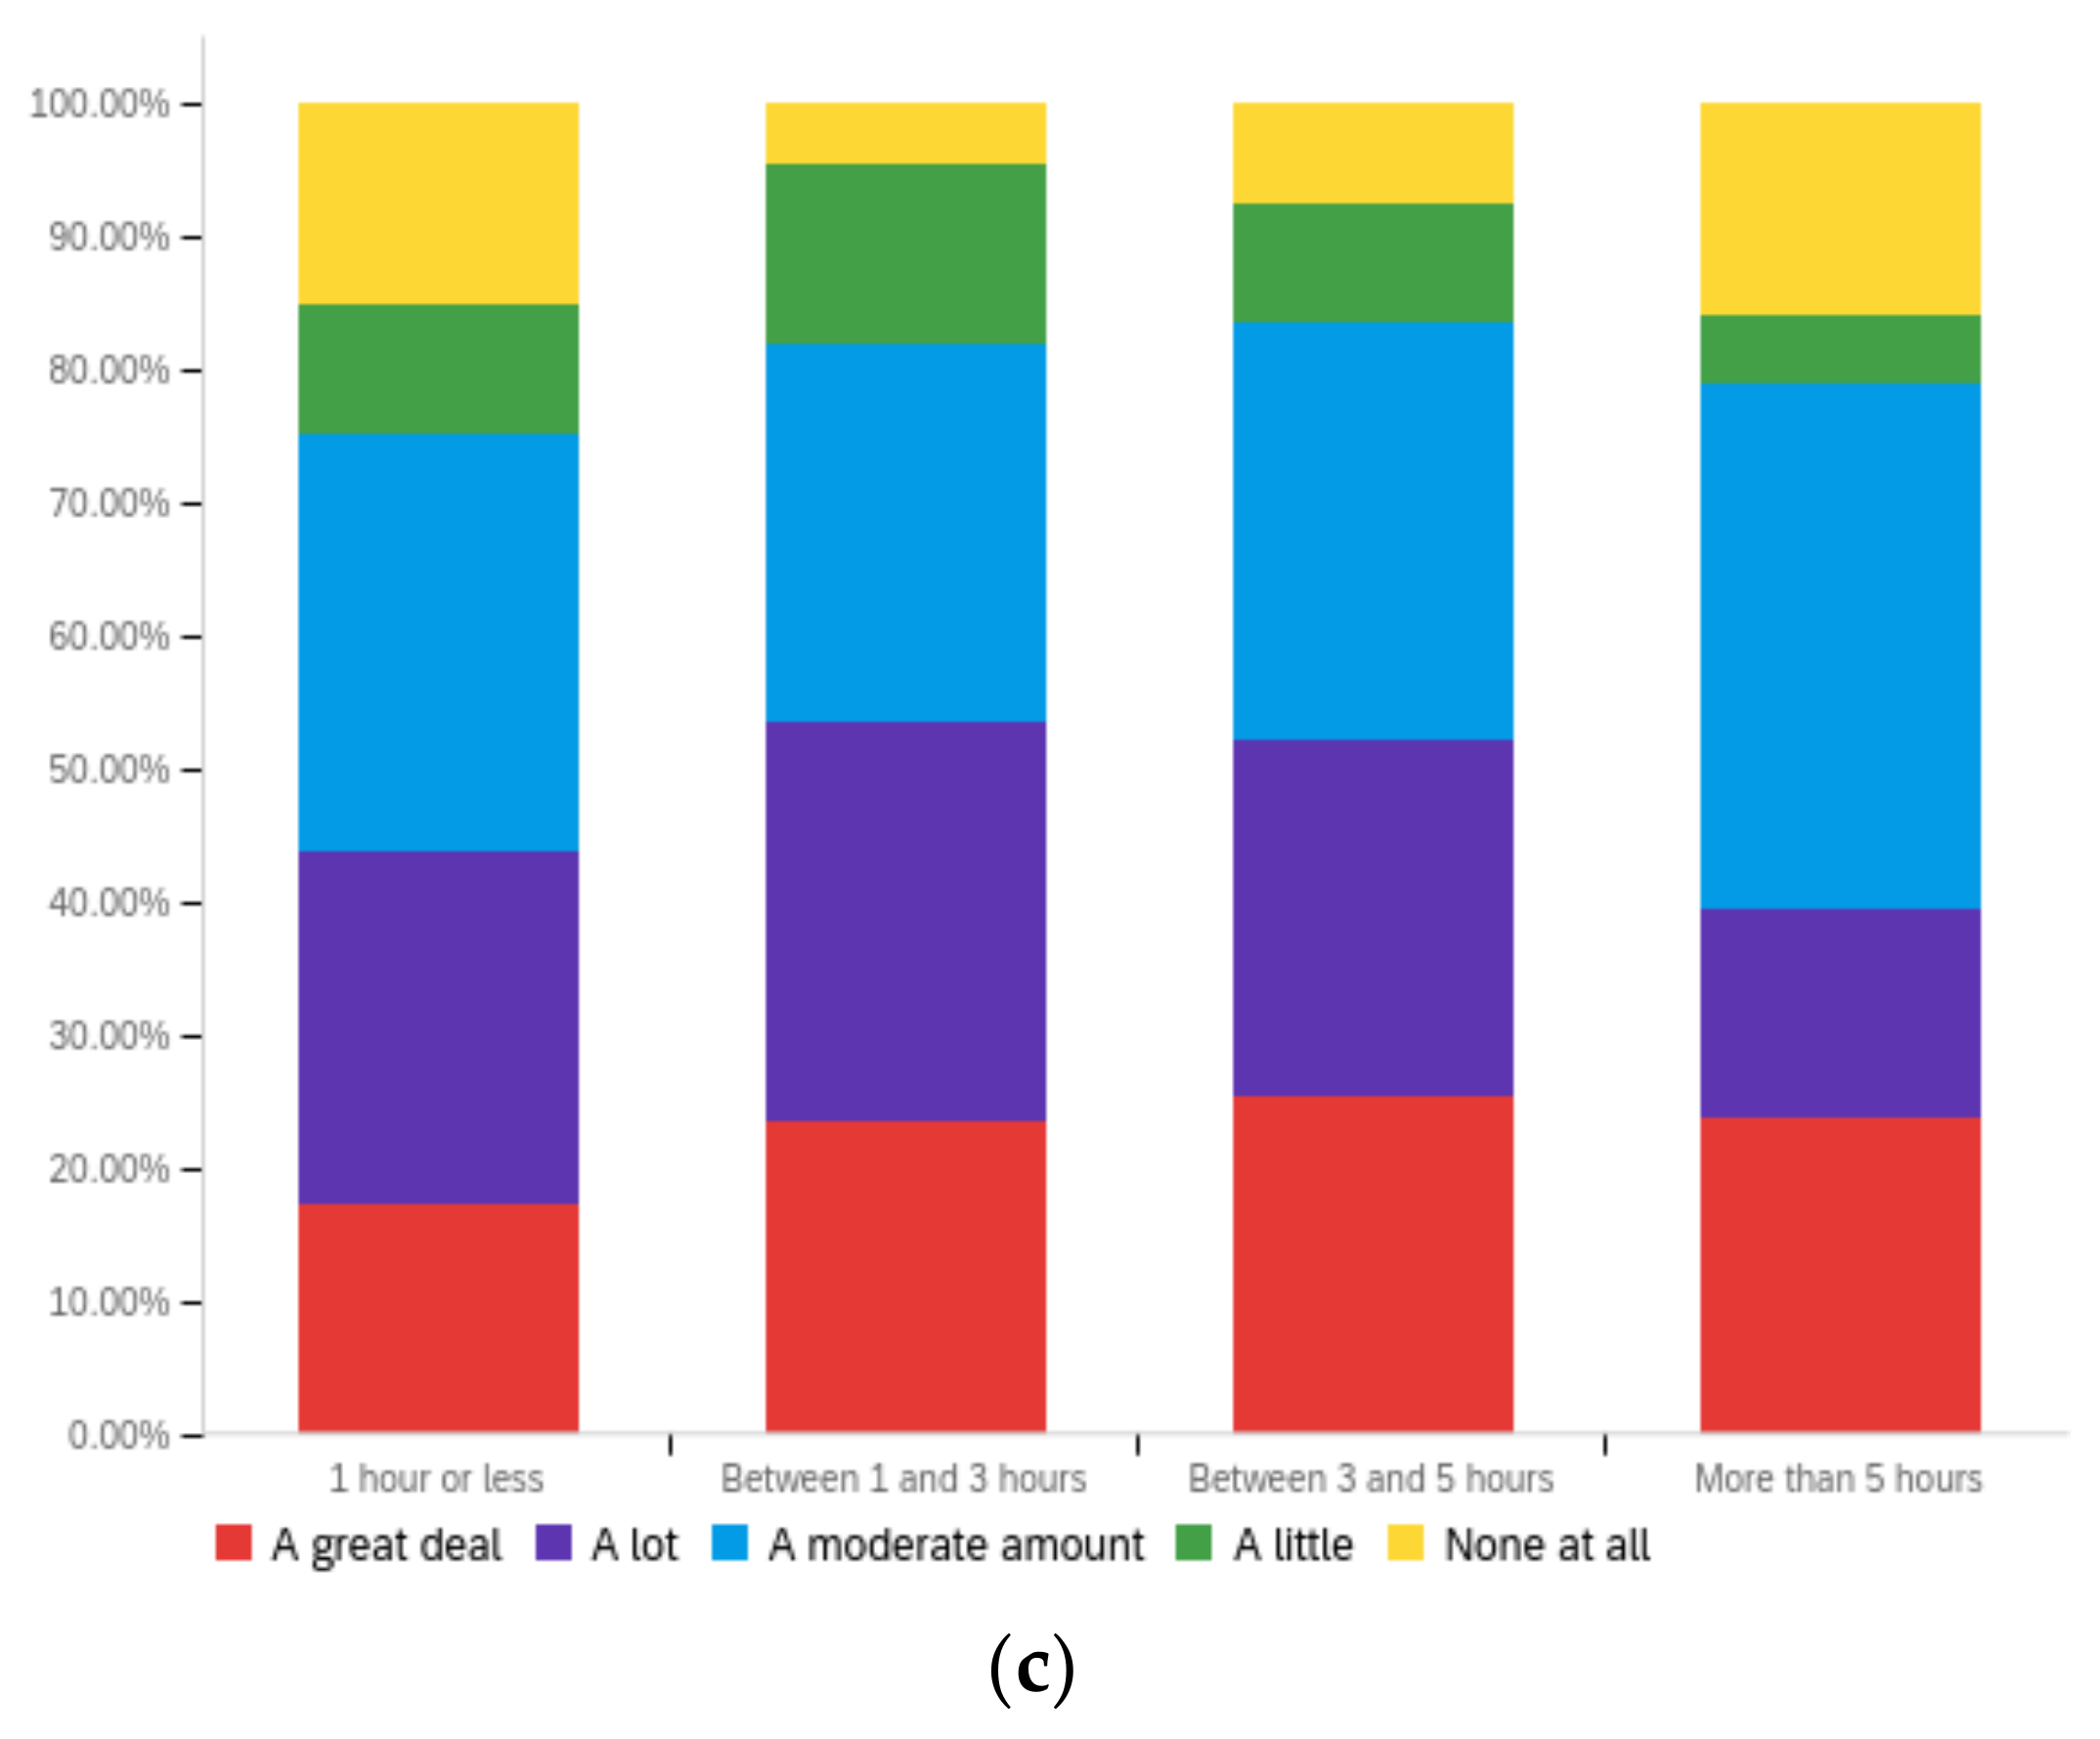
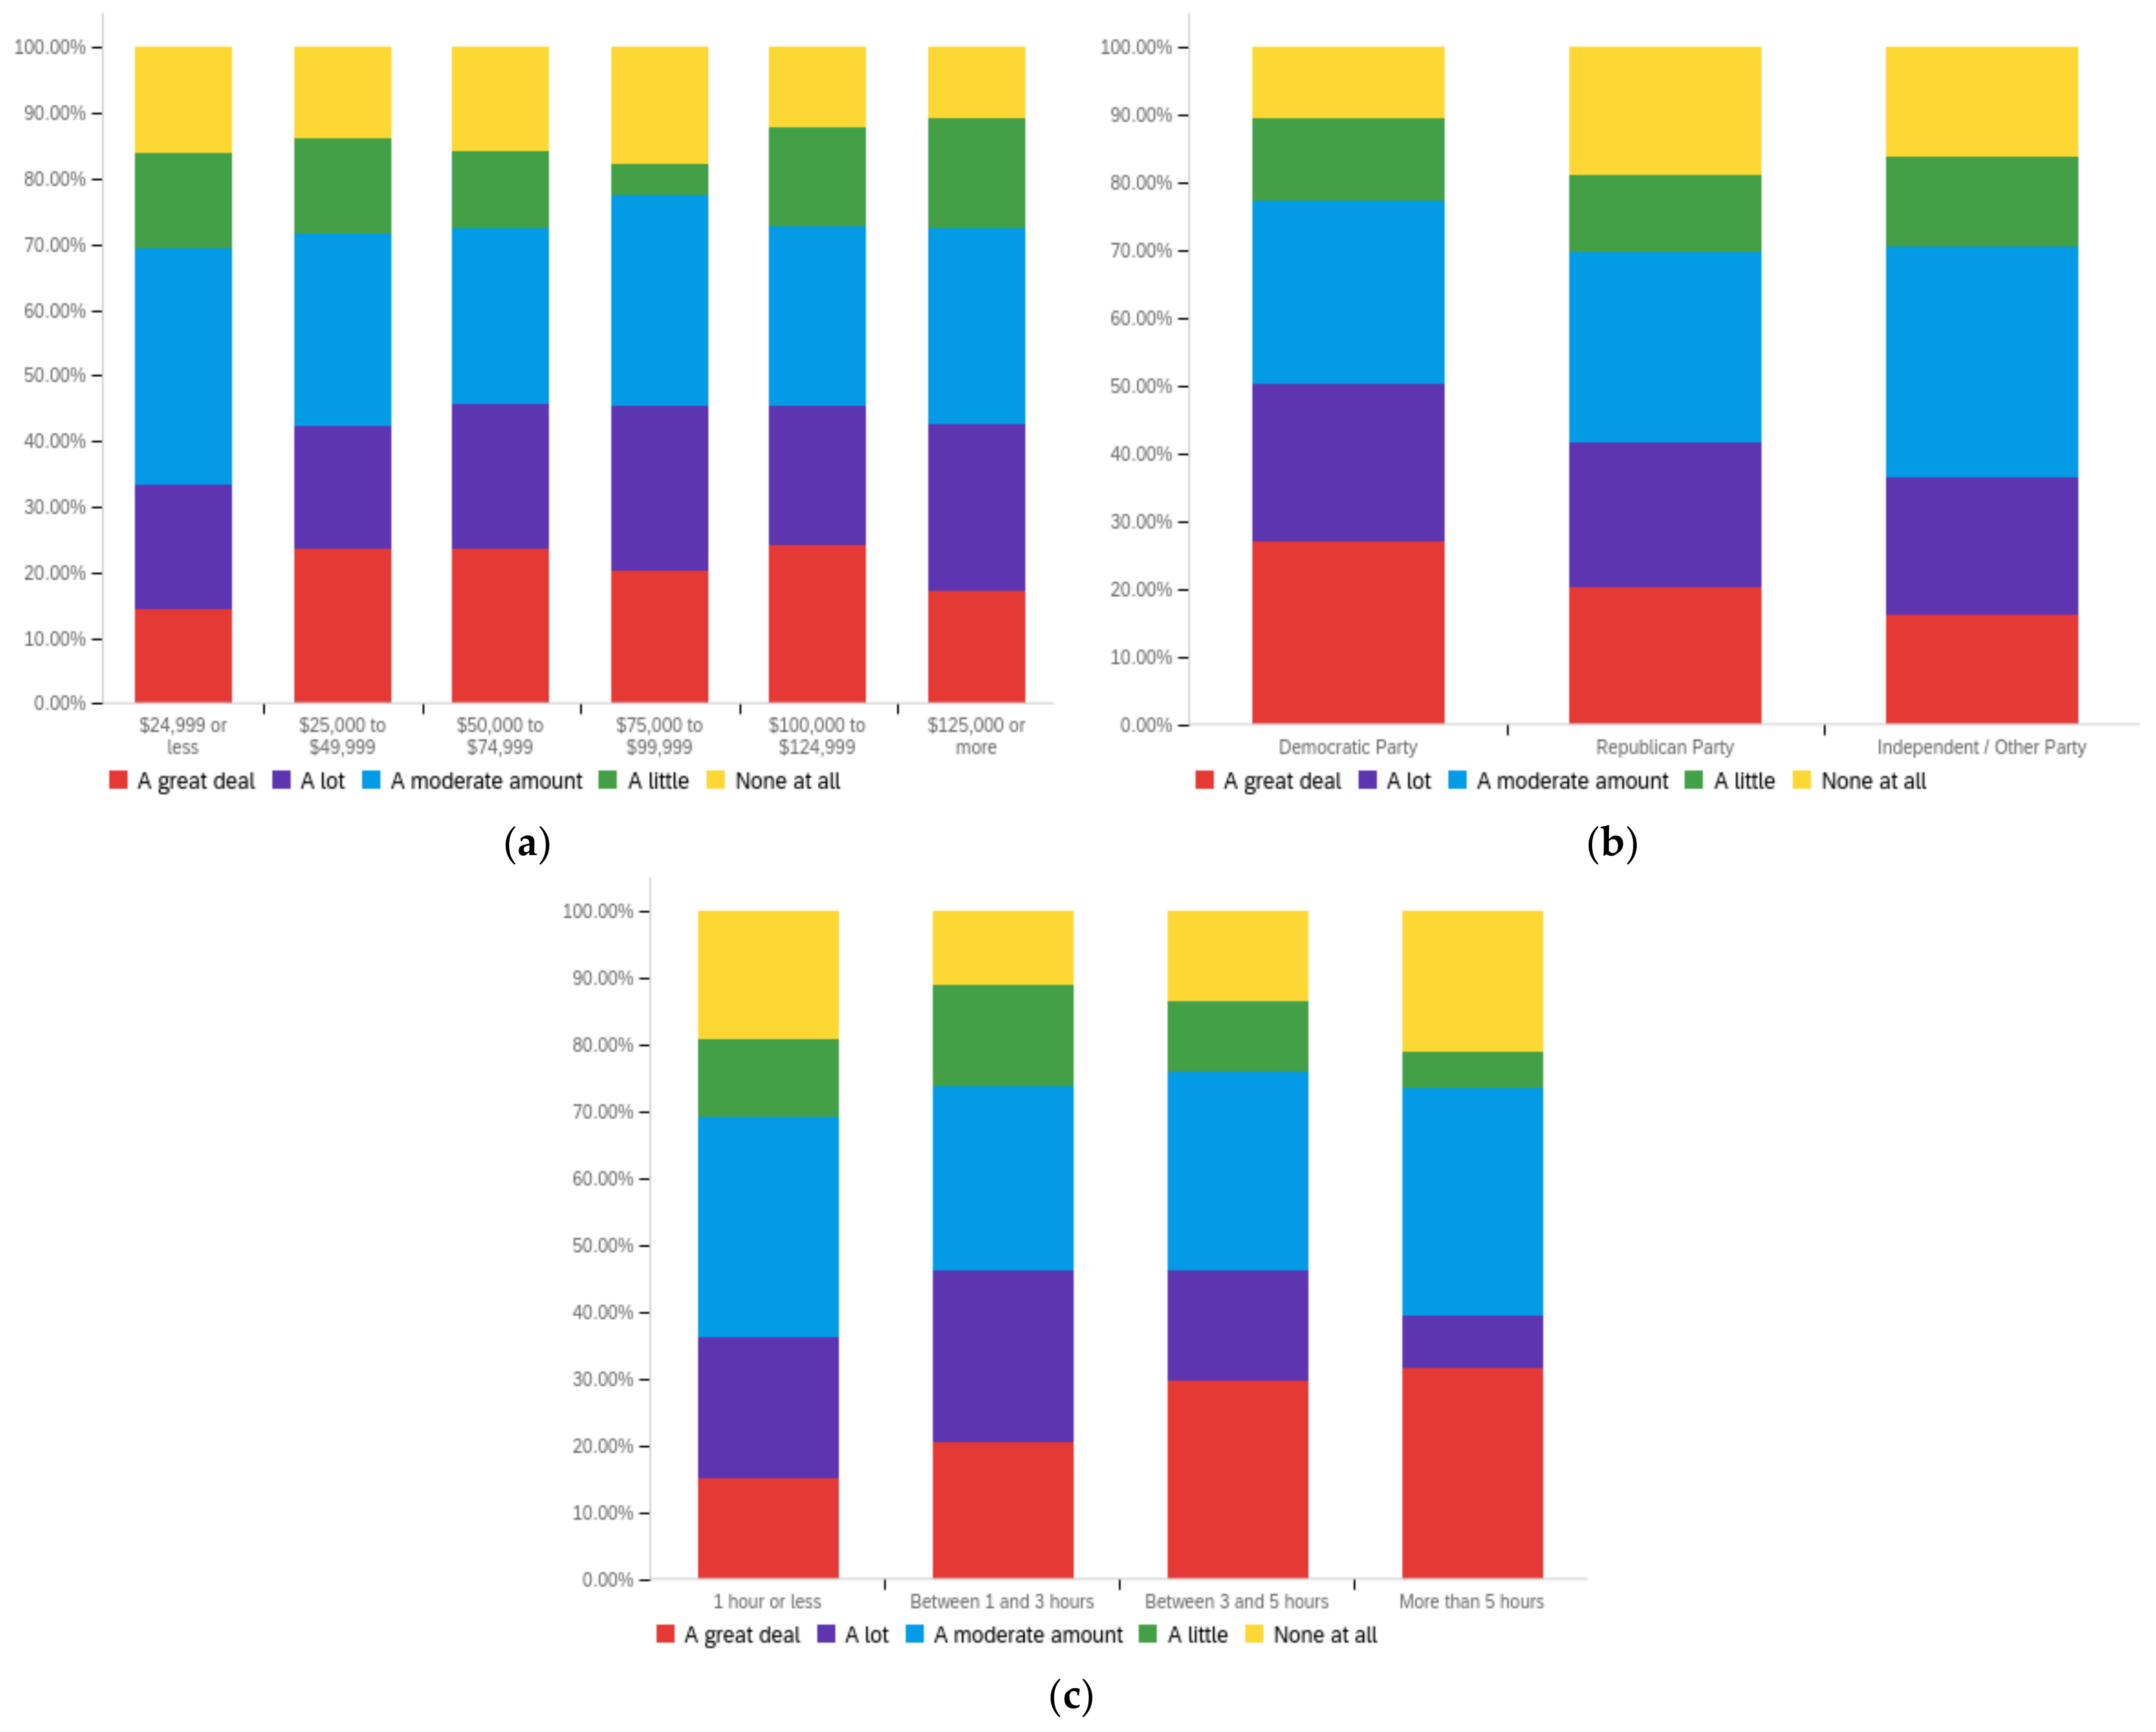
Futureinternet 14 00320 g0a16
Figure A17. Article author’s political alignment—others’ perception impact by: (a) income level (top left), (b) political affiliation (top right) and (c) online usage (bottom).
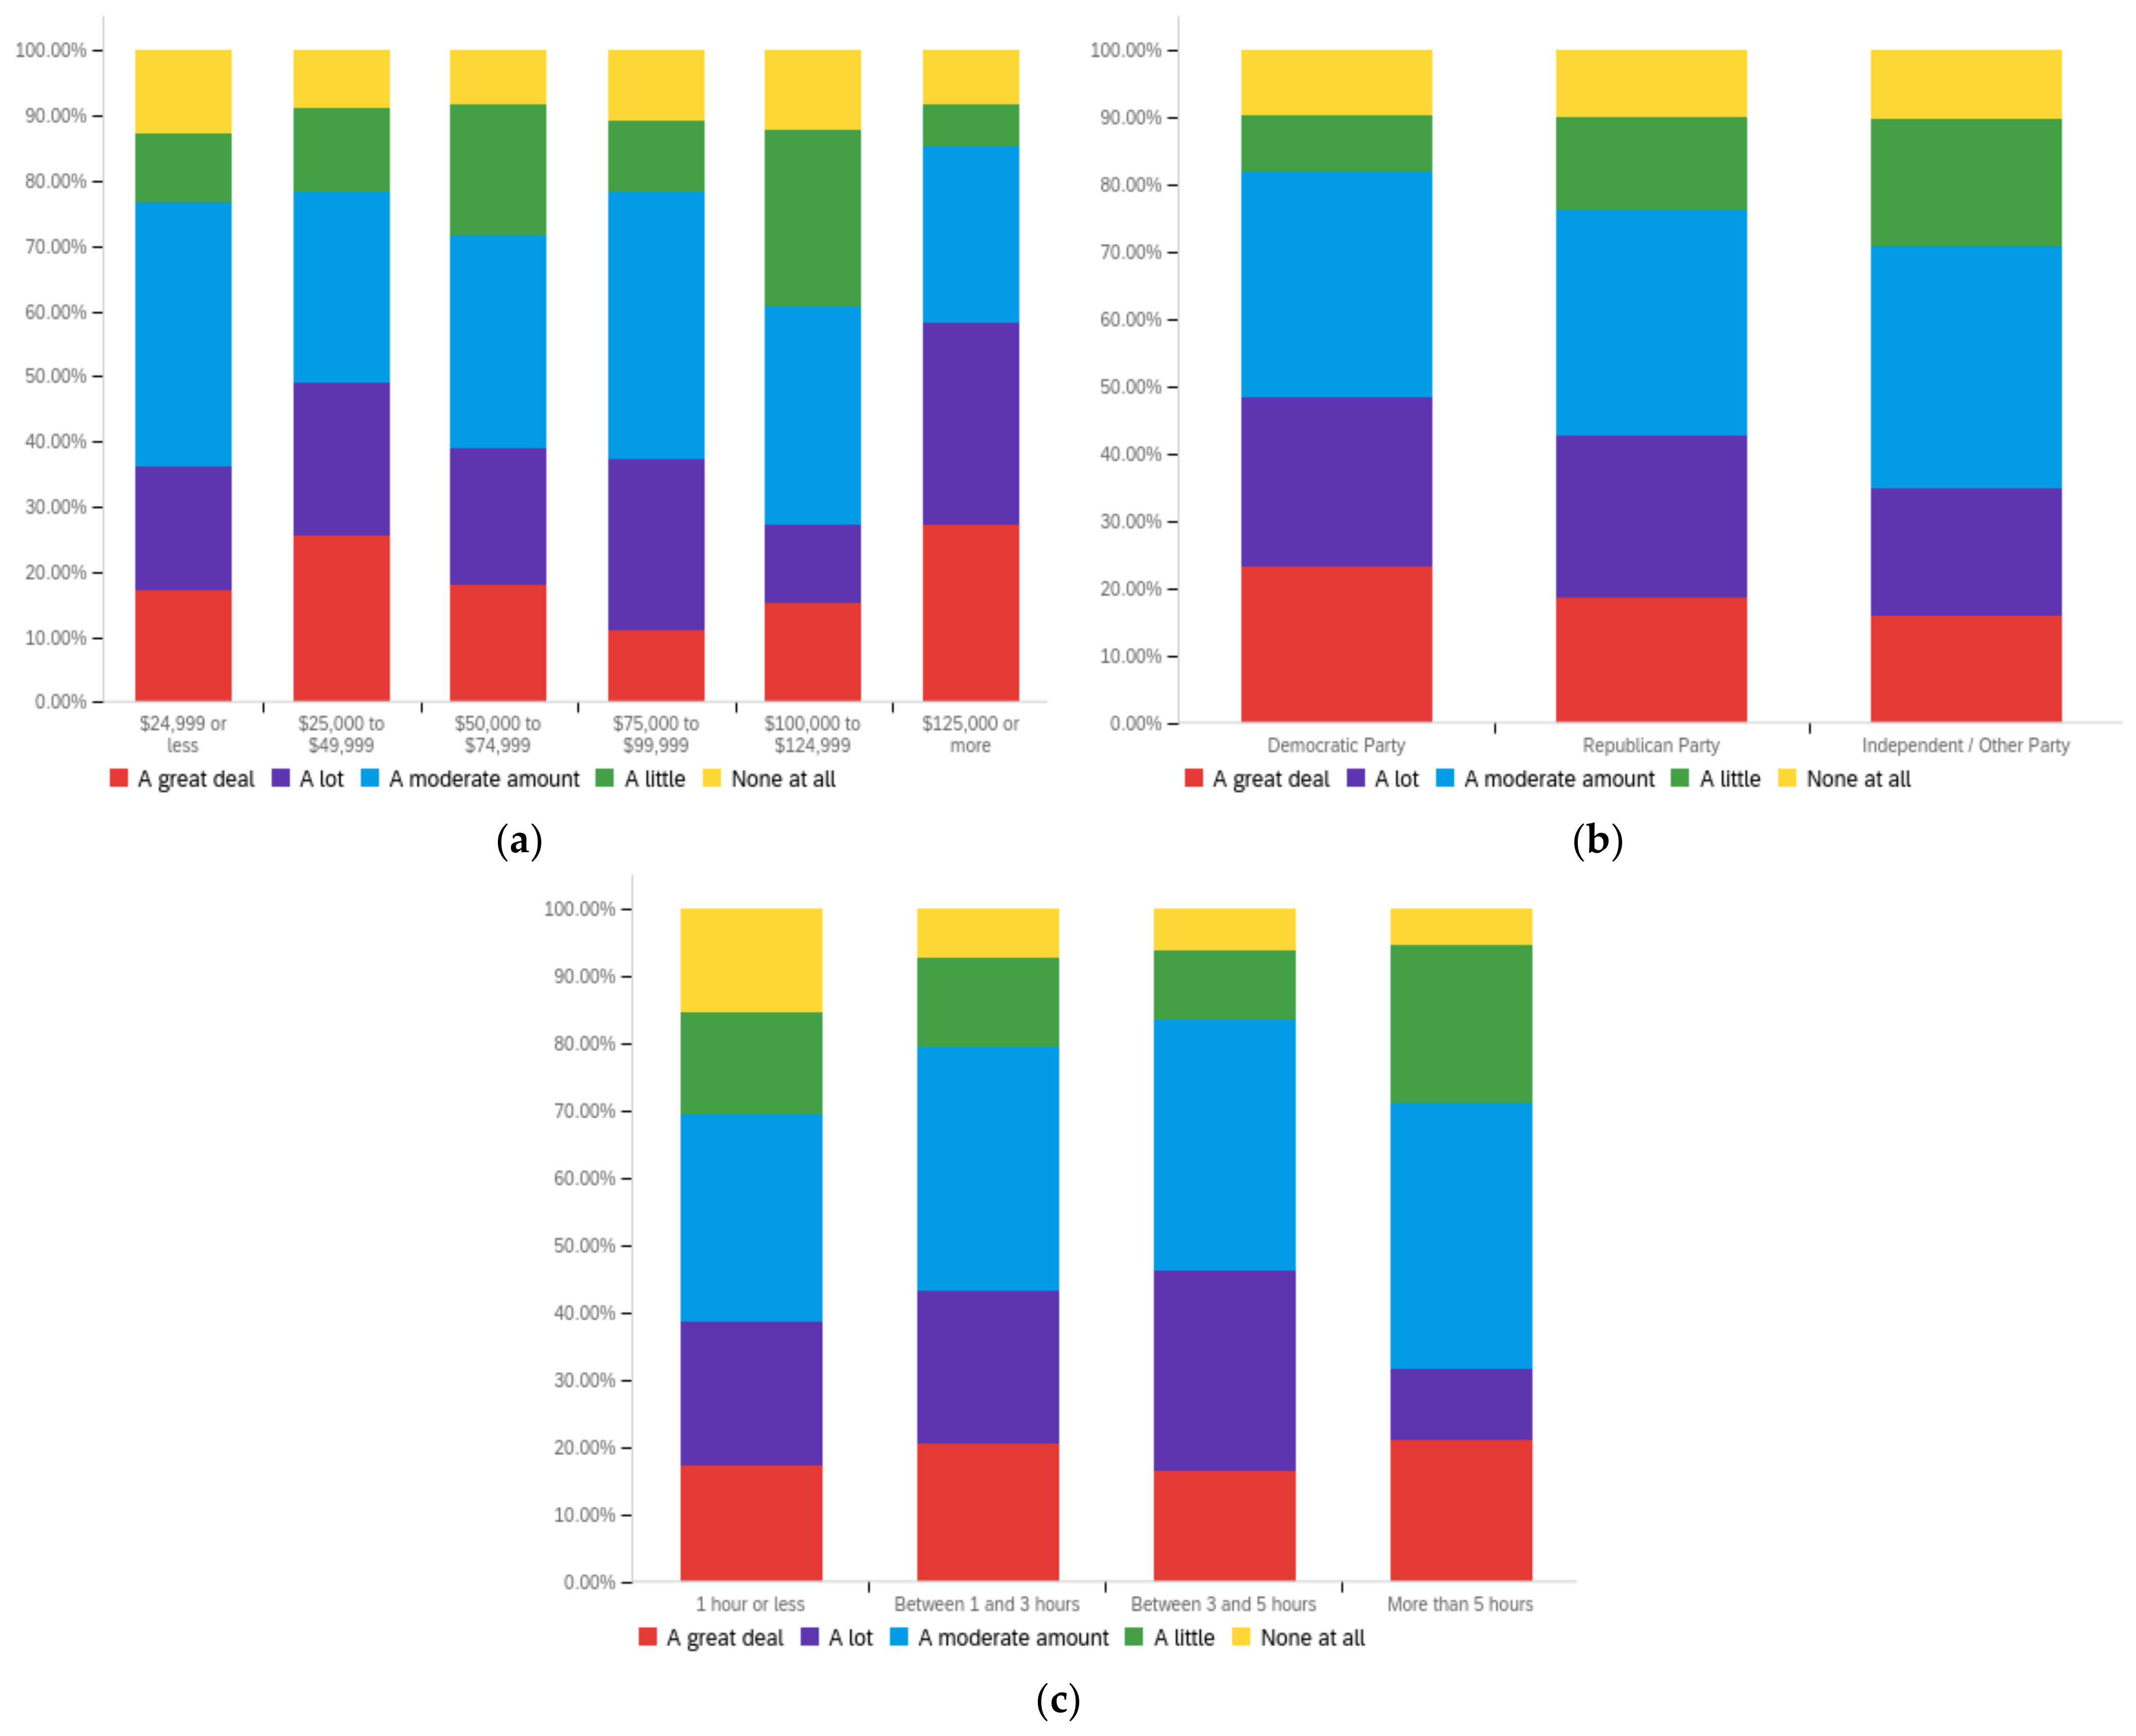
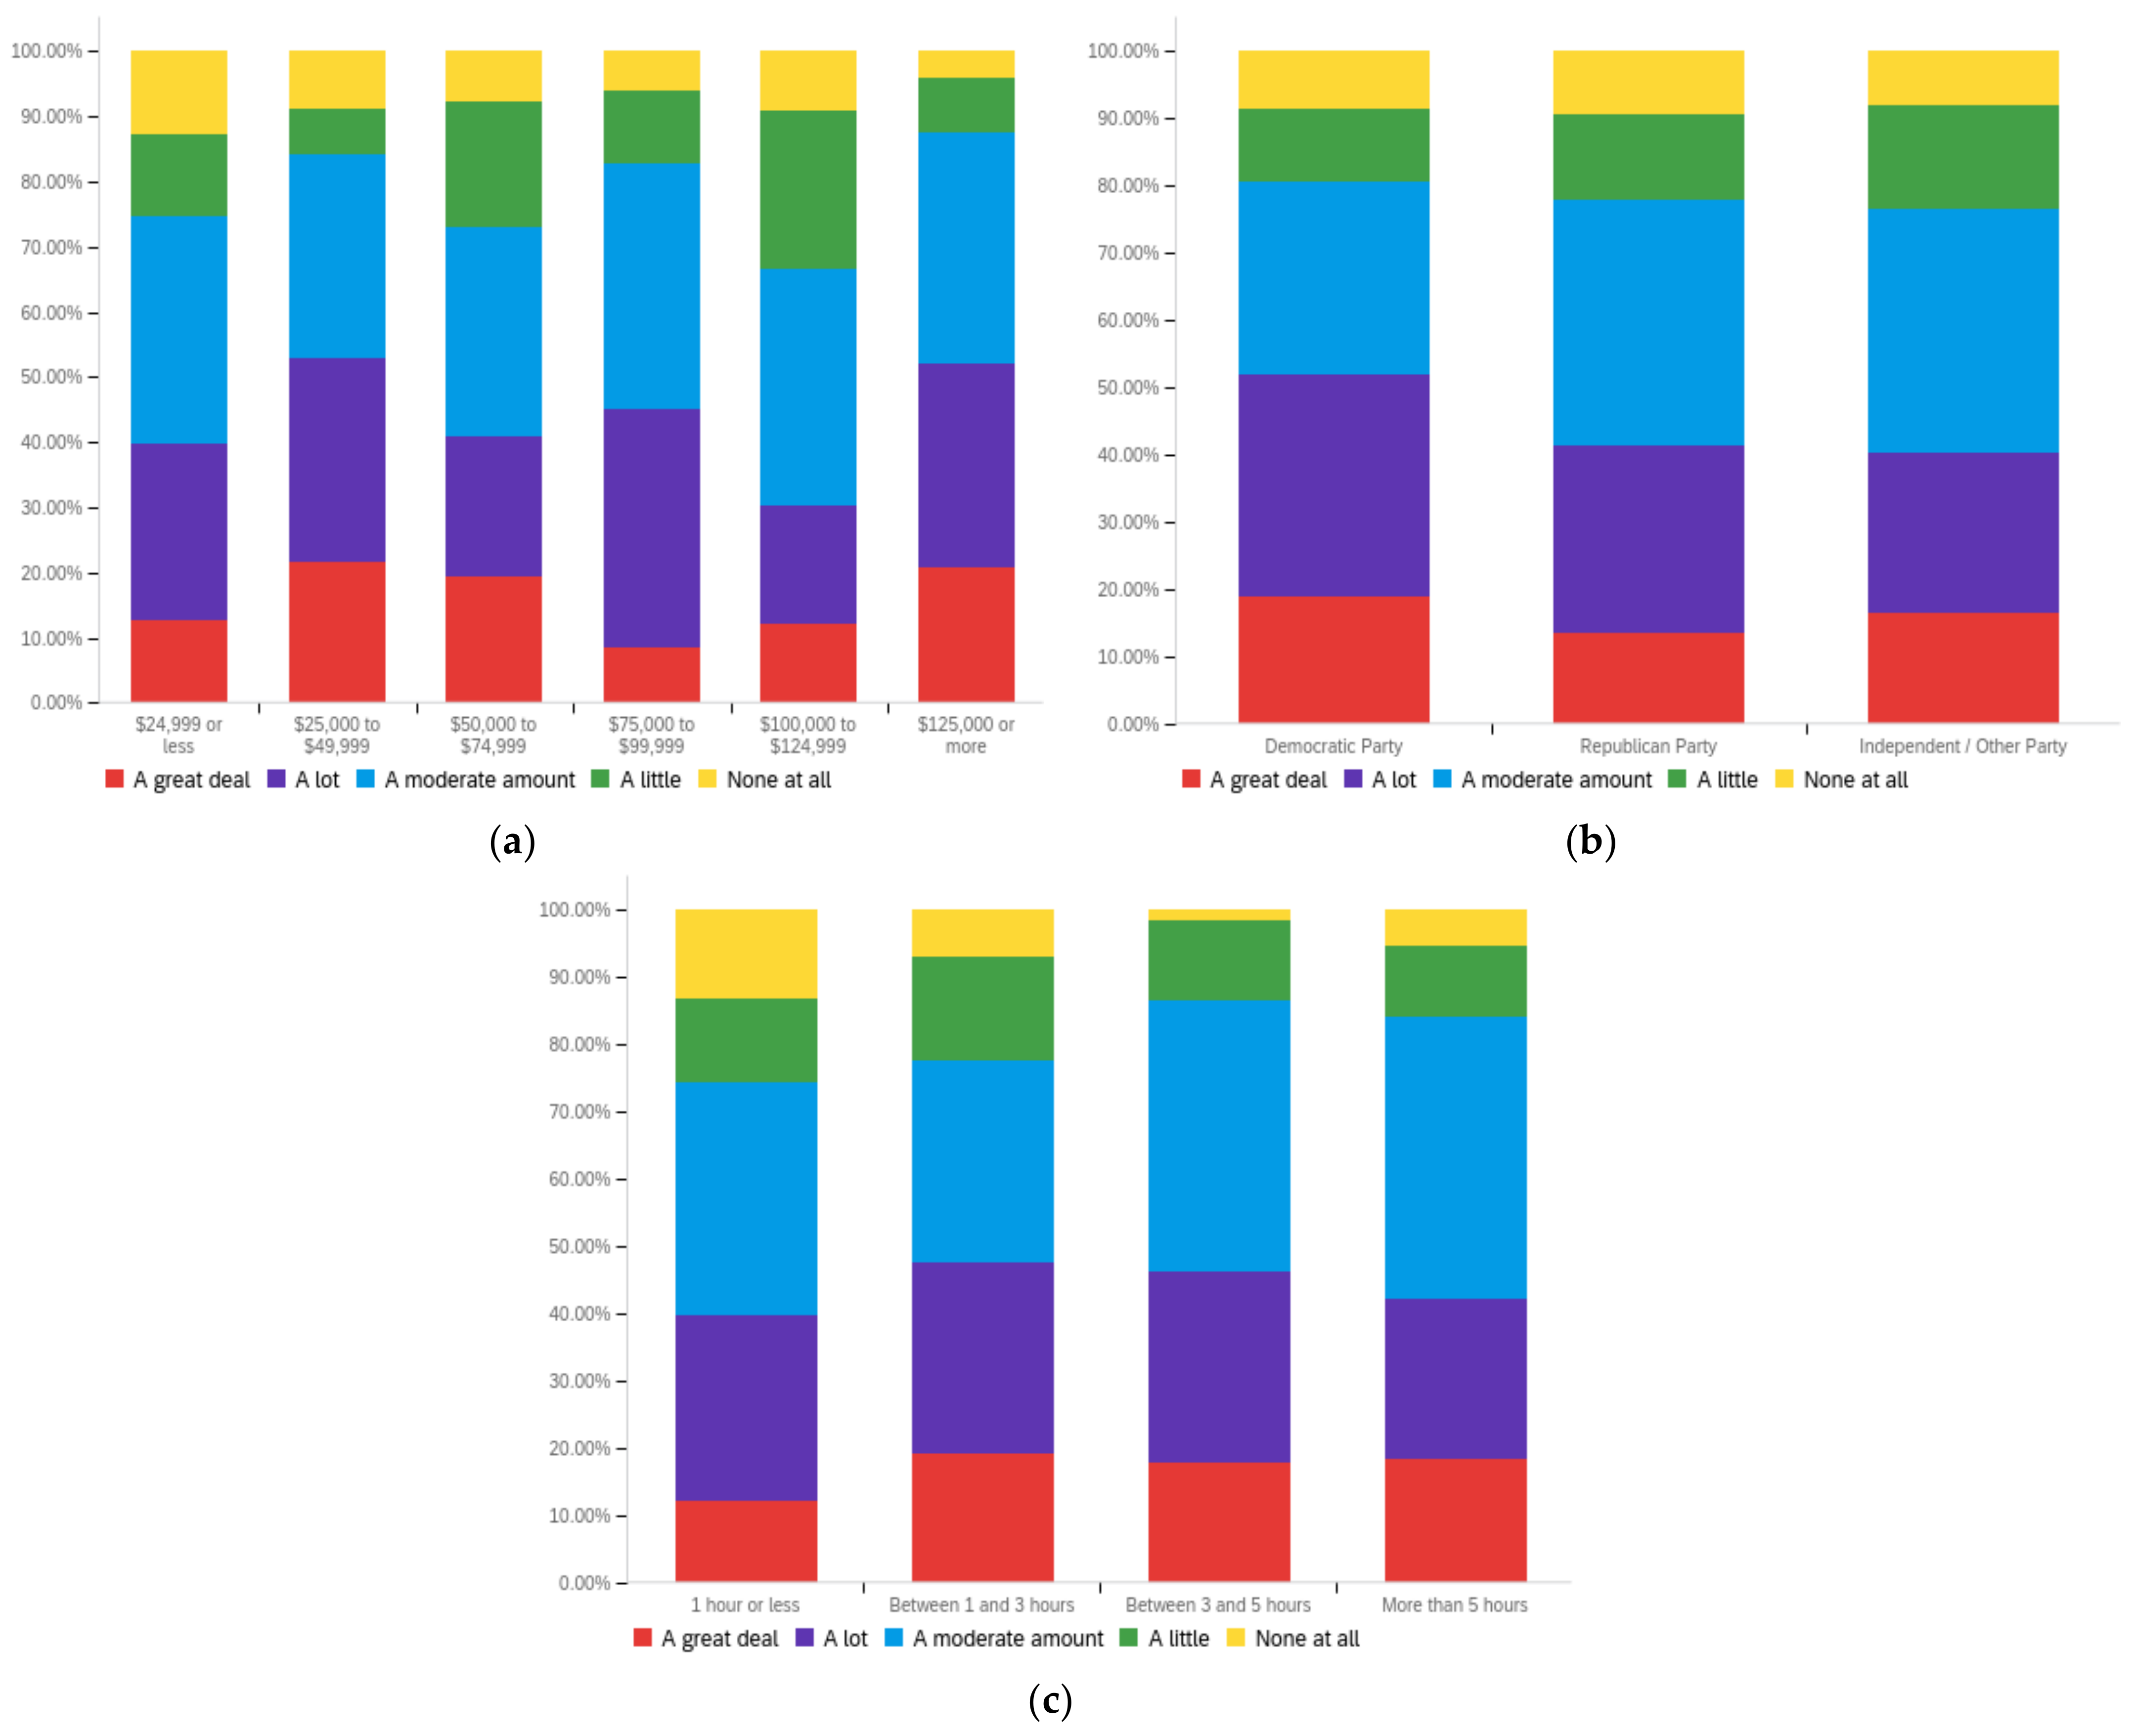
Futureinternet 14 00320 g0a17aFutureinternet 14 00320 g0a17b
Figure A18. Article author’s political alignment—ideal perception impact by: (a) income level (top left), (b) political affiliation (top right) and (c) online usage (bottom).
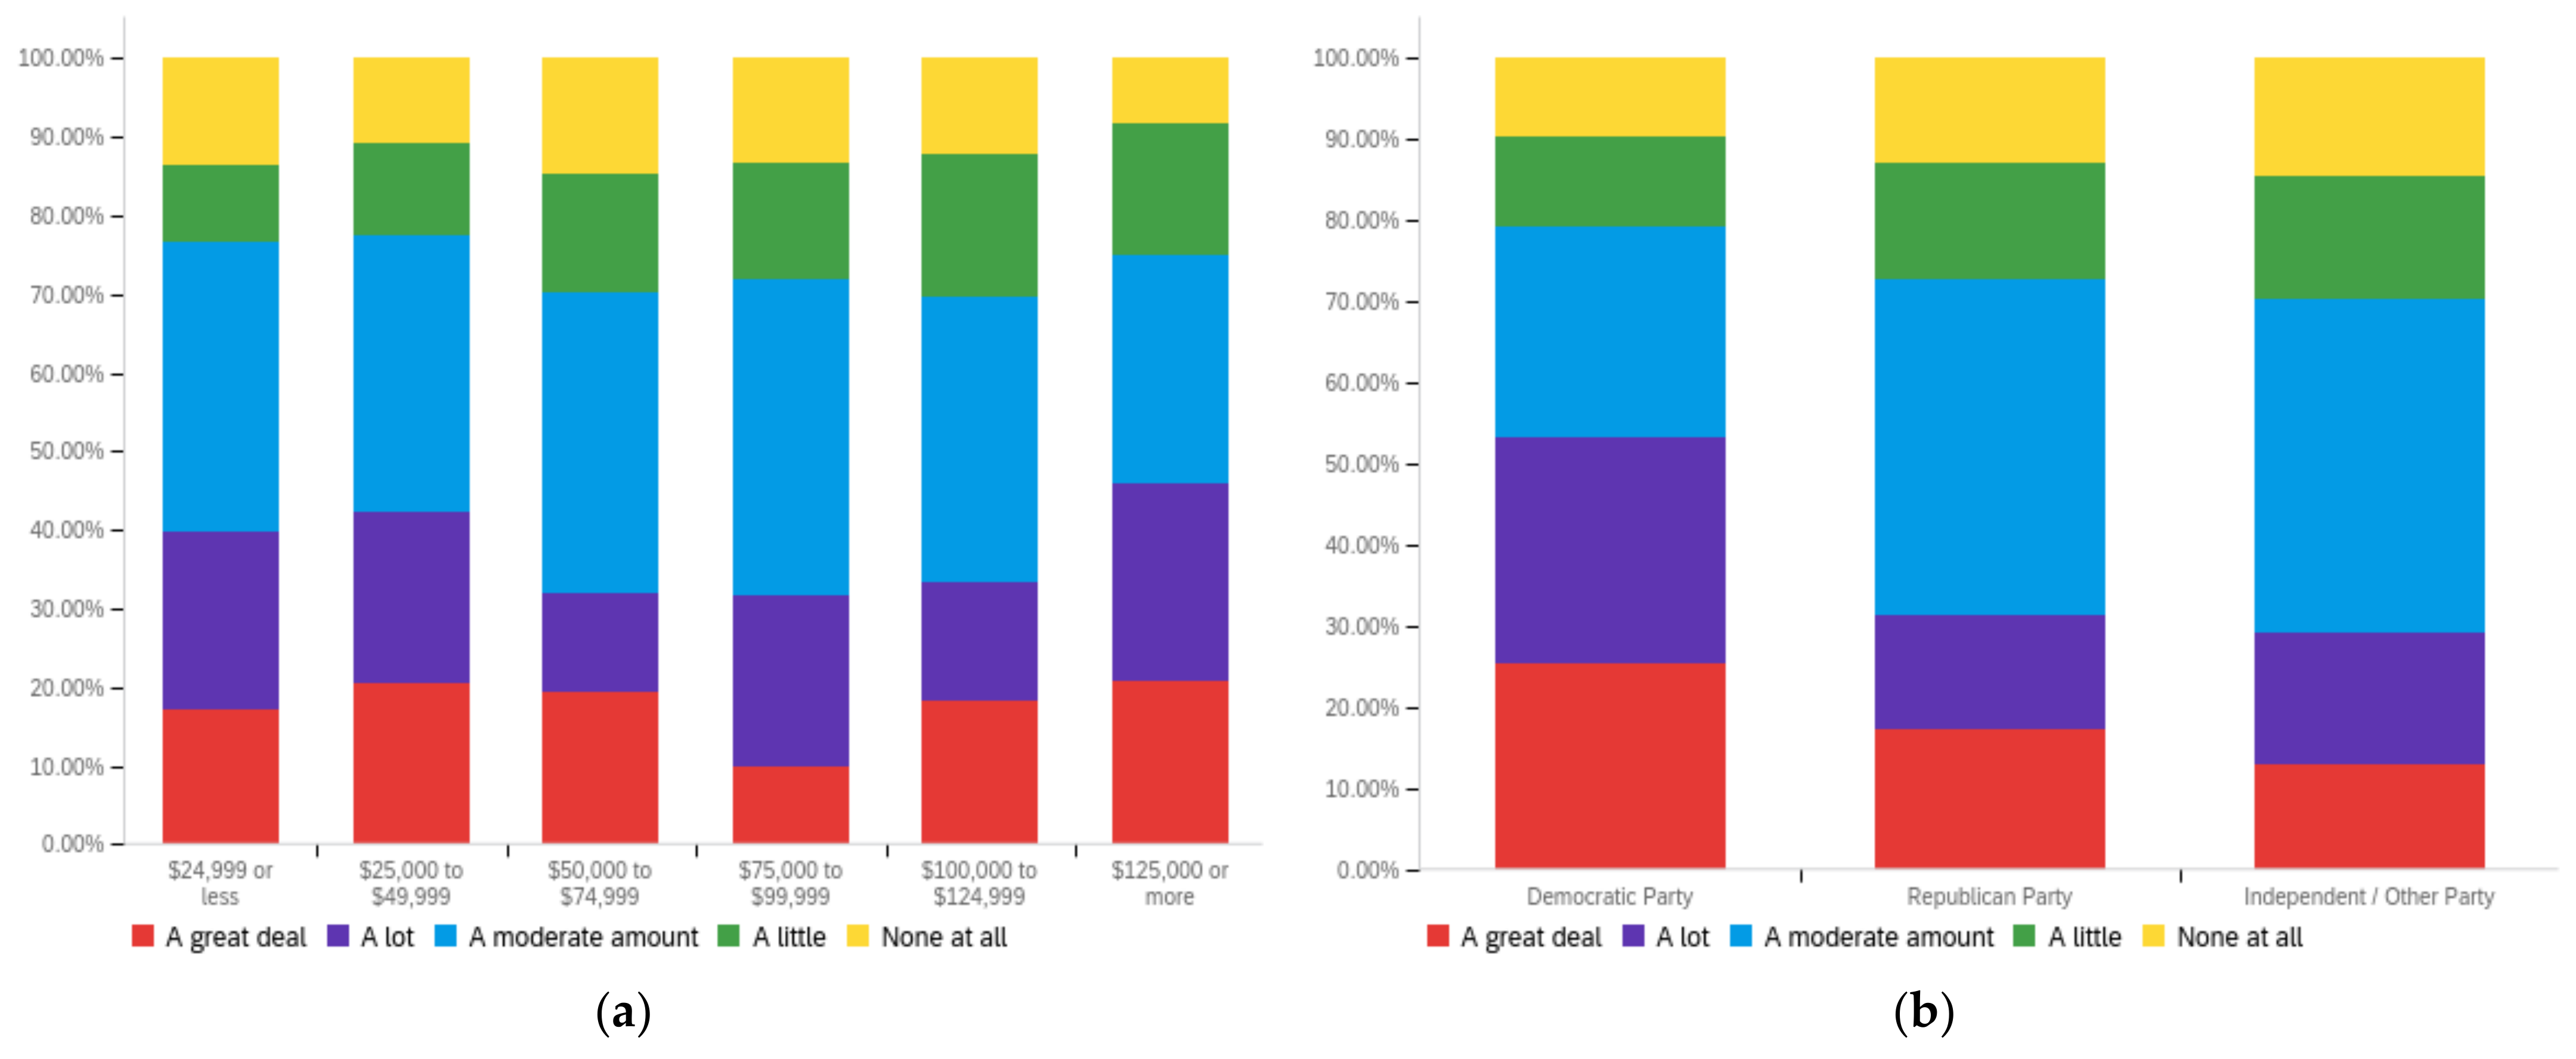
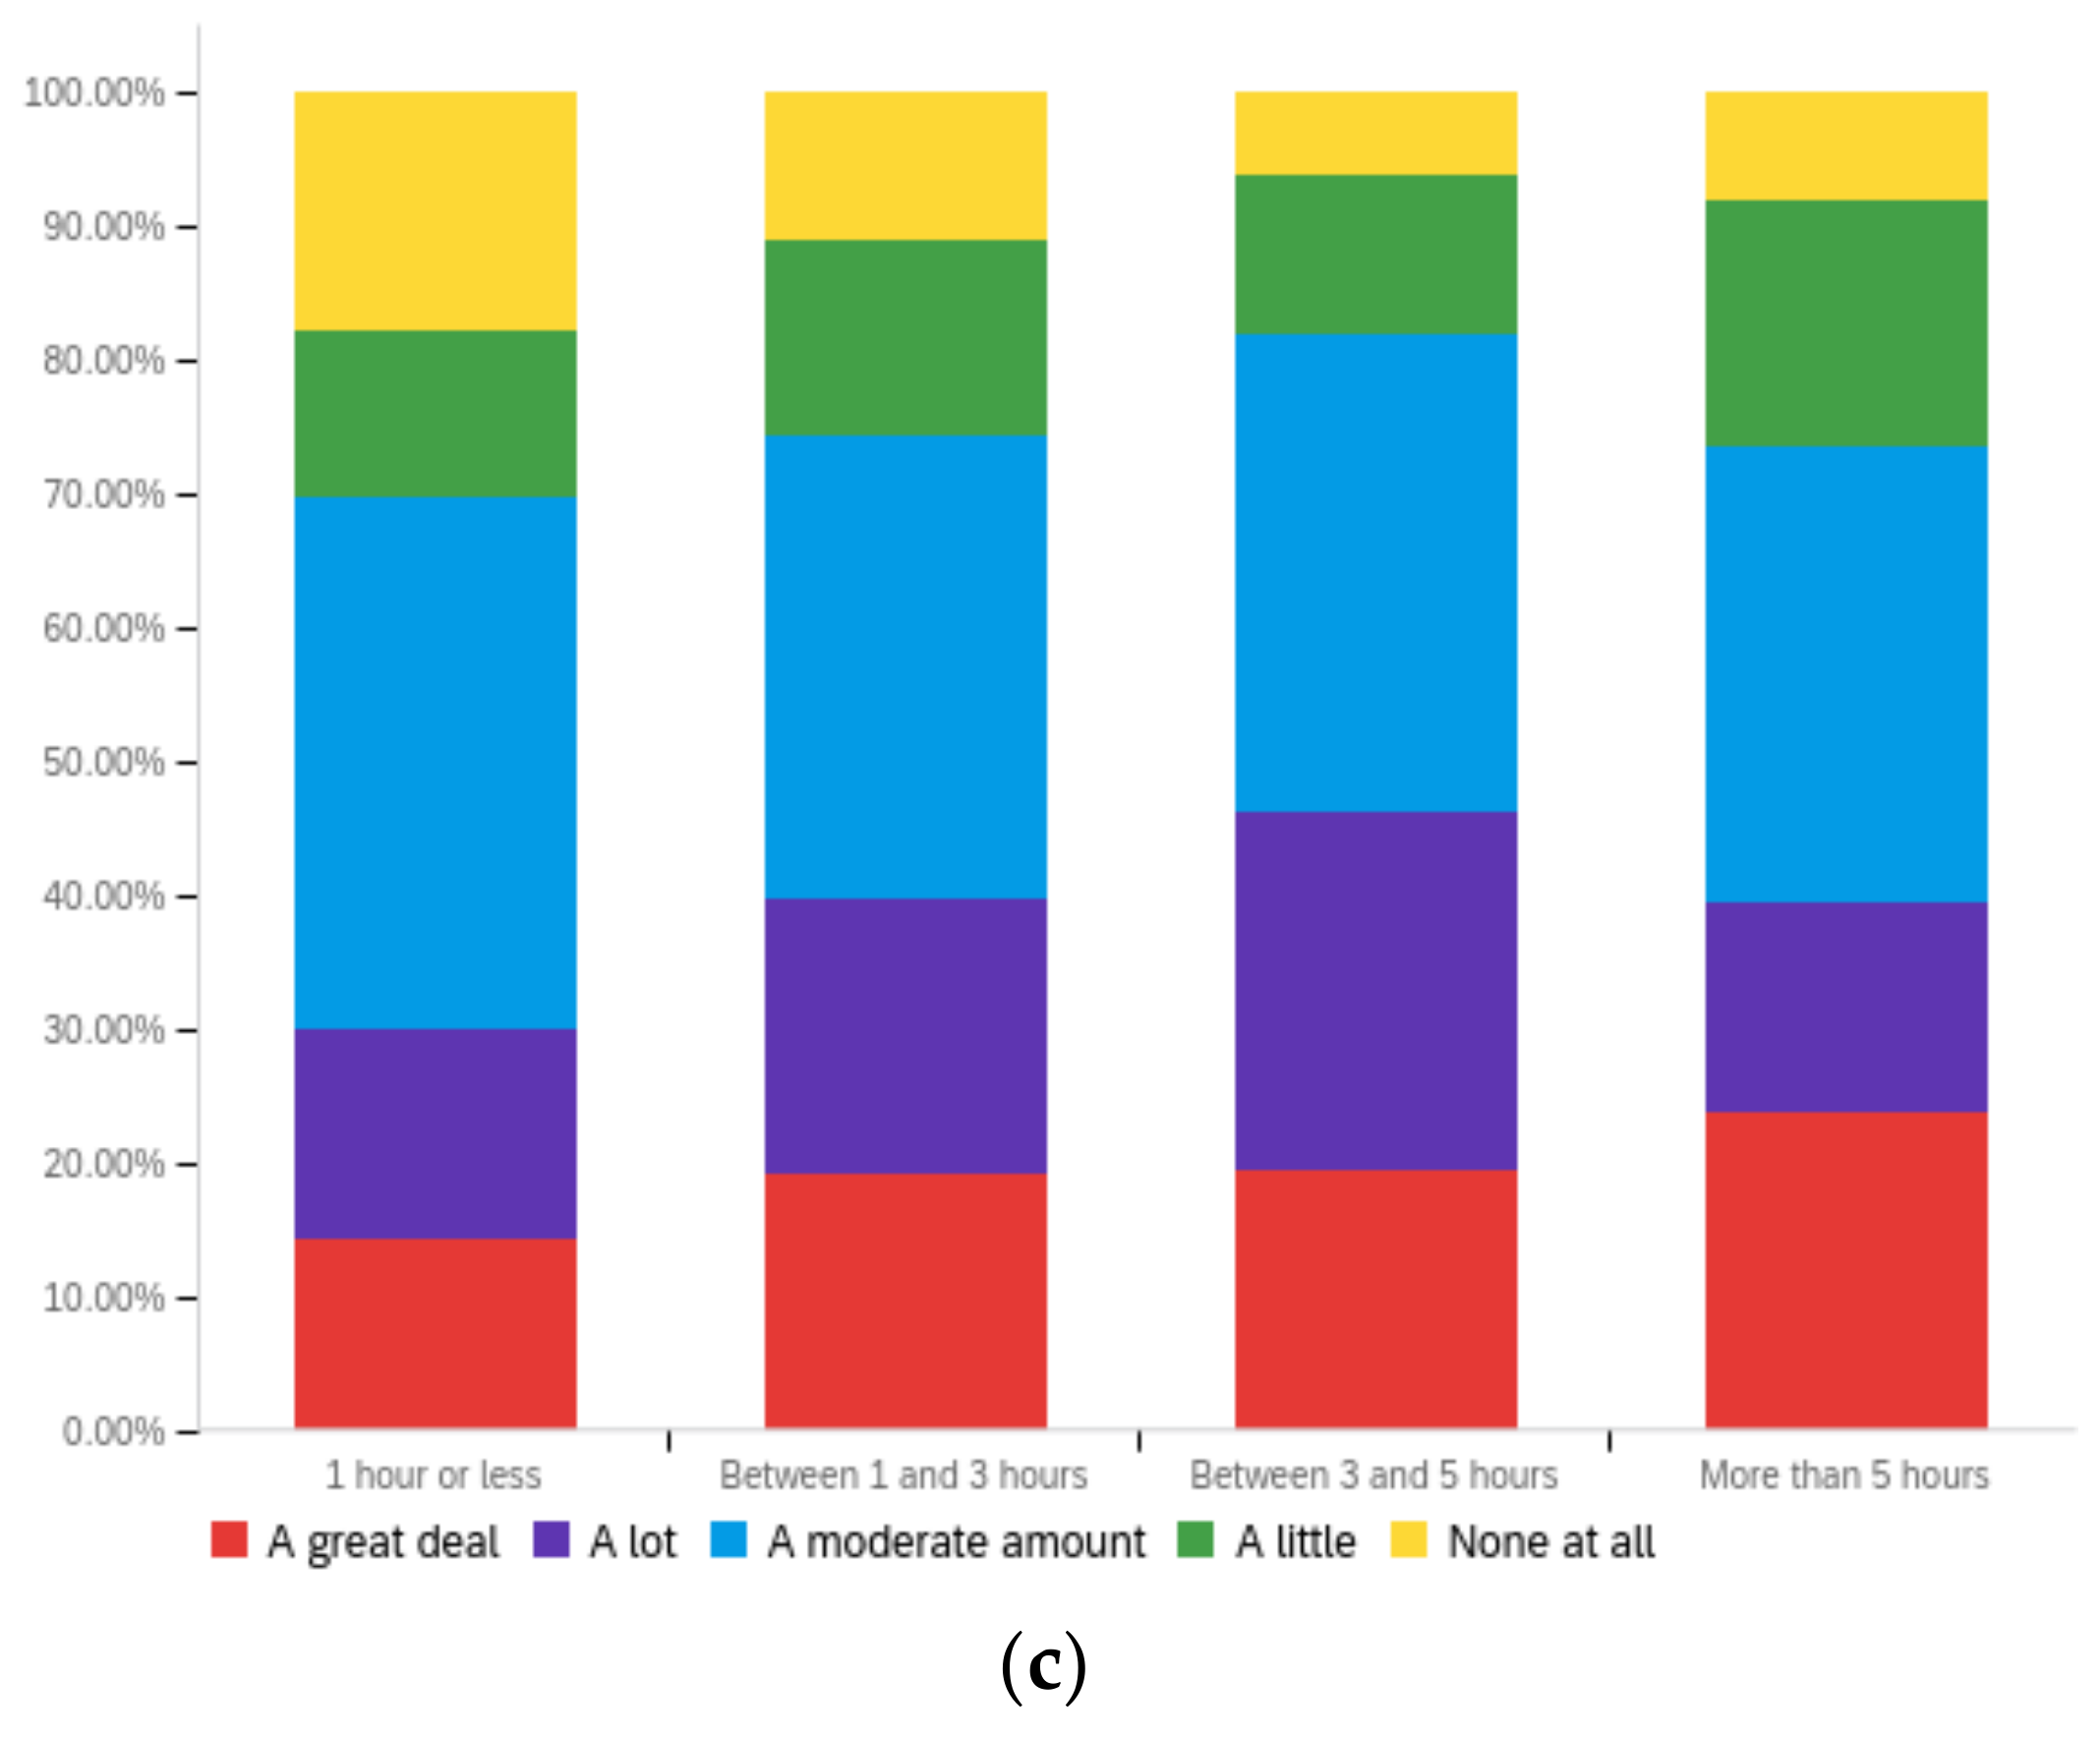
Futureinternet 14 00320 g0a18
Figure A19. Article publisher’s political alignment—personal perception impact by: (a) income level (top left), (b) political affiliation (top right) and (c) online usage (bottom).
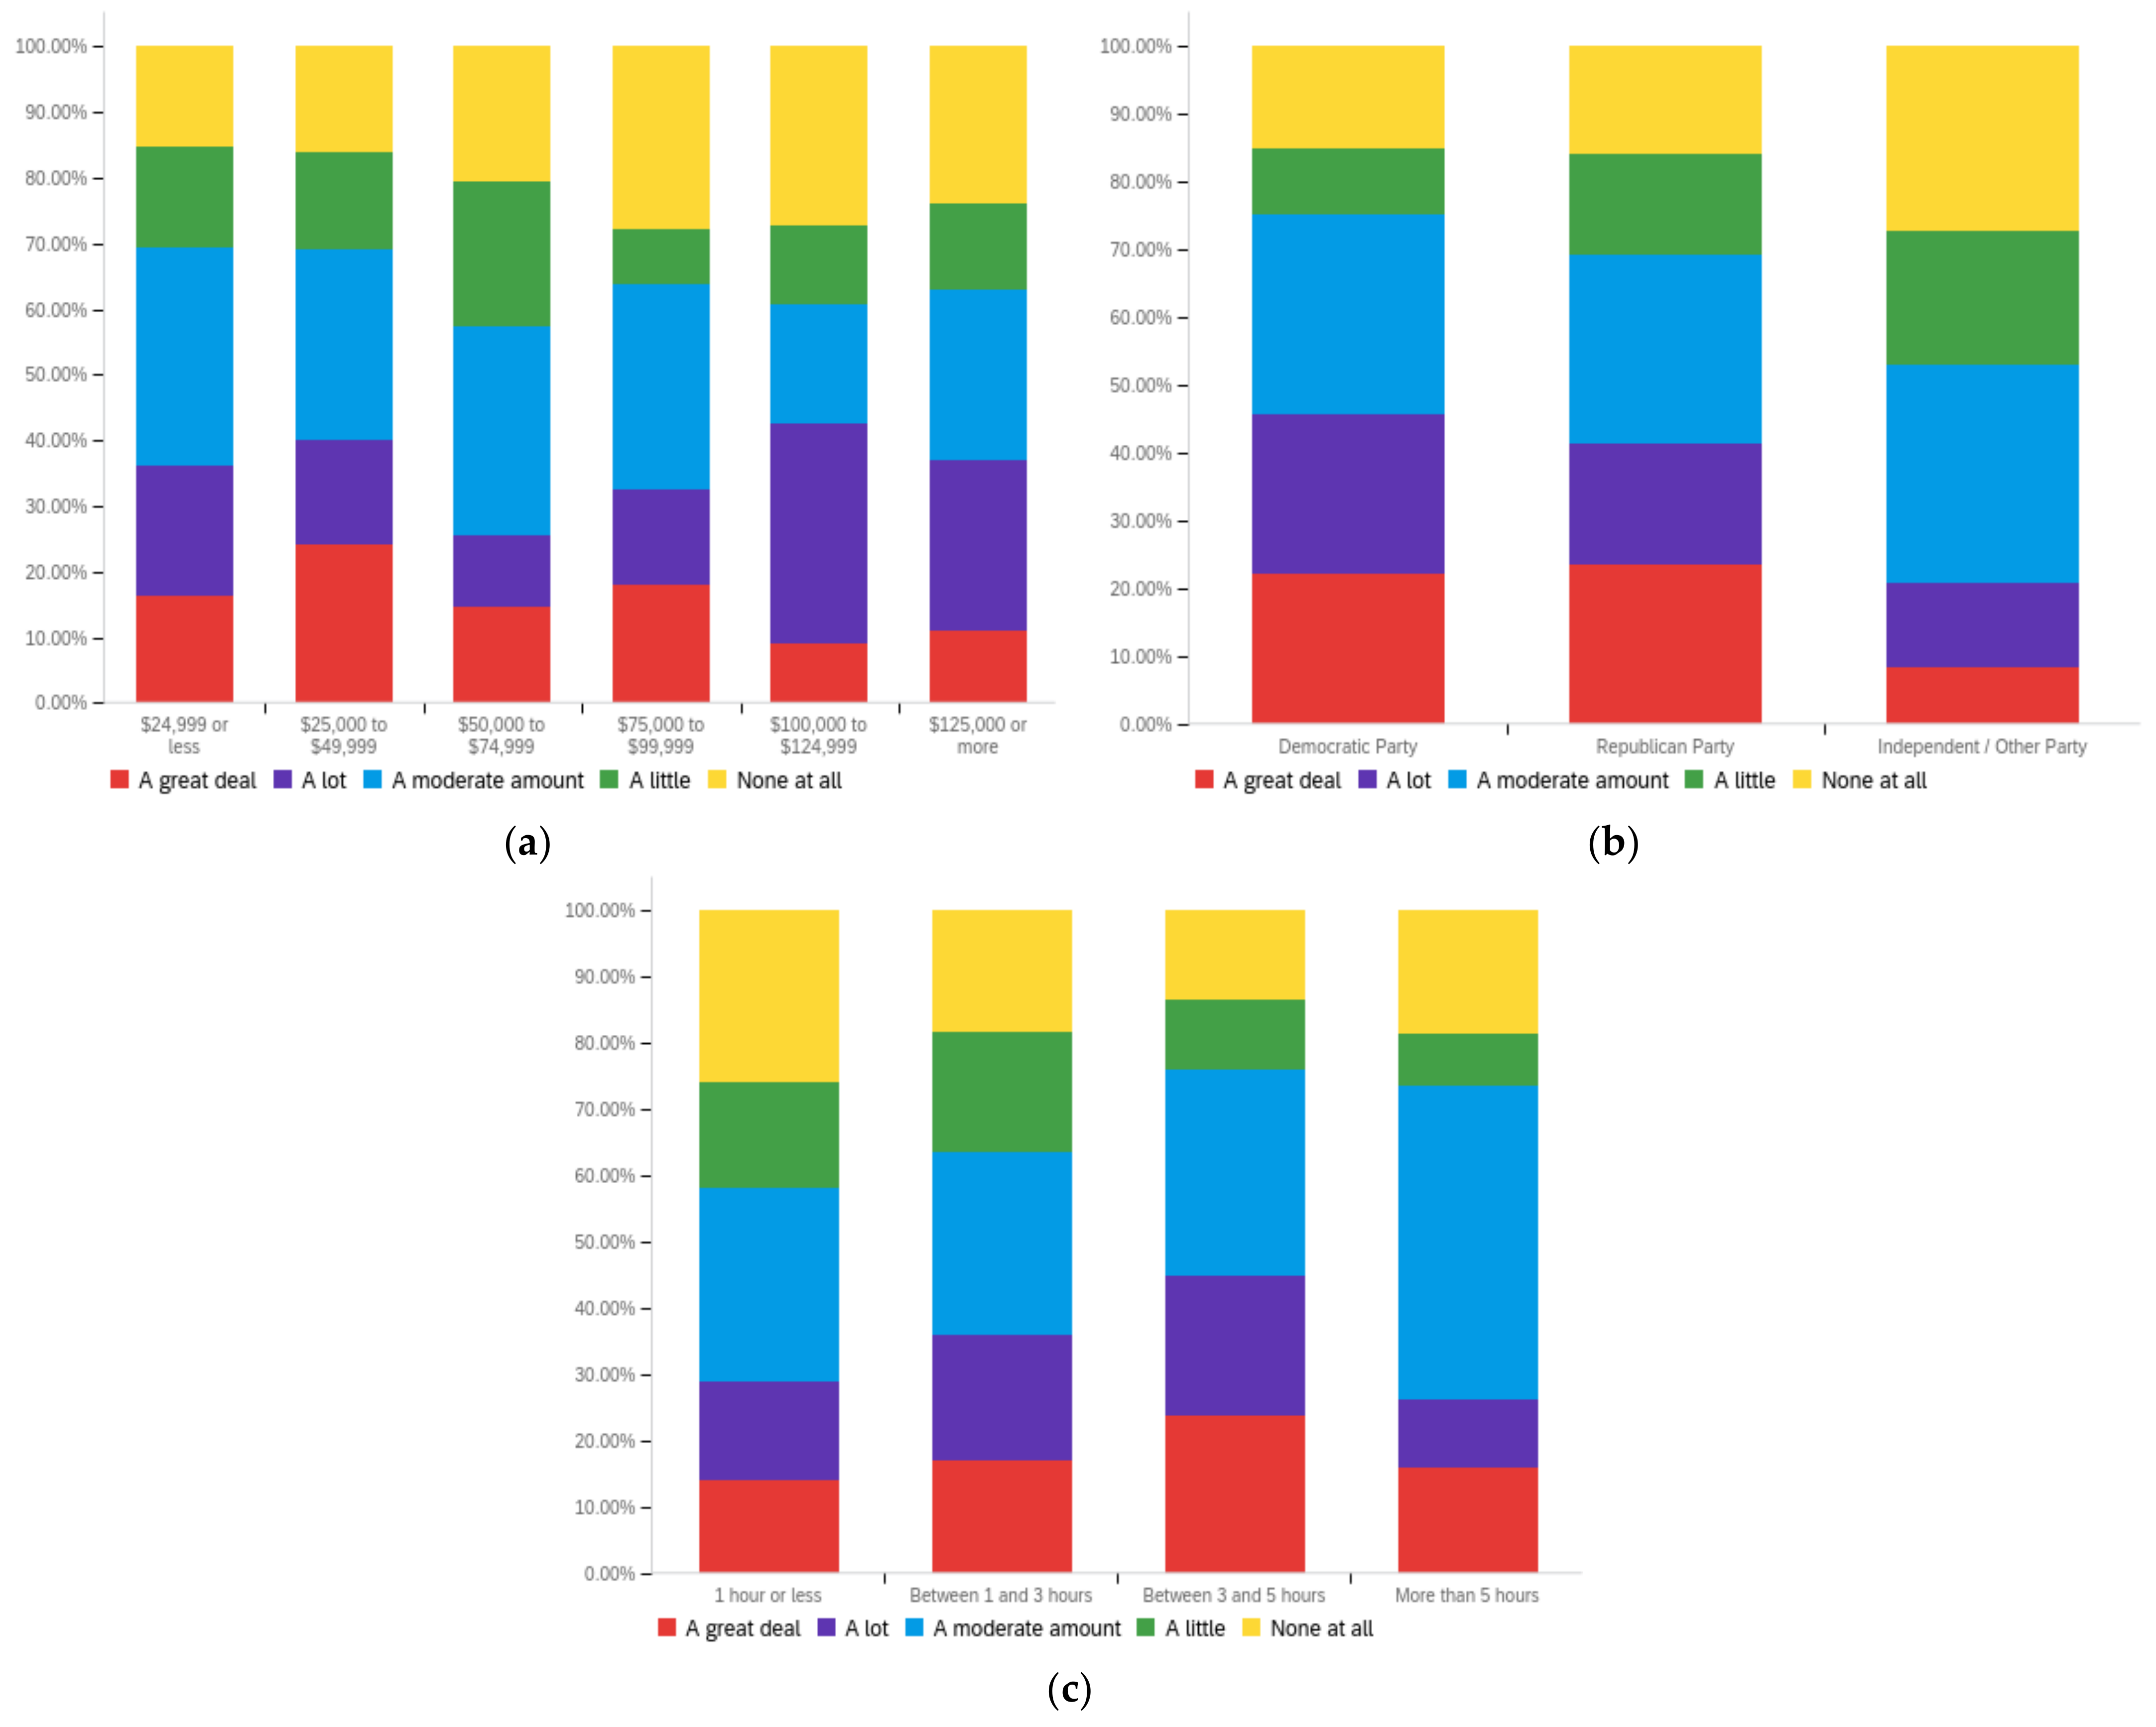
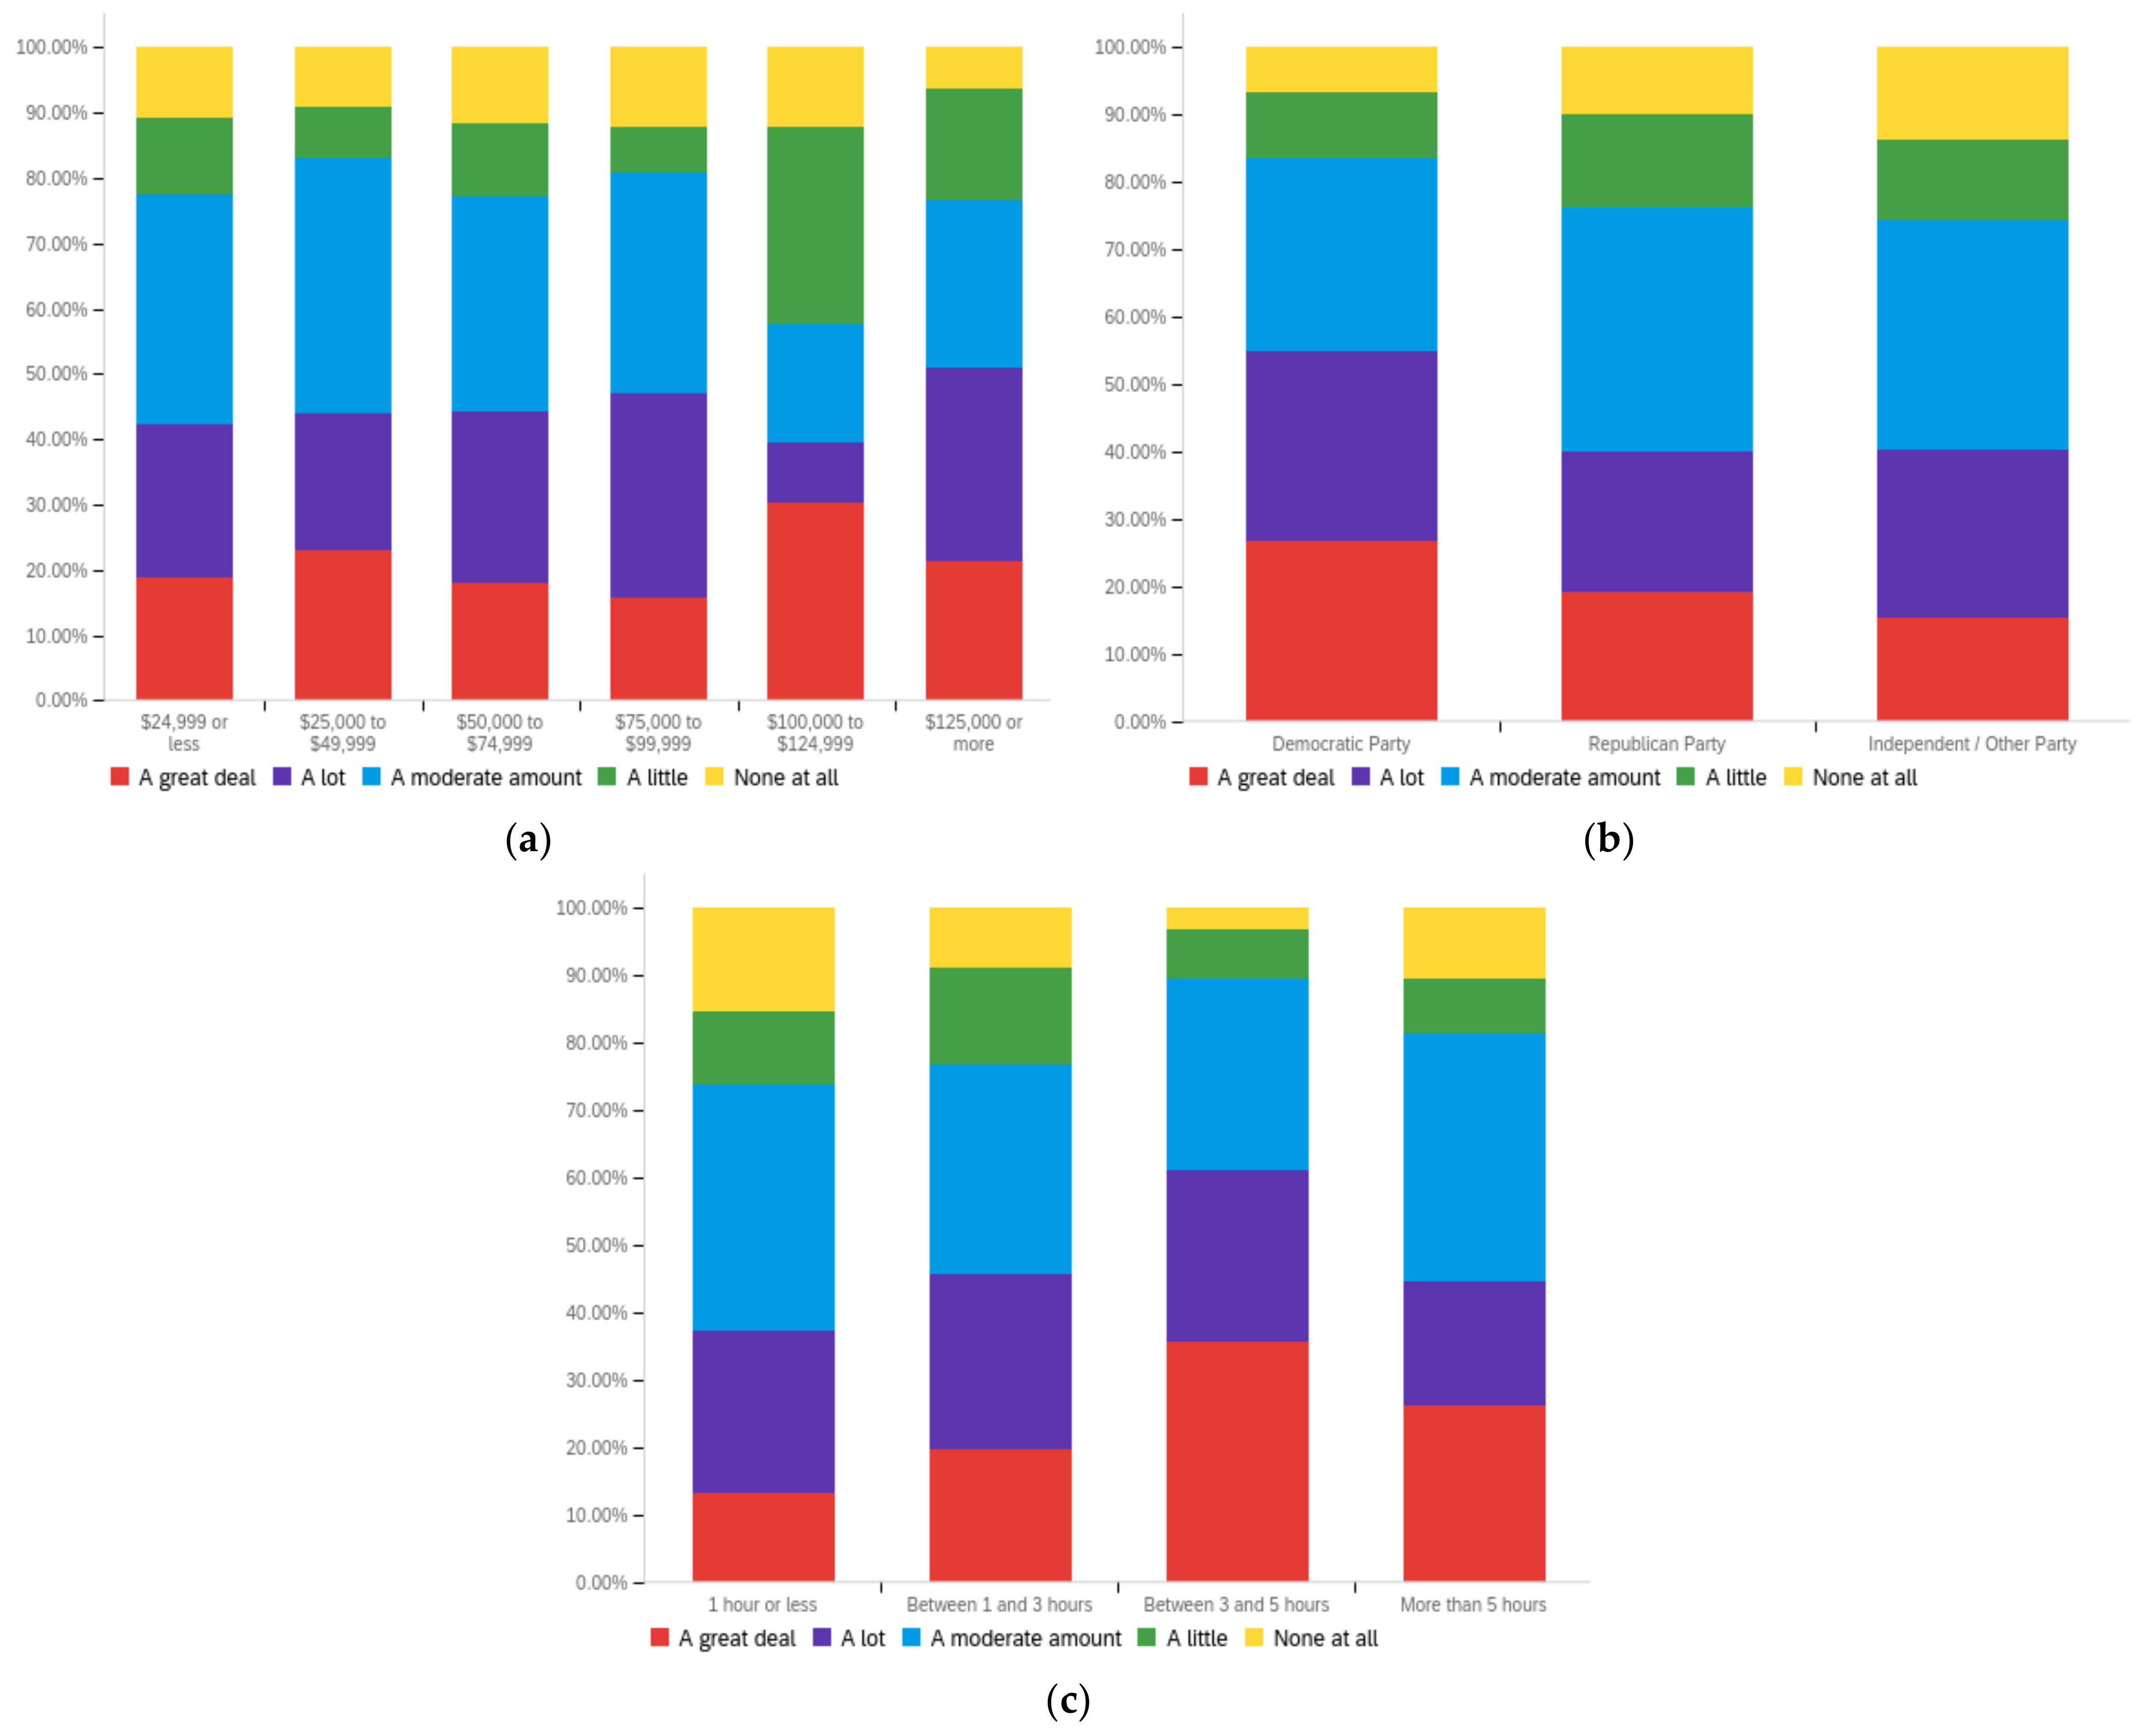
Futureinternet 14 00320 g0a19
Figure A20. Article publisher’s political alignment—others’ perception impact by: (a) income level (top left), (b) political affiliation (top right) and (c) online usage (bottom).
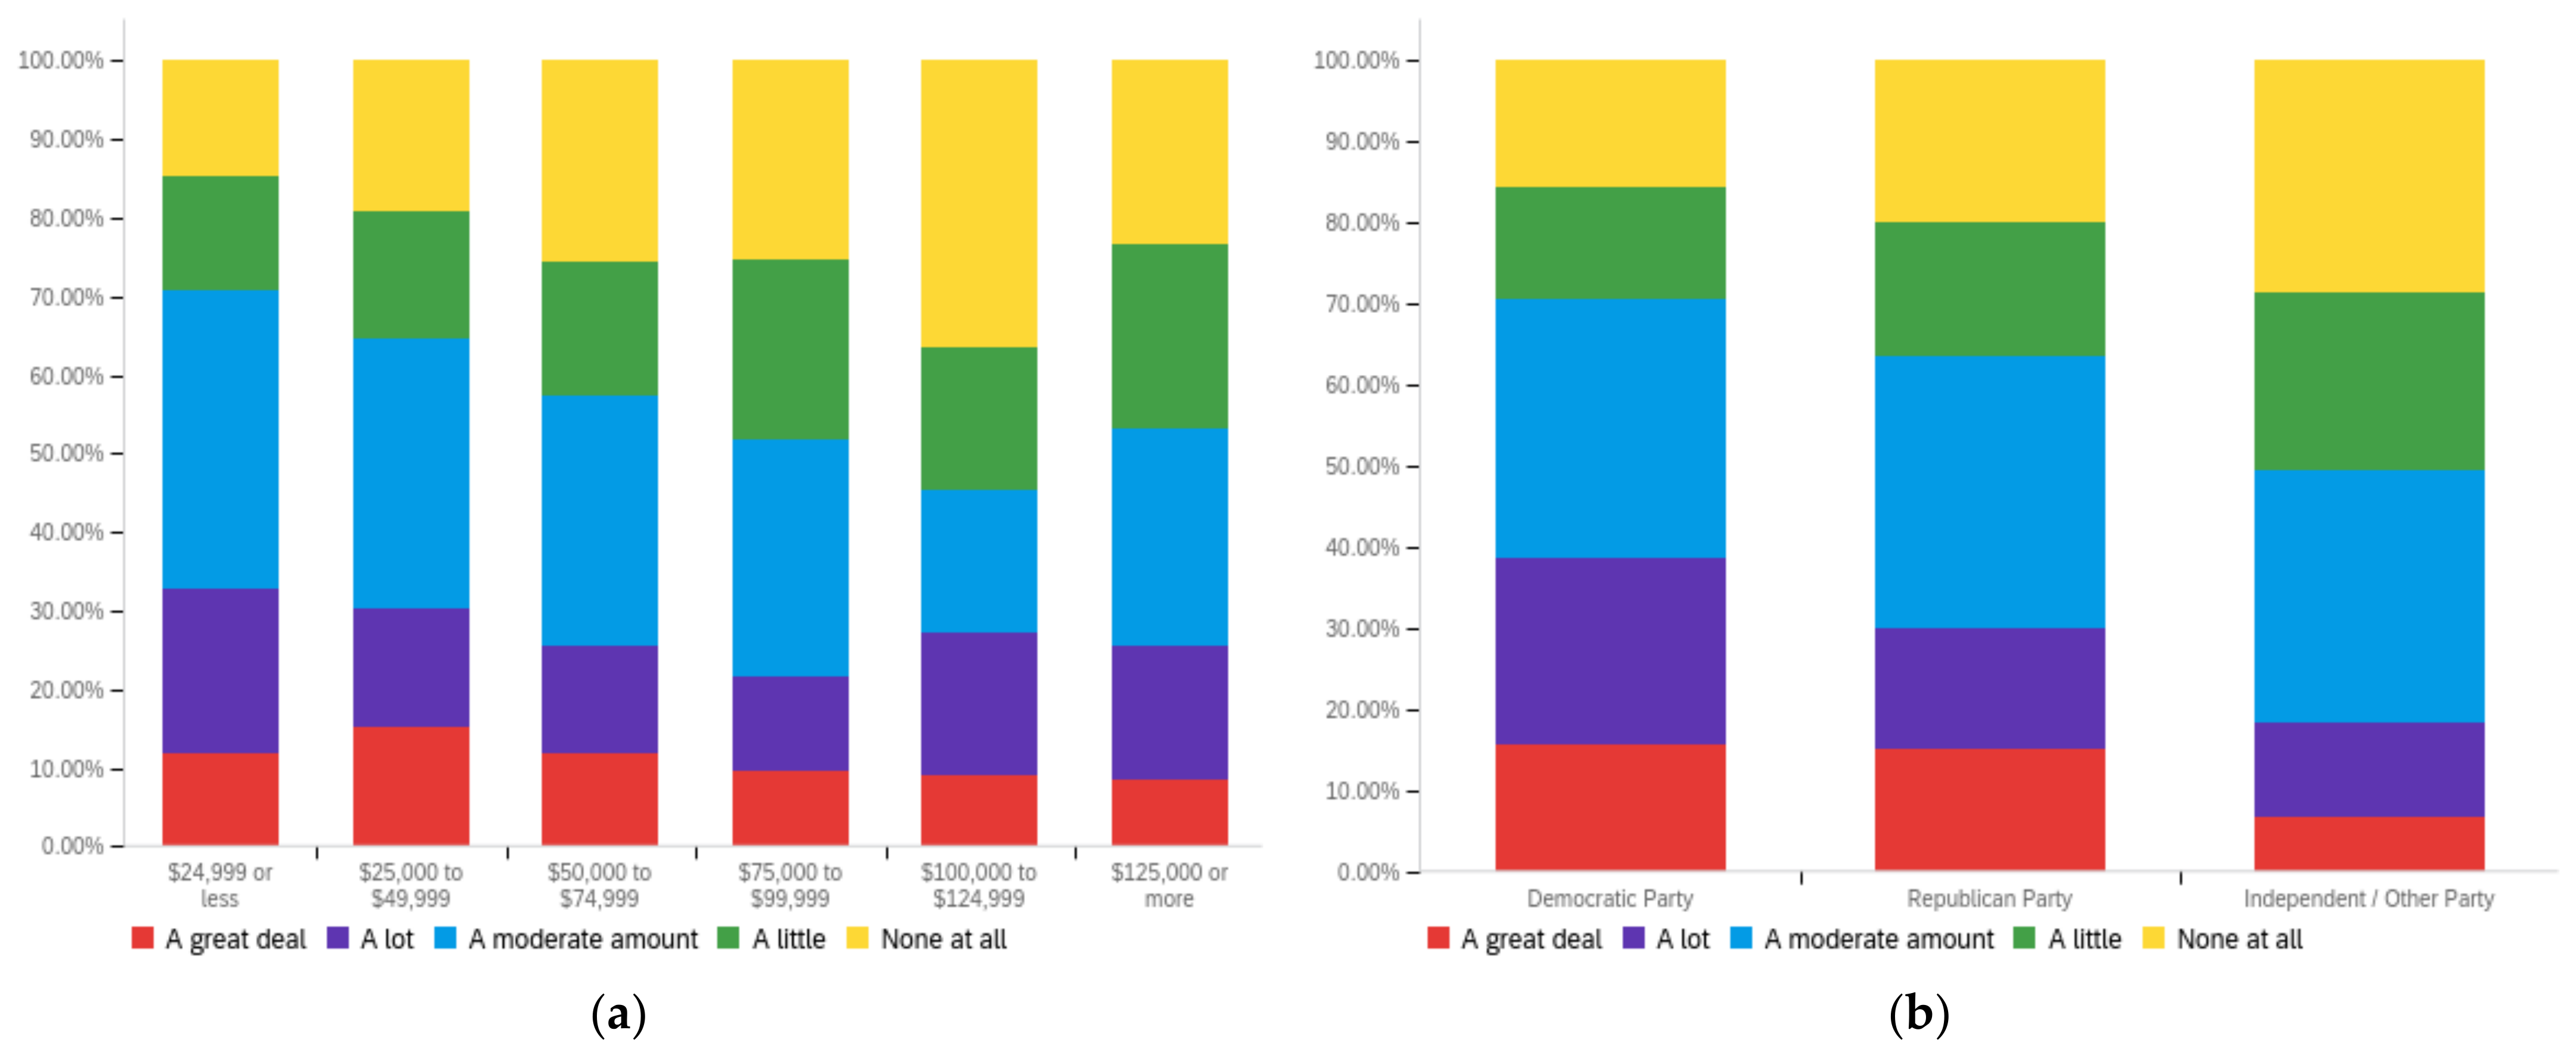
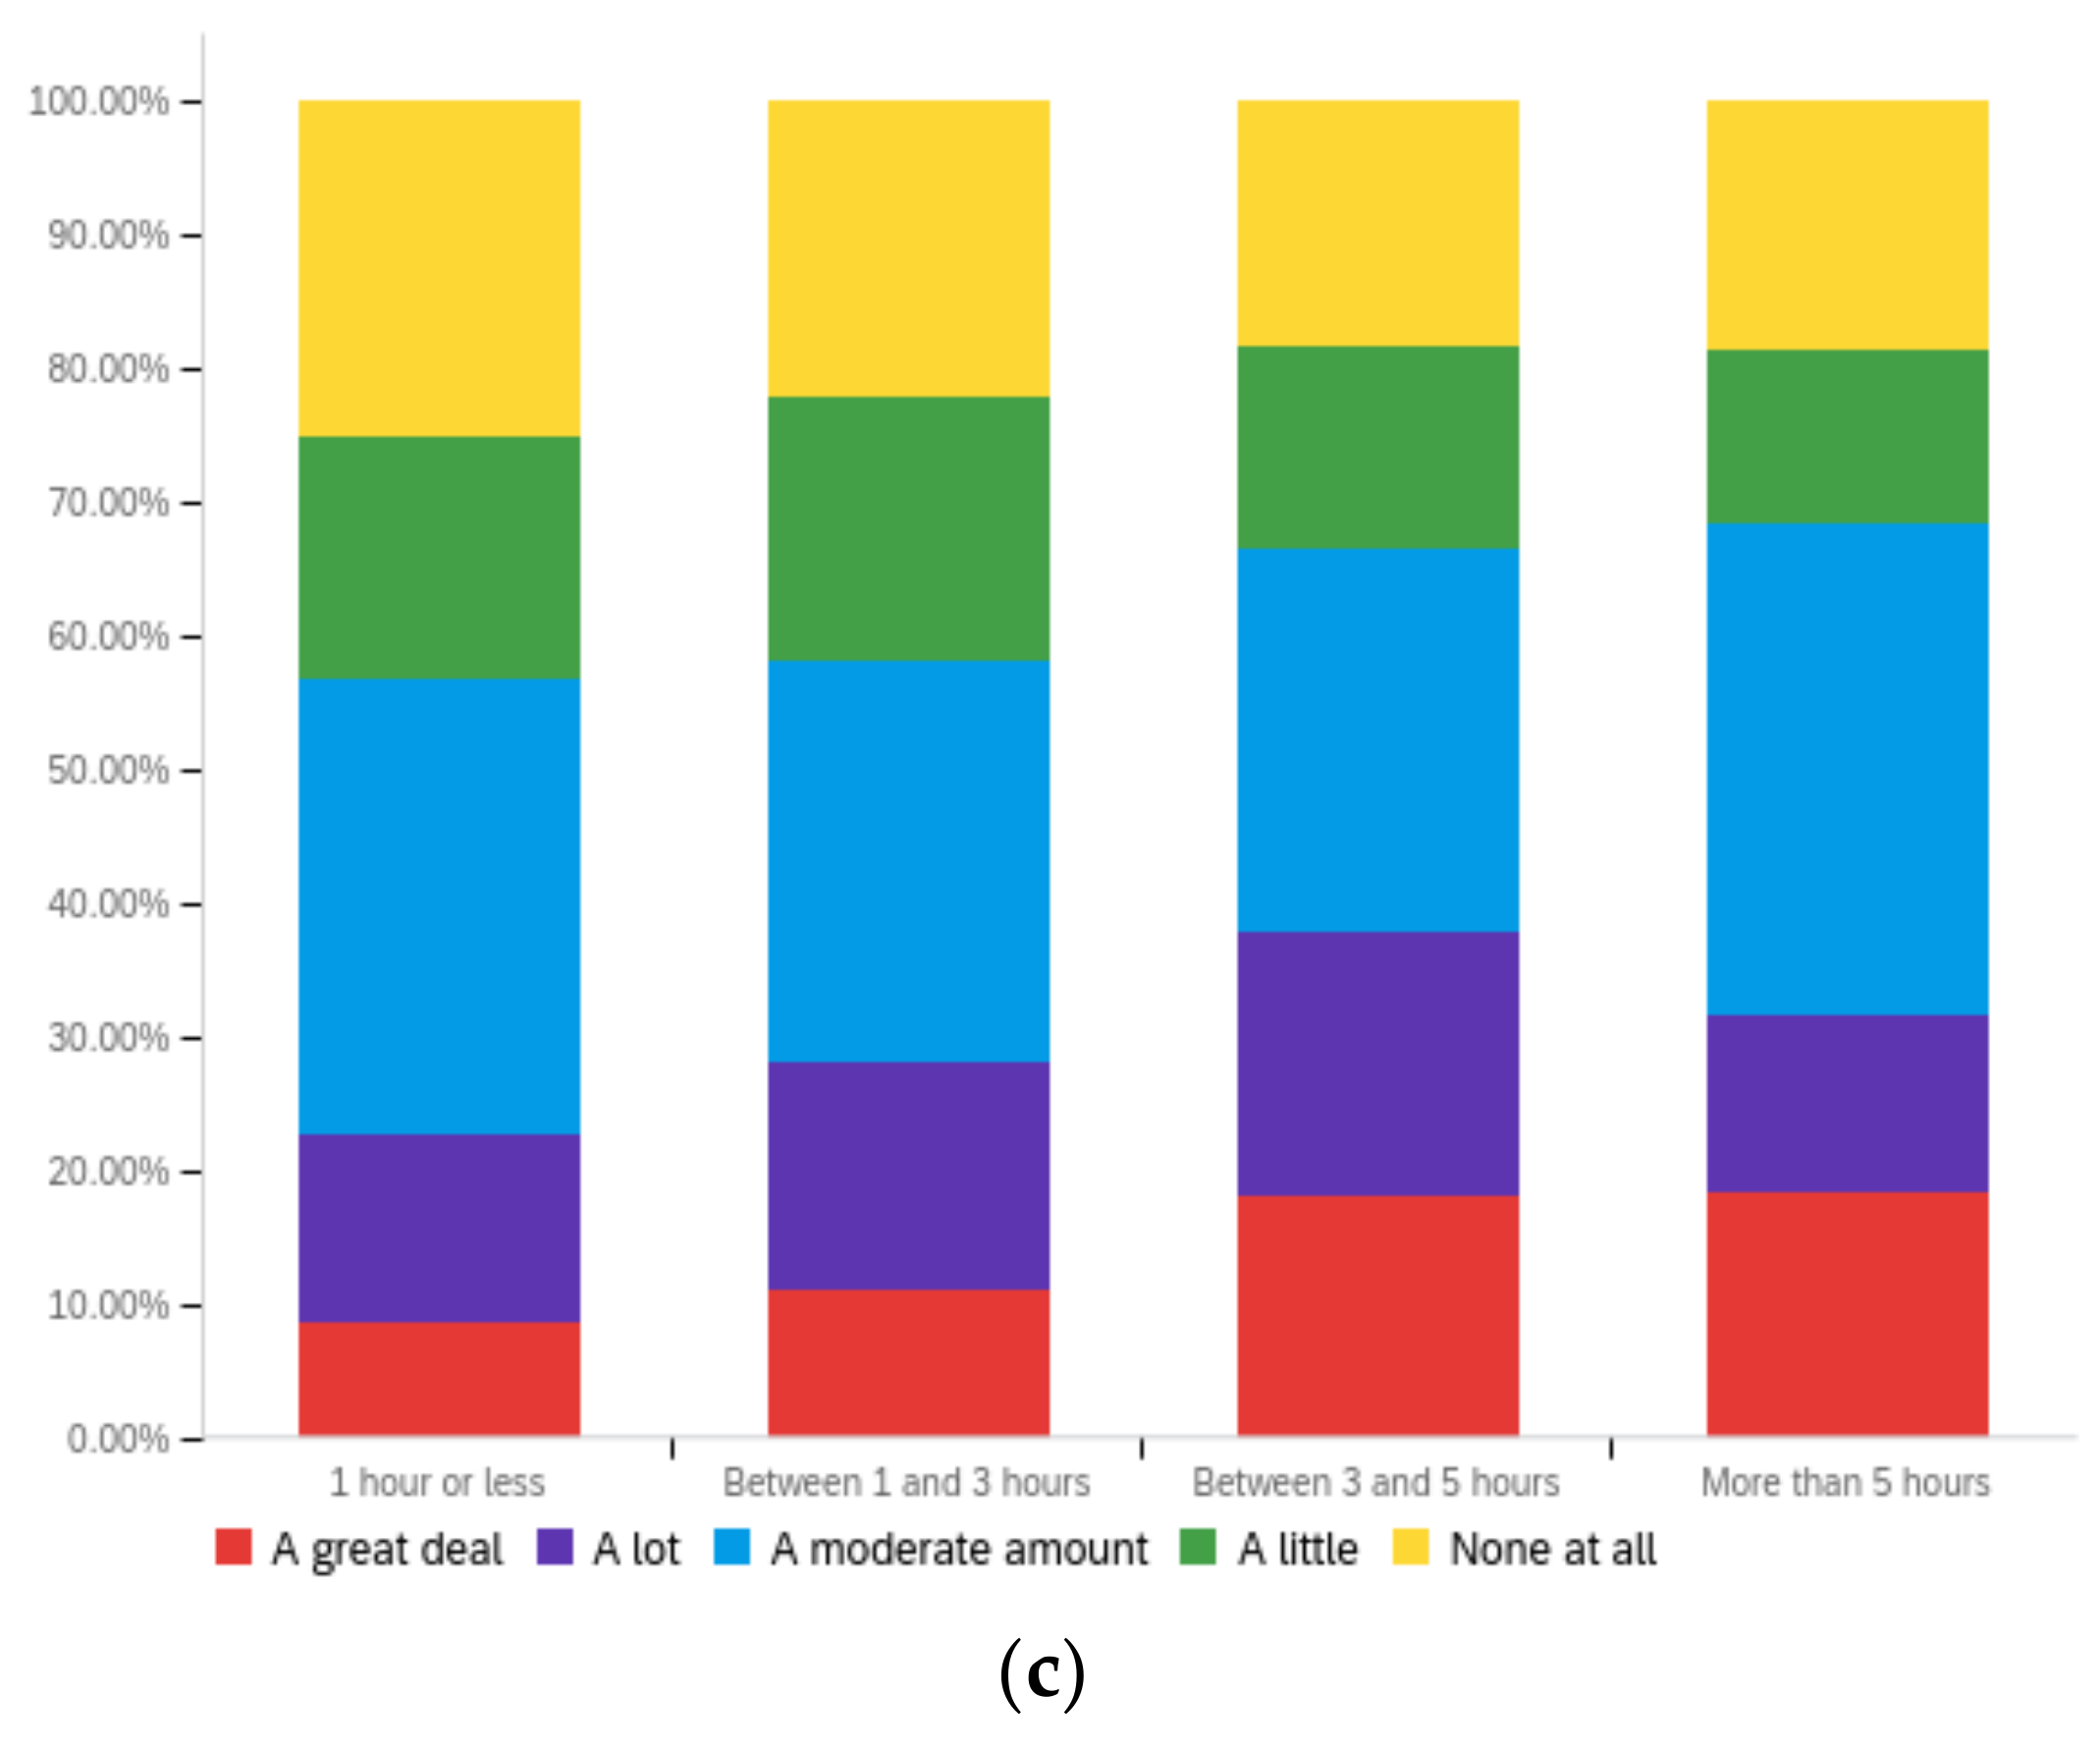
Futureinternet 14 00320 g0a20aFutureinternet 14 00320 g0a20b
Figure A21. Article publisher’s political alignment—ideal perception impact by: (a) income level (top left), (b) political affiliation (top right) and (c) online usage (bottom).
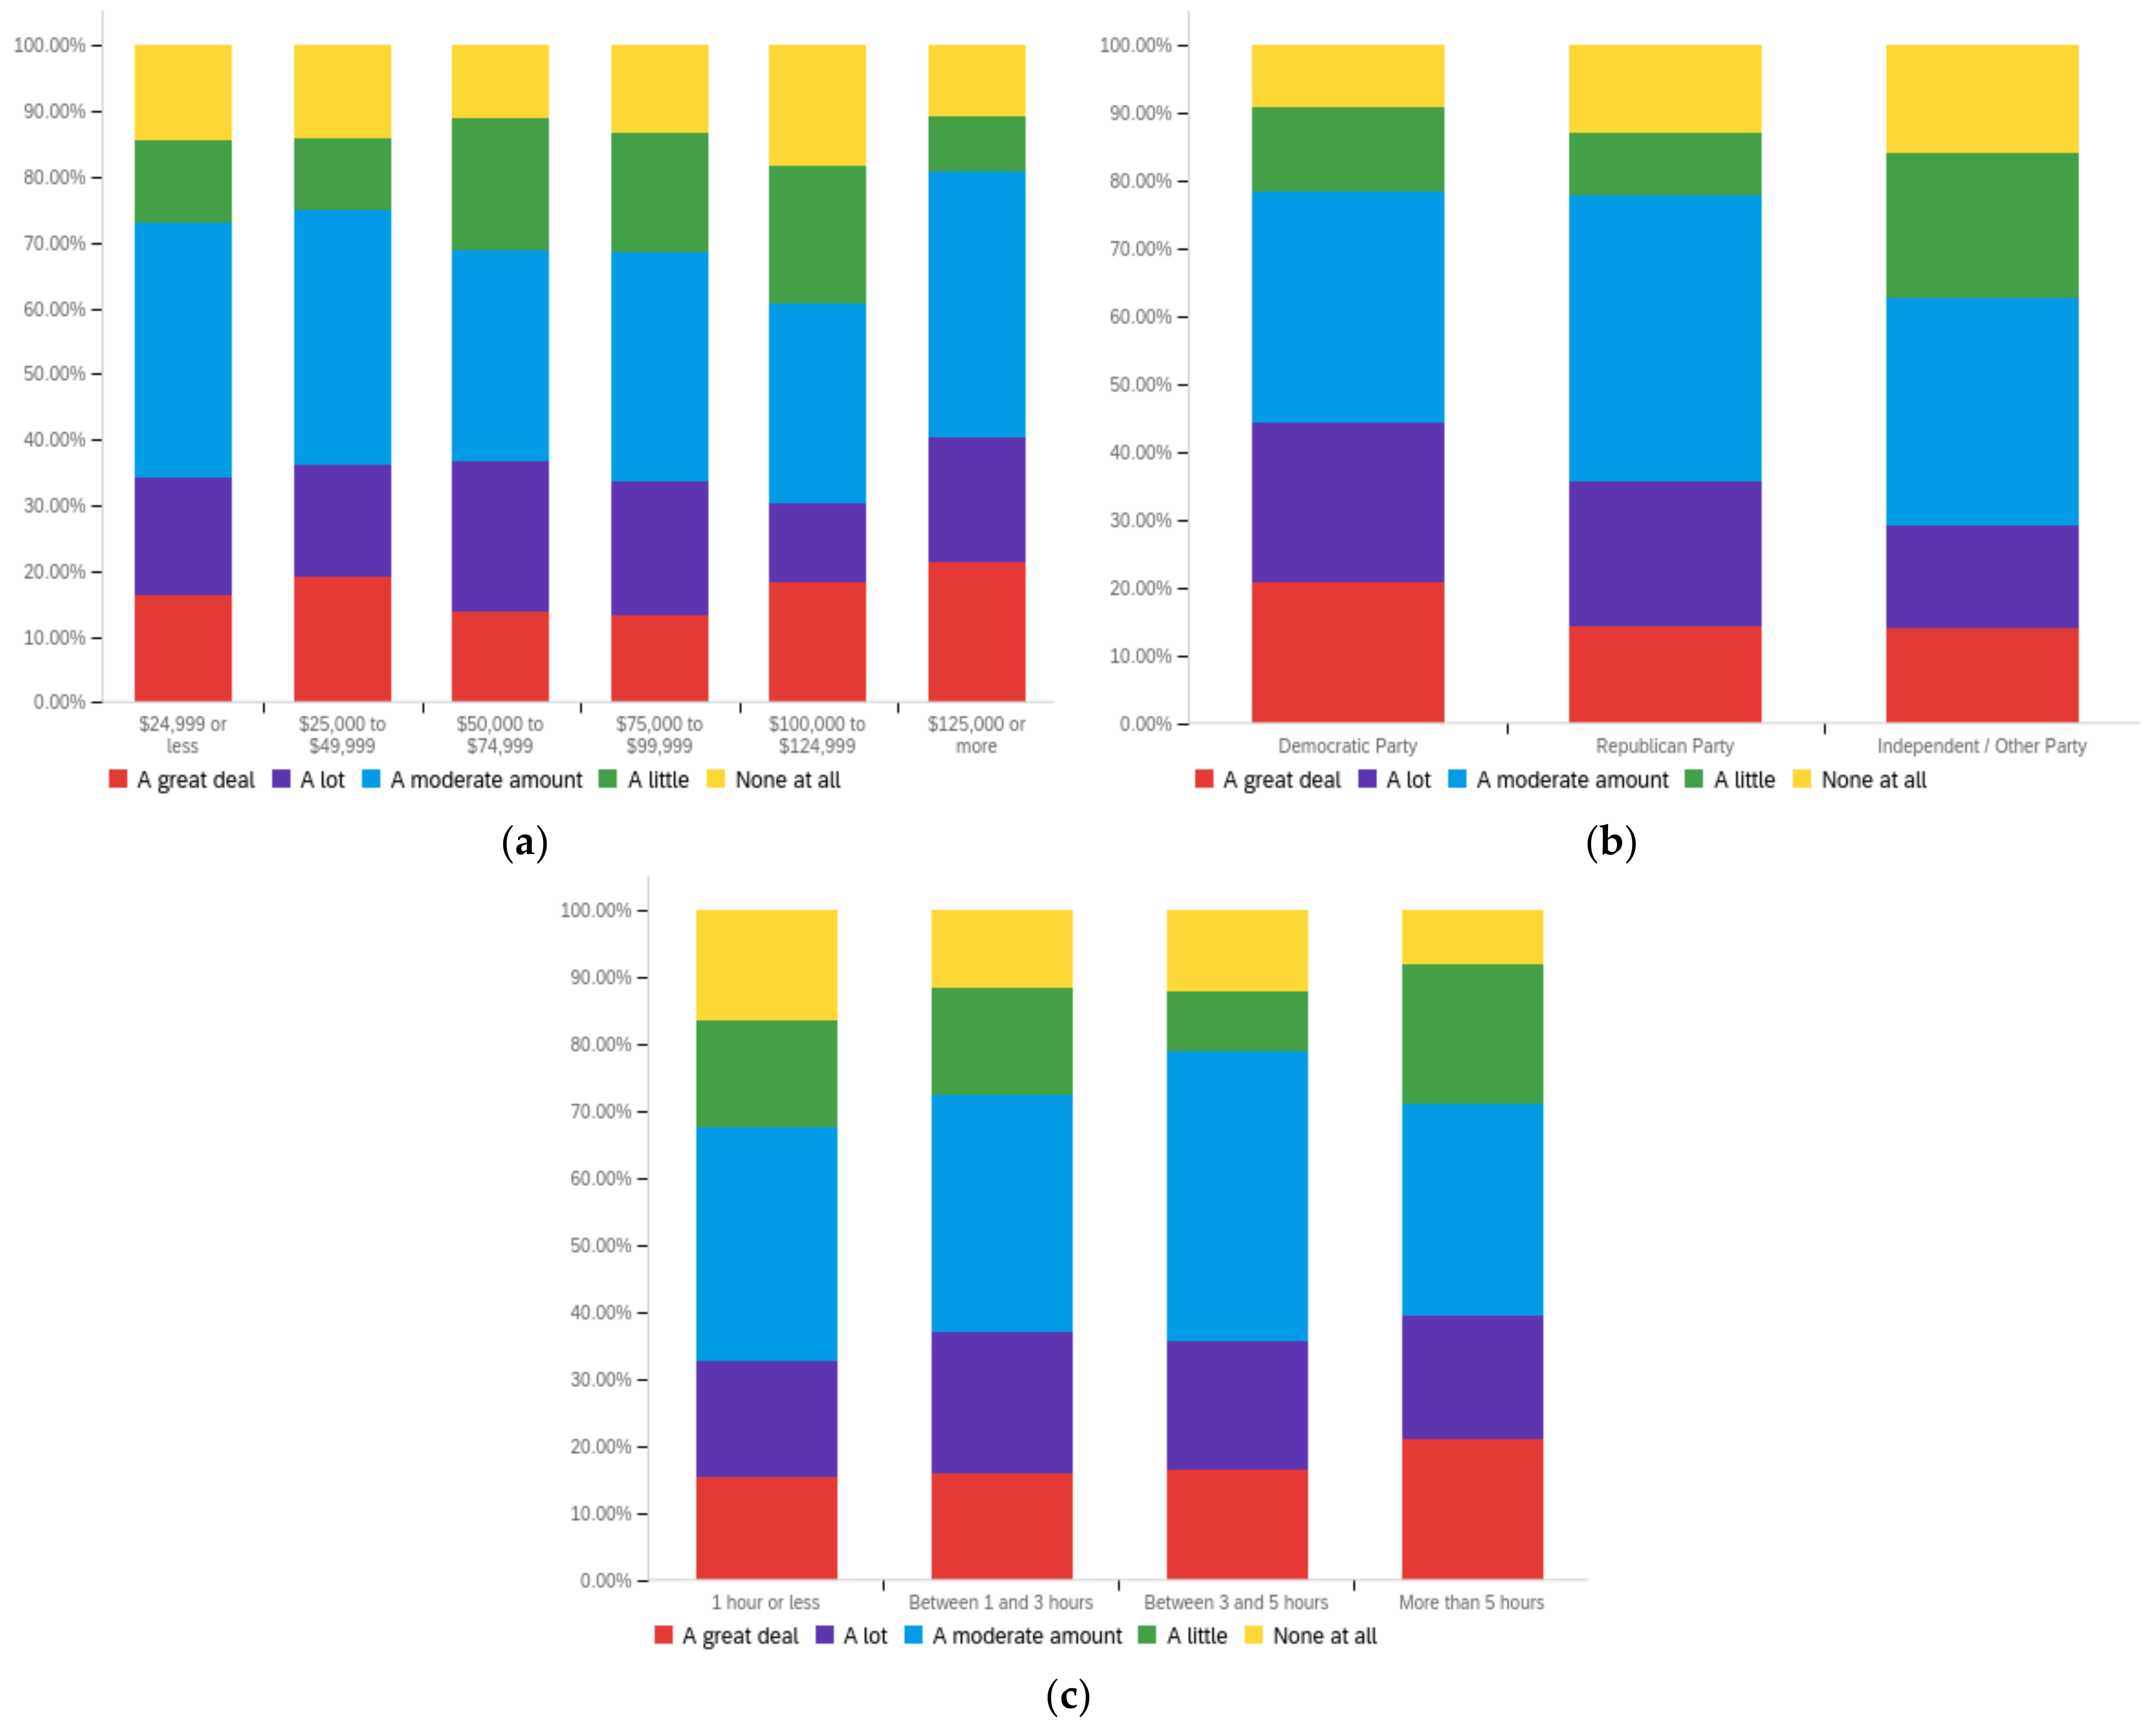
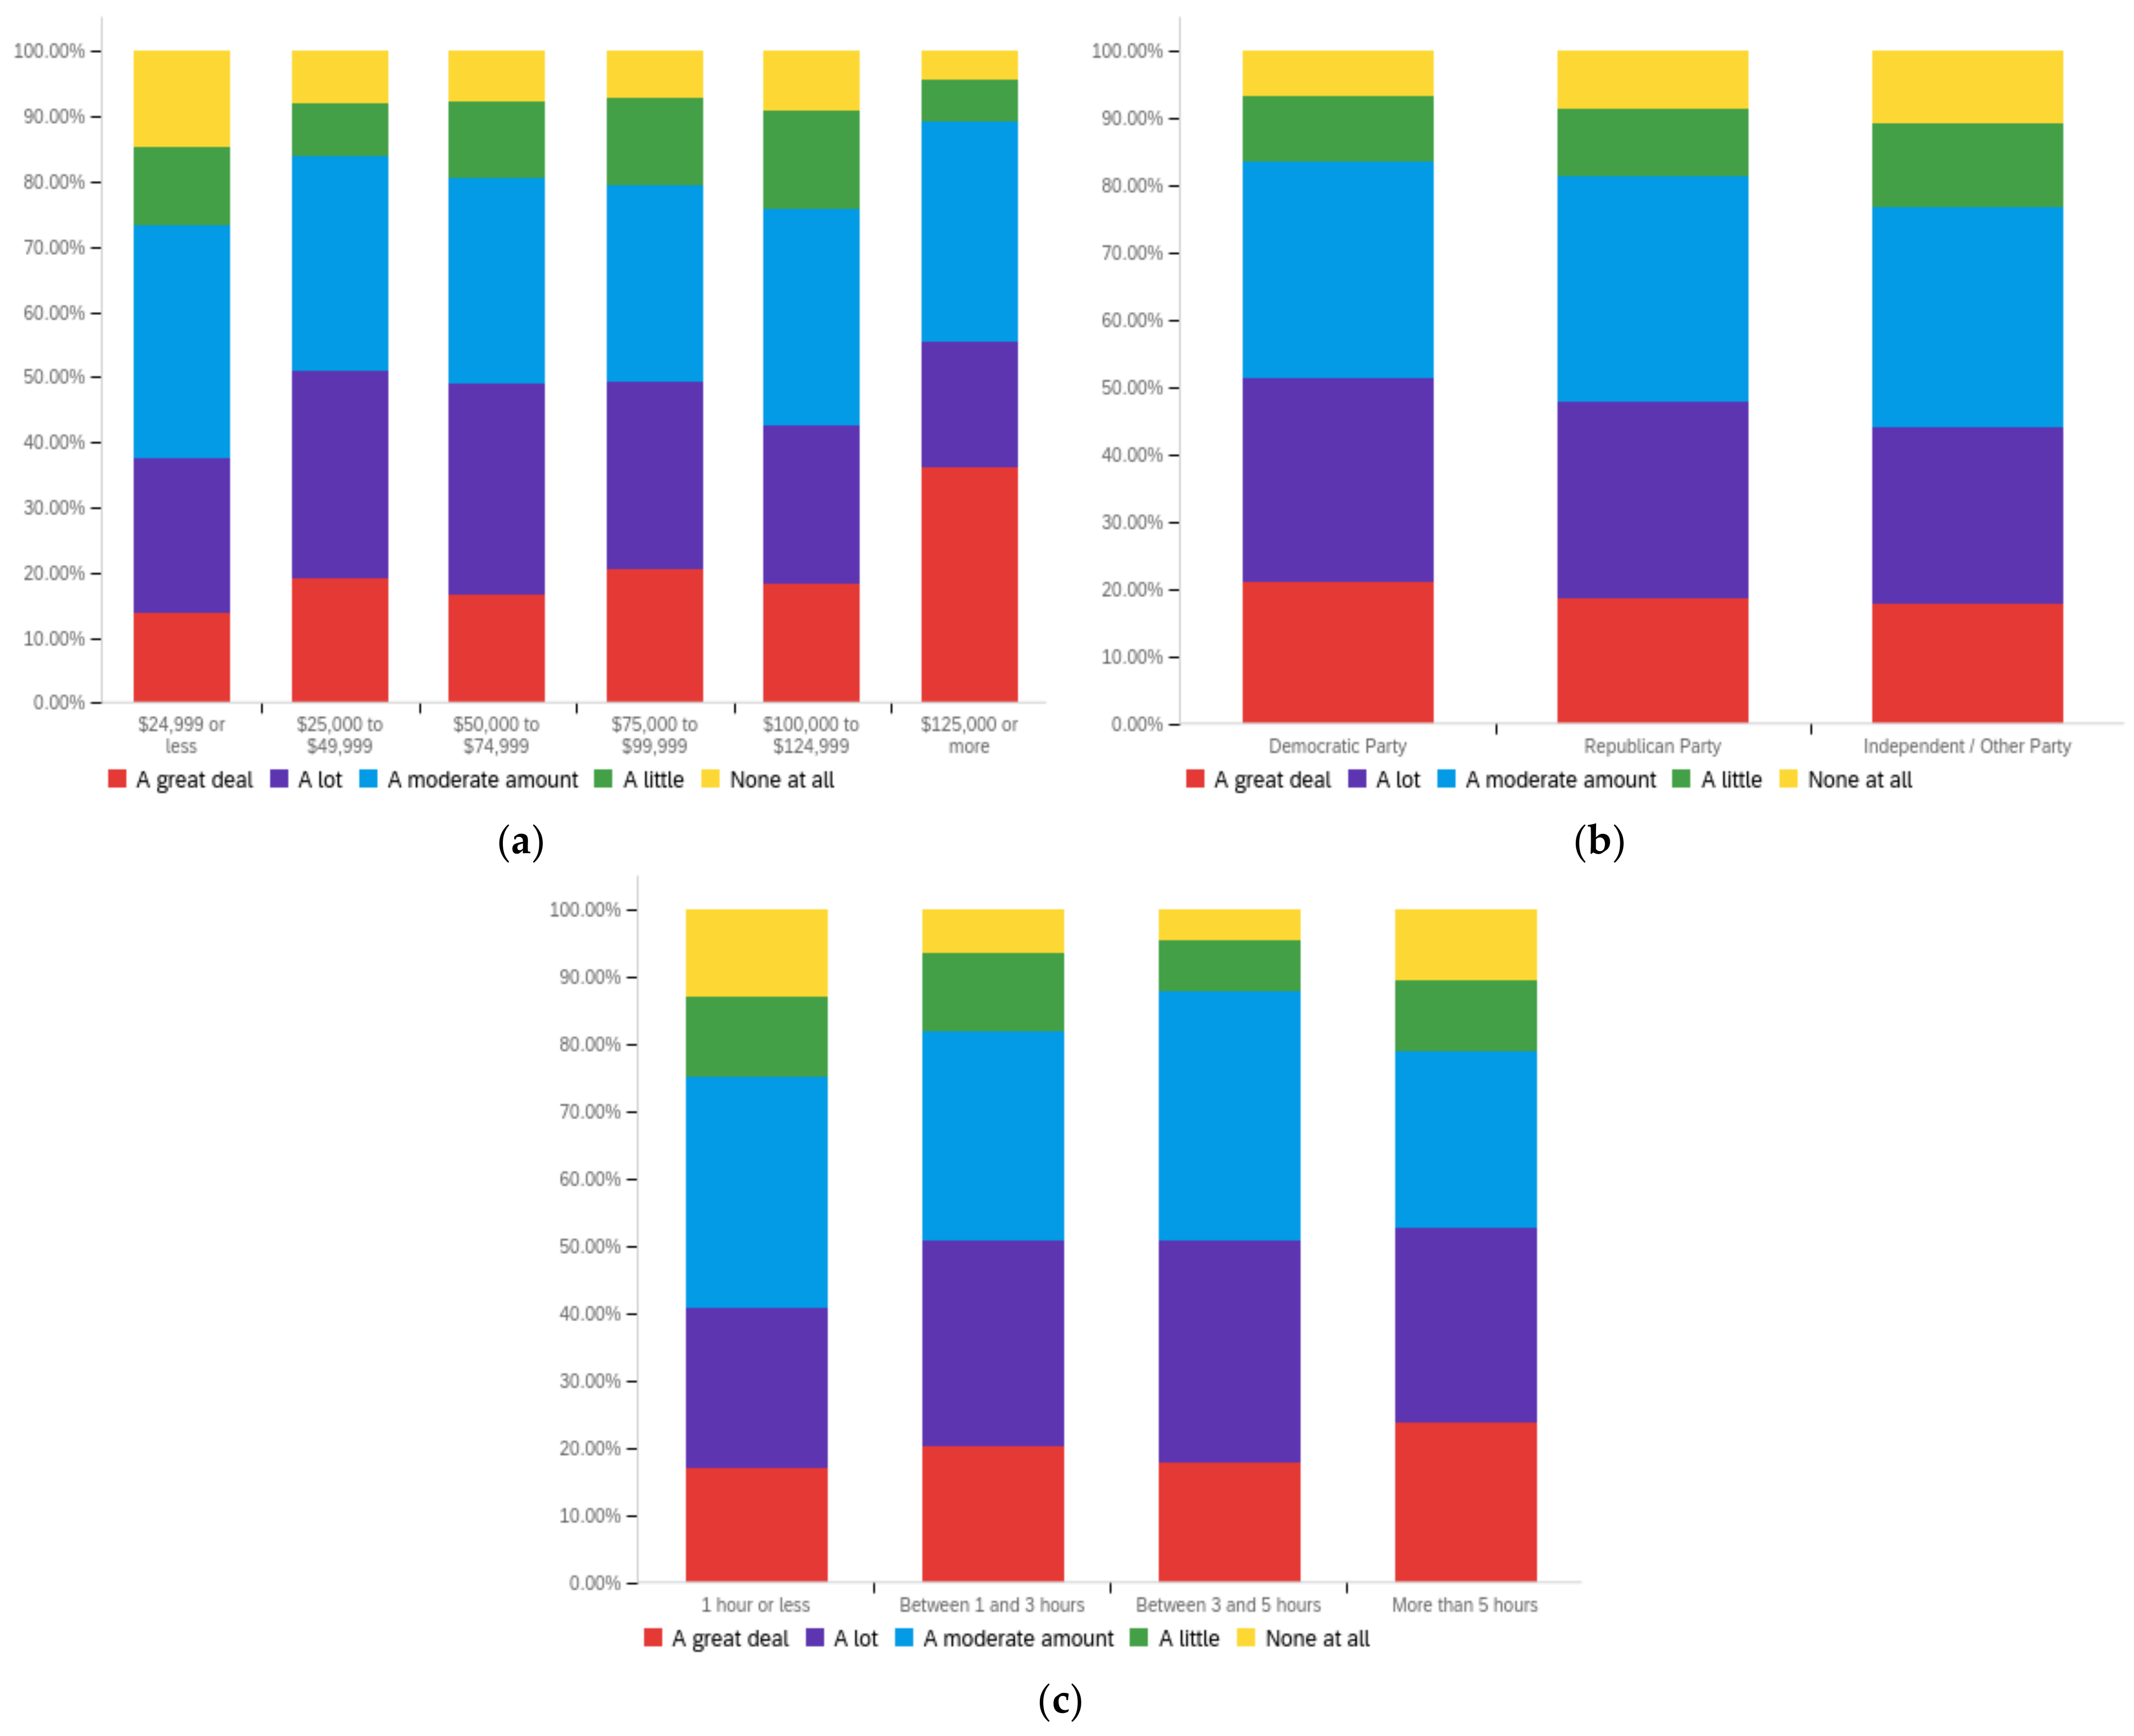
Futureinternet 14 00320 g0a21
Figure A22. Article sponsor’s political alignment—personal perception impact by: (a) income level (top left), (b) political affiliation (top right) and (c) online usage (bottom).
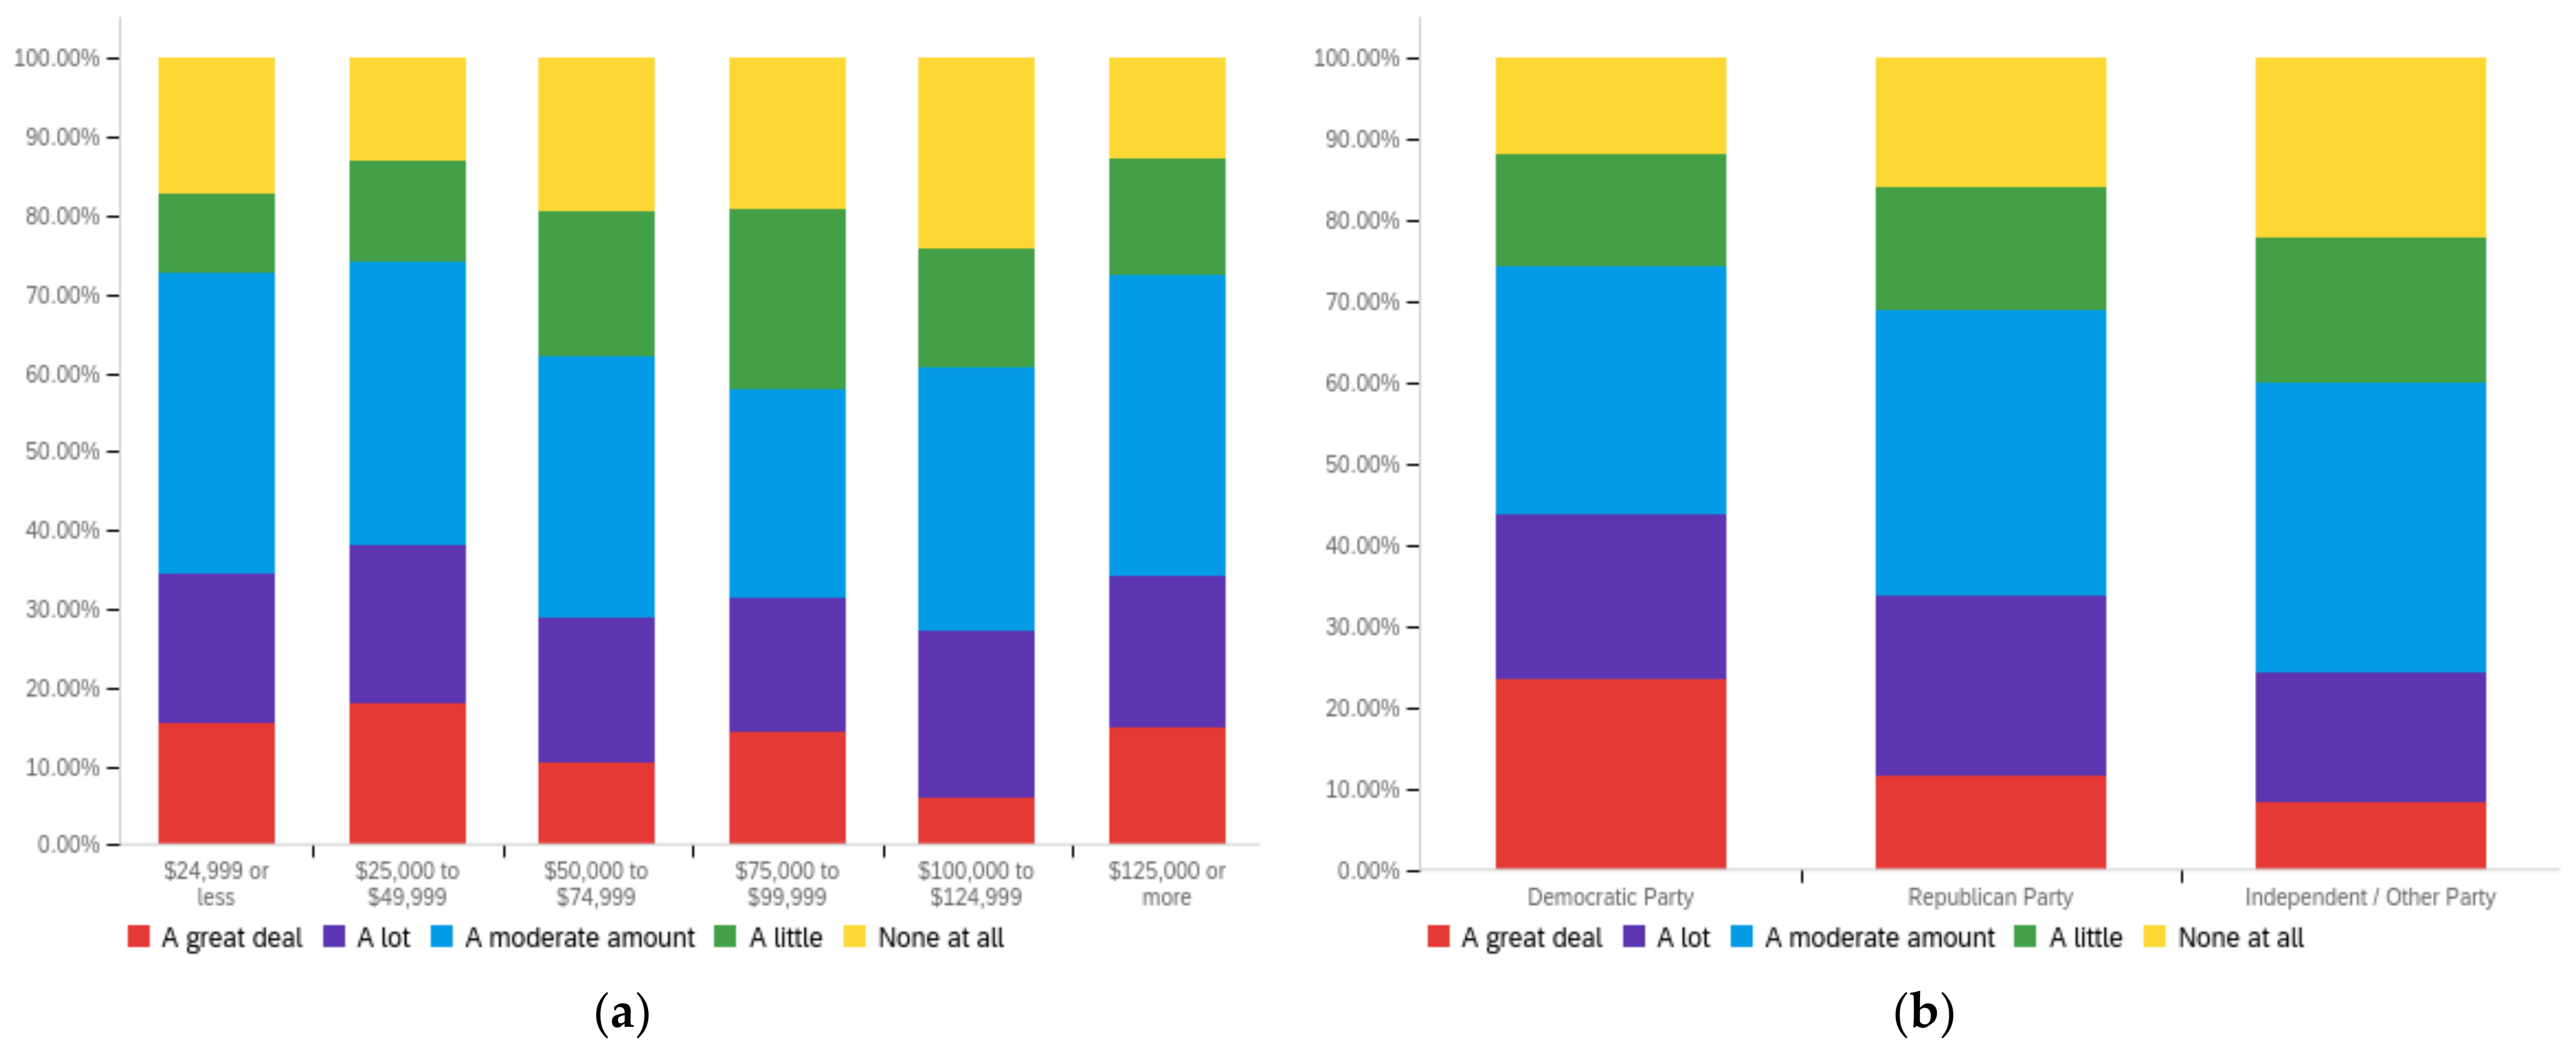
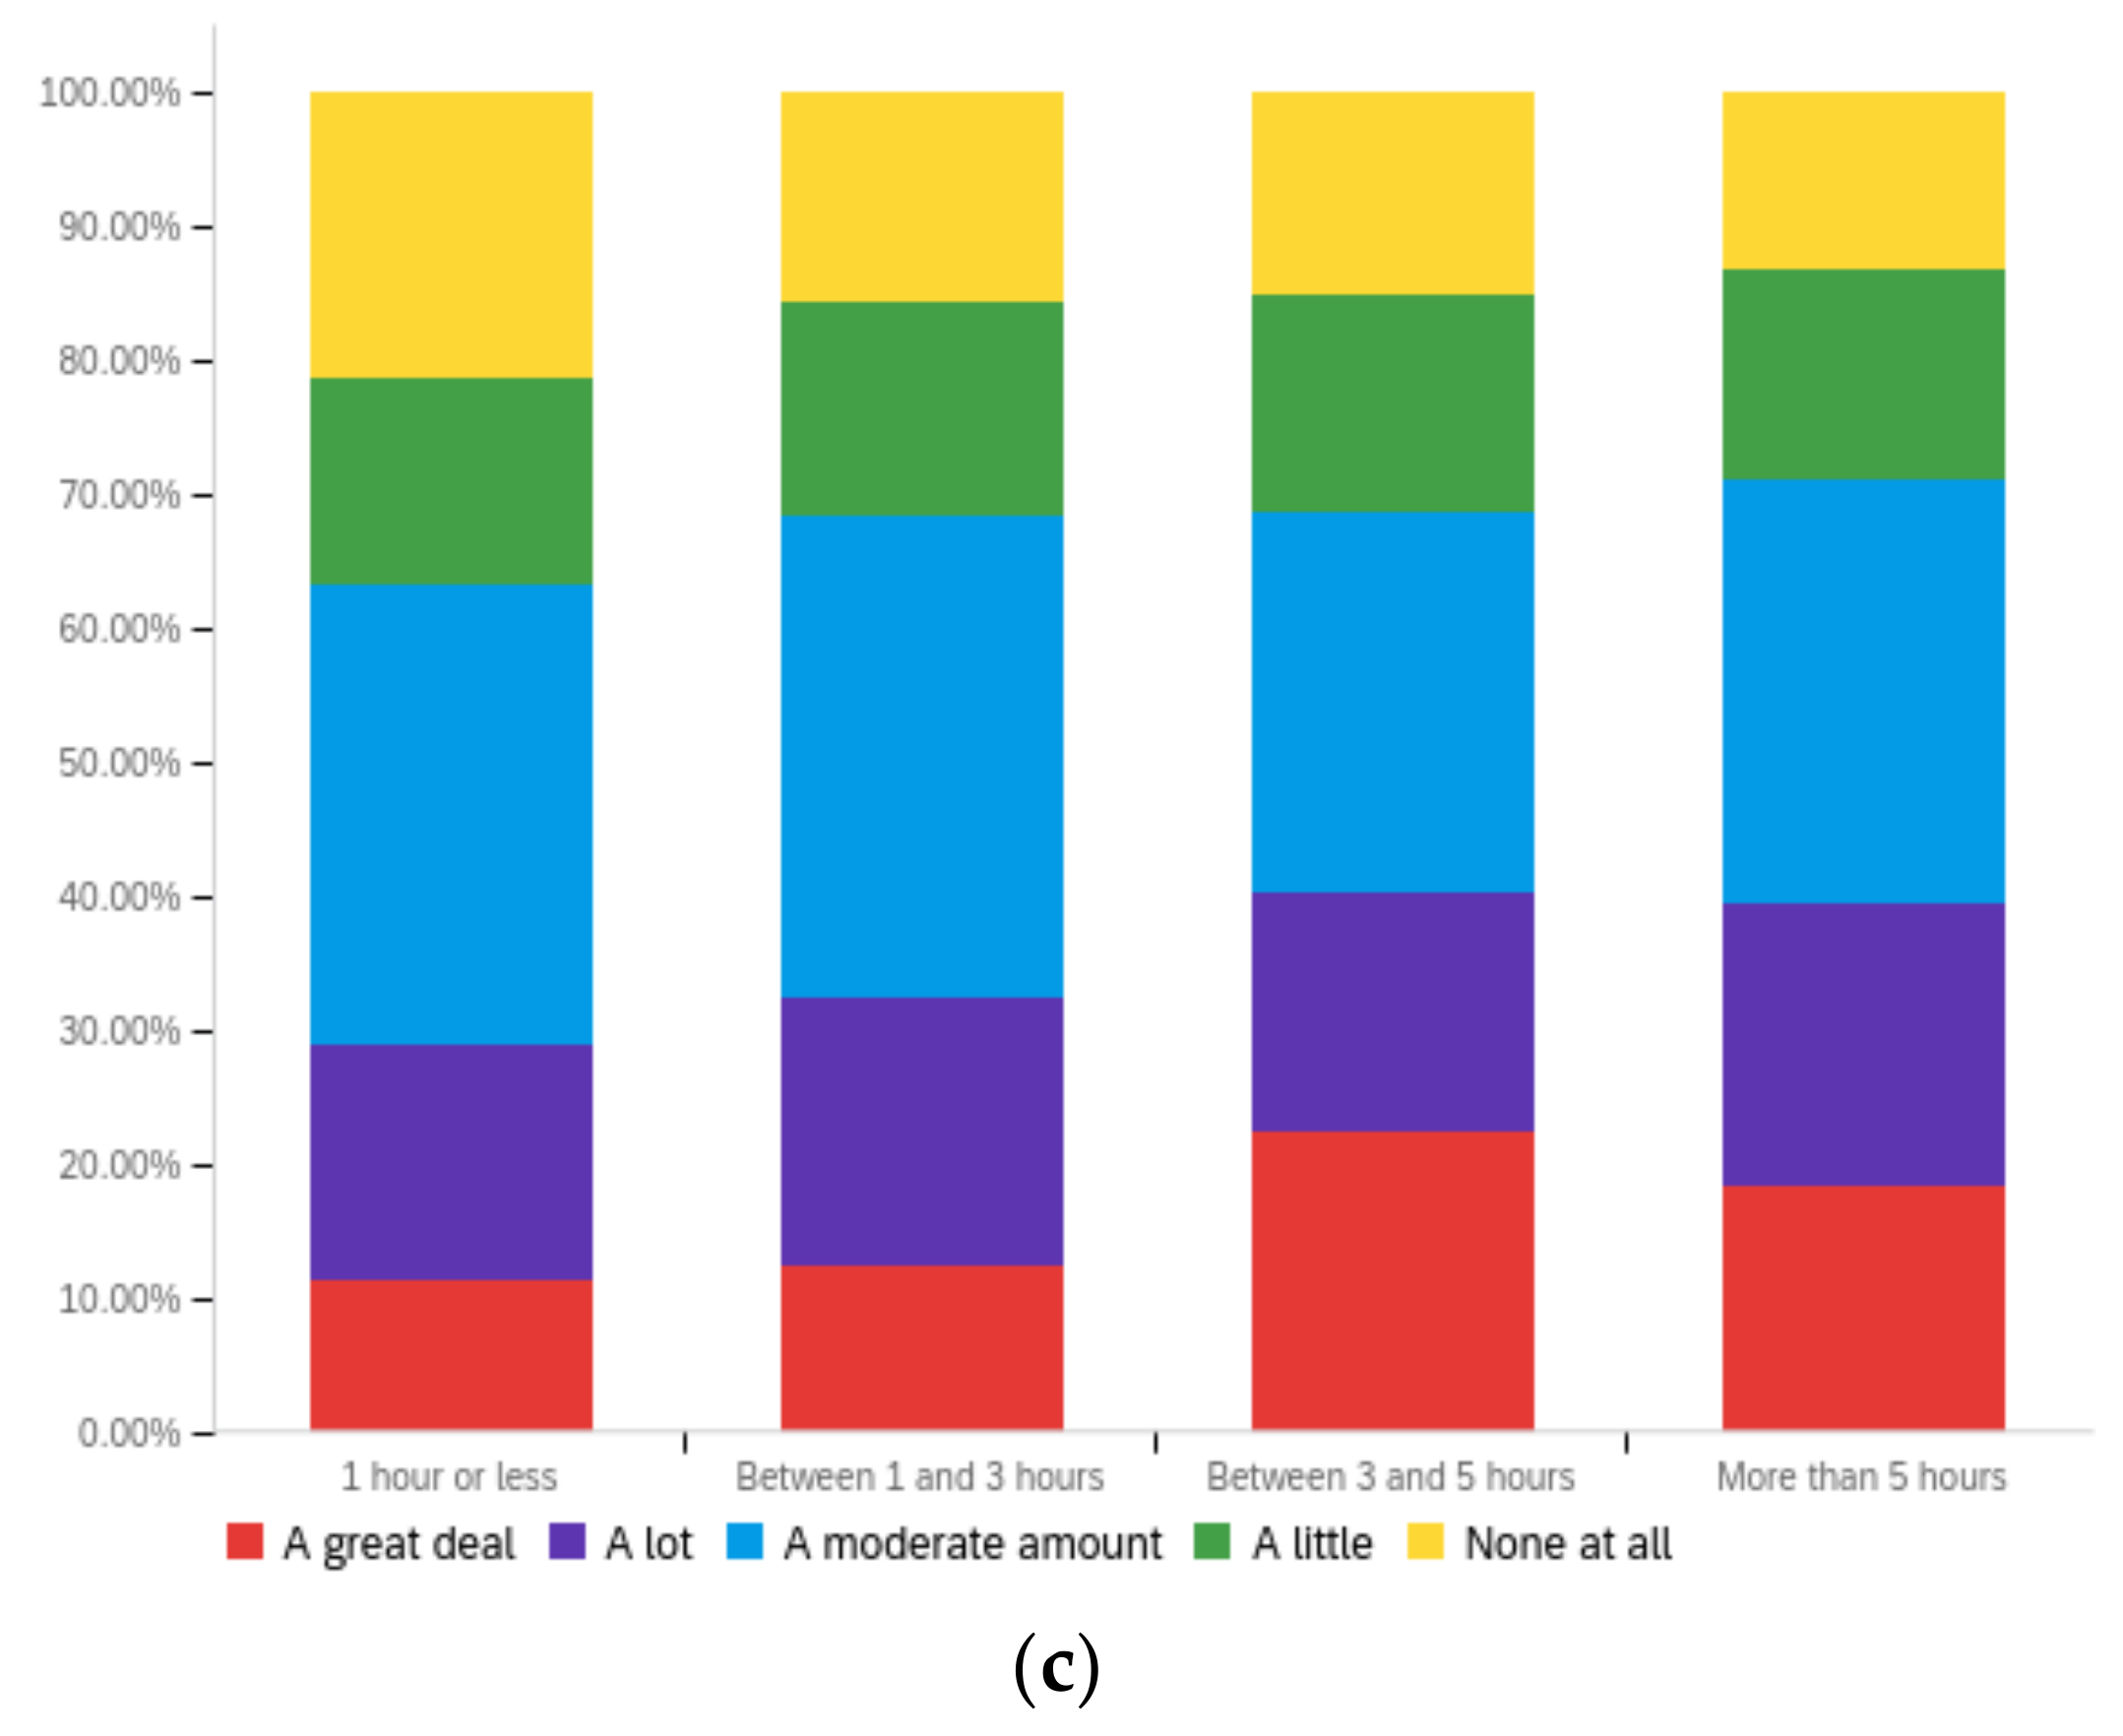
Futureinternet 14 00320 g0a22
Figure A23. Article sponsor’s political alignment—others’ perception impact by: (a) income level (top left), (b) political affiliation (top right) and (c) online usage (bottom).
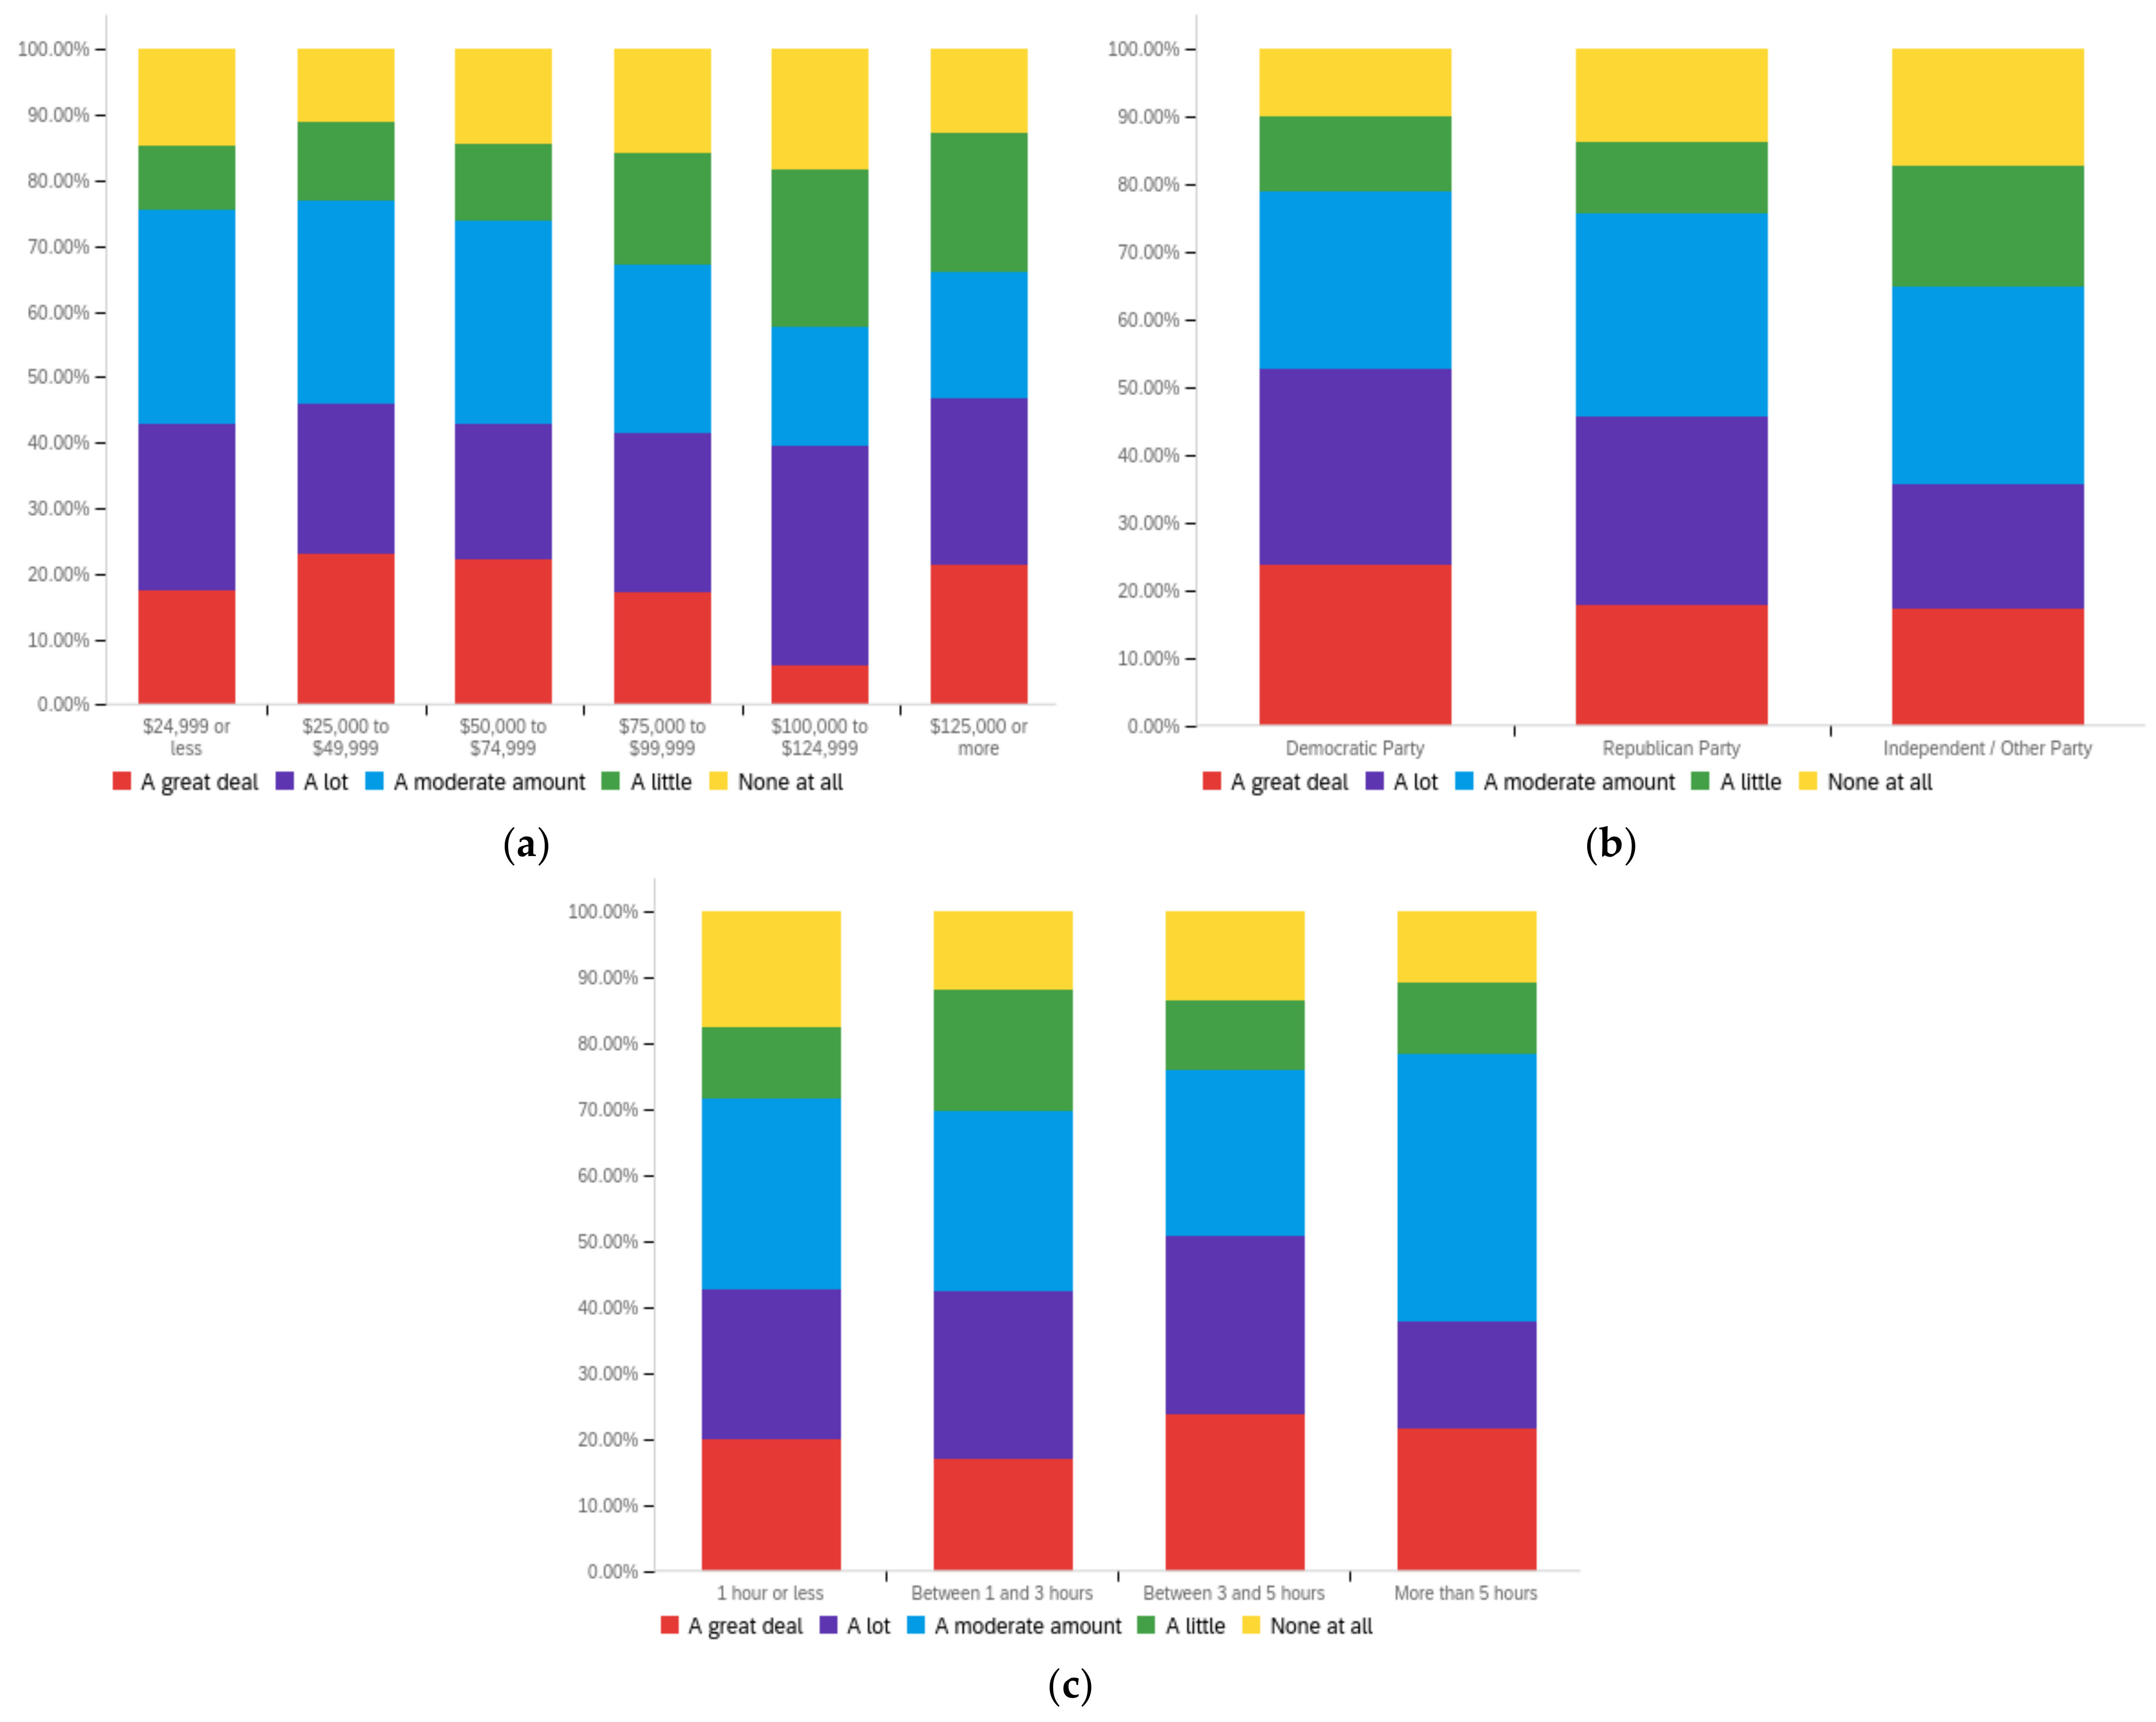
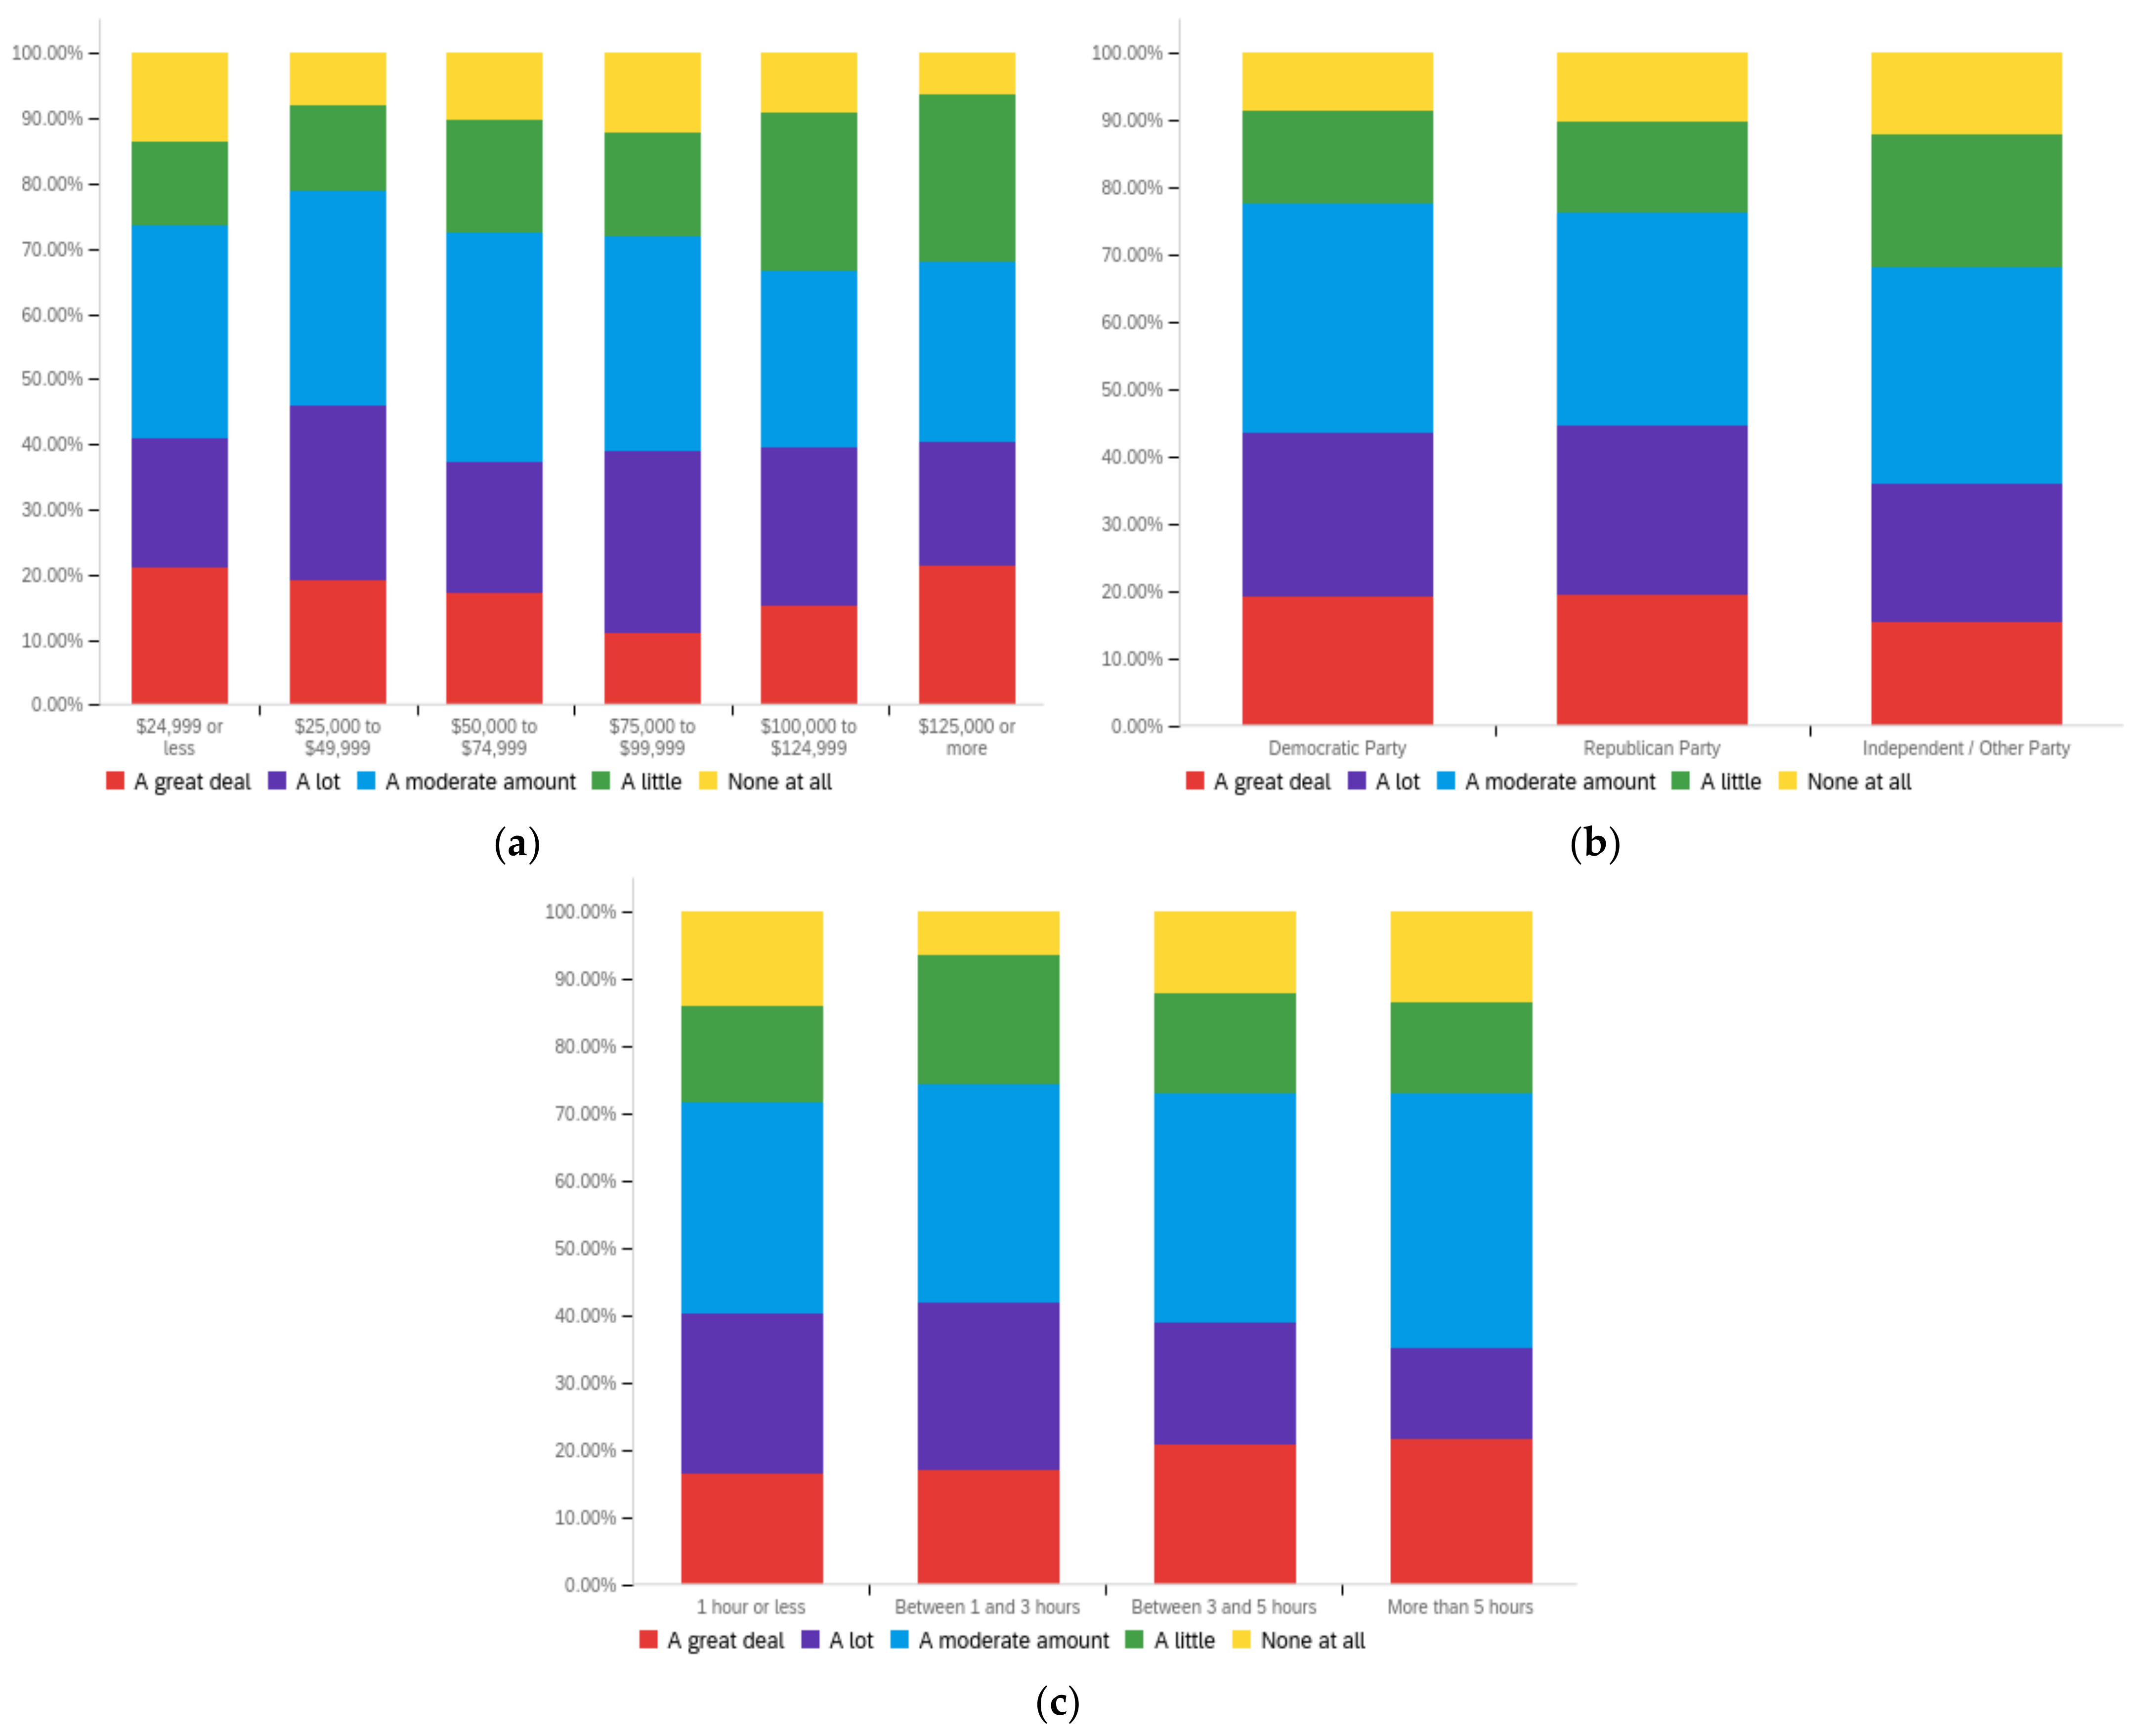
Futureinternet 14 00320 g0a23aFutureinternet 14 00320 g0a23b
Figure A24. Article sponsor’s political alignment—ideal perception impact by: (a) income level (top left), (b) political affiliation (top right) and (c) online usage (bottom).
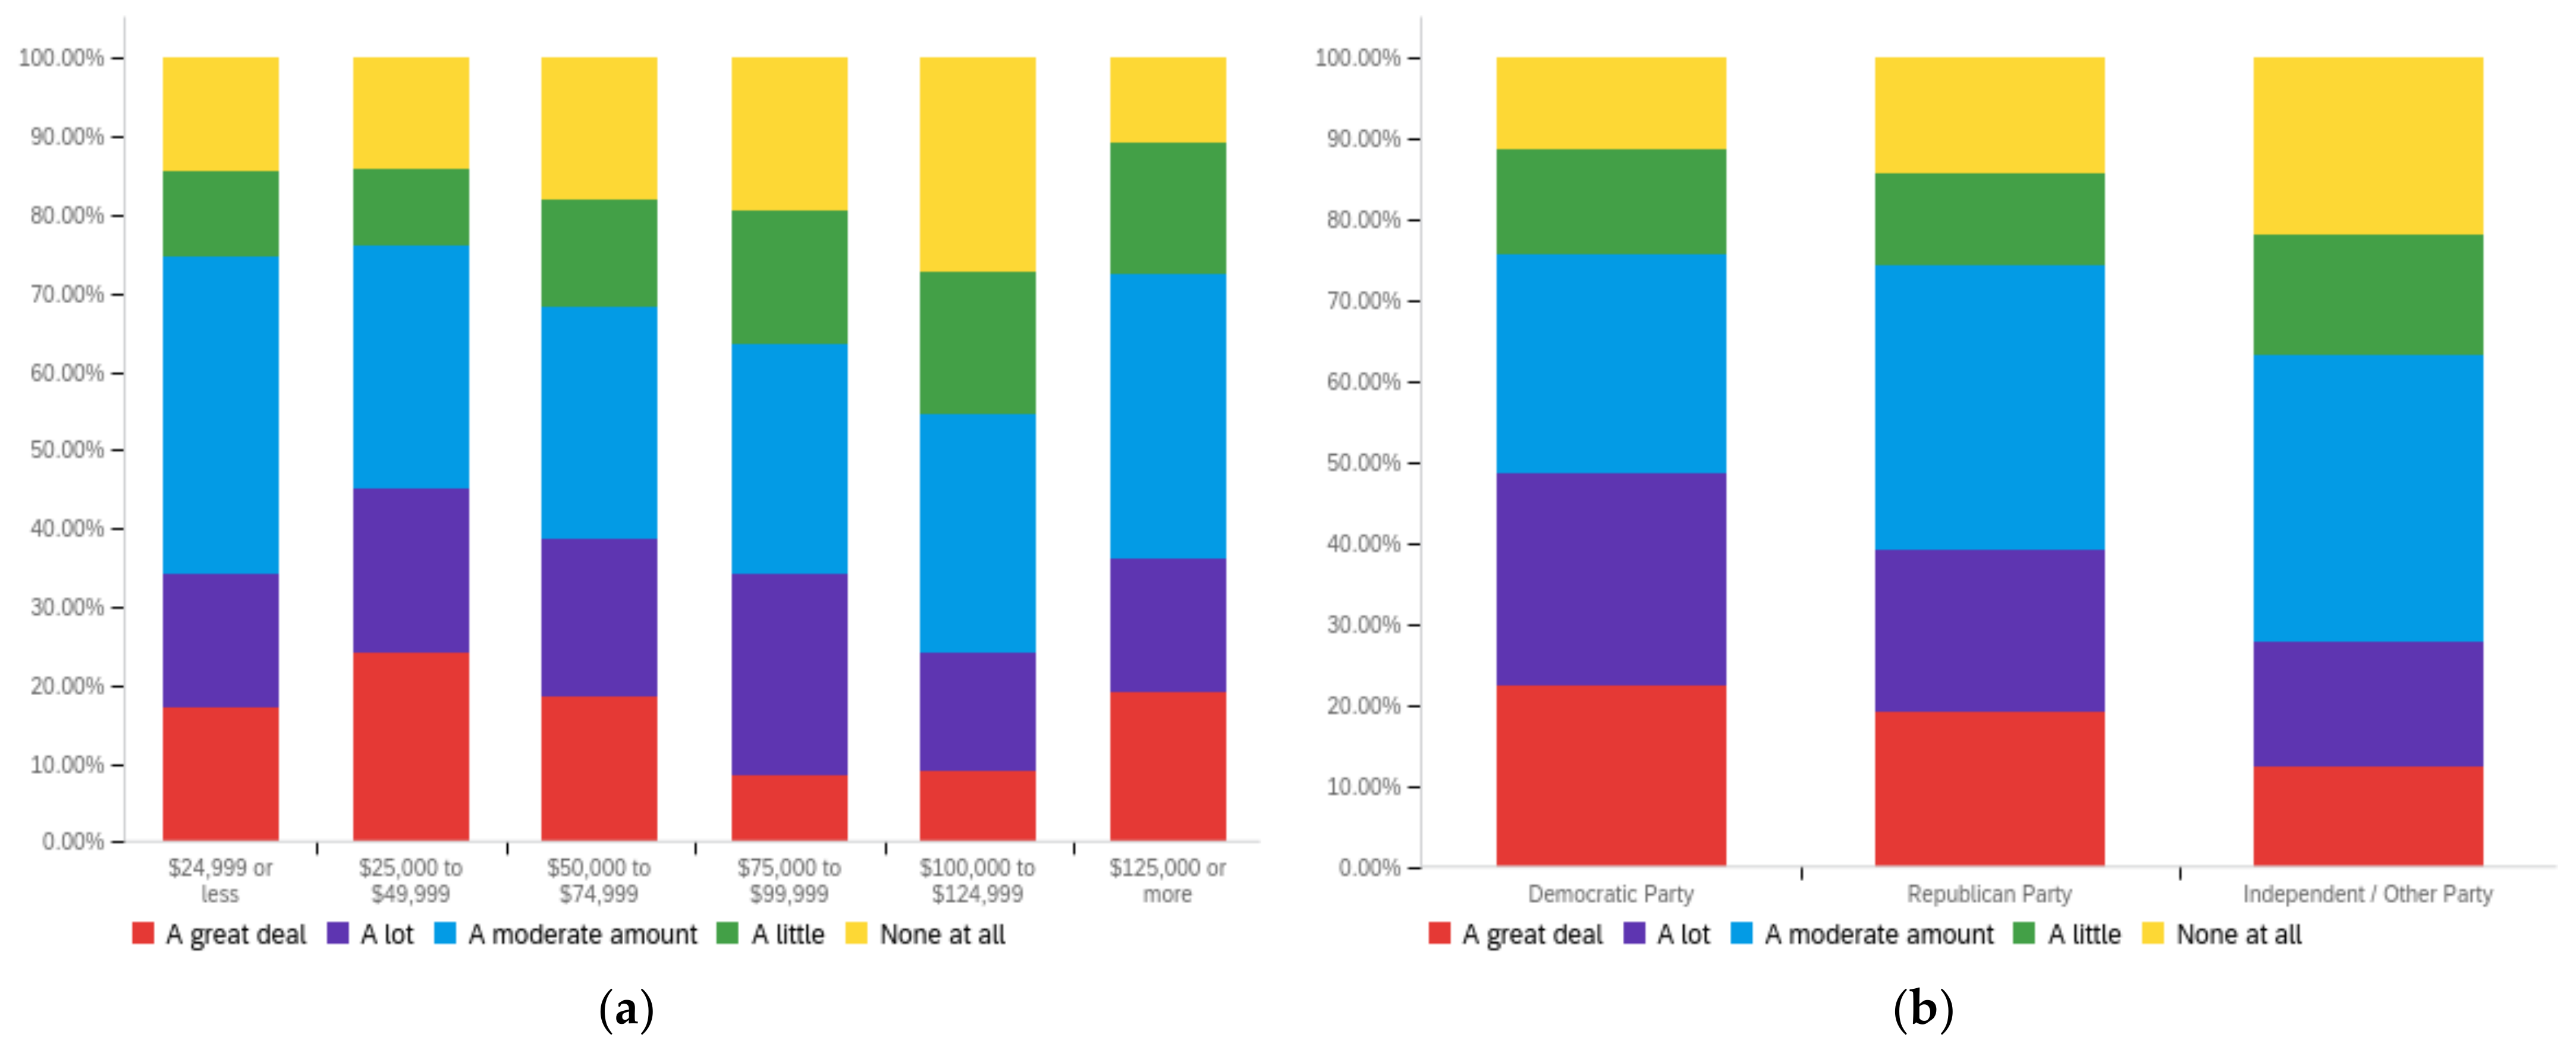
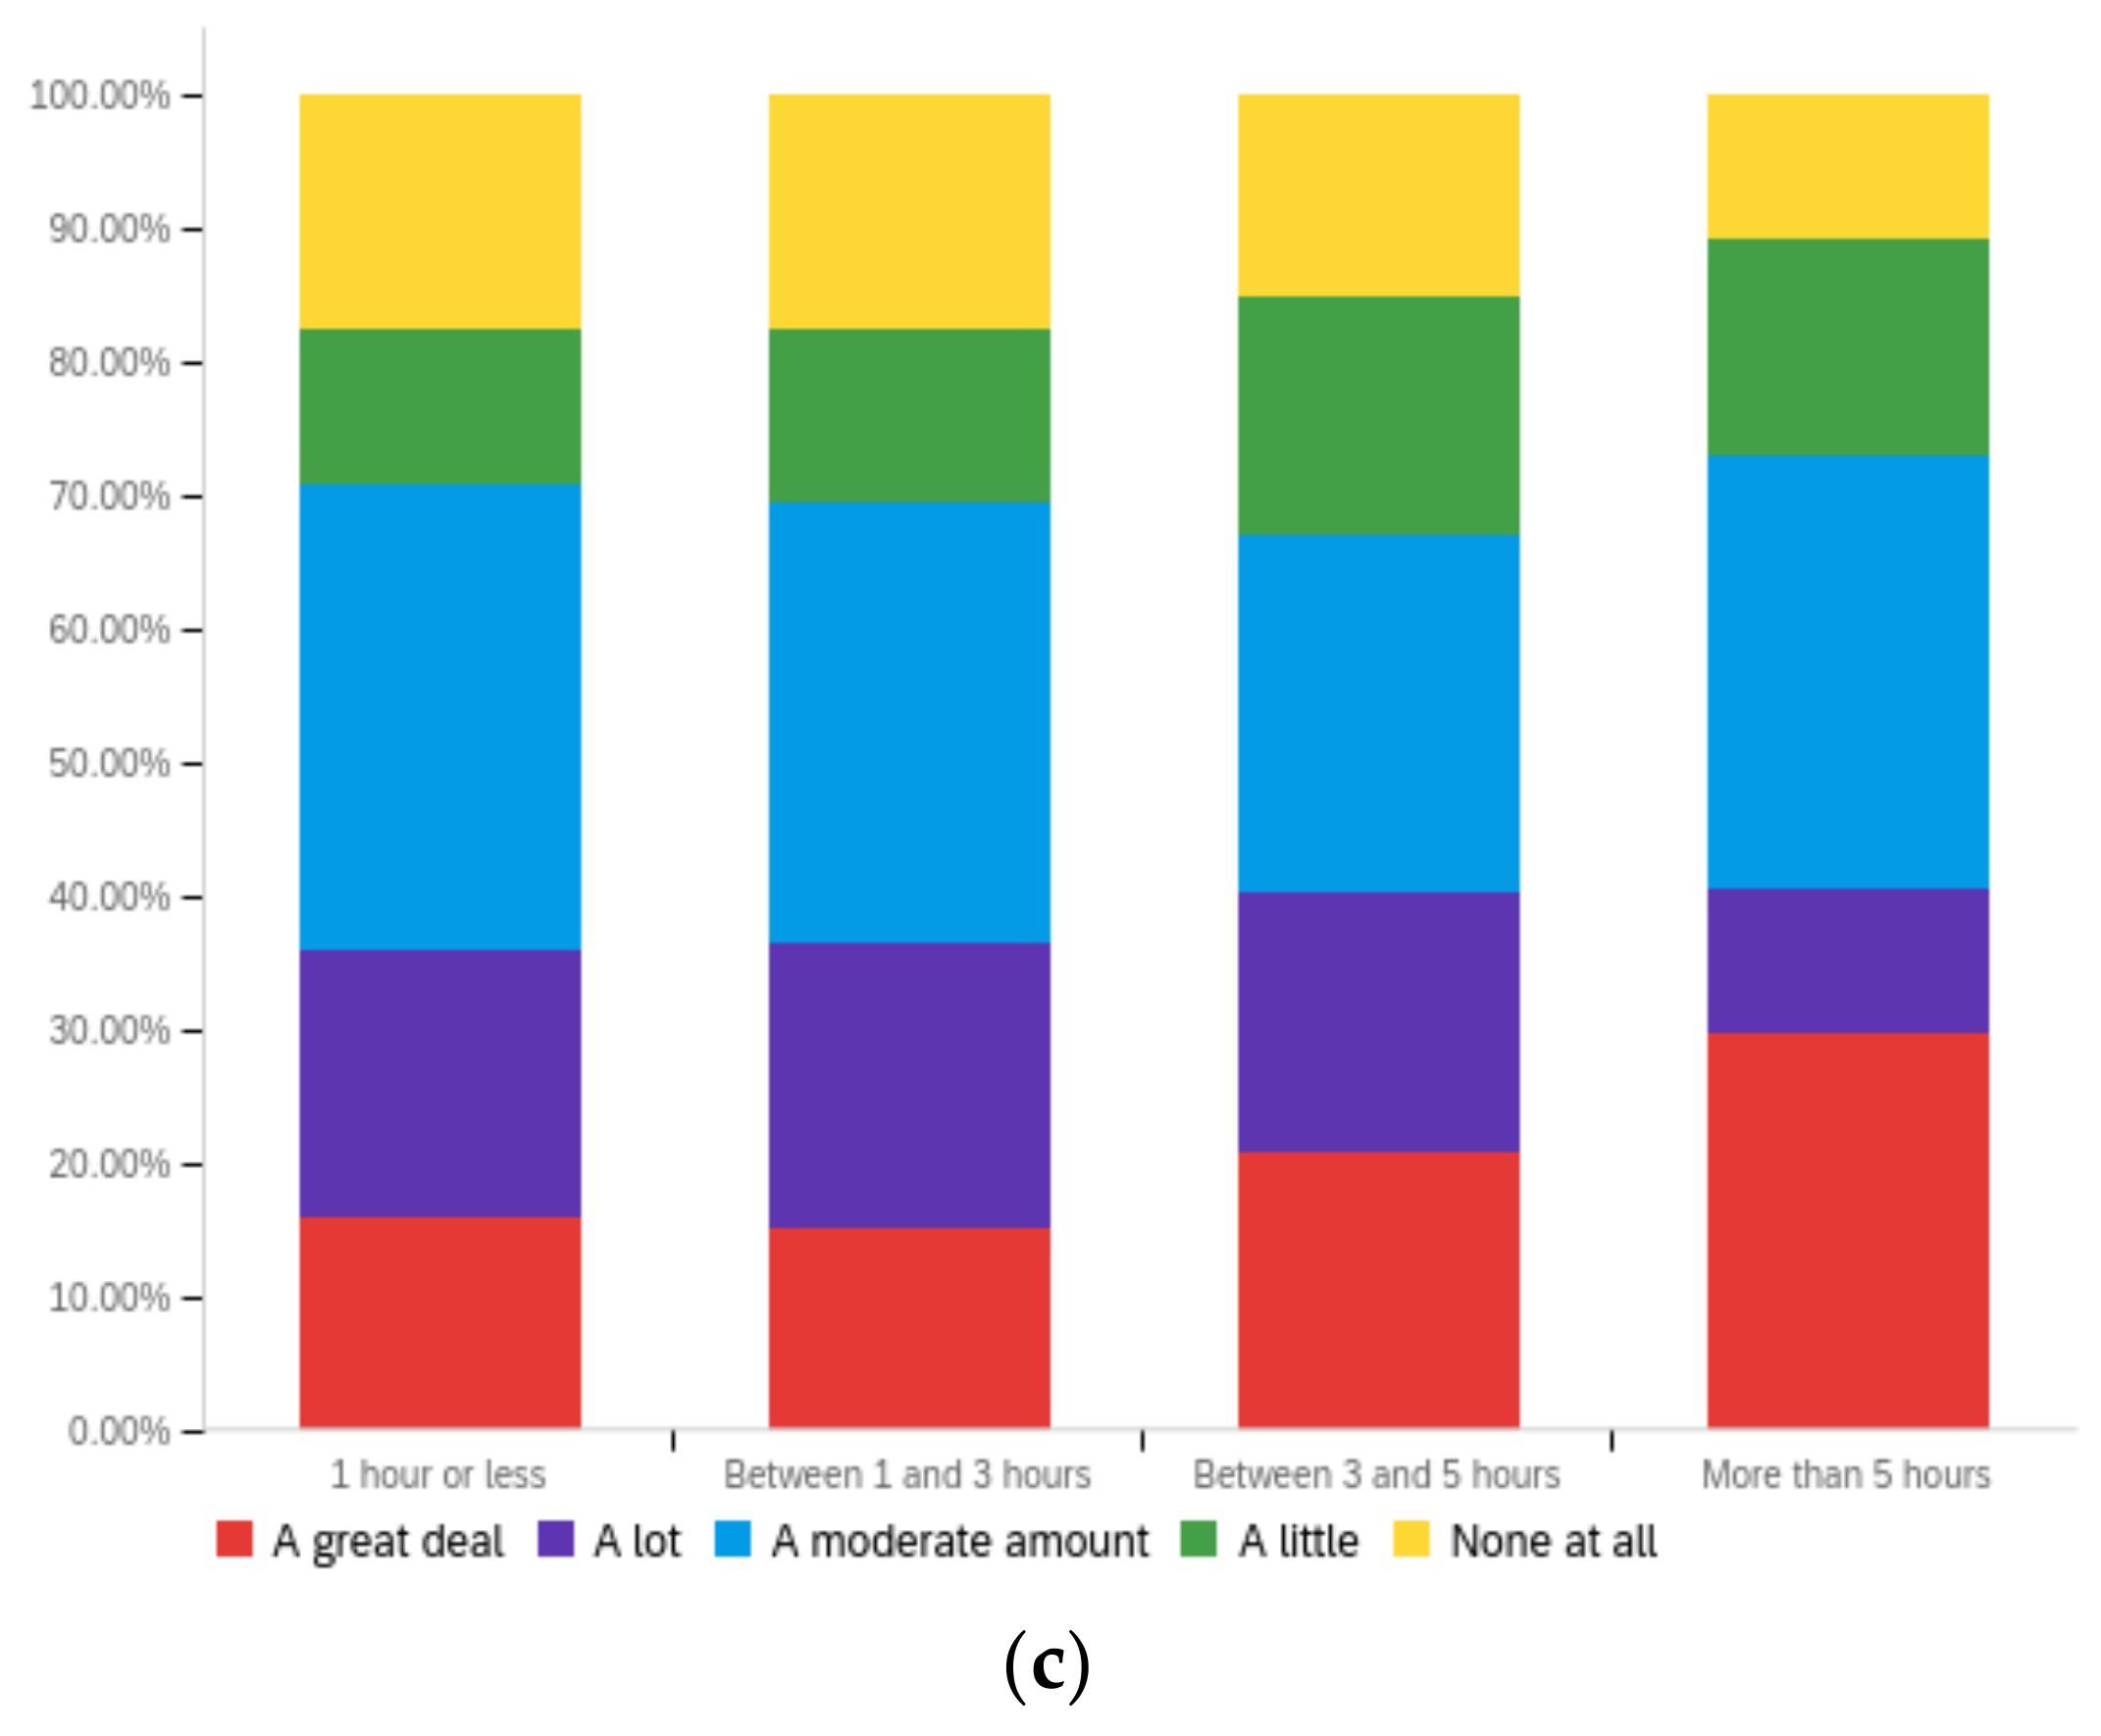
Futureinternet 14 00320 g0a24
Figure A25, Figure A26, Figure A27, Figure A28, Figure A29, Figure A30, Figure A31, Figure A32, Figure A33, Figure A34, Figure A35 and Figure A36 present data in regard to the areas discussed in Section 4.2. Figure A25, Figure A26 and Figure A27 present data regarding articles’ number of opinion statements. Figure A28, Figure A29 and Figure A30 present data regarding the virality of articles. Figure A31, Figure A32 and Figure A33 present data on articles’ level of controversy. Finally, Figure A34, Figure A35 and Figure A36 present data regarding the impact of articles’ reading levels.
As with the earlier figures, each set of three figures includes one related to respondents’ personal self-perceptions of impact, on regarding the perceptions of others regarding the metric’s impact and one that asks what the ideal level of impact should be.
Figure A25. Article opinion statement quantity—personal perception impact by: (a) income level (top left), (b) political affiliation (top right) and (c) online usage (bottom).
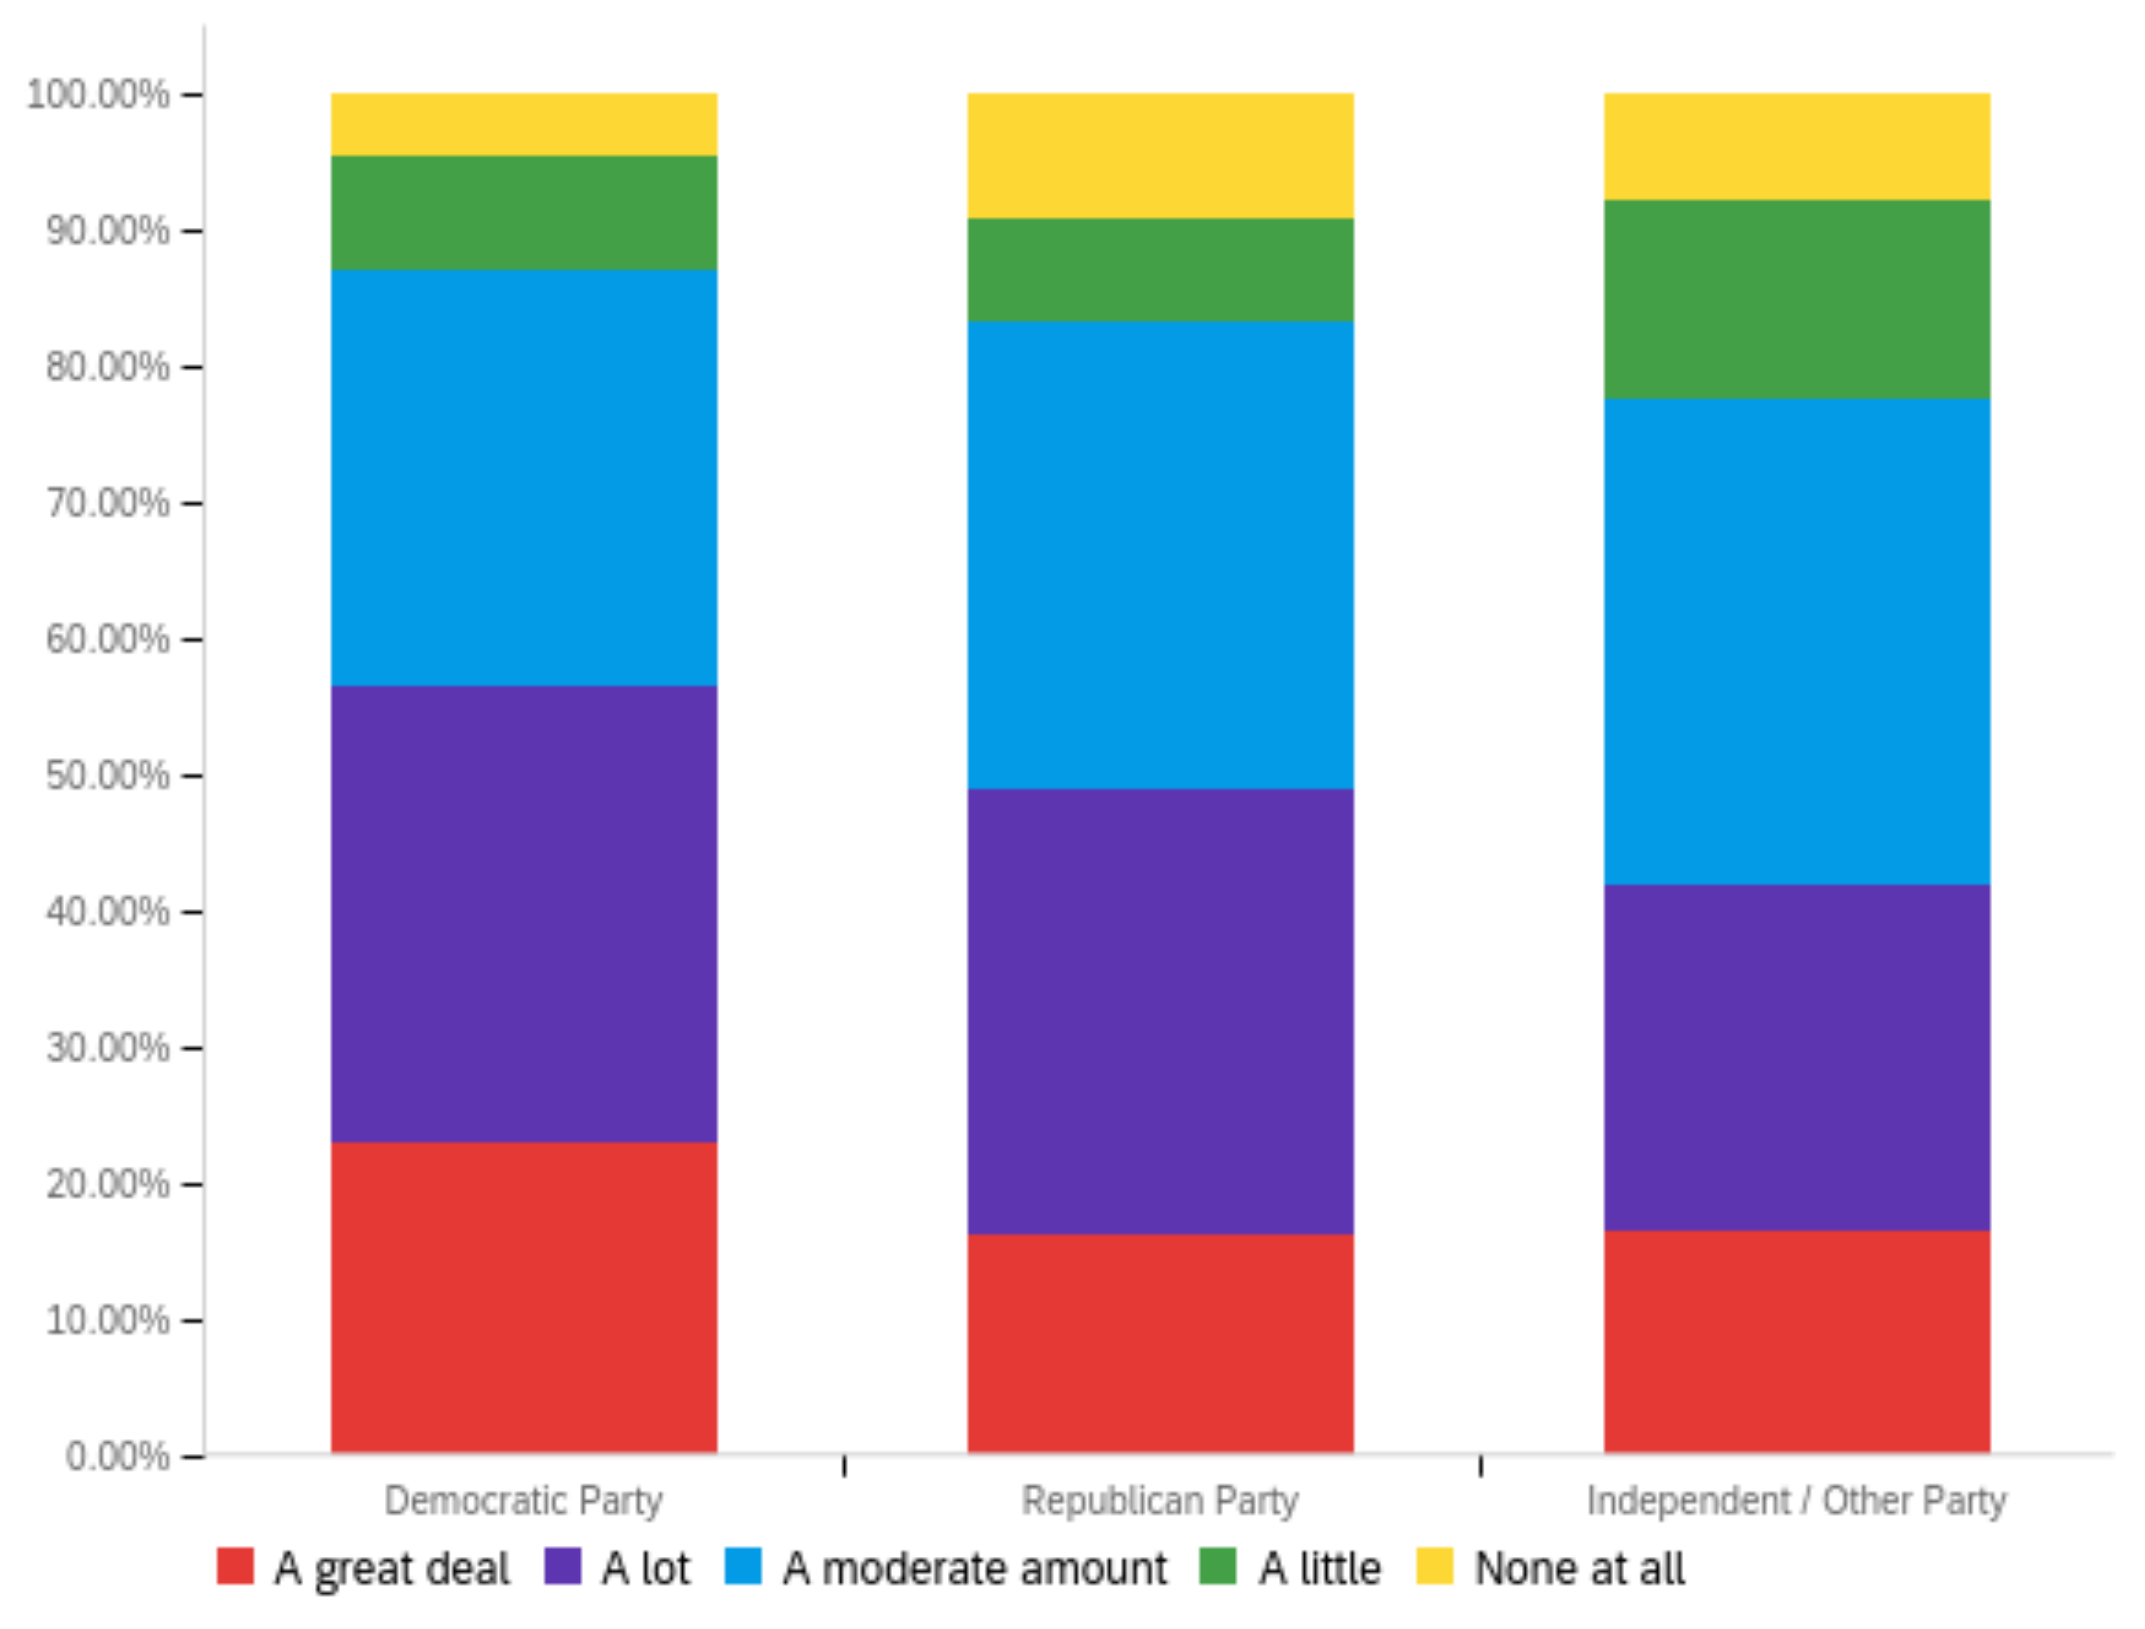
Futureinternet 14 00320 g0a25
Figure A26. Article opinion statement quantity—others’ perception impact by: (a) income level (top left), (b) political affiliation (top right) and (c) online usage (bottom).
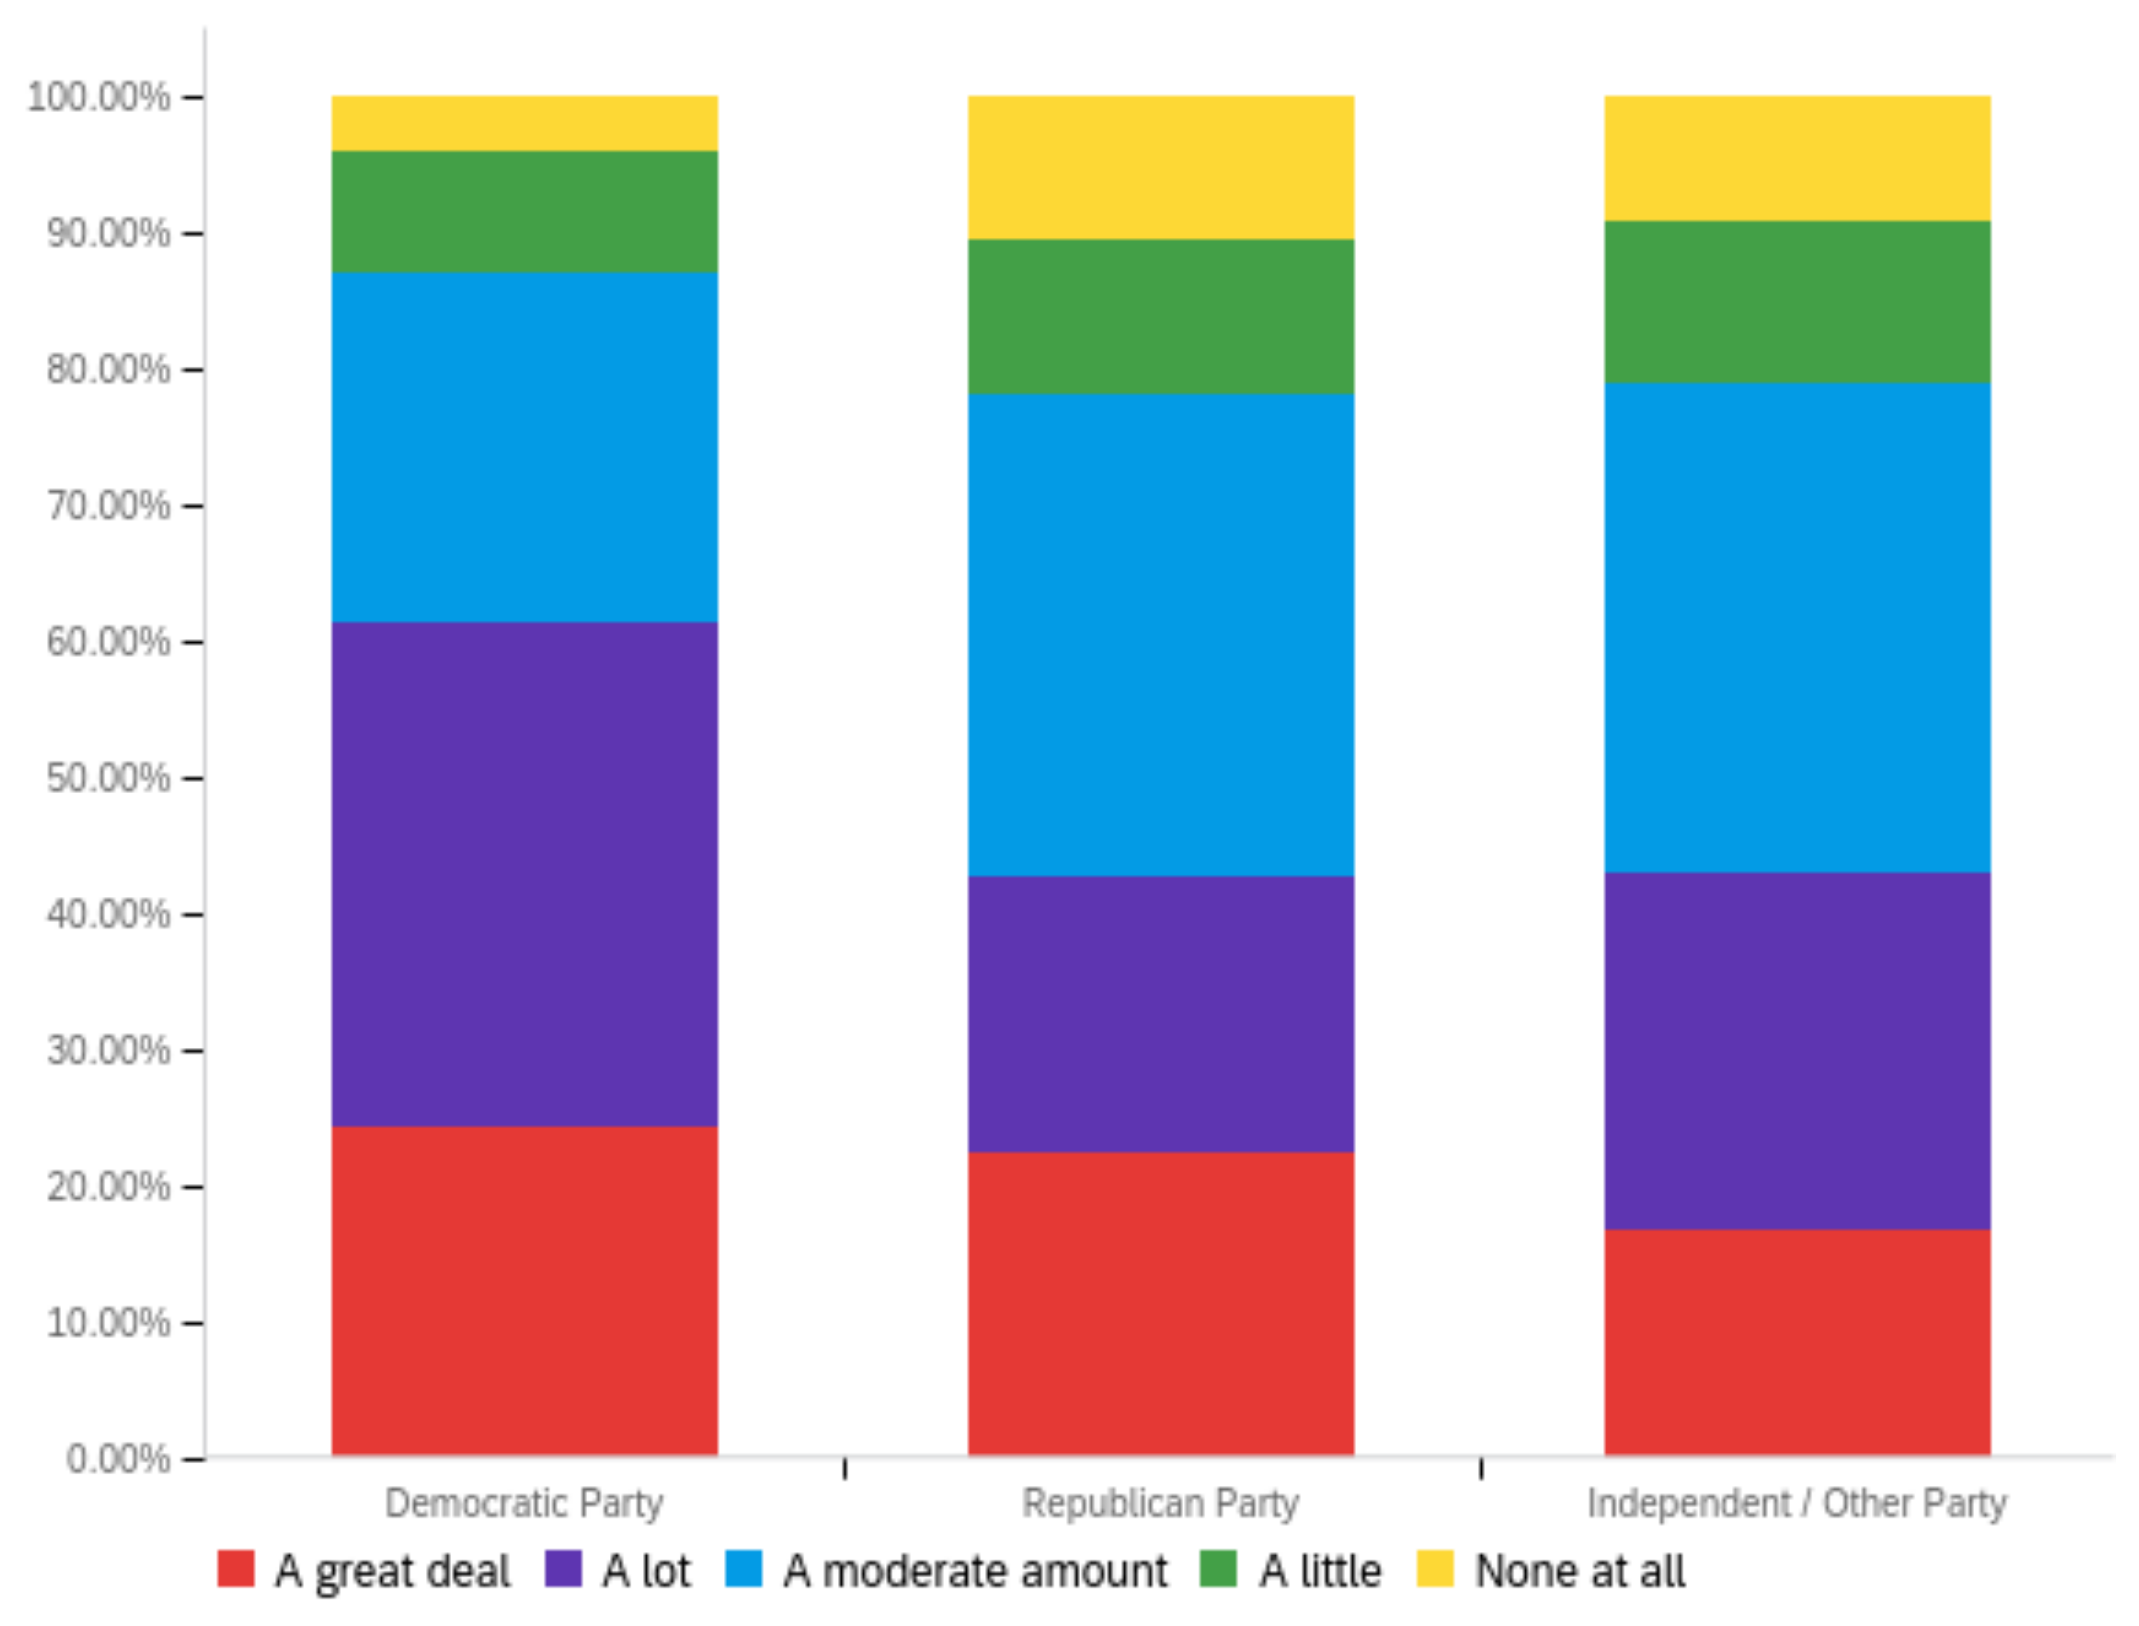
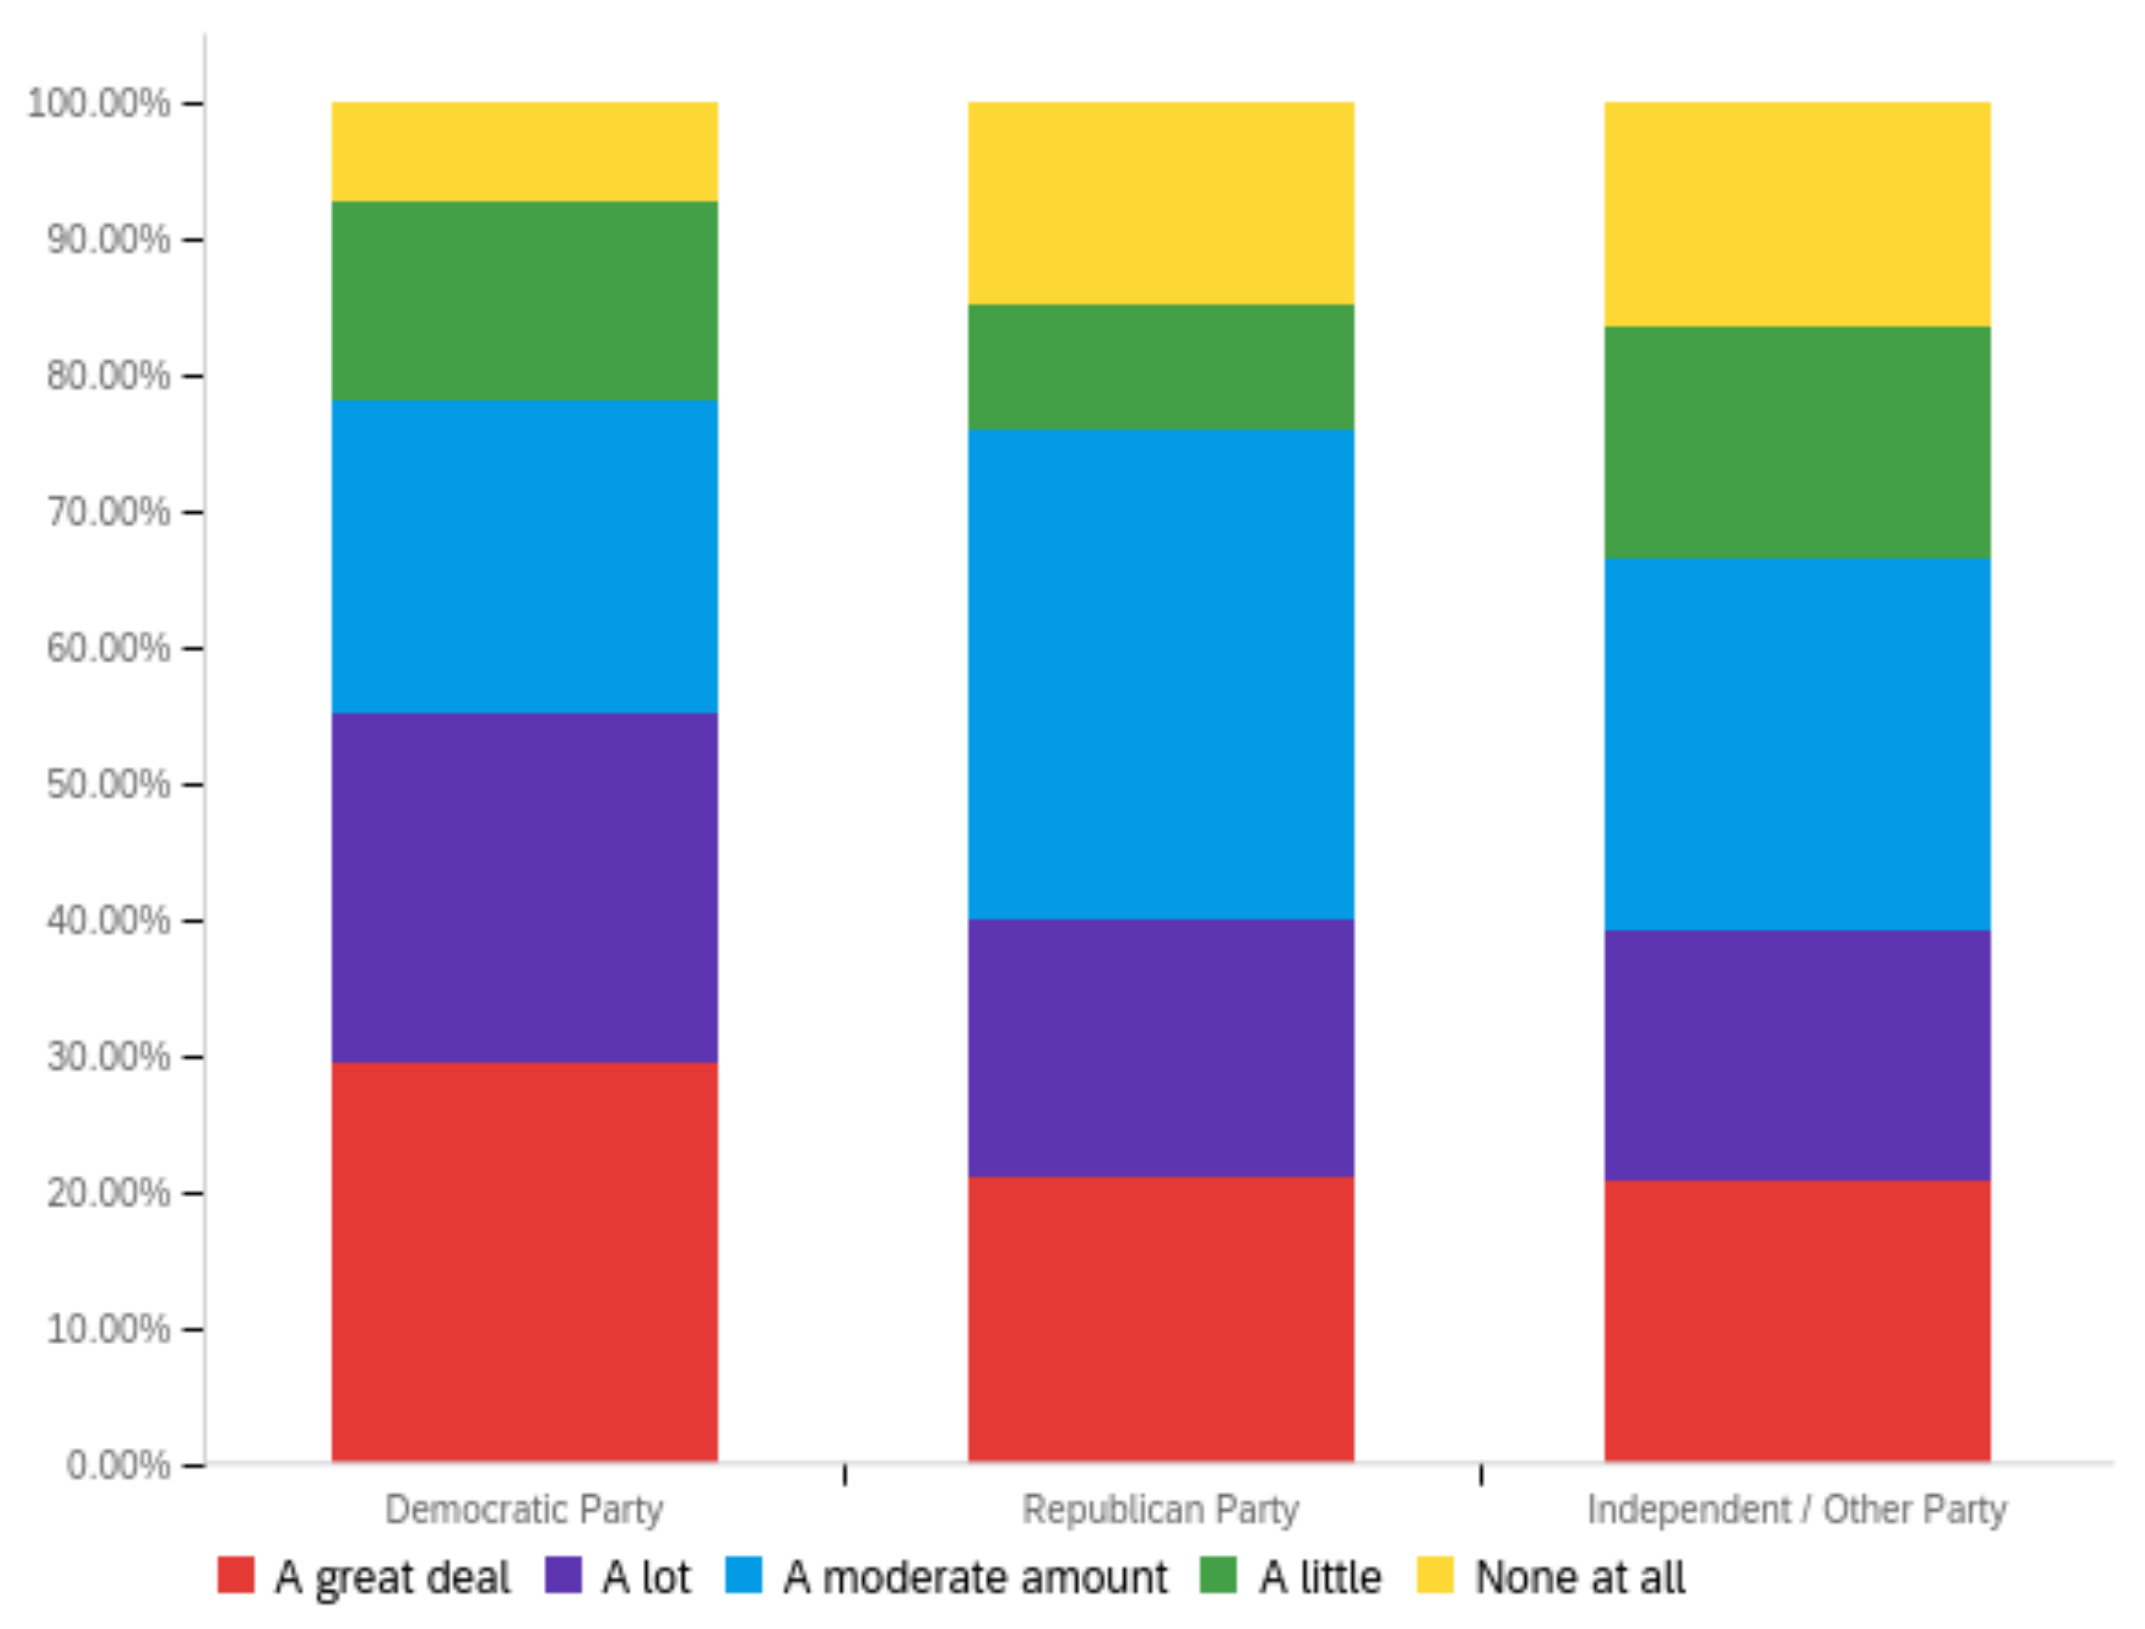
Futureinternet 14 00320 g0a26
Figure A27. Article opinion statement quantity—ideal perception impact by: (a) income level (top left), (b) political affiliation (top right) and (c) online usage (bottom).
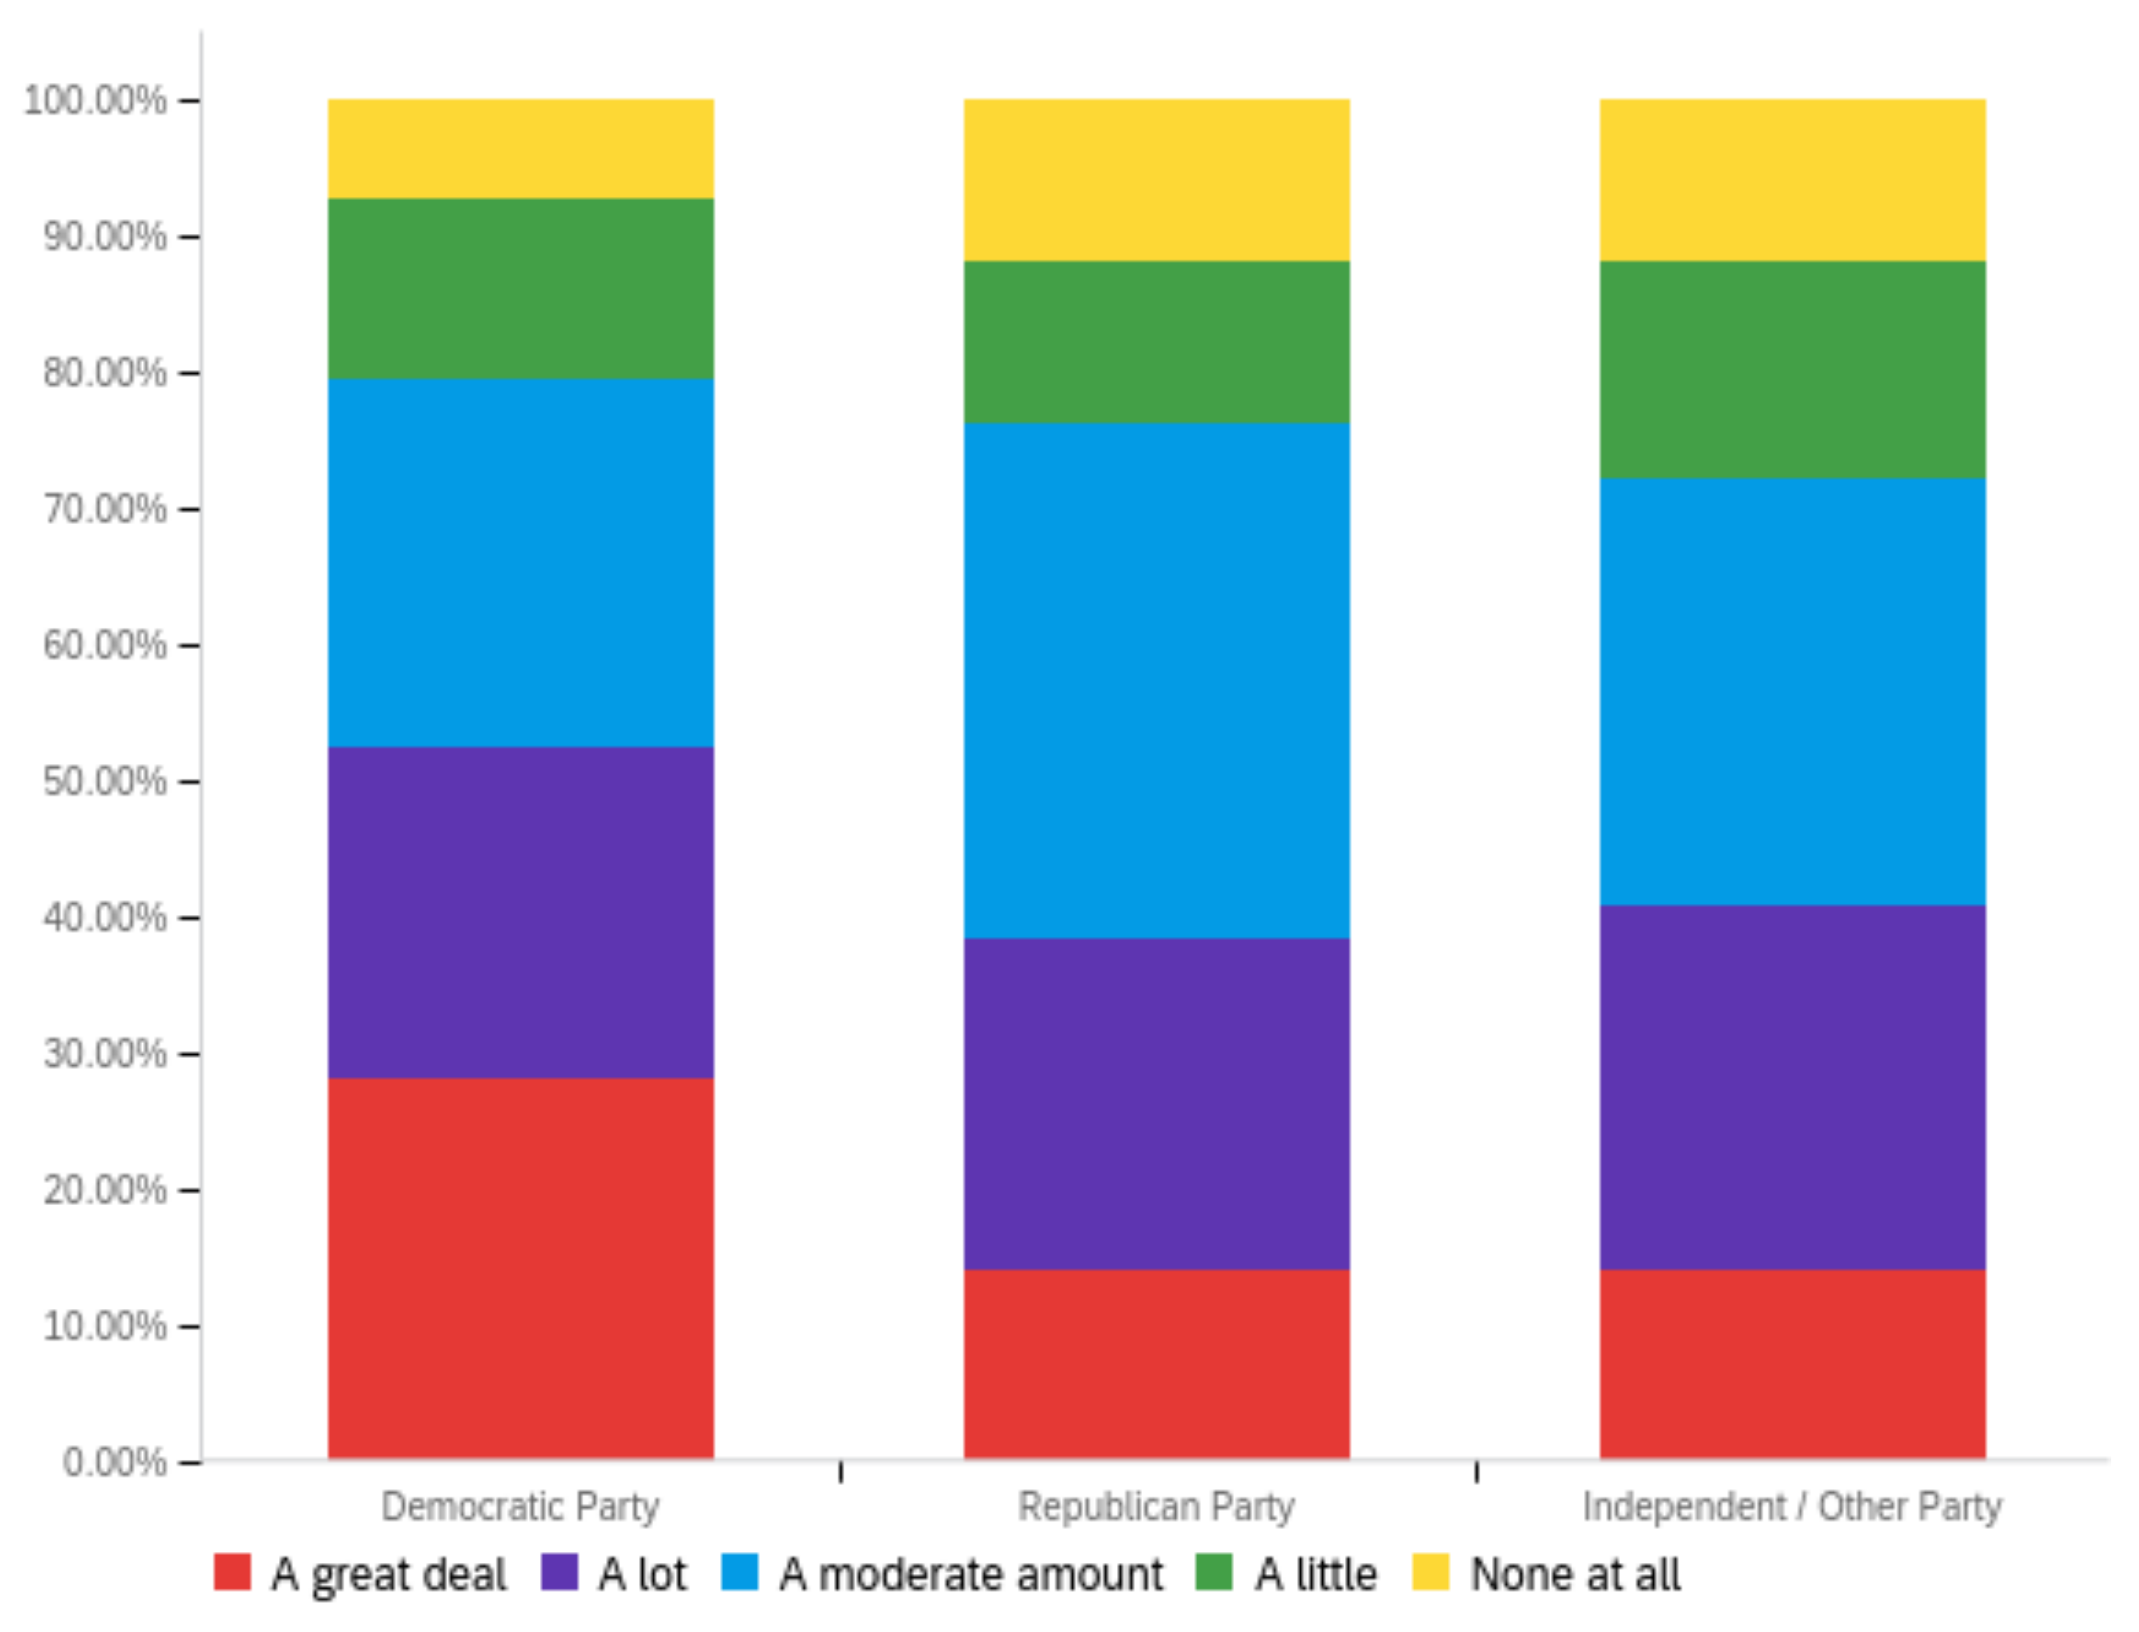
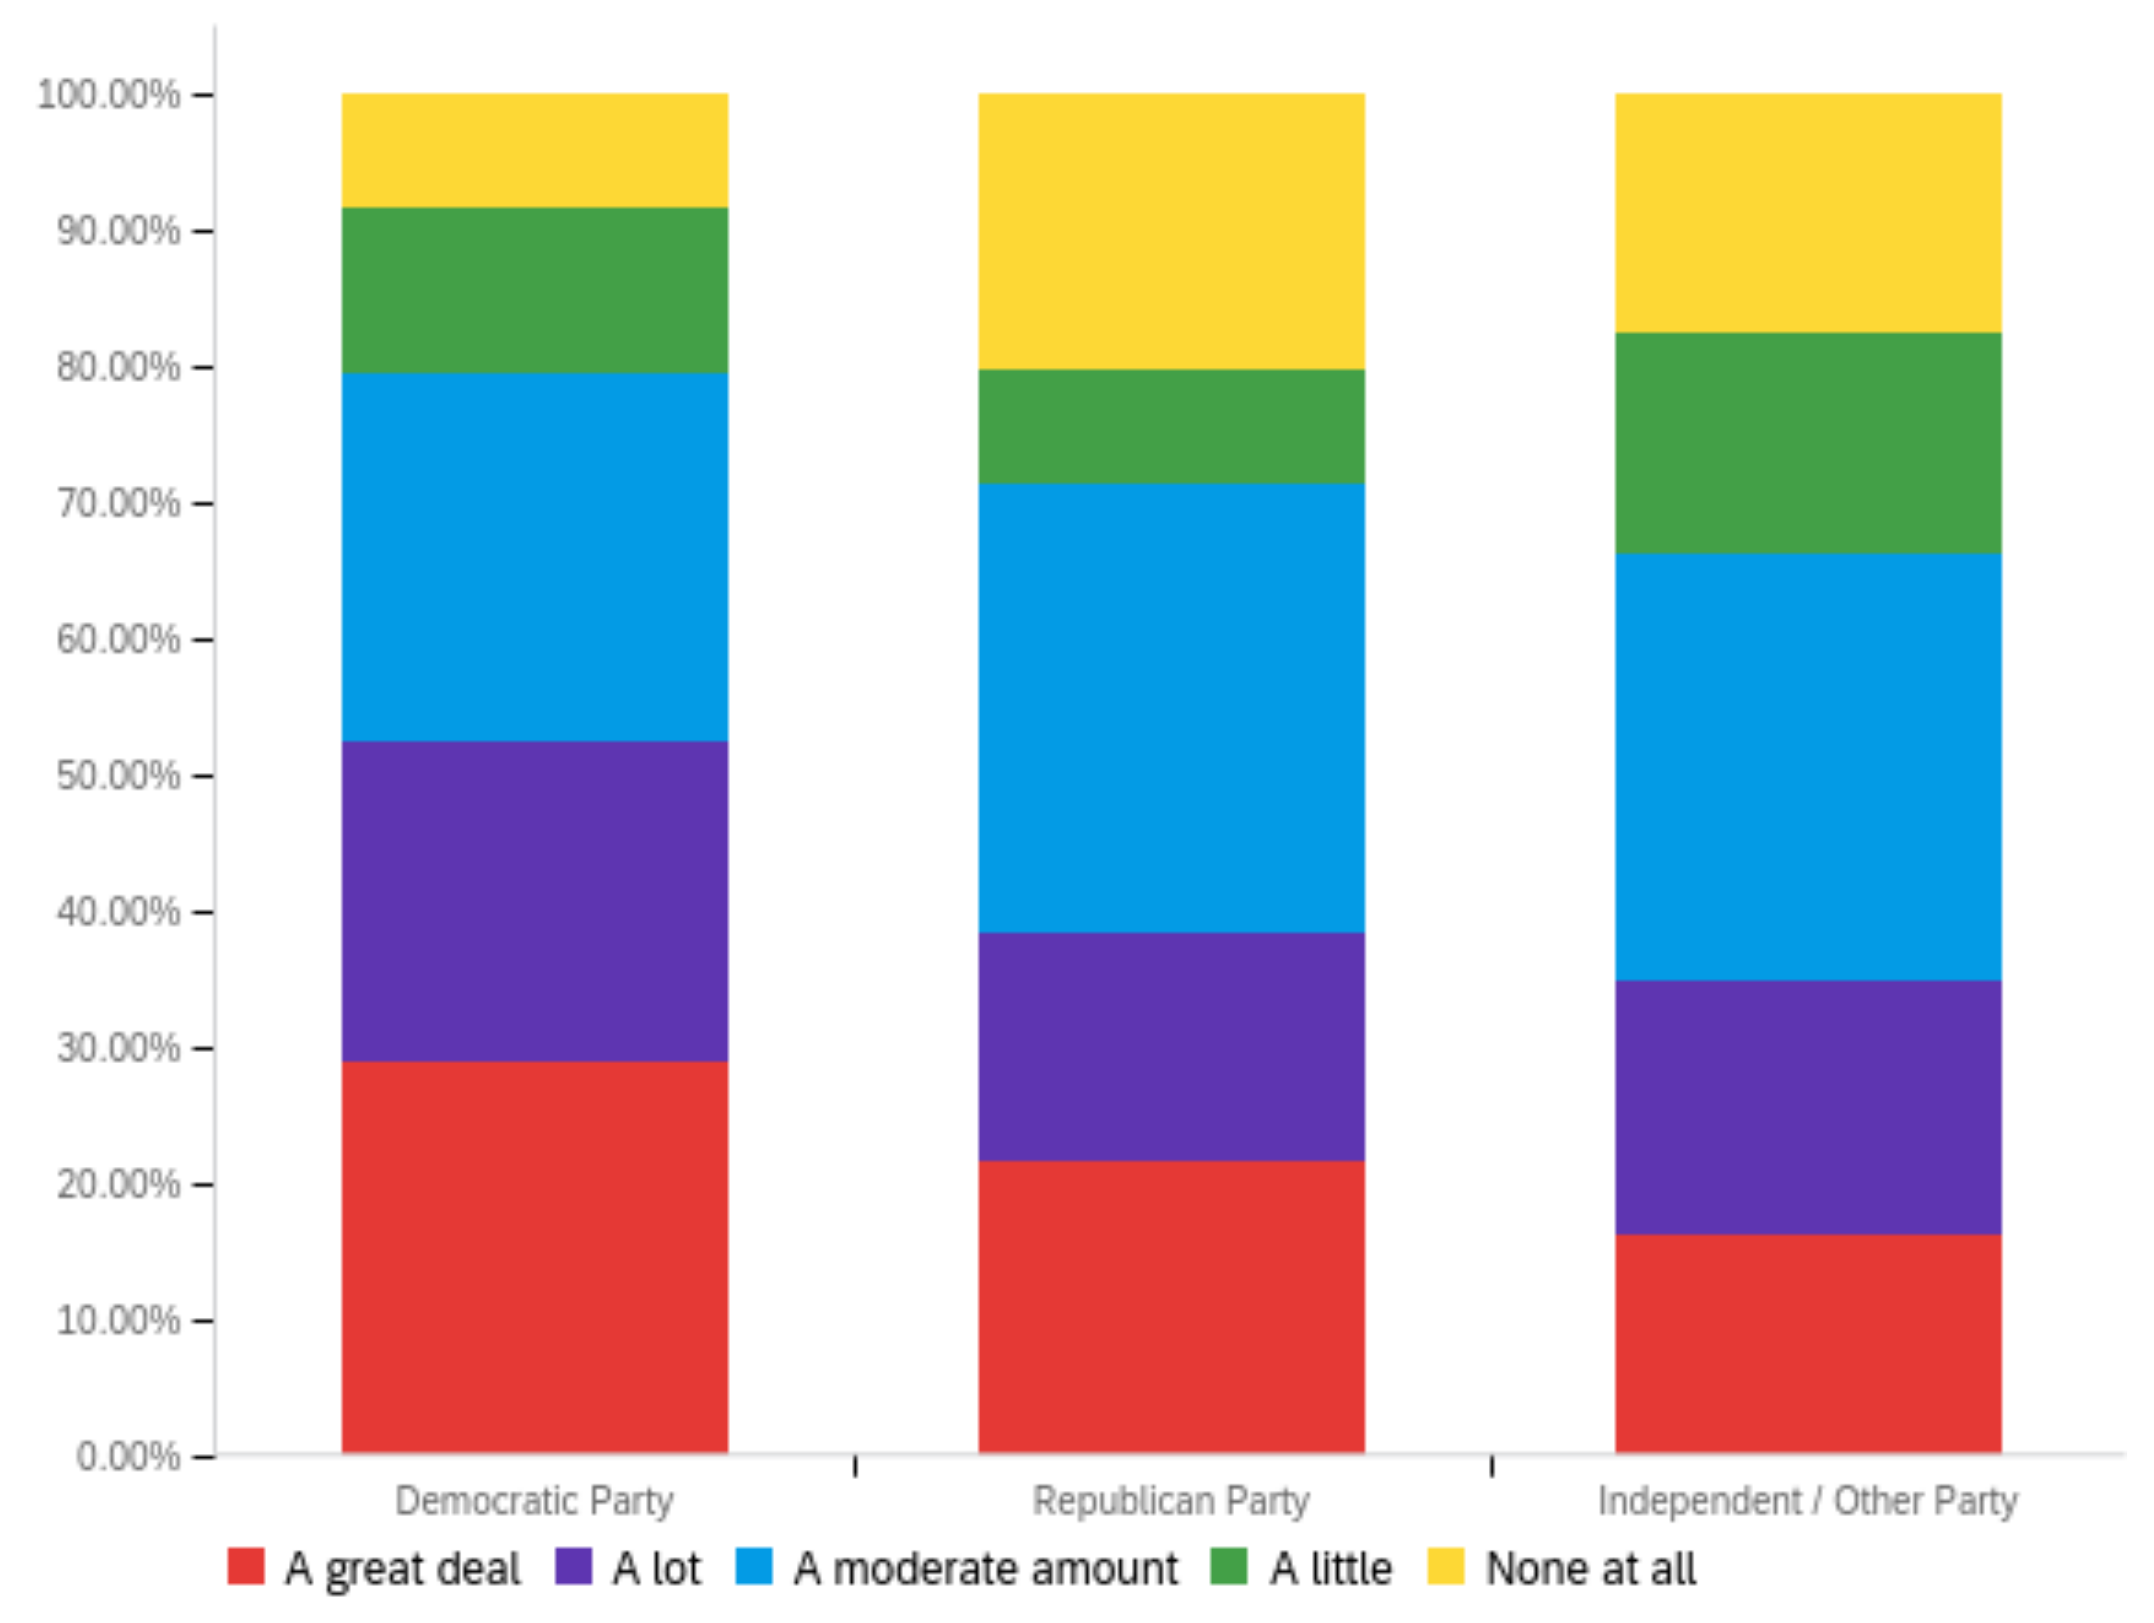
Futureinternet 14 00320 g0a27aFutureinternet 14 00320 g0a27b
Figure A28. Article virality—personal perception impact by: (a) income level (top left), (b) political affiliation (top right) and (c) online usage (bottom).
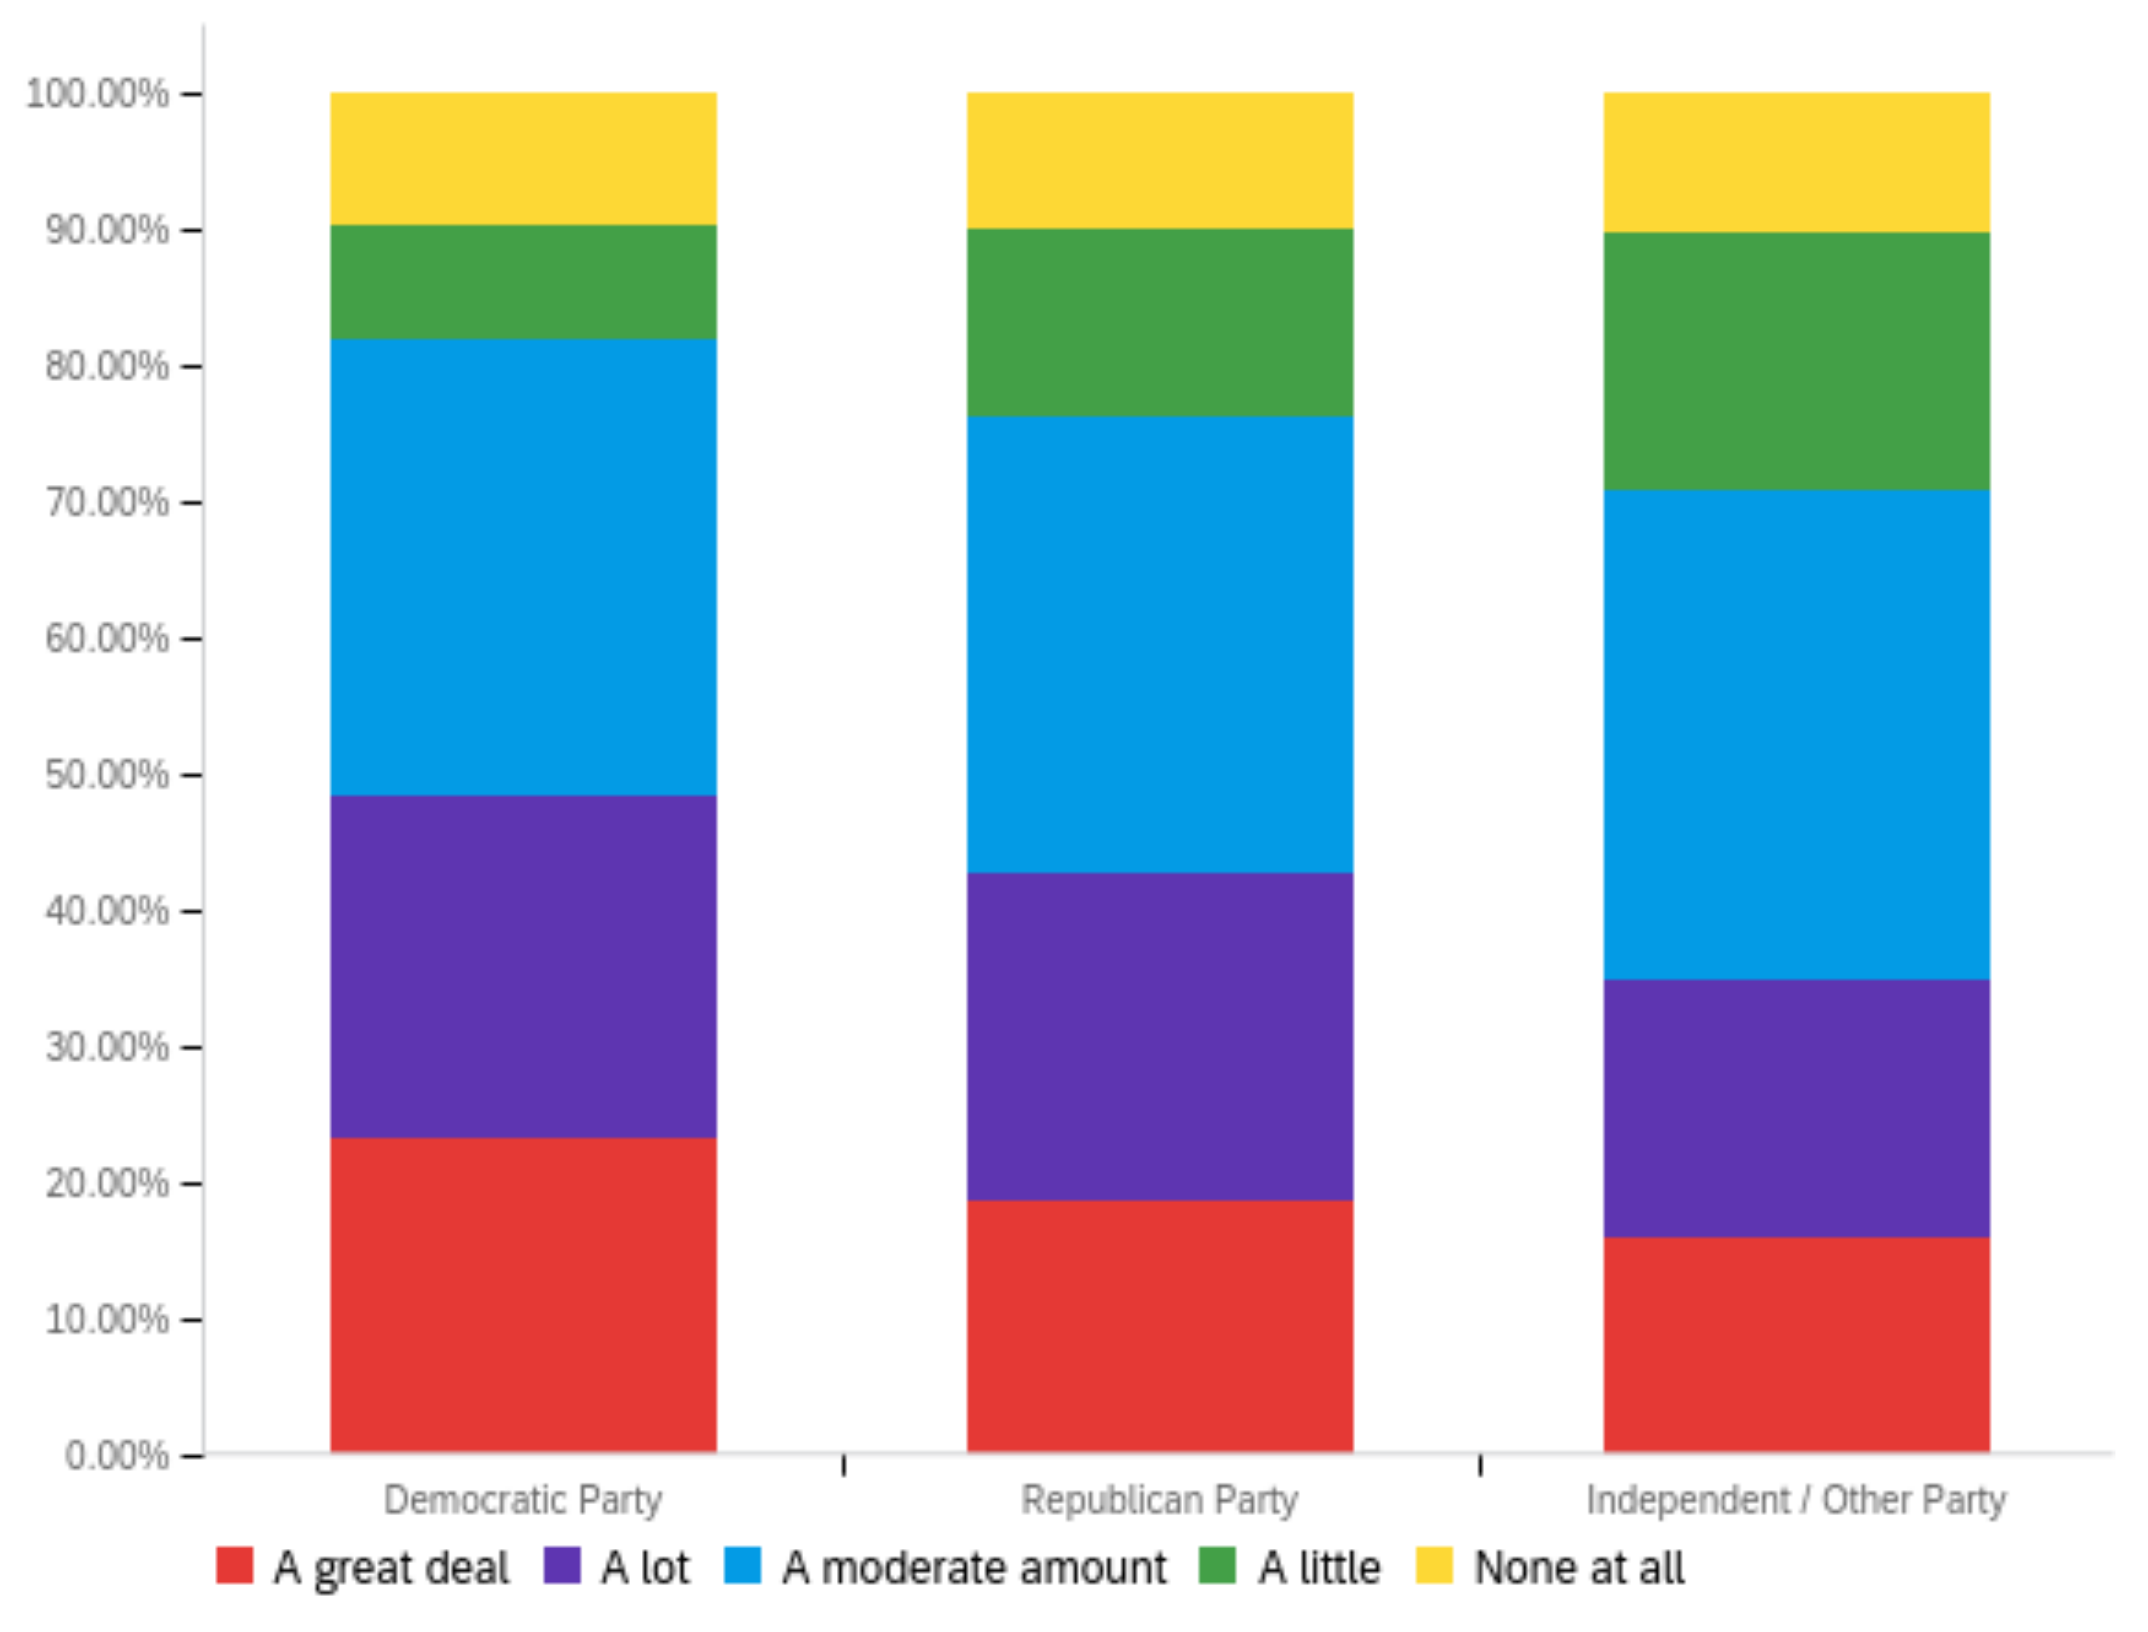
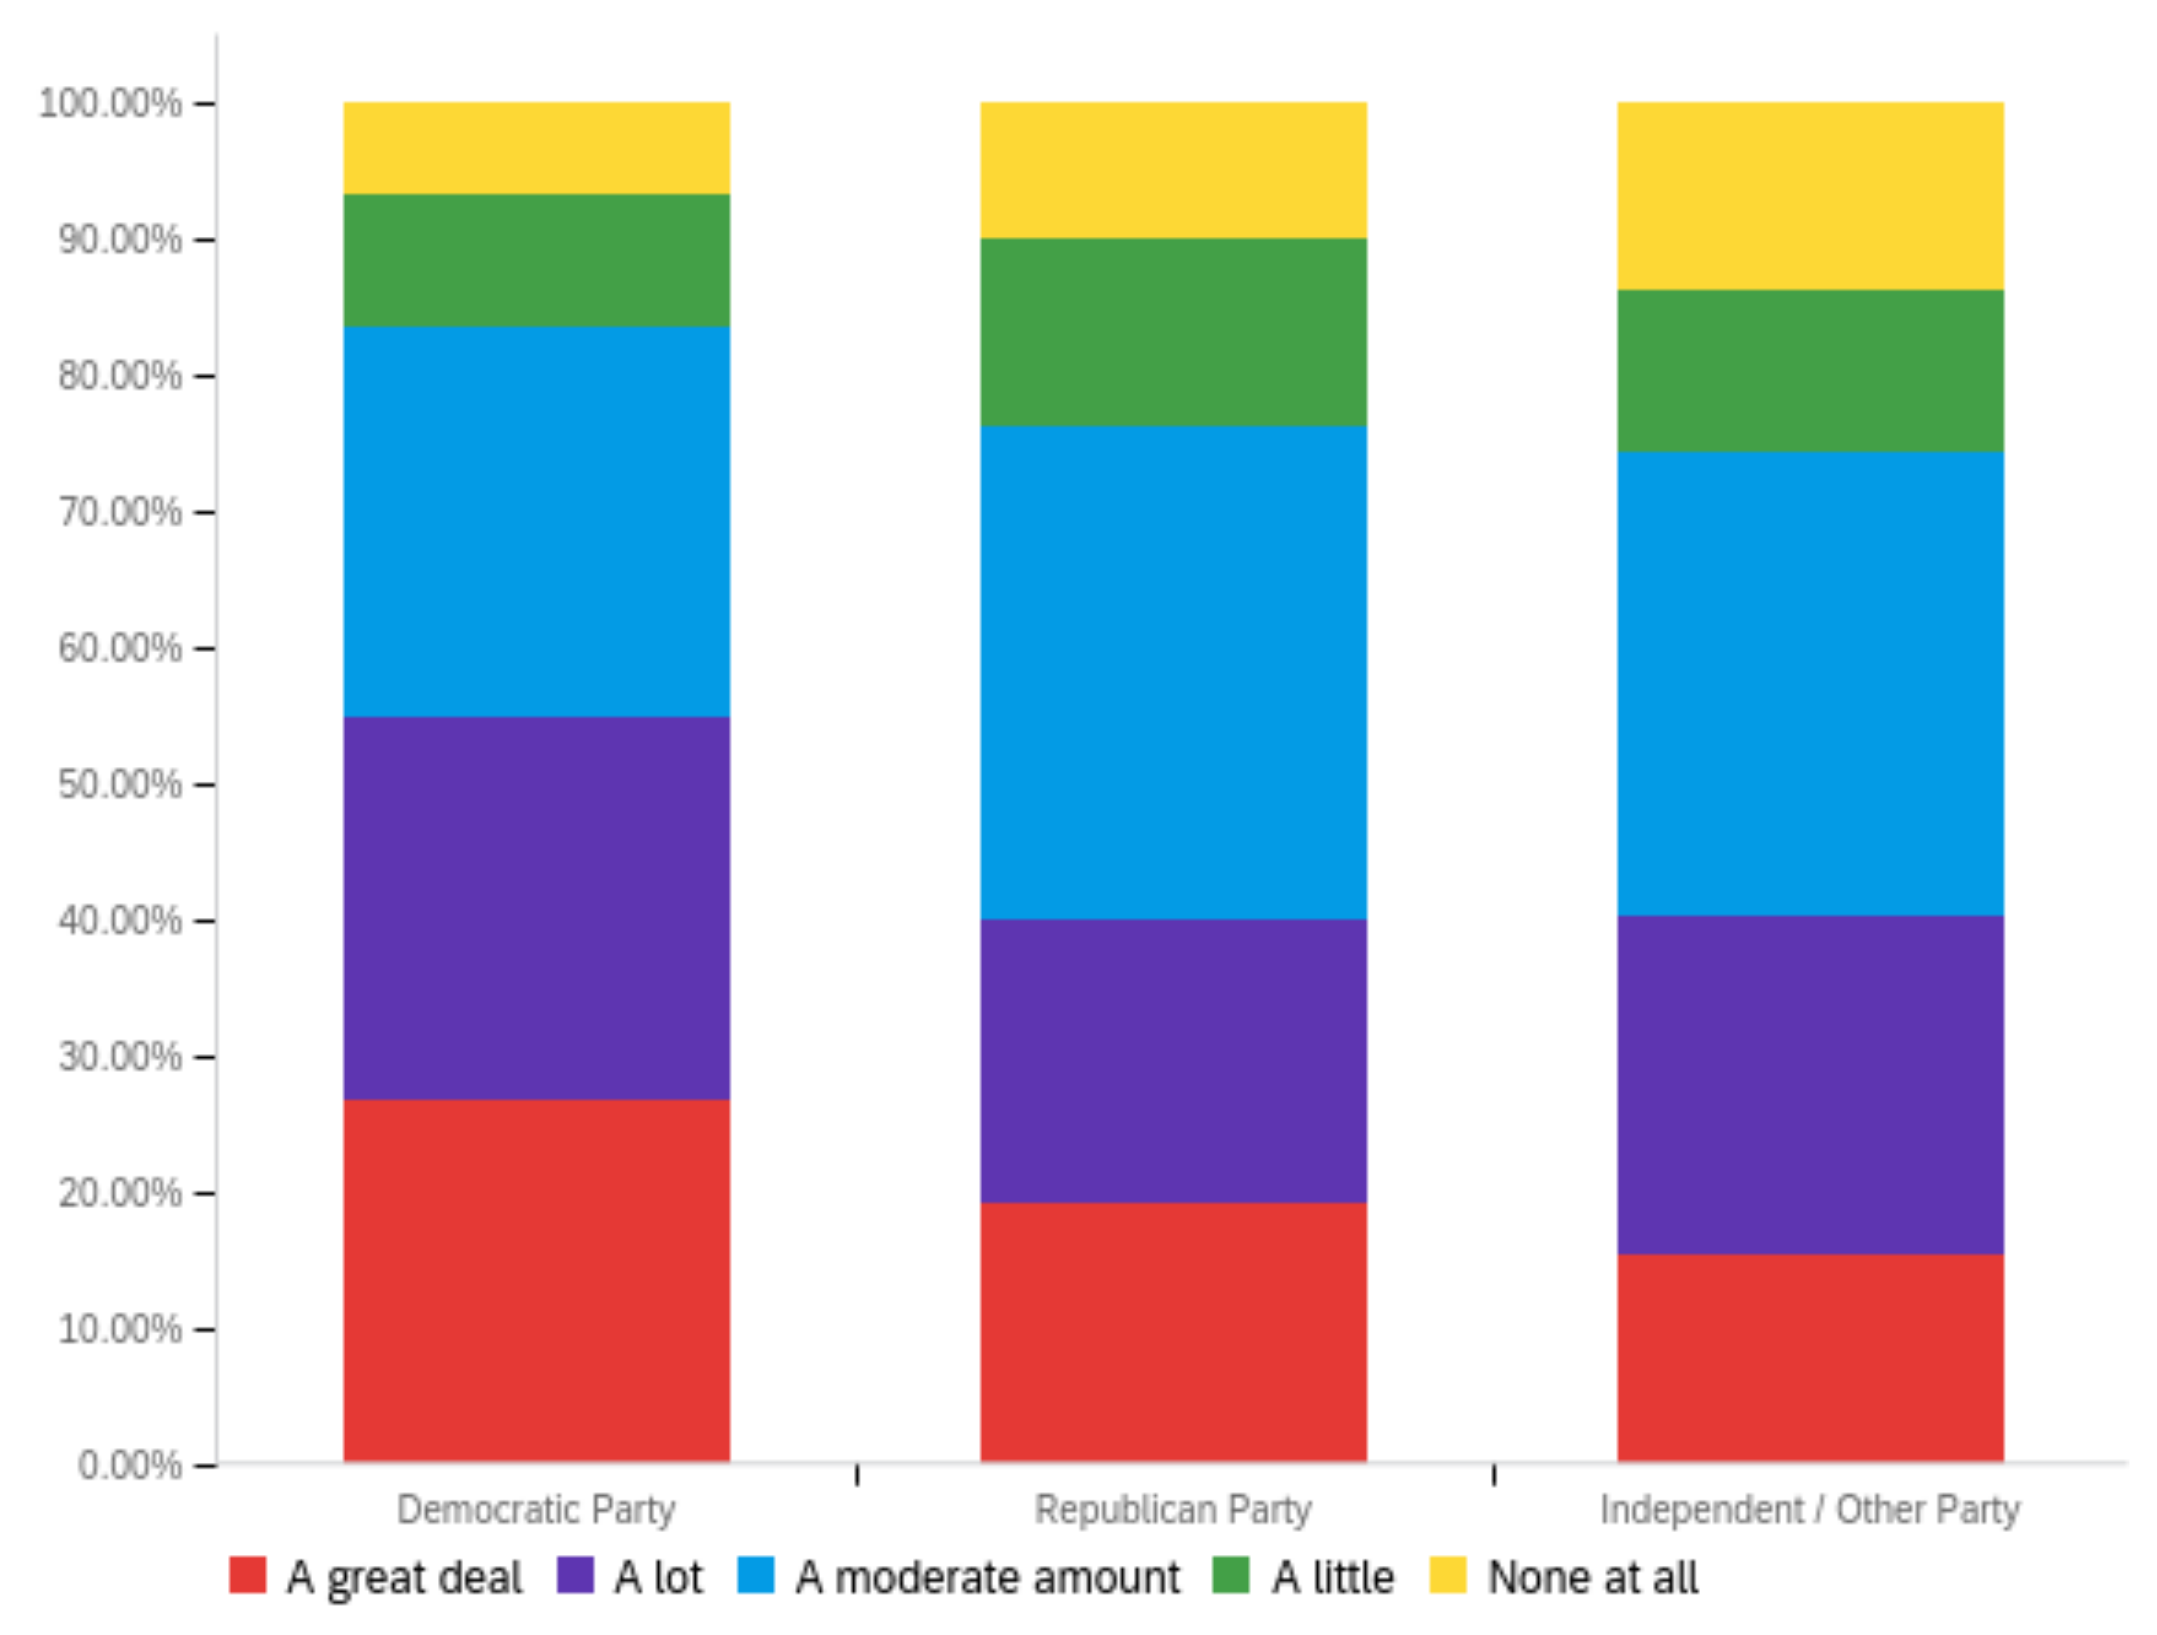
Futureinternet 14 00320 g0a28
Figure A29. Article virality—others’ perception impact by: (a) income level (top left), (b) political affiliation (top right) and (c) online usage (bottom).
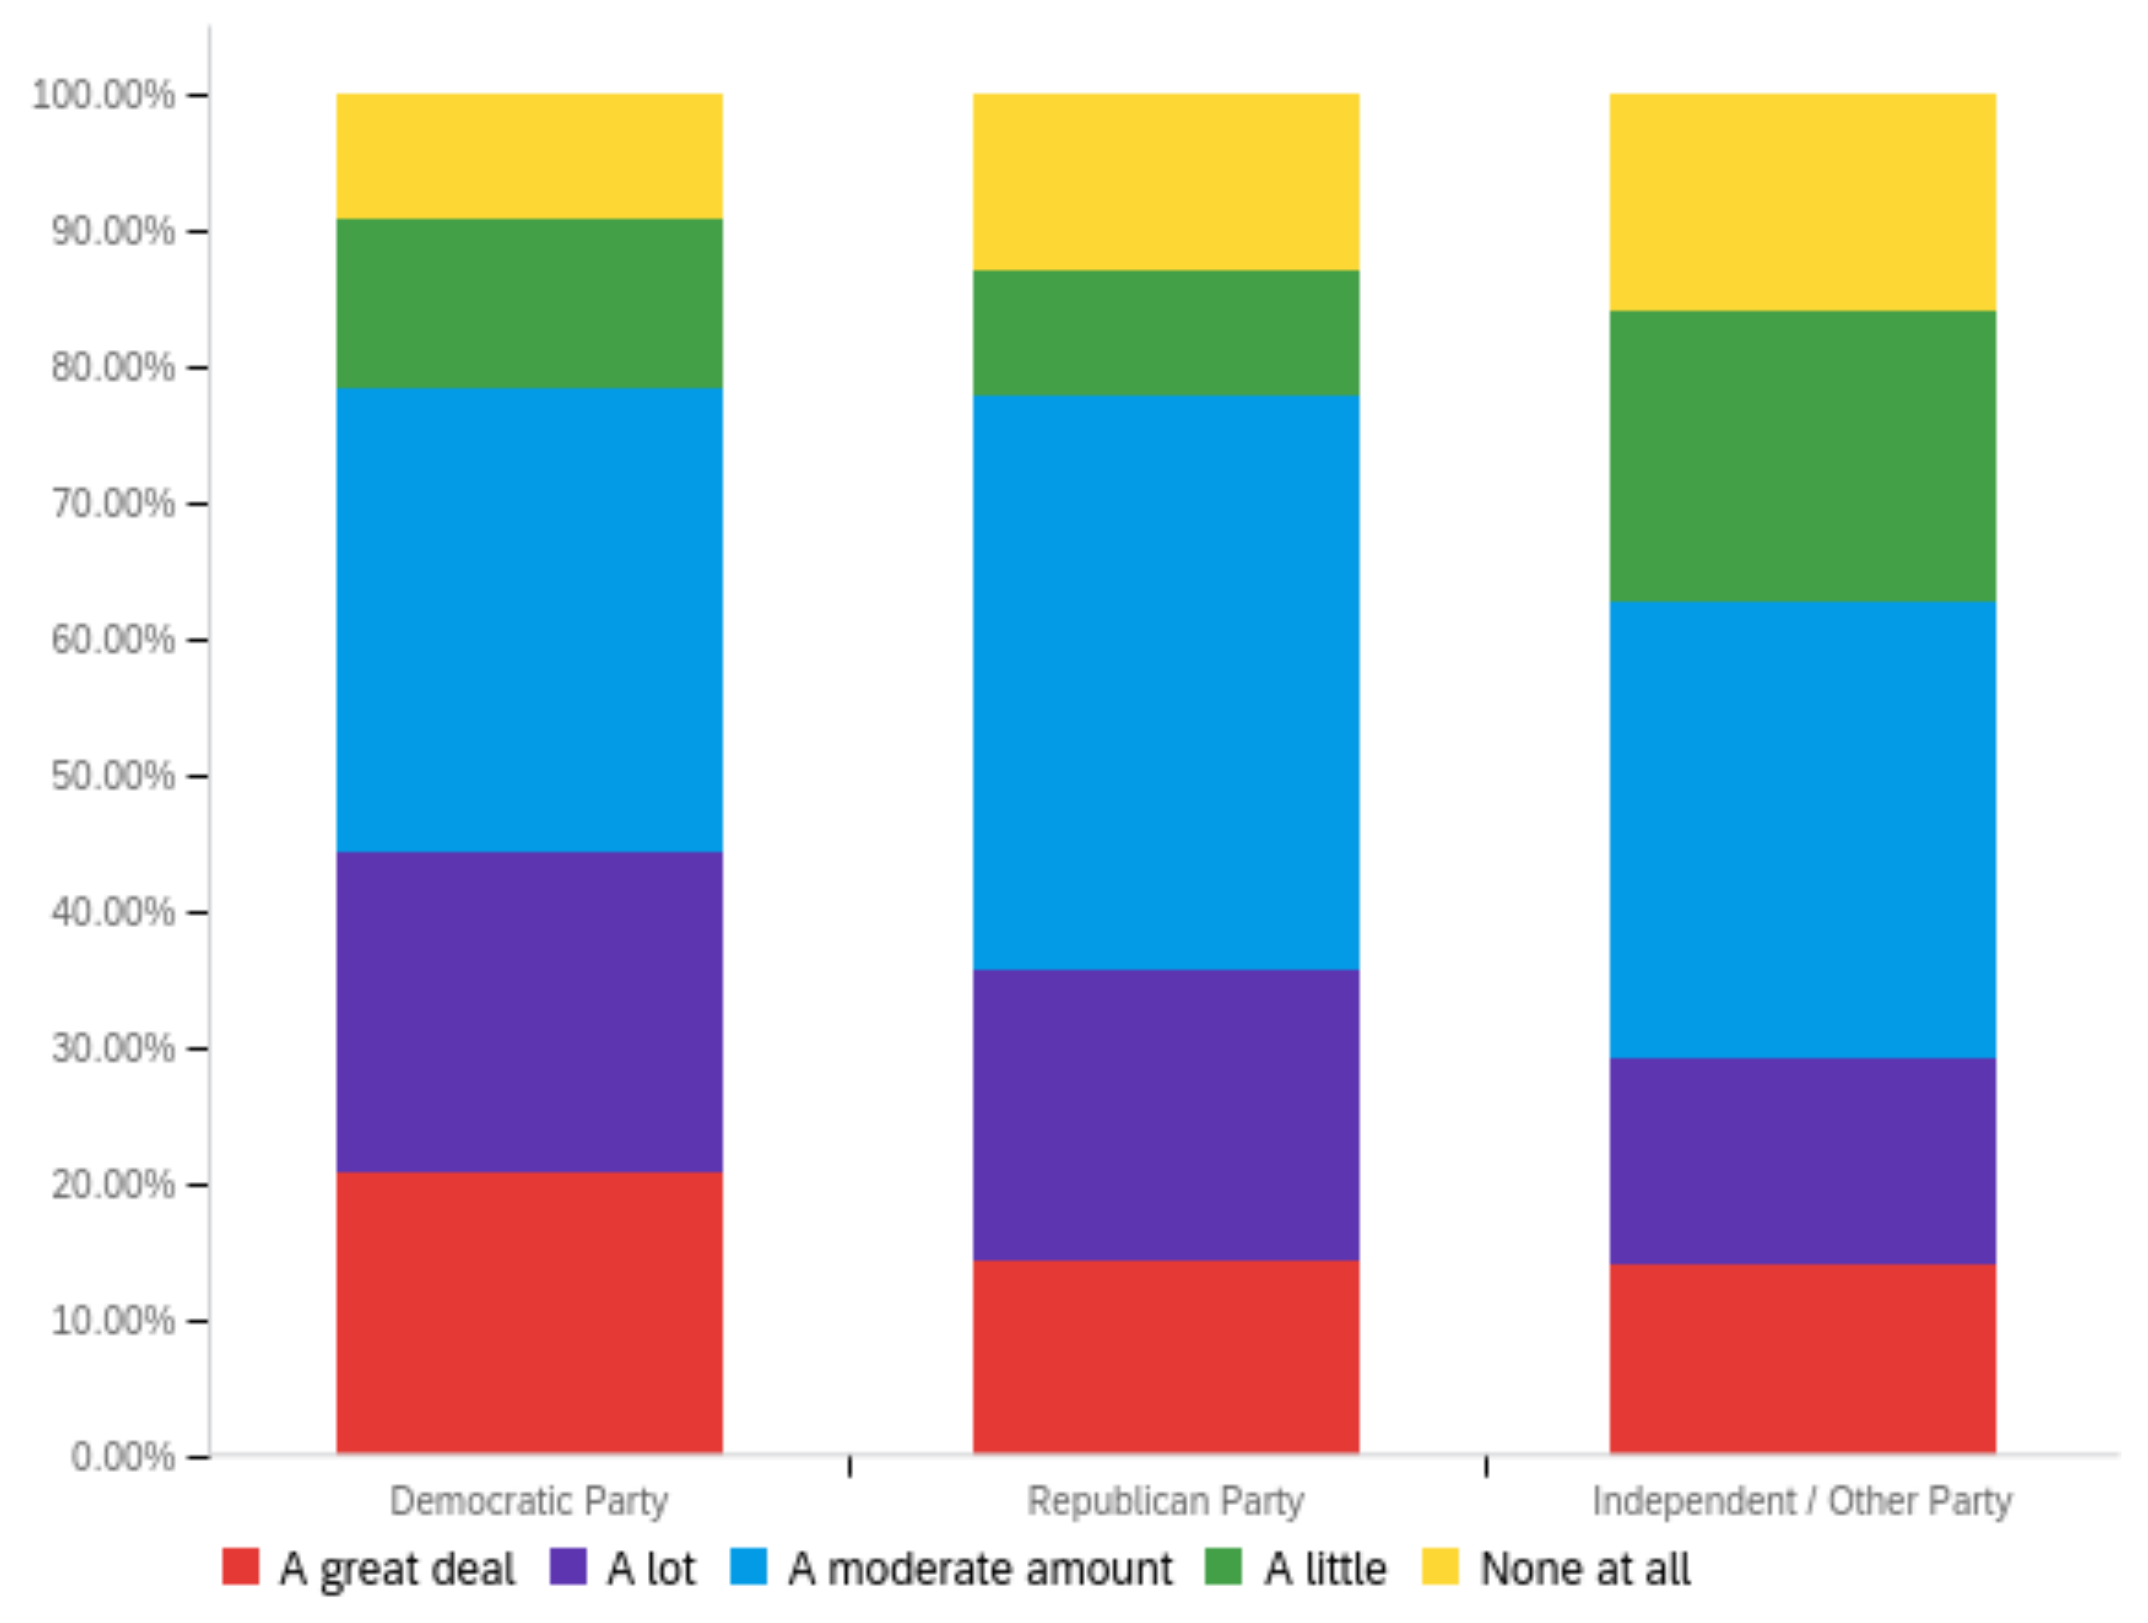
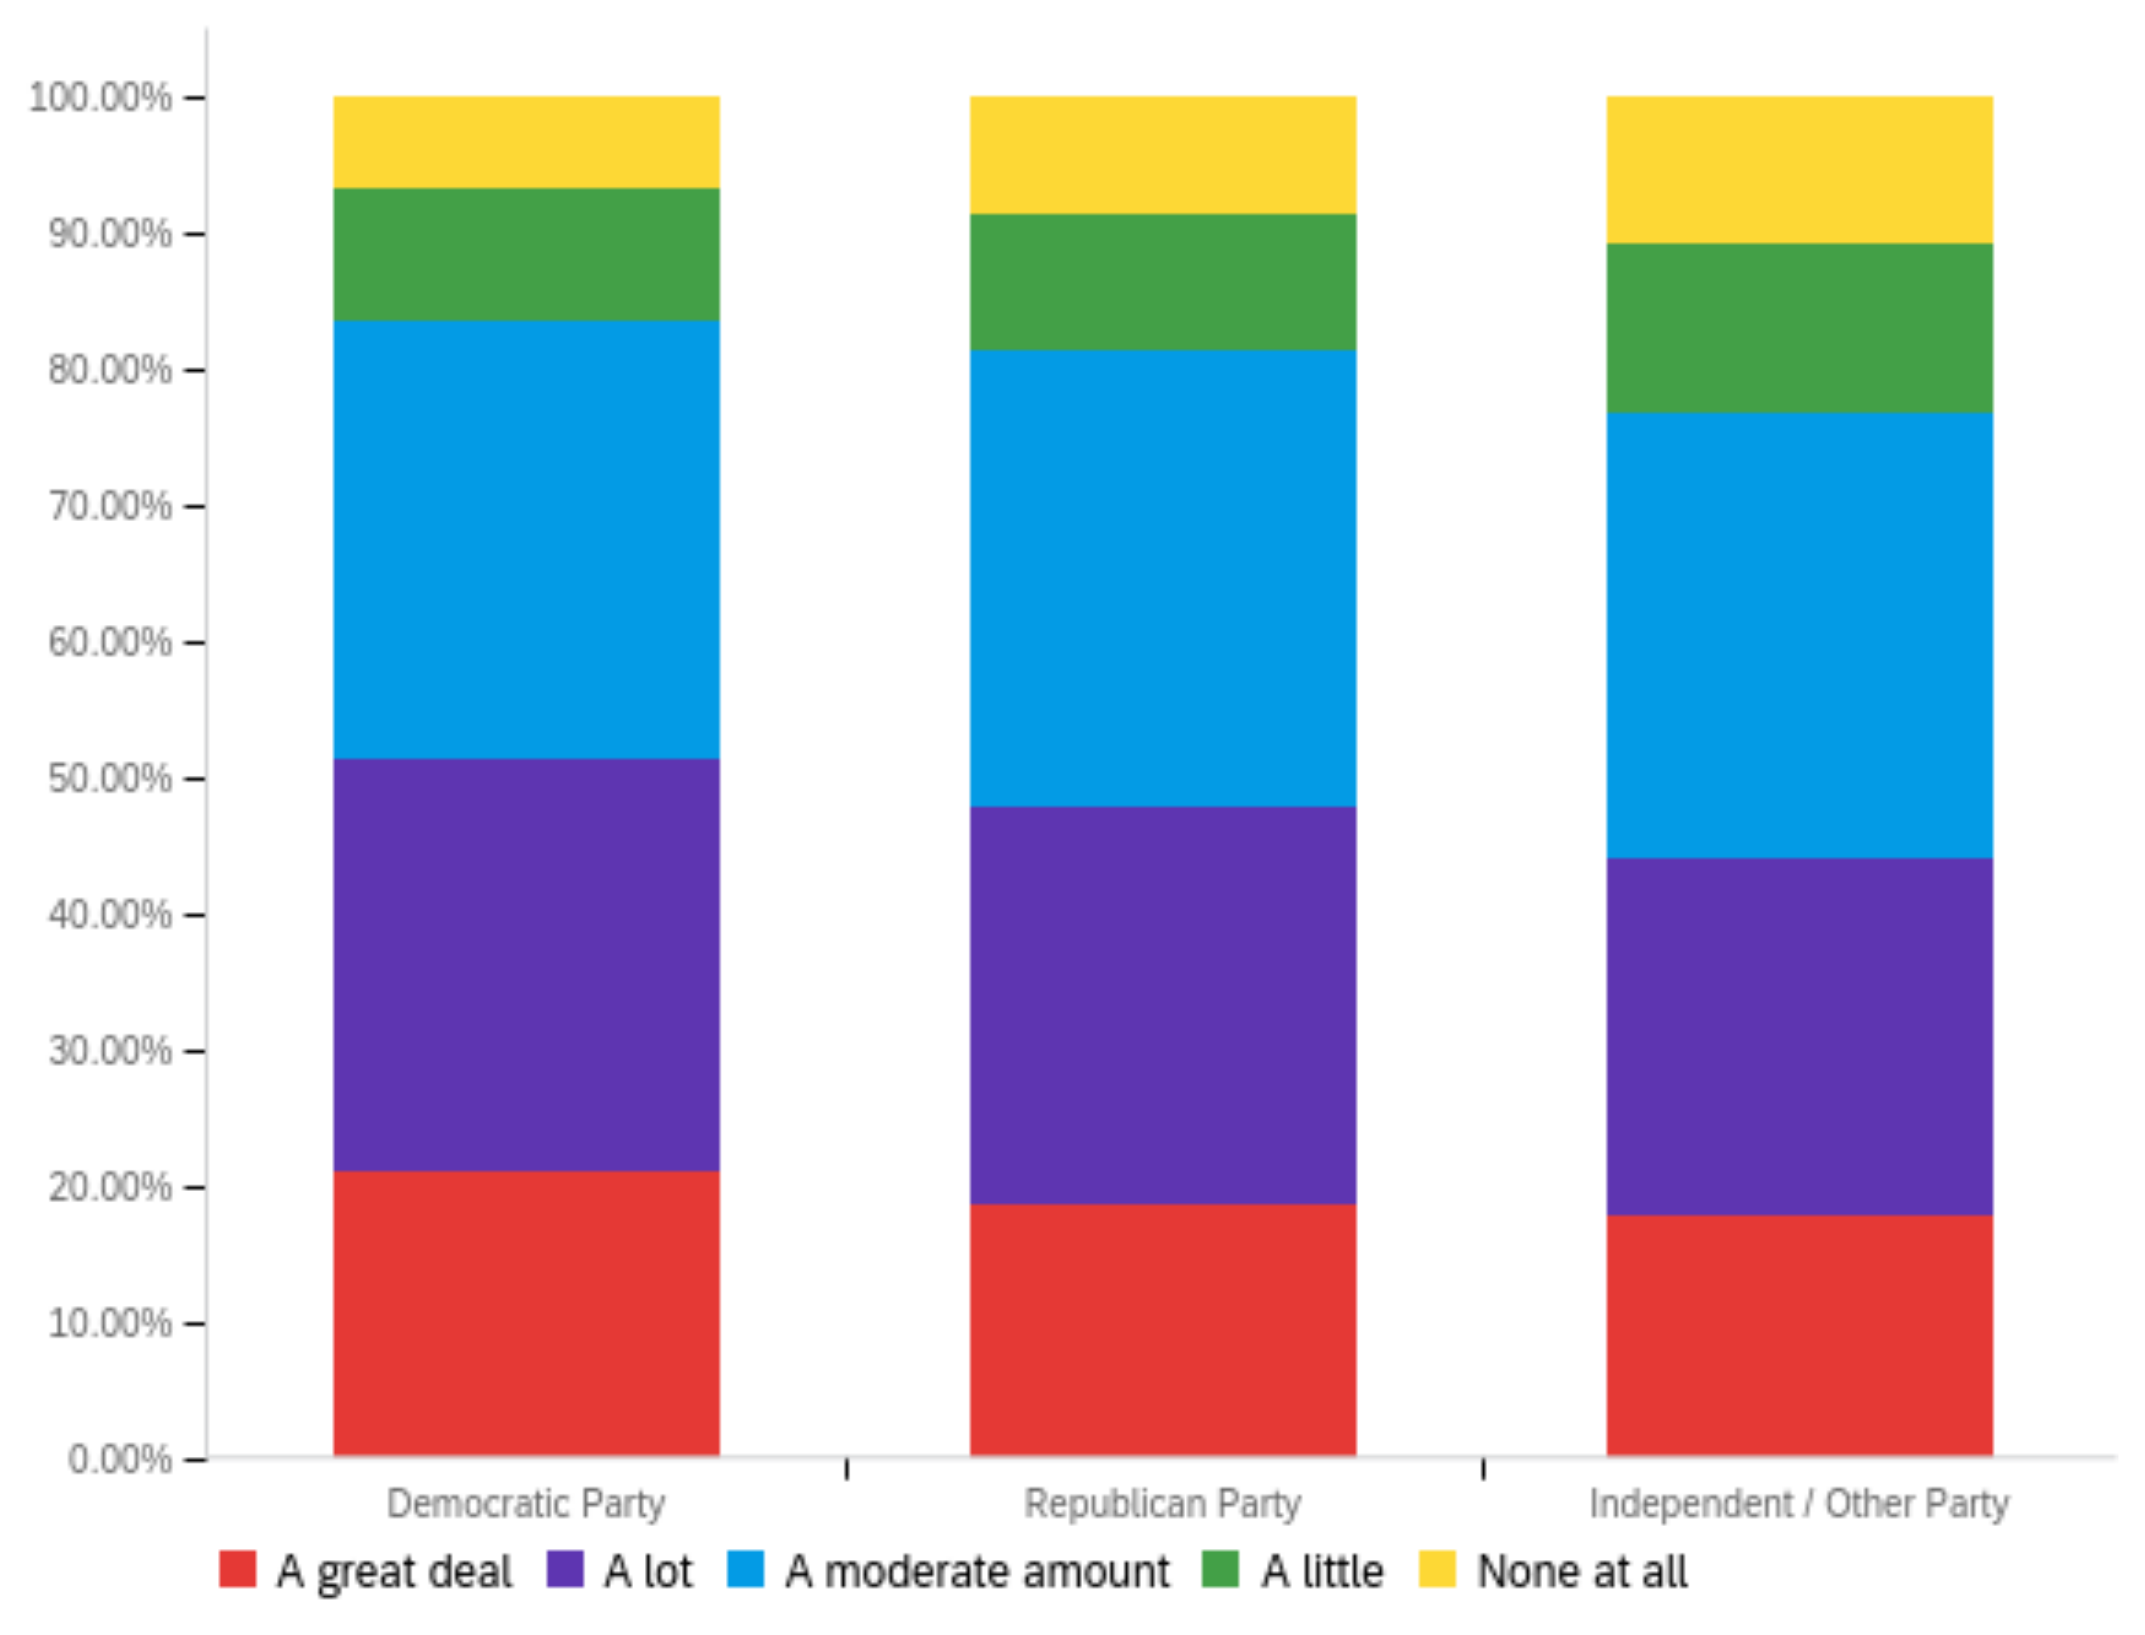
Futureinternet 14 00320 g0a29
Figure A30. Article virality—ideal perception impact by: (a) income level (top left), (b) political affiliation (top right) and (c) online usage (bottom).
Futureinternet 14 00320 g0a30aFutureinternet 14 00320 g0a30b
Figure A31. Article controversy level—personal perception impact by: (a) income level (top left), (b) political affiliation (top right) and (c) online usage (bottom).
Futureinternet 14 00320 g0a31
Figure A32. Article controversy level—others’ perception impact by: (a) income level (top left), (b) political affiliation (top right) and (c) online usage (bottom).
Futureinternet 14 00320 g0a32
Figure A33. Article controversy level—ideal perception impact by: (a) income level (top left), (b) political affiliation (top right) and (c) online usage (bottom).
Futureinternet 14 00320 g0a33aFutureinternet 14 00320 g0a33b
Figure A34. Article reading level—personal perception impact by: (a) income level (top left), (b) political affiliation (top right) and (c) online usage (bottom).
Futureinternet 14 00320 g0a34
Figure A35. Article reading level—others’ perception impact by: (a) income level (top left), (b) political affiliation (top right) and (c) online usage (bottom).
Futureinternet 14 00320 g0a35
Figure A36. Article reading level—ideal perception impact by: (a) income level (top left), (b) political affiliation (top right) and (c) online usage (bottom).
Futureinternet 14 00320 g0a36aFutureinternet 14 00320 g0a36b

References

  1. Grinberg, N.; Joseph, K.; Friedland, L.; Swire-Thompson, B.; Lazer, D. Fake news on Twitter during the 2016 U.S. presidential election. Science 2019, 363, 374–378. [Google Scholar] [CrossRef] [PubMed]
  2. Gillin, J. How Pizzagate Went from Fake News to a Real Problem for a D.C. Business; PolitiFact: Petersburg, FL, USA, 2016. [Google Scholar]
  3. Washington Post Staff Jan. 6 Insurrection: The Washington Post’s Investigation of the Causes, Cost and Aftermath. Available online: https://www.washingtonpost.com/politics/interactive/2021/jan-6-insurrection-capitol/ (accessed on 11 May 2022).
  4. Egelhofer, J.L.; Aaldering, L.; Eberl, J.M.; Galyga, S.; Lecheler, S. From Novelty to Normalization? How Journalists Use the Term “Fake News” in their Reporting. J. Stud. 2020, 21, 1323–1343. [Google Scholar] [CrossRef] [Green Version]
  5. Van der Linden, S.; Panagopoulos, C.; Roozenbeek, J. You are fake news: Political bias in perceptions of fake news. Media Cult. Soc. 2020, 42, 460–470. [Google Scholar] [CrossRef]
  6. Bastos, M.T.; Mercea, D. The Brexit Botnet and User-Generated Hyperpartisan News. Soc. Sci. Comput. Rev. 2017, 37, 38–54. [Google Scholar] [CrossRef] [Green Version]
  7. Greene, C.M.; Nash, R.A.; Murphy, G. Misremembering Brexit: Partisan bias and individual predictors of false memories for fake news stories among Brexit voters. Memory 2021, 29, 587–604. [Google Scholar] [CrossRef]
  8. Ecarma, C. Jair Bolsonaro Apparently Setting Up His Own Stolen-Election Conspiracy. Available online: https://www.vanityfair.com/news/2022/05/jair-bolsonaro-stolen-election-conspiracy (accessed on 11 May 2022).
  9. Khaldarova, I.; Pantti, M. Fake News: The narrative battle over the Ukrainian conflict. J. Pract. 2016, 10, 891–901. [Google Scholar] [CrossRef] [Green Version]
  10. Cunha, E.; Magno, G.; Caetano, J.; Teixeira, D.; Almeida, V. Fake News as We Feel It: Perception and Conceptualization of the Term “Fake News” in the Media. In Proceedings of the International Conference on Social Informatics, St. Petersburg, Russia, 25–28 September 2018; 11185 LNCS. Springer: Cham, Switzerland, 2018; pp. 151–166. [Google Scholar] [CrossRef] [Green Version]
  11. Lee, T. The global rise of “fake news” and the threat to democratic elections in the USA. Public Adm. Policy 2019, 22, 15–24. [Google Scholar] [CrossRef] [Green Version]
  12. Roth, E. Internet Backbone Provider Shuts Off Service in Russia. Available online: https://www.theverge.com/2022/3/5/22962822/internet-backbone-provider-cogent-shuts-off-service-russia (accessed on 11 May 2022).
  13. Stokel-Walker, C. How Russians Are Dealing with an Internet That’s Gone Dark. Available online: https://time.com/6156639/russia-internet-dissent/ (accessed on 11 May 2022).
  14. Bengani, P. A Platform and Publishers Timeline of the Russian Invasion of Ukraine. Available online: https://www.cjr.org/tow_center/a-platform-and-publishers-timeline-of-the-russian-invasion-of-ukraine.php (accessed on 11 May 2022).
  15. Silva, R.M.; Santos, R.L.S.; Almeida, T.A.; Pardo, T.A.S. Towards automatically filtering fake news in Portuguese. Expert Syst. Appl. 2020, 146, 113199. [Google Scholar] [CrossRef]
  16. Collins, B.; Hoang, D.T.; Nguyen, N.T.; Hwang, D. Trends in combating fake news on social media—A survey. J. Inf. Telecommun. 2020, 5, 247–266. [Google Scholar] [CrossRef]
  17. Griffiths, J. The Great Firewall of China: How to Build and Control an Alternative Version of the Internet, 2nd ed.; Zed Books: London, UK, 2021. [Google Scholar]
  18. Spradling, M.; Straub, J.; Strong, J. Protection from ‘Fake News’: The Need for Descriptive Factual Labeling for Online Content. Future Internet 2021, 13, 142. [Google Scholar] [CrossRef]
  19. Suttle, R.; Hogan, S.; Aumaugher, R.; Spradling, M.; Merrigan, Z.; Straub, J. University Community Members’ Perceptions of Labels for Online Media. Future Internet 2021, 13, 281. [Google Scholar] [CrossRef]
  20. Straub, J.; Spradling, M. Americans’ Perspectives on Online Media Warning Labels. Behav. Sci. 2022, 12, 59. [Google Scholar] [CrossRef]
  21. Straub, J.; Spradling, M.; Fedor, B. Assessment of Consumer Perception of Online Content Label Efficacy by Income Level, Party Affiliation and Online Use Levels. Information 2022, 13, 252. [Google Scholar] [CrossRef]
  22. Straub, J.; Spradling, M.; Fedor, B. Assessment of Factors Impacting the Perception of Online Content Trustworthiness by Age, Education and Gender. Societies 2022, 12, 61. [Google Scholar] [CrossRef]
  23. Golbeck, J.; Mauriello, M.; Auxier, B.; Bhanushali, K.H.; Bonk, C.; Bouzaghrane, M.A.; Buntain, C.; Chanduka, R.; Cheakalos, P.; Everett, J.B.; et al. Fake news vs. satire: A dataset and analysis. In Proceedings of the 10th ACM Conference on Web Science, Amsterdam, The Netherlands, 27–30 May 2018; pp. 17–21. [Google Scholar] [CrossRef]
  24. Keyes, R. The Post-Truth Era: Dishonesty and Deception in Contemporary Life; St. Martin’s Press: New York, NY, USA, 2004. [Google Scholar]
  25. McGaughey, E. Could Brexit be Void? King’s Law J. 2018, 29, 331–343. [Google Scholar] [CrossRef]
  26. Allcott, H.; Gentzkow, M. Social Media and Fake News in the 2016 Election. J. Econ. Perspect. 2017, 31, 211–236. [Google Scholar] [CrossRef] [Green Version]
  27. Bovet, A.; Makse, H.A. Influence of fake news in Twitter during the 2016 US presidential election. Nat. Commun. 2019, 10, 1657. [Google Scholar] [CrossRef] [Green Version]
  28. Allen, J.; Howland, B.; Mobius, M.; Rothschild, D.; Watts, D.J. Evaluating the fake news problem at the scale of the information ecosystem. Sci. Adv. 2020, 6, eaay3539. [Google Scholar] [CrossRef]
  29. Monsees, L. ‘A war against truth’—understanding the fake news controversy. Crit. Stud. Secur. 2020, 8, 116–129. [Google Scholar] [CrossRef]
  30. Tandoc, E.C. The facts of fake news: A research review. Sociol. Compass 2019, 13, e12724. [Google Scholar] [CrossRef]
  31. Loos, E.; Ivan, L.; Leu, D. “Save the Pacific Northwest tree octopus”: A hoax revisited. Or: How vulnerable are school children to fake news? Inf. Learn. Sci. 2018, 119, 514–528. [Google Scholar] [CrossRef]
  32. Shearer, E.; Matsa, K.E. News Use Across Social Media Platforms. 2018. Available online: https://www.pewresearch.org/journalism/2018/09/10/news-use-across-social-media-platforms-2018/ (accessed on 21 September 2021).
  33. Fatilua, J. Who trusts social media? Comput. Hum. Behav. 2018, 81, 303–315. [Google Scholar] [CrossRef]
  34. Wineburg, S.; McGrew, S. Why Students Can’t Google Their Way to the Truth. Available online: https://www.edweek.org/teaching-learning/opinion-why-students-cant-google-their-way-to-the-truth/2016/11 (accessed on 23 March 2022).
  35. Wineburg, S.; McGrew, S.; Breakstone, J.; Ortega, T. Evaluating Information: The Cornerstone of Civic Online Reasoning; Stanford Digital Repository: Stanford, CA, USA, 2016. [Google Scholar]
  36. Loos, E.; Nijenhuis, J. Consuming Fake News: A Matter of Age? The Perception of Political Fake News Stories in Facebook Ads. In Proceedings of the International Conference on Human-Computer Interaction, Online, 19–24 July 2020; 12209 LNCS. Springer: Cham, Switzerland, 2020; pp. 69–88. [Google Scholar] [CrossRef]
  37. Albright, J. Welcome to the Era of Fake News. Media Commun. 2017, 5, 87–89. [Google Scholar] [CrossRef]
  38. Lees, C. Fake news: The global silencer. Index Censorsh. 2018, 47, 88–91. [Google Scholar] [CrossRef]
  39. Zucker, H.A. Tackling Online Misinformation: A Critical Component of Effective Public Health Response in the 21st Century. Am. J. Public Health 2020, 110, S269. [Google Scholar] [CrossRef]
  40. Zhang, X.; Ghorbani, A.A. An overview of online fake news: Characterization, detection, and discussion. Inf. Process. Manag. 2020, 57, 102025. [Google Scholar] [CrossRef]
  41. Zhou, X.; Zafarani, R. A Survey of Fake News: Fundamental Theories, Detection Methods, and Opportunities. ACM Comput. Surv. 2020, 53, 109. [Google Scholar] [CrossRef]
  42. Budak, C.; Agrawal, D.; Abbadi, A. El Limiting the spread of misinformation in social networks. In Proceedings of the 20th International Conference on World Wide Web, Hyderabad, India, 28 March–1 April 2011; pp. 665–674. [Google Scholar] [CrossRef]
  43. Zhao, J.; Cao, N.; Wen, Z.; Song, Y.; Lin, Y.R.; Collins, C. #FluxFlow: Visual analysis of anomalous information spreading on social media. IEEE Trans. Vis. Comput. Graph. 2014, 20, 1773–1782. [Google Scholar] [CrossRef]
  44. Davis, C.A.; Varol, O.; Ferrara, E.; Flammini, A.; Menczer, F. BotOrNot: A System to Evaluate Social Bots. Available online: https://dl.acm.org/doi/abs/10.1145/2872518.2889302 (accessed on 29 January 2022).
  45. Wang, W.Y. “Liar, Liar Pants on Fire”: A New Benchmark Dataset for Fake News Detection. arXiv 2017, arXiv:1705.00648. [Google Scholar]
  46. Jain, S.; Sharma, V.; Kaushal, R. Towards automated real-time detection of misinformation on Twitter. In Proceedings of the 2016 International Conference on Advances in Computing, Communications and Informatics (ICACCI), Jaipur, India, 21–24 September 2016; pp. 2015–2020. [Google Scholar] [CrossRef]
  47. Yuan, H.; Zheng, J.; Ye, Q.; Qian, Y.; Zhang, Y. Improving fake news detection with domain-adversarial and graph-attention neural network. Decis. Support Syst. 2021, 151, 113633. [Google Scholar] [CrossRef]
  48. Deepak, S.; Chitturi, B. Deep neural approach to Fake-News identification. Procedia Comput. Sci. 2020, 167, 2236–2243. [Google Scholar] [CrossRef]
  49. De Oliveira, N.R.; Pisa, P.S.; Lopez, M.A.; de Medeiros, D.S.V.; Mattos, D.M.F. Identifying Fake News on Social Networks Based on Natural Language Processing: Trends and Challenges. Information 2021, 12, 38. [Google Scholar] [CrossRef]
  50. Koloski, B.; Stepišnik-Perdih, T.; Pollak, S.; Škrlj, B. Identification of COVID-19 Related Fake News via Neural Stacking. In Proceedings of the International Workshop on Combating Online Hostile Posts in Regional Languages during Emergency Situation, Virtual Event, 8 February 2021; 1402 CCIS. Springer: Cham, Switzerland, 2021; pp. 177–188. [Google Scholar] [CrossRef]
  51. Anoop, K.; Deepak, P.; Lajish, L.V. Emotion cognizance improves health fake news identification. In Proceedings of the 24th Symposium on International Database Engineering & Applications, Seoul, Korea, 12–14 August 2020; Association for Computing Machinery: New York, NY, USA, 2020. [Google Scholar]
  52. Shu, K.; Sliva, A.; Wang, S.; Tang, J.; Liu, H. Fake News Detection on Social Media: A Data Mining Perspective. ACM SIGKDD Explor. Newsl. 2017, 19, 22–36. [Google Scholar] [CrossRef]
  53. Batailler, C.; Brannon, S.M.; Teas, P.E.; Gawronski, B. A Signal Detection Approach to Understanding the Identification of Fake News. Perspect. Psychol. Sci. 2022, 17, 78–98. [Google Scholar] [CrossRef]
  54. Pröllochs, N. Community-Based Fact-Checking on Twitter’s Birdwatch Platform. arXiv 2021, arXiv:2104.07175. [Google Scholar] [CrossRef]
  55. Tandoc, E.C.; Lim, W.; Ling, R. Defining “Fake News” A typology of scholarly definitions. Digit. J. 2018, 6, 137–153. [Google Scholar] [CrossRef]
  56. Bakir, V.; McStay, A. Fake News and The Economy of Emotions. Digit. J. 2018, 6, 154–175. [Google Scholar] [CrossRef] [Green Version]
  57. Spradling, M.; Allison, M.; Tsogbadrakh, T.; Strong, J. Toward limiting social botnet effectiveness while detection is performed: A probabilistic approach. In Proceedings of the 2019 International Conference on Computational Science and Computational Intelligence (CSCI), Las Vegas, NV, USA, 5–7 December 2019; pp. 1388–1391. [Google Scholar] [CrossRef]
  58. Yadav, K.; Erdoğdu, U.; Siwakoti, S.; Shapiro, J.N.; Wanless, A. Countries have more than 100 laws on the books to combat misinformation. How well do they work? Bull. At. Sci. 2021, 77, 124–128. [Google Scholar] [CrossRef]
  59. Carson, A.; Fallon, L. Fighting Fake News: A Study of Online Misinformation Regulation in the Asia Pacific. Trobe Rep. 2021, 3, 124–128. [Google Scholar] [CrossRef]
  60. Haque, M.M.; Yousuf, M.; Alam, A.S.; Saha, P.; Ahmed, S.I.; Hassan, N. Combating Misinformation in Bangladesh. Proc. ACM Hum.-Comput. Interact. 2020, 4, 130. [Google Scholar] [CrossRef]
  61. U.S. Embassy Beijing New PRC Internet Regulation. Available online: https://irp.fas.org/world/china/netreg.htm (accessed on 28 February 2022).
  62. Diagne, A.; Finlay, A.; Gaye, S.; Gichunge, W.; Pretorius, C.; Schiffrin, A.; Cunliffe-Jones, P.; Onumah, C. Misinformation Policy in Sub-Saharan Africa; University of Westminster Press: London, UK, 2021; p. 224. [Google Scholar] [CrossRef]
  63. Motion Picture Association Inc.; National Association of Theatre Owners Inc. Classification and Rating Rules; Sherman Oaks: Los Angeles, CA, USA, 2020. [Google Scholar]
  64. WELCOME TO FilmRatings.com. Available online: https://www.filmratings.com/ (accessed on 1 February 2020).
  65. Federal Communications Commission. The V-Chip: Options to Restrict What Your Children Watch on TV. Available online: https://www.fcc.gov/consumers/guides/v-chip-putting-restrictions-what-your-children-watch (accessed on 1 February 2020).
  66. Harrington, R. Record Industry Unveils Lyrics Warning Label. Available online: https://www.washingtonpost.com/archive/lifestyle/1990/05/10/record-industry-unveils-lyrics-warning-label/6fc30515-ac8a-4e5d-9abd-a06a34cb54f2/ (accessed on 28 February 2022).
  67. U.S. Federal Bureau of Investigation FBI Anti-Piracy Warning Seal. Available online: https://www.fbi.gov/investigate/white-collar-crime/piracy-ip-theft/fbi-anti-piracy-warning-seal (accessed on 1 March 2022).
  68. US Food and Drug Administration Changes to the Nutrition Facts Label. Available online: https://www.fda.gov/food/food-labeling-nutrition/changes-nutrition-facts-label (accessed on 3 June 2020).
  69. FDA. FDA Proposes New Health Warnings for Cigarette Packs and Ads. Available online: https://web.archive.org/web/20220304155742/https://www.fda.gov/tobacco-products/labeling-and-warning-statements-tobacco-products/fda-proposes-new-health-warnings-cigarette-packs-and-ads (accessed on 2 February 2020).
  70. Fairbanks, J.; Fitch, N.; Knauf, N.; Briscoe, E. Credibility Assessment in the News: Do we need to read? In Proceedings of the MIS2 Workshop Held in Conjunction with 11th International Conference on Web Search and Data Mining, Los Angeles, CA, USA, 9 February 2018; ACM: Los Angeles, CA, USA, 2018. [Google Scholar]
Figure 1. Article author—personal perception impact by political affiliation.
Futureinternet 14 00320 g001
Figure 2. Article author—others’ perception impact by political affiliation.
Futureinternet 14 00320 g002
Figure 3. Article author—ideal perception impact by political affiliation.
Futureinternet 14 00320 g003
Figure 4. Article sponsor—personal perception impact by political affiliation.
Futureinternet 14 00320 g004
Figure 5. Article sponsor—others’ perception impact by political affiliation.
Futureinternet 14 00320 g005
Figure 6. Article sponsor—ideal perception impact by political affiliation.
Futureinternet 14 00320 g006
Figure 7. Article opinion statement quantity—personal perception impact by political affiliation.
Futureinternet 14 00320 g007
Figure 8. Article virality—others’ perception impact by political affiliation.
Futureinternet 14 00320 g008
Figure 9. Article controversy level—personal perception impact by political affiliation.
Futureinternet 14 00320 g009
Figure 10. Article controversy level—others’ perception impact by political affiliation.
Futureinternet 14 00320 g010
Figure 11. Article controversy level—ideal perception impact by political affiliation.
Futureinternet 14 00320 g011
Table 6. Respondents’ online usage time distribution.
1 h or LessBetween 1 and 3 hBetween 3 and 5 hMore Than 5 h
39%41%13%8%
2162287143
Table 7. Changes in usage levels of label categories as Internet usage and income levels increase.
Label CategoryAs Internet Usage IncreasesAs Income Increases
TitleUsage increases, except at highest internet usage level.Usage increases, up to the $75,000–99,999 range in the ideal. For self and others, spikes at $25,000–49,999 income level then flattens out.
PublisherUsage increases, except at highest internet usage level.Usage increases, up to the $75,000–99,999 range then flattens out.
Publication DateUsage increases for others and ideal, except at highest internet usage level.Relatively flat, but with decreasing magnitude of support as income increases except at the highest income level.
AuthorUsage increasesNo major patterns
SponsorUsage increasesNo major patterns
Author’s Political AlignmentUsage increases, except in self-perception.Usage increases, except in perception of the ideal. Drops in gravity of use at the $100,000–124,999 income level except in perception of the ideal.
Publisher’s Political AlignmentUsage increases, except at highest internet usage level.Usage increases, except in perception of the ideal. Drops in gravity of use at the $100,000–124,999 income level.
Sponsor’s Political AlignmentUsage increases, except in self-perception.Perceived usage by others increases. Drops in gravity of use at the $100,000–124,999 income level except in perception of the ideal.
Quantity of Opinion StatementsUsage increasesDrops in gravity of use at the $100,000–124,999 income level.
ViralityUsage increasesDrops in gravity of perceived use by others at the $100,000–124,999 income level.
Controversy LevelUsage increasesNo major patterns
Reading LevelUsage increasesNo major patterns
Table 8. Belief paradigms for each political party group, for each label category, based upon majority support for using the metric ‘a lot’ or ‘a great deal.’ Areas of agreement amongst political party groups are presented in bold in each row.
Label CategoryDemocratsRepublicansIndependent/Other
TitleEveryone else uses this, and I should.Only I use this, and I should not.Everyone else uses this, but they should not.
PublisherEveryone uses this, and we should.Everyone else uses this, but they should not.Everyone uses this, but we should not.
Publication DateOnly I use this, and everyone else should.No one uses this, and no one should.No one uses this, and no one should.
AuthorEveryone uses this, and we should.Everyone uses this, but we should not.Only I use this, and I should not.
SponsorEveryone uses this, and we should.No one uses this, and no one should.No one uses this, and no one should.
Author’s Political AlignmentEveryone uses this, but we should not.Everyone uses this, but we should not.Everyone else uses this, but they should not.
Publisher’s Political AlignmentEveryone uses this, but we should not.Everyone else uses this, but they should not.No one uses this, and no one should.
Sponsor’s Political AlignmentEveryone else uses this, and I should.No one uses this, and no one should.Everyone else uses this, but they should not.
Quantity of Opinion StatementsEveryone else uses this, and I should.Everyone uses this, but we should not.Everyone else uses this, but they should not.
ViralityEveryone else uses this, but they should not.Everyone uses this, but we should not.Everyone else uses this, but they should not.
Controversy LevelEveryone else uses this, but they should not.Everyone else uses this, but they should not.Everyone else uses this, but they should not.
Reading LevelOnly I use this, and I should not.No one uses this, and no one should.No one uses this, and no one should.
Publisher’s Note: MDPI stays neutral with regard to jurisdictional claims in published maps and institutional affiliations.