Article

Preference for Number of Friends in Online Social Networks

1
School of Systems Science and Engineering, Sun Yat-Sen University, Guangzhou 510006, China
2
School of Computer Science and Engineering, Sun Yat-Sen University, Guangzhou 510006, China
3
School of Journalism and Communication, Computational Communication Collaboratory, Nanjing University, Nanjing 210093, China
4
Department of Statistics and Data Science, College of Science, Southern University of Science and Technology, Shenzhen 518055, China
*
Author to whom correspondence should be addressed.
These authors contributed equally to this work.
Future Internet 2021, 13(9), 236; https://doi.org/10.3390/fi13090236
Submission received: 1 July 2021 / Revised: 11 September 2021 / Accepted: 13 September 2021 / Published: 16 September 2021
(This article belongs to the Section Techno-Social Smart Systems)

Abstract

:
Preferences or dislikes for specific numbers are ubiquitous in human society. In traditional Chinese culture, people show special preference for some numbers, such as 6, 8, 10, 100, 200, etc. By analyzing the data of 6.8 million users of Sina Weibo, one of the largest online social media platforms in China, we discover that users exhibit a distinct preference for the number 200, i.e., a significant fraction of users prefer to follow 200 friends. This number, which is very close to the Dunbar number that predicts the cognitive limit on the number of stable social relationships, motivates us to investigate how the preference for numbers in traditional Chinese culture is reflected on social media. We systematically portray users who prefer 200 friends and analyze their several important social features, including activity, popularity, attention tendency, regional distribution, economic level, and education level. We find that the activity and popularity of users with the preference for the number 200 are relatively lower than others. They are more inclined to follow popular users, and their social portraits change relatively slowly. Besides, users who have a stronger preference for the number 200 are more likely to be located in regions with underdeveloped economies and education. That indicates users with the preference for the number 200 are likely to be vulnerable groups in society and are easily affected by opinion leaders.

1. Introduction

Numbers play a prominent role in the daily life of human beings. Just as the motto of the Pythagorean school goes, all is number [1,2,3]. The Pythagoreans used numbers to describe the world, attempted to capture the essence of all existing things, and associated social meanings with the numbers. For example, they believed that odd numbers were masculine, even numbers were feminine [4], the number one stood for the origin of everything, and the number ten was the number of the universe [5]. This kind of mystical worship for numbers became Pythagorean numerology, which affected many aspects of people’s life in turn. Up to the present, similar numerology or number preference still widely exists in various cultures around the world [6,7,8,9]. For example, the number eight represents good fortune and wealth, while the number four represents bad fortune in China [10,11,12]. Similarly, in a few Christian countries, the number thirteen is seen as unlucky [13,14]. However, in Italy, thirteen is considered a lucky number. In modern society, the preference for numbers has a profound influence on people’s decision making, and it has been extensively studied in the field of consumer research [15,16,17,18,19,20,21,22,23,24].
With the rapid development of the Internet and the increasing popularity of intelligent terminals, global online social media represented by Facebook, Twitter, WeChat, Weibo, and TikTok have formed a new trans-national, trans-ethnic, and trans-cultural online community with more than billions of people [25,26,27,28,29]. These social media platforms play an indispensable role in daily life. A large amount of data on user interaction behavior provides a solid foundation for studying the online presentation of human behavior. Based on the data generated by social media, we can infer users’ characteristics [30,31] and design a more accurate recommendation system [32]. In addition, users’ social profiles can reflect their personality [33,34,35] and their preferences for different ways of information consumption [36]. In terms of specific applications, the data of user interaction on social media can be applied for event prediction [37,38], robot detection [39,40], and fake news detection [41]. Further, social media also provides us a large-scale data of network topology and information transmission trajectory. Thus, we can analyze the evolution of users’ attention [42] and discourse power in the network [43].
In this present research, we focus on the preference for numbers in the online social network Sina Weibo, especially the choice for the number of friends. We find that the distribution of users’ friend number has a very significant peak near 200. Weibo’s network structure formation mechanism is the same as that of Twitter. Users are free to decide who and how many to follow (i.e., friends). However, they cannot determine who follows themselves (i.e., followers) and the corresponding number. In this system, the numbers of users’ followers are usually heterogeneous [44,45]. In other words, most users often have a quite limited number of followers, while a minority of users have a large number of followers, such as social celebrities and entertainment stars. However, due to the limited time and attention of the users, they can only maintain effective social relationships with a certain number of friends. Therefore, the numbers of effective friends of the users are generally homogeneous [46], such as Dunbar number (150) [47]. In this paper, we mainly study users in Sina Weibo who have a particular preference for 200 friends and investigate their important social properties, such as activity, popularity, attention tendency, portraits evolution, regional difference, economic, and educational development level.

2. Related Work

Number preference is a phenomenon that exists in different countries, fields, and cultures. In [10], the authors studied price ending strategies in Asia and found that people prefer prices ending with eight in Asian cultures for four main reasons: luck, market norm, appeal, and value image. In [11], the authors analyzed superstitions and price clustering in the Taiwan Stock Exchange. Results showed the prevalence of price concentrates in the Chinese lucky number group (three, six, eight, and nine) rather than the unlucky number group (4 and 7). In [48], the authors analyzed companies listed on the Taiwan stock market. Results revealed that firms could gain return premiums on the stock market if their listing codes include lucky numbers. The authors in [12] studied the value of superstition in the number eight by using car plate auction data in Malaysia. They found that the number eight is considered lucky by ethnic Chinese people. The authors in [23] compared the effects of integers and non-integers on consumers’ evaluation and judgment of related target entities. Results revealed using non-round numbers would increase attention to numerical values. In [49], the authors used Nigerian lottery games to analyze players’ number preferences. They found that the two most popular numbers are one and nine, and players tried to avoid multiples of seven and numbers containing seven. The authors in [24] explored the degree to which voters can translate their ideological predispositions into numerical policy preferences and found that their ideological differences are reflected in numerical preferences.
With the rise of social media, people have become more and more involved in their current online life. A large amount of user behavior data has facilitated research in related fields. Based on social media user attributes, researchers focus on predicting user’s personalities and analyzing their online behavior characteristics. In [33], the authors proposed a machine learning approach to predict the user’s personality based on their social profile. The authors in [36] studied users’ attention economy in news consumption by analyzing users’ portraits. The authors in [30] identified the similarities and differences in personality characteristics of Internet and social media addiction profiles. In [34], the authors found extraversion is highly related to Facebook usage. Similarly, the authors in [35] found a positive relation between Big Five personality traits of user activity. In [42], the authors examined the effects of follower number and comment tone on judgments about opinion leaders. There are also some specific applications based on analyzing user attributes, such as optimizing recommendation system [32], modeling information dissemination [43,50], event detection [37,51], and bot detection [39,40]. However, for users with specific personalities offline, there are few studies about how their online portraits would be. As described before, most studies about number preferences were conducted in a certain field offline. To the best of our knowledge, nobody has verified whether this phenomenon exists on social media. Moreover, if it exists, what numbers will it be, and how would the attributes of users with these numbers preferences (e.g., social media usage, attention to opinion leaders, especially social activity, and extroversion) be? This paper will bridge the gap between research on number preferences and how it presents on social media.

3. Datasets and Methods

3.1. Datasets

As one of the most popular online social media platforms in China, Sina Weibo [52] plays an important role in spreading popular topics, entertainment gossip, and celebrity anecdotes. The collective behavior of users engaging in Sina Weibo makes it possible to study how traditional Chinese culture is reflected on social media. We collected users’ attribute information at three different times (see Table 1) on Weibo, and included users’ nickname, number of friends, number of followers, number of posts, gender, and city. In addition, we also collected data from China’s sixth census (conducted in 2011), including the level of economic development, population distribution, gender composition, age composition, urbanization, and education level of different regions.

3.2. Methods

Based on the data collected in 2012, Weibo users exhibit distinct preferences for the number 200 from both the national and regional levels. To verify whether this phenomenon is stable and long-standing, we randomly selected 68,655 users whose number of friends was less than 200 in 2012 and then analyzed their distribution of the number of friends in 2021. Meanwhile, to justify this phenomenon as normal human behaviors rather than caused by robots, we randomly selected 6620 users whose number of friends is near 200 and then analyzed their posts type (i.e., tweet or retweet). After confirming this phenomenon is stable and has research significance, we systematically compare the characteristics of users with and without 200 preferences from the static, dynamic, and regional levels. The following are the definitions of variables used in this paper, corresponding measurement and combination of using data:
Variables description and definition.
Here, we describe the variables used in this paper. The number of friends (i.e., k i ) of a user is how many users he/she follows. The number of followers (i.e., k o ) of a user is how many users follow him/her. The number of posts (i.e., m) is how many posts he/she has created since registration. The post content is the content generated by users. It may contain hyperlinks, hashtags, or mentions. According to whether it is an original post or not, the post content could be classified into two categories: tweet (post) or retweet (repost). The proportion of Original Posts is the percentage of tweets a user has tweeted since registration. In Section 4.2, we use m and k o to represent the user’s Activity and Popularity, respectively. The Follower Count of Friends is the number of followers a user’s friends have. Based on the friends list, we crawled the number of followers of each of his/her friends. It directly reflects the user’s Attention Tendency, especially the user’s preference on the popularity of their friends.
Measuring portraits evolution.
In Section 4.3, we explore the evolution of users’ portraits from 2012 to 2018. For each user, we define δ , the fluctuation of number of friends, followers or posts of him/her as:
δ = | X ( 2018 ) X ( 2012 ) | X ( 2012 )
where X(t) represents the number of friends, followers, or posts in year t. Then, we calculate the fraction of δ 5 % of two user groups (with and without the 200 preference). Similarly, we calculate the fraction of users whose locations remain unchanged.
Preference Intensity.
In Section 4.4, we study the preference intensity for number 200 in different regions. We define the preference intensity of number 200 as:
P I = p G 1 p G 2 , G 3 ,
where
p G 1 = k i = 200 202 p k i 3 ,
and
p G 2 , G 3 = k i = 193 199 p k i + k i = 203 209 p k i 14 .
Here p k i denotes the proportion of users whose number of friends is k i , 3, and 14 denote the number of different k i in the user groups with and without the preference for the number 200, respectively.
Linking user portraits to regional GDP and Education.
In Section 4.5, we study the correlations between preference intensity and regional characteristics (i.e., GDP and education). The location information (i.e., city) in user portraits can be used to identify which province he/she belongs to. The census data records each province’s information about GDP, education, gender/age composition, etc. We link province information to census data and get the corresponding region’s GDP and education information.

4. Results

We crawled 6,836,935 users’ attribute information of Sina Weibo using a random walk sampling method [53] in 2012. When calculating the distribution of the number of friends, we observe that there exists a very sharp peak at 200. In Figure 1a–j, we demonstrate this phenomenon in different provinces in detail. Meanwhile, Figure 1l indicates that there is a peak between 200 to 202. This phenomenon reveals users’ preference for the number 200.
To better analyze the statistical characteristics of the users with the preference of the number 200, we investigate the differences among various aspects of three user groups based on their number of friends: (i) Group 1, whose number of friends is 200, 201, or 202, which includes 48,960 users; (ii) Group 2, whose number of friends is between 193 and 199, which consists of 88,573 users; (iii) Group 3, whose number of friends is between 203 and 209, which includes 76,954 users. The number of friends for these three user groups is very close, which can exclude other factors’ impact on subsequent analysis as much as possible and reflect the characteristics of users with the preference for the number 200 better.

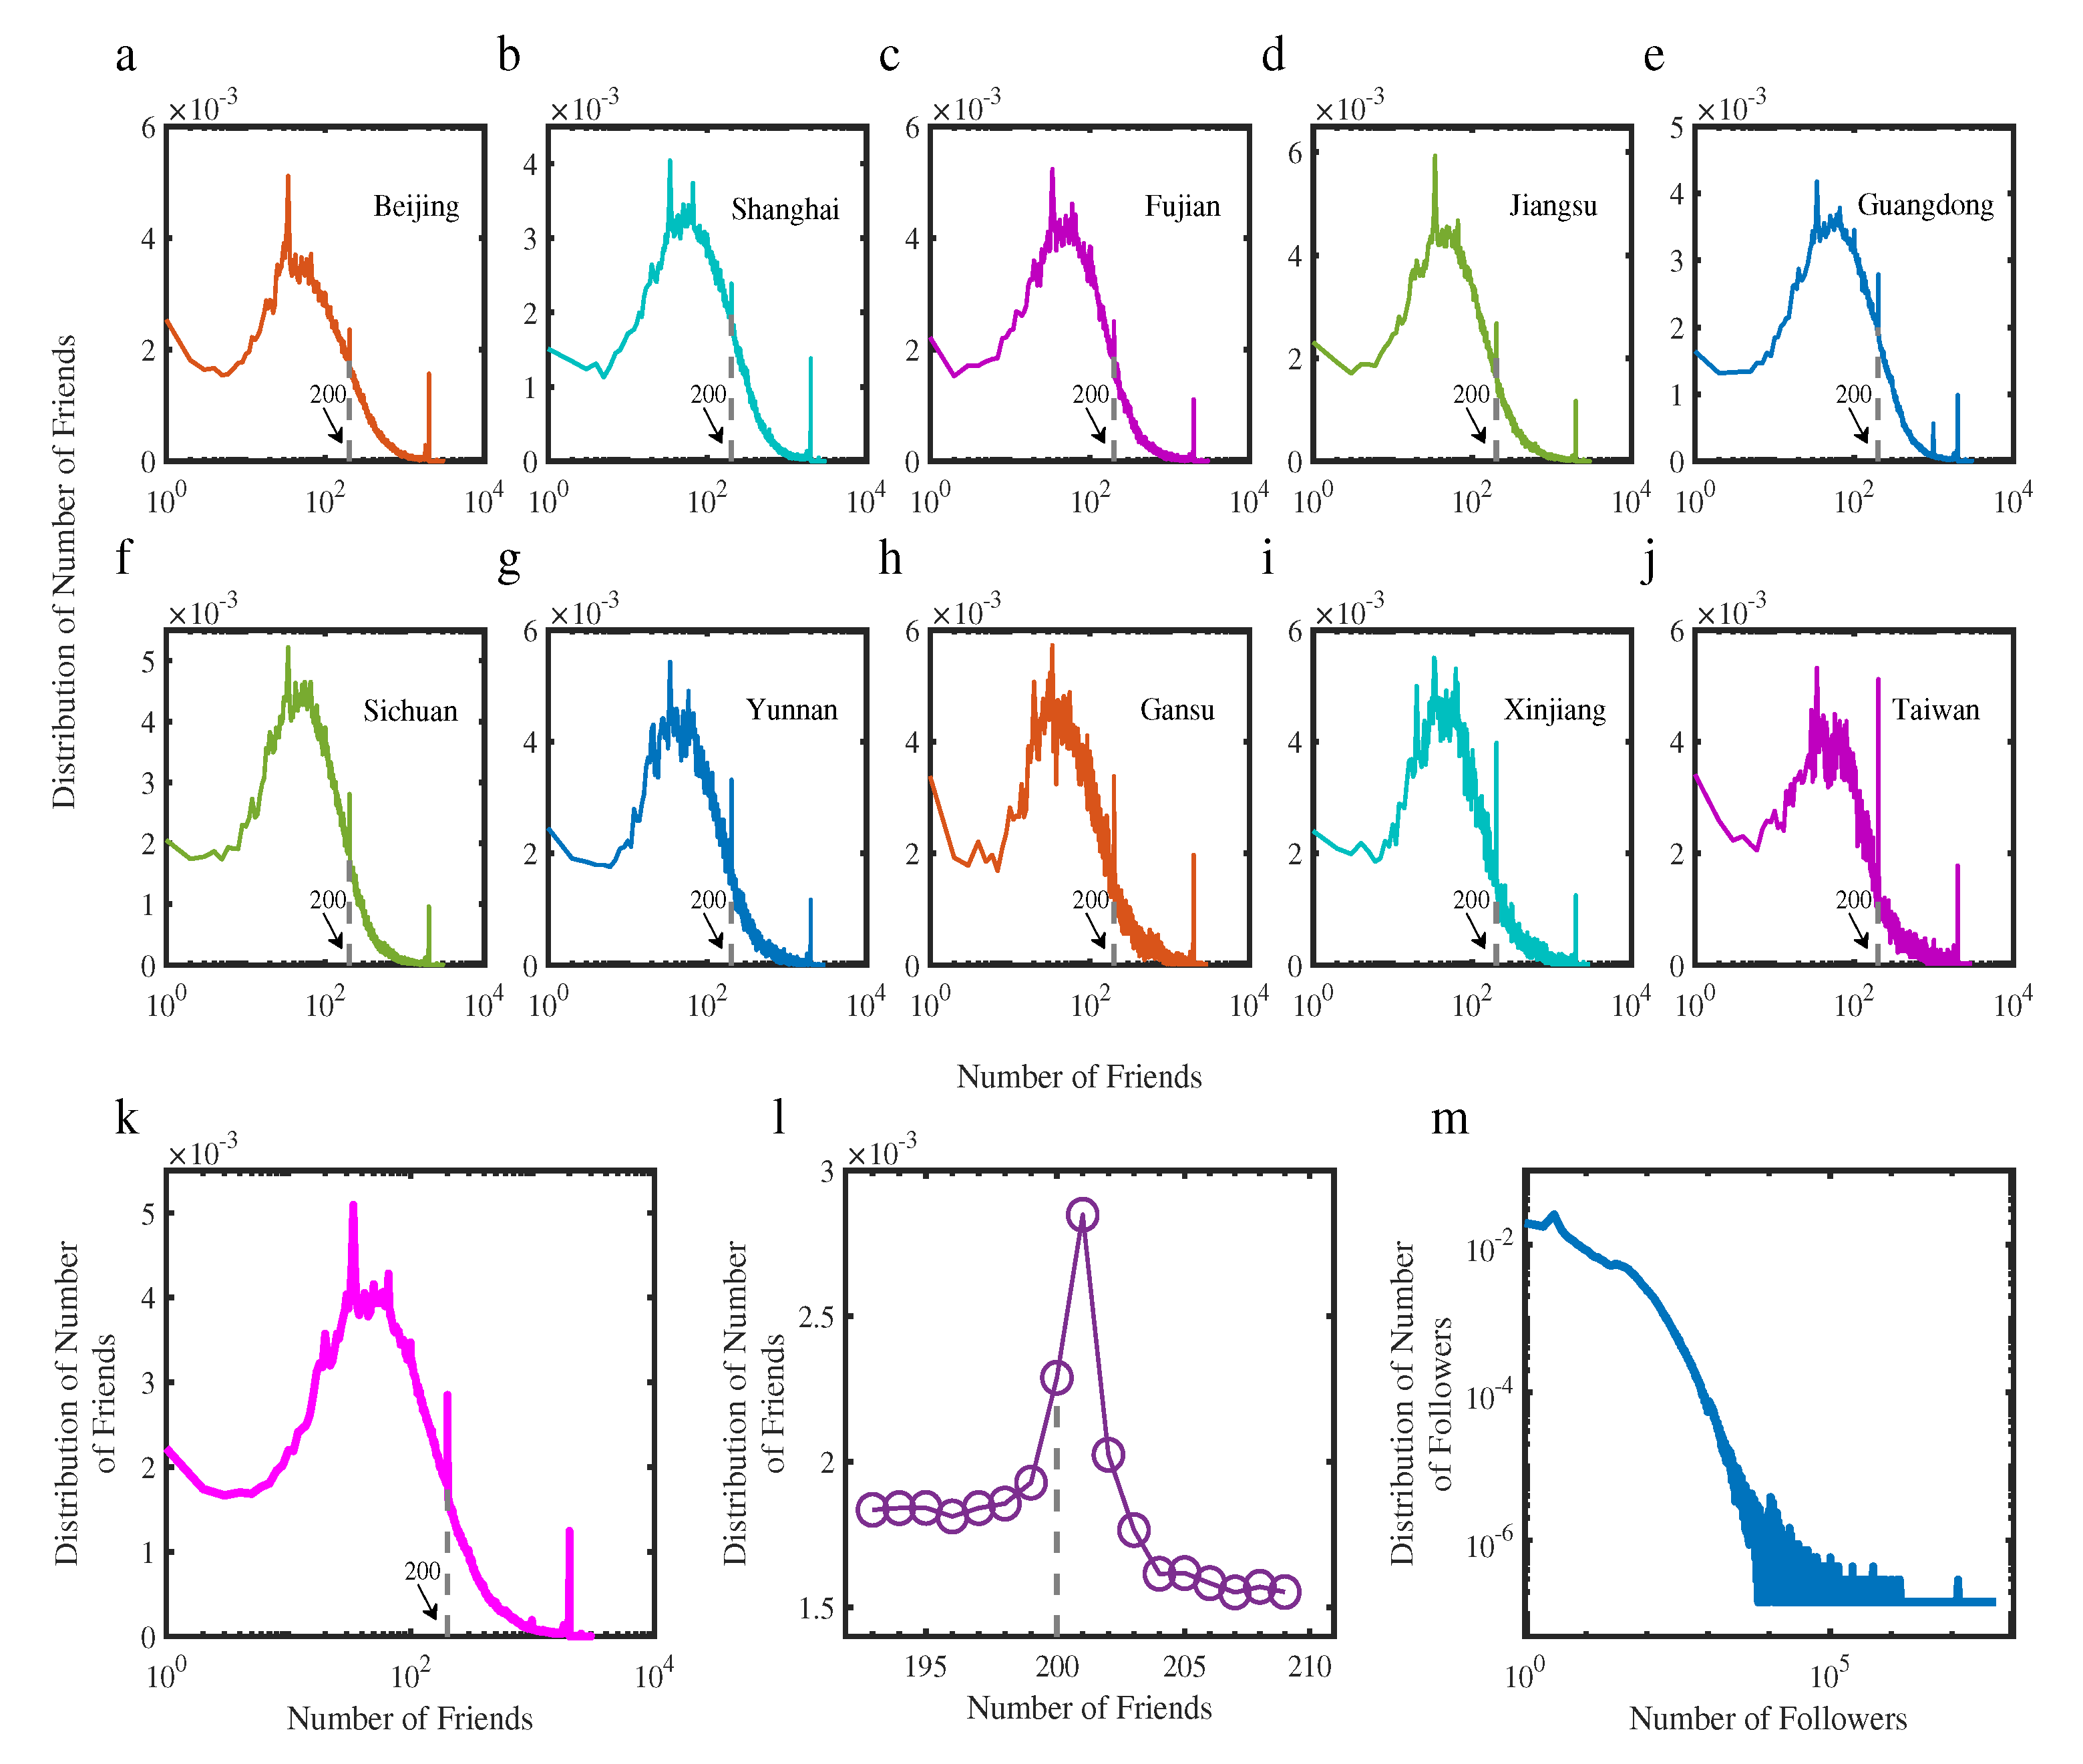
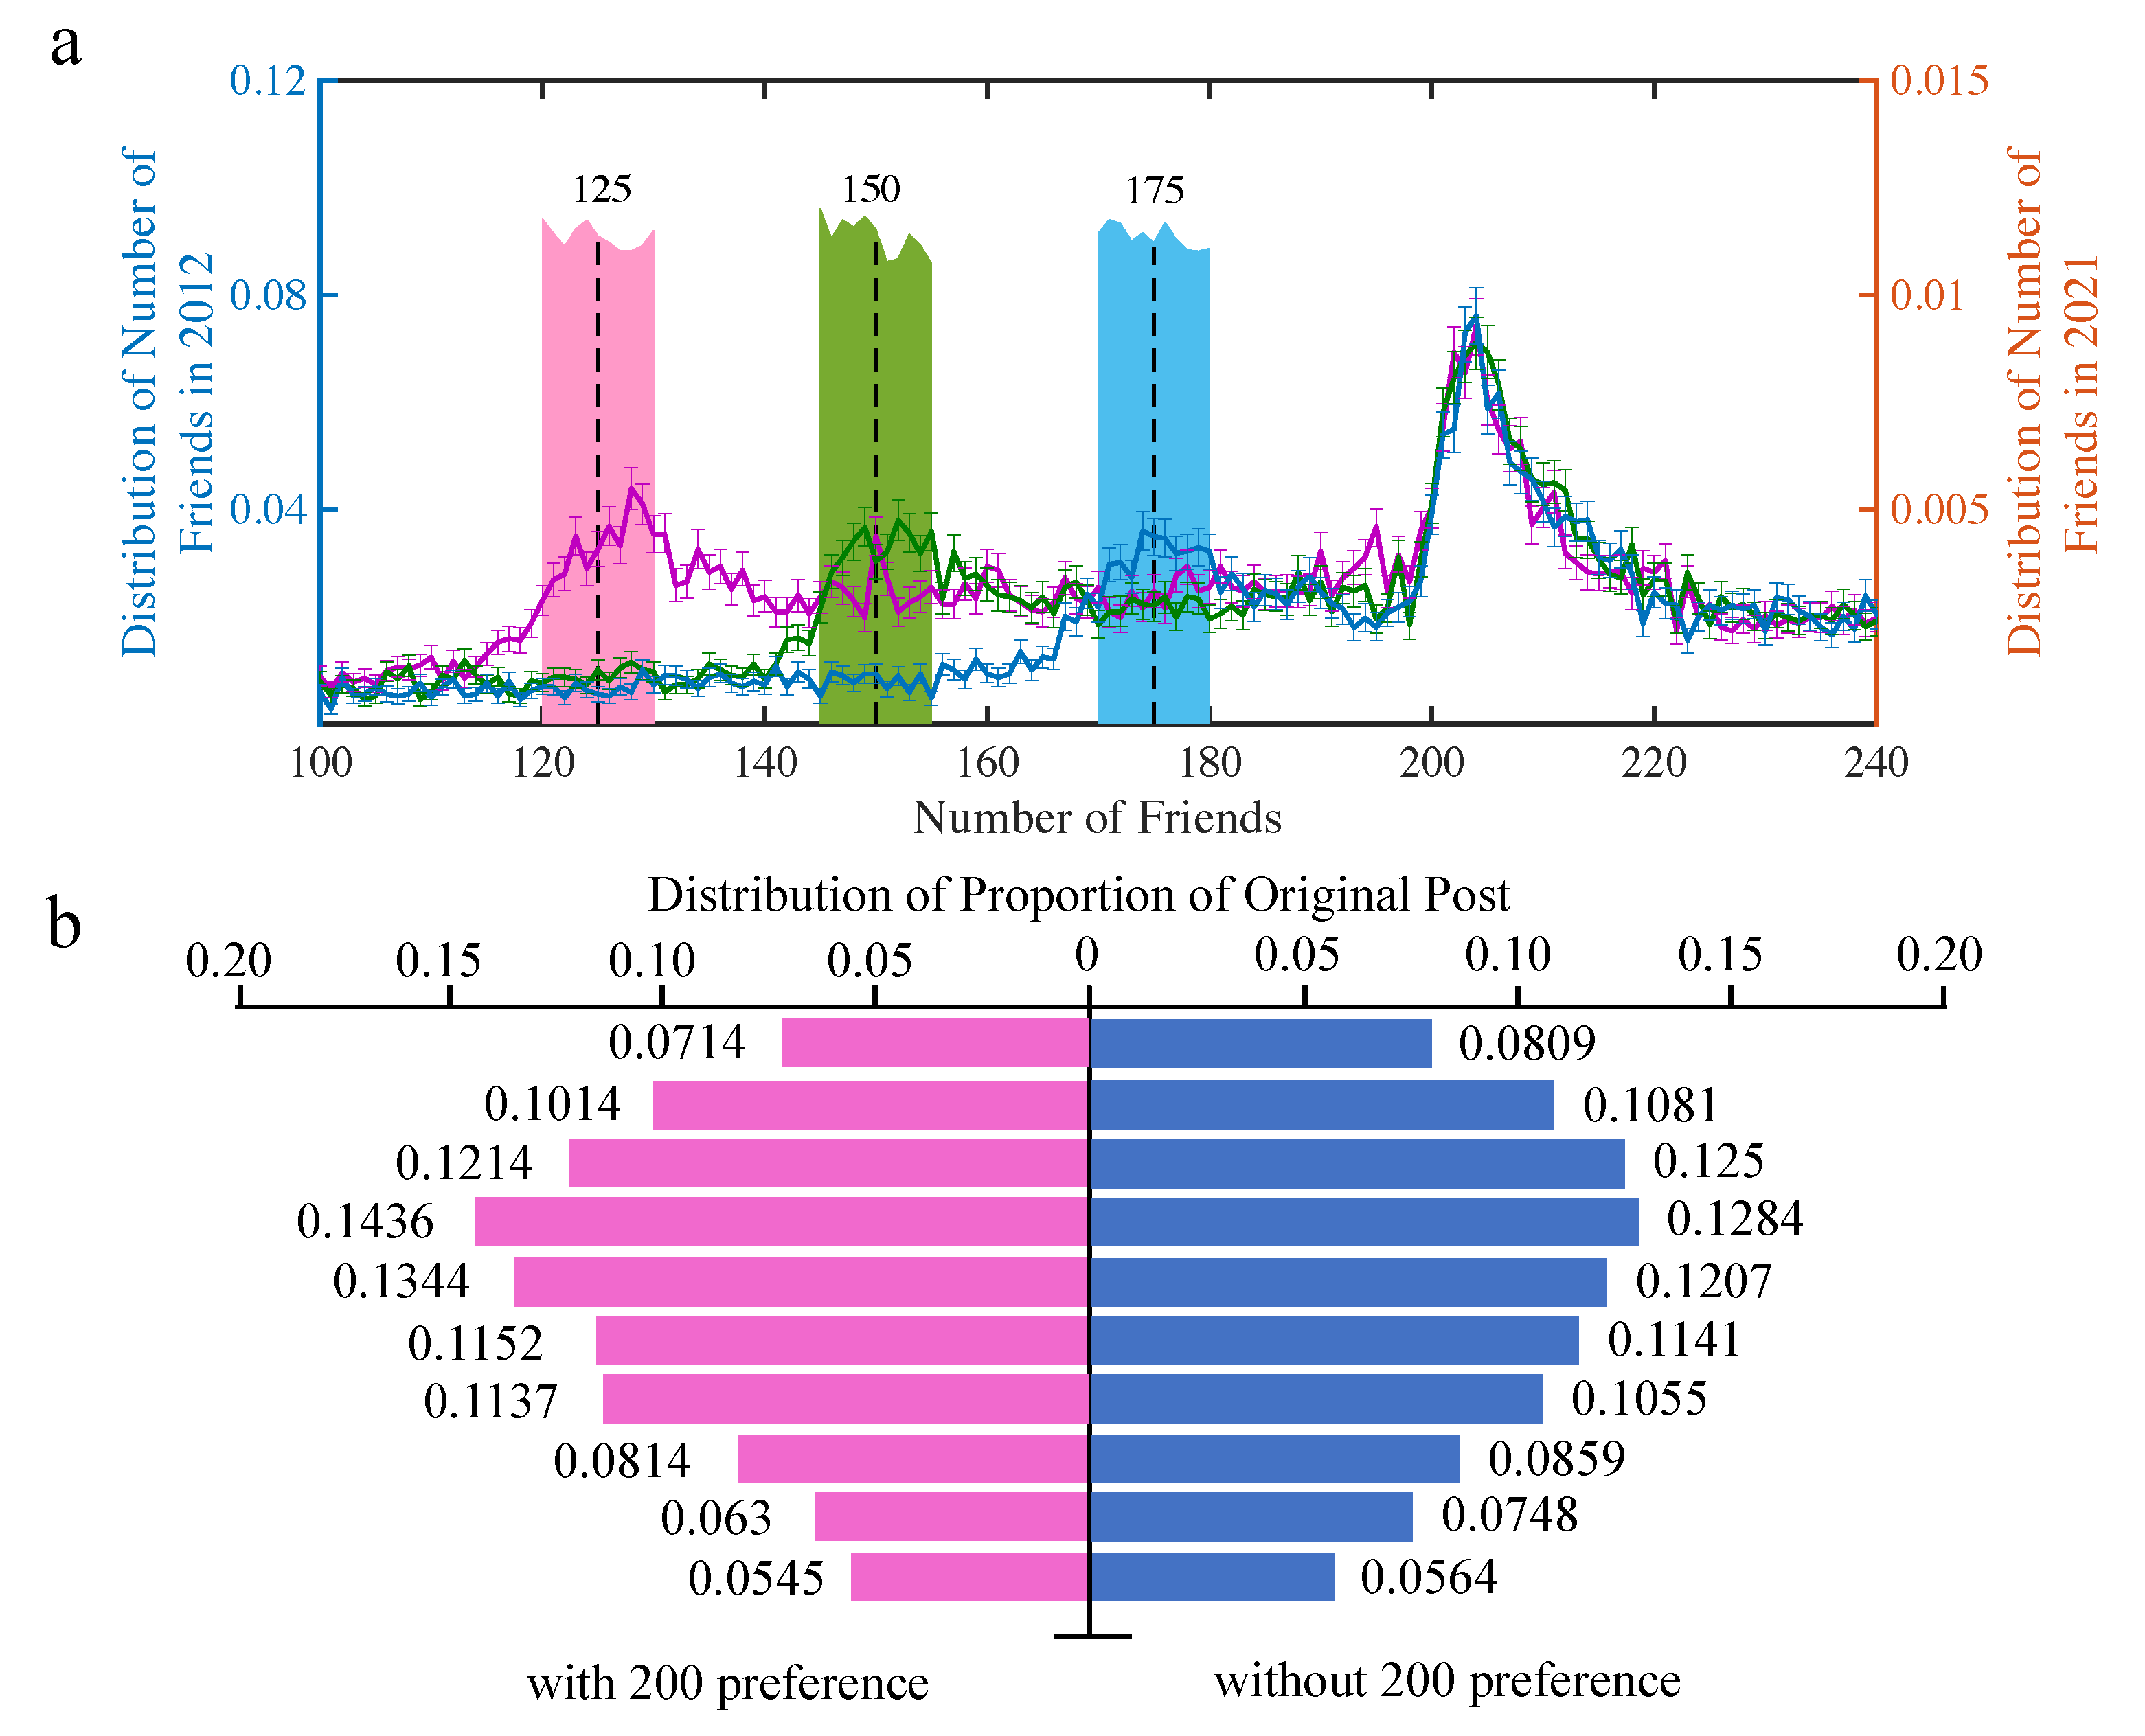
4.1. Evolution of the Number of Friends

In order to study the evolution of the distribution of the number of friends, we randomly selected 22,604, 22,936, and 23,115 users whose number of friends in 2012 was in the range between 120 and 130, 145 and 155, and 170 and 180, respectively, and then crawled their attribute information in 2021. In Figure 2a, the histogram and the corresponding solid line represent the distribution of the number of friends for these three user groups in 2012 and 2021, respectively. We can observe that the distribution of the number of friends in 2021 also has a peak at 200. Meanwhile, we used resampling methods (i.e., bootstrap and jackknife) [54] to estimate the bias. Here we used uniform sampling with a replacement method to investigate the effects of sampling bias. From Figure 2a, we can see that the discrepancies between resampled dataset and the original dataset are minimal in all corresponding solid lines. These results suggest that the sampling bias is not significant for verifying this is a stable phenomenon. That is to say, when a user’s number of friends evolved up to 200, the evolution speed will slow down. In other words, the number of friends of users will stay at 200 for a relatively long time. This phenomenon reflects from another aspect that the preference for 200 friends is not robots’ behavior.
Moreover, we randomly selected 1302 users with the preference of the number 200 and 5318 users without the preference of the number 200 in 2012. In 2018, we crawled all posts of these users published since registration and counted the proportions of the original posts for each user. Figure 2b shows the distribution of proportions of original posts, and we can see that the two distributions are almost the same. Specifically, there are 46.01% users with the preference for the number 200 whose proportion of the original post is more than half, which is similar with users without the preference for the number 200 (43.68%). That indicates the posting behavior of users with the preference for the number 200 is consistent with that of normal users. This further illustrates that the preference for number 200 is not robots’ behavior.

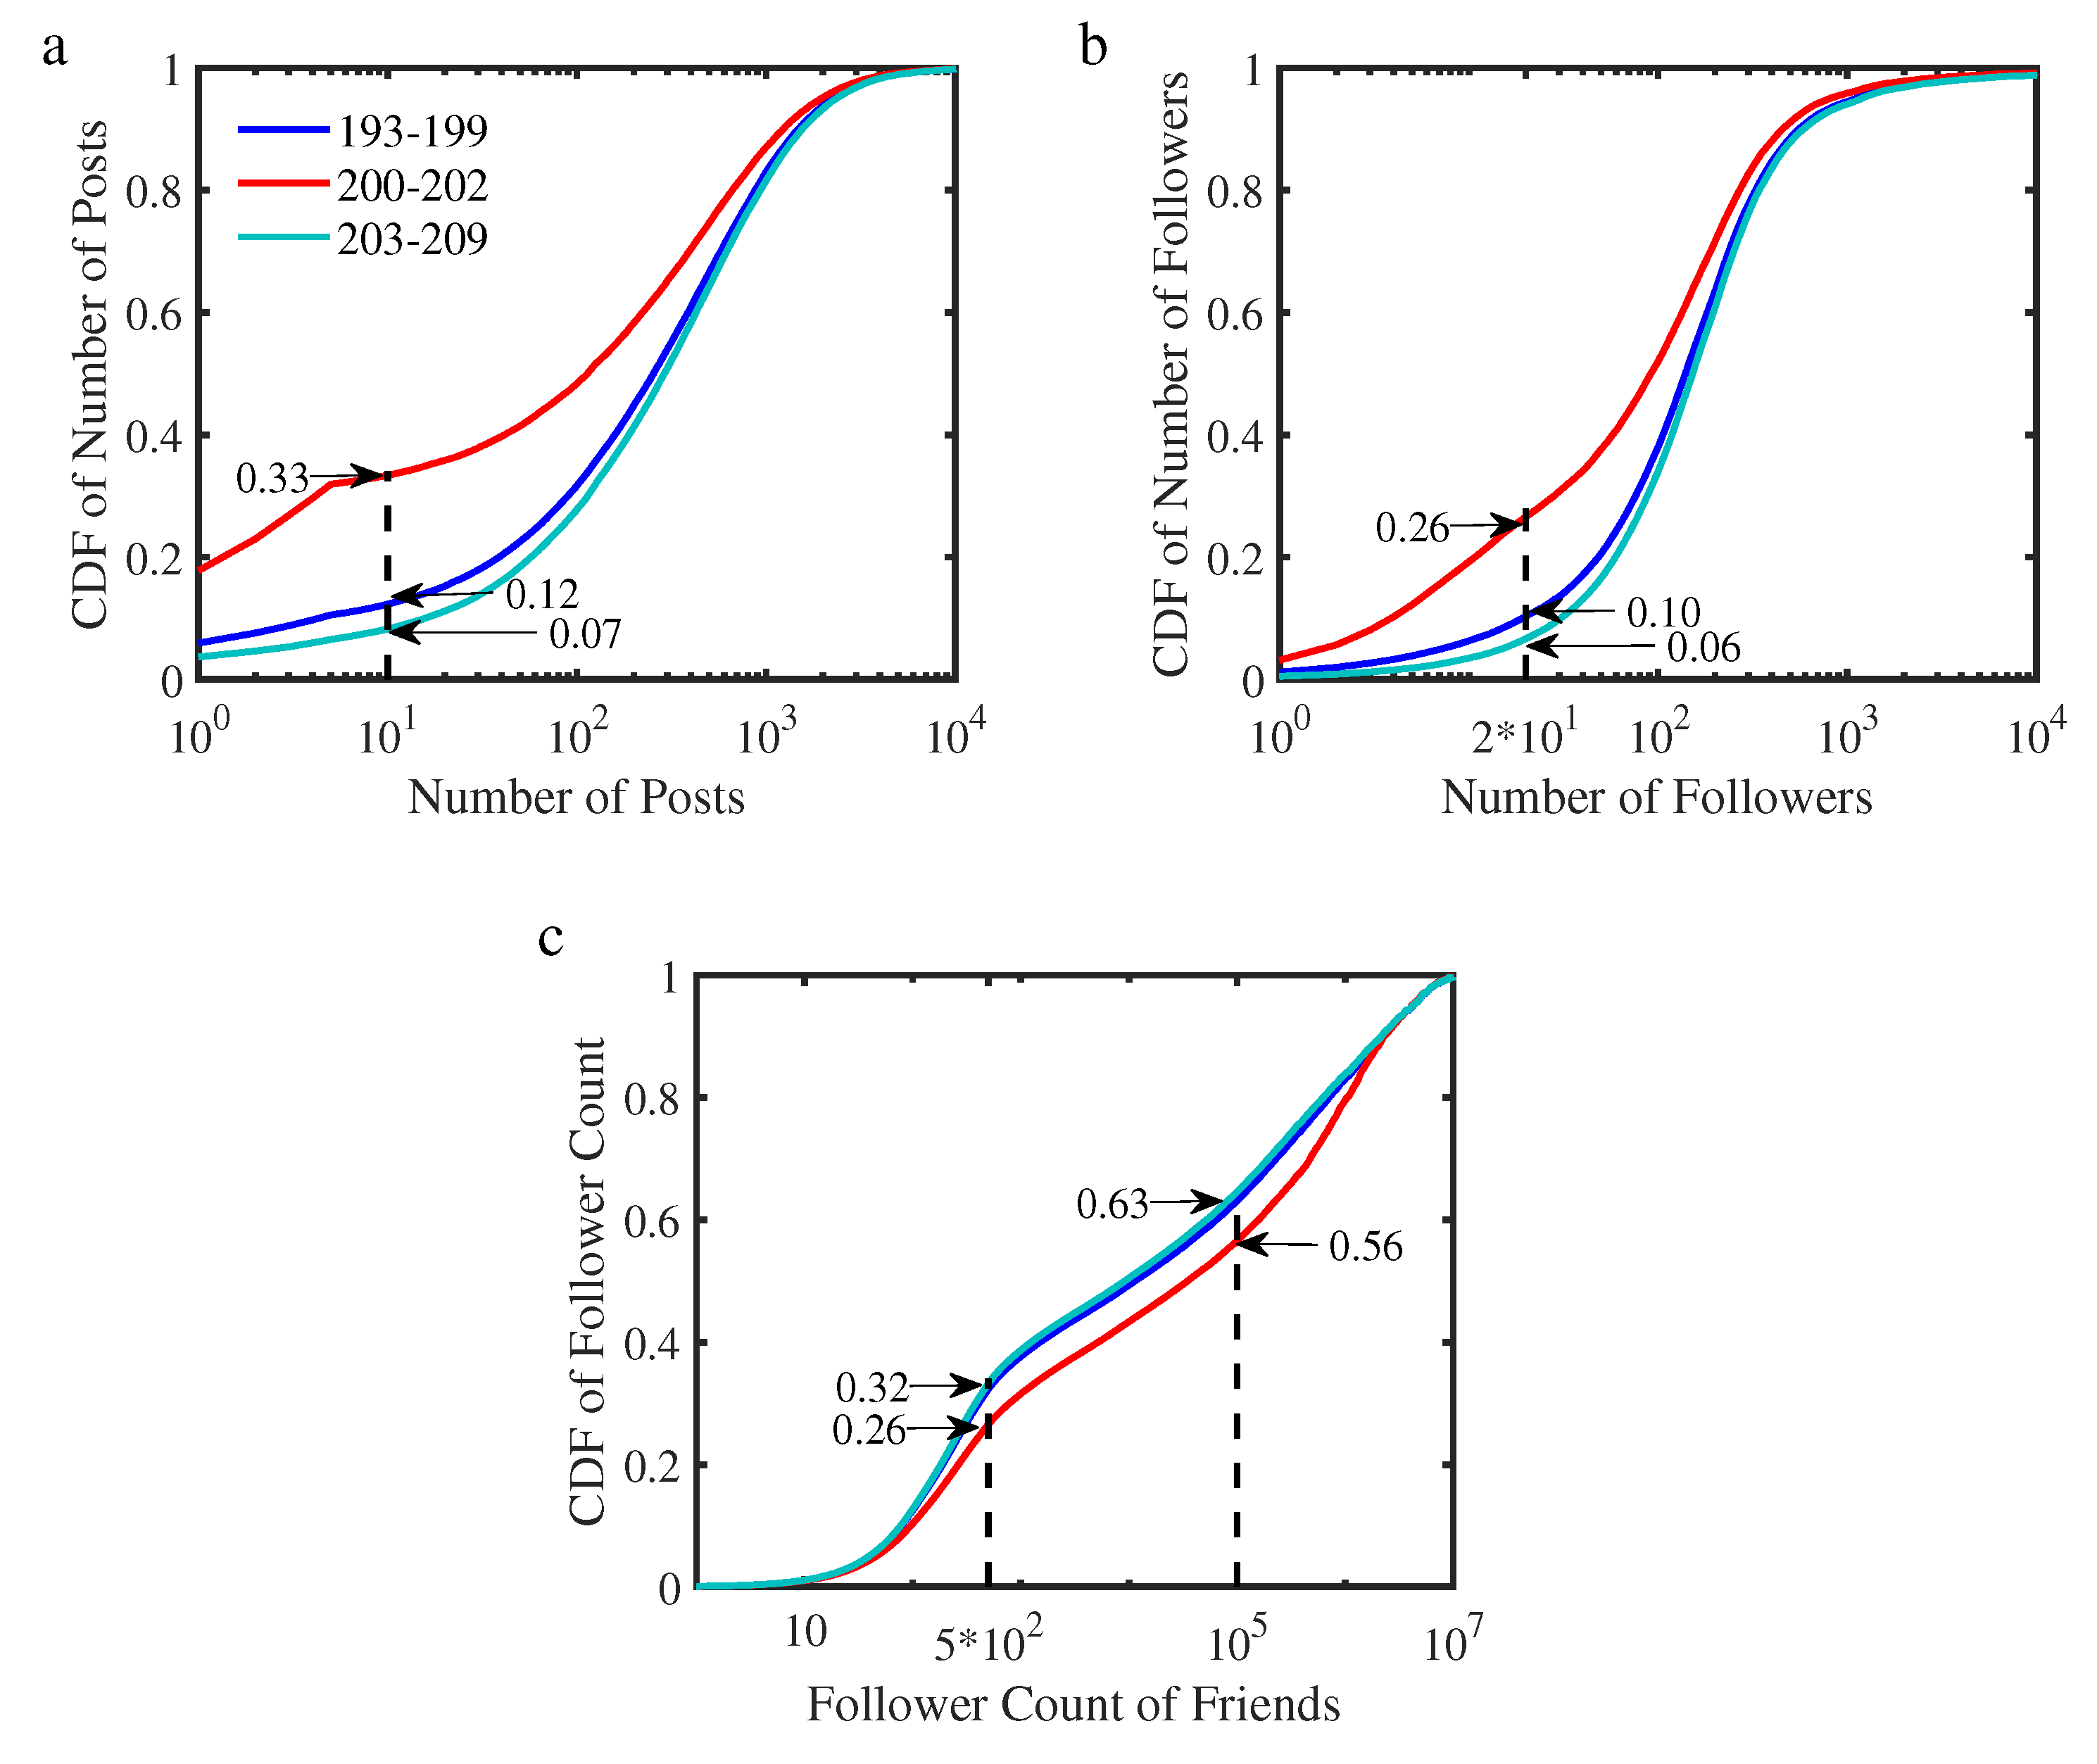
4.2. User Activity, Popularity, and Attention Tendency

We start by studying the activity, popularity, and attention tendency of users whose number of friends is 200, 201, and 202 (with the preference for the number 200). From Figure 3a,b, we can see that users with the preference for the number 200 have fewer posts and followers than users without the preference for the number 200, which means the former users are less active and popular. For instance, for the users with (without) the preference for the number 200, 33.12% (9.96%) of users posted less than 10 posts, and 26.11% (8.15%) of users have less than 20 followers. Moreover, the behavior of the two groups of users without the preference for the number 200 is almost the same.
Further, we analyzed the attention tendency (See Methods) of these users. Figure 3c shows users with a preference for the number 200 are, relatively, more inclined to follow popular users compared with users without the preference for the number 200. For instance, there are 43.42% of users with a preference for the number 200 would follow popular users (number of followers ≥ 100,000), while only 26.51% of them would follow normal users (number of followers ≤ 500). However, among users without the preference for the number 200, the corresponding percentages are 36.13% and 32.75%, respectively.

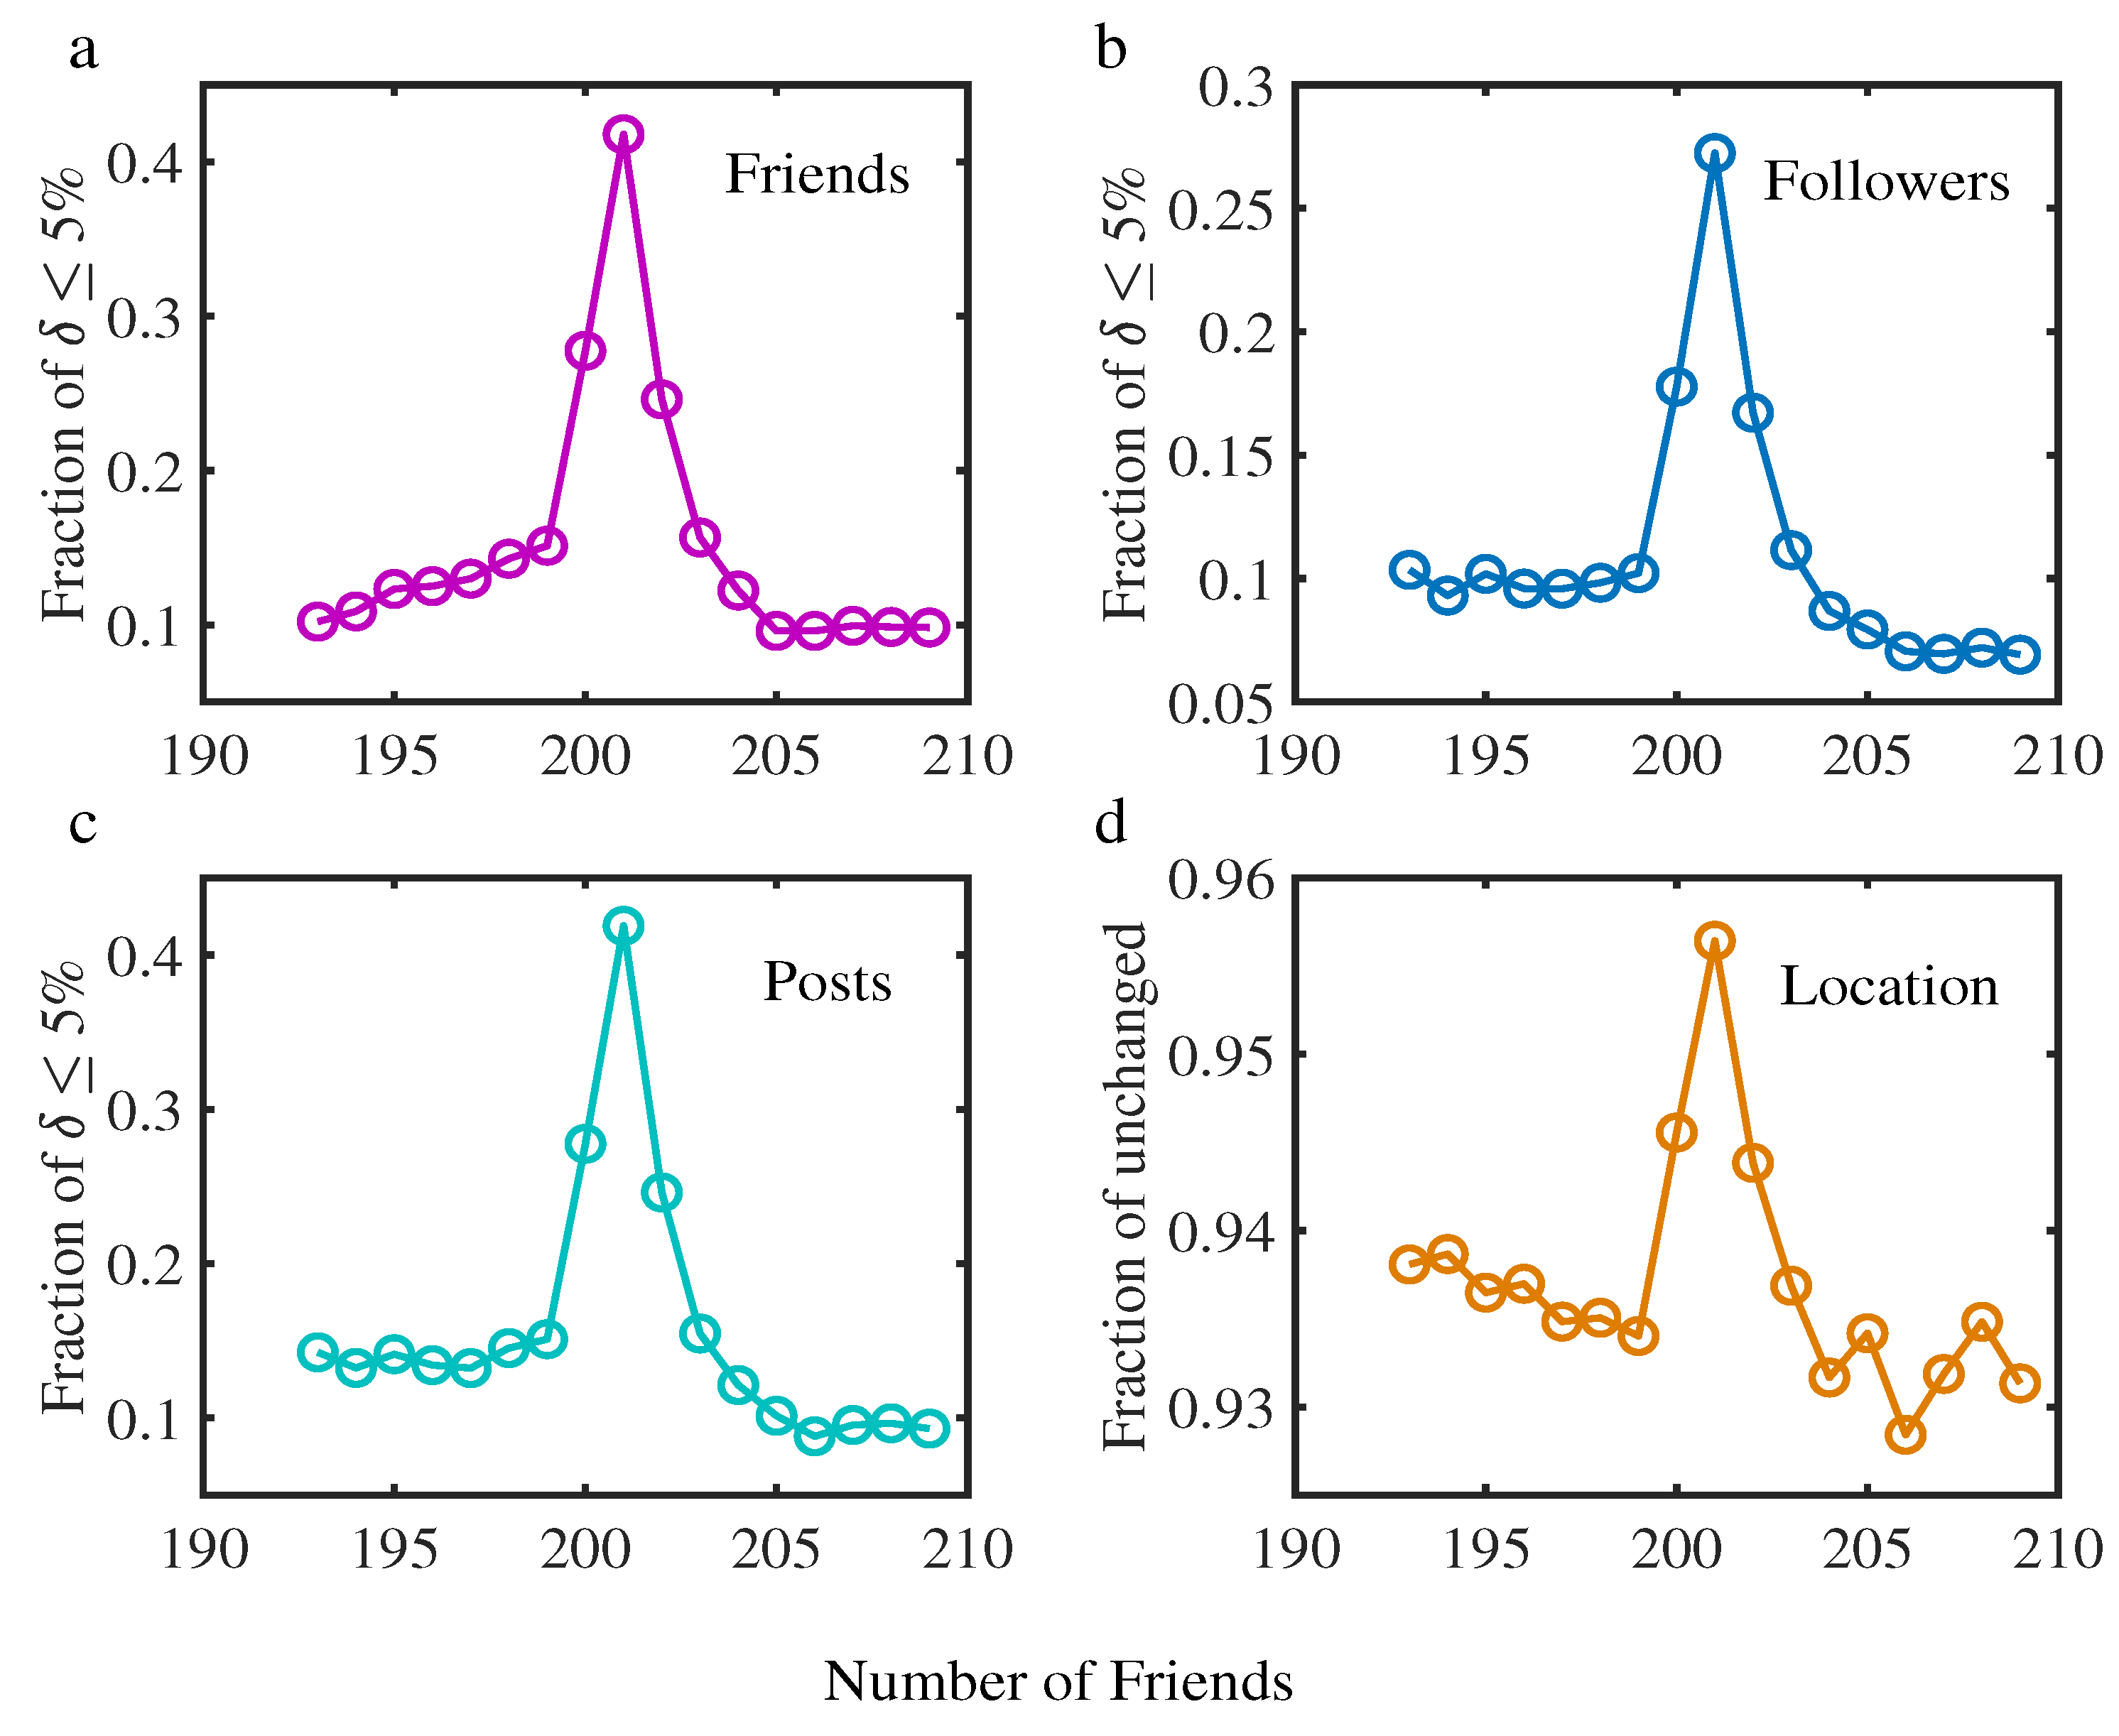
4.3. User Portrait Evolution

In order to further investigate the activity of users with the preference for the number 200, we next focus on the evolution of user’s portraits over time. In 2018, we have also collected the attribute information of users whose number of friends in 2012 was between 193 and 209. We obtained valid data consisting of 43,198 users with the preference for the number 200 and 146,404 users without the preference for the number 200.
For users whose number of friends was k in 2012, we count the proportion of the users whose number of friends, followers, and total posts are fluctuated within 5% by 2018, i.e., the corresponding number changes were less than 5% compared to 2012 (See Methods). From Figure 4a–c, we can see that, compared to users without the preference for the number 200, the changes of the number of friends, followers, and total posts are smaller in users with the preference for the number 200. For instance, in Figure 4a,c, only about 10% of users without the preference for the number 200 change less than 5%, while the corresponding proportions exceed 40% in users with the preference for the number 200. Similarly, we count the proportion of the users whose geographical position remains unchanged from 2012 to 2018, as Figure 4d shows. Although both these two kinds of users rarely changed during this period, the change of those users with the preference for the number 200 is even less.

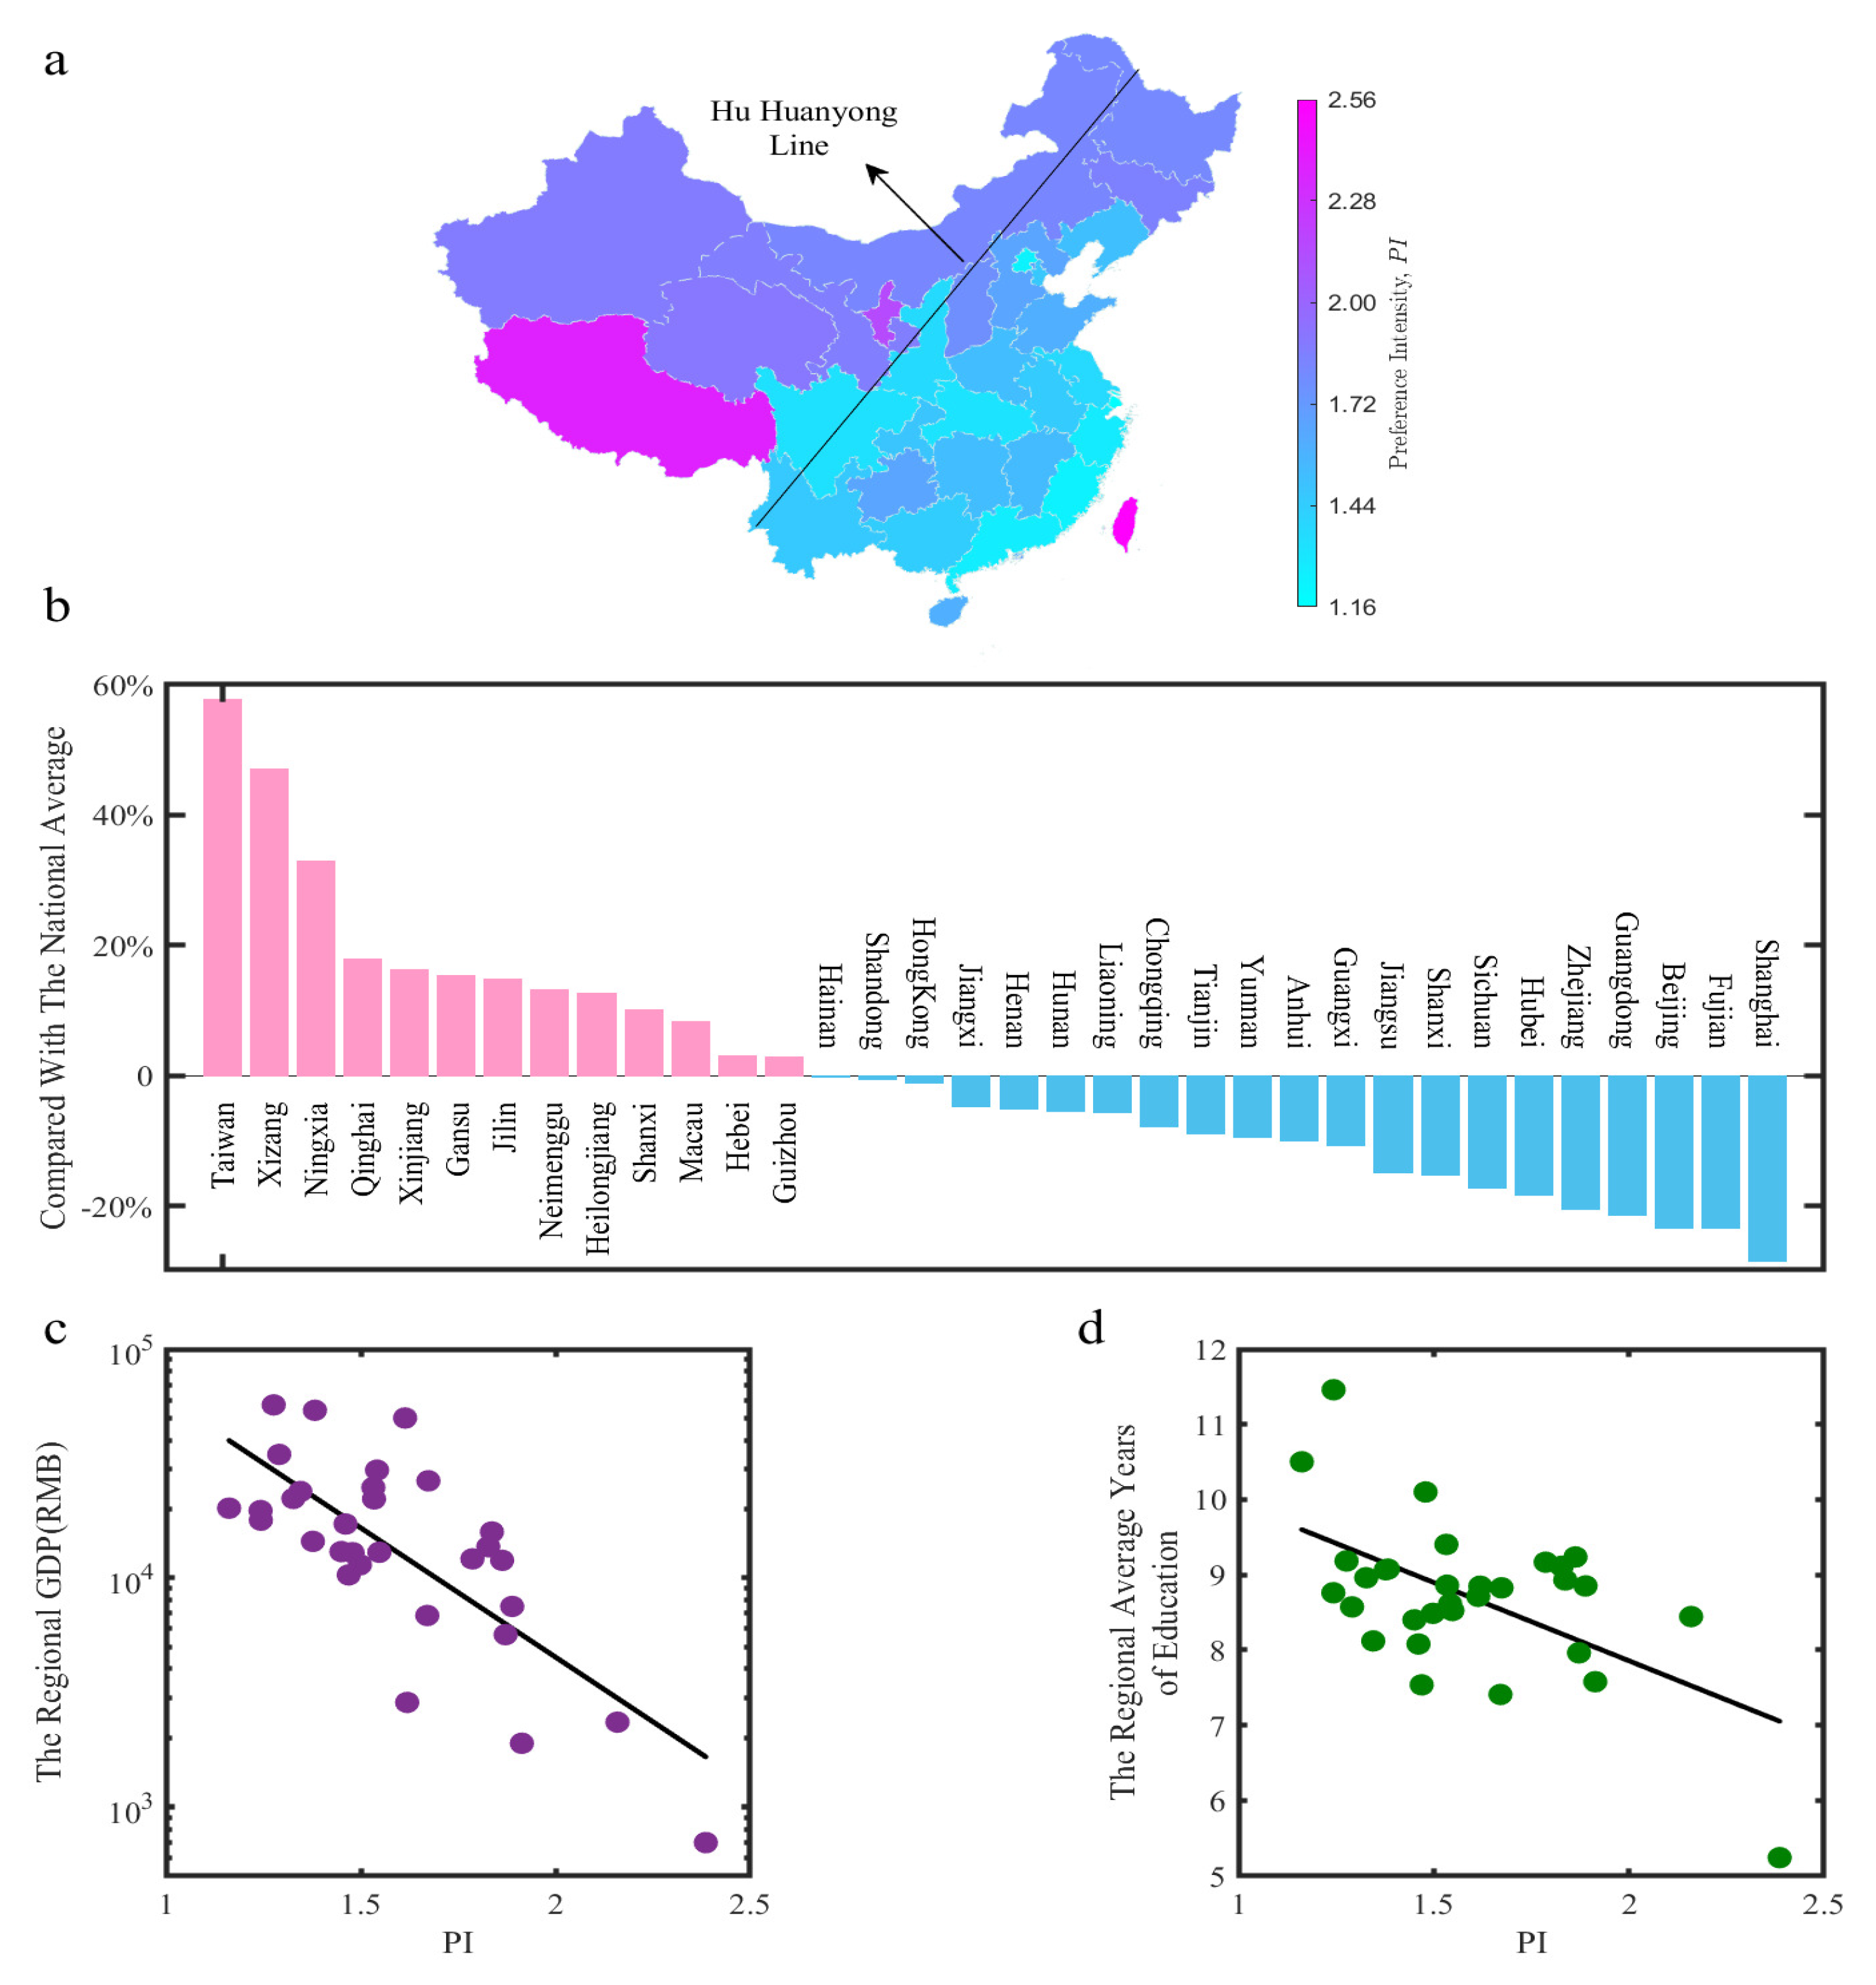
4.4. Regional Difference

Next, we discuss users’ preference intensity of the number 200 in different regions. As defined in Section 3.2, P I will be approximately equal to 1 if all users have no preference for the number 200, because there will be no peak at 200 in this case. Additionally, a higher value indicates a stronger preference. Figure 5a shows that the preference for the number 200 intensity in northwest China is much stronger than the one in southeast China, whose degree of difference can be separated well by Hu Line [55], a line dividing the population, urbanization level, and culture transformation. Moreover, the preference intensity of number 200 in Taiwan (2.56), Tibet (2.39), and Ningxia (2.16) is highest. While Shanghai (1.16), Beijing (1.24), and Guangdong (1.28) are relatively lower.
Further, we rank 34 regions’ preference intensity of number 200, as Figure 5b shows. We can see that the preference intensity in the northwest region (e.g., Tibet, Ningxia, Qinghai, Xinjiang, Gansu, etc.) is significantly higher than the national average, while the southeast region (e.g., Jiangsu, Zhejiang, Shanghai, Fujian, Guangdong, etc.) is far below the national average. For instance, Tibet and Ningxia are 47% and 33% higher than the national average, respectively, while Shanghai and Fujian are below 28% and 23%, respectively.

4.5. Economic and Educational Level

Figure 5a shows the 200 preference intensity roughly decreases from northwest to southeast China, which is consistent with the regional economic and educational level. That prompted us to further study their correlations. We collected relevant data from the official website of the National Bureau of Statistics [56], including the regional GDP of 31 provinces/municipalities in mainland China (without the data of Hong Kong, Macao, and Taiwan) and the average years of education in each province in the sixth population census in 2011.
Figure 5c,d exhibit the negative correlation between the economic level, the educational level, and the preference intensity of the number 200, which implies regions where the economic and educational levels are more undeveloped, the preference intensity for number 200 is more strong.

5. Conclusions

In this work, we studied 6.8 million Sina Weibo users systematically and found that a significant fraction of users have a special preference for number 200, i.e., they prefer to follow 200 friends. We comparatively portrayed users with the preference for the number 200 from several different perspectives, such as user activity, popularity, attention tendency, regional distribution, economic, and education level. The results show that users with a 200 preference have lower social activity and fewer followers compared with users without the preference for the number 200. We found that they are more inclined to pay attention to users with higher popularity, and their social portraits change relatively slowly. Moreover, we also found the preference intensity of number 200 is stronger in regions with relatively undeveloped economic and educational levels. Further analysis revealed that there exists a significant negative correlation between the preference intensity and the development of regions. That indicates users with the preference for the number 200 are likely to be vulnerable groups in society, and influenced by opinion leaders in the network.
We argue that people have a special preference for 200 friends for a few reasons. On the one hand, in traditional Chinese culture, people have a special preference for some numbers, such as 6, 8, 10, 100, 200, etc. On the other hand, due to the limits of brain capacity, people can only maintain effective social relationships with a certain number of friends. However, online social networks make information exchange among people more convenient than ever, which is the most likely reason why the number of friends is a little higher than the Dunbar number (150) [47] in online social networks.

6. Discussion

This paper systematically studied the phenomenon of number preferences on one of China’s most popular online social media. Nevertheless, two questions need to be seriously considered when evaluating its universality around the world. Firstly, whether there is a similar phenomenon of number preference on other social networks. Secondly, if so, whether the exact number is still 200 or another number that depends on its cultural background. Yet, it is difficult to verify the above two questions. Affected by the Facebook-Cambridge Analytica data breach [57,58], the world’s mainstream social media, such as Twitter, Facebook, and WeChat have strengthened user privacy protection through the restricted APIs and anti-crawler mechanism [59]. It is now almost impossible to collect large amounts of user data in a short time. Besides, collecting and using data correctly is another issue that cannot be ignored [60].
However, verifying its universality will be still possible in the future. On the one hand, suppose other social media re-open their previous APIs to access more user data, or researchers collaborate with the social media to get the required data. In that case, it will be possible to examine this phenomenon on different social network platforms in China and beyond. On the other hand, large-scale offline experimental investigations which take more time and effort might also help validate the above findings.

Author Contributions

Y.H. designed the study. F.M. and H.S. performed the study and analyzed the results. J.X., J.W., and C.W. discussed and analyzed the results. F.M. and Y.H. wrote the manuscript. All authors have read and agreed to the published version of the manuscript.

Funding

This work was supported by the National Natural Science Foundation of China (grant no. 61773412, 61903385 and U1911201), Guangzhou Science and Technology Project (grant no. 201804010473), the Natural Science Foundation of Guangdong for Distinguished Youth Scholar, Guangdong Provincial Department of Science and Technology (grant no. 2020B1515020052), Guangdong High-Level Personnel of Special Support Program, Young TopNotch Talents in Technological Innovation (grant no. 2019TQ05X138), Social Science Foundation of Jiangsu Province (grant no. 19JD001).

Data Availability Statement

Data associated with this study will be available on the website of corresponding author after publication: www.huyanqing.com (accessed on 1 January 2018).

Conflicts of Interest

The authors declare no conflict of interest.

Abbreviations

The following abbreviations are used in this manuscript:
G i Group i
P I Preference Intensity

Mathematical Symbols

The following mathematical symbols are used in this manuscript:
δFluctuation of user portraits
p k i Distribution of number of friends
Σ p k i Sum of distribution of number of friends
p G i Average of distribution of number of friends in G i

References

  1. Heath, T.L. A History of Greek Mathematics; Cambridge University Press: Cambridge, UK, 2013; Volume 1. [Google Scholar] [CrossRef]
  2. Maziarz, E.A. Greek Mathematical Philosophy; Duke University Press: Durham, NC, USA, 1968. [Google Scholar] [CrossRef]
  3. Zhmud, L.J. “All Is Number”? “ Basic Doctrine” of Pythagoreanism Reconsidered. Phronesis 1989, 34, 270–292. [Google Scholar]
  4. Burkert, W. Lore and Science in Ancient Pythagoreanism; Harvard University Press: Harvard, MA, USA, 1972; ISBN 978-0674539181. [Google Scholar]
  5. Riedweg, C. Pythagoras: His Life, Teaching, and Influence; Cornell University Press: Ithaca, NY, USA, 2008; ISBN 978-0801474521. [Google Scholar]
  6. Tong, S.T.; Van Der Heide, B.; Langwell, L.; Walther, J.B. Too much of a good thing? The relationship between number of friends and interpersonal impressions on Facebook. J. Comput.-Mediat. Commun. 2008, 13, 531–549. [Google Scholar] [CrossRef] [Green Version]
  7. Caplan, S.E. Preference for online social interaction: A theory of problematic Internet use and psychosocial well-being. Commun. Res. 2003, 30, 625–648. [Google Scholar] [CrossRef]
  8. Chau, K.; Ma, V.; Ho, D. The pricing of ‘luckiness’ in the apartment market. J. Real Estate Lit. 2001, 9, 29–40. [Google Scholar] [CrossRef]
  9. Bourassa, S.C.; Peng, V.S. Hedonic prices and house numbers: The influence of feng shui. Int. Real Estate Rev. 1999, 2, 79–93. [Google Scholar]
  10. Ngan, H.F.B.; Ren, L.; O’Bree, G. Lucky 8-ending—A case study on managerial price-ending beliefs in Macao. J. Hosp. Tour. Manag. 2018, 36, 22–30. [Google Scholar] [CrossRef]
  11. Raesita, K.; Mahadwartha, P.A. Superstitions and Price Clustering in the Taiwan Stock Exchange. In Proceedings of the 17th International Symposium on Management (INSYMA 2020), Vung Tao City, Vietnam, 19–31 February 2020; Vũng TàuAtlantis Press: Vung Tao City, Vietnam, 2020; pp. 483–488. [Google Scholar] [CrossRef] [Green Version]
  12. Hock-Eam, L.; Wong, W.C.; Hiau Abdullah, N.A. Estimating the Value of Chinese Superstitions in Car Plate Number of ‘8’: A Nonlinear Decomposition Analysis. 2020. Available online: https://ssrn.com/abstract=3721982 (accessed on 16 September 2021).
  13. Keith, A.B. The unlucky number 13. J. R. Asiat. Soc. 1916, 48, 350–355. [Google Scholar] [CrossRef] [Green Version]
  14. Hassler, U.; Pohle, M.O. Unlucky Number 13? Manipulating Evidence Subject to Snooping. arXiv 2020, arXiv:2009.02198. [Google Scholar]
  15. Hoon Ang, S. Chinese consumers’ perception of alpha-numeric brand names. Asia Pac. J. Mark. Logist. 1996, 8, 31–47. [Google Scholar] [CrossRef]
  16. Boyd, C.W. Alpha-Numeric Brand Names; Advertising res Foundation, 641 Lexington Ave: New York, NY, USA, 1985. [Google Scholar]
  17. Hamerman, E.J.; Johar, G.V. Conditioned superstition: Desire for control and consumer brand preferences. J. Consum. Res. 2013, 40, 428–443. [Google Scholar] [CrossRef]
  18. Kramer, T.; Block, L. Conscious and nonconscious components of superstitious beliefs in judgment and decision making. J. Consum. Res. 2007, 34, 783–793. [Google Scholar] [CrossRef] [Green Version]
  19. Shum, M.; Sun, W.; Ye, G. Superstition and “lucky” apartments: Evidence from transaction-level data. J. Comp. Econ. 2014, 42, 109–117. [Google Scholar] [CrossRef]
  20. Pokryshevskaya, E.B.; Antipov, E.A. A study of numerological superstitions in the apartments market. Econ. Bull. 2015, 35, 83–88. [Google Scholar] [CrossRef]
  21. Kendall, M.G.; Smith, B.B. Randomness and random sampling numbers. J. R. Stat. Soc. 1938, 101, 147–166. [Google Scholar] [CrossRef]
  22. Kramer, T.; Block, L. Nonconscious effects of peculiar beliefs on consumer psychology and choice. J. Consum. Psychol. 2011, 21, 101–111. [Google Scholar] [CrossRef]
  23. Jain, G.; Gaeth, G.J.; Nayakankuppam, D.; Levin, I.P. Revisiting attribute framing: The impact of number roundedness on framing. Organ. Behav. Hum. Decis. Process. 2020, 161, 109–119. [Google Scholar] [CrossRef]
  24. Pedersen, R.T.; Larsen, M.V. Putting a number on preferences: How numerical attitudes are shaped by ideology and equivalency framing. Int. J. Public Opin. Res. 2019, 31, 528–548. [Google Scholar] [CrossRef]
  25. Anderson, M.; Jiang, J. Teens, social media & technology 2018. Pew Res. Cent. 2018, 31, 1673–1689. Available online: https://www.pewresearch.org/internet/2018/05/31/teens-social-media-technology-2018/ (accessed on 8 August 2021).
  26. Fuchs, C. Social Media: A Critical Introduction; Sage: Newcastle upon Tyne, UK, 2021; ISBN 9781529752748. [Google Scholar]
  27. Perrin, A. Social media usage. Pew Res. Cent. 2015, 125, 52–68. Available online: https://books.google.ru/books?id=OupAnQAACAAJ (accessed on 8 August 2021).
  28. Hjorth, L.; Hinton, S. Understanding Social Media; Sage: Newcastle upon Tyne, UK, 2019; ISBN 9781526425966. [Google Scholar]
  29. Carr, C.T.; Hayes, R.A. Social media: Defining, developing, and divining. Atl. J. Commun. 2015, 23, 46–65. [Google Scholar] [CrossRef]
  30. Hawi, N.; Samaha, M. Identifying commonalities and differences in personality characteristics of Internet and social media addiction profiles: Traits, self-esteem, and self-construal. Behav. Inf. Technol. 2019, 38, 110–119. [Google Scholar] [CrossRef]
  31. Chen, Y.; He, J.; Wei, W.; Zhu, N.; Yu, C. A Multi-Model Approach for User Portrait. Future Internet 2021, 13, 147. [Google Scholar] [CrossRef]
  32. Wang, X.; Zhu, W.; Liu, C. Social Recommendation with Optimal Limited Attention. In Proceedings of the 25th ACM SIGKDD International Conference on Knowledge Discovery & Data Mining. Association for Computing Machinery, New York, NY, USA, 4–8 August 2019; pp. 1518–1527. [Google Scholar] [CrossRef]
  33. Souri, A.; Hosseinpour, S.; Rahmani, A.M. Personality classification based on profiles of social networks’ users and the five-factor model of personality. Hum.-Centric Comput. Inf. Sci. 2018, 8, 1–15. [Google Scholar] [CrossRef] [Green Version]
  34. Tadesse, M.M.; Lin, H.; Xu, B.; Yang, L. Personality predictions based on user behavior on the facebook social media platform. IEEE Access 2018, 6, 61959–61969. [Google Scholar] [CrossRef]
  35. Stankevich, M.; Smirnov, I.V.; Ignatiev, N.; Grigoryev, O.; Kiselnikova, N. Analysis of Big Five Personality Traits by Processing of Social Media Users Activity Features. In Proceedings of the DAMDID/RCDL, CEUR-WS, Moscow, Russia, 9–12 October 2018; pp. 162–166. Available online: http://ceur-ws.org/Vol-2277/paper29.pdf (accessed on 8 August 2021).
  36. Cinelli, M.; Brugnoli, E.; Schmidt, A.L.; Zollo, F.; Quattrociocchi, W.; Scala, A. Selective exposure shapes the Facebook news diet. PLoS ONE 2020, 15, e0229129. [Google Scholar] [CrossRef] [PubMed] [Green Version]
  37. Sivaraman, N.K.; Tokala, J.R.; Rupesh, R.S.C.V.; Muthiah, S.B. Event Detection in Twitter using Social Synchrony and Average Number of Common Friends. In Proceedings of the 13th ACM Web Science Conference 2021, Association for Computing Machinery, New York, NY, USA, 21–25 June 2021; pp. 115–119. [Google Scholar] [CrossRef]
  38. Sánchez-Romero, C.; Muñoz-Jiménez, E.M. Social and Educational Coexistence in Adolescents’ Perception in Current Social Problems through Networks. Future Internet 2021, 13, 141. [Google Scholar] [CrossRef]
  39. Efthimion, P.G.; Payne, S.; Proferes, N. Supervised machine learning bot detection techniques to identify social twitter bots. SMU Data Sci. Rev. 2018, 1, 5. Available online: https://scholar.smu.edu/cgi/viewcontent.cgi?article=1019&context=datasciencereview (accessed on 8 August 2021).
  40. Beskow, D.M.; Carley, K.M. You are known by your friends: Leveraging network metrics for bot detection in twitter. In Open Source Intelligence and Cyber Crime; Springer: Berlin/Heidelberg, Germany, 2020; pp. 53–88. [Google Scholar] [CrossRef]
  41. Spradling, M.; Straub, J.; Strong, J. Protection from ‘Fake News’: The Need for Descriptive Factual Labeling for Online Content. Future Internet 2021, 13, 142. [Google Scholar] [CrossRef]
  42. Luqiu, L.R.; Schmierbach, M.; Ng, Y.L. Willingness to follow opinion leaders: A case study of Chinese Weibo. Comput. Hum. Behav. 2019, 101, 42–50. [Google Scholar] [CrossRef]
  43. Xie, J.; Meng, F.; Sun, J.; Ma, X.; Yan, G.; Hu, Y. Detecting and modelling real percolation and phase transitions of information on social media. Nat. Hum. Behav. 2021, 1–8. [Google Scholar] [CrossRef]
  44. Barabási, A.L.; Albert, R. Emergence of scaling in random networks. Science 1999, 286, 509–512. [Google Scholar] [CrossRef] [Green Version]
  45. Hu, Y.; Ji, S.; Jin, Y.; Feng, L.; Stanley, H.E.; Havlin, S. Local structure can identify and quantify influential global spreaders in large scale social networks. Proc. Natl. Acad. Sci. USA 2018, 115, 7468–7472. [Google Scholar] [CrossRef] [Green Version]
  46. Dunbar, R.I. Do online social media cut through the constraints that limit the size of offline social networks? R. Soc. Open Sci. 2016, 3, 150292. [Google Scholar] [CrossRef] [PubMed] [Green Version]
  47. Hill, R.A.; Dunbar, R.I. Social network size in humans. Hum. Nat. 2003, 14, 53–72. [Google Scholar] [CrossRef]
  48. Weng, P.S. Lucky issuance: The role of numerological superstitions in irrational return premiums. Pac.-Basin Financ. J. 2018, 47, 79–91. [Google Scholar] [CrossRef]
  49. Otekunrin, O.A.; Folorunso, A.G.; Alawode, K.O. Number preferences in selected Nigerian lottery games. Judgm. Decis. Mak. 2021, 16, 1060–1071. Available online: http://journal.sjdm.org/20/201204a/jdm201204a.pdf (accessed on 8 August 2021).
  50. Xie, J.; Wang, X.; Feng, L.; Zhao, J.H.; Moreno, Y.; Hu, Y. Induced Percolation on Networked Systems. arXiv 2020, arXiv:2011.14034. [Google Scholar]
  51. Balakrishnan, V.; Khan, S.; Fernandez, T.; Arabnia, H.R. Cyberbullying detection on twitter using Big Five and Dark Triad features. Personal. Individ. Differ. 2019, 141, 252–257. [Google Scholar] [CrossRef]
  52. Sina Weibo Platform. Available online: https://weibo.com/ (accessed on 1 September 2012).
  53. Leskovec, J.; Faloutsos, C. Sampling from Large Graphs. In Proceedings of the 12th ACM SIGKDD International Conference on Knowledge Discovery and Data Mining, ACM, Philadelphia, PA, USA, 20–23 August 2006; pp. 631–636. [Google Scholar] [CrossRef]
  54. Good, P.I. Resampling Methods; Springer: Berlin/Heidelberg, Germany, 2006; ISBN 10. [Google Scholar]
  55. Qi, W.; Liu, S.; Zhao, M. Study on the stability of Hu Line and different spatial patterns of population growth on its both sides. Acta Geogr. Sin. 2015, 70, 551–566. [Google Scholar] [CrossRef]
  56. National Bureau of Statistics of China Website. Available online: http://www.stats.gov.cn/ (accessed on 26 April 2018).
  57. Cadwalladr, C.; Graham-Harrison, E. Revealed: 50 million Facebook profiles harvested for Cambridge Analytica in major data breach. Guard 2018, 17, 22. Available online: http://freestudio21.com/wp-content/uploads/2018/04/50-million-fb-profiles-harvested-by-cambridge-analitica.pdf (accessed on 8 August 2021).
  58. Isaak, J.; Hanna, M.J. User data privacy: Facebook, Cambridge Analytica, and privacy protection. Computer 2018, 51, 56–59. [Google Scholar] [CrossRef]
  59. Bruns, A. After the ‘APIcalypse’: Social media platforms and their fight against critical scholarly research. Information, Commun. Soc. 2019, 22, 1544–1566. [Google Scholar] [CrossRef]
  60. Lopes, H.; Pires, I.M.; Sánchez San Blas, H.; García-Ovejero, R.; Leithardt, V. PriADA: Management and Adaptation of Information Based on Data Privacy in Public Environments. Computers 2020, 9, 77. [Google Scholar] [CrossRef]
Figure 1. Sina Weibo’s network degree distribution. (aj) Distribution of the number of friends in different regions. (k) Distribution of the number of friends nationwide. (l) Distribution of the number of friends near 200. (m) Distribution of the number of followers. We can observe that the distribution of the number of friends in Sina Weibo is homogeneous, while the distribution of the number of followers is heterogeneous. Meanwhile, we found a sharp peak at 200 in different regions, which indicates this is a ubiquitous phenomenon. Note that the peak at the number of 2000 is caused by Sina Weibo’s system setting of the maximum number of friends for normal users and VIP users are not subject to this restriction.
Futureinternet 13 00236 g001
Figure 2. Evolution of the distribution of the number of friends and the distribution of proportions of original posts. (a) Evolution of distribution of the number of friends. The histogram from left to right represents the distribution of users whose number of friends in 2012 was in the range of 120 to 130, 145 to 155, and 170 to 180, respectively. The solid lines corresponding to the colors represent the distribution of the number of friends of each user group in 2021. We use uniform sampling with replacement method [54] to investigate the effects of sampling bias. The resamples are the same size as the original sample. Error bars are standard deviations of 1000 generated resamples. (b) The distribution of ratios of original posts in two kinds of users. The histogram on the left (right) represents the distribution of ratios of the original post for users with (without) 200 preferences. The two distributions are almost the same.
Futureinternet 13 00236 g002
Figure 3. Comparison of user portraits whose number of friends is near 200. (a) Cumulative distribution of the user’s total posts. (b) Cumulative distribution of the user’s number of followers. Three different color lines represent three user groups whose number of friends is between 193 and 199, between 200 and 202, and between 203 and 209 in 2012, respectively. (c) Cumulative distribution of the follower count of friends. The two dash lines corresponding to the abscissa are 5 × 10 2 and 10 5 , respectively. We can see that users with the preference for the number 200 have lower activity, fewer followers, and tend to follow popular users. Note that (c) combined with the friends list and crawled the number of followers of each of the user’s friends, then calculated the average follower count of these friends.
Futureinternet 13 00236 g003
Figure 4. Evolution of user portraits whose number of friends is near 200. (ac) represent the proportion of users whose number of friends, followers, and posts fluctuation is less 5% from 2012 to 2018, respectively. (d) The proportion of users whose location remains unchanged. We can see that the social portraits of users with the 200 preference change more slowly.
Futureinternet 13 00236 g004
Figure 5. Regional distribution characteristics of users with the preference for the number 200. (a) The preference intensity of number 200 in different regions. The black line represents the famous Hu Line [55]. (b) Comparison of the preference intensity of the number 200 in each region to the national average. (c) The relationship between the preference intensity of the number 200 and the GDP of the region. (d) The relationship between the preference intensity of the number 200 and the average years of education in the region. Each point represents a province, and the black line represents the fitted line of the least squares method with a confidence of 95%, R 2 are 0.56 and 0.32, respectively. From this figure, we can see that there exist obvious differences in regions for preference intensity, the northwestern region is relatively strong, while the southeastern coastal region is weak. Moreover, there is a significant negative correlation between preference intensity and the level of regional economic/educational development.
Futureinternet 13 00236 g005
Table 1. Collected user attribute information.
YearNNickname k i k o mPost ContentCityGender
20126,836,935
2018189,602
202168,655
N: sample space size; k i : number of friends of a user; k o : number of followers of a user; m : number of posts from a user since registration.
Publisher’s Note: MDPI stays neutral with regard to jurisdictional claims in published maps and institutional affiliations.

