1. Introduction
In the modern age of information technology, user authentication is an important process for information security and IoT-based systems. User authentication is a useful technique to keep one’s networks secured by permitting only authenticated users to access one’s protected resources which may include databases, computer systems, websites, and other network-based services or applications. It plays an important role in the user’s own authorized account which is only accessible by his or her in a protective manner. The authentication methods can be structured into three prime classes: knowledge-based, token-based, and biometric-based. Password-based user authentication is very common but not robust enough. Several researchers investigated user authentication processes based on Keystroke, Hand Geometry, Finger Print, Iris, Face, DNA, Voice, and others. However, every individual’s handwriting has distinguishable attributes, which can be used to uniquely authenticate a person both offline or online.
In recent years, handwriting recognition and person identification has become a potential field of research. In handwriting recognition system, it takes the input from a touch screen, electronic pen, scanner, images, and paper documents to read, elaborate, and create features of the handwritten characters. Every individual has his or her own individuality in handwriting style. This reality is exercised in various applications like signature verification [
1,
2] or person identification [
3,
4]. Personal identification based on handwriting is a unique approach that has a variety of potential applications like security purposes, financial activities, forensic activities, demography-based writer authentication, and archaeological authentication (e.g., to identify ancient document writers). Handwriting can also be used to identify the author’s identity relating to age, gender, handedness, and ethnicity. This process requires feature extraction from the parameters such as writing speed, pressure, direction, duration, height, width, slant angle, etc. Hence, designing a handwriting recognition system considering all sorts of handwriting styles with a high range of accuracy is challenging. Several approaches have been used for this purpose like Structural Methods, Convolutional Neural Networks, Syntactic Methods, Back Propagation, K-Nearest Neighbor Algorithm, Support Vector Machine (SVM), etc.
Most of the existing works in this area are image-based which focused on image pre-processing techniques and so on. In an image-based system, the quality of images depends on lights, effects, reflection, image quantization, brightness, camera attributes, camera frames, and image quality. Hence, the system accuracy is affected by the image quality, contrast, lighting, shading, noise suppression, filtering, etc. Depending on image pre-processing, the time complexity and computational processing cost are also high for the existing systems. Moreover, an image-based model does not work with the genuine and exact numerical values of an individual’s handwriting data. Direct numerical values of a person’s handwriting data provide more genuine and accurate features of an individual user which is crucial for the authentication of a writer.
Therefore, in this research, we concentrate on collecting the more genuine numerical values of the user’s handwriting directly from the sensors signal of digital pen-tablet devices which motivates this work. The process of getting direct data values helps the proposed method to get more improve accuracy in the context of pen-tablet sensor data. Hence, in this research, we emphasized more robust and efficient data acquisition and analysis which is invariant of the camera frame, camera positioning, image quality, and image pre-processing techniques. The proposed model is constructed based on the user’s pen tablet handwriting data analysis which automatically stores the numeric values of the user’s handwriting attributes from the pen-tablet sensor signals. In the proposed system, since the data values are directly extracted from the sensor signal of digital pen and tablet devices, it ensures the robustness of the identification of handwriting data.
In this research, we emphasize real-time handwritten sensor data analysis of individuals by using pen tablet devices. In the proposed user authentication model, firstly, six completely separate parameters of handwritten data are collected from the sensor signals of digital pen-tablet devices. Before feature extraction, data pre-processing has been done. In the feature extraction phase, several discriminant kinematic and statistical features are extracted from the parameters of handwriting data. However, all the features extracted from high dimensional sensor data are not equally important to identify a user. Hence, to keep our trained model focused only on the vital features, we introduce the optimal feature selection model which minimizes the overfitting problem.
Then, the most informative and vital features are selected using the optimal feature selection model. Finally, machine learning techniques are applied for training and testing the selected optimal features for the user authentication process. The proposed system is implemented using different classification algorithms and the experimental analysis shows that we got satisfactory results which ensure the practicality of our system with low implementation cost. Our main contributions in this research work are:
User authentication using motion sensor data of pen-tablet devices.
A quantitative analysis of pen-tablet sensor data using kinematic and statistical features extraction model.
Introduce optimal feature selection model combination of filter-based approach and wrapper approach.
An efficient and robust writer identification model using support vector machine (SVM), logistic regression (LR), and random forest (RF) classifier.
The full paper is organized as follows: the next section provides the literature review.
Section 3 explains the proposed system model, data acquisition, data pre-processing, feature extraction, and optimal feature selection process.
Section 4 discusses the experimental result analysis. And
Section 5 concludes this research works with future scopes. Each section includes the necessary diagrams, tables, and graphical representations for an easy and clear understanding of this research work.
2. Literature Review
In this section, the theoretical and methodological approaches related to our work are explained. Multiple works on image and pattern analysis-based handwriting recognition and person identification have been reported. Saini et al. in [
5], proposed a three-step biometric authentication model based on sitting, walking, and relaxing patterns using mobile devices. Here, Random Forest and KNN are used for classification. However, this model achieves less than 1% False Acceptance Rate (FAR) and 2.2% EER Equal Error Rate (EER). Several papers based on touchscreen gestures while using mobile devices in scenarios such as document reading, keystroke dynamics, web surfing, or free tasks have been achieved popular impact nowadays [
6,
7,
8]. In [
9], a multistage cascading system to serve the field of offline Arabic handwriting recognition is proposed where deep learning techniques are used. The similarity between characters and inconstancy of the writing styles makes Arabic character recognition more challenging. They utilize Hierarchical Agglomerative Clustering (HAC) technique to form the dataset into partially inter-related clusters. The IFN/ENIT Arabic dataset has been used for their experiment. Their process is divided into three consecutive stages. However, the inter-related clusters represent the database as a big search tree model. A behavioral authentication method for mobile devices based on browsing behaviors is proposed in [
10]. They develop a news APP using Web View Library and news API of Extreme Speed Data. Their result depends on the external environment model (EEM), the screen-sliding behavior model (SSBM), and the browsing behavior model (BBM). The average DR of the method in this paper is 86% which needs to be improved. In [
11], a novel forensic hand radiograph-based human authentication is proposed using a deep neural network. Three-layered convolutional deep neural network architecture is used for the feature extraction and recognition of hand radiographs using KNN and SVM classifiers. The performance of the cross-validation accuracy is 97.60% for KNN and 99.20% for SVM. However, the system required a large amount of data and high computational cost.
Image Processing Features are widely used at the document level or the paragraph level. Here features are divided into three groups: pen pressure, writing movement, and stroke information. In [
12,
13], the author used image acquisition, image pre-processing, image segmentation, feature extraction, and classification techniques in their proposed system. But the problem of these systems is lighting, shading effect, noise suppression, etc. which are dependent on image pre-processing techniques. In [
14], a method concerning to develop the performance of a palm print-based verification system by integrating hand geometry features has been proposed. The hand shape and palm print images are used to extract features. The result is then examined for their individual and combined verification performances. This feature extraction process has been done by image pre-processing techniques which are costly. M. Kosugi and T. Suzuki proposed an image-based user authentication method for touch screen devices by using the latest image shot by the user as the pass-image [
15]. Their authentication could resist smudge attacks, which is one of the major threats for touch screen devices. However, the security strength of the method is low. Some systems on handwriting recognition are done depending on some image pre-processing techniques like image contrast, lighting, shading, illumination, noise suppression, filtering, etc. [
16,
17,
18]. Hence, the quality of the image affects the robustness of the data. Image quality also varies depending on pre-processing techniques [
19,
20]. From [
21,
22,
23,
24,
25,
26], the research works have been done on handwriting recognition and person identification. These systems are also based on image and pattern analysis which suffers from high computational cost.
The researcher in [
27] presents a hybrid feature selection model with a discriminant feature distribution analysis-based feature subset evaluation. This method is focused on online bearing fault diagnosis in induction motors. The proposed model better performance than the state-of-the-art average distance-based approaches by a performance margin of about 5%.
Paper [
28] has presented an overview of automatic writer identification modules of an embedded biometric system based on small-scale handwritten data. They evaluated both static and dynamic features and proposed a new feature selection algorithm based on likeness coefficients. The identification result of 95% validates the use of handwriting in embedded personal identification devices. However, this system focused only on the small-scale handwriting samples of single handwritten words. The author considered the minimum distance classifier which is sensitive to the differences in variance among the categories.
In [
29], the authors have pointed out future trends and challenges in biometric research on signature and handwriting. Special emphasized the use of handwriting signals not only on biometric traits but also on e-security and e-health. Some challenges are identified which should attract the interest of the research community towards a more secure society.
Chahi et al. in [
30,
31] proposed classic approaches emphasizing on extracting the desirable features. Authors in [
30] proposed a Block Wise Local Binary Count (BW-LBC) operator stimulated by traditional LBP that characterizes multiple histograms. Based on the distribution of the pixels in small blocks, the histograms are generated. They utilized the nearest-neighbor classification using the Hamming distance and presented that their approach is better than the modern approaches. For writer identification, the authors in [
31], proposed another classical feature extraction method. Their descriptor illustrates a salient feature for local writing structure and is applied to small connected regions of the sample. These feature maps have been used as inputs for the nearest neighbor classifier to classify the query writer. These two works show that traditional features are still useful for writer identification and superior in some tasks. However, as the authors of this research are resizing the handwriting images, there is a possibility of losing the writers’ personalities due to stretching the images.
He and Schomaker have recently proposed two deep architectures [
32,
33]. The former one represents the handwriting which contains two implicit and explicit information where the explicit information refers to the length, number of characters, and lexical contents of single words. In contrast, the implicit information is the writer’s behavioral information that can be used for author identity. The author proposed using both implicit and explicit information so that explicit information can be used along with the implicit features to make extra information. The proposed CNN architecture is based on the AlexNet, including two parallel pathways. However, a challenging issue of this research relies on resizing handwriting patches into 120 × 140 × 1, where such an affine transformation can lose the writer’s intrinsic information.
In [
34], the authors represent a deep learning framework for offline text-independent writer identification based on the conjugation of the deep and traditional features. Proposed deep architecture is an extended version of ResNet, which is done using the auxiliary information of handwriting thickness descriptor (HTD). The HTD computed the thickness of handwriting as an essential and preliminary feature for human handwriting analysis. However, the authors do not resize the handwriting images, rather they suggest to crop patches of the handwriting and propose a descriptor to explain each handwriting image regarding the script thickness. Therefore, their model is a conjugating approach to fill the gap of using classical and modern features and achieves appropriate results. However, for future scopes, more reasonable features and multimodal descriptions can be utilized.
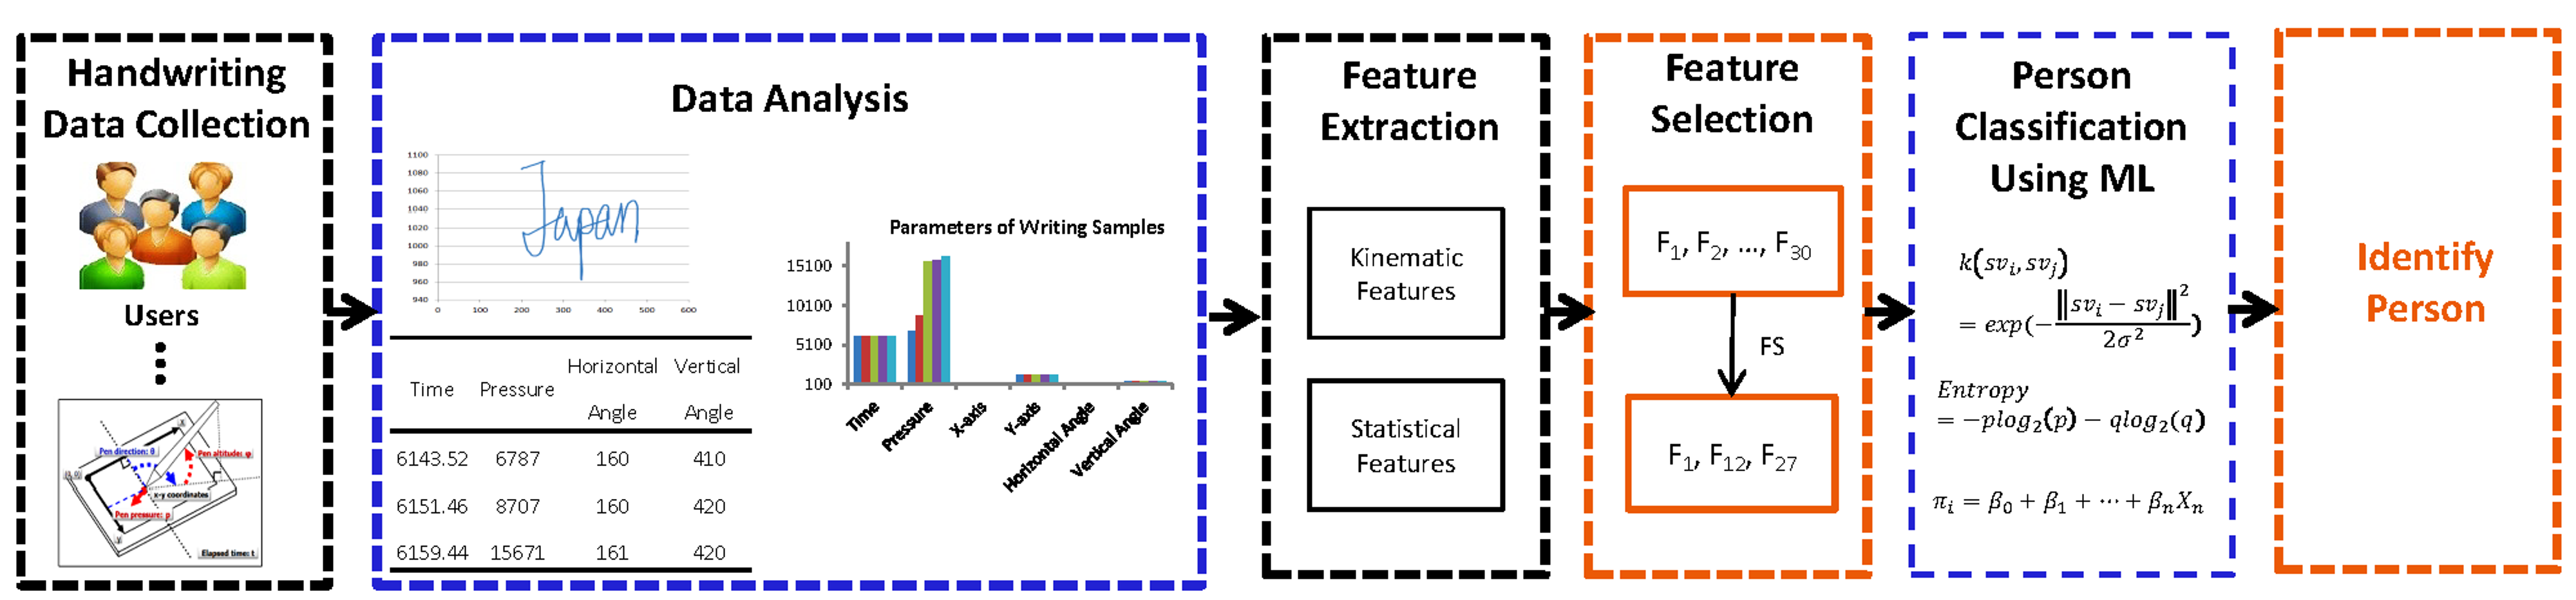
3. Proposed Model
In this section, the proposed system model of writer identification is explained in a step-by-step procedure. The proposed system consists of six phases: data acquisition, data analysis and prepossessing, feature extraction, optimal feature selection, and classification. In the data collection phase, handwriting data is collected from the sensor signal of a digital pen tablet device which generates six attributes (Time, Pressure, X-axis, Y-axis, Horizontal angle, and Vertical angle) which represents different unique numerical values for different types of handwriting. To make a balanced format of dataset some functions such as Imputation Function and Flatten Function are utilized. Our handwriting dataset consists of real-time handwritten data and every data is important. After data analysis, it is observed that some data values are missing and some became very high which can be a problem for our machine learning model. Using a direct mean of the data may cause the loss of some attributes of the data such as pressure, angle, etc. Since, missing values of the handwritten data are not ignorable; data imputation has the highest potential to preserves the mean of the non-missing data. In our research, we have utilized mean imputation to replace the missing data values. On the other hand, Flatten function is utilized to convert the 2D data into a one-dimensional array for passing it to the next layer. We flatten the dataset to keep the level same for all the data. It makes our computational process simple and easier. Hence, to enhance our dataset and to make it normalize, we have utilized some pre-processing techniques such as imputation function and flatten function. These pre-processing makes our dataset balanced (ready) for the implementation and experiment. That is why we called it as a balanced format of dataset.
After data pre-processing, different statistical and kinematic features are extracted. The feature selection model is introduced to find the optimal features which are vital for the identification of a user. Three different and most widely used machine learning algorithms are used for classification which are: Support Vector Machine (SVM), Linear Regression (LR), and Random Forest (RF) classifiers.
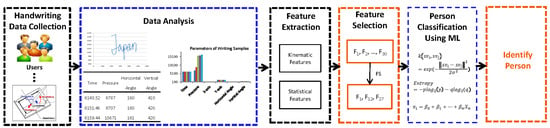
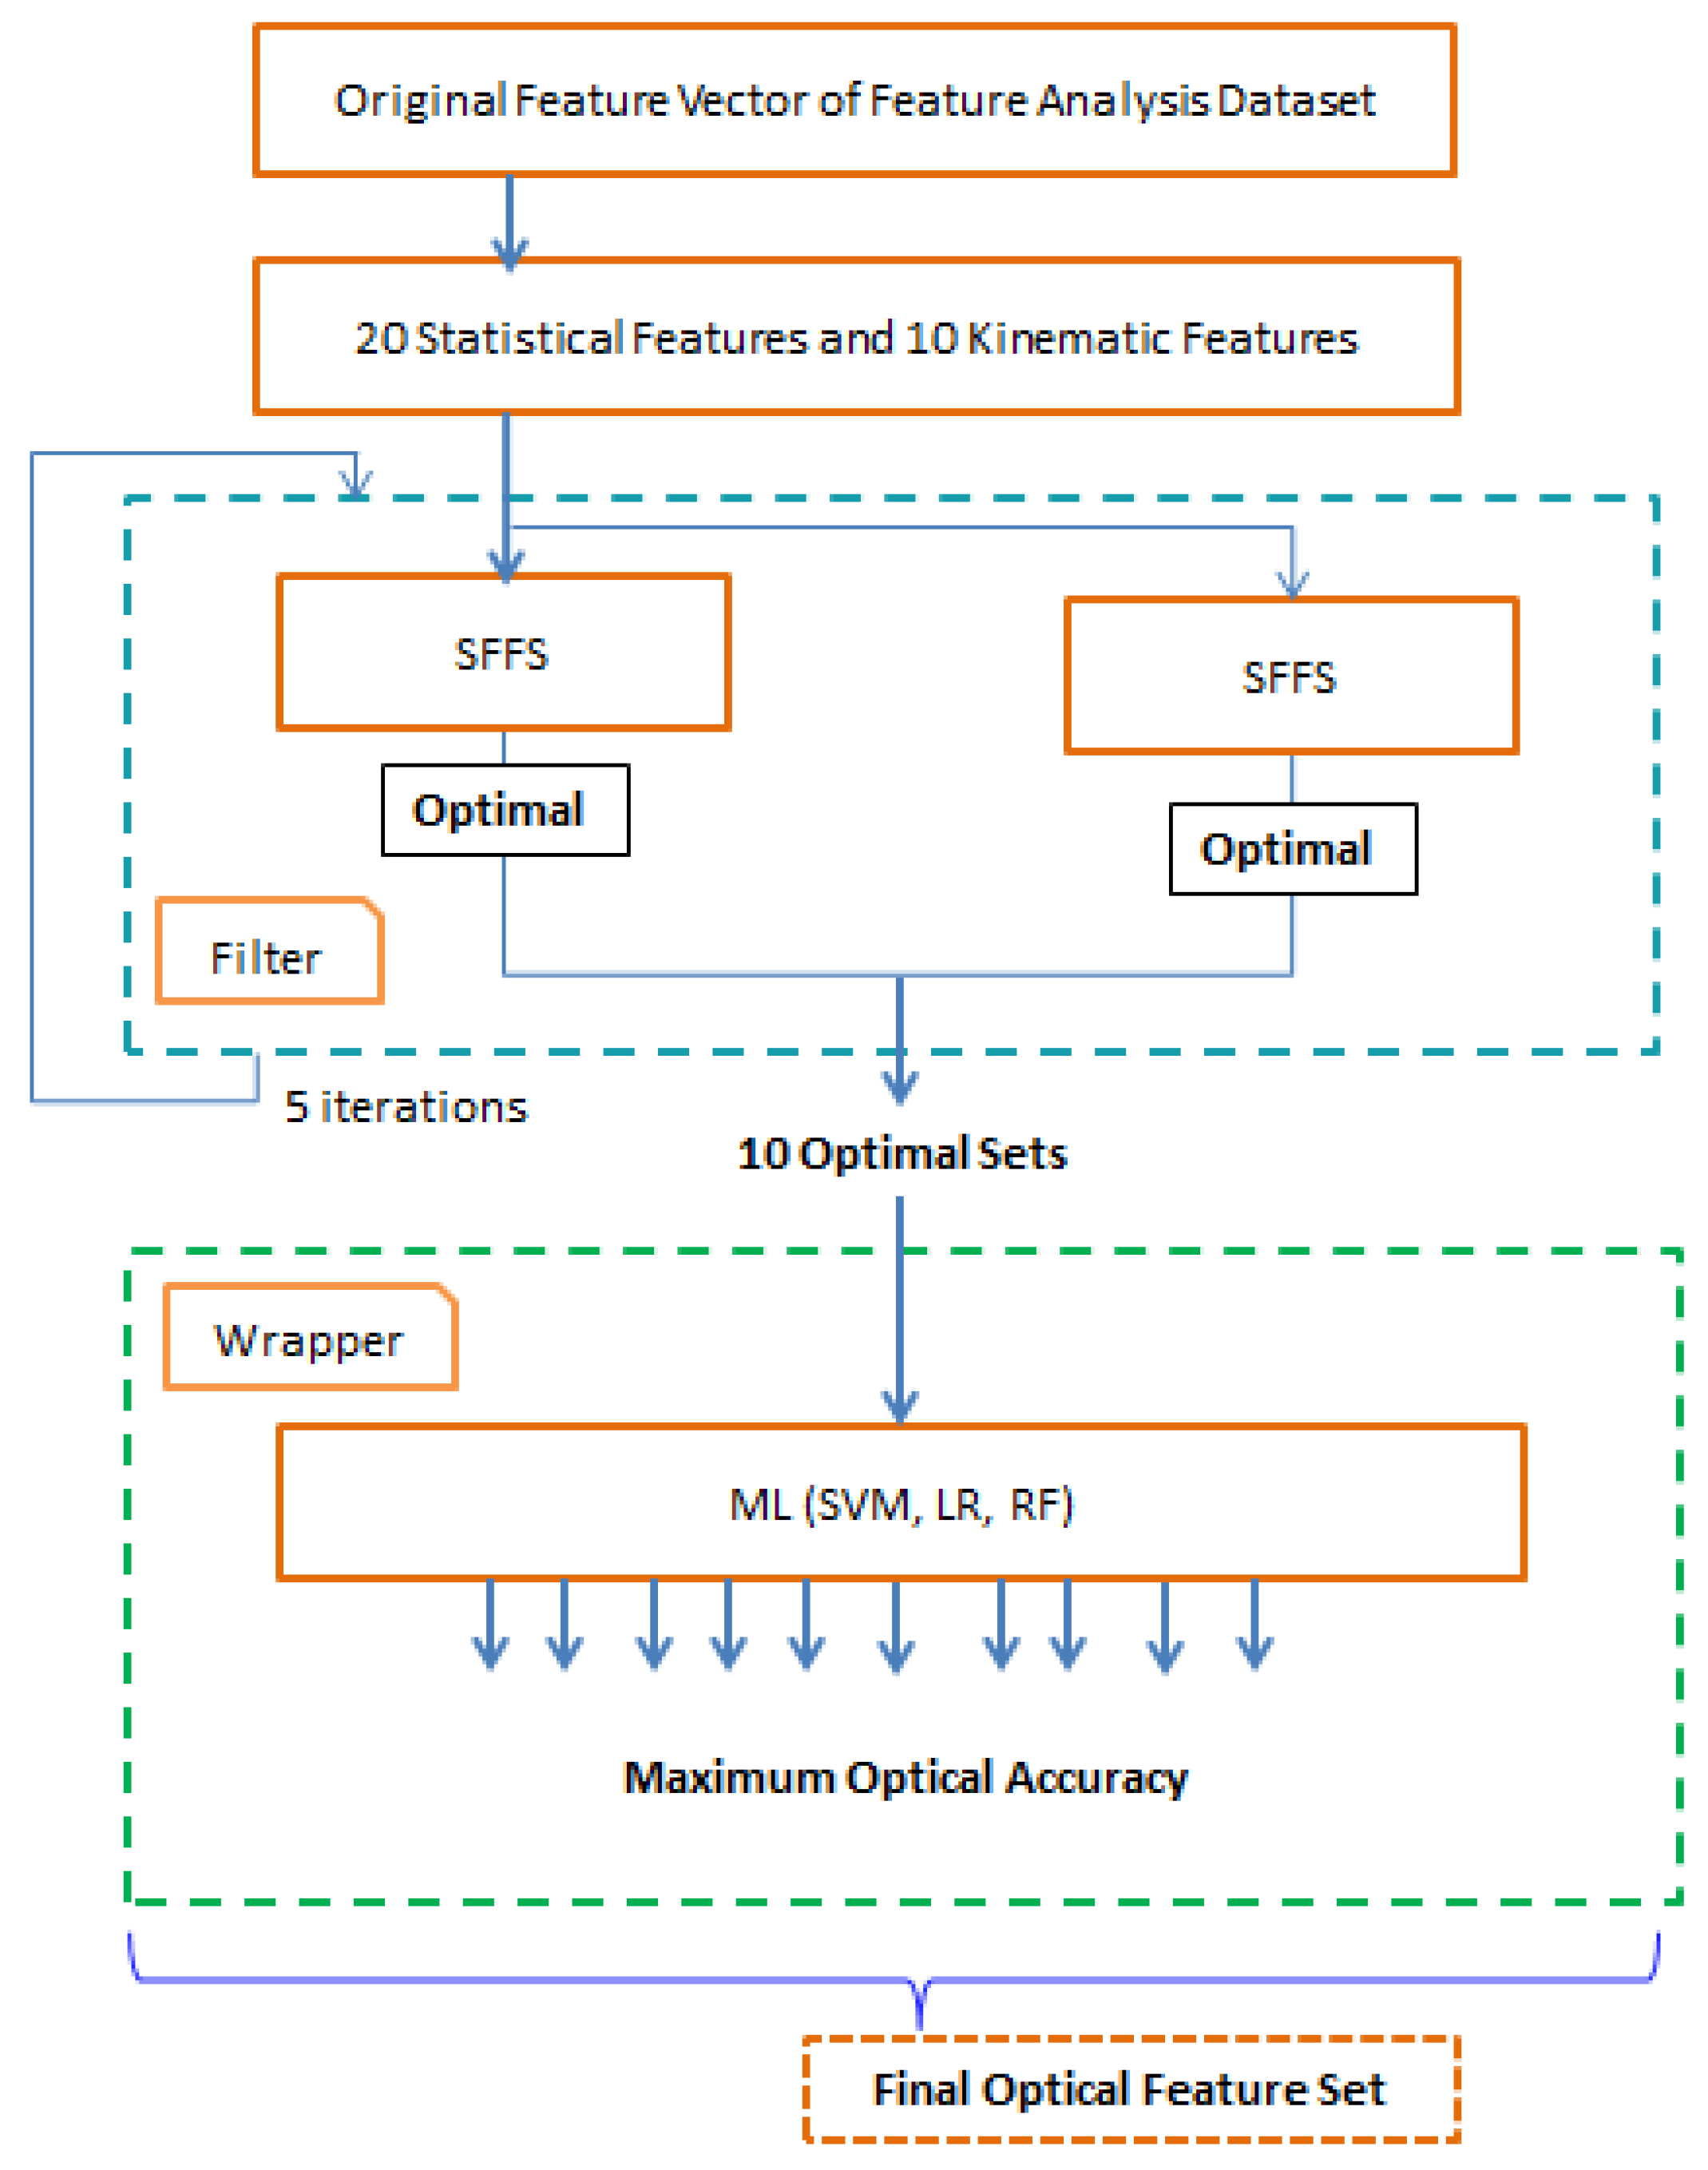
A general block diagram of the user identification model is shown in
Figure 1. The model is divided into two major parts. In this research, the first part represents our main contribution to the experimental analysis. The first part consists of extracting different statistical and kinematic features from the dataset and the optimal feature selection process. The dataset is split into two subsets. The first subset is used to generate different optimal features using a hybrid feature selection process. Several kinematic and statistical features are calculated from the six parameters (time, pressure,
x-axis,
y-axis, horizontal angle, and vertical angle) of sensor signals from the first data subset. In this research, for better accuracy, we have considered both statistical and kinematic features. The proposed model introduces a hybrid feature selection algorithm to find out the important feature sets. In the second phase, training and testing are completed using the second data subset. Two third of the dataset is used for feature selection and training process and one-third of the dataset is used for the testing process. A machine learning technique is deployed to identify the person’s handwriting based on the classified optimal features set. We have used SVM, LR, and RF classifiers to compare the accuracy of the classified features in this research and to show the stability of our proposed model.
3.1. Pen Tablet Handwriting Data Collection
In this research, we have collected handwriting samples from different individuals of age 19~40 using digital pen-tablet devices. Initially, we have collected hand-writing samples from 25 different persons both male and female. The sample keywords are written on a plane platform of the tablet within a margin. When the persons are writing on the tablet surface using a digital pen, then an automatic dataset is generated with the corresponding numeric values in an excel sheet. The dataset consists of six parameters (time, pressure,
x-axis,
y-axis, horizontal angle, and vertical angle) which are automatically generated from the pen and tablet sensor signals. Therefore, our dataset is more genuine and robust which contains unique attributes of different person’s handwriting. For collecting the handwriting dataset, we have used Wacom Tablet which is shown in
Figure 2.
For ensuring the data values of our system, every keyword has been collected 5 times from each person. Initially, 25 persons writing samples are collected. Every person was asked to write 10 defined keywords (Basic Research, Computer Vision, Pattern Processing, Machine Learning, Japan, Tokyo, Fukushima, Aizu University, Hello World, and Thank You) and each of them was repeated 5 times. Thus, 1250 sample data are collected to conduct this research. Since the numeric data values are directly storing in an excel sheet without any filtering or pre-processing, therefore after data analysis, we claim that we have got more genuine and robust data than the existing image-based system.
Table 1 shows an example of our dataset which is automatically generated from the sensor signals of pen and tablet devices. The automatic numeric data collection process of handwriting through sensor signals makes our proposed model significant to get better accuracy and open up a new direction for further research in this field. Additionally, the initial data pre-processing is limited in the proposed system, which does not affect the processing time and hardware cost.
3.2. Parameters of Pen Tablet Handwriting Data
In this research work, the dataset has six important parameters or attributes from which different kinematic and statistical features are calculated. The detailed explanations of these attributes are given below:
Writing Time: Every person consumes a different amount of time for his/her writing depending on the writing speed. Someone writes very slowly, someone writes moderately and someone writes very fast. After analysis, it is found that for those who write very fast, their handwriting style changes like their baseline changed over time such as rising, straight, falling, erratic, etc.
Pen Pressure: Pen pressure is the most vital attribute of individual handwriting. Pen pressure of every individual is different from each other in terms of heavy or light. In our collected, dataset, the pressure of a person is not the same for each iteration. The pressure range of some person is (2345–6595) and some other person is (1978–22905).
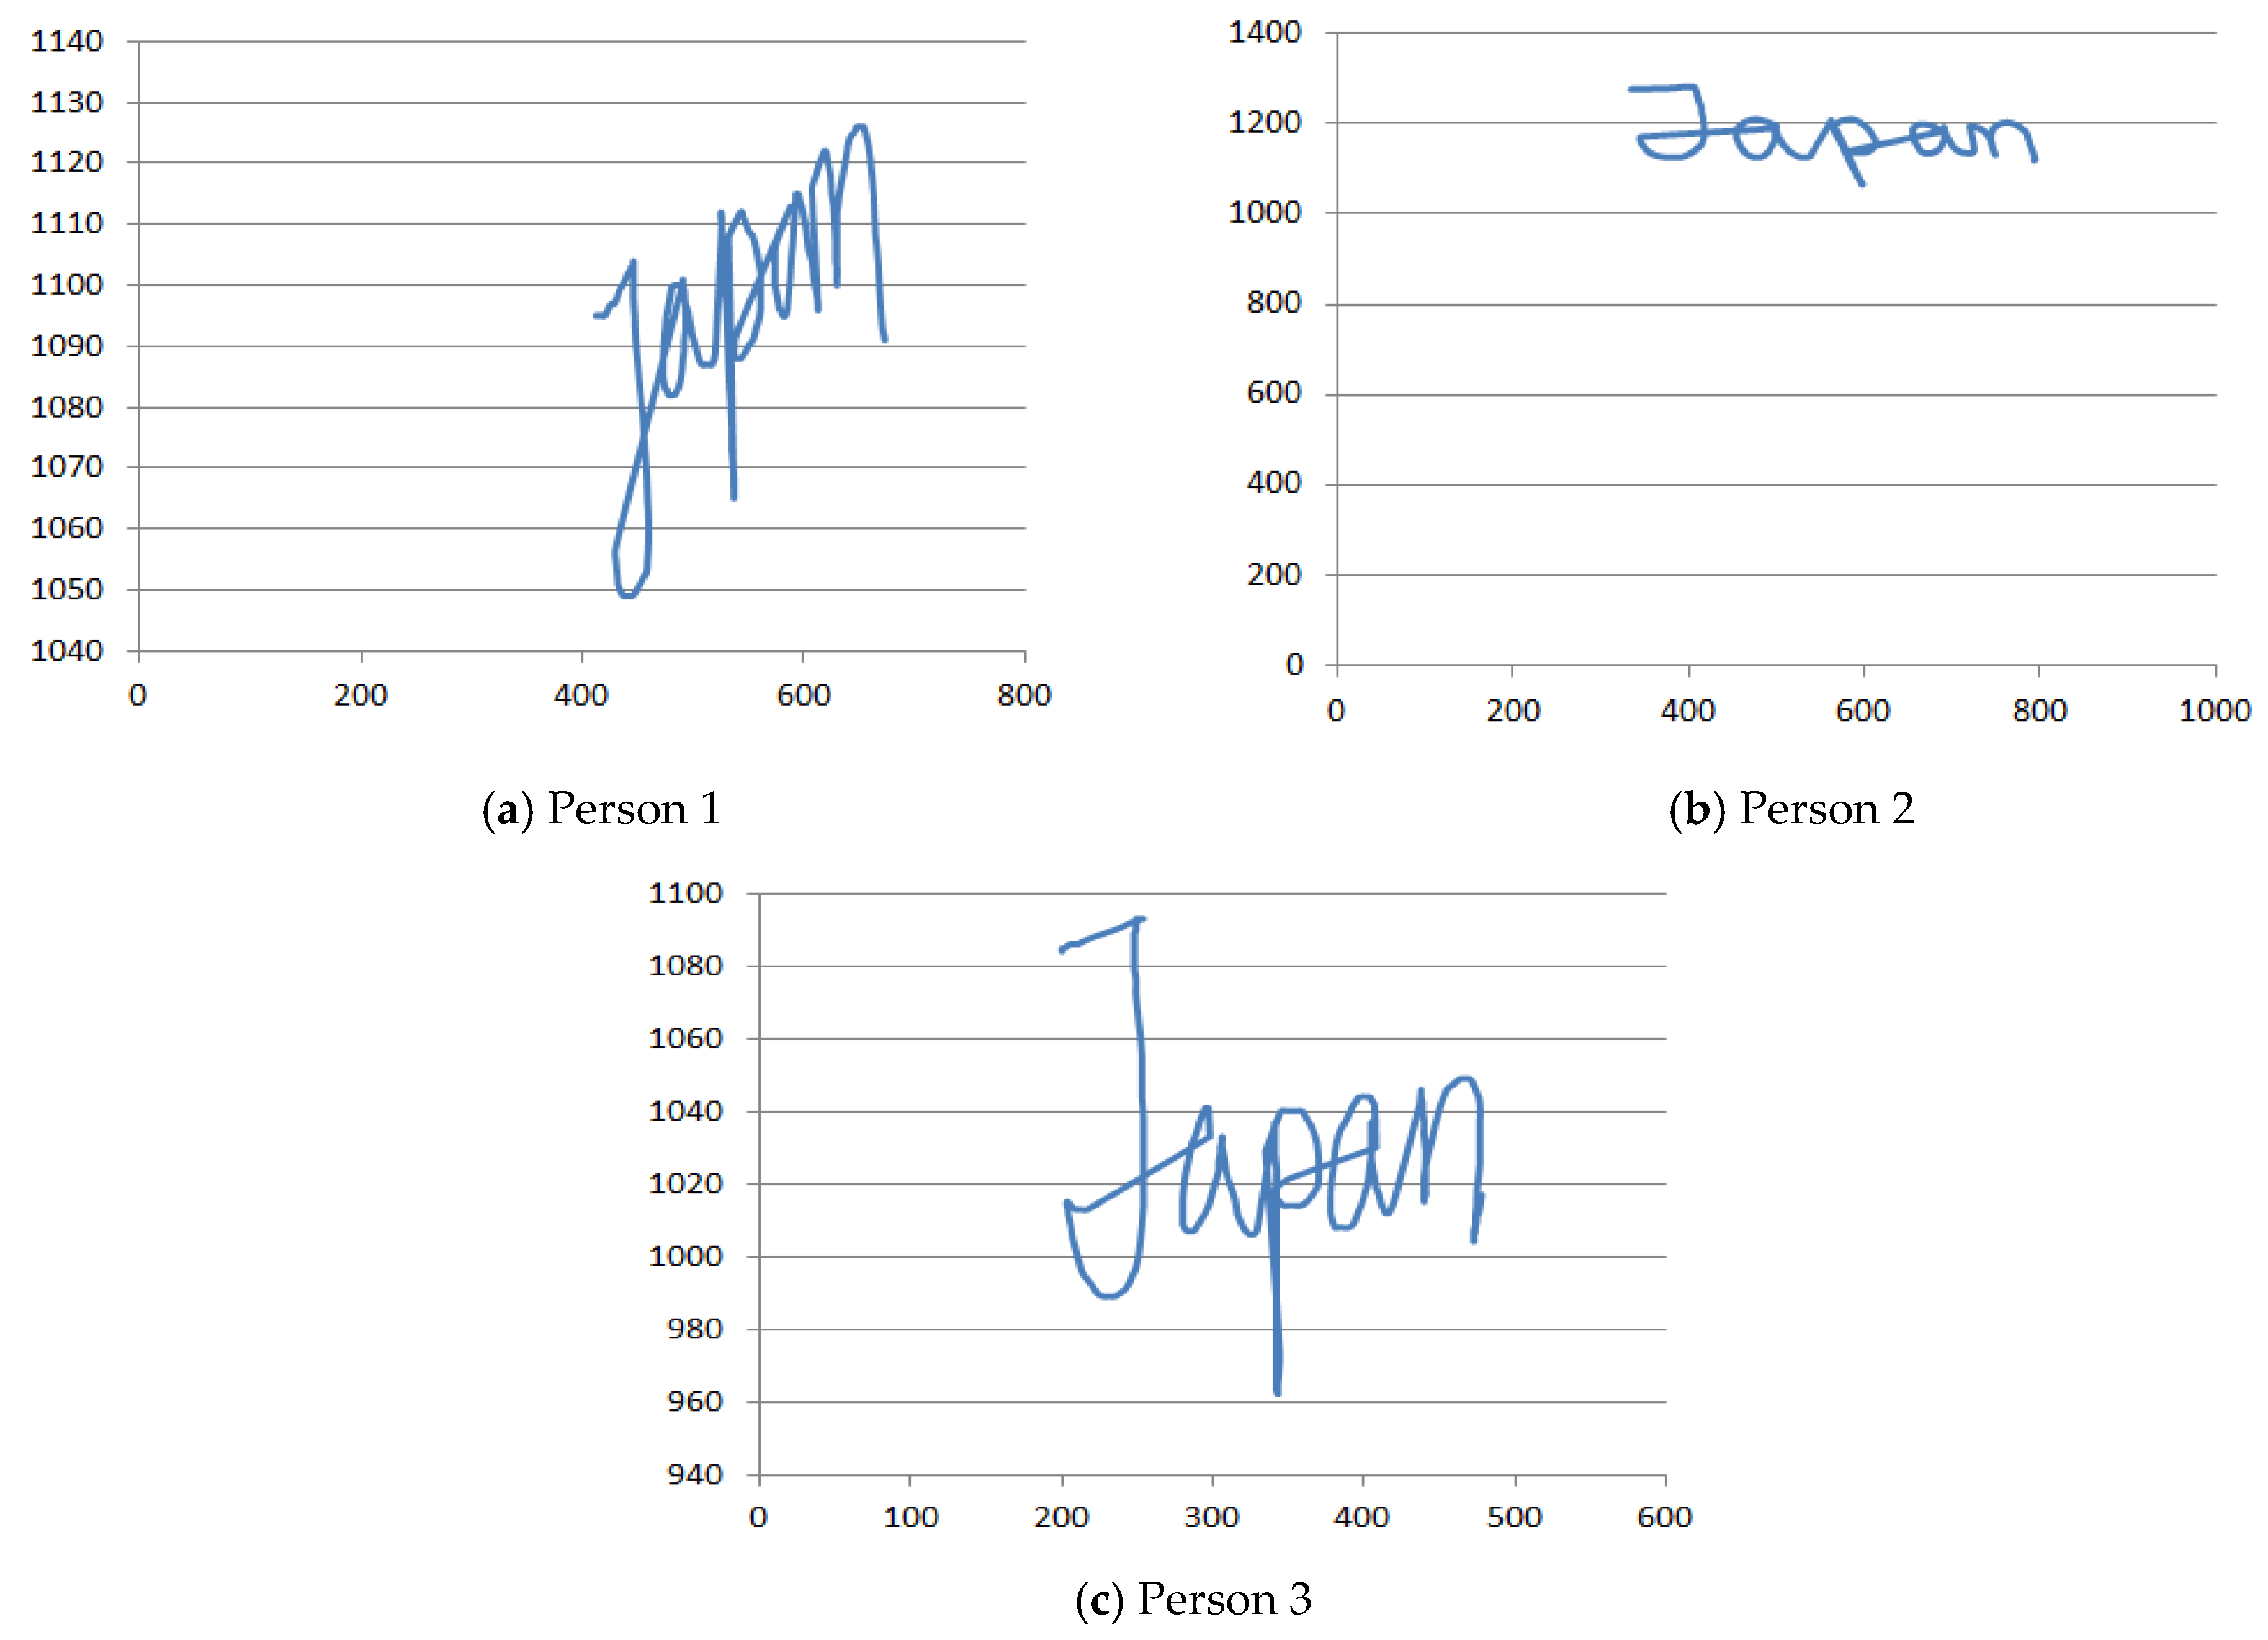
X-axis: The X-axis represents the writing position of a person from X-axis. We have taken a single keyword 5 times by the same person. It is noticed that the X-axis position value for each of the 5 cases is very close to each other which indicates that the X-axis value remains almost the same for each case for the same person. It ensures that the X-axis value is a promising attribute that can uniquely identify one person from another.
Y-axis: The
Y-axis indicates the writing position of a person from
Y-axis. This position is different from each other. Like the
X-axis position value, the
Y-axis position value remains very similar in each iteration of the same person. The range of
Y-axis value for some person is (1110–1201) and that of some other person has (1200–1350).
Figure 3 shows
x-axis and
y-axis values for different persons for the same keyword.
- 5.
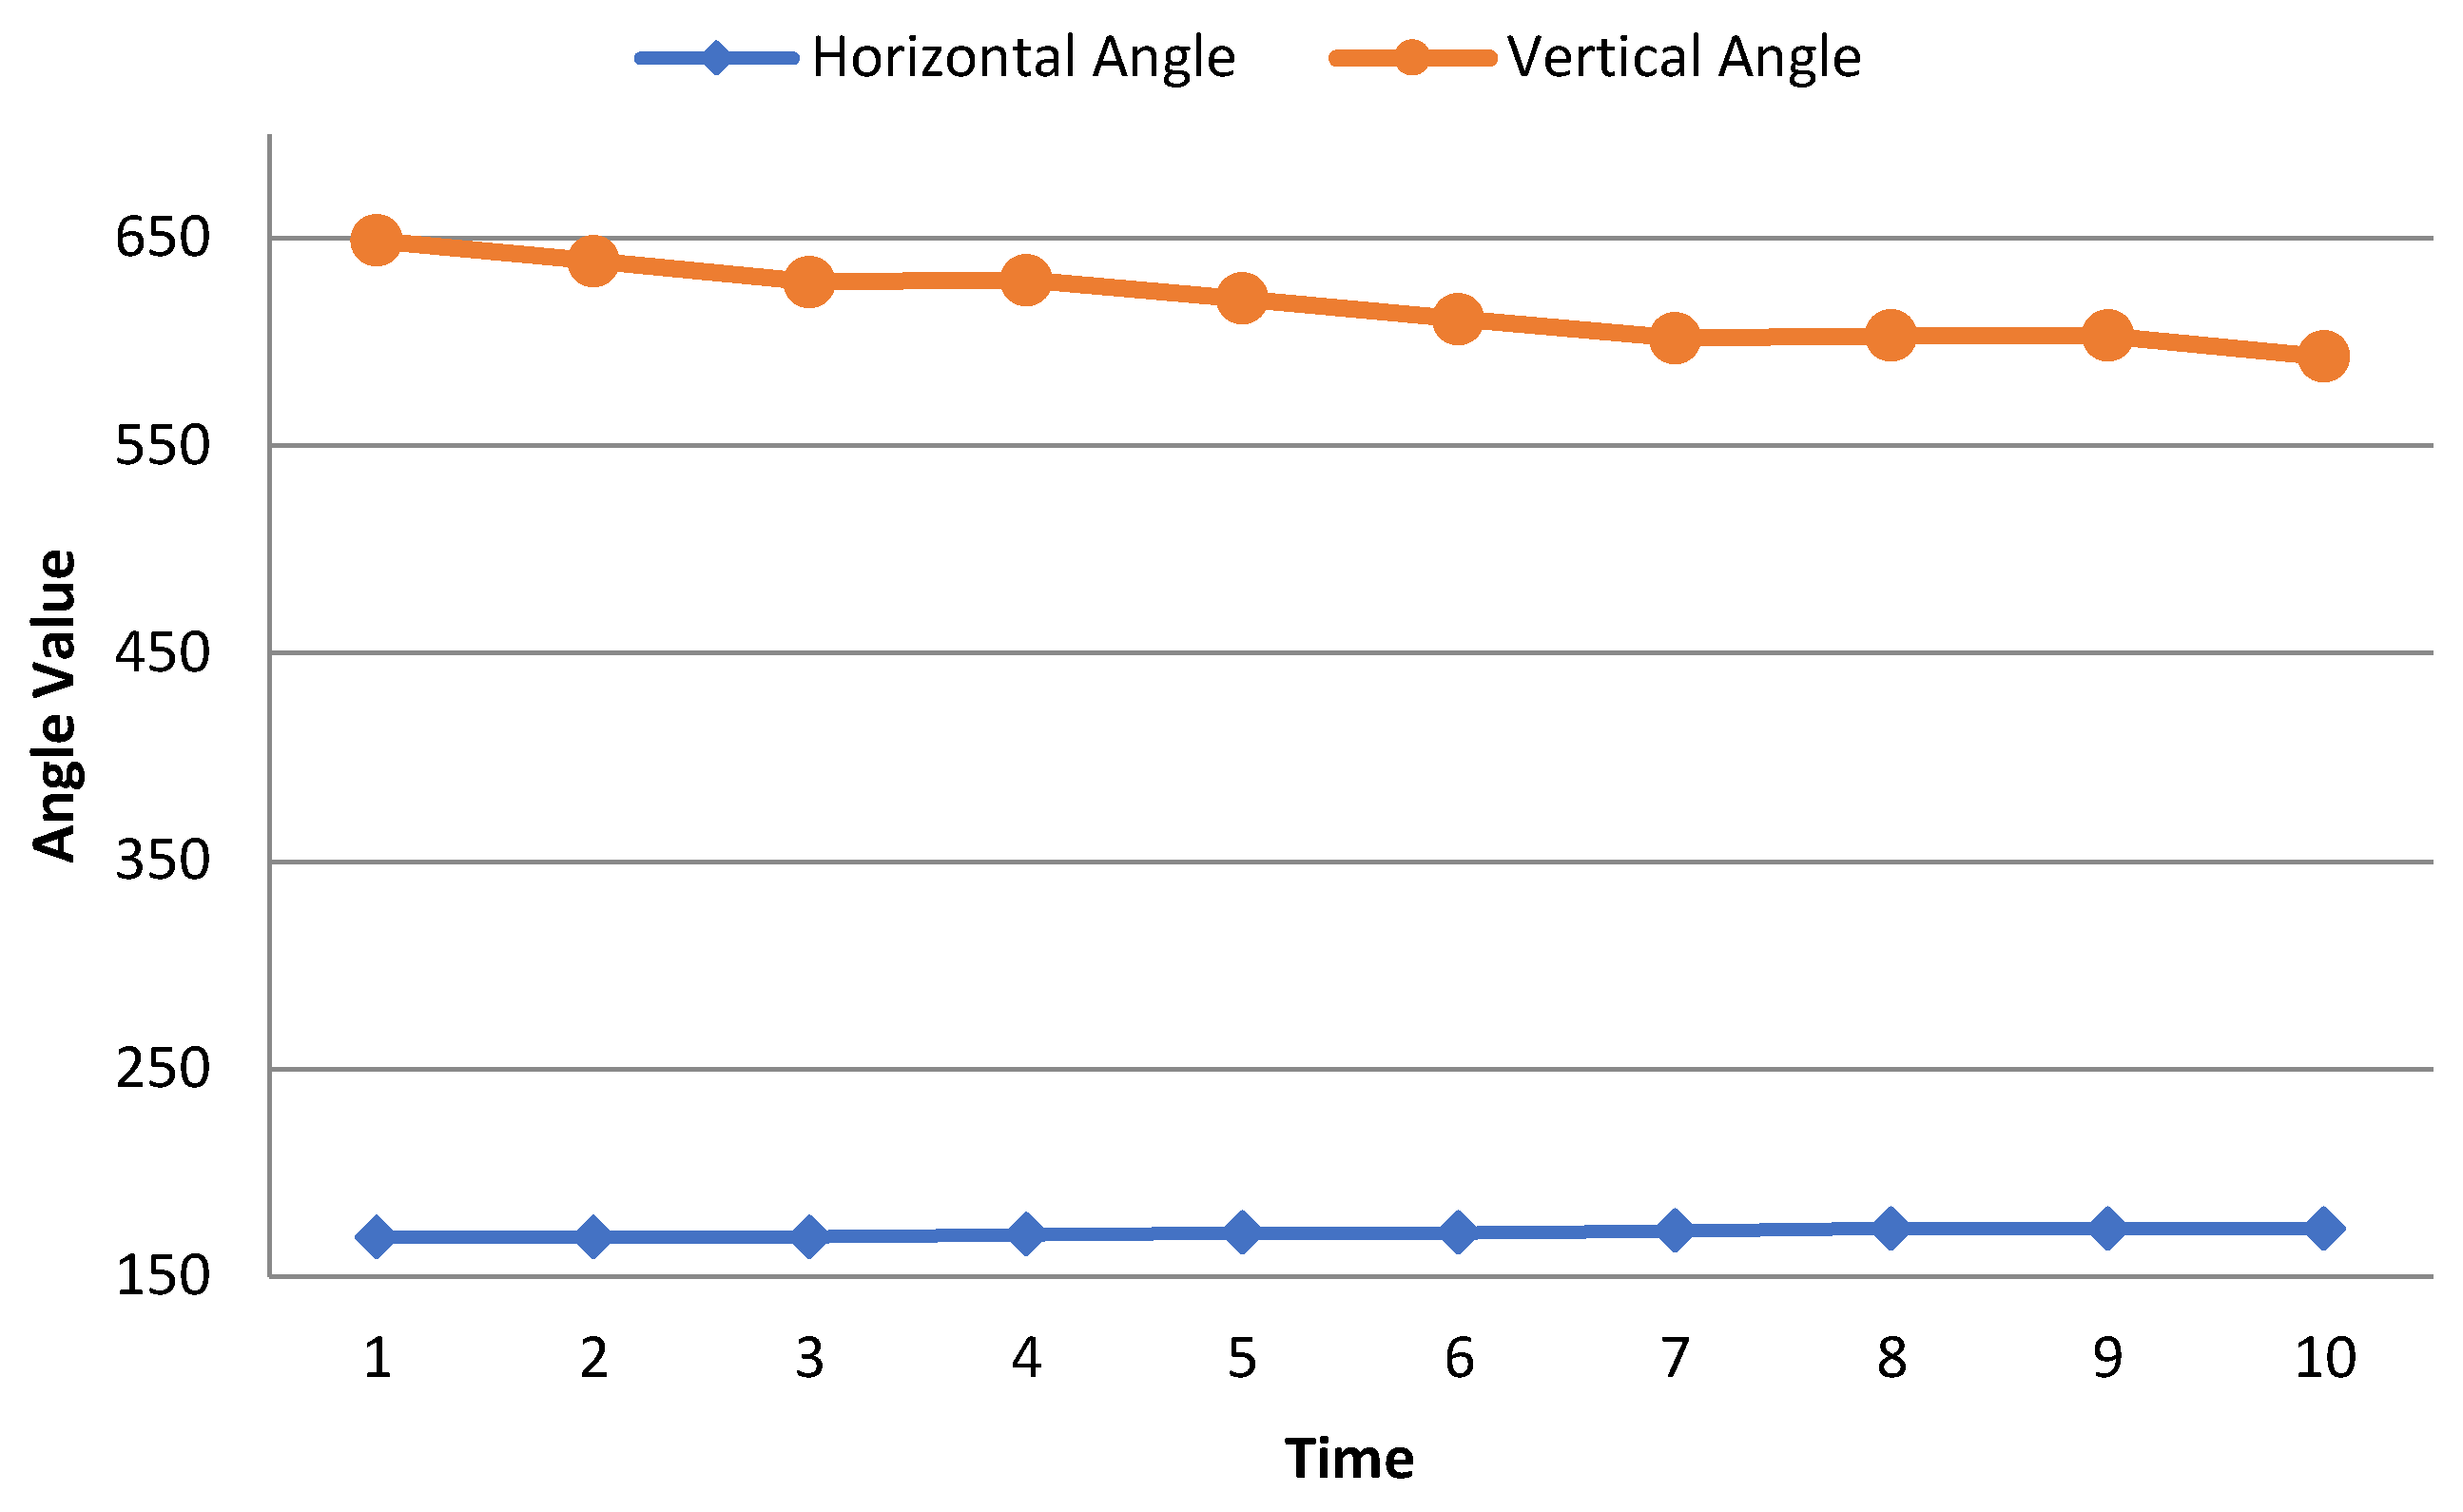
Horizontal Angle: The horizontal angle is the dimension of an angle within two lines, rising from the same spot. This angle is automatically measured by the pen tablet. To uniquely identify a user, the horizontal angle is one of the major attributes of our work. The maximum range of horizontal angles in the data set is below 500.
Figure 4 shows that the horizontal angle remains constant over time.
- 6.
Vertical Angle: The vertical angels are the opposite angels to each other after passing two lines. This is also a major attribute of this research work to identify a user uniquely. In the data set, the maximum vertical angle is below 800.
Figure 4 shows the horizontal and vertical angle of the same person which is kind of constant over time.
Figure 4 represents how the writing angle (horizontal angle and vertical angle) of a person is changing over time. Writing angle is an attribute of the writer’s handwritten data, this is not a model feature. From
Figure 4, we can see that the horizontal and vertical angles of a person remain constant over time which can be considered as a vital attribute for a person. From here, we extracted some kinematic and statistical features such as horizontal velocity, vertical velocity, average writing start velocity, average writing end velocity, etc. Then those extracted features are used in our model. Therefore, there is no direct relation of this attribute (writing angle) with the model.
3.3. Handwriting Data Preprocessing
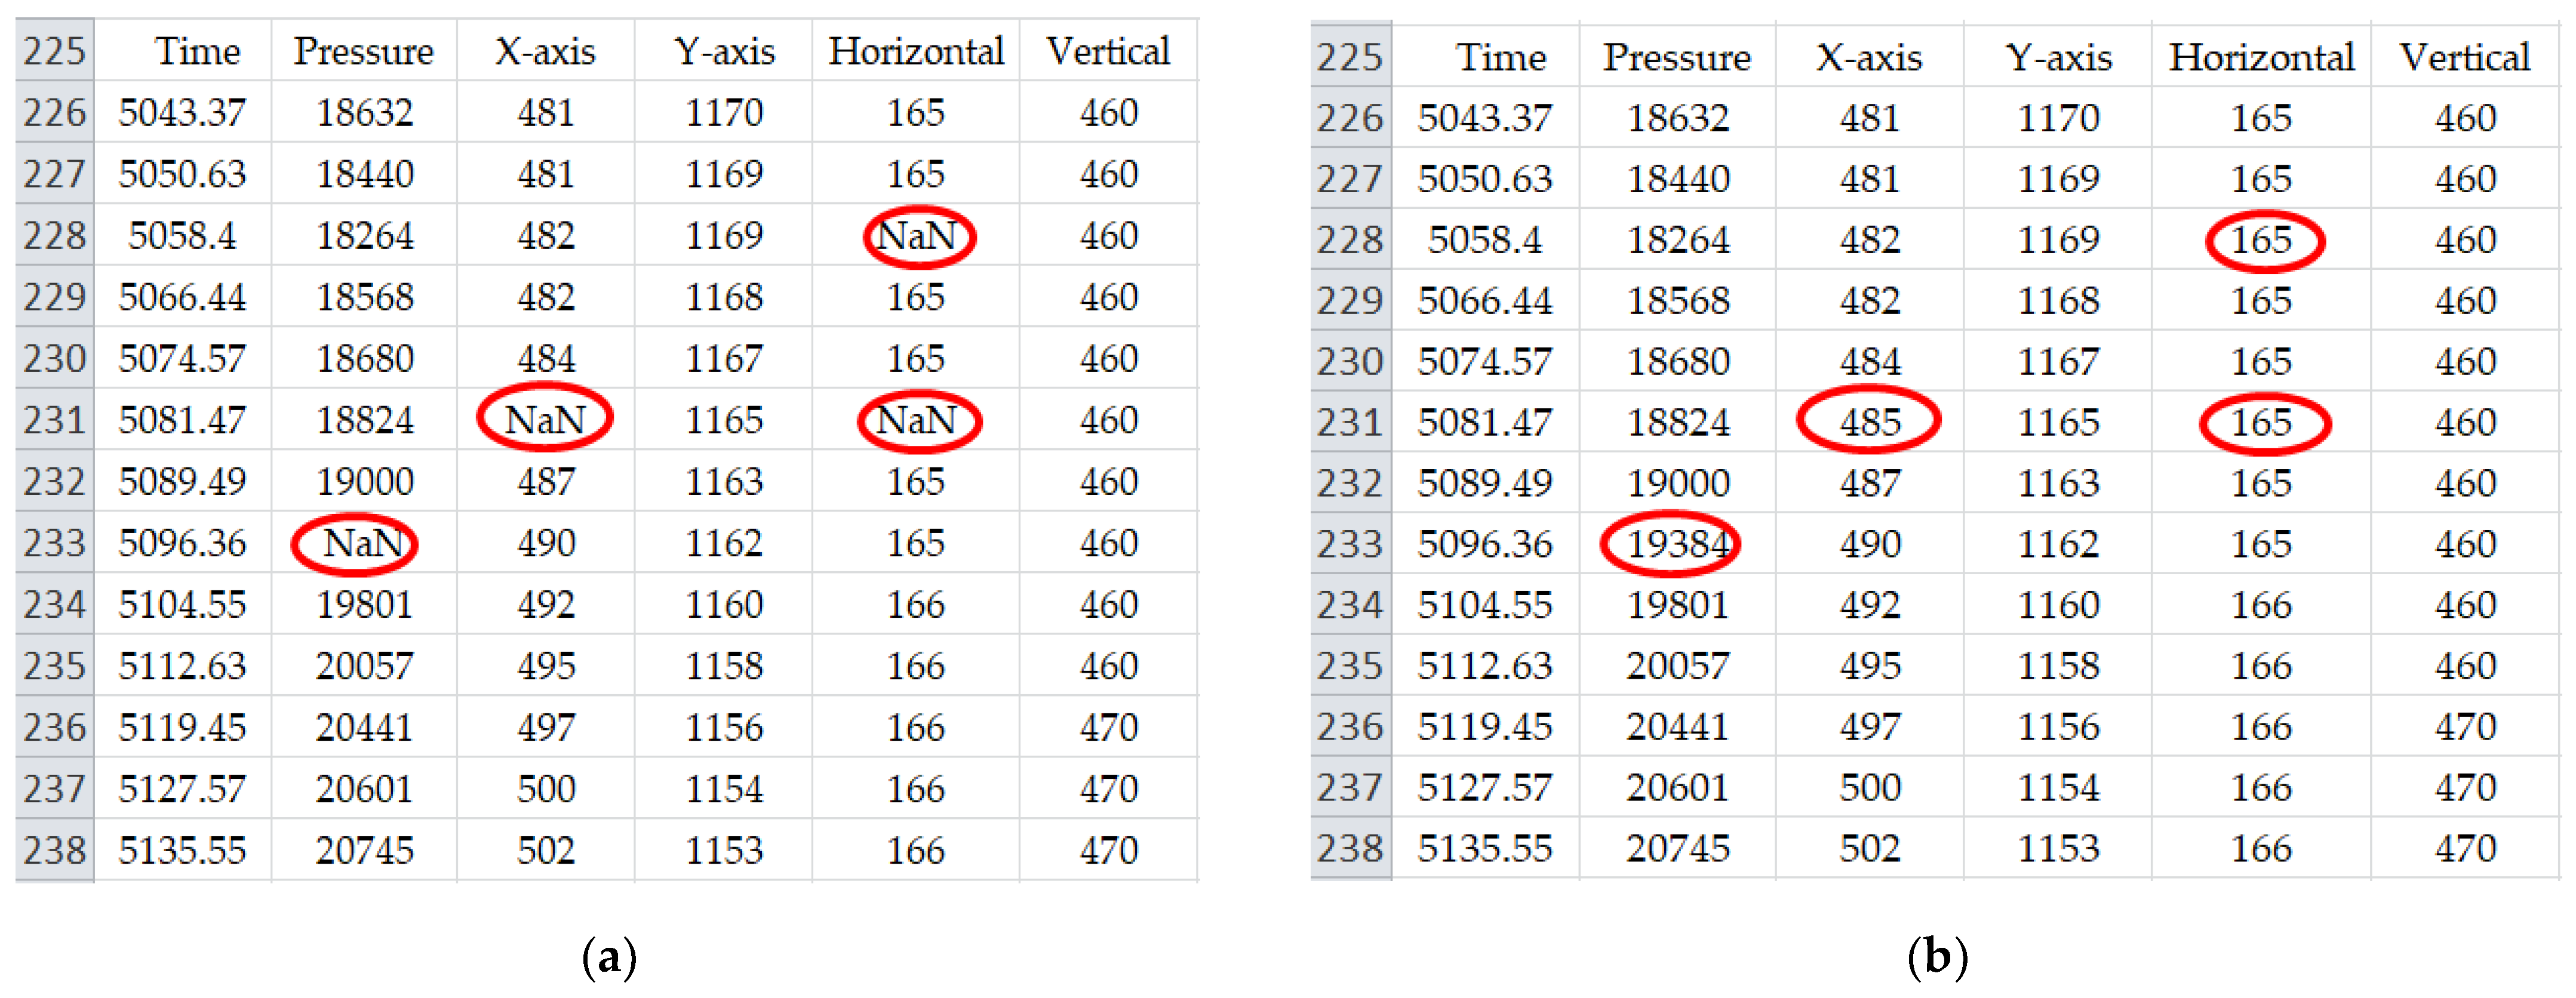
In this section, the dataset preprocessing techniques are described which have been utilized in the proposed method. To get a more balanced dataset and improve efficiency, some preprocessing techniques are applied in the proposed model. In our dataset, data in a row has multiple column attributes and each of the columns is supposed to carry a valid numeric value. However, there are some missing data values in our dataset. Due to the speed difference between the data capture device and data acquisition device the writing signal can be lost which may cause some null values. Because whenever the pen is detached from the tablet there can be a signal lost which may lead to some null values. Therefore, we have utilized the Imputation Function to fill up the missing values in a column attribute. We have filled the null values with the computed mean values of the same column attributes shown in
Figure 5.
There are various techniques for imputing the missing data values. However, in our research, we have utilized mean imputation to replace the missing data values. This is because; mean imputation is a very simple and popular technique to understand and to apply with the basic knowledge of statistics. It helps us to make our general ML audience to understand our process. It calculates a statistical value for each column (such as a mean) and replaces all missing values for that column with the immediate statistics by calculating the data close to the missing values. Besides, mean imputation keeps the full dataset while not reducing the sample size. And multiple imputations for missing data allow us to obtain good estimates of the standard errors. In addition, our dataset consists of numerical data rather than categorical data, and mean imputation often shows good performance for numerical data values. On the other hand, the ML-based imputation process requires heavy learning process which increases the computational overhead. Thus, to tradeoff the performance as well as computational cost, we used mean imputation in our proposed model.
During the data preprocessing phase, we have also utilized Flatten Function for converting the two-dimensional data into one dimension. Flatten is a useful technique for converting 2D data into 1D. A Flatten function reshapes the dataset to have a shape that is equal to the number of elements contained in the file. It makes our computational process simple and easier to extract the required feature.
3.4. Feature Extraction
The detailed feature extraction process is described in this section. The mathematics behind statistics plays a vital role in data analysis. The feature extraction process can extract some specific parameters from a person’s handwriting that can discriminate it from others. The features are extracted to uniquely identify each individual from his/her handwritten dataset. Handwriting is quite an unstable process, and writing styles also vary. Similarly, there is a great variety of parameters involving environmental, psychological circumstances within the handwriting of one person. For feature extraction, different statistical and kinematic features are extracted from the parameters of pen tablet sensor signals.
3.4.1. Statistical Features
Statistics is an effective mathematical technique to perform technical data analysis. Statistics help us to get deeper and meaningful information along with the graphical visualization of data. Every person has unique feature values. Sometimes some feature values are very close but not exactly the same to each other. These features are genuine and unique to identify a writer. Here, we consider both time domain and frequency domain statistical parameters. For this, some statistical feature has been extracted from the sensor signal of handwriting dataset.
Table 2 shows total of 20 features along with their corresponding statistical formulas. A brief explanation of these statistical features is given below:
The mean is commonly known as the average which is the total of all the data values divided by the number of data points. We can understand the standard level of attributes from the mean value. Here, mean represents average value for writing attributes such as angle, pressure, axis value, etc. When the data is sorted in ascending or descending order then the middle value is known as median. The median is sometimes used as opposite to the mean when there are outliers in the sequence that might skew the average value.
Standard deviation (SD) is a measure of how a set of data is spread out. A low SD states that the data is closely clustered around the mean or average while a high SD indicates that the data is dispersed over a wider range of values. Standard deviation is used to realize whether a specific data point is standard or unusual.
Skewness is a measure of the degree of asymmetry of a frequency distribution. In our research, its value of skewness became as negative, positive or zero. A positive value indicates right-skewed, a negative value indicates left-skewed and zero-skewed indicates symmetric distribution. It helps to understand on which side of the data we need to work. Skewness is measured by using the average of attributes, and their standard deviation. Kurtosis is a measure of the peakedness of a distribution. Kurtosis generally represents a positive value. It is used as a measure of error or risk. A large kurtosis is represented with a high error and low indicates low error. Variance is used to determine how well the mean represents an entire set of data. In our research, the variances of several attributes are measured such as for pressure, angle, time, etc. Standard deviation and variance are related to each other.
The peak value represents the maximum value of an attribute. Impulse Factor is measured by using the average of attributes and their peak value by using a statistical formula. Margin Factor depends on the peak value and Statistical Reasoning Assessment (SRA). Maximum value is measured for the maximum data boundary level for every attribute. Minimum value is measured for minimum data boundary level for every attribute. These levels aid us to understand the attribute levels. Peak to peak value is measured by subtracting the Maximum attribute value to the Minimum attribute value.
3.4.2. Kinematic Features
In our experiment, for better classification, 10 different kinematic features are extracted as shown in
Table 3. The
X-axis value has been measured by the difference of the
X-axis’s value by different variations of the period. We measured the
x-axis velocity (horizontal velocity) by subtracting the
x-axis’s value of
Xn from that of
Xn−1. The mathematical formula of
X-axis velocity is:
where,
N represents the length of the input data of each person,
is the elapsed time after the start of the test,
is the writing pressure,
is the positional coordinate in the horizontal direction, and
is the positional coordinate in the vertical direction. The
Y-axis velocity (vertical velocity) has been measured from its
Y-axis value difference with its time variation at each iteration. The average velocity has been located using the length and square root of the velocity of the
X-axis and
Y-axis. The mean pressure has been calculated through the mean of writing pressure. The peak pressure has been calculated from the highest pressure which is greater than the mean pressure. The peak pressure is different from person to person.
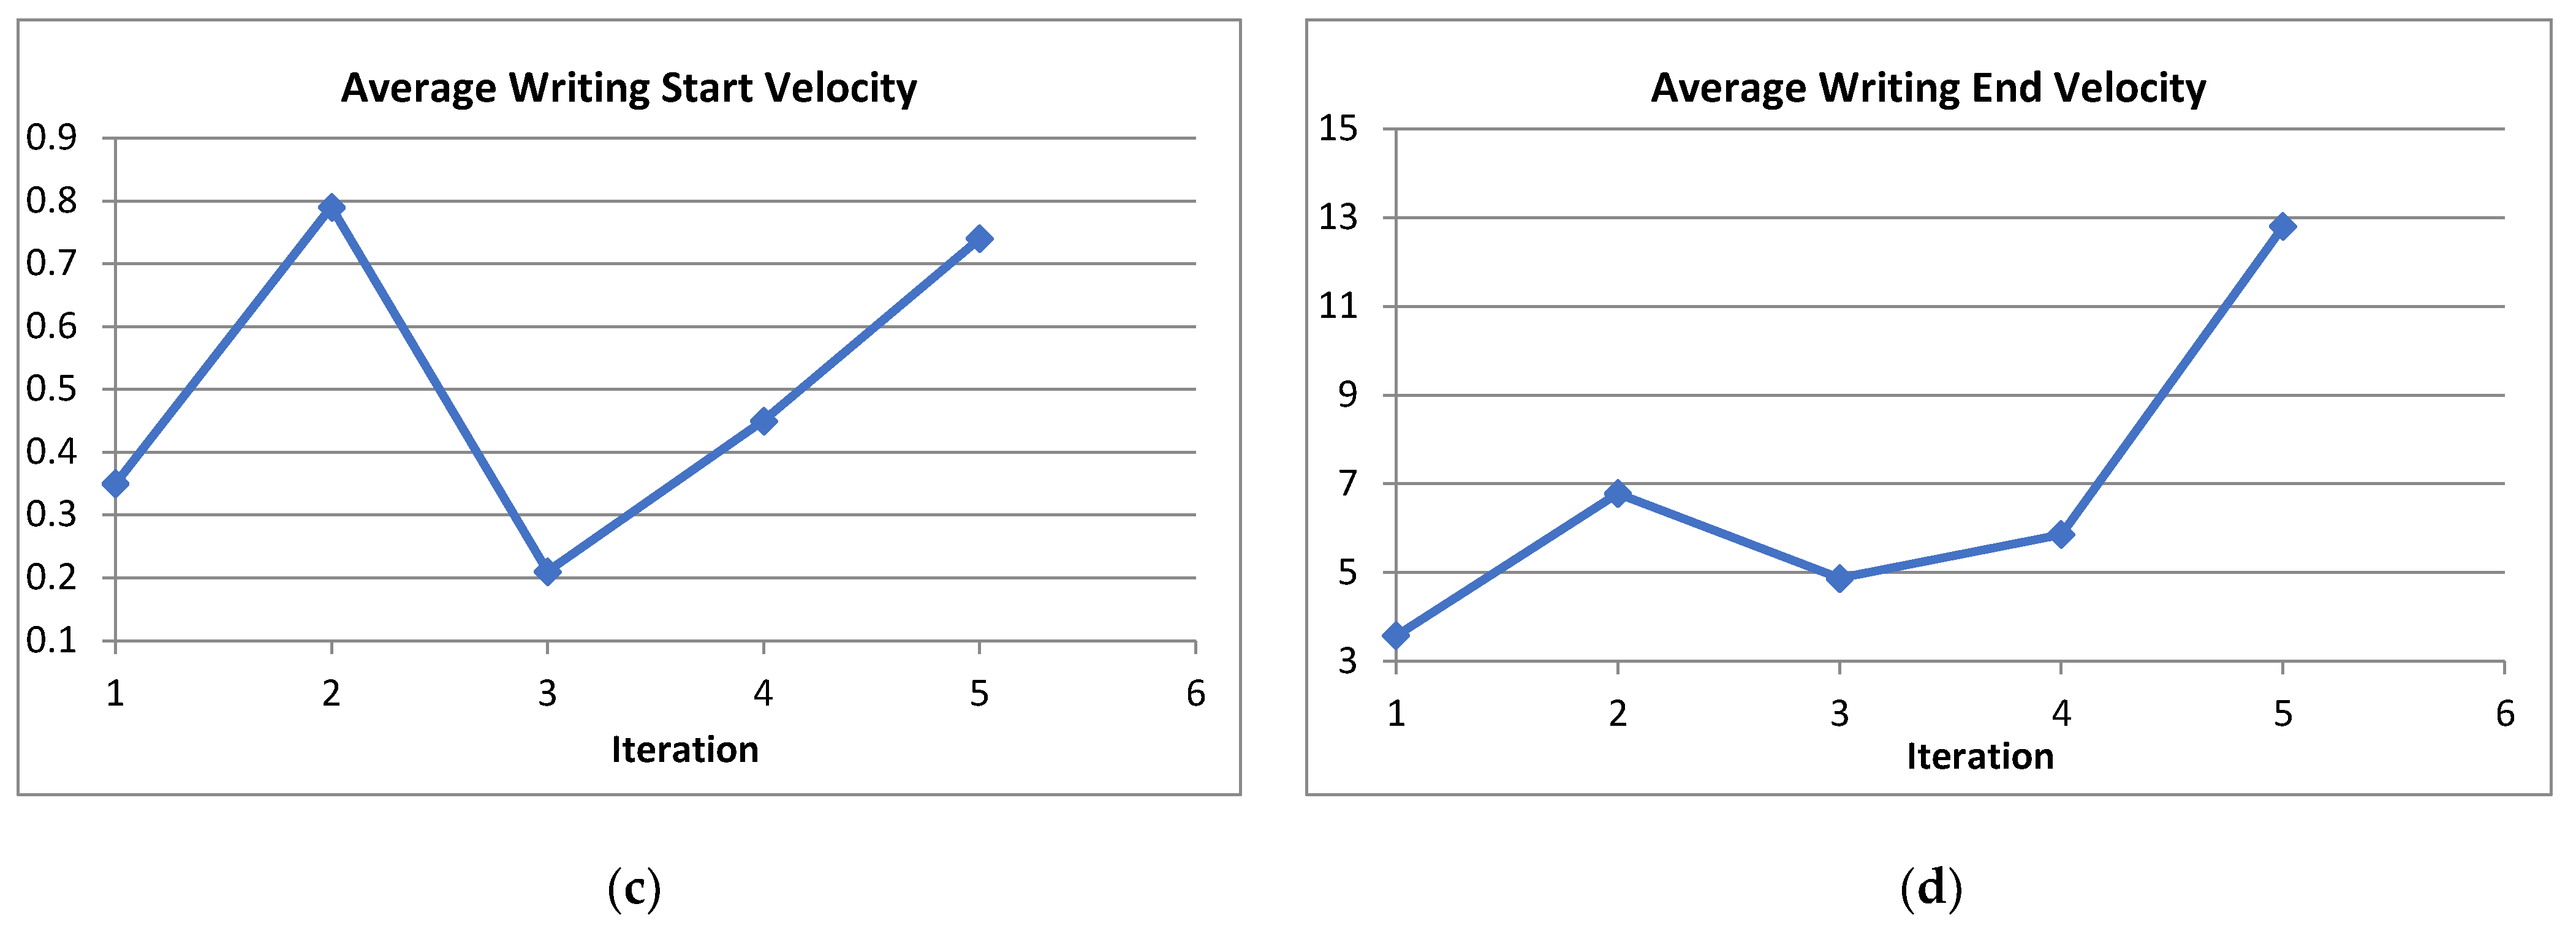
Writing Velocity is the rate of change of the position of the pen tip over time. The writing velocity has been measured from horizontal direction and vertical direction. The average start position is the rate of change of the start position of the pen tip over time. The average end position is the rate of change of the end position of the pen tip over time. The horizontal velocity and vertical velocity of each person are not changing much i.e., it also remains constant for each individual.
3.5. Optimal Feature Selection
In our experiment, 20 statistical and 10 kinematic features are extracted from the handwriting sensor signals for each person. However, all the features are not equally important to identify a user or writer. Thus the training algorithm should be trained focusing only on the important features while ignoring the non-vital features. Hence, in our experiment, we introduced a hybrid feature selection algorithm to reduce the high dimension problem of the original feature set and to achieve higher classification results.
3.5.1. Hybrid Feature Selection Model
The feature selection algorithm consists of two parts. The first part is a filter-based approach. It uses sequential forward floating search (SFFS) where the feature subset evaluation process does not depend on the classification algorithm. The second part is a wrapper-based approach. This part takes the feature sets derived from the filter-based approach as input and evaluates the best feature sets among them.
The whole process of optimal feature selection is shown in
Figure 6. The filter-based feature analysis is an iterative approach that is conducted by SFFS. Initially, 25 users’ first and second datasets are applied for the training and validation respectively. The dataset is again randomly splitted into two equal parts for the training and testing process. The first equal part is then again divided into two equal parts to use in the filter-based approach. For testing in the wrapper approach, the second equal part is used. SFFS is applied in the first equal part where the process iterates five times and brings out the 10 sub-optimal feature sets. This process is repeated for the rest of the sensor data. Then the selected optimal feature sets are forwarded to the wrapper method. The wrapper method analyzes different optimal feature sets by using different machine learning algorithms to evaluate the best features.
The SFFS algorithm (Algorithm 1) that we utilized in our algorithm is given below:
| Algorithm 1: SFFS Algorithm |
Input: The set of all features X = {x1, x2, …, xn}
Output: A subset of features Y = {yi|i = 1,2,3,…, n; yi X}
Where, n = (0,1,2,…, m)
Steps:
1. X0 = {Ø}
2. Select the best feature Y+
Update: XN+1 = XN + Y+ = +1
3. Select the best feature Y−
4. If I(XN − Y−) > I(XN); [(Y) = criterion function]
Then, XN+1 = XN − Y−; N = N + 1
Go to step 3. |
For training and testing of the second equal part of the dataset, the SVM algorithm is applied in the wrapper-based approach. Then the 10 sub-optimal features which are obtained from the filter-based approach are forwarded to the SVM machine learning algorithm to find the best feature sets in the wrapper approach. To show the stability of our proposed model of writer identification, we have done the feature selection procedure and the classification process using two additional machine learning algorithms as logistic regression (LR) and random forest (RF) classifier. For that, we repeated the above procedure for feature selection with LR and RF, and also the evaluation is done using the same classifier algorithm. From the experimental evaluation, it is observed that the performance of our proposed model with LR and RF is also satisfactory which makes our claim stronger. However, among the 3 machine learning algorithms (SVM, LR, and RF), SVM gives us the best feature sets from the 10 optimal feature sets in terms of classification accuracy.
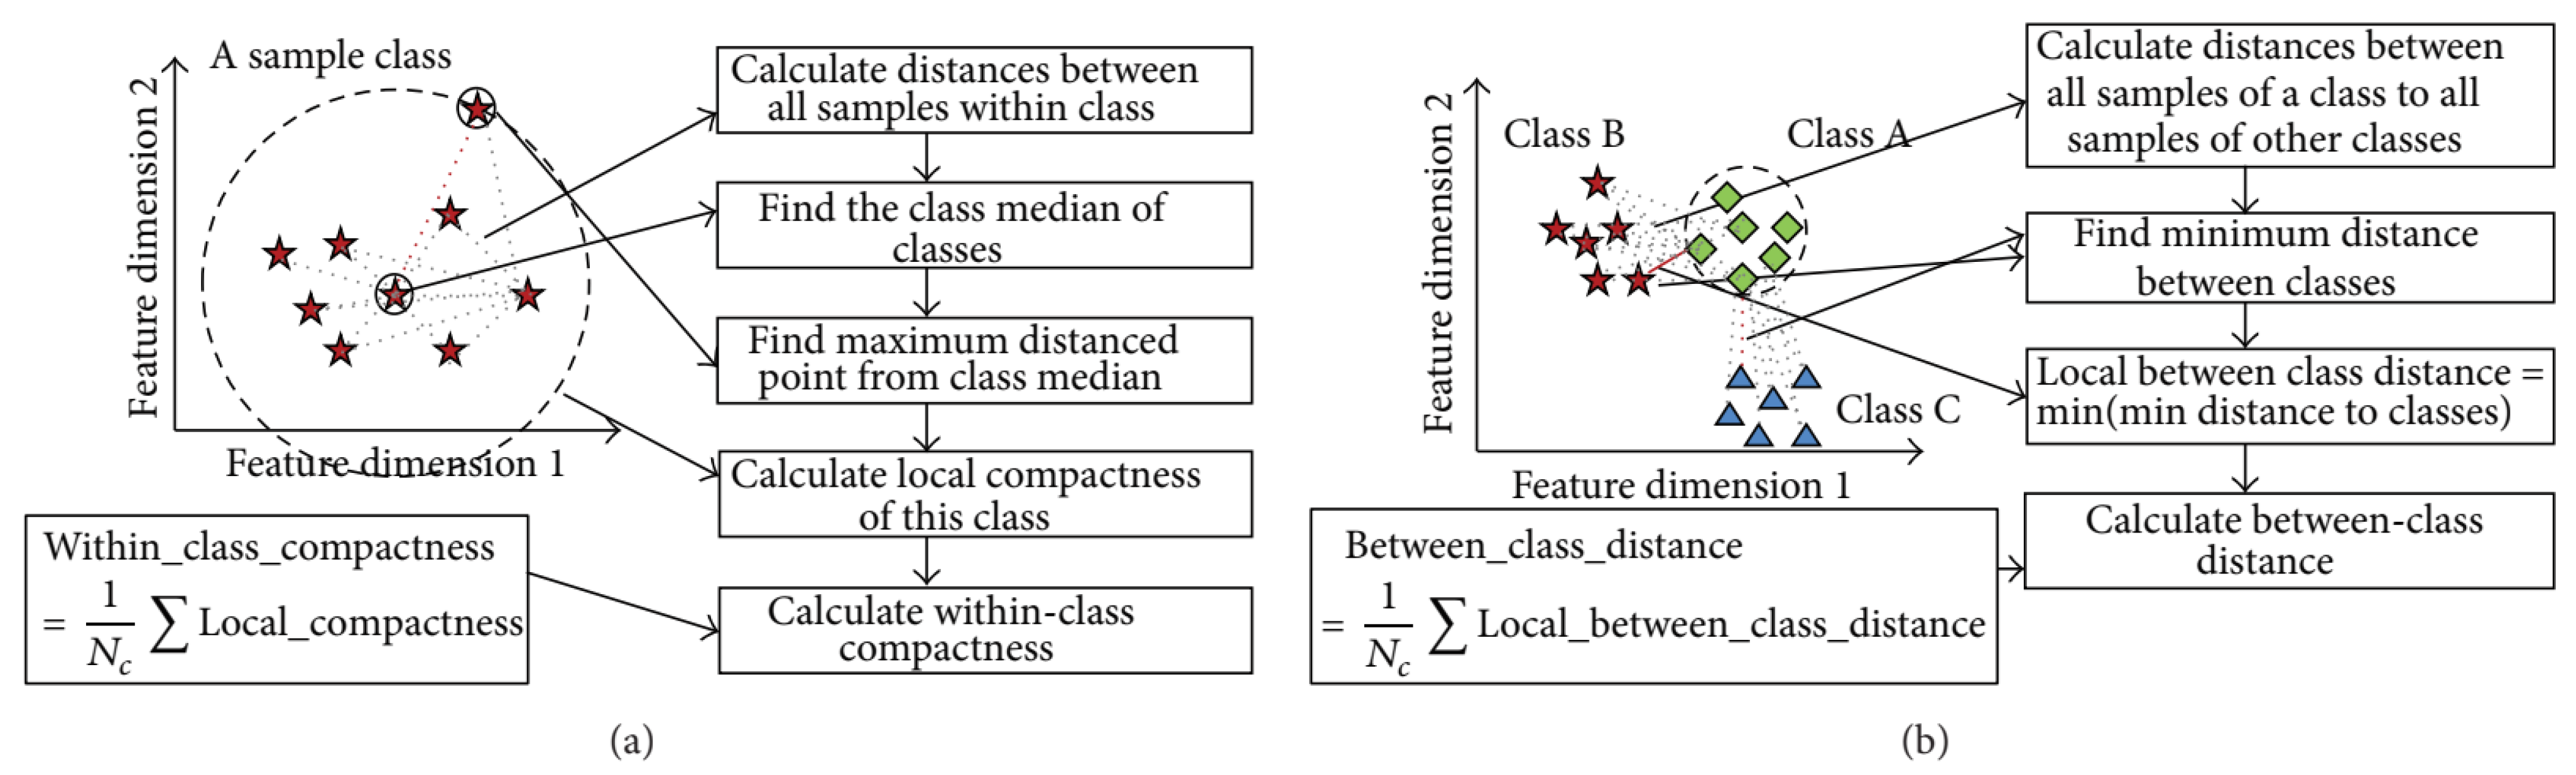
3.5.2. Objective Function Based on Discriminant Feature
In this research, the proposed hybrid feature selection approach is carried out in two parts, i.e., filter approach and wrapper approach. In the wrapper approach, the evaluation process is based on a classification model, which is very much efficient but computationally expensive. Thus, the filter approach is used before the wrapper approach to minimize the cost and optimized the performance. The filter approach selects some optimal subsets of features using SFFS with the help of an efficient feature subset evaluation model. In this research, we adopted Discriminant Feature Distribution Analysis Based Objective Function proposed in [
27] as a feature subset evaluation model. In this evaluation model, the power of discrimination of features are measured by calculating the within-class compactness and between-class distance. The distance measurement has a significant role in feature analysis and machine learning techniques. There are several criteria to measure distribution of features, i.e., distance, correlation, entropy, information gain, and others. However, distance measurement is one of the most used techniques in data science and machine learning. Several machine learning and classification models are depending on distance measurement, i.e., k-NN, k-means, self-organizing map (SOM). Many kernel-based algorithms also use distance measurement, such as, SVM uses the distance measurement for classification. Also, the distance measurement expresses the geographical distribution in high dimension feature space efficiently. Among the several distance measurements, Euclidean distance is mostly used technique. Thus, in this measurement process, the Euclidean distance is considered to evaluate the distance of samples in a class and/or other classes. The Euclidean distance is formulated as Equation (2), where
x and
y are two points,
n is the number of features, and
xi and
yi are features values of points.
To calculate the within-class compactness, firstly, the class median is determined based on the distances of all points of a class. After that, the maximum distance is calculated from the class medium to the farthest point of a class. Finally, within-class compactness is calculated by averaging all class compactness of all classes. To calculate the between-class distance, the minimum distance between two classes is calculated from all distances between each point from one class to each point to the other class. The minimum distance of two classes is considered as class separability. The overall between-class distance is calculated by averaging all class separability of different classes. Finally, the evaluation/objective value is calculated as Equation (3).
Figure 7 presents the process of calculation of objective value.
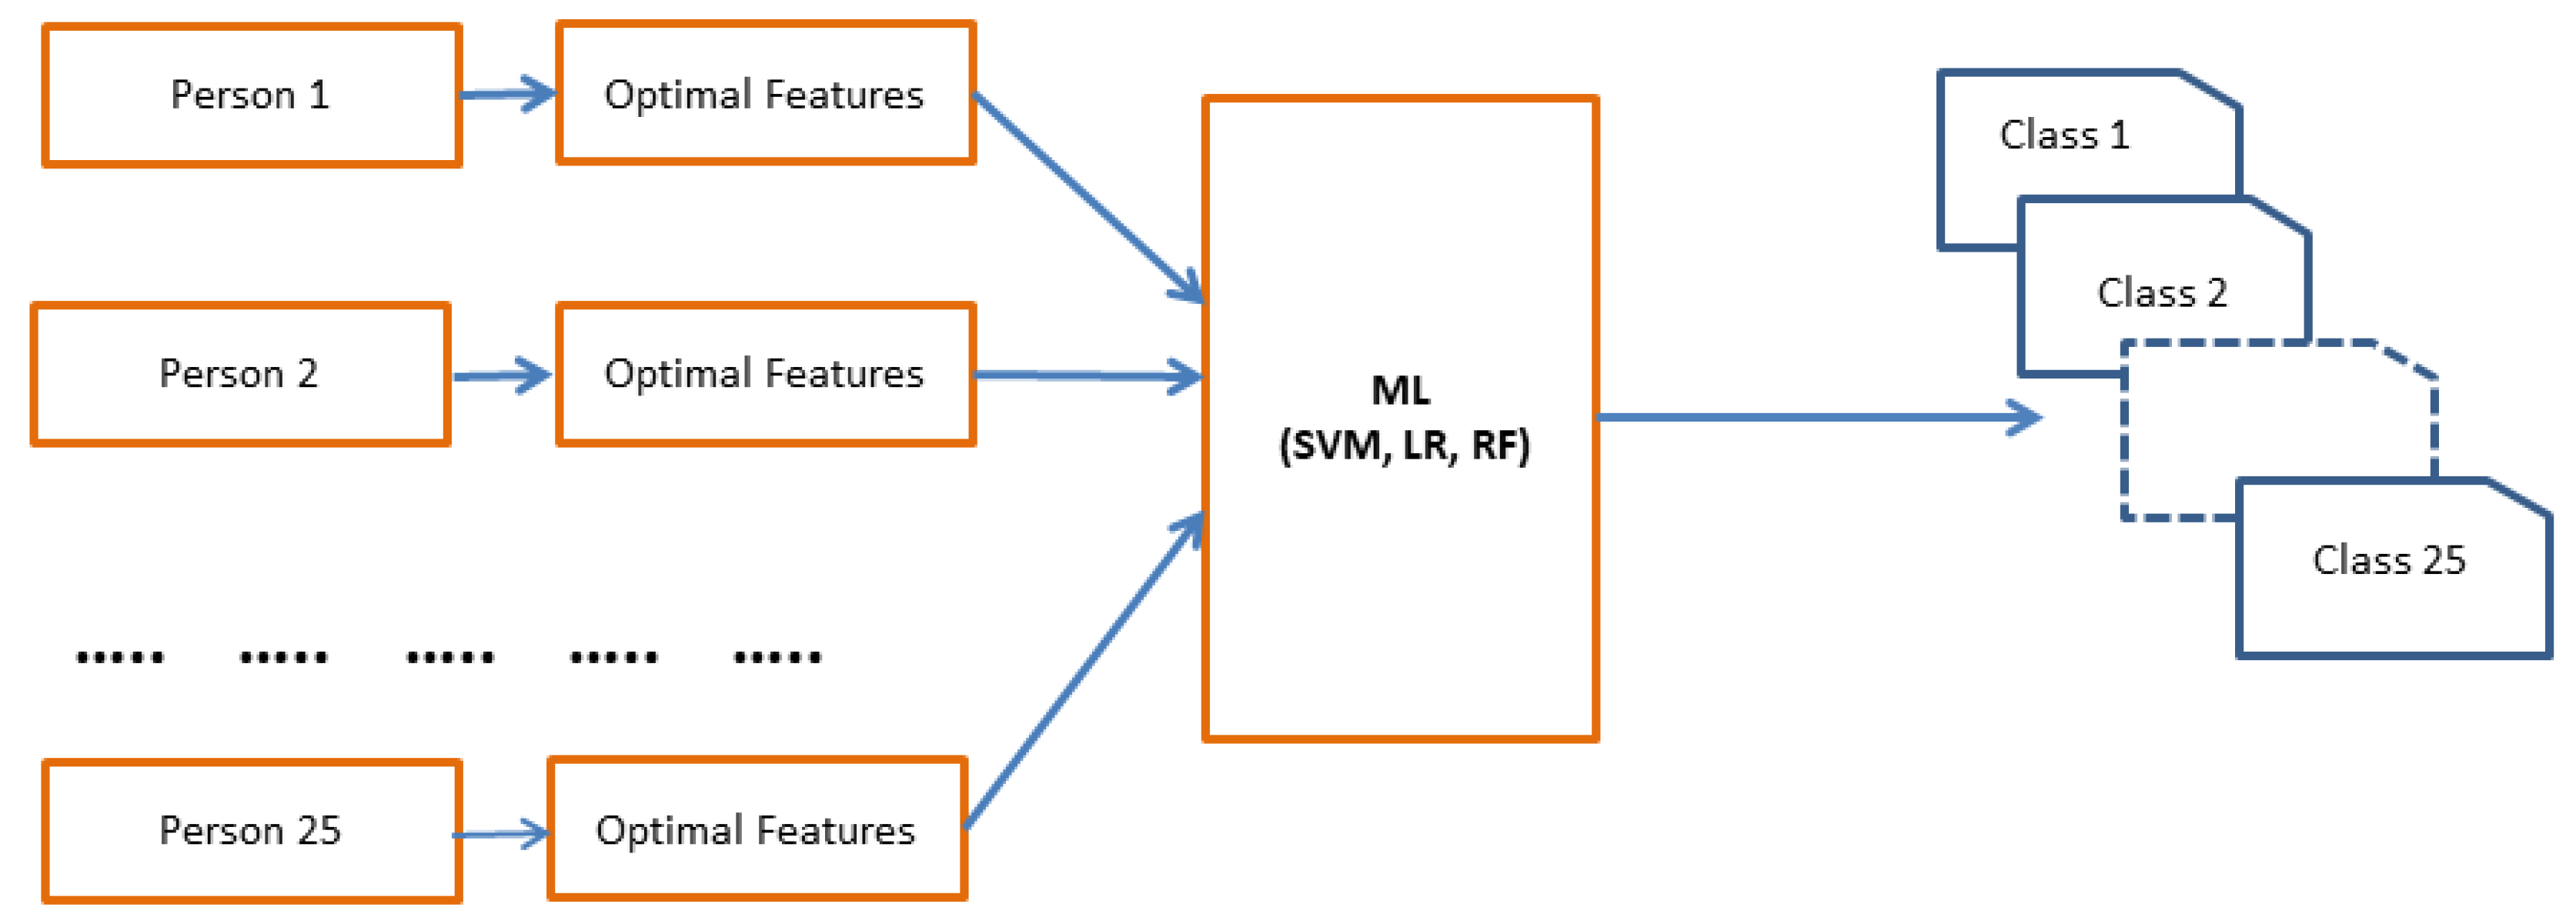
3.6. User Authentication Using Classification Algorithm
In this section, the user authentication process using different classifier models (SVM, LR and RF) is described. Our main goal is to make our system faster and real time system for the future. As we know Deep learning is very efficient and provides better accuracy. But to make a proper deep learning model, we need huge amount of data. However, in this type of single person identification or authentication system, huge amount of person data collection is complex. In this research, we are working with one dimensional single data and our dataset is limited. Hence, if we can extract the good or optimal features which can classify the classes very well, then we can use less computation overhead classifier to get a good result. Considering this point or concept in mind, we chooses the less computational classifiers (SVM, LR, RF) which can classify the classes very well with less amount of data in the training process. If we can provide good features from the data, then these classifiers can train the model very well and can provide good and stable accuracy result with less computational overhead. To check the robustness of the proposed model, in the authentication phase, the selected optimal features are validated using different classifiers to identify the writes.
Figure 8 represents the user authentication process.
A short description of the 3 ML classifiers is given below:
Logistic Regression (LR): The logistic regression is one of the widely used linear and statistical models for discriminant analysis. Logistic regression can occasionally lead to outperforming other sophisticated nonlinear models such as ensemble learners or support vector machines due to simplicity and interoperability [
35].
For a binary classifier, the logistic regression model is expressed by summing over the linear combinations of input features and a corresponding weight (
w) plus a bias term (
b) for each instance as shown in Equations (5) and (6).
Random Forest (RF): Random forests is an ensemble learning algorithm for classification, regression, and other tasks that operates by constructing a multitude of decision trees at training time. RF is comprised of n collections of de-correlated decision trees. It uses multiple trees to average (regression) or compute majority votes (classification) in the terminal leaf nodes when making a prediction [
35]. The following equation is needed for the calculation of RF model:
Support Vector Machine (SVM): SVM is an efficient and popular and machine learning technique which is widely used for classification due to its simplicity and computational efficiency. Different kernel techniques are there for SVM. The RBF non-linear kernel is formulated as Equation (8).
where k(sv
i, sv
j) is the kernel function, and sv
i and sv
j are the input data, and parameter σ is a set by the user. The σ used here to determine the width of the kernel function k. Note that, if σ values are small, then overtraining may occur. Again, if σ values are large, then the basis function puts an oval around the points without describing their shapes or patterns [
36].
4. Experimental Result Analysis
For the experiment of this research, initially, we have collected pen-tablet handwriting samples from 25 different persons of age 19~40. Users in the experiment were given 10 different keywords (Japan, Machine Learning, Tokyo, Hello World, Fukushima, Aizu University, Basic Research, Computer Vision, Pattern Processing and Thank You) to write using the pen-tablet devices. After data collection, for labeling the training and testing dataset, we have separated our dataset into two portions. A total 60% of the dataset is separated for training the system and 40% of the dataset for testing purpose. In our research, during data collection, each key word is written 5 times by each person. Thus from (10 key words × 5 times) = 50 data samples of one person, total (10 × 3) = 30 data samples are randomly selected for feature selection and training process and rest of the (10 × 2) = 20 data samples are selected for testing process. The same procedure is repeated for the 25 classes. Thus a total 1250 writing samples and 25 classes are used in the experiment. After data collection, the test dataset and train dataset kept separated. The test data is not mixed up with the training data.
Table 4 presents the summary of dataset labeling.
All the experiments are implemented on a laptop computer Intel Core i5 (2.20 GHz) and 8GB RAM with operating system windows (×64) version 10, using Python programming language, Anaconda software, and Wacom Tablet Device. In our research, we utilized 3 different machine learning algorithms (SVM, LR, and RF) to show the stability of our proposed model by measuring the classification results. There are two phases of our experiment: (1) Classification without feature selection (all features) and (2) Classification with feature selection (selected features). To evaluate the performance of the proposed model, four evaluation metrics are used for which we need to compute the parameters of True Positive (TP), False Positive (FP), True Negative (TN), and False Negative (FN). A confusion matrix is generated by these four evaluation metrics of classification results. These four evaluation metrics are computed as follows:
The writing samples of different users are not the same. Hence, there is visible discrimination between the same feature values of different persons.
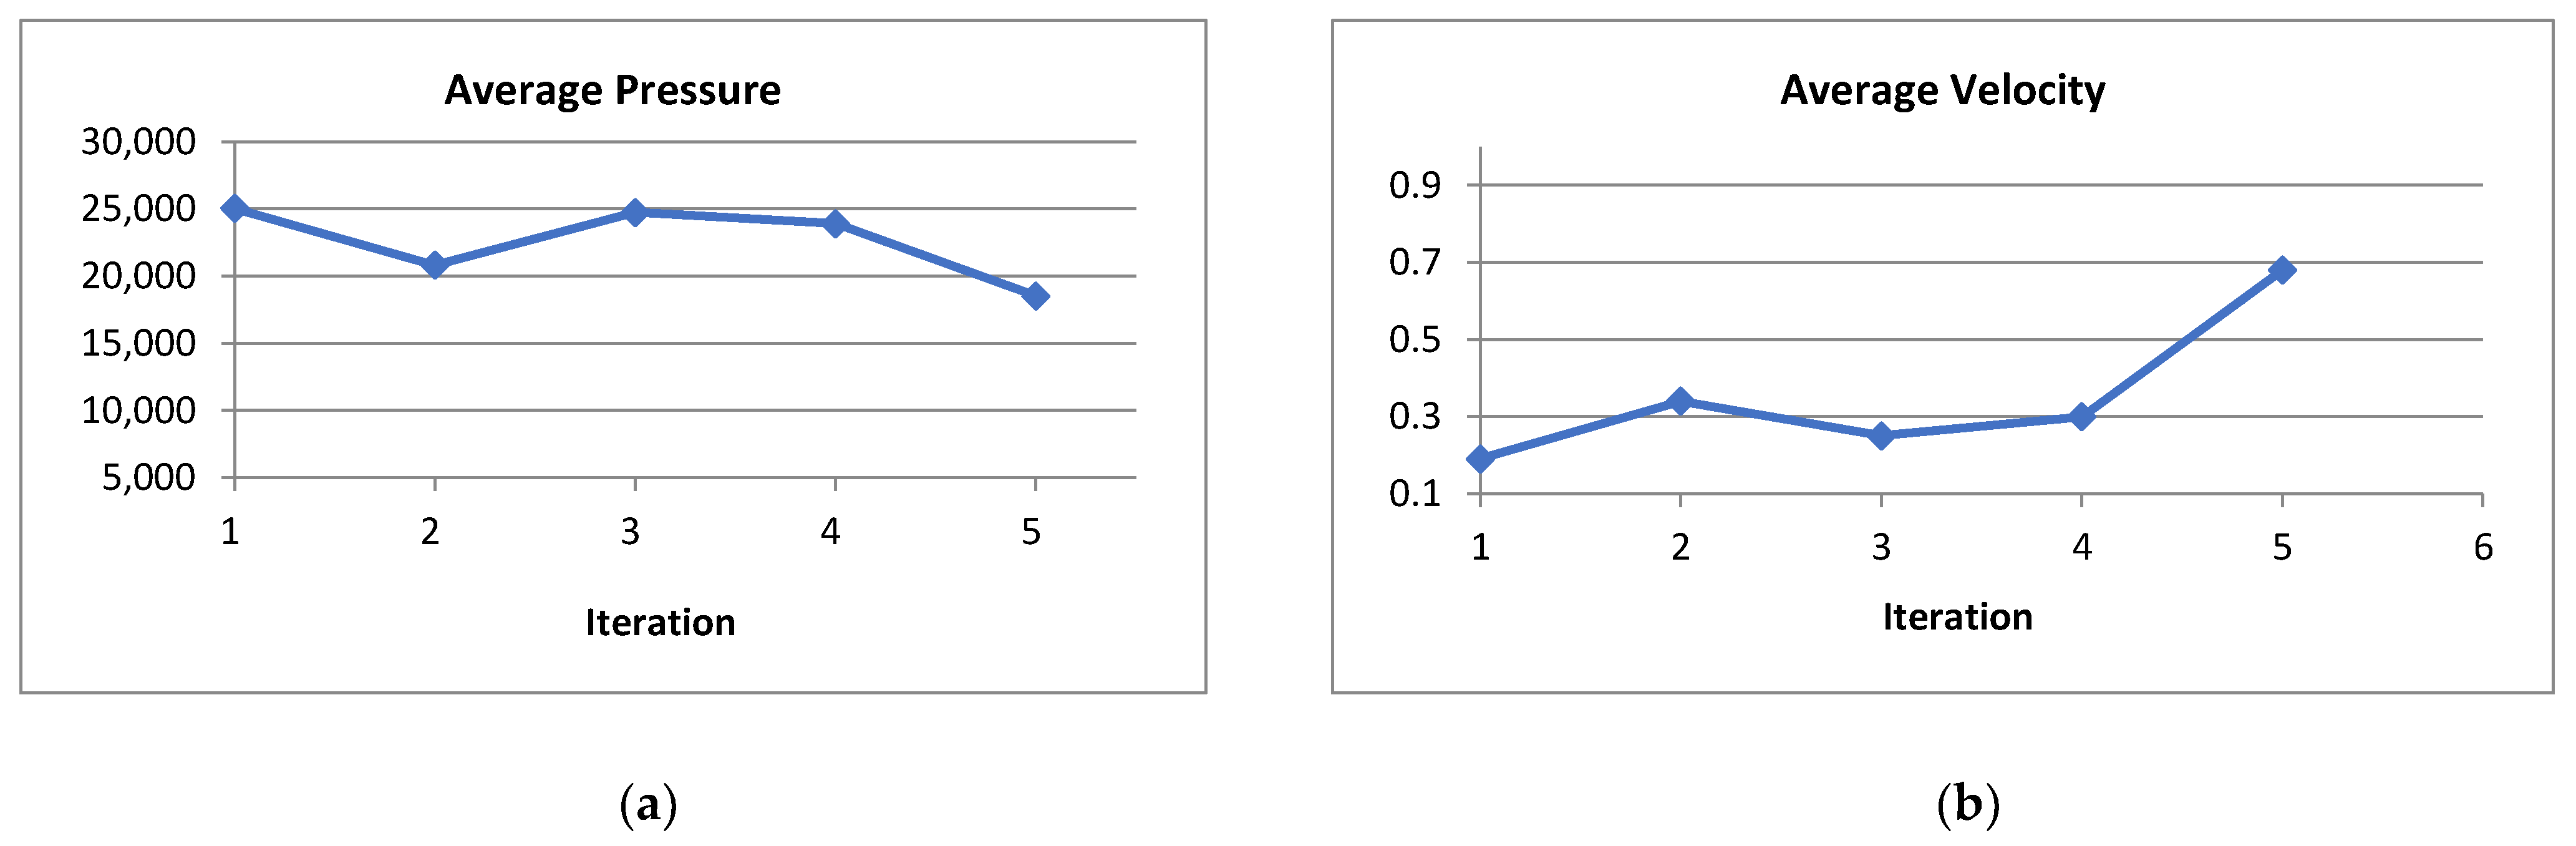
Figure 9 shows different features of writing samples for different persons.
There are 30 main features in the experiment (f
1~f
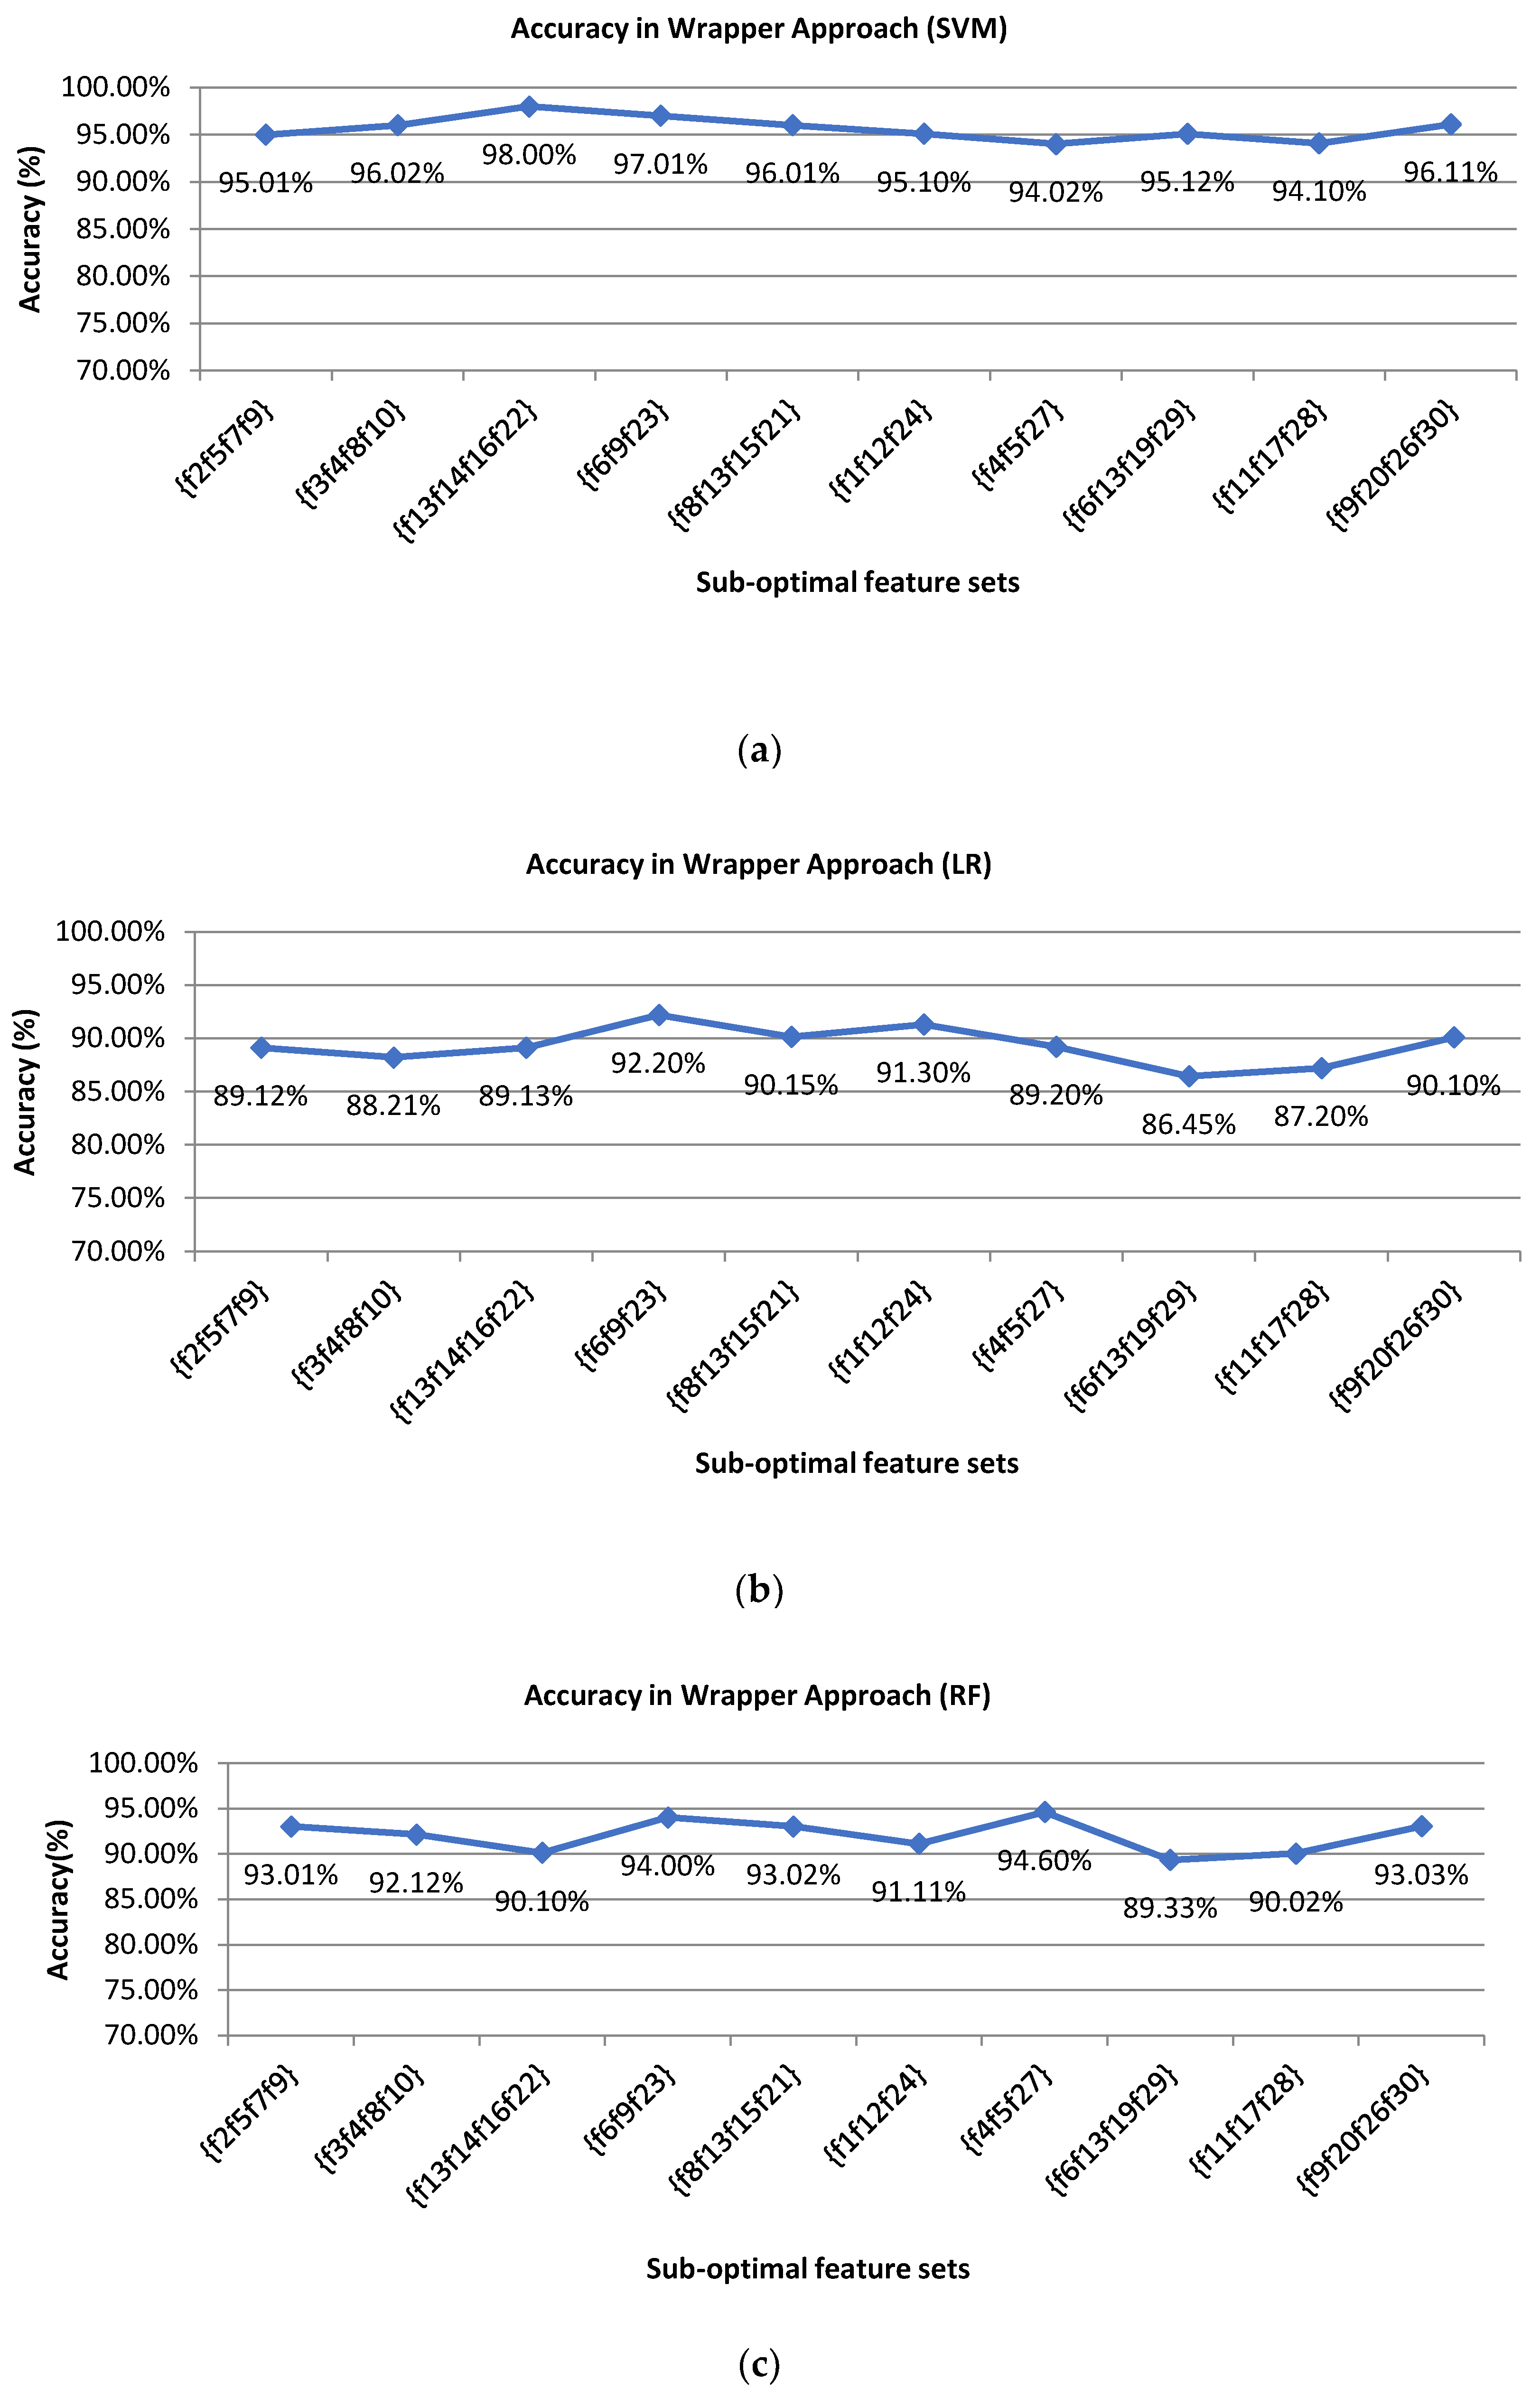
30). These feature vectors are directly applied to the filter approach for optimal feature selection. The filter technique is executed by two different SFFS algorithms on the two randomly splitted datasets containing equal numbers of data. Individual SFFS algorithm generates separate optimal feature sets from both datasets. This whole process is repeated for 4 iterations. Finally, the filter technique generates 10 sub-optimal feature sets from the 30 datasets. Then the 10 sub-optimal feature sets are forwarded to the wrapper approach, where the classification accuracies are measured using SVM, LR, and RF for each of the sub-optimal feature vectors.
Table 5 shows the 10 sub-optimal feature sets after the filter approach. In our experiment, firstly, we have done the best optimal feature selection process with SVM and the evaluation is also done with the same classifier that is SVM. The classification accuracy using SVM is about 98% which shows the practicality of our system. However, to prove the stability of our system, we implemented our model with two additional machine learning algorithms such as LR and RF classifier. For that, the feature selection and evaluation processes are done using LR and RF accordingly following the same procedure of SVM. From the experimental analysis, it is found that the LR and RF provide satisfactory results and SVM perform outstanding which makes our claim stronger for the proposed model.
Figure 10 presents the classification accuracies of all sub-optimal feature vectors for 3 machine learning algorithms in the wrapper approach. From the 10 sub-optimal features, the wrapper approach identifies the best feature for higher classification results.
Table 6 presents the best optimal feature sets and the classification accuracy for the selected best optimal feature set.
Table 6 presents the best accuracy of finally selected best optimal features in wrapper approach using support vector machine, logistic regression, and random forest. From
Table 6, we can see that SVM provides the best accuracy result compare to LR and RF. It is found that our proposed system provides a higher accuracy outcome with the combination of best optimal features {f
13, f
14, f
16, f
22} with the best accuracy of 98.0% whereas the accuracy without feature selection is 93% using SVM. Using LR with the combination of best optimal features {f
6, f
9, f
23} provides the best accuracy of 92.2% whereas the accuracy without feature selection is 86% only. Again, using RF with the combination of best optimal features {f
4, f
5, f
27} provides the best accuracy of 94.6% whereas the accuracy without feature selection is 90%. These selected best features are then used in the validation process to check the overall accuracy of our proposed model of user identification. Our proposed model provides efficient and satisfactory writer identification with limited computational resources and hardware cost which prove the practicality of our system.
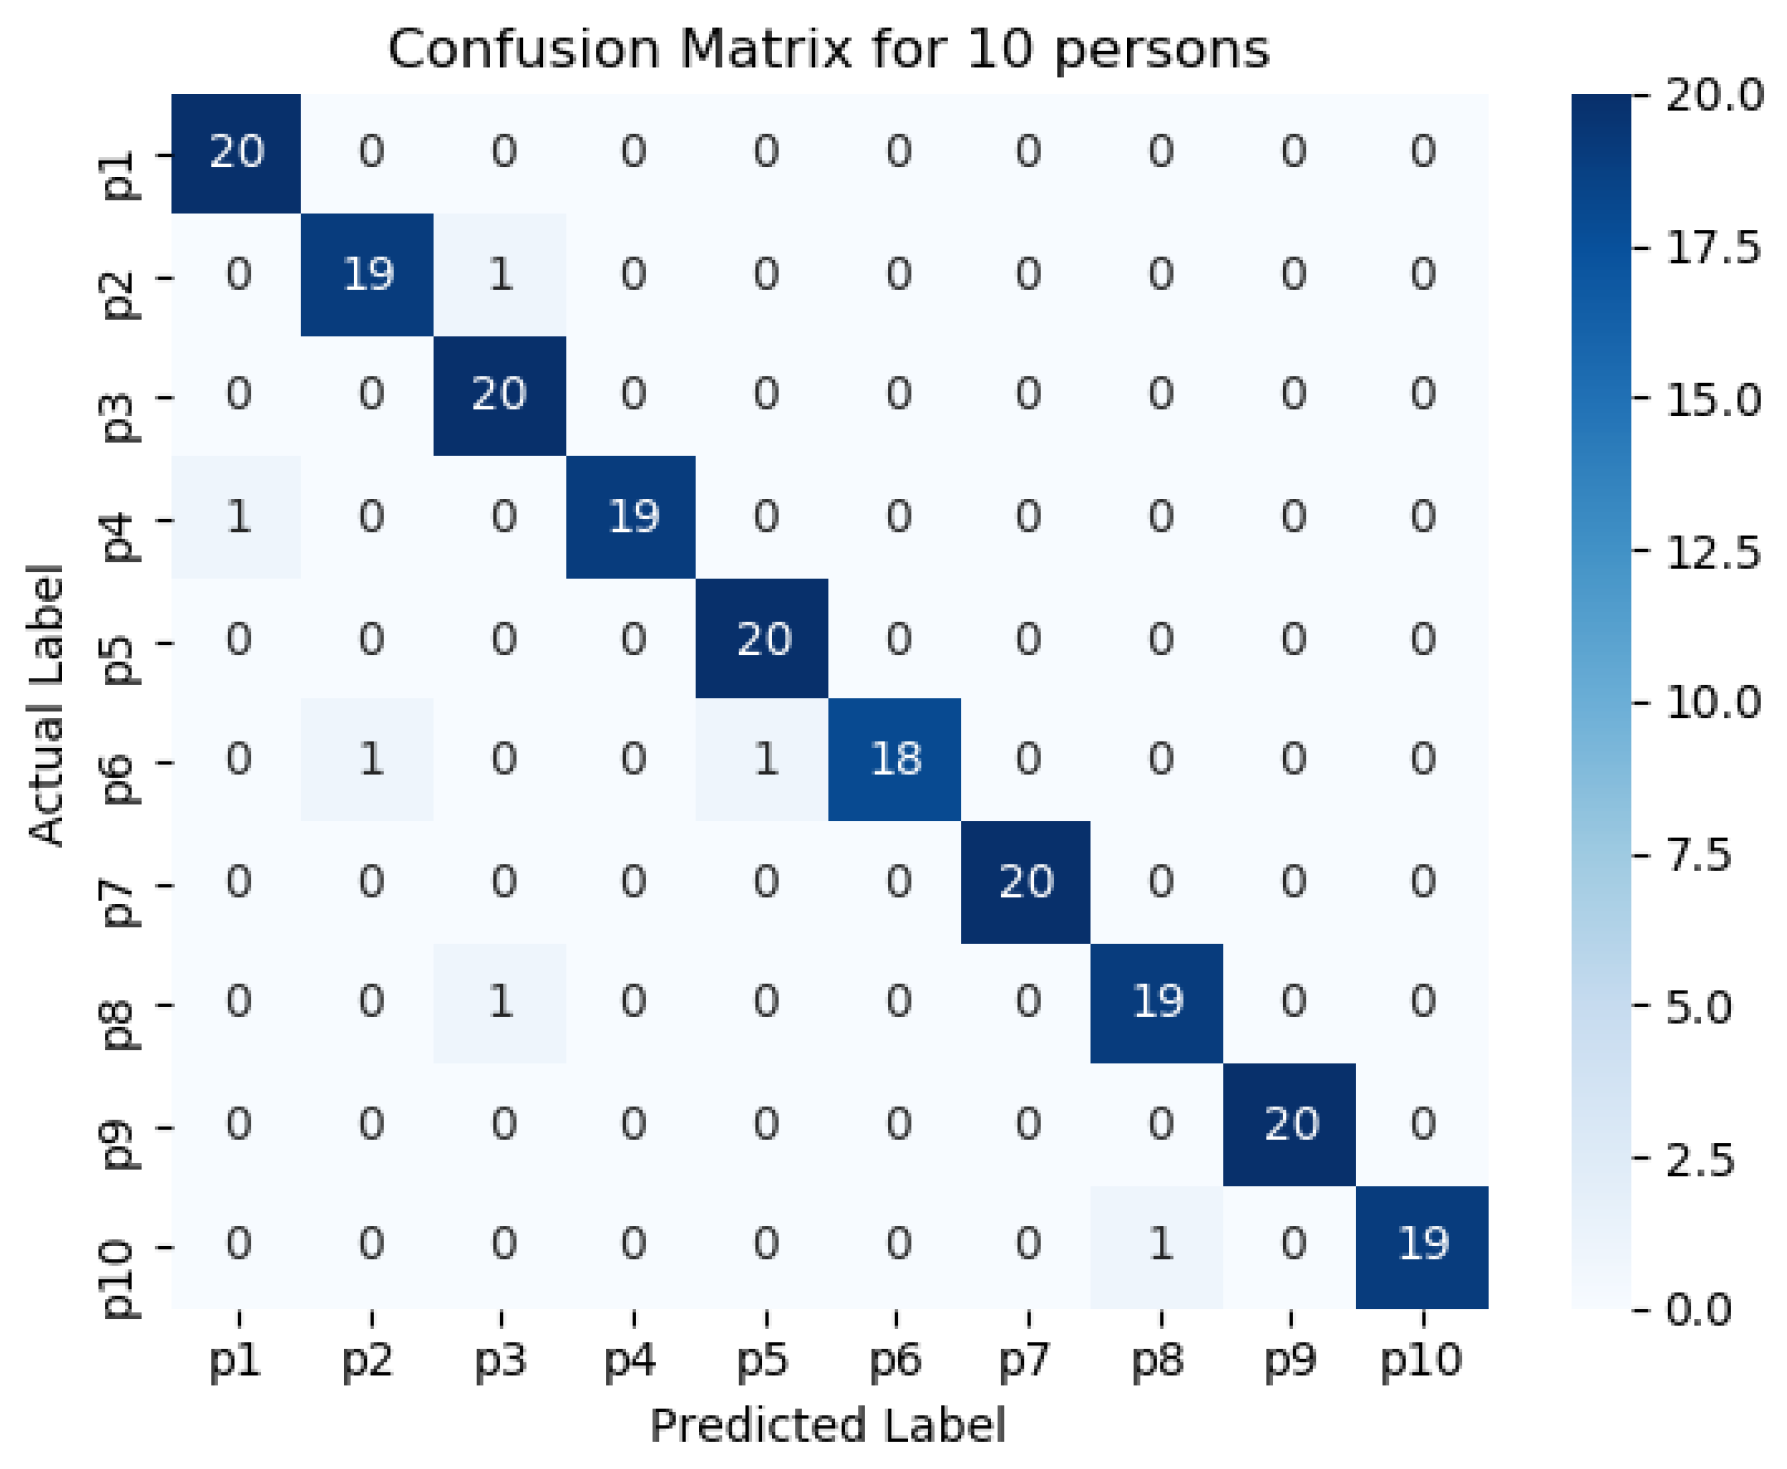
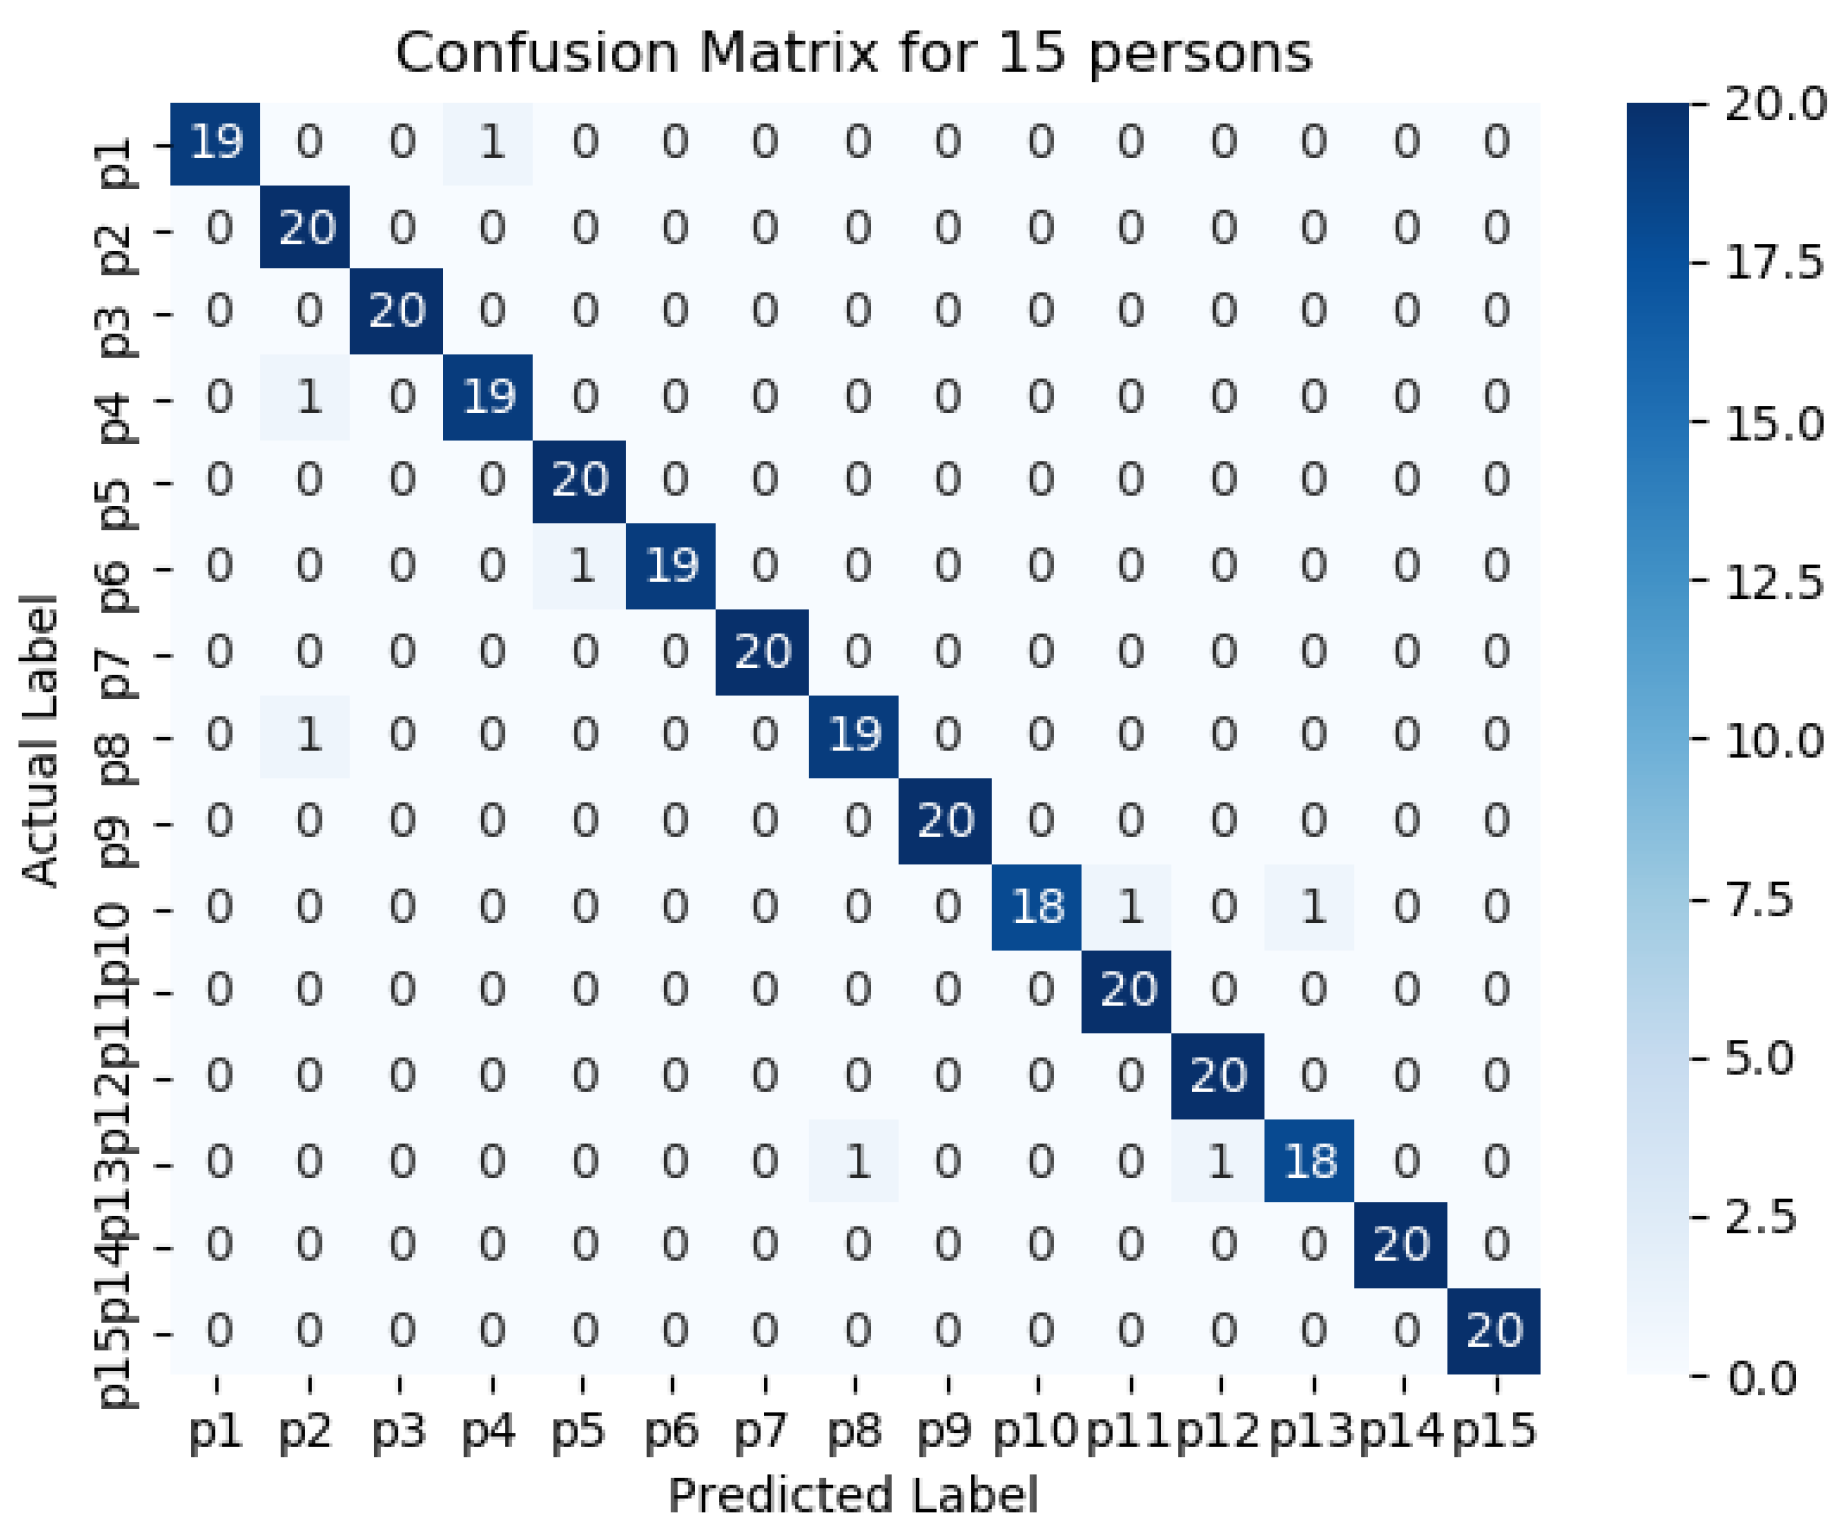
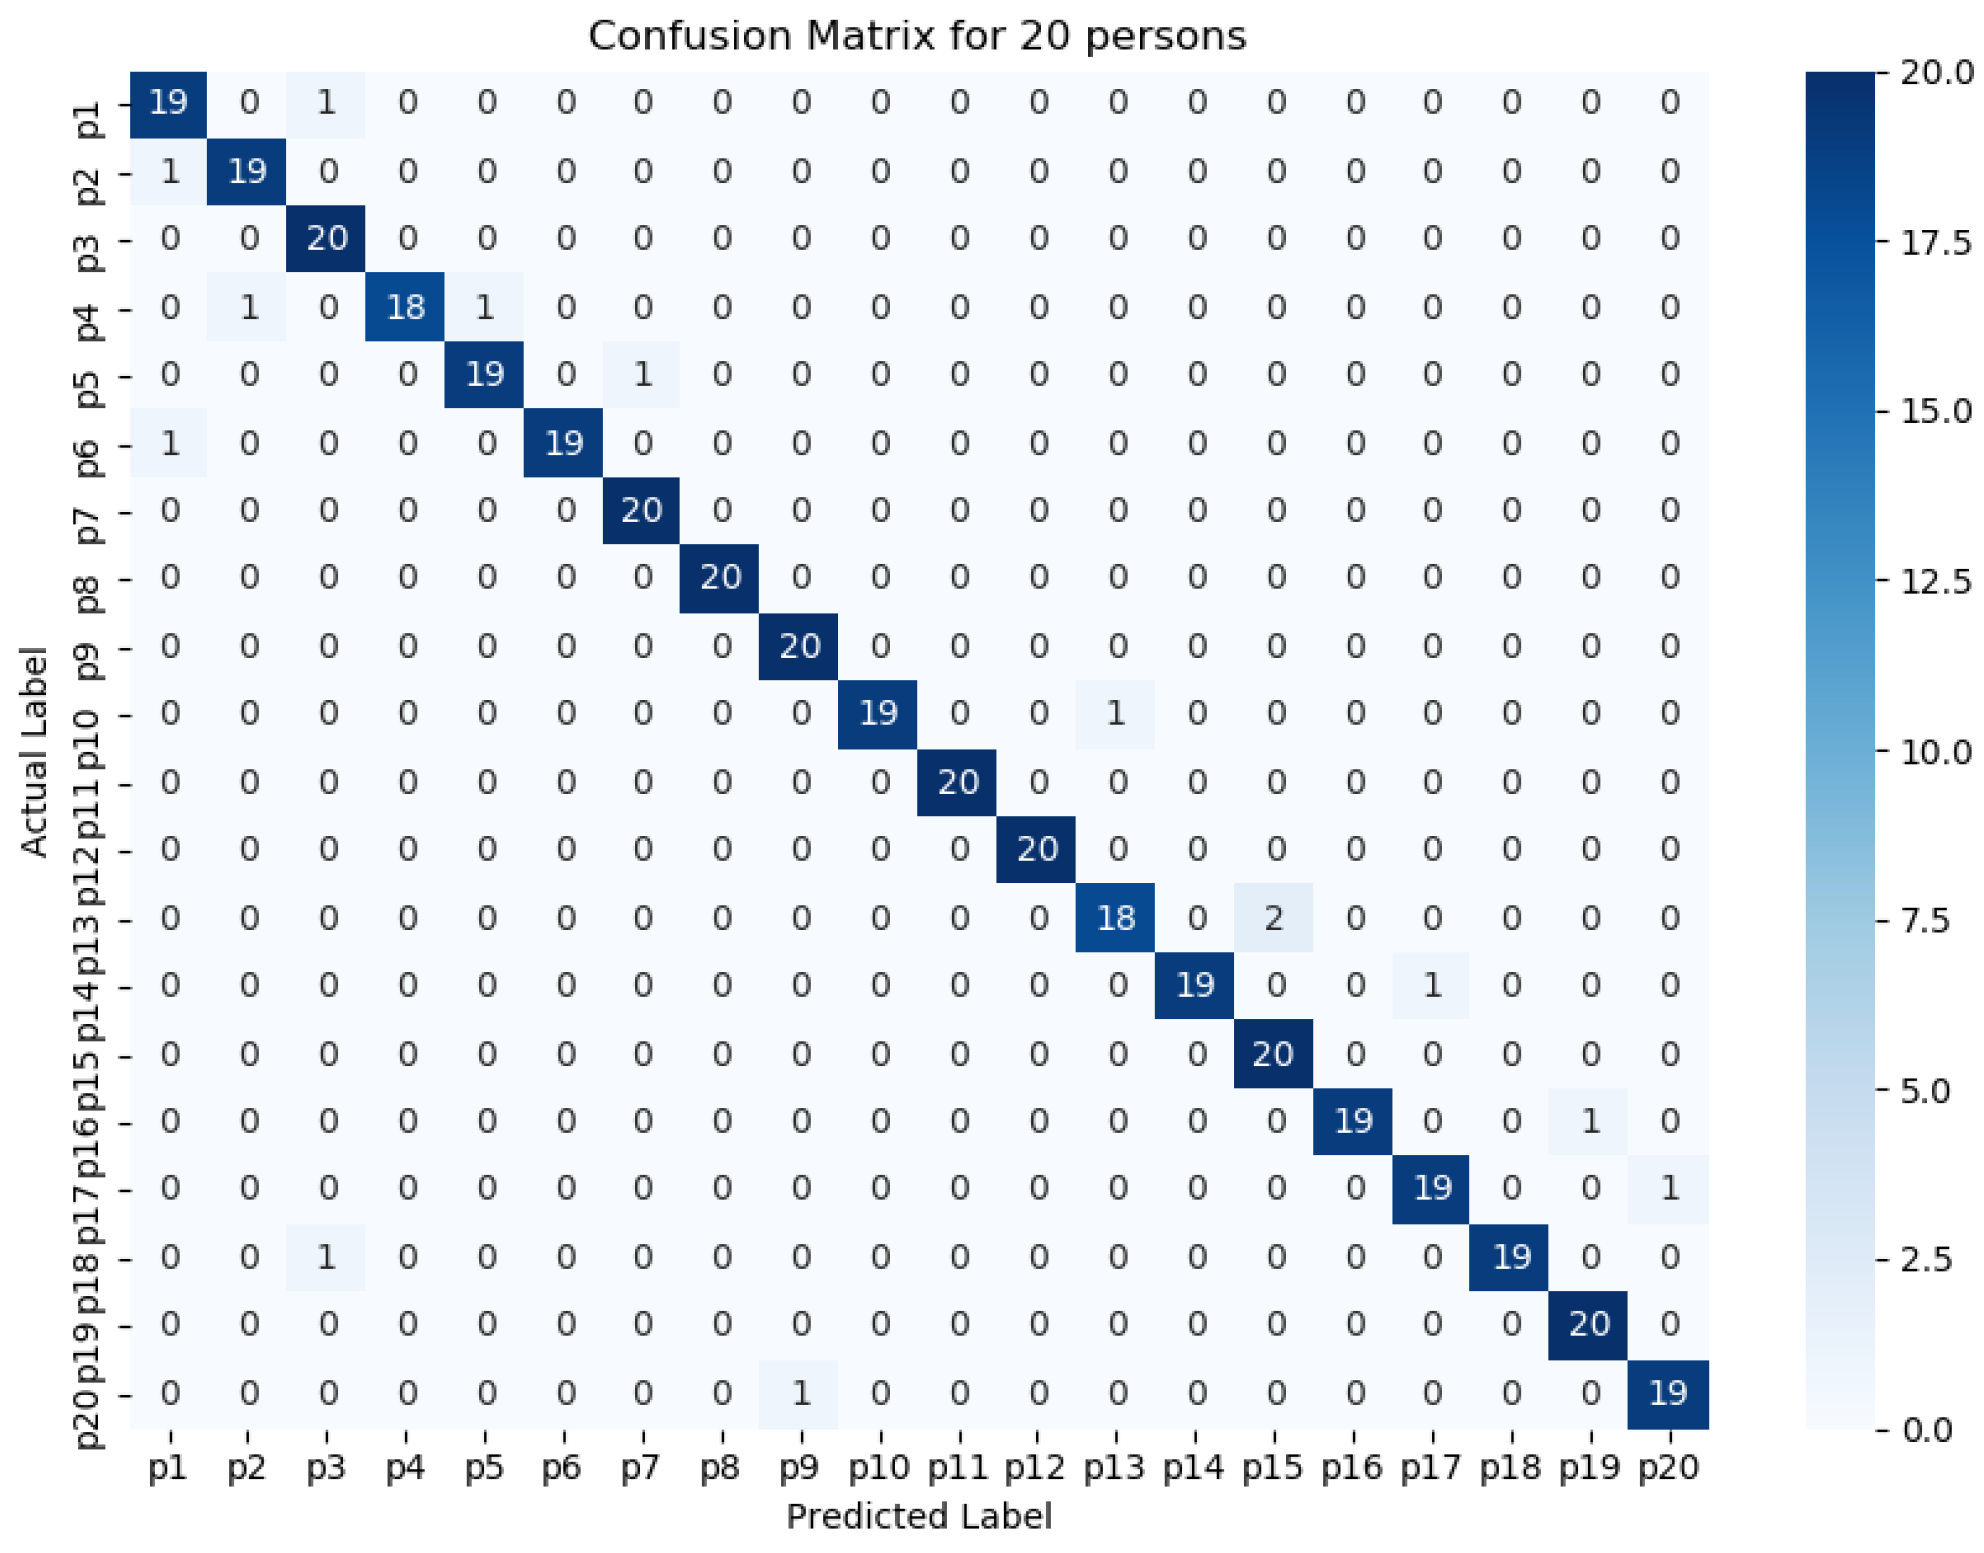
To evaluate the performance of the proposed model, we used four evaluation metrics namely accuracy, precision, recall, and F1 score. We measured the values of performance matrices for 5 different classes utilizing the SVM classifier.
Table 7 shows the performance of the SVM classifier for a different number of persons with optimal feature sets.
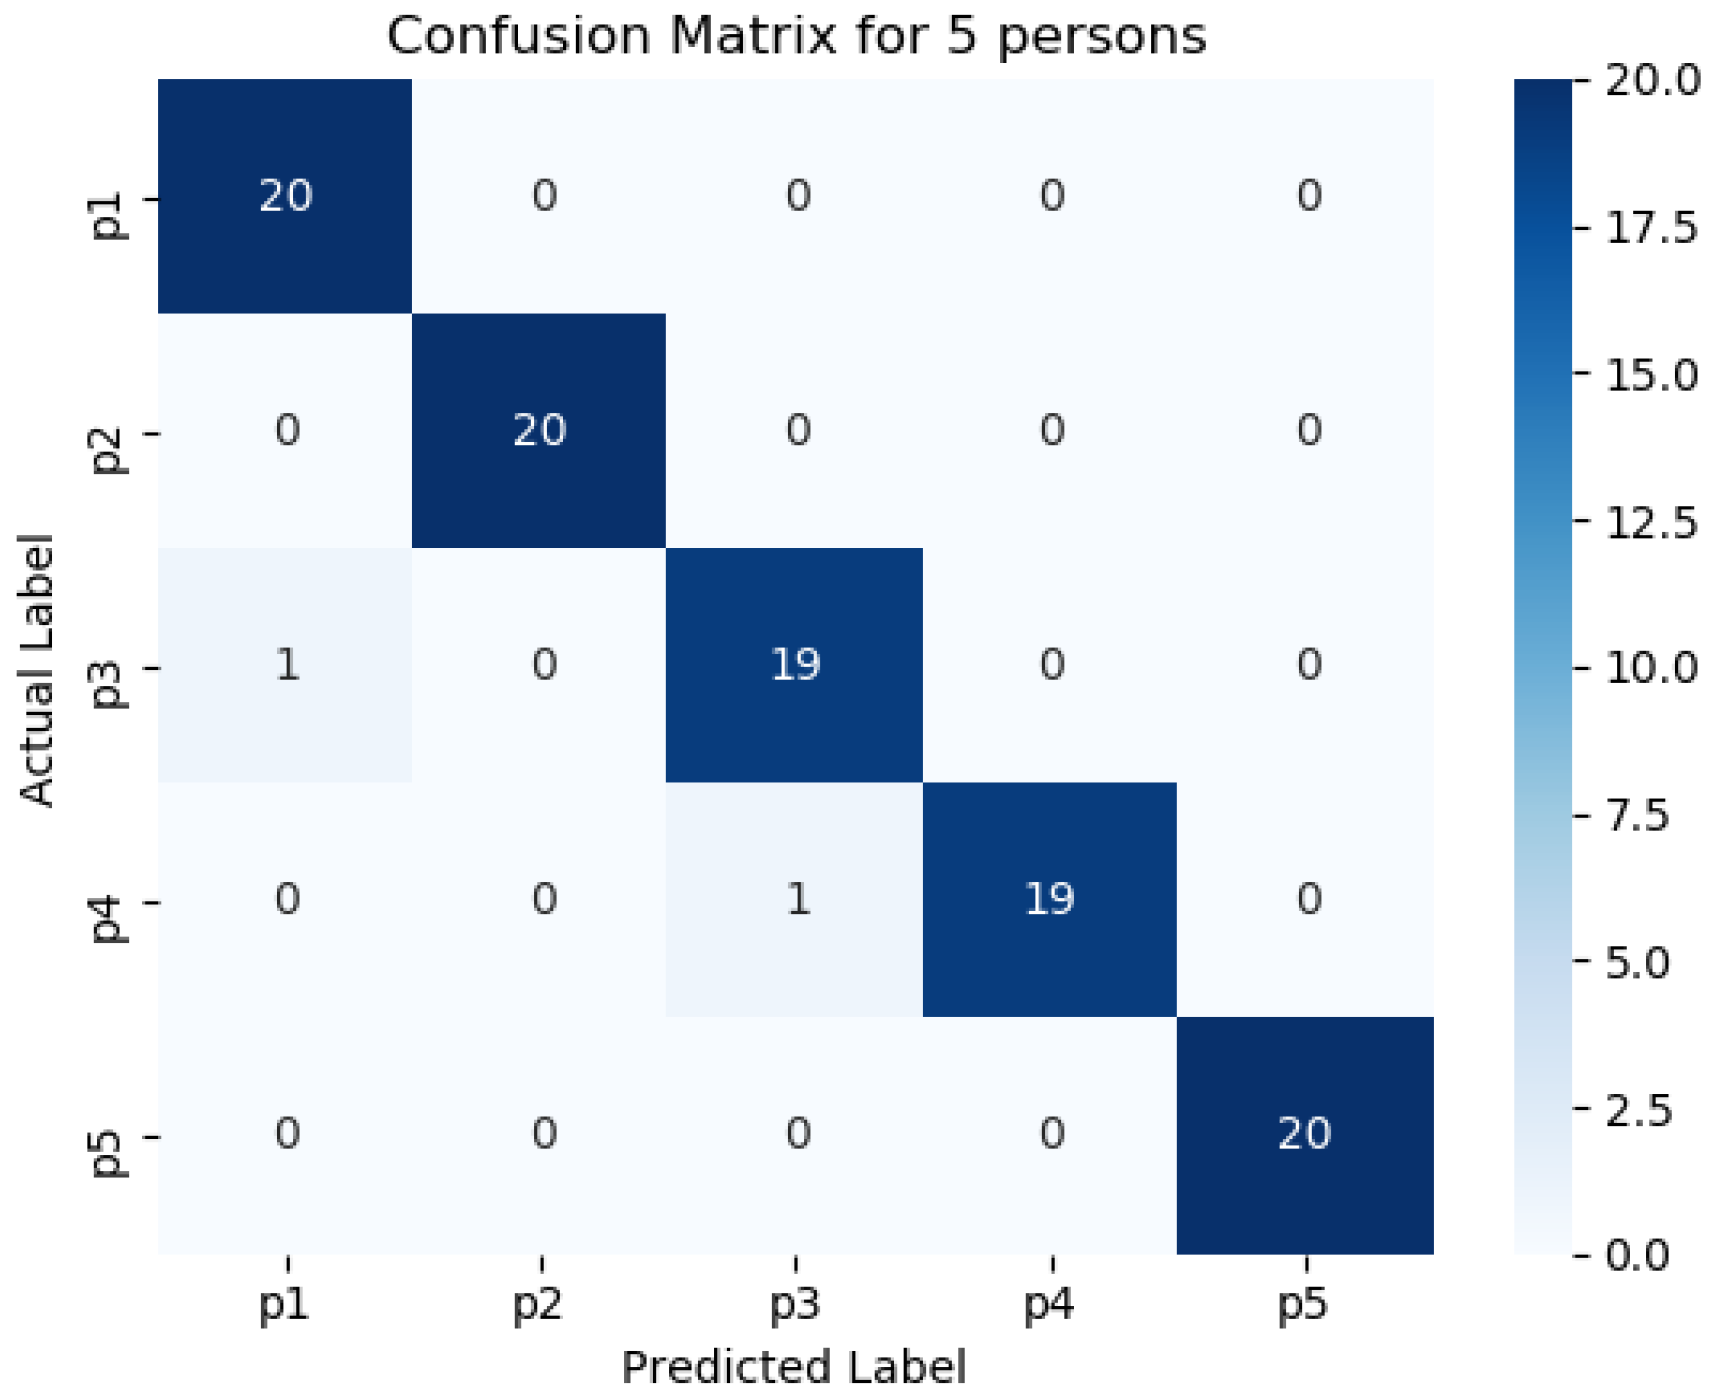
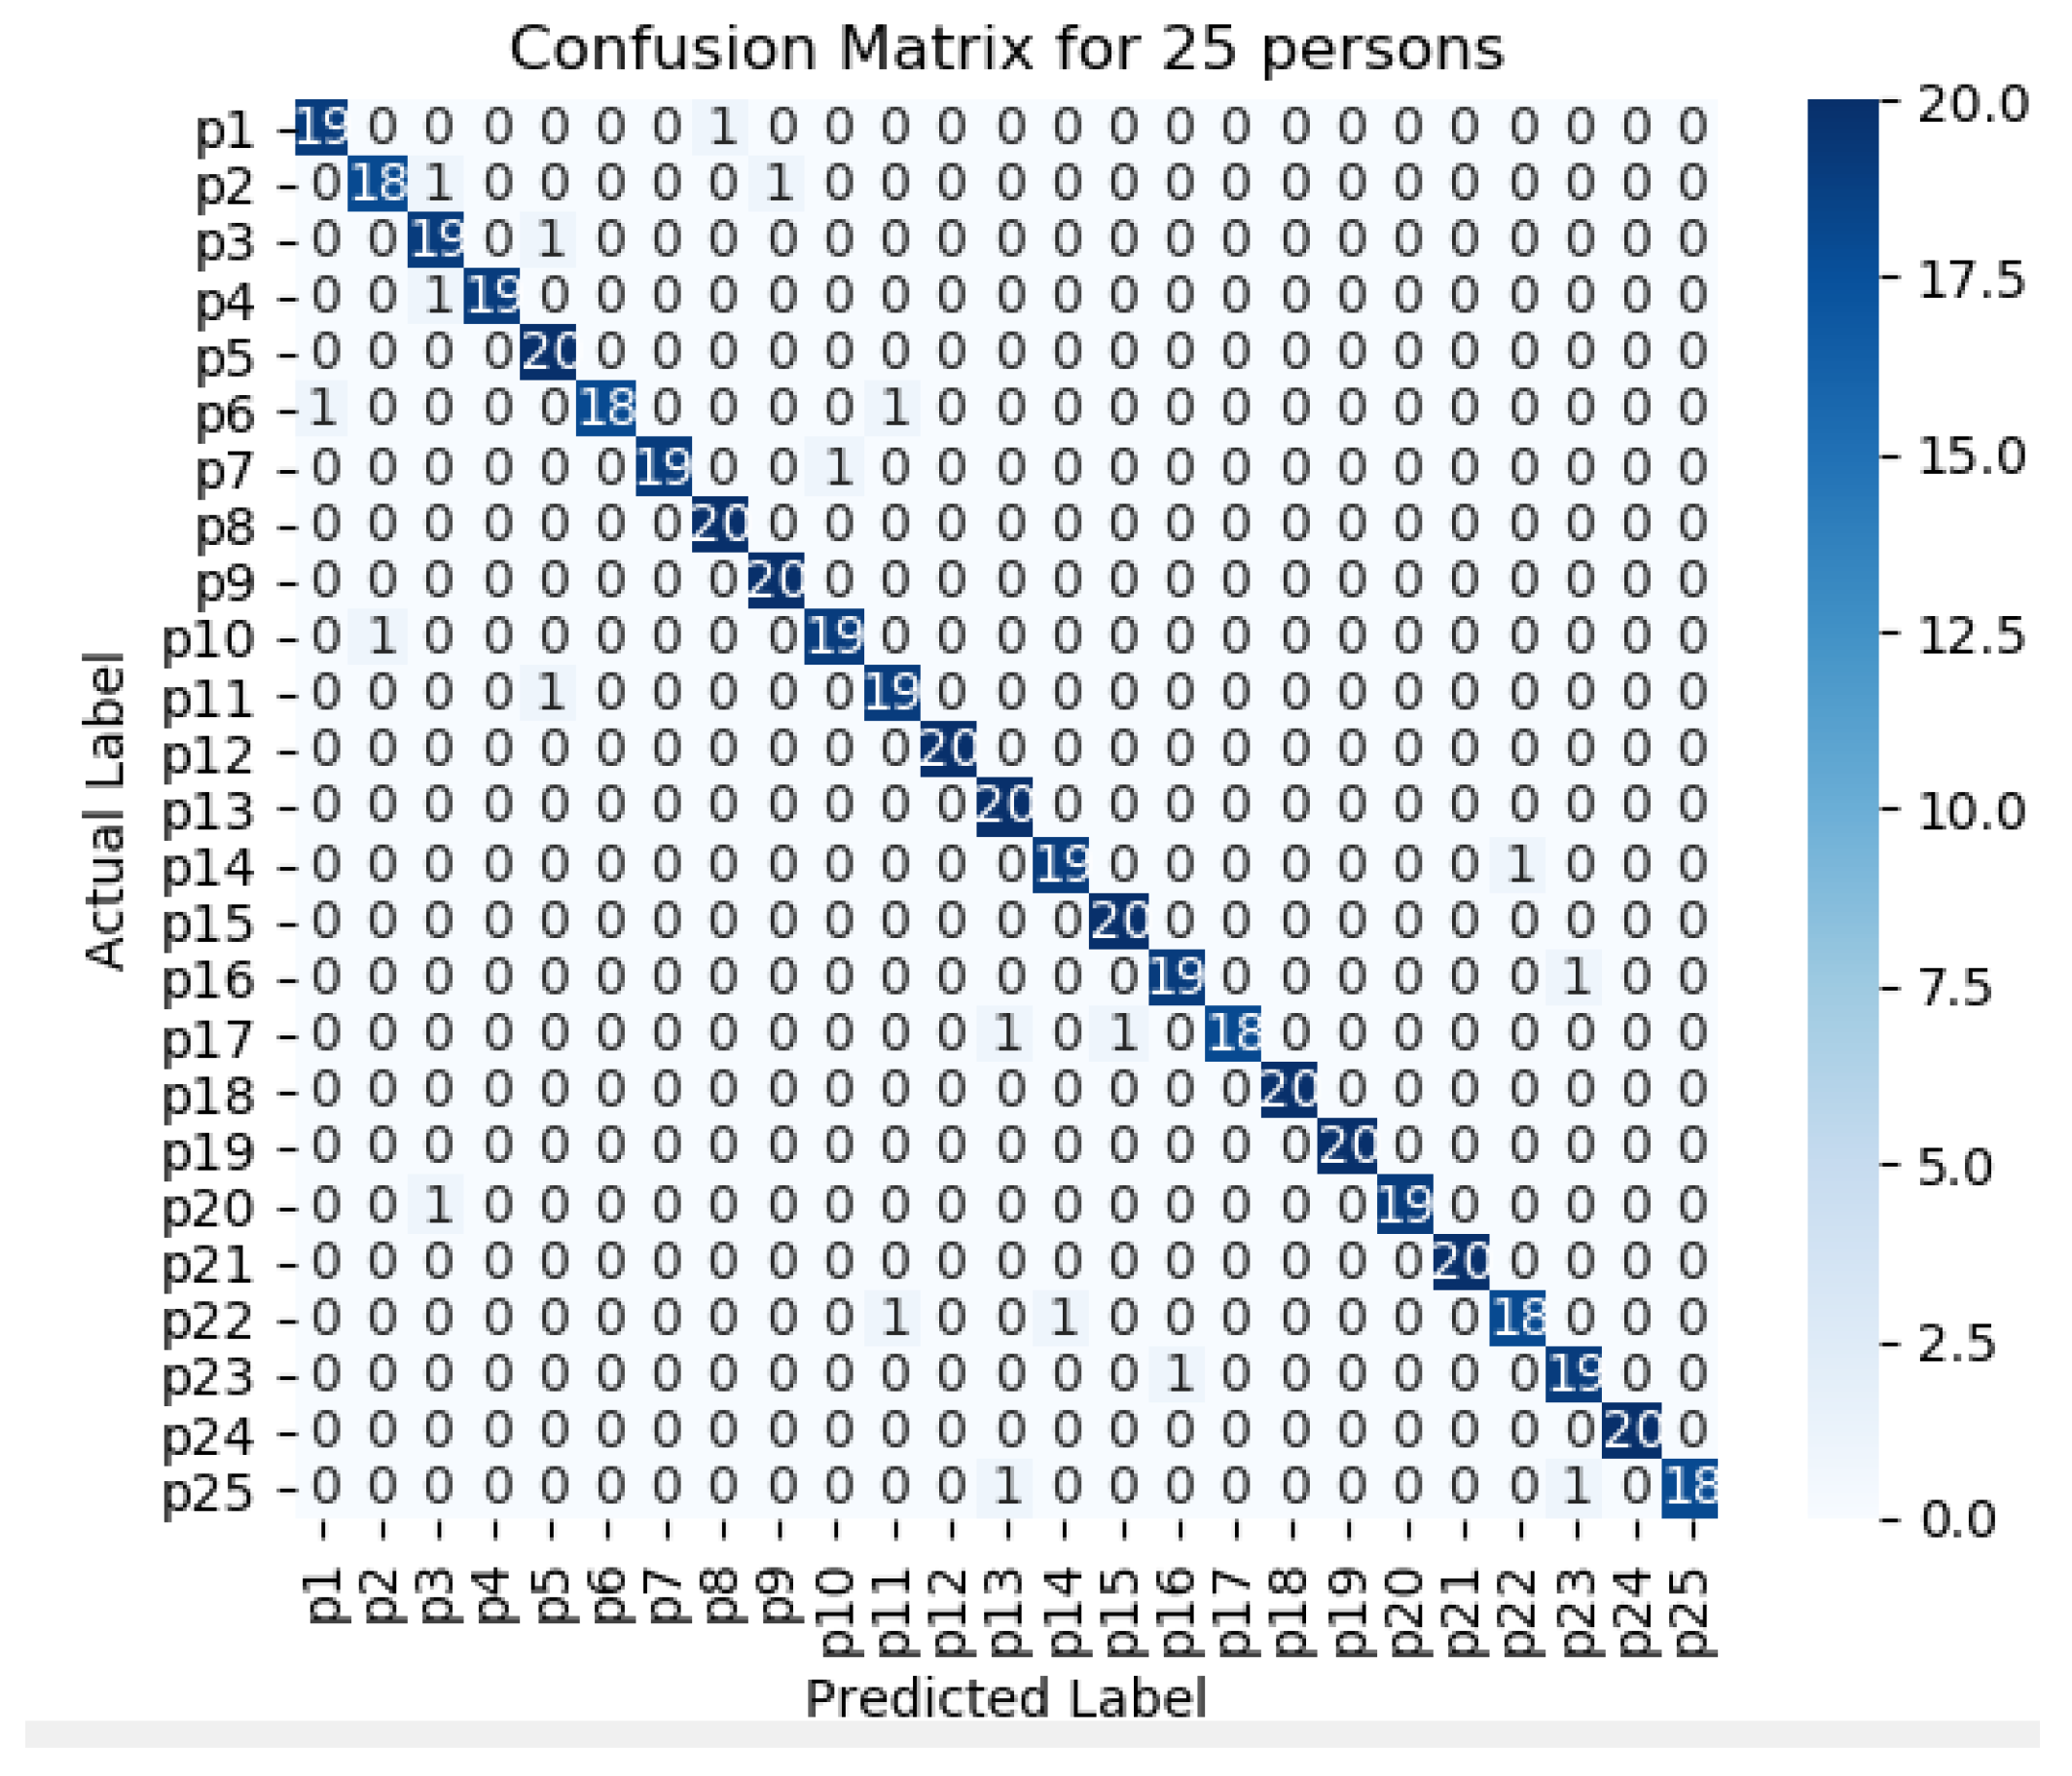
Figure 11,
Figure 12,
Figure 13,
Figure 14 and
Figure 15 represents the confusion matrix to visualize the performance of the implemented model in a contingency table for different number of persons with optimal feature sets.
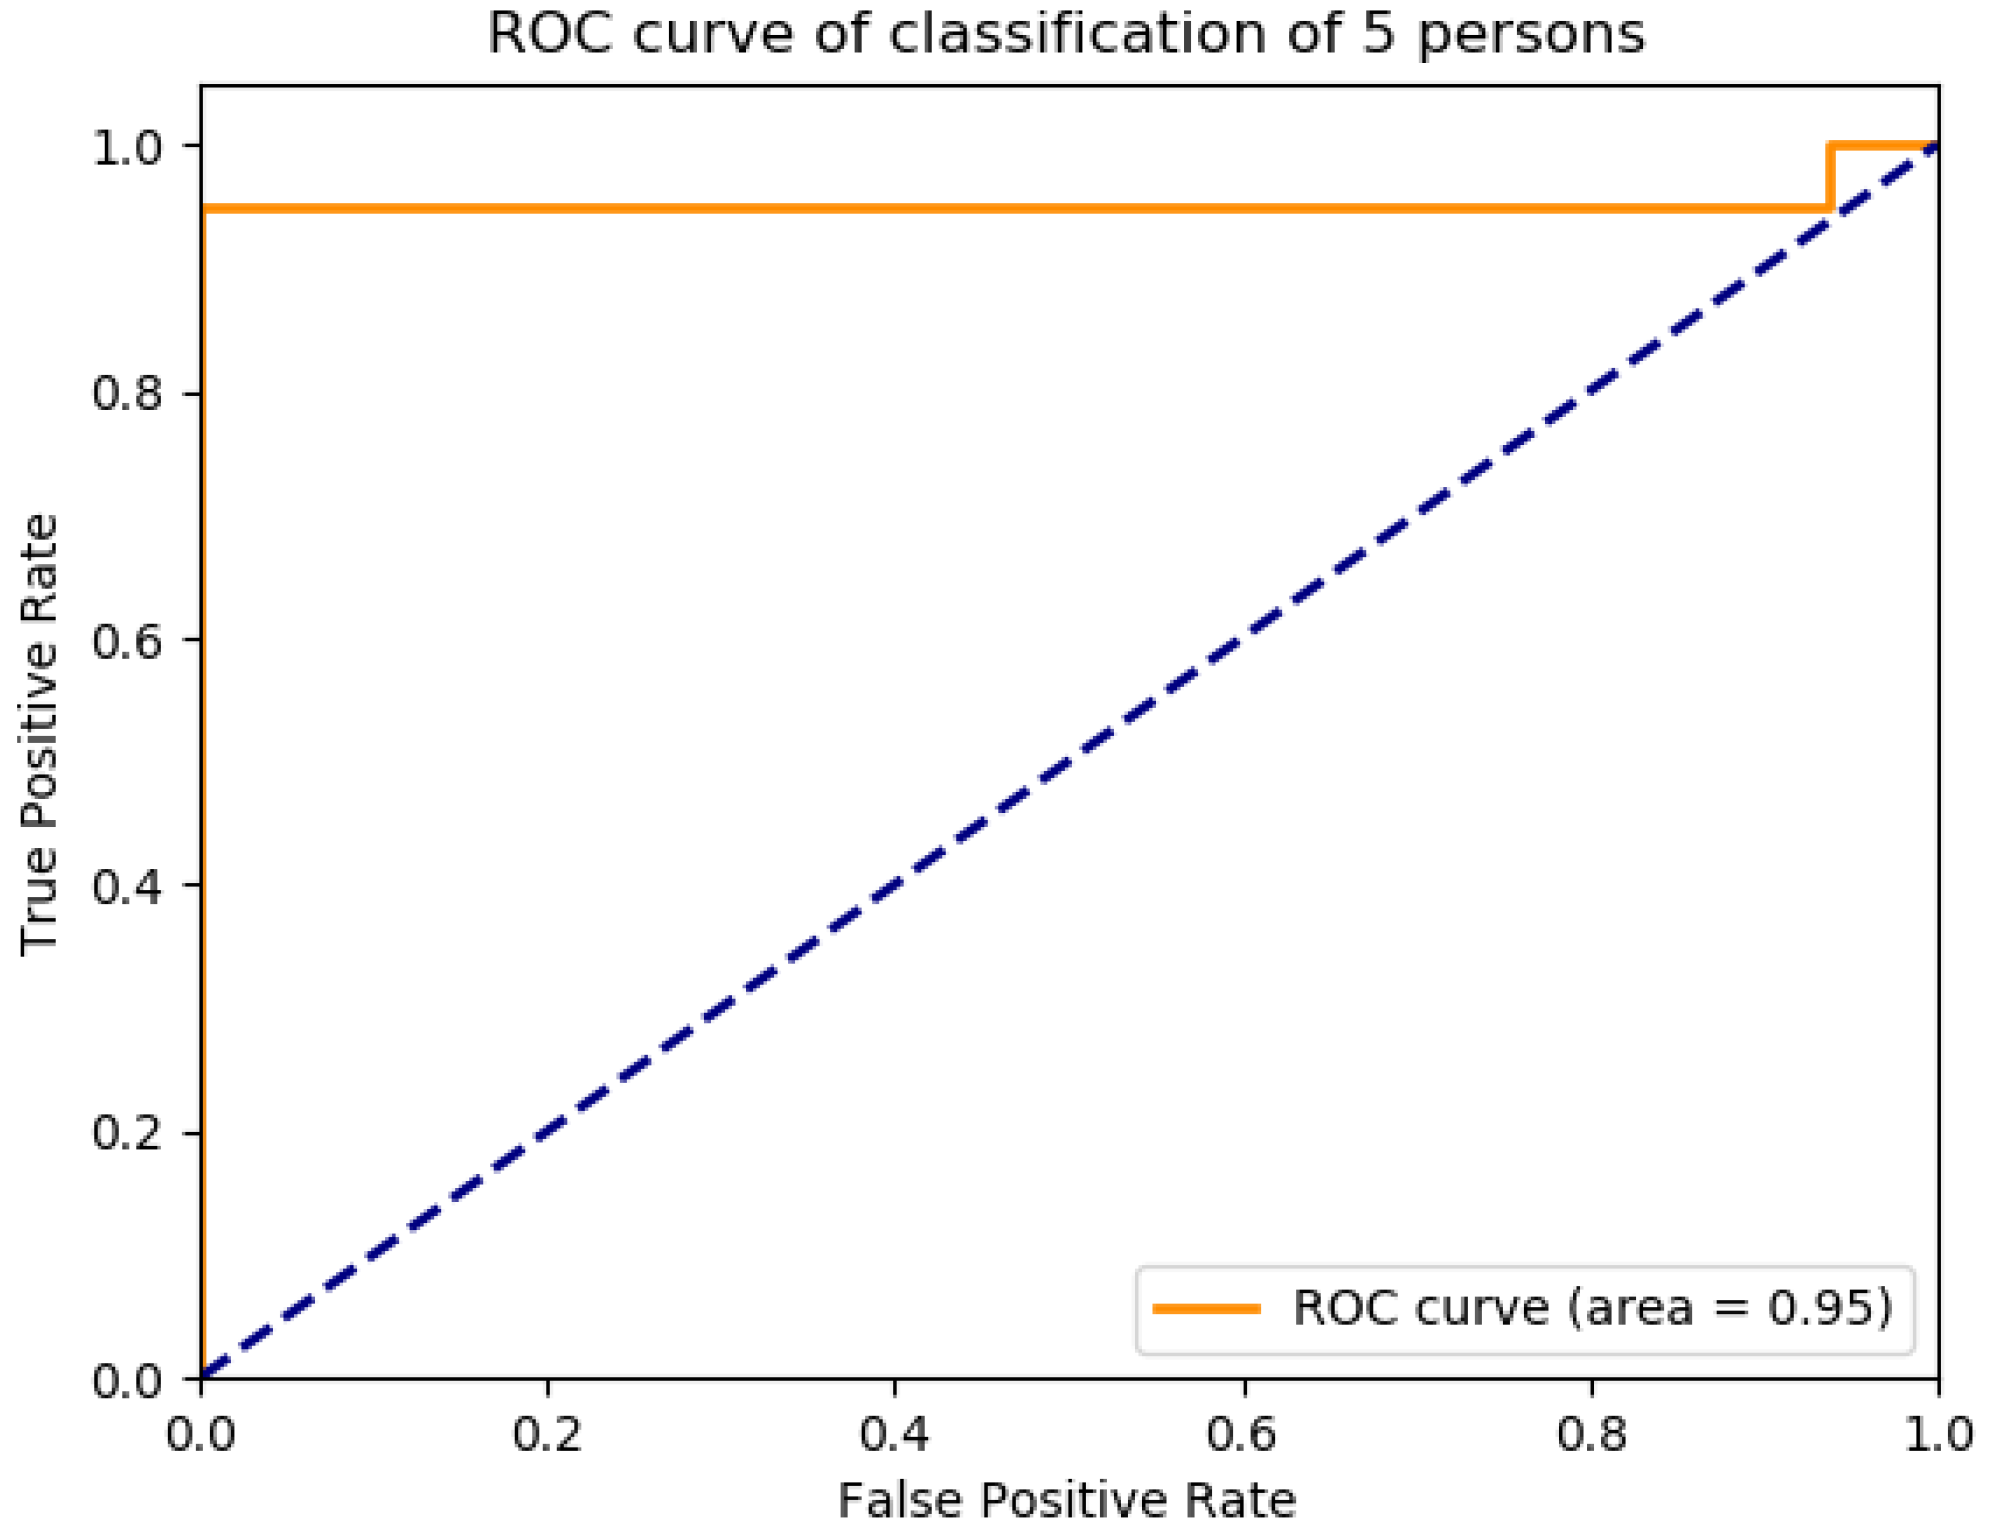
Figure 16 presents the ROC curve of classification of 5 persons. From the experiment, it is observed that in case of optimal feature selection, when the no. of person’s increases then the values of the performance metrics are not changing much which is satisfactory and stable. However, in case of no feature selection, these values are changing significantly. This is because, the distribution of large number of data in high dimensional feature space is more complicated and inefficient for classification.
The performance matrices, accuracy, precision, recall, and F1 score achieve higher values such as 98%, 98%, 98%, and 98% respectively when the number of persons is smaller. However, when the number of persons is 15, then the values of accuracy, precision, recall, and F1 score are 97.3%, 97.25%, 97.35%, and 87.3% respectively where the performance is changing insignificantly which is practical.
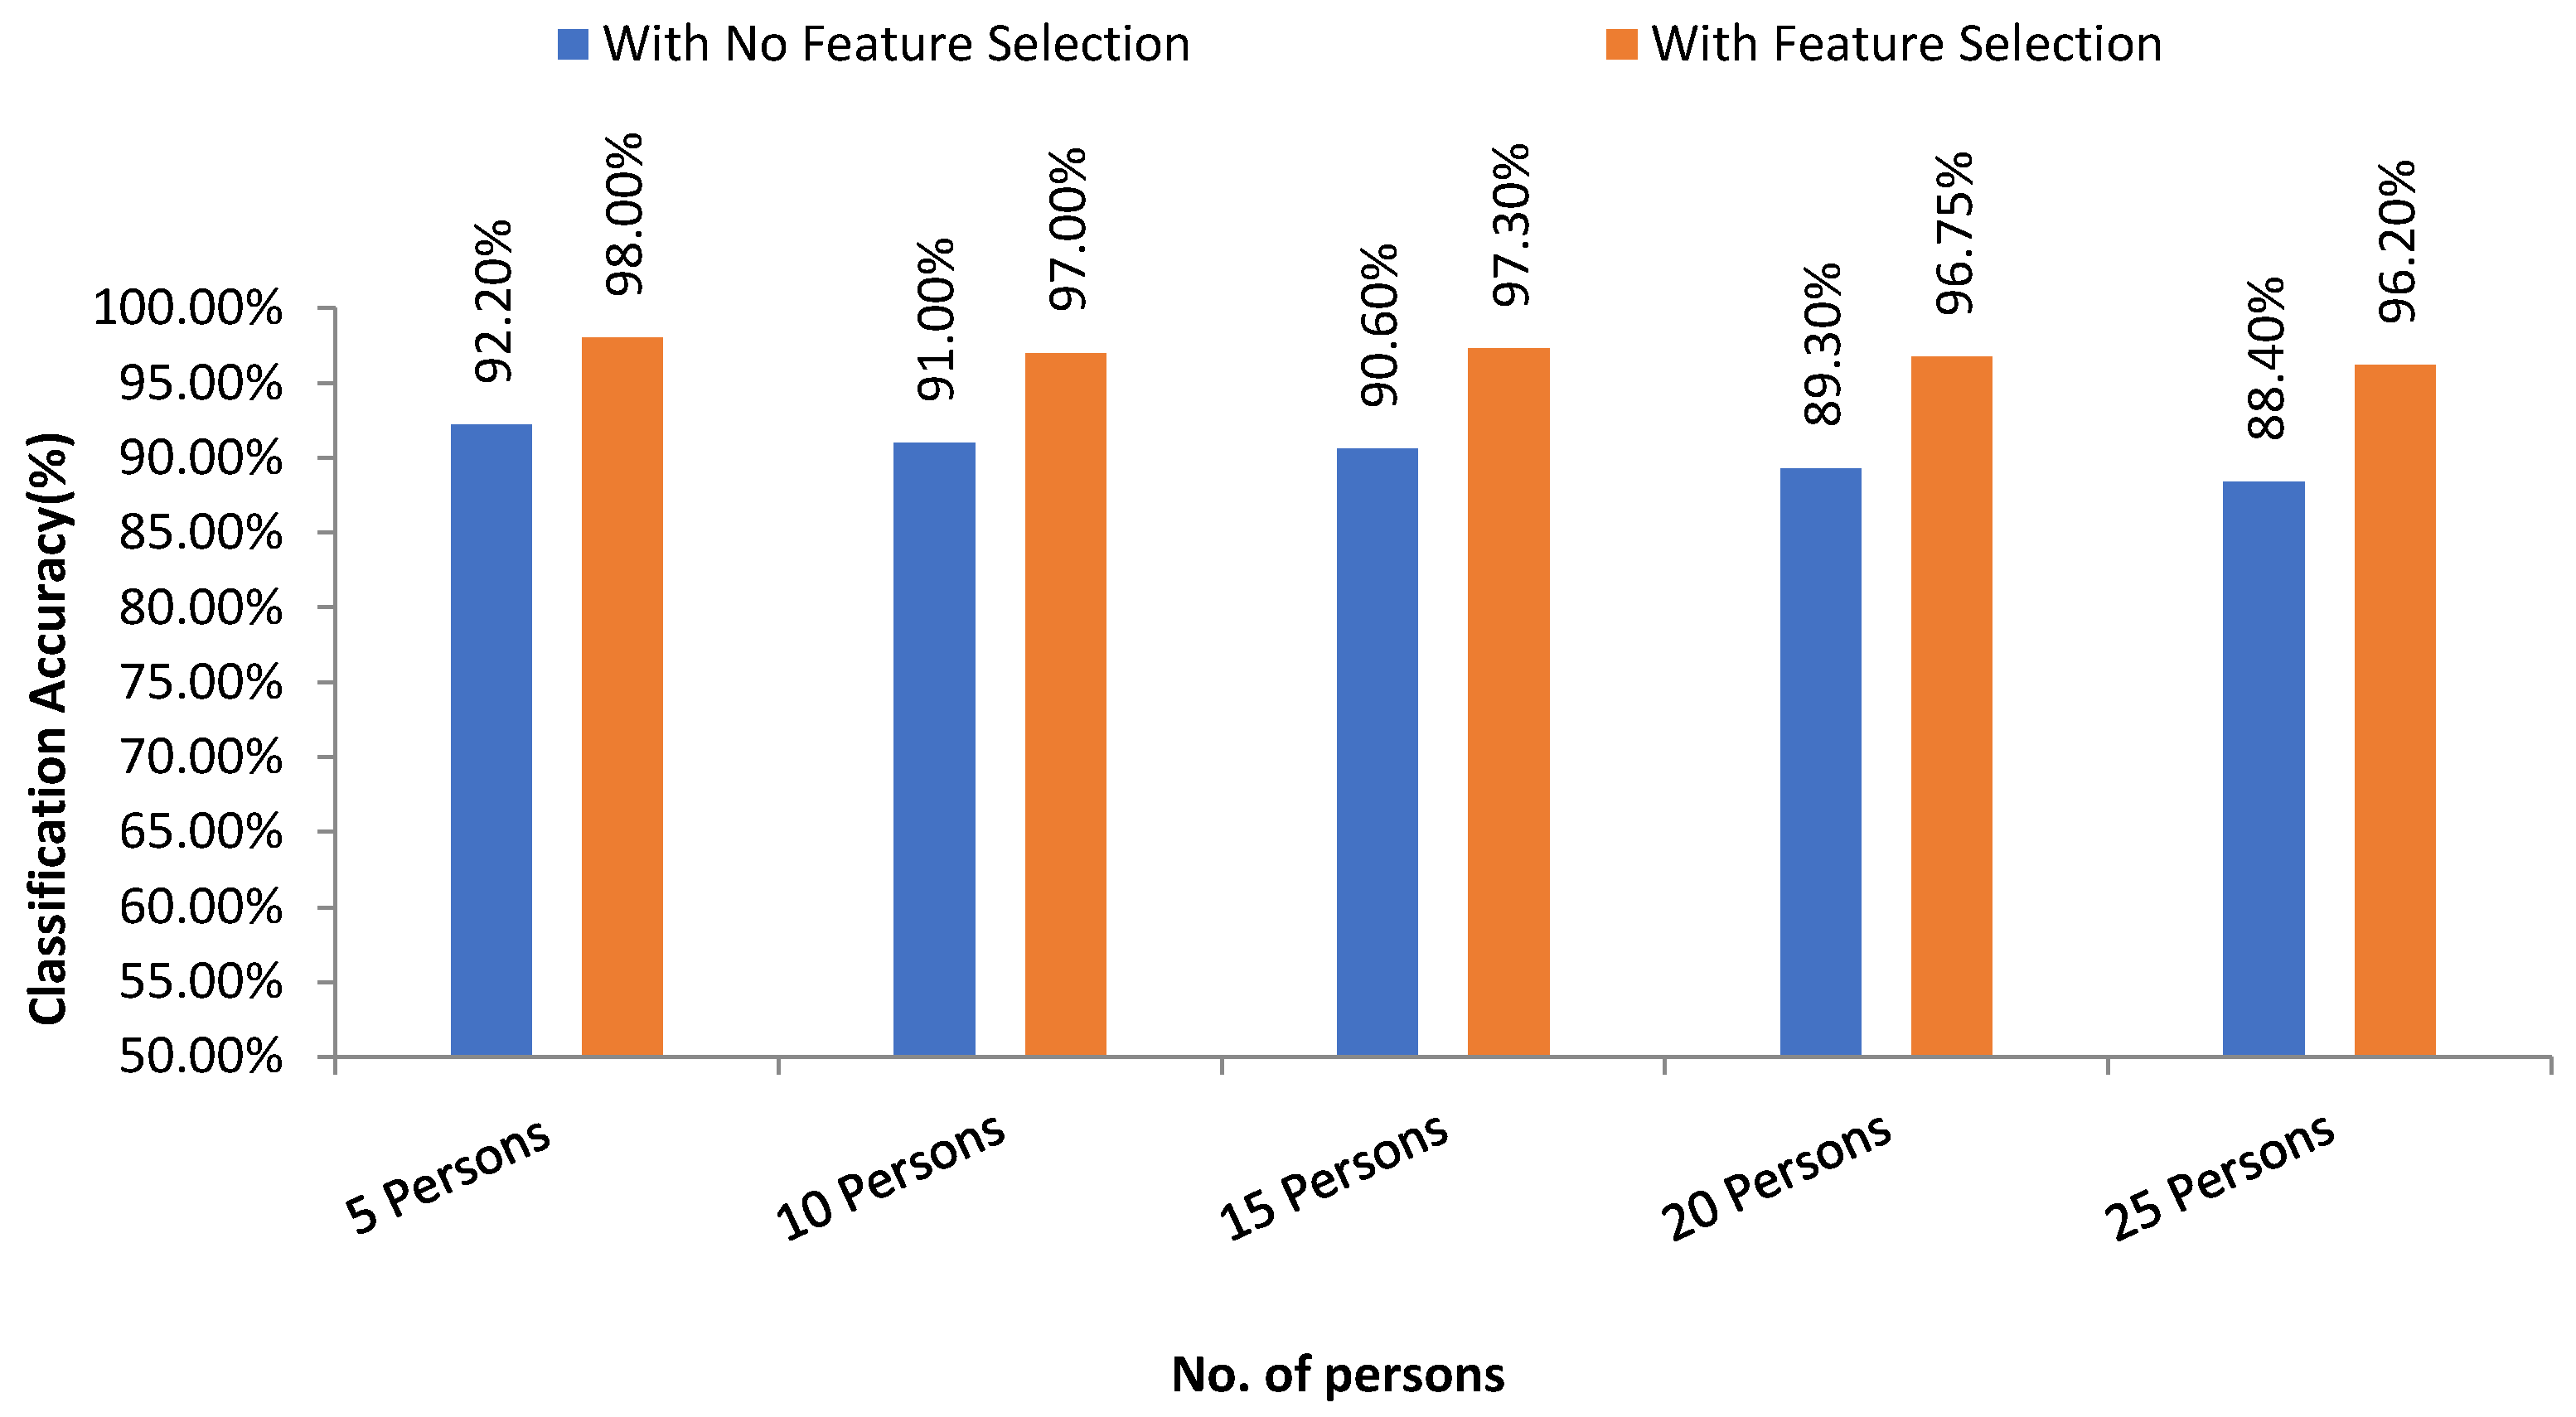
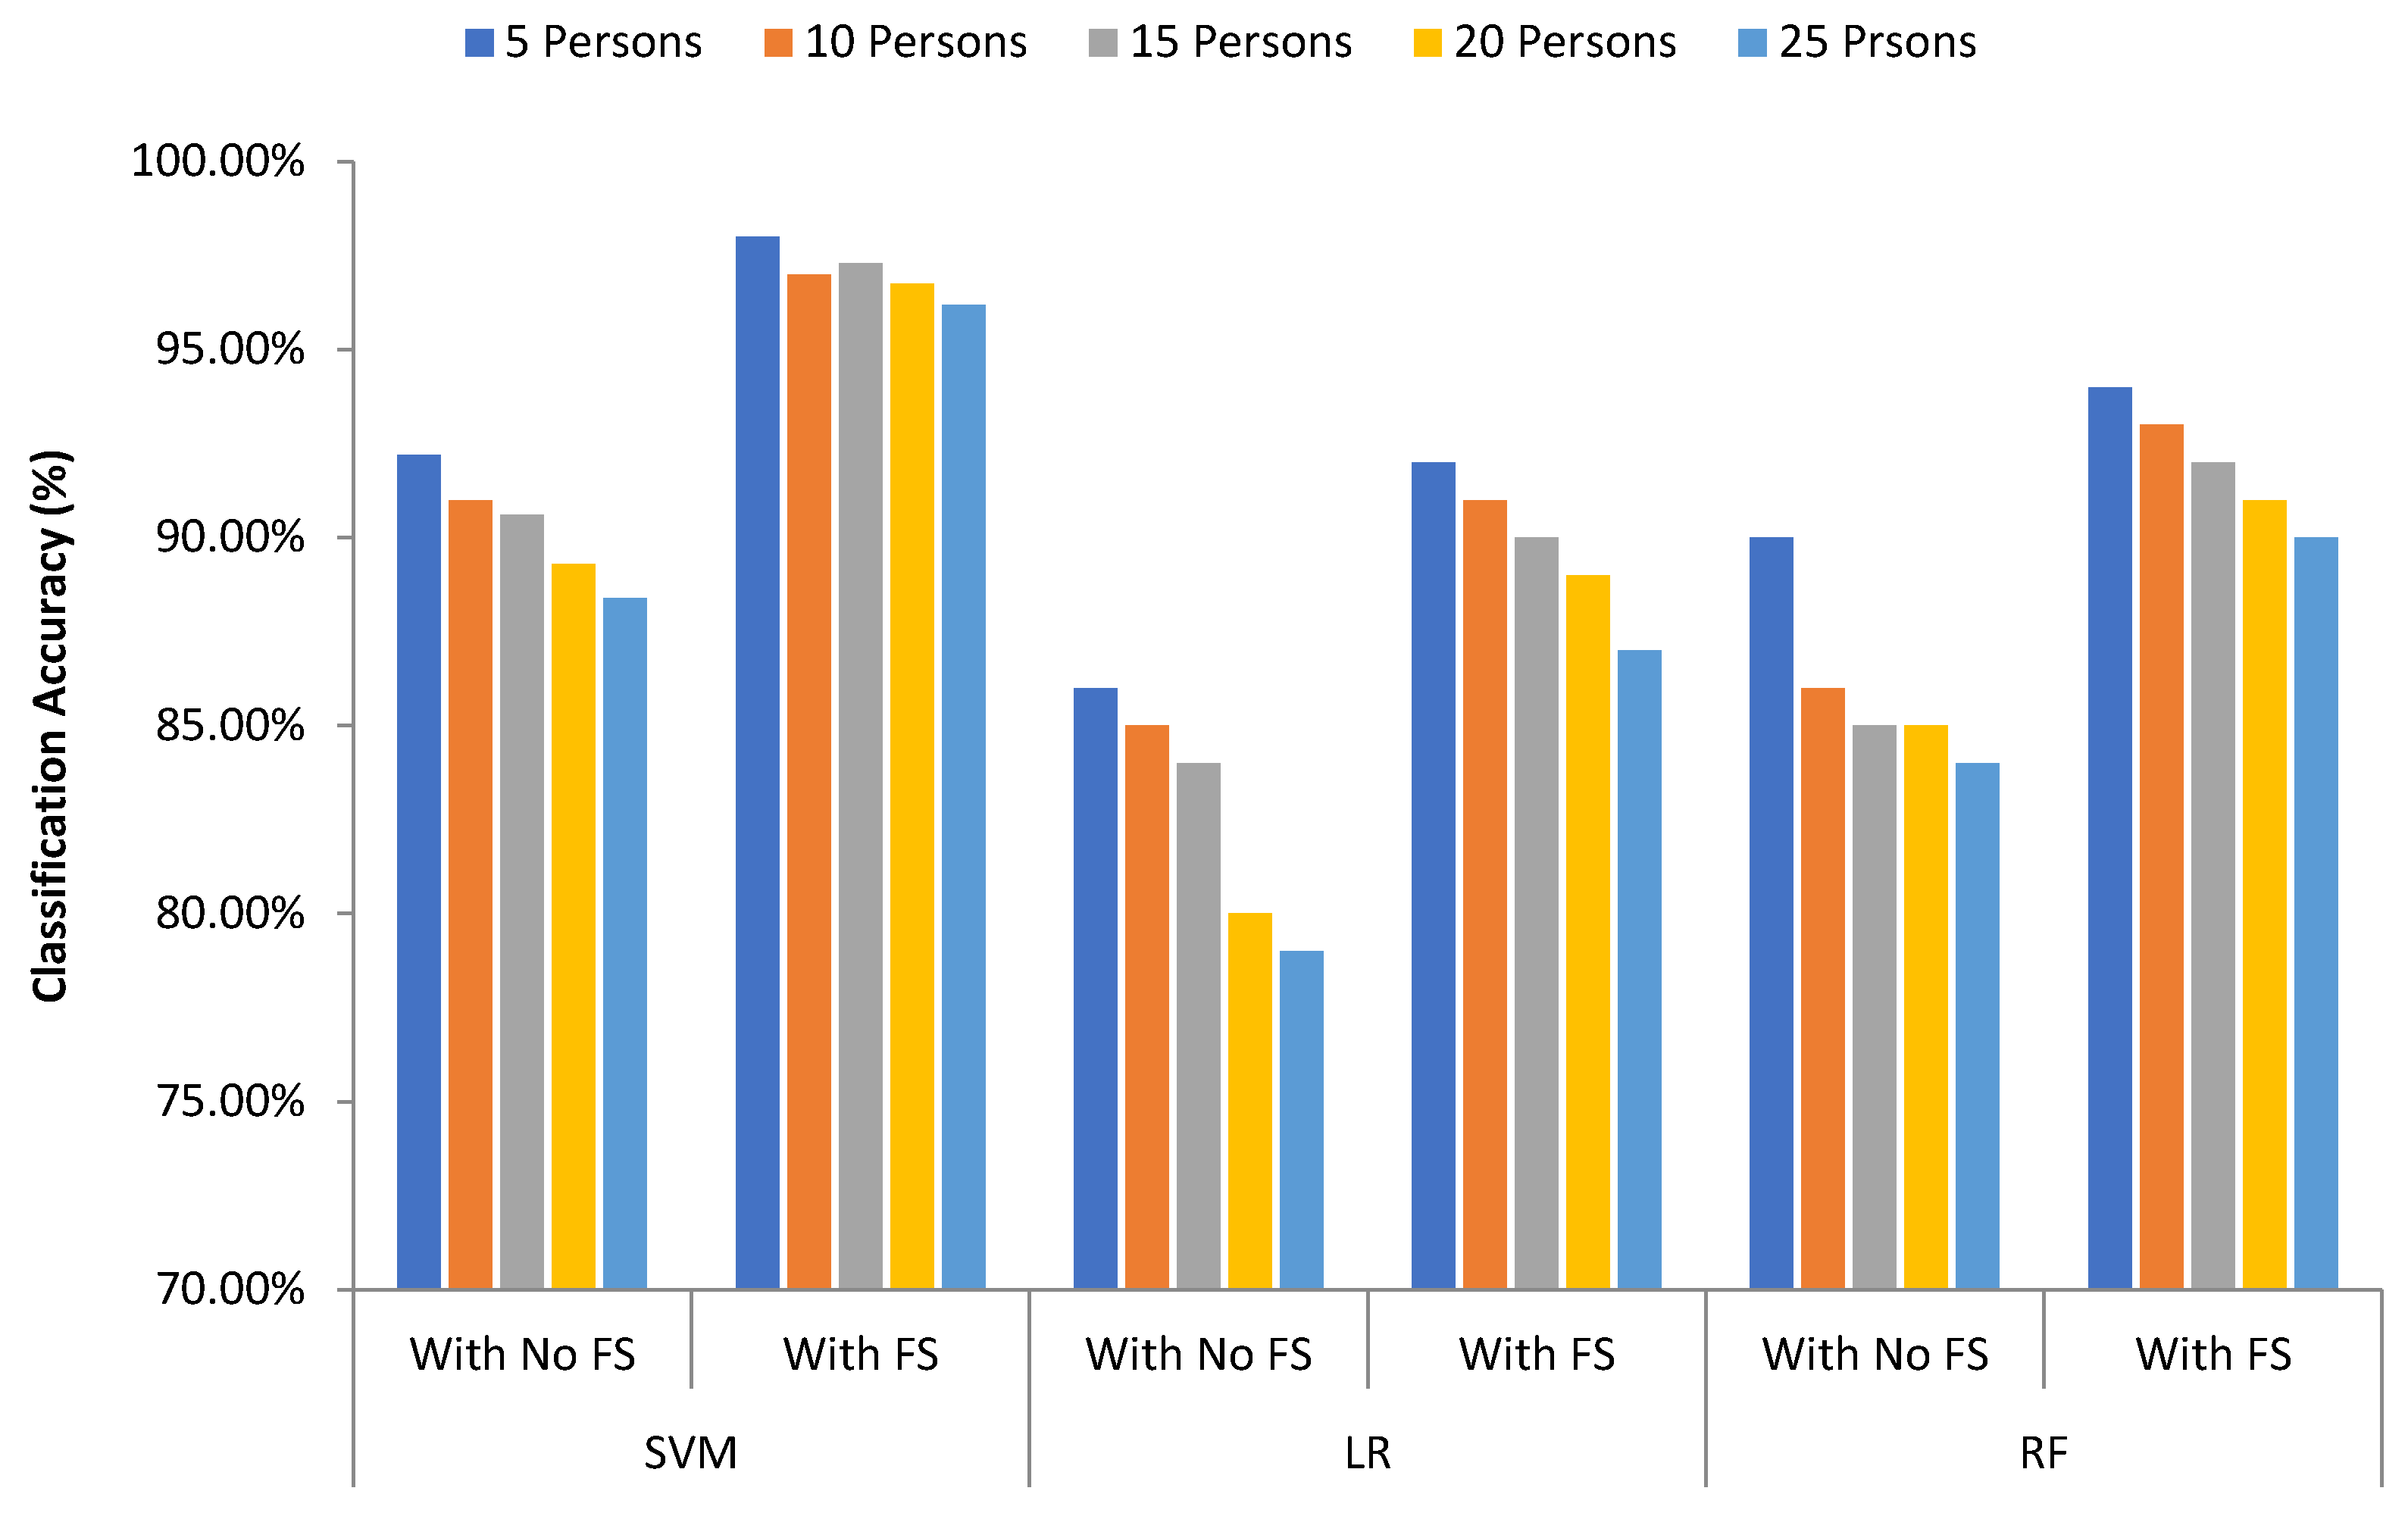
Figure 17 presents the overall accuracy of different groups of persons with feature selection and without feature selection using the SVM linear kernel technique. From the experimental analysis, it is found that our proposed system achieves higher results with the feature selection method than no feature selection process. For SVM, the highest accuracy with feature selection is 98.0% where that of which is 92.20% with no feature selection technique.
Three different machine learning algorithms are used to measure the classification performance of the proposed system.
Figure 18 shows the comparison of classification results of different algorithms that are used in the proposed system for different groups of persons. We have compared the classification performance without feature selection and with the feature selection (FS) technique. SVM provides the best accuracy outcome than logistic regression and random forest. The accuracy values are 98%, 92%, and 94% in case of SVM, in case of LR, and in case of RF respectively with feature selection process.
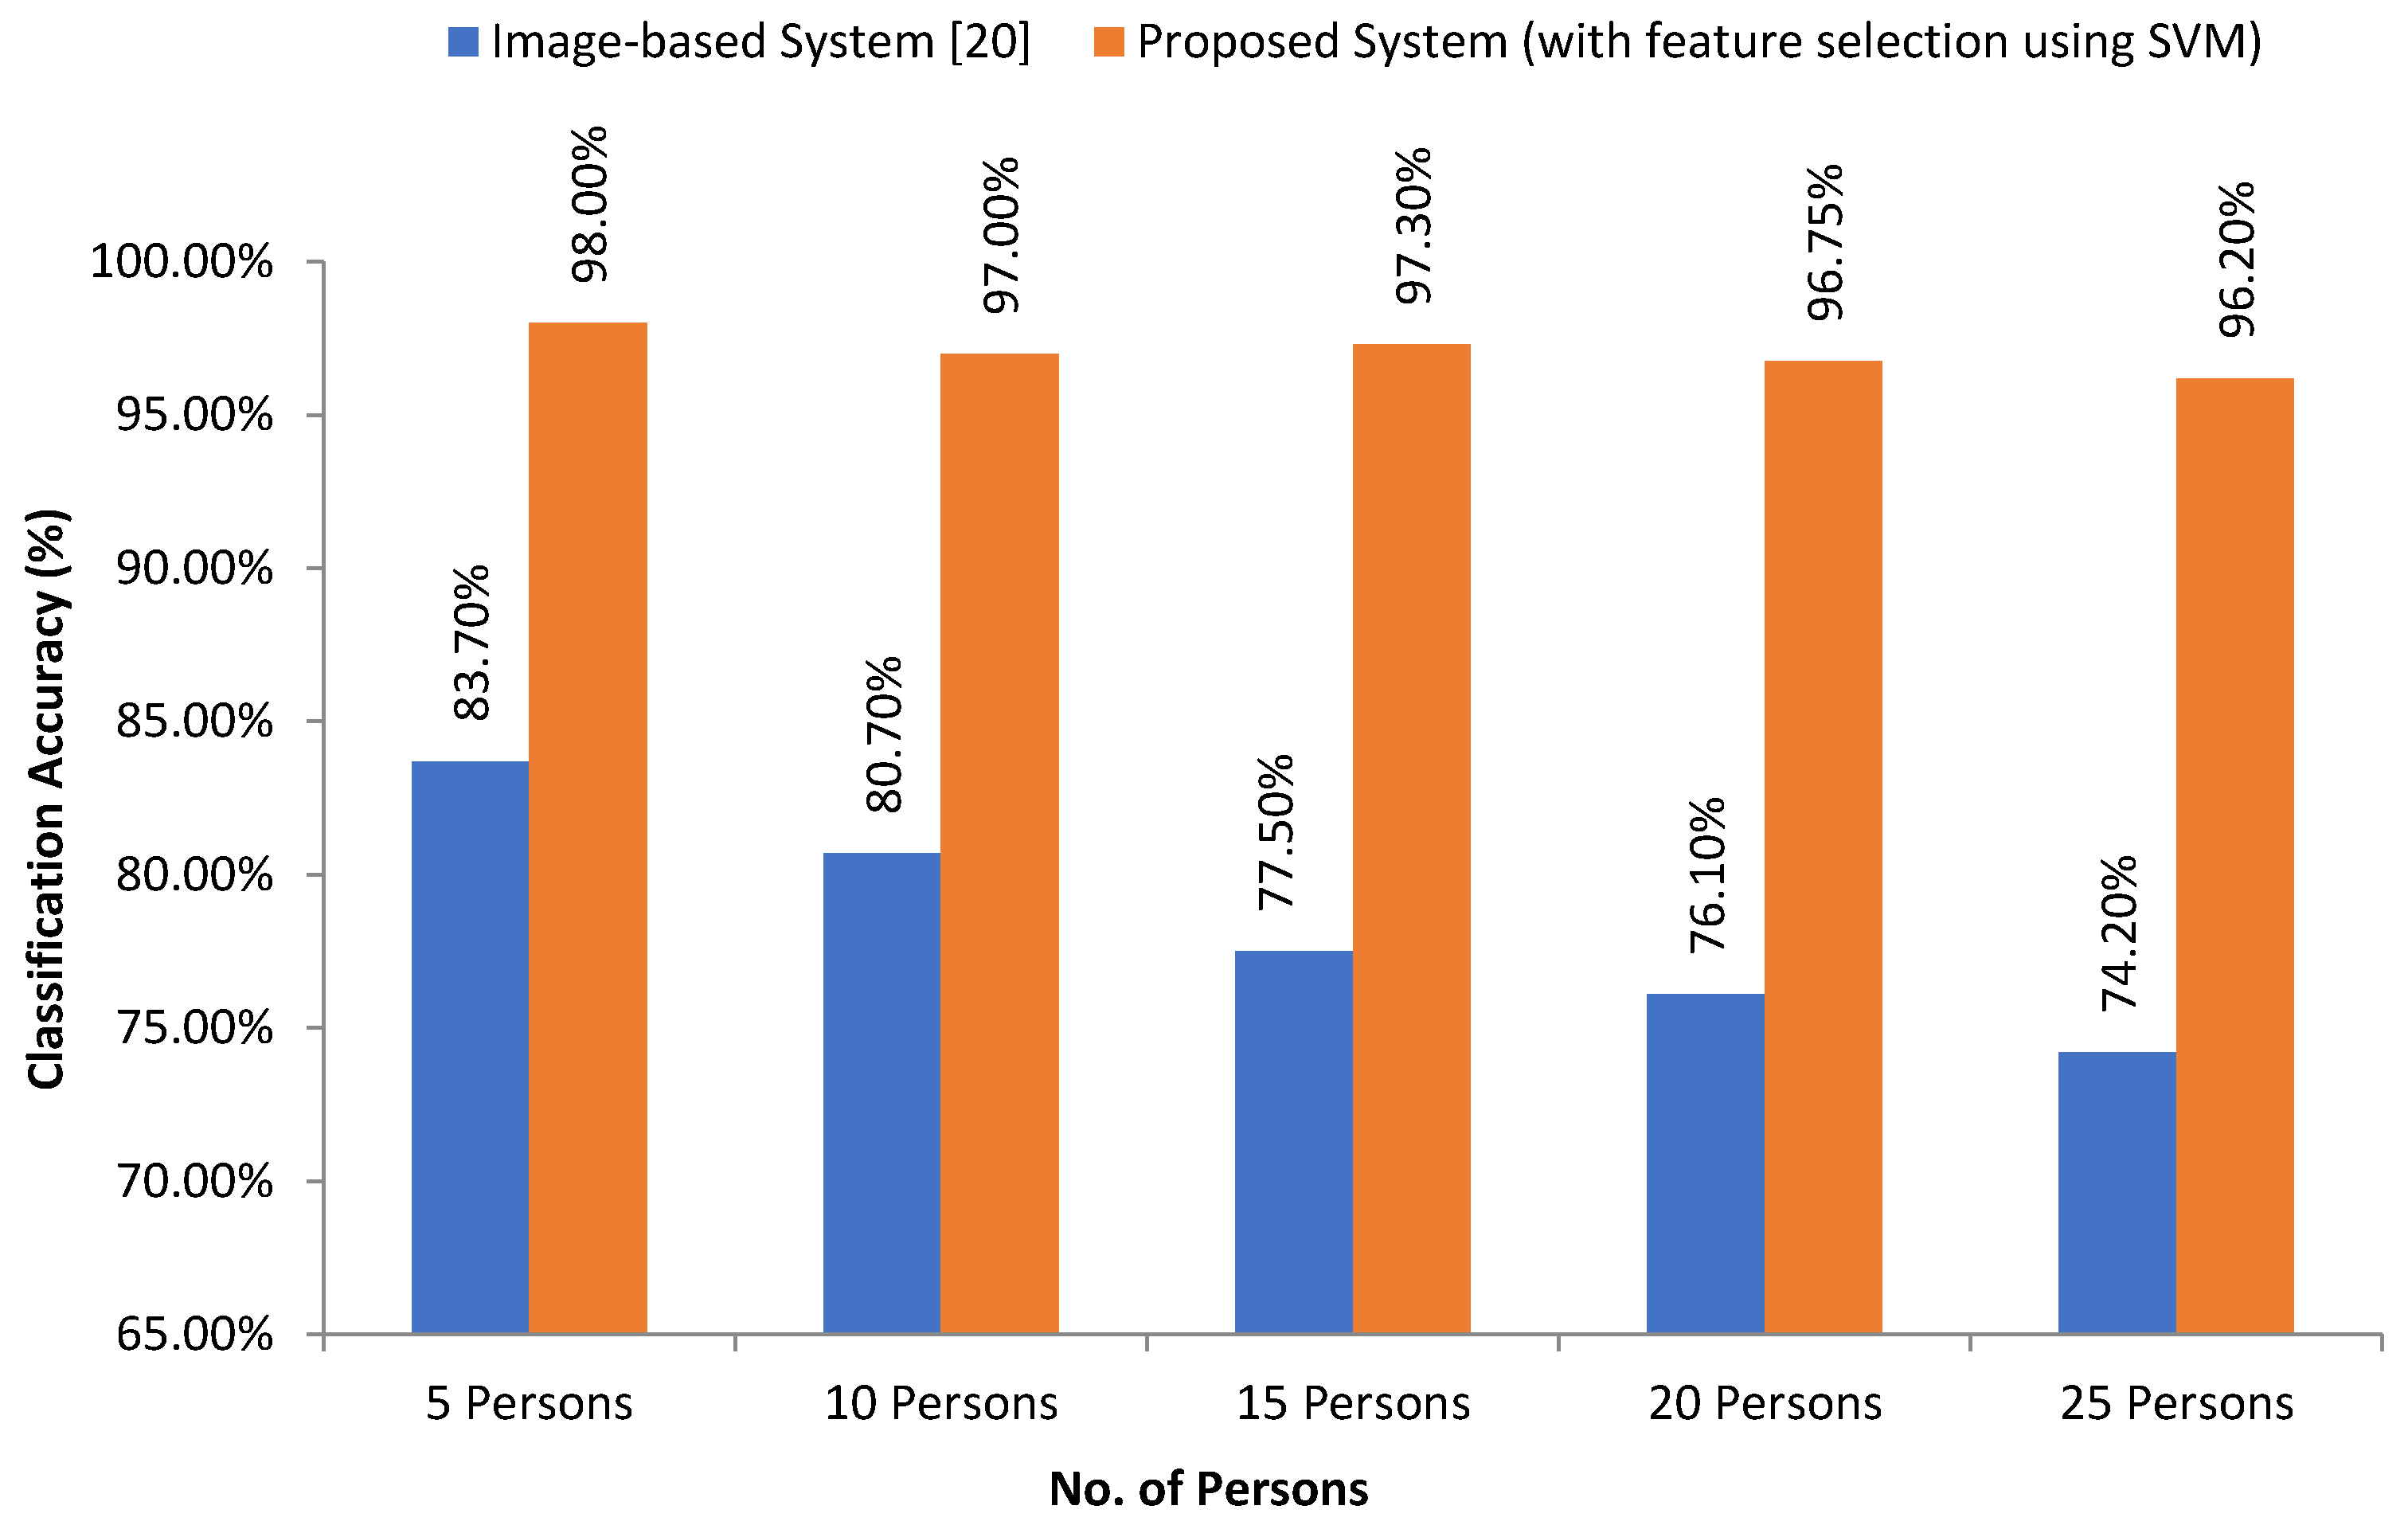
In [
20], the researcher proposed a writer identification system using image-based handwriting feature analysis using K-NN and neural networks. Here, the overall recognition rate is 74.2%, where all feature vectors in the training set are used as prototypes. They varied the number of neighbor’s k from 1 up to 25. In our case (pen-tablet sensor data-based), initially, we considered 25 persons, and the proposed system has 98% accuracy with the feature selection approach.
Figure 19 depicts the intuitive comparison between the state-of-art (image-based) system [
20] and our proposed system.
Table 8 presents a comparison summary of our proposed system with some existing studies. From
Table 8, we can see that our self-collected pen-tablet data are more robust in terms of noise effect compare to image-based. And our model outperforms with low computational costs.
5. Conclusions
This paper proposed a user authentication system by analyzing digital pen-tablet sensor data by optimal feature selection model which can successfully identify the writer. In this research, several statistical and kinematic features are extracted for classifying the users. However, not all the features are vital for the authentication of a user. Moreover, sometimes, extra features may degrade the performance of classifiers. Therefore, a hybrid optimal feature selection algorithm based on the filter and wrapper approach has been introduced to get the best optimal features from original high dimension feature vector. The selected features are then used for training and authenticating the writes using SVM, LR, and RF to identify based on person’s handwriting. To validate the proposed model, different handwritings from different users are collected using digital pen tablet. Ten specific keywords were written by the users iteratively. The proposed system shows 90% and 92% average classification results with feature selection techniques which are around 7% and 6% improved and higher performance than without feature selection technique using LR and RF respectively. The proposed system also shows 97% average classification results with feature selection technique which is around 7% improved and higher performance than the no feature selection phase using SVM. Among the 3 machine learning algorithms, the SVM performs outstanding compared to the rest.
The proposed system can successfully classify the given handwriting dataset. Thus, the system can be applied in some real applications like signature verification in the banking sector, proving the writer in forensic analysis, analysis of mental states of the writer, and so on. As the proposed system uses more genuine and robust sensor data for analyzing the handwriting, it can accurately predict the writer with limited computational resources and hardware costs which can be a good application in the case of small mobile devices.


 ,
, 


