Abstract
Hierarchical Bayesian models (HBM) are powerful tools that can be used for spatiotemporal analysis. The hierarchy feature associated with Bayesian modeling enhances the accuracy and precision of spatiotemporal predictions. This paper leverages the hierarchy of the Bayesian approach using the three models; the Gaussian process (GP), autoregressive (AR), and Gaussian predictive processes (GPP) to predict long-term traffic status in urban settings. These models are applied on two different datasets with missing observation. In terms of modeling sparse datasets, the GPP model outperforms the other models. However, the GPP model is not applicable for modeling data with spatial points close to each other. The AR model outperforms the GP models in terms of temporal forecasting. The GP model is used with different covariance matrices: exponential, Gaussian, spherical, and Matérn to capture the spatial correlation. The exponential covariance yields the best precision in spatial analysis with the Gaussian process, while the Gaussian covariance outperforms the others in temporal forecasting.
1. Introduction
Recently, traffic flow modeling has gained significant interest in the intelligent transportation and traffic management sectors, where it is used to describe and predict traffic status by modeling historical and recent traffic data. This directly benefits the traffic management sector by enhancing the infrastructure of transportation networks and supporting real-time decision making [1]. Additionally, traffic modeling takes into account other traffic issues, such as traffic safety and transportation efficiency. Therefore, a number of techniques, such as time series forecasting and spatial prediction, have been developed to study this area of research and to predict the changes in traffic behavior [2]. However, these traditional traffic modeling techniques perform poorly in terms of accuracy and effectiveness. Time series forecasting techniques and spatial prediction techniques suffer from several major drawbacks that affect the prediction accuracy [3,4,5], whereas time series forecasting techniques focus exclusively on the time series of observations and construct forecasting on the time element. These techniques are preferable when we only want to identify a directional movement in a time series. In spatial prediction techniques, it only takes into account the geographical space to build the prediction outcome. The lack of temporal factor in the spatial prediction would have a detrimental impact on the prediction accuracy [6]. Furthermore, the integration of the time and space factors in the prediction models significantly improve the prediction results. Therefore, a number of spatiotemporal approaches for analyzing and predicting the traffic status have been proposed in order to gain a deeper understanding of traffic data. These spatiotemporal traffic models can be defined as a statistical process to represent the behavior of traffic at a given location and time [7]. However, these proposed approaches have encountered obstacles in recent years, due to a number of challenges concerning modeling large-scale traffic data, traffic data with missing observations, and predicting traffic status for short-time intervals. These challenges require models that are not highly sensitive to outliers and do not require high computations in order to maintain good prediction accuracy [8].
Generally speaking, Bayesian-based spatiotemporal models offer a robust statistical framework to estimate the correlation between different dependent variables and yield accurate prediction results from complex data using probability rules [9]. They are structured to estimate the posterior distribution from the prior distribution of the model parameters using Bayes’ theorem [10,11]. Furthermore, the Bayesian approach provides a hierarchical implementation for modeling complex problems, such as large-scale traffic data with multi-dimensional time series [12]. The hierarchical implementation can provide an intuitive and understandable algorithm to compute the model parameters. These parameters in traffic data may appear to be quite complex to compute, due to the difficulties in determining the spatiotemporal dependencies between different geographic areas at different time frames [13]. Therefore, the Bayesian hierarchical approach is suitable to apply in traffic prediction for short-time intervals. However, most of the studies on hierarchical Bayesian models are centered around the usage of this approach in specific applications, such as the environment, healthcare, and finance [14,15,16,17]. This work contributes to existing knowledge of spatiotemporal traffic prediction models by providing experimental work, using hierarchical Bayesian models in the traffic domain.
Recent developments in the Bayesian modeling approach propose a hierarchical structure, where the model is built in multiple levels [14]. Each level is implemented through a number of iterations, using the Markov Chain Monte Carlo (MCMC) algorithm in order to define the prior, the joint likelihood of model parameters, and the joint posterior. The three levels (also known as sub-models), as described in the literature, build the HBM model’s functions. Bakar and Sahu [18] developed a hierarchical Bayesian approach, using three sub-models: data model, process model, and parameter model in its hierarchy. The results of their research support the space–time and air-pollution pair datasets to predict the daily 8 hour maximum ozone concentration [18]. The performance evaluation of their study using GP, AR, and GPP models shows high prediction accuracy with the used data. Utilizing their approach with different covariance matrices to predict the traffic flow data should make an essential contribution to the domain of spatiotemporal analysis. In this paper, we apply the HBM approach in the traffic domain, using the Gaussian process (GP), autoregressive (AR), and Gaussian predictive processes (GPP) approximation models. The estimation of model parameters is carried out using Bayesian inference, and different traffic data modeled for the experiments analysis. We apply these three different models to obtain accurate spatial prediction and temporal forecasting, using the HBM approach. We test four different spatial correlation matrices: Exponential, Gaussian, Spherical, and Matérn in the GP model. Constructing the temporal forecasting is based on two different units of time: day and month. We use two different datasets collected by the Chicago Transit Authority (CTA) about bus traffic counts to apply our model and conduct a spatiotemporal traffic prediction. The first dataset has its spatial points relatively close to one another, while in the second dataset, the spatial points distribution is widely spaced from each other.
2. Related Works
In the literature, various spatiotemporal modeling techniques have been proposed for traffic prediction, which can be mainly classified into two categories: parametric and nonparametric approaches [19]. The parametric approaches make assumptions and define a fixed-parameter for its structural algorithm. Parametric approaches, such as STARIMA, make assumptions on the variables and establish a structural algorithm with fixed parameters [20], while in the nonparametric approaches, such as neural networks (NNs) and Bayesian networks, the number of the model’s parameters grows as the size of the training data increases [19,21]. Having an infinite number of parameters makes nonparametric approaches suitable methods for analyzing and predicting spatiotemporal data. However, due to the complexity of estimating the spatiotemporal traffic data relationships, developing an efficient spatiotemporal traffic model becomes challenging [21].
Fusco et al. [22] propose a hybrid modeling framework for short-term traffic prediction that incorporates Bayesian networks (BN) and neural networks (NN) to model the spatiotemporal correlation between traffic variables. However, these two models have several drawbacks, which can be summarized as follows: (1) training data that are reasonable in size are computationally expensive when compared to other spatiotemporal models [23]; and (2) the lack of a clear methodology structure affects the reliability of the results [24].
Another research study for predicting traffic data with missing values using the ST-Kriging approach is proposed in [2]. The study indicates the efficiency of ST-Kriging methods in handling missing values. However, the prediction accuracy might be affected when each road network is considered separately [25]. Furthermore, the ST-Kriging approach faces some challenges that are highlighted in a study by Selby and Kockelman [26]. First, ST-Kriging prediction lies on the covariance matrix and the inverse covariance matrix; with large-scale data, the matrix inversion is difficult. Therefore, ST-Kriging prediction is implemented on data with relatively small sizes. Another challenge that the ST-Kriging approach faces is optimizing the semivariogram estimation and selecting the optimal lag size and the optimal number of lags [27], as there is no optimal approach for selecting these parameters.
Jones et al. [28] and Kotusevski and Hawick [29] propose spatiotemporal traffic modeling studies from a microscopic perspective. These studies, however, do not take into account the traffic flow status; instead, these methods focus on simulating the origin-destination (OD) element to develop a singular trajectory model that targets vehicle changing patterns associated with time and location [30]. Although there are numerous studies concerning traffic prediction, there is still a literature gap in modeling large space–time traffic data for short-time prediction considering both the spatial and temporal correlations [20].
On the other hand, a considerable amount of literature has been published on spatiotemporal modeling using a hierarchical Bayesian (HB) approach; however, these models were developed in different application contexts, such as public health, image processing and environmental modeling [31,32,33]. The basic idea behind hierarchical Bayesian modeling is to integrate prior knowledge about specific observations, such as air pollution concentrations, traffic flow values, etc., and then analyze the collected observations from each spatial point with the prior knowledge to predict new data that are more accurate and reliable [34]. One of the key features of the Bayesian approach is representing the uncertainty of all the possible predictive distributions, using probability distributions. The uncertainty in Bayesian inferences can be represented in terms of observations level, parameters level, and processes level [16]. Together, this gives a full joint distribution in a hierarchical manner to prove the accuracy of the hypothesis.
There is a wide variety of research on hierarchical Bayesian (HB) models applied to spatiotemporal data, such as environmental data, including weather conditions and ozone level concentrations [35]. These studies have shown that hierarchical Bayesian is more effective, accurate, and resilient, compared to other models. Bakar et al. [18] propose a spatiotemporal model to predict the ozone concentration level in New York City. The model is implemented in their spTimer R package to use one of the three models: GP, AR, or GPP. In their framework, they use a Gibbs sampler to estimate the likelihood functions. The structural framework and the three models have achieved precise results in analyzing and predicting spatiotemporal data.
In order to leverage this robust approach in the spatiotemporal traffic domain, we apply all three different models with different traffic data, and different covariance matrices in the GP model. The findings of the performance of the covariance matrices conclude that covariance matrices perform differently based on different characteristics of the dataset. Before discussing the methodology, we look into the existing literature on the GP, AR, and GPP models to explore the key theoretical concepts for better understanding.
2.1. Gaussian Processes (GP) Model
Gaussian processes (GP), which are also known as kernel-based learning algorithms, have become more popular in spatiotemporal research due to their ability to effectively model complex, nonlinear relationships [36]. GP models are very effective tools for investigating implicit correlations between parameters, which makes them particularly effective for complex nonlinear classification and regression analysis [37]. A highly appealing feature of GP models is that they are developed using a Bayesian framework, which enables probabilistic predictions based on the model’s parameters. Furthermore, Bayesian learning may be utilized to determine the parameters of GP models. It has been shown in a variety of research areas, including geostatistics, general regression, time series, and spatial statistics that GP models outperform other standard techniques. In terms of traffic-related studies, GP models have been successfully applied in different studies, such as traffic congestion [38], travel times [39], public transportation flow [40], etc.
Additionally, GP provides excellent accuracy in learning and is relatively straightforward to apply. However, the GP model computational cost is expensive, due to the covariance matrix, where its computational complexity is and its memory complexity is [41]. This may limit the use of the GP model when N is large, where N is the number of observations [37]. To overcome this issue, a number of studies have suggested reducing the run-time complexity by reducing the number of the parameters, which can be achieved by producing sub-samples of the observations using hierarchical structures [42].
2.2. Autoregressive (AR) Model
An autoregressive (AR) model is a statistical model that represents a time series process. The AR model refers to the order (p) element in the autoregressive integrated moving average (ARIMA), which has the order (p, d, q) and autoregressive moving average (ARMA) with the order (p, q) [43]. The AR, MA, ARMA, and ARIMA models are commonly used in time series forecasting studies [44]. AR models are composed of three steps, the first of which is used to find correlations in time data. The second step defines the model parameters, and the third step forecasts the time series future points.
Numerous studies have been conducted on traffic modeling using AR, MA, ARMA, and ARIMA statistical models. A suggested methodology integrating ARIMA with generalized autoregressive conditional heteroscedasticity (ARIMA-GARCH) [45] was applied for traffic flow prediction in short-term time series; however, the methodology failed to achieve significant improvement over the standard ARIMA, where the parameters model in ARIMA is easily interpretable, unlike the GARCH model [43].
Although all these time series methods are widely used in traffic prediction, the majority of the research found in the literature focuses on applying these methods on large time windows [46]. A study by Song et al. on short-term traffic speed prediction provides a comparison between four prediction methods with different data collected in a varying time window ranging from 1 min up to 30 mins [47]. The study proposes a seasonal discrete grey model (SDGM) and compares the prediction accuracy with the seasonal autoregressive integrated moving average (SARIMA) model, artificial neural network (ANN) model, and support vector regression (SVR) model. The findings of this study show that the prediction accuracy increases when the target time window is more than 10 min, whilst the prediction of the time window that is fewer than 10 min suffers from instability. Additionally, the study shows that the SARIMA performance has the highest error indicator in the prediction results. A probable explanation regarding these results is that SARIMA cannot capture the variation characteristics of the traffic data in a small time window [48].
2.3. Gaussian Predictive Processes (GPP) Model
Gaussian predictive process (GPP) models are developed to address the significant computational cost associated with calculating the covariance matrix in Gaussian predictive process (GPP) models, particularly when modeling large spatiotemporal datasets [36]. GPP models work best on modeling spatial data points that are distributed over a large distance [49]. To date, relatively little research on GPP models has been conducted on spatiotemporal data since the current literature tends to focus on the theoretical features of GPP models, which makes them an interesting topic for research [50].
3. Methodology and Data
We can summarize the fundamental concept of Bayesian theory into three keywords: prior, likelihood, and posterior. The prior is an initial belief to begin with, based on the current/historical information, and can be updated when new information arrives. The likelihood is the joint distribution of the data, given the model parameters , and . Model parameters can be determined after updating the prior. Lastly, the posterior is the conditional probability distribution of our dependent variable , which depends on the data and the prior. The posterior is computed as the product of the prior and likelihood [17].
Generally speaking, the Bayesian inference can be performed as follows: (1) define the prior empirical probability distribution or the assumptions for the hypothesis; (2) compute the marginal likelihood probability of the data using a sampler (e.g., MCMC) to generate random samples from the probability distribution [51]. In each sample, calculate the marginal likelihood probability, which contains all the relevant information to evaluate the evidence. However, estimating the marginal likelihood typically is a difficult task because we have to integrate all model parameters; and (3) determine the posterior, which is the probability distribution of a particular value of the parameter after having seen the whole data set [16]. The Bayesian inference theory is formally expressed as follows:
3.1. Hierarchical Bayesian Modeling
The hierarchical Bayesian model can be structured as three levels of probabilistic models [18]: the data model, the process model, and the parameters model. These three levels (or stages) can be represented as follows:
In the first level, we obtain the data model according to a certain process and some errors that are assumed to be independently normally-distributed (). The data model is described as shown below:
The process model in Equation (2) captures the relationship of the underlying nature expressed by the data at location s at time t. The process model can be one of three; Gaussian process (GP), autoregressive (AR), or Gaussian predictive process (GPP). In Equation (2), the process is expressed by a Gaussian process in addition to some errors :
The third level of hierarchical modeling defines the model parameters. According to Equations (1) and (2), these parameters are the variance of , the variance of , the coefficients of the GP, and , which defines the spatial correlation.
Generically, Equation (3) represents the structure of estimating the model parameters of the hierarchical model, using Bayesian inference. Starting with the Gaussian process, , which follows a normal distribution conditioning on the model parameters , where is a vector containing , , and . The prior distribution of conditioning on where will have a prior distribution that follows a gamma or uniform distribution.
From Equation (4), the posterior distribution is proportional to the likelihood being conditional on both , and multiplied by the prior for and . Based on the conditional independence rules and knowing that our data are independent of , if we know , we can take the joint distribution and break it down into conditional distribution and multiply it by the distribution of . Equation (5) formalizes these steps, which is derived from Equation (4).
3.1.1. Gaussian Processes (GP) Model
The GP includes the temporal effect as well as the spatial effect denoted in Equation (6), which captures the space–time relationship [52].
where Y is the value of the traffic flow at location s at time t; is a set of spatial coordinates ; and , is the total number of locations. For the temporal component, is a set of time series where we have two time components denoted by l and t that represent the short time component and the long time component, respectively. In our dataset, we only use the day and month at the observed spatial points. The dataset has 28 locations, and we use the generic spatial process to define the spatial process . We compare the spatial process to the temporal process to decompose Y in Equation (6), where the spatial process at fixed time and the temporal process at fixed spatial point are denoted by Equations (7) and (8), respectively [52]:
By combining and as follows:
where the dimensional distributions are determined by the mean function , and the covariance matrices for all spatial points . Since we are using the GP to build the HBM, we define the hierarchy of the GP in Equation (10):
The long time unit is denoted by L, where and the short time unit is denoted by , where .
Our dataset is represented by , where is a random error that we assume to be independently normally-distributed that follows , and we can break down Equation (2) as follows:
Let be the spatiotemporal random effects, and is the mean function at location at time . The mean can be represented by , where represents the vector of regression coefficients and represents the matrix of the covariates between time and space. Thus, Equation (2) can be written as follows:
Different spatial covariance matrices show significant positive results on the prediction outcomes, where estimating the correlation for the space-time effect on a specific observed value is a major step in fitting the model. In the following, we briefly describe these four covariance matrices.
Spatial Covariance Matrices: In GP, the spatial correlation parameter is calculated by applying one of the four covariance matrices: exponential, Gaussian, spherical and Matérn. We refer to the spatial covariance function by , which includes three parameters: , and the distance between two spatial points and , which is calculated as .
When the distance between and increases, their correlation level decays, and we refer to this by the parameter , where it dominates the rate of the correlation of and locations; is the smoothness parameter that softens the fitted curve of the model. The term computes the variance–covariance matrix, where is the site invariant spatial variance. The spTimer package uses exponential as the default spatial covariance matrix. The decay of the correlation function is calculated as follows [53,54,55]:
where and . Similarly, in the Gaussian covariance matrix, the square of the exponential covariance matrix is calculated as follows [53,54]:
The spherical covariance matrix takes in consideration the range “distance” over pairs of spatial points. The covariance vanishes when the distance between and is zero [53,55].
The Matérn covariance matrix includes the modified Bessel functions of the second kind that is sometimes called the Basset functions, and it is given by Equation (18) [56]:
Let denote all the generic quantities parameters of the GP model, and we integrate the posterior predictive distribution for over the model parameters with respect to the joint posterior distribution as follows:
3.1.2. Autoregressive (AR) Model
The independent AR model is proposed by Sahu et al. [18]. Let be the vector of observations and be the true square root of the bus count in l and t that represent the short time component, and the long time component at sites . We define the hierarchy of the AR model in Equations (20) and (21):
is a random error that we assume to be independently normally-distributed that follows . We assign a prior distribution as shown in Equation (21), where denotes the unknown parameter for temporal correlation with . The parameter is used to reduce the computations in the GP model.
We continue to assume that represents the matrix of the covariates between time and space, and represents the vector of regression coefficients. The spatiotemporal random effects error is distributed as stationary parameter with zero mean”. Let denote all the parameters of the AR model, and we integrate the posterior predictive distribution for over the model parameters with respect to the joint posterior distribution as follows:
3.1.3. Gaussian Predictive Processes (GPP) Model
The GPP model is mainly used to predict values for large spatial datasets that are sparse, and it applies sparse matrix algorithms to overcome the high computational cost when modeling the parameters of the large dataset, unlike the GP and AR models that use dense matrix algorithms.
The GPP models is a modified version of the AR model, where the spatiotemporal random effects error is distributed as stationary parameter with zero mean in the AR model, while in the GPP model, we define the random effects at each spatial point , , which we call knots. Let denote the spatial random effects at these locations . We define knots of spatial points as a grid before fitting the model. Defining the knots grid reduces the computational complexity of the GPP model when modeling large datasets. The GPP defines the random effects of each spatial point inside the boundary of the selected grid. Different grid sizes can be selected, such as , , , , , and . The knot length needs to be equal to or less than the number of spatial points. We define the hierarchy of the GPP model in Equations (23) and (24):
Let denote all the parameters of the GPP model, and we integrate the posterior predictive distribution for over the model parameters with respect to the joint posterior distribution as follows:
3.1.4. Gibbs Sampler
The Gibbs sampler is an MCMC algorithm that generates a sequence of observations (samples) from a specific multivariate distribution of the hierarchical model parameters. It starts by simulating a sequence of random vectors , for , and . Then, it choose a starting point for which [57]. (Algorithm 1)
| Algorithm 1: Gibbs Sampler |
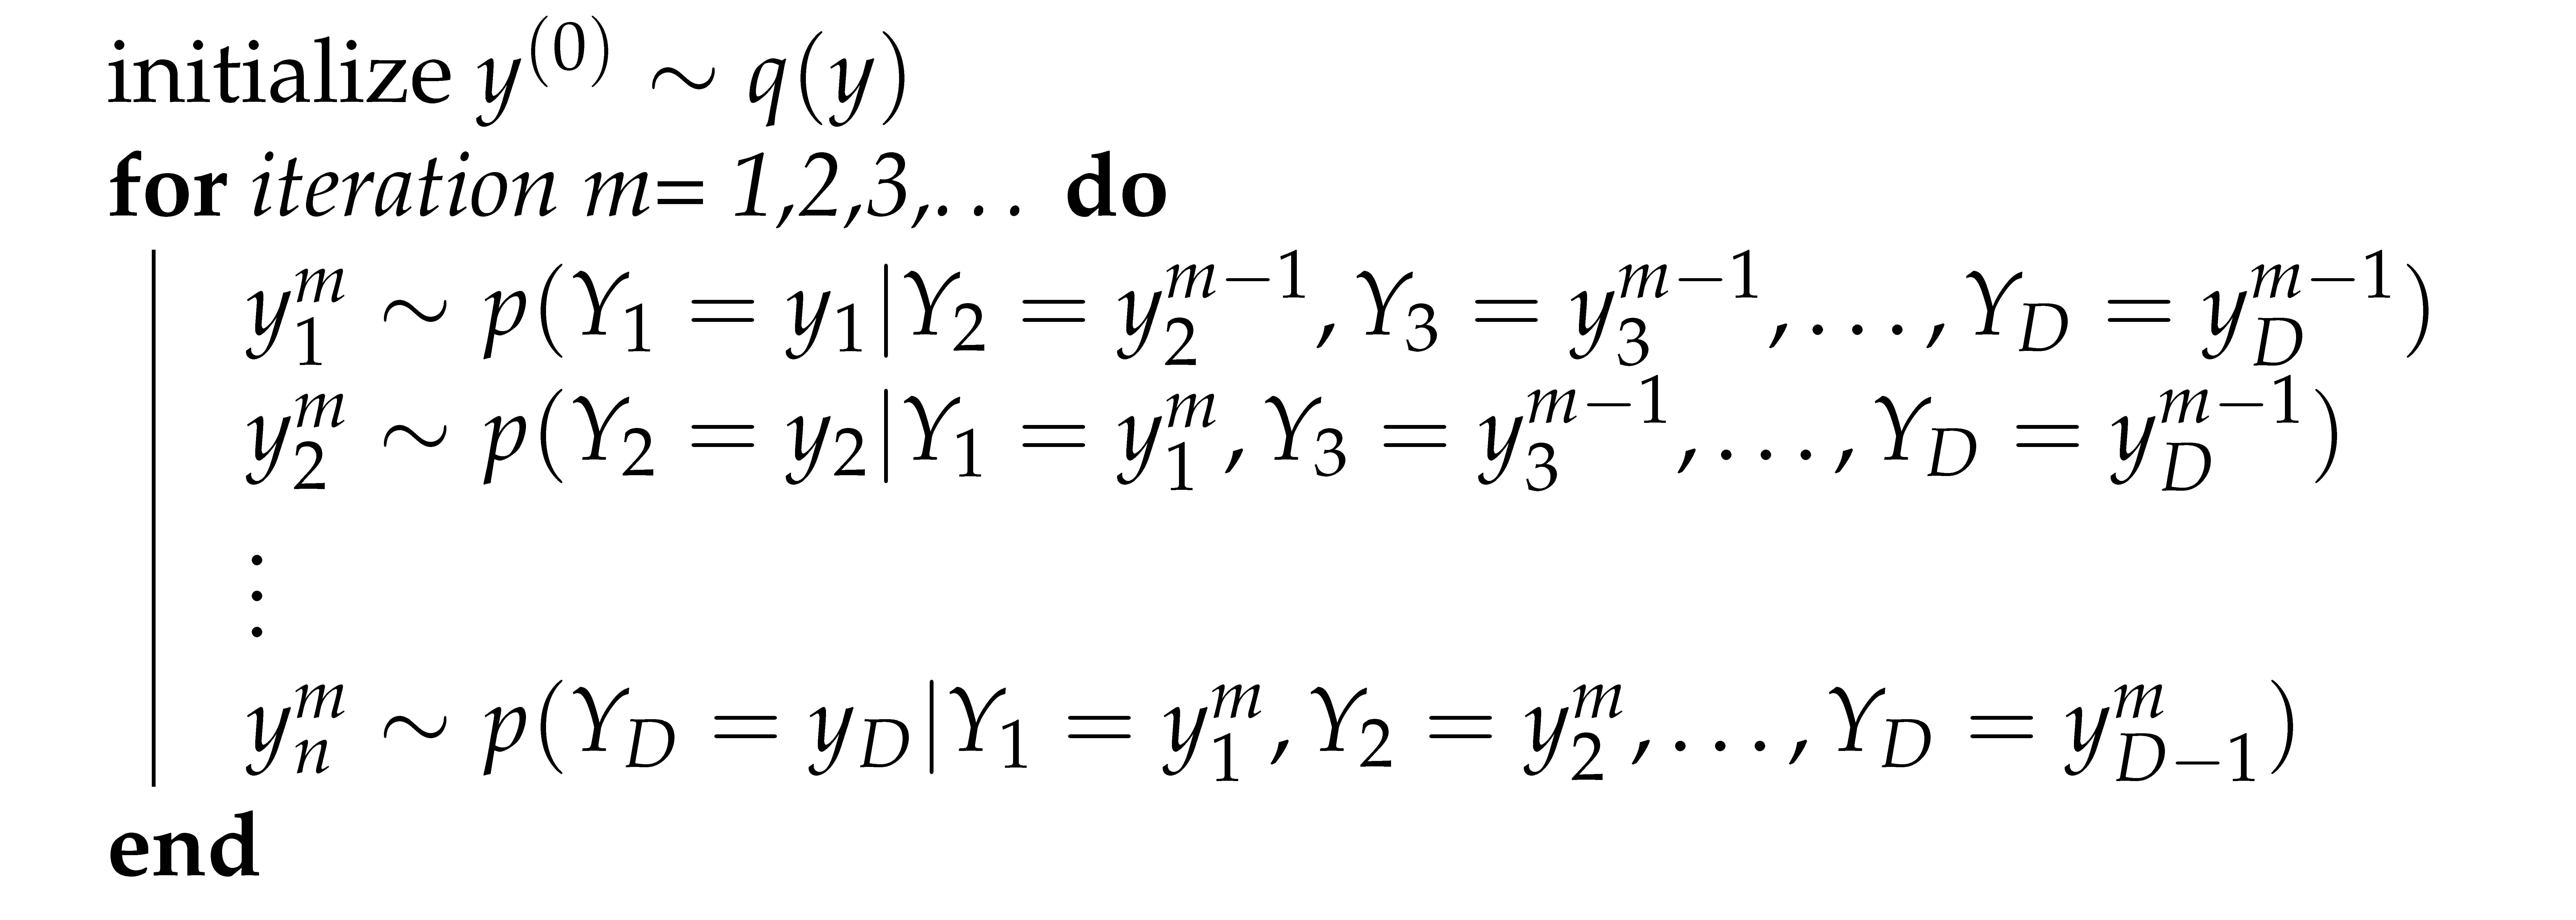 |
Gibbs sampling allows us to examine each variable and calculate its conditional distribution for the random vectors , and the value for each random variable is initialized from the prior distribution. In each iteration m, the sampler produces the samples of as follows:
The Gibbs sampler stops when all generated sampling values have the same distribution size. Algorithm 1 [57,58] provides the procedure that the Gibbs sampler uses to generate the samples. Samples are generated by examining each random variable one at a time and obtaining samples from the conditional distributions of each variable. A sequence of pairs of random variables is generated as follows: .
3.2. Study Area and Data Preprocessing
The datasets we use in this study are collected from the Chicago Transit Authority (CTA). The data include information about public transportation bus counts in Chicago and the neighboring areas. We select this dataset, due to the importance of public transport, which plays an essential role in the development of large cities and is considered an economical way of transportation. However, this mode of transportation is often involved in traffic congestion [1]. Understanding the public transit traffic data helps in improving public transport services and generally enhances road traffic management. The two study areas include 29 sensors, where the first dataset has spatial points distributed mostly in downtown Chicago. The second dataset contains sparsely distributed spatial point data as shown in Figure 1 and Figure 2. Both datasets include the number of buses, their speeds, and the number of sensor readings every 10 min from August 2018 to December 2019.
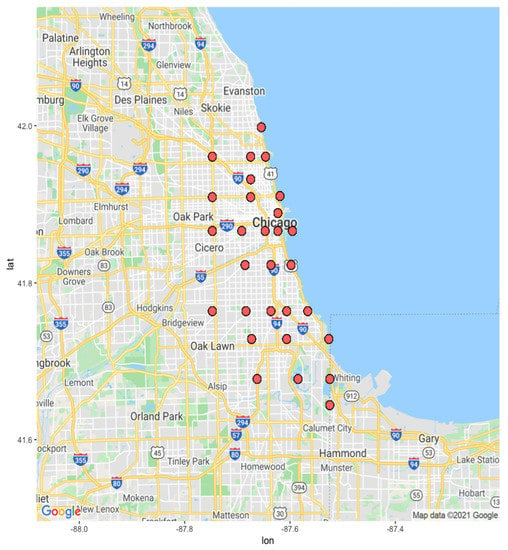
Figure 1.
The sensor locations in the dense dataset.
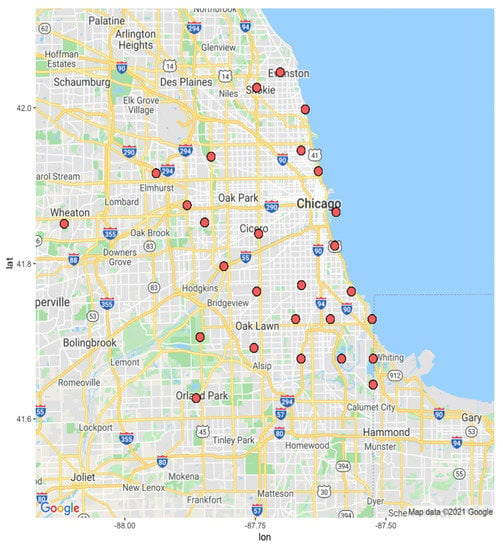
Figure 2.
The sensor locations in the sparse dataset.
A quick exploration of the data presents the aggregate number of buses for each day as shown in Figure 3 and Figure 4 The reason we are showing this visual analysis is to illustrate the variations in traffic patterns over days, which does not exhibit normal distribution. Unlike most of the other spatiotemporal analysis techniques, HBM can efficiently deal with data that do not have a normal distribution [59].
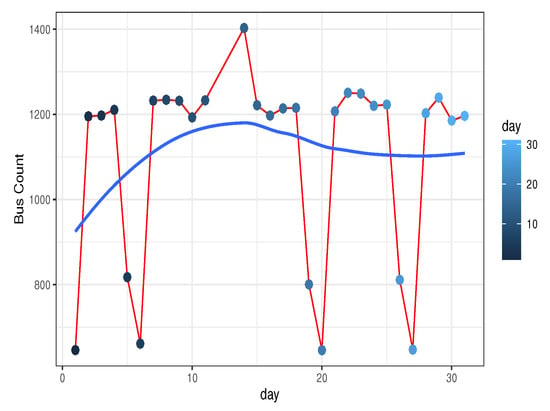
Figure 3.
The average volume of the bus traffic count per day in the dense dataset.
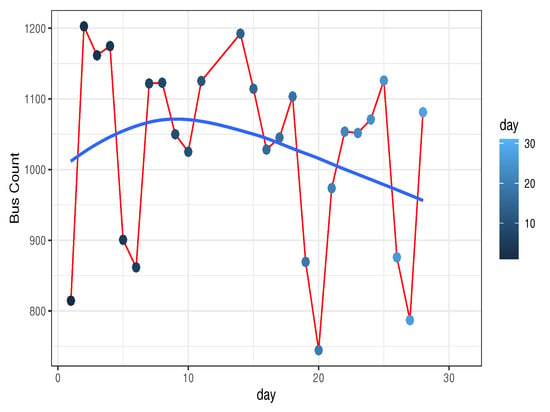
Figure 4.
The average volume of the bus traffic count per day in the sparse dataset.
We estimate the distance between all spatial points in both datasets and find that the minimum distance is 2 km and the maximum distance is 20 km in the first dataset. The second dataset shows a minimum distance of 4 km and a maximum distance of 79 km. On the first dataset, we apply the GP and AR models, whereas, on the second dataset we apply all the three models GP, AR, and GPP with three days of missing observations. Due to the small distances between spatial points, the GPP model cannot be used with the first dataset. We define the knot size with a grid of , which includes the random effect of 16 spatial points. We cannot define a grid of or higher since it requires 36 spatial points and our dataset only includes 28 spatial points. The approach does not perform accurately with short-time units “hour”, due to implementation limitations in the spTimer package. That is why we opt to use the daily aggregate data. We train the model on 21 locations for the time period starting from 1 January 2019 to 29 January 2019. Then, we test the model performance on the eight locations that will be defined in the Gibbs sampler.
4. Results and Discussion
The hierarchical Bayesian approach using the three models GP, AR, and GPP are applied in this study to model the correlation between time, location, and the bus speed of the bus traffic data. In our experiment, we run GP and AR models on the dense dataset, and then we run the three models GP, AR, and GPP on the sparse dataset with missing observations. In terms of modeling the first dataset, the results show that the GP model outperforms the AR model from the spatial prediction side, while the AR model provides better performance in terms of temporal forecasting. The GPP model cannot be applied to this data since the spatial points are close to each other, which cannot fit the sparse matrix. A number of performance criteria are used to measure the accuracy of the models, including the mean absolute error (MAE), root mean squared error (RMSE), and mean absolute percentage error ( MAPE) as shown in Table 1, Table 2, Table 3 and Table 4 [60,61]. We compare the MAE, RMSE, and MAPE outputs of the three models: the GP, the AR, and the GPP. In the GP, we compare the results for the spatial prediction with the exponential, Gaussian, spherical, and Matérn covariance matrices.

Table 1.
Spatial prediction error of GP and AR models.

Table 2.
Temporal forecasting error of GP and AR models.

Table 3.
Spatial prediction error of GP, AR and GPP models.

Table 4.
Temporal forecasting error of GP, AR and GPP models.
Table 1 and Table 2 provide the performance measurements of the spatial prediction and the temporal forecasting for the AR and the GP model with the different covariance matrices. Interestingly, we observe similarities in the accuracy error between the exponential, spherical, and Matérn in the GP model. The exponential covariance provides the best performance with the GP in spatial prediction and is slightly better than the spherical and Matérn. The Gaussian provides the lowest spatial prediction accuracy out of the four covariance matrices. As for the AR model, it provides better performance in temporal forecasting, due to the greater flexibility of the AR model in representing the changes of the data in time series. We attribute the unsatisfactory results of the GP model, in particular the Gaussian covariance, to the multiple distributions of the data. This explains the poor performance that Gaussian covariance provides, where Gaussian covariance is suitable for data with normal distribution. However, using data that follow a normal distribution would provide significant improvements in the error results for both models.
Table 3 and Table 4 provides the performance measurements of the temporal forecasting for the three models. The GPP model outperforms the AR and GP models. Although we have missing observations in the training data and the predicted data, the three models provide good performance in general; however, none of these models can predict missing observations because of the limitation of the Bayesian approach when modeling missing data points. The Bayesian approach samples unknown observations or missing observations, using the MCMC algorithm, but when we compute the covariates in the Gibbs sampler, the sample with missing observation will not be included.
To provide a fair comparison, we concentrate on the results of the three models applied on the second dataset. The relationship between the residuals and the estimated responses that present the predicted response is shown in Figure 5, Figure 6 and Figure 7. Figure 5 illustrates the residuals estimation plot of the GP model, using the Matérn covariance matrix where Figure 6 and Figure 7 represent the residuals estimation plot of the AR and the GPP models, respectively. It appears that residuals roughly form around the zero line, especially in the GPP model. Additionally, most of the predicted responses fall on the estimated regression line. These points explain the relatively good correlation between residuals and fits. In Figure 5 and Figure 6, the mean residuals change with the fitted values, where the spread of the residuals increases as the fitted values change. In Figure 7, the residuals are mostly negative when the fitted value is small.
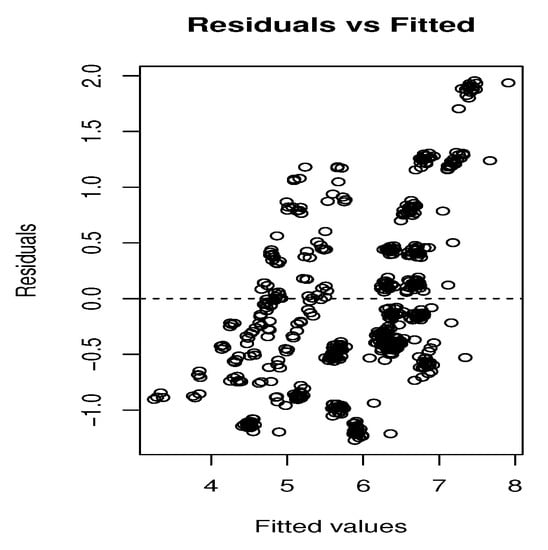
Figure 5.
The residuals versus the estimated responses of the GP model.
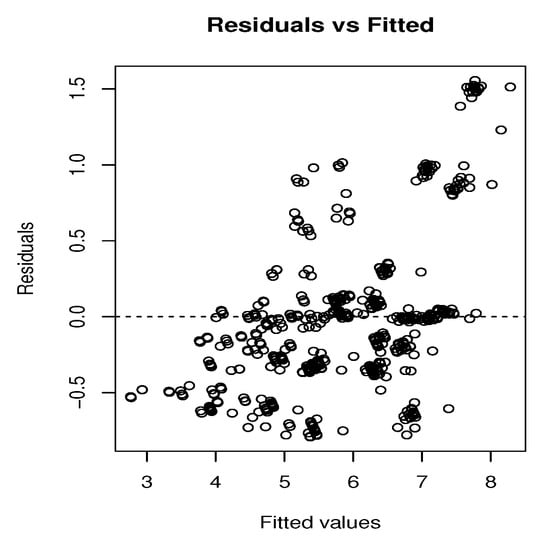
Figure 6.
The residuals versus the estimated responses of the AR model.
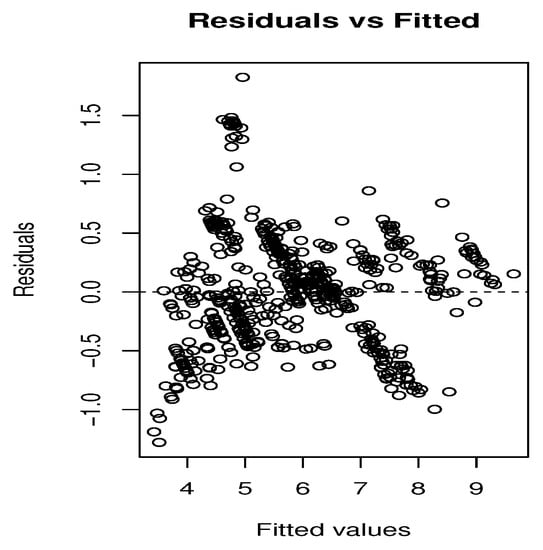
Figure 7.
The residuals versus the estimated responses of the GPP model.
Prior to evaluating the performance of the MCMC chain, we plot the correlograms of the autocorrelation coefficient function at different lags. The MCMC chain demonstrates a significant relationship between the different lags. This implies that the present value is continually influenced by the prior values, confirming their interdependence. We assess the MCMC performance by applying some available diagnostic tests, such as Geweke’s convergence, and Gelman and Rubin’s diagnostic. The Gelman and Rubin’s diagnostic requires multiple MCMC chains run in parallel to compare the autocorrelation coefficient of the multiple MCMC chains as shown in Figure 8, Figure 9 and Figure 10. The estimated variance of each parameter within the MCMC chain is very small, which indicates that the MCMC chain has converged. The statistical results of the Gelman and Rubin’s diagnostic match the results of the auto-correlation coefficient figures, where the convergence diagnostic is 1.03 in the three models. Having convergence less than 1.1 means that the chains have converged. We run the MCMC for 5000, 10,000,and 15,000 iterations to produce samples, and then set the number of burn samples to 0. We conclude that running MCMC for 15,000 iterations does not substantially enhance the prediction accuracy when compared to running MCMC with the default 5000 iterations. This process, however, increases the computation time but does not achieve high accuracy. Additionally, we notice that the size of the knots has an impact on the prediction accuracy in the GPP model, where the grid output only contains 16 spatial points and discards 12 spatial points, resulting in MCMC samples created from only 16 spatial points. Although the GPP model outperforms the other models, the dataset is insufficient to demonstrate the suitability of the GPP model.
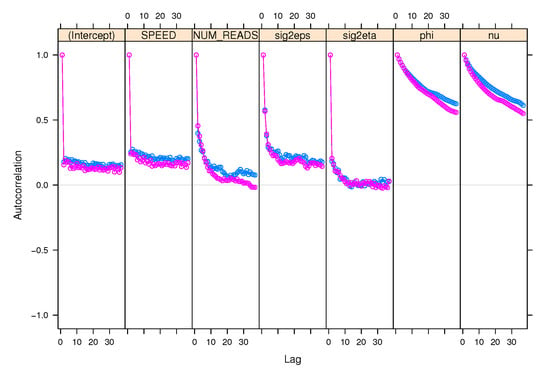
Figure 8.
The autocorrelation coefficient estimation using two different lists of MCMC chains in the GP model.
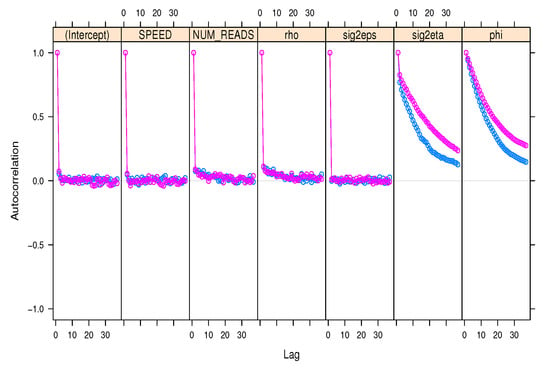
Figure 9.
The autocorrelation coefficient estimation using two different lists of MCMC chains in the AR model.
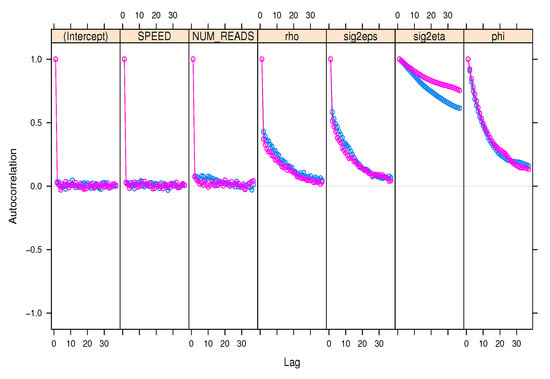
Figure 10.
The autocorrelation coefficient estimation using two different lists of MCMC chains in the GPP model.
Another interesting finding is that aggregating the 10 min readings to obtain the daily average of bus counts has an effect on the data distribution, resulting in a non-stationary distribution. The effect of the probability distribution should not be underestimated since it affects the reliability of the MCMC samples. These findings are found on all three models considering that we discuss deeply the results of the sparse dataset. Nonetheless, these results raise some interesting issues that need further investigation, such as the potential of utilizing these three temporal components (hour, day, month) in the models’ implementation for additional influences.
5. Conclusions
This study applies hierarchical Bayesian modeling, using the Gaussian process (GP), autoregressive (AR), and Gaussian predictive processes (GPP) approximation models to predict bus counts. The GPP model does not apply for data with spatial points close to each other. Additionally, the data distribution has a significant impact on the model accuracy; however, the normality of the data distribution can be improved by using the transformation log and the square-root function when running the MCMC algorithm. We use the Gibbs sampler to obtain the samples from the bus count data and use these samples to build spatial prediction and temporal forecasting. Different covariance matrices are used with the Gibbs sampler, including exponential, Gaussian, spherical, and Matérn. We apply the these models on two different datasets with different distributions. The results show that the GPP model outperforms the AR, and GP models. In the GP model, the exponential, spherical, and Matérn provide a higher accuracy, compared to the Gaussian covariance matrix. The AR model provides better prediction accuracy in terms of temporal forecasting. The results also confirm that HBM can be used effectively in spatiotemporal analysis and yields high prediction accuracy.
Author Contributions
Conceptualization, T.A., K.E. and T.S.; methodology, T.A.; software, T.A.; validation, T.A., K.E. and T.S.; formal analysis, T.A.; investigation, T.A., K.E. and T.S.; resources, T.A. and K.E.; data curation, T.A.; Writing – original draft, T.A; Writing – review & editing, T.A., K.E. and T.S.; visualization, T.A.; supervision, K.E. and T.S.; project administration, K.E.; funding acquisition, K.E. All authors have read and agreed to the published version of the manuscript.
Funding
This research received no external funding.
Data Availability Statement
Not Applicable, the study does not report any data.
Conflicts of Interest
The authors declare no conflict of interest.
References
- Nguyen-Phuocab, D.Q.; Curriea, G.; De Gruytera, C.; Kimc, I. Modelling the net traffic congestion impact of bus operations in Melbourne. Transp. Res. Part A Policy Pract. 2018, 117, 1–12. [Google Scholar] [CrossRef]
- Chen, X.; He, X.; Xiong, C.; Zhu, Z.; Zhang, L. A Bayesian Stochastic Kriging Optimization Model Dealing with Heteroscedastic Simulation Noise for Freeway Traffic Management. Transp. Sci. 2018. [Google Scholar] [CrossRef]
- Lu, S.H.; Huang, D.; Song, Y.; Jiang, D.; Zhou, T.; Qin, J. St-trafficnet: A spatial-temporal deep learning network for traffic forecasting. Electronics 2020, 9, 1474. [Google Scholar] [CrossRef]
- Gonzalo, R. Transport Gaussian Processes for Regression. arXiv 2020, arXiv:2001.11473. [Google Scholar]
- Alexandre, A.; Filliat, D.; Ibanez-Guzman, J. Modelling stop intersection approaches using gaussian processes. In Proceedings of the 16th International IEEE Conference on Intelligent Transportation Systems (ITSC 2013), The Hague, The Netherlands, 6–9 October 2013. [Google Scholar]
- Fusco, G.; Colombaroni, C.; Isaenko, N. Short-term speed predictions exploiting big data on large urban road networks. Transp. Res. Part C Emerg. Technol. 2016, 73, 183–201. [Google Scholar] [CrossRef]
- Bull, A. NU. CEPAL. ECLAC. In Traffic Congestion: The Problem and How to Deal with it; United Nations Publications: New York, NY, USA, 2006; pp. 1–187. [Google Scholar]
- Sipahi, R.; Niculescu, S.I. A survey of deterministic time delay traffic flow models. IFAC Proc. Vol. 2007, 40, 111–116. [Google Scholar] [CrossRef]
- Rigat, F.; de Gunsty, M.; van Peltz, J. Bayesian modelling and analysis of spatio-temporal neural networks. Bayesian Anal. 2006, 4, 733–764. [Google Scholar]
- Wikle, C.K.; Milliff, R.F.; Nychka, D.; Berlinerr, L.M. Spatiotemporal hierarchical Bayesian modeling tropical ocean surface winds. J. Am. Stat. Assoc. 2001, 96, 382–397. [Google Scholar] [CrossRef] [Green Version]
- Bezener, M.; Hughes, J.; Jones, G. Bayesian spatiotemporal modeling using hierarchical spatial priors, with applications to functional magnetic resonance imaging (with discussion). Bayesian Anal. 2018, 13, 1261–1313. [Google Scholar] [CrossRef]
- Deublein, M.; Schubert, M.; Adey, B.T.; Köhler, J.; Faber, M.H. Prediction of road accidents: A Bayesian hierarchical approach. Accid. Anal. Prev. 2013, 51, 274–291. [Google Scholar] [CrossRef] [PubMed]
- Brogna, G.; Leclere, J.A.Q.; Sauvage, O. Engine noise separation through Gibbs sampling in a hierarchical Bayesian model. Mech. Syst. Signal Process. 2019, 128, 405–428. [Google Scholar] [CrossRef]
- Wikle, C.K. Hierarchical models in environmental science. Int. Stat. Rev. 2003, 71, 181–199. [Google Scholar] [CrossRef]
- Zaslavsky, A.M. Using hierarchical models to attribute sources of variation in consumer assessments of health care. Stat. Med. 2007, 26, 1885–1900. [Google Scholar] [CrossRef]
- Lindgren, F.; Rue, H. Bayesian spatial modelling with R-INLA. J. Stat. Softw. 2015, 63, 1–25. [Google Scholar] [CrossRef] [Green Version]
- Friedman, N.; Koller, D. Being Bayesian about network structure. A Bayesian approach to structure discovery in Bayesian networks. Mach. Learn. 2003, 50, 95–125. [Google Scholar] [CrossRef]
- Bakar, K.S.; Sahu, S.K. spTimer: Spatio-temporal bayesian modelling using R. J. Stat. Softw. 2015, 63, 1–32. [Google Scholar] [CrossRef] [Green Version]
- Smith, B.L.; Williams, B.M.; Oswald, R.K. Comparison of parametric and nonparametric models for traffic flow forecasting. Transp. Res. Part C Emerg. Technol. 2002, 10, 303–321. [Google Scholar] [CrossRef]
- Abdi, J.; Moshiri, B.; Abdulhai, B.; Sedigh, A.K. Short-term traffic flow forecasting: Parametric and nonparametric approaches via emotional temporal difference learning. Neural Comput. Appl. 2013, 23, 141–159. [Google Scholar] [CrossRef]
- Smith, B.L.; Demetsky, M.J. Traffic flow forecasting: Comparison of modeling approaches. J. Transp. Eng. 1997, 123, 261–266. [Google Scholar] [CrossRef]
- Fusco, G.; Colombaroni, C.; Comelli, L.; Isaenko, N. Short-term traffic predictions on large urban traffic networks: Applications of network-based machine learning models and dynamic traffic assignment models. In Proceedings of the 2015 International Conference on Models and Technologies for Intelligent Transportation Systems (MT-ITS), Budapest, Hungary, 3–5 June 2015. [Google Scholar]
- Cufoglu, A.; Lohi, M.; Madani, K. Classification accuracy performance of naïve Bayesian (NB), Bayesian networks (BN), lazy learning of Bayesian rules (LBR) and instance-based learner (IB1)-comparative study. In Proceedings of the 2008 International Conference on Computer Engineering & Systems), Washington, DC, USA, 12–14 December 2008. [Google Scholar]
- Cheng, B.; Titterington, D.M. Neural networks: A review from a statistical perspective. Stat. Sci. 1994, 9, 2–30. [Google Scholar]
- Saha, A.; Chakraborty, S.; Chandra, S.; Ghosh, I. Kriging based saturation flow models for traffic conditions in Indian cities. Transp. Res. Part A Policy Pract. 2018, 118, 38–51. [Google Scholar] [CrossRef]
- Selby, B.; Kockelman, K.M. Spatial prediction of traffic levels in unmeasured locations: Applications of universal kriging and geographically weighted regression. J. Transp. Geogr. 2013, 29, 24–32. [Google Scholar] [CrossRef]
- Gentile, M.; Courbin, F.; Meylan, G. Interpolating point spread function anisotropy. Astron. Astrophys. 2013, 123, A1. [Google Scholar] [CrossRef] [Green Version]
- Kotusevski, G.; Hawick, K.A. A Review of Traffic Simulation Software; Massey University: 2009. Available online: http://www.exec-ed.ac.nz/massey/fms/Colleges/College%20of%20Sciences/IIMS/RLIMS/Volume13/TrafficSimulatorReview_arlims.pdf (accessed on 23 August 2021).
- Jones, S.L.; Sullivan, A.J.; Cheekoti, N.; Anderson, M.D.; Malave, D. Traffic Simulation Software Comparison Study; UTCA Report; 2004. Available online: https://docplayer.net/11265523-Traffic-simulation-software-comparison-study.html (accessed on 23 August 2021).
- Wong, K.I.; Yu, S.A. Estimation of origin–destination matrices for mass event: A case of Macau Grand Prix. J. King Saud Univ. -Sci. 2011, 23, 281–292. [Google Scholar] [CrossRef] [Green Version]
- Shirley, K.; Vasilaky, K.; Greatrex, H.; Osgood, D.; Hierarchical Bayes Models for Daily Rainfall Time Series at Multiple Locations from Heterogenous Data Sources. Earth Institute and International Research Institute for Climate and Society. 26 May 2016. Available online: https://citeseerx.ist.psu.edu/viewdoc/download?doi=10.1.1.734.9836&rep=rep1&type=pdf (accessed on 23 August 2021).
- Shuler, K. Bayesian Hierarchical Models for Count Data. Statistical Science, Ph.D. Thesis, University of California, Santa Cruz, Oakland, CA, USA, June 2020. [Google Scholar]
- Normington, J.P. Bayesian Hierarchical Difference-in-Differences Models. Ph.D. Thesis, The University of Minnesota, Minneapolis, MN, USA, December 2019. [Google Scholar]
- McGlothlin, A.E.; Viel, K. Bayesian Hierarchical Models. Am. Med. Assoc. 2018, 320, 2365–2366. [Google Scholar] [CrossRef]
- Sahu, S.K.; Gelfand, A.E.; Holland, D.M. Spatio-temporal modeling of fine particulate matter. J. Agric. Biol. Environ. Stat. 2006, 11, 61–86. [Google Scholar] [CrossRef]
- Datta, A.; Banerjee, S.; Finley, A.O.; Hamm, N.A.S.; Schaap, M. Nonseparable dynamic nearest neighbor Gaussian process models for large spatio-temporal data with an application to particulate matter analysis. Ann. Appl. Stat. 2016, 10, 1286. [Google Scholar] [CrossRef] [PubMed]
- Rodriguesa, F.; Pereiraa, F.C. Heteroscedastic Gaussian processes for uncertainty modeling in large-scale crowdsourced traffic data. Transp. Res. Part C Emerg. Technol. 2018, 95, 636–651. [Google Scholar] [CrossRef] [Green Version]
- Liu, S.; Yue, Y.; Krishnan, R. Adaptive collective routing using gaussian process dynamic congestion models. In Proceedings of the 19th ACM SIGKDD International Conference on Knowledge Discovery and Data Mining, New York, NY, USA, 11–14 August 2013. [Google Scholar]
- Idé, T.; Kato, S. Travel-time prediction using Gaussian process regression: A trajectory-based approach. In Proceedings of the 2009 SIAM International Conference on Data Mining, Sparks, NV, USA, 30 April–2 May 2009. [Google Scholar]
- Neumann, M.; Kersting, K.; Xu, Z.; Schulz, D. Stacked Gaussian process learning. In Proceedings of the 2009 Ninth IEEE International Conference on Data Mining, Miami, FL, USA, 6–9 December 2009. [Google Scholar]
- Cheng, C.A.; Boots, B. Variational inference for Gaussian process models with linear complexity. arXiv 2017, arXiv:1711.10127. [Google Scholar]
- Lu, S.H.; Huang, D.; Song, Y.; Jiang, D.; Zhou, T.; Qin, J. Efficient multiscale Gaussian process regression using hierarchical clustering. arXiv 2015, arXiv:1511.02258. [Google Scholar]
- Chen, P.; Yuan, H.; Shu, X. Forecasting crime using the arima model. In Proceedings of the Fifth International Conference on Fuzzy Systems and Knowledge Discovery, Jinan, China, 18–20 October 2008. [Google Scholar]
- Alghamdi, T.; Elgazzar, K.; Bayoumi, M.; Sharaf, T.; Shah, S. Forecasting traffic congestion using ARIMA modeling. In Proceedings of the 15th International Wireless Communications & Mobile Computing Conference (IWCMC), Tangier, Morocco, 24–28 June 2019. [Google Scholar]
- Chen, C.; Hu, J.; Meng, Q.; Zhang, Y. Short-time traffic flow prediction with ARIMA-GARCH model. In Proceedings of the 2011 IEEE Intelligent Vehicles Symposium (IV), Baden, Germany, 5–9 June 2011. [Google Scholar]
- He, Z.; Tao, H. Epidemiology and ARIMA model of positive-rate of influenza viruses among children in Wuhan, China: A nine-year retrospective study. Int. J. Infect. Dis. 2018, 74, 61–70. [Google Scholar] [CrossRef] [PubMed] [Green Version]
- Song, Z.; Guo, Y.; Wu, Y., Ma. Short-term traffic speed prediction under different data collection time intervals using a SARIMA-SDGM hybrid prediction model. PLoS ONE 2019, 14, e0218626. [Google Scholar] [CrossRef] [PubMed]
- Nobre, F.F.; Monteiro, A.B.; Telles, P.R.; Williamson, G.D. Dynamic linear model and SARIMA: A comparison of their forecasting performance in epidemiology. Stat. Med. 2018, 20, 3051–3069. [Google Scholar] [CrossRef] [PubMed]
- Banerjee, S.; Gelfand, A.E.; Finley, A.O.; Sang, H. Gaussian predictive process models for large spatial data sets. J. R. Stat. Soc. Ser. B (Stat. Methodol.) 2008, 70, 825–848. [Google Scholar] [CrossRef] [Green Version]
- Guhaniyogi, R.; Finley, A.O.; Banerjee, S.; Gelfand, A.E. Adaptive Gaussian predictive process models for large spatial datasets. Environmetrics 2011, 22, 997–1007. [Google Scholar] [CrossRef] [Green Version]
- Paap, R. What are the advantages of MCMC based inference in latent variable models? Stat. Neerl. 2002, 56, 2–22. [Google Scholar] [CrossRef]
- Cressie, N.; Hoboken, C.K.W. Statistics for Spatio-Temporal Data, 2nd ed.; Wiley: Hoboken, NJ, USA, 2011; pp. 1–624. [Google Scholar]
- Davies, S.; Hall, P. Fractal analysis of surface roughness by using spatial data. J. R. Stat. Soc. Ser. B Stat. Methodol. 1999, 61, 3–37. [Google Scholar] [CrossRef]
- Genton, M.G. Classes of kernels for machine learning: A statistics perspective. J. Mach. Learn. Res. 2001, 2, 299–312. [Google Scholar]
- Rasmussen, C.E.; Williams, C.K.I. Gaussian Processes for Machine Learning; TMIT Press: Cambridge, MA, USA, 2006; pp. 1–266. [Google Scholar]
- Minasny, B.; McBratney, A.B. The Matérn Function as a General Model for Soil Variograms; Elsevier BV: Amsterdam, The Netherlands, 2005; pp. 192–207. [Google Scholar]
- Gelman, A.; Carlin, J.B.; Stern, H.S.; Rubin, D.B. SBayesian Data Analysis, 3rd ed.; Chapman and Hall/CRC: New York, NY, USA, 1995. [Google Scholar]
- Johansen, L.; Caluza, B. Deciphering west philippine sea: A plutchik and VADER algorithm sentiment analysis. Indian J. Sci. Technol. 2018, 11, 47. [Google Scholar]
- Džambas, T.; Ahac, S.; Dragčević, V. Numerical prediction of the effect of traffic lights on the vehicle noise at urban street intersections. J. Acoust. Soc. Am. 2008, 123, 3924. [Google Scholar]
- De Myttenaere, A.; Golden, B.; Le Grand, B.; Rossi, F. Mean absolute percentage error for regression models. Neurocomputing 2016, 192, 38–48. [Google Scholar] [CrossRef] [Green Version]
- Chai, T.; Draxler, R.R. Root mean square error (RMSE) or mean absolute error (MAE). Geosci. Model Dev. Discuss. 2014, 7, 1525–1534. [Google Scholar]
Publisher’s Note: MDPI stays neutral with regard to jurisdictional claims in published maps and institutional affiliations. |
© 2021 by the authors. Licensee MDPI, Basel, Switzerland. This article is an open access article distributed under the terms and conditions of the Creative Commons Attribution (CC BY) license (https://creativecommons.org/licenses/by/4.0/).