Article

Deep Learning-Based Classification of Fine Hand Movements from Low Frequency EEG

by
Giulia Bressan
1,2,
Giulia Cisotto
1,3,4,*,
Gernot R. Müller-Putz
2,5 and
Selina Christin Wriessnegger
2,5
1
Department of Information Engineering, University of Padova, 35122 Padova, Italy
2
Institute of Neural Engineering, Graz University of Technology, 8010 Graz, Austria
3
National Centre for Neurology and Psychiatry, Tokyo 187-8551, Japan
4
National Inter-University Consortium for Telecommunications (CNIT), 43124 Parma, Italy
5
BioTechMed-Graz, 8010 Graz, Austria
*
Author to whom correspondence should be addressed.
Future Internet 2021, 13(5), 103; https://doi.org/10.3390/fi13050103
Submission received: 9 March 2021 / Revised: 15 April 2021 / Accepted: 15 April 2021 / Published: 21 April 2021
(This article belongs to the Special Issue The Future Internet of Medical Things)

Abstract

:
The classification of different fine hand movements from electroencephalogram (EEG) signals represents a relevant research challenge, e.g., in BCI applications for motor rehabilitation. Here, we analyzed two different datasets where fine hand movements (touch, grasp, palmar, and lateral grasp) were performed in a self-paced modality. We trained and tested a newly proposed CNN, and we compared its classification performance with two well-established machine learning models, namely, shrinkage-linear discriminant analysis (LDA) and Random Forest (RF). Compared to previous literature, we included neuroscientific evidence, and we trained our Convolutional Neural Network (CNN) model on the so-called movement-related cortical potentials (MRCPs). They are EEG amplitude modulations at low frequencies, i.e., ( 0.3 , 3 ) Hz that have been proved to encode several properties of the movements, e.g., type of grasp, force level, and speed. We showed that CNN achieved good performance in both datasets (accuracy of 0.70 ± 0.11 and 0.64 ± 0.10 , for the two datasets, respectively), and they were similar or superior to the baseline models (accuracy of 0.68 ± 0.10 and 0.62 ± 0.07 with sLDA; accuracy of 0.70 ± 0.15 and 0.61 ± 0.07 with RF, with comparable performance in precision and recall). In addition, compared to the baseline, our CNN requires a faster pre-processing procedure, paving the way for its possible use in online BCI applications.

Graphical Abstract

1. Introduction

Several BCI systems for motor rehabilitation or motor control [1,2,3,4,5,6] and other basic neuroscience studies strongly rely on the ability to precisely and effectively distinguish different fine hand movements. One example is the investigation of the neural mechanisms underlying the writing and the music performance [7,8] or during real-life performance in ecologically valid situations outside the laboratory [9]. Movement-related cortical potentials (MRCPs) are amplitude modulations of the time-domain EEG signal that occur in the ( 0.3 , 3 ) Hz frequency band [10]. MRCPs can be detected during motor execution, motor attempt, and even during imagery of a movement, and they reflect the cortical processes involved in the planning and execution of a movement [11]. Previous literature [10] reports that the components of the MRCPs can be influenced by several factors, such as the preparatory state (self-paced or cue-based), the level of intention [12], the type of movement, the praxis, and the previous experience of the same movement. Nevertheless, it has been found that MRCPs can also encode several properties of the movements, such as the type of grasp [13], the force level [14], and the speed of the task [15]. In addition, MRCPs have been previously employed to discriminate hand movements in patients with severe manual impairments [5]. For this reason, MRCPs are considered valid signals to be used for BCI control [5,6]. Based on this well-established neuroscience background, our aim was to test if a deep learning (DL) approach can improve the performance of the classification of touch, grasp, palmar, and lateral grasp movements. Previous literature has already investigated the classification of different fine hand movements, including touch and different kinds of grasp [16,17,18]. Shrinkage linear discriminant analysis (sLDA) and random forest (RF) are well-established approaches for electroencephalography (EEG) classification, showing low complexity and good performance even with a limited amount of trials. However, they might score poorly in case of complex nonlinear EEG data [19]. However, deep DL has recently demonstrated promising results in decoding brain activity in several scenarios, e.g., sleep stage scoring [20], epileptic seizure detection [21], as well as hand movement classification [22]. Therefore, the aim of this work was to evaluate the performance of a newly proposed DL-based model, compared to the well-established sLDA and RF methods, in the classification of three different classes of movement, using two pre-recorded datasets. Given the small size of our datasets, we decided to adopt a CNN-based model to classify MRCPs, as it has been previously showed to be effective in small datasets [23,24,25].
The paper is organized as follows: in Section 2, we present the most relevant previous studies related to our work; in Section 3, we describe the experimental protocol, the common steps of pre-processing for all models, our proposed CNN model, and we briefly review the two baseline models chosen for comparison. In Section 4, we report and discuss all results, both from the qualitative analysis of the MRCPs and of the classification from different movements. Finally, Section 5 concludes the paper and mentions the possible impact of this work for other studies.

2. Related Works

The possibility of decoding touch and grasp actions from low-frequency EEG signals has been shown in other studies [16,17,18]. Well-established literature proved that brain activity in the frequency band 2–5 Hz contains relevant movement-related information. Thus, in [26], the authors proposed an interesting approach to classify speed in hand movements: they applied wavelet-CSP to MRCPs and were able to classify slow and fast movements with 83.71 % accuracy. In [18], Ofner et al. classified single upper limb movements with a binary classification approach, recording six different types of movements, both executed and imagined, and rest trials. For the executed movements, in the movements versus rest binary classification, the average accuracy reached the value of 87 % , while, for the movementsversusmovements, the average accuracy dropped down to 55 % . For the imagined movements, an accuracy of as less as 27 % and 73 % was obtained for movements versus movements and rest versus movements classification, respectively. In [16], palmar, lateral, and pincer grasps were recorded and classified, in a cue-based paradigm. A 4-class sLDA was used to classify the three movements and the rest data, obtaining a peak accuracy of 65.9 % . Moreover, a binary classifier was trained in the same study, for each binary combination of classes. The palmar versus lateral grasp classification obtained a peak accuracy of 73.5 % . In [17], MRCP was shown to significantly discriminate between unimanual (e.g., left hand vs. right hand grasps) as well unimanual vs. bimanual movements. Particularly, both unimanual and bimanual reach and grasp actions were classified with sLDA based on low-frequency time-domain EEG in the frequency range 0.3–3 Hz. Binary combinations of the different movements were also classified separately, leading to average accuracies for the movement classes between 66 % and 70 % . The highest accuracies were obtained with the rest class versus the movement ones, with performance between 74 % to 90 % . Recently, new approaches have been increasing. DL showed promising results in many different fields of application and has been successfully applied also in the BCI field [27]. It provided satisfactory outcomes in a variety of EEG analysis, ranging from channel selection to classification of motor imagery (MI). Among other models, CNN was particularly successful to extract spatial and frequency features from EEG for speech classification, as reported in [28], to detect artifacts in EEG [21], as well as to recognize MI for BCI [25]. In the works by Dose [23] and Lee [24], the possibility of MI-EEG classification using a CNN architecture was explored. In both studies, the input of the CNN was represented by the raw EEG signal, without any pre-processing. In [23], fist movements were classified and transfer learning was also used, reaching a subject-specific accuracy of 86.49 % , and a standard accuracy of 80.38 % . In [24], instead, four MI classes were analyzed, namely elbow extension, twisting, grasping, and rest. The average accuracy obtained was 84 % . It is worth noting that these results were obtained with a relatively low amount of data: only 50 trials for each class were available, for a total of 150 trials for the training of the DL architecture.

3. Materials and Methods

For this work, we re-analyzed two datasets, which were recorded in the scope of the EU Horizon 2020 project “MoreGrasp” [6]. First, we describe the experimental protocol used to acquire the two datasets. Second, we describe the pre-processing pipeline that is employed in this study, both before the CNN and the baseline models. Then, we introduce our CNN-based model and the baseline models used for the performance comparison. Finally, we explain the cross-validation procedure and the metric we used for the evaluation of the performance.

3.1. Experimental Protocol

At the very beginning of the experimental protocol, the participants’ handedness was tested with the well-known hand dominance test of [29]. Then, they were asked to seat on a comfortable chair in a noise and electromagnetic shielded room. Their brain activity was acquired via EEG by means of 4 g. USBamp amplifiers (g.tec medical engineering GmbH, Austria) and a 64 gel-based channel EEG cap (g.GAMMAsys/g.LADYbird, g.tec medical engineering GmbH, Austria). Incidentally, 58 electrodes recorded the brain activity, while six of them were used to record the electrooculogram (EOG). The EEG electrodes locations were defined by a well-established modified version of the International 10–20 System [30]. All data were recorded using a 256 Hz sampling frequency. In the resting position, the participants’ right arm was placed, relaxed, upon a pressure button on a table in front of them. They were also recommended to avoid unnecessary body or eye movements, and to fix their gaze at a fixed point, for a few seconds, at the beginning of each repetition of the movement. All movements were self-initiated to ensure a more natural application scenario. Additionally, at the beginning, middle, and end of the experiment, 3 min rest was repeated 3 times.

3.1.1. Experiment 1—Touch and Grasp

In the first experiment, 11 healthy volunteers (11 males, ages 20–38) were included. The hand dominance test resulted in nine right-handed participants, one left-handed and one undefined. During the experiment, two glasses were on the table at the participant’s reaching distance. They were equipped with one pressure sensor each, in order to precisely detect the grasping onset. The participants were instructed either to grasp the first glass or to touch the second glass for a minimum time of 4 s. Thus, the total duration of each repetition was longer than 5 s. Four sessions of 20 repetitions of the same movement, i.e., grasping and touching, were included in the protocol. Thus, 80 touching and 80 grasping movements were performed by each participant at the end of the experiment. After each session, the participants could take a break and the glasses were switched. The same number of repetitions was performed in each glasses’ positions. On the computer screen in front of them, they could see the remaining number of trials to perform.

3.1.2. Experiment 2—Palmar and Lateral
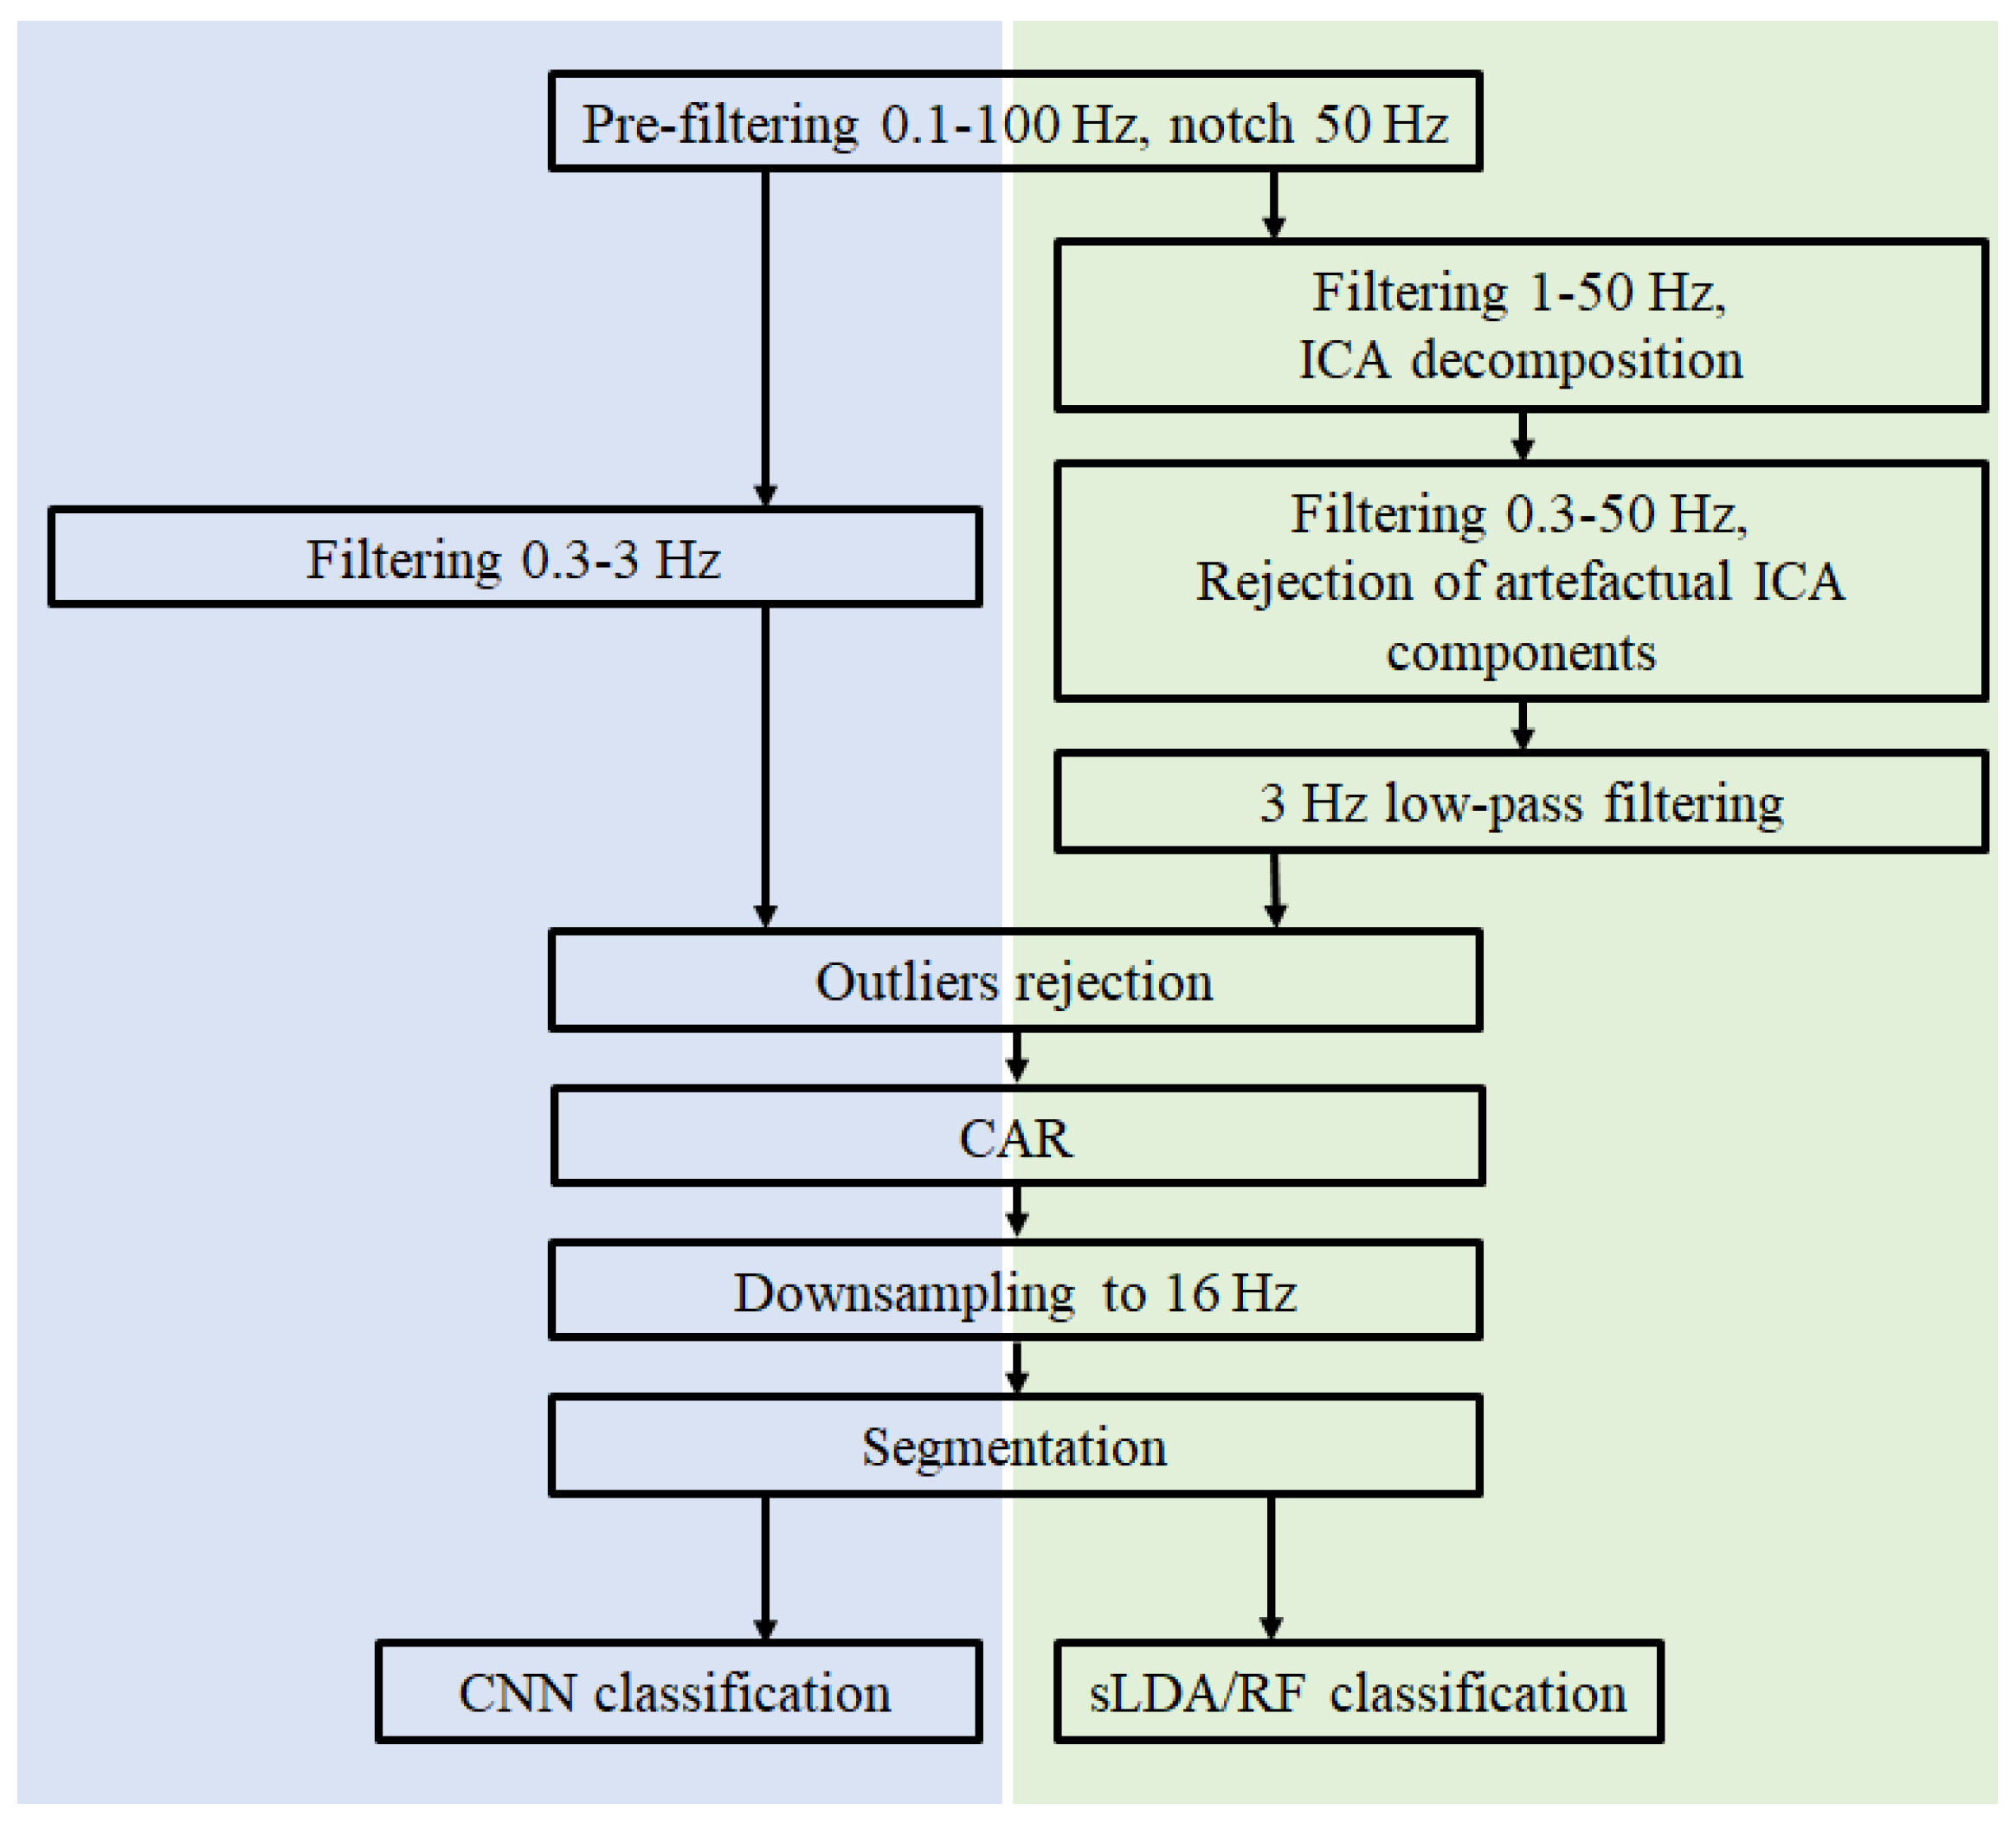
In the second experiment, 15 right handed participants (10 males, ages 21–30) were involved. During the experiment, two jars were on the table at the participant’s reaching distance. The first one was empty, while the second had a spoon stuck in it. The participants were instructed either to reach-and-grasp the first jar or the second for a minimum time of 2 s. Thus, the total duration of each repetition was longer than 5 s. They freely decided which movement to perform. To interact with the empty jar, they had to perform a palmar grasp, while, for the jar with the spoon, they exploited a lateral grasp. Four sessions of 20 repetitions of the same movement, i.e., palmar or lateral grasp, were included in the protocol. After each session, the participants could take a break and the objects were switched. The same number of repetitions was performed in both objects’ positions. The full experimental description can be found in [17].

3.2. Pre-Processing

We adopted the same pre-processing pipeline for both EEG datasets used in this study. The pipeline is a well-established algorithm, previously implemented in [16,17]. The full data processing was implemented in Matlab 2020a [31]. A scheme of the pre-processing pipeline is displayed in Figure 1.
First, every EEG signal was band-pass filtered between 0.01 Hz and 100 Hz (Chebyshev filter, order 8). Second, a notch filter was applied to suppress the power line noise at 50 Hz. Additionally, ICA was applied for classification with sLDA as well as RF, to identify and remove the artifacts due to eye movements, as in [32]. Third, a narrower band-pass filter (Butterworth filter, order 4) was applied to extract the signal low-frequency component in the band ( 0.3 , 3 ) Hz [33]. All filters were implemented using the non-causal Matlab function filtfilt in order to compensate for the delay introduced by them. The full dataset, i.e., including all EEG signals, was transformed using the common average reference (CAR) filter [34], a spatial filter used to enhance the signal component due to the brain region under each individual EEG sensor (i.e., discarding components that are spread all around the scalp). Finally, every signal was downsampled to 16 Hz (using the Matlab function resample).
During the experimental sessions, a pressure sensor (either on the table or on the object to interact with, see Section 3.1) was exploited to identify the time instants when the individual initiated the movement, i.e., the movement onset. Therefore, proper segmentation of the continuous pre-processed EEG signals was ensured. Each segment (or trial) was defined as the signal period of time from 2 s to + 3 s around the movement onset (i.e., time 0). Not only movement-related trials, but also 5 s rest trials have been obtained from the datasets: they were extracted from the 3 min rest periods (see Section 3.1).
In order to include only clean data in the datasets to analyze, we applied a well-established outlier rejection algorithm [35,36,37]. Briefly, it works as follows: a single trial was kept in the dataset if it simultaneously met the following conditions: (1) its absolute amplitude does not exceed 125 V, (2) and its kurtosis does not exceed its standard deviation by four times.
Finally, we obtained two different 3 class datasets: dataset 1 includes clean data from Experiment 1, while dataset 2 includes those from Experiment 2. Both datasets can be described as follows:
X ( i ) = x 1 ( i ) ( 1 ) x 1 ( i ) ( 2 ) x 1 ( i ) ( N ) x 2 ( i ) ( 1 ) x 58 ( i ) ( 1 ) x 58 ( i ) ( N )
where i is the total number of trials in the dataset (despite the specific class of movement), and N the number of time samples available. At the end of the pre-processing procedure, the dataset 1 includes 64.9 ± 5.6 Touch trials, 67.8 ± 7.8 Grasp trials, and 69.6 ± 3.9 Rest trials (average number across subjects), while the dataset 2 includes 68.7 ± 2.8 Palmar trials, 69.6 ± 5.1 Lateral trials, and 69.5 ± 2.8 Rest trials (average number across subjects). Similarly, in the case in which (ICA) was used, the dataset 1 includes 63.9 ± 4.8 Touch trials, 64.4 ± 7.7 Grasp trials, and 67.1 ± 3.4 Rest trials; while dataset 2 includes 67.1 ± 3.7 Palmar trials, 67.4 ± 4.9 Lateral trials, and 68.5 ± 4.1 Rest trials.
To note, N varies depending on the learning model used to analyze the data (see Section 3.3 and Section 3.4). X ( i ) can be interpreted as an EEG 2D image.
Moreover, the class of movements can be either touch, grasp, palmar, lateral or rest. Dataset 1 includes touch, grasp and rest classes, while dataset 2 includes palmar, lateral, and rest classes.
Both datasets were processed by adopting the same pre-processing pipeline reported in Figure 1, separately. For both datasets, preliminary results (not reported here) showed that sLDA and RF performed better if pre-processing includes an ICA step, while CNN works better without any ICA decomposition. For this reason, Figure 1 shows two different branches, depending on which classifier is used.

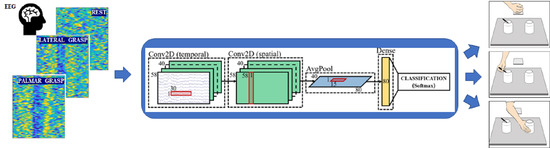
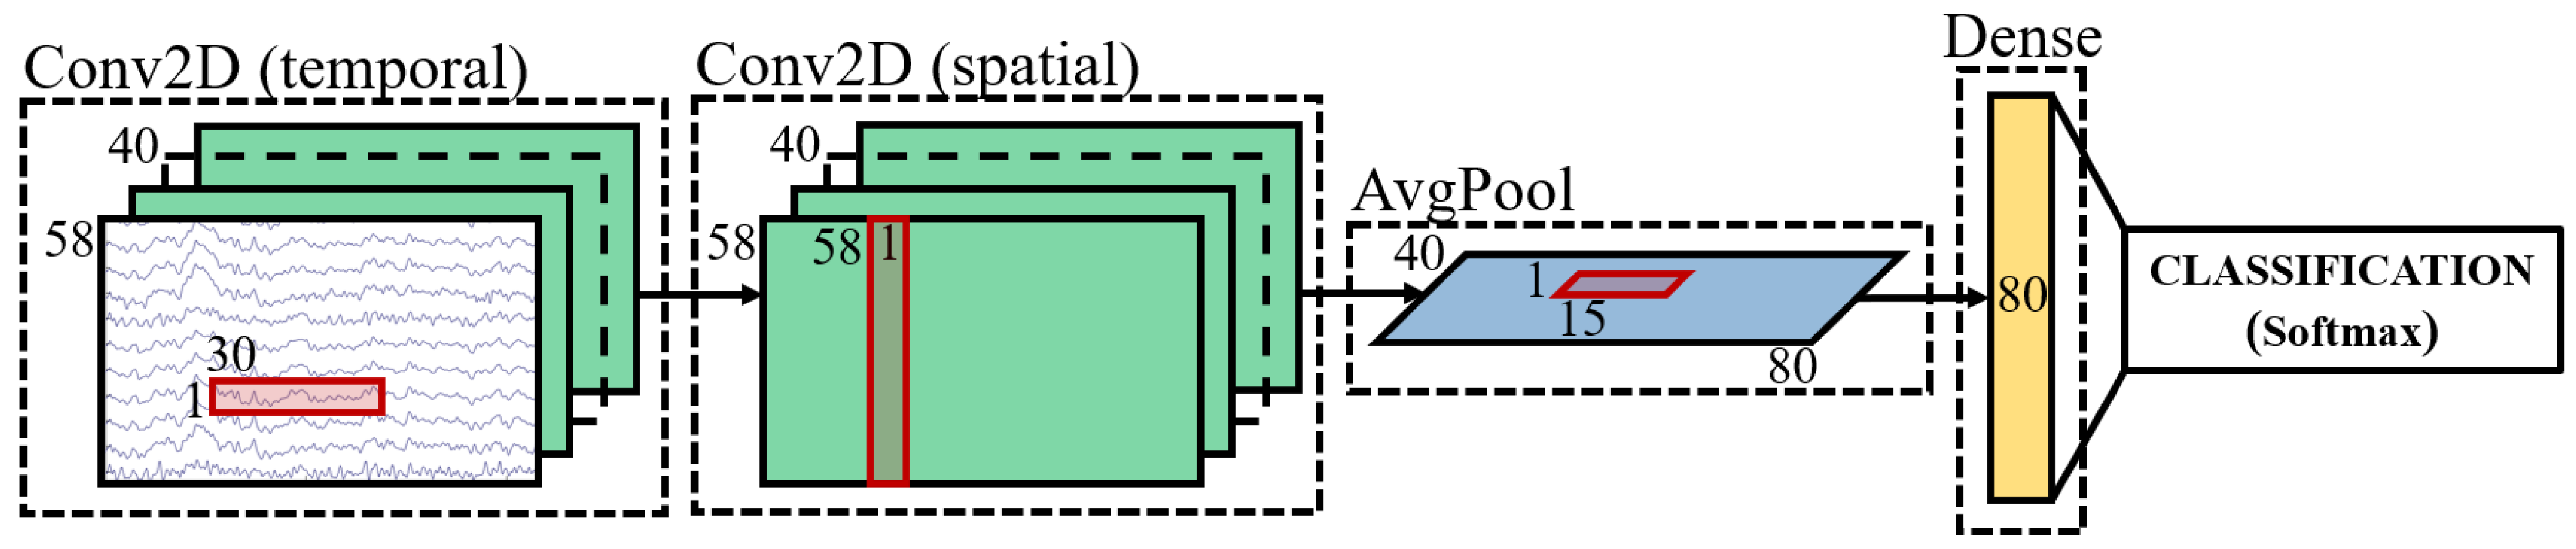
3.3. Classification with CNN

The CNN is a particular type of neural network that implements, in at least one of its layers, a convolutional operation [38]. In this study, the architecture of the CNN was adapted from [23,24]. As depicted in Figure 2, it consisted of five layers.
The first two were convolutional layers: the first one performed a temporal filtering (i.e., convolution along the time axis), while the second one a spatial filtering (i.e., convolution along the channel axis). Each convolutional layer was followed by a batch normalization and an exponential linear unit (eLu) activation function. Then, an average pooling layer, which flattened the input to a single dimension, and two fully connected layers were stacked on the top of the convolutional ones. Finally, a softmax activation function returned the probability of each sample to belong to each class. To note, since the kernel size at the output of the second convolutional layer was equal to the number of channels, this filter reduced the channel dimension to one. The input to this CNN was given by the EEG 2D images X ( i ) , for every available trial i, as computed in (1), which resulted in a three-dimensional tensor. To implement such architecture, several parameters had to be decided: specifically, the kernel size and the depth of the convolutional layers, and the size of the pooling and dense layers. Given each participant, we used a grid-search procedure to optimize such parameters over a priori selected ranges. Then, the optimal combination of parameter values was given by a majority vote strategy across all participants. As a result, the kernel size of the first convolutional layer was equal to 30, while, for the second convolutional layer, it corresponded to the number of channels, i.e., 58. Moreover, for both of them, the optimal depth was found to be 40 filters. The kernel size of the average pooling layer was equal to 15, the first fully connected layer had 80 neurons, while the second fully connected layer had three neurons, corresponding to the number of classes. The same CNN architecture was used for both datasets, while one CNN model was trained for each participant.

3.4. Classification with Baseline Models

Two state-of-the-art machine learning models were used for comparison with our proposed CNN: an sLDA and an RF. They both have the advantages to be simple in their implementation, to require a light computational burden, and to show good performance in EEG classification during hand movements, gesture recognition, and BCI experiments.
The linear discriminant analysis (LDA) is a supervised multi-class classification technique that aims at estimating the parameters of the linear multivariate model of the input data, via parametric density estimation procedure [19]. Here, the input to the sLDA is the vector x obtained by reshaping matrix X as follows:
x ( i ) = [ x 1 ( i ) ( 1 ) , x 2 ( i ) ( 1 ) , , x 58 ( i ) ( 1 ) , x 1 ( i ) ( 2 ) , x 2 ( i ) ( 2 ) , , x 58 ( i ) ( N ) ] ,
where i is the trial number, and N the number of time samples available in the sliding window. The shrinked LDA version, i.e., the sLDA, introduces a regularization strategy, especially useful with high-dimensional feature spaces, when only a few data points are available. For the regularization, we considered the pooled covariance matrix, computed from the three classes, and we optimized the regularization parameter as in [39]. A common approach to obtain the optimal sLDA model with time series, i.e., as in the EEG case, is to train several sLDA models, each one based on a different subset of the training set (e.g., given by a different observation window), and to select the one which yields the best training performance. Thus, here, for each single trial i, a sliding window is used to scan the entire EEG segment from 2 s to 3 s. Then, an sLDA model was obtained for each, every 2, time instant (i.e., one every 125 ms). For each participant, the time instant where the sLDA model resulted in the best classification performance was taken as the trained model. Moreover, three different window lengths were tested for each participant, specifically { 0.6 , 0.8 , 1 } s, and the same model training was repeated for every length value.
The RF is a classifier that works as an ensemble of individual decision tree algorithms to reduce the risk of overfitting and, thus, to enhance the classification performance. Each tree is obtained by independently bootstrapping the samples from the input dataset, resulting in uncorrelated models whose predictions are more accurate than the ones we would obtain from a single one [40]. Then, a random set of predictors is used at each split to grow the tree [41]. To compute the predictions, a majority vote across the predictions of the individual decision trees is used. In this study, the vector in (2) was also used as the input to the RF. The number of trees was empirically set to 50, found as the best trade-off between the classification accuracy and the computational complexity.

3.5. Cross-Validation and Performance Evaluation

The performance of the classifiers were evaluated by means of the accuracy, computed as follows:
accuracy   =   correctly   classified   instances total   number   of   instances   to   classify .
The chance level was computed for each model and each participant by means of the Adjusted Wald Interval [42], with α set to 0.05 . For both datasets, we split each of them into a training set ( 75 % ) and a validation set ( 25 % ). During training, a 10 times repeated 5-fold cross validation procedure was adopted to ensure the robustness of the trained model. The validation set was used for testing the performance of the trained models on unseen data. All splits led to representative subset of the dataset, in order to have balanced classes for an unbiased classification.

4. Results and Discussion

In this section, we describe both the quality of our dataset after pre-processing and the results of the classification using the CNN model designed in Section 3.3, including the comparison with sLDA and RF.

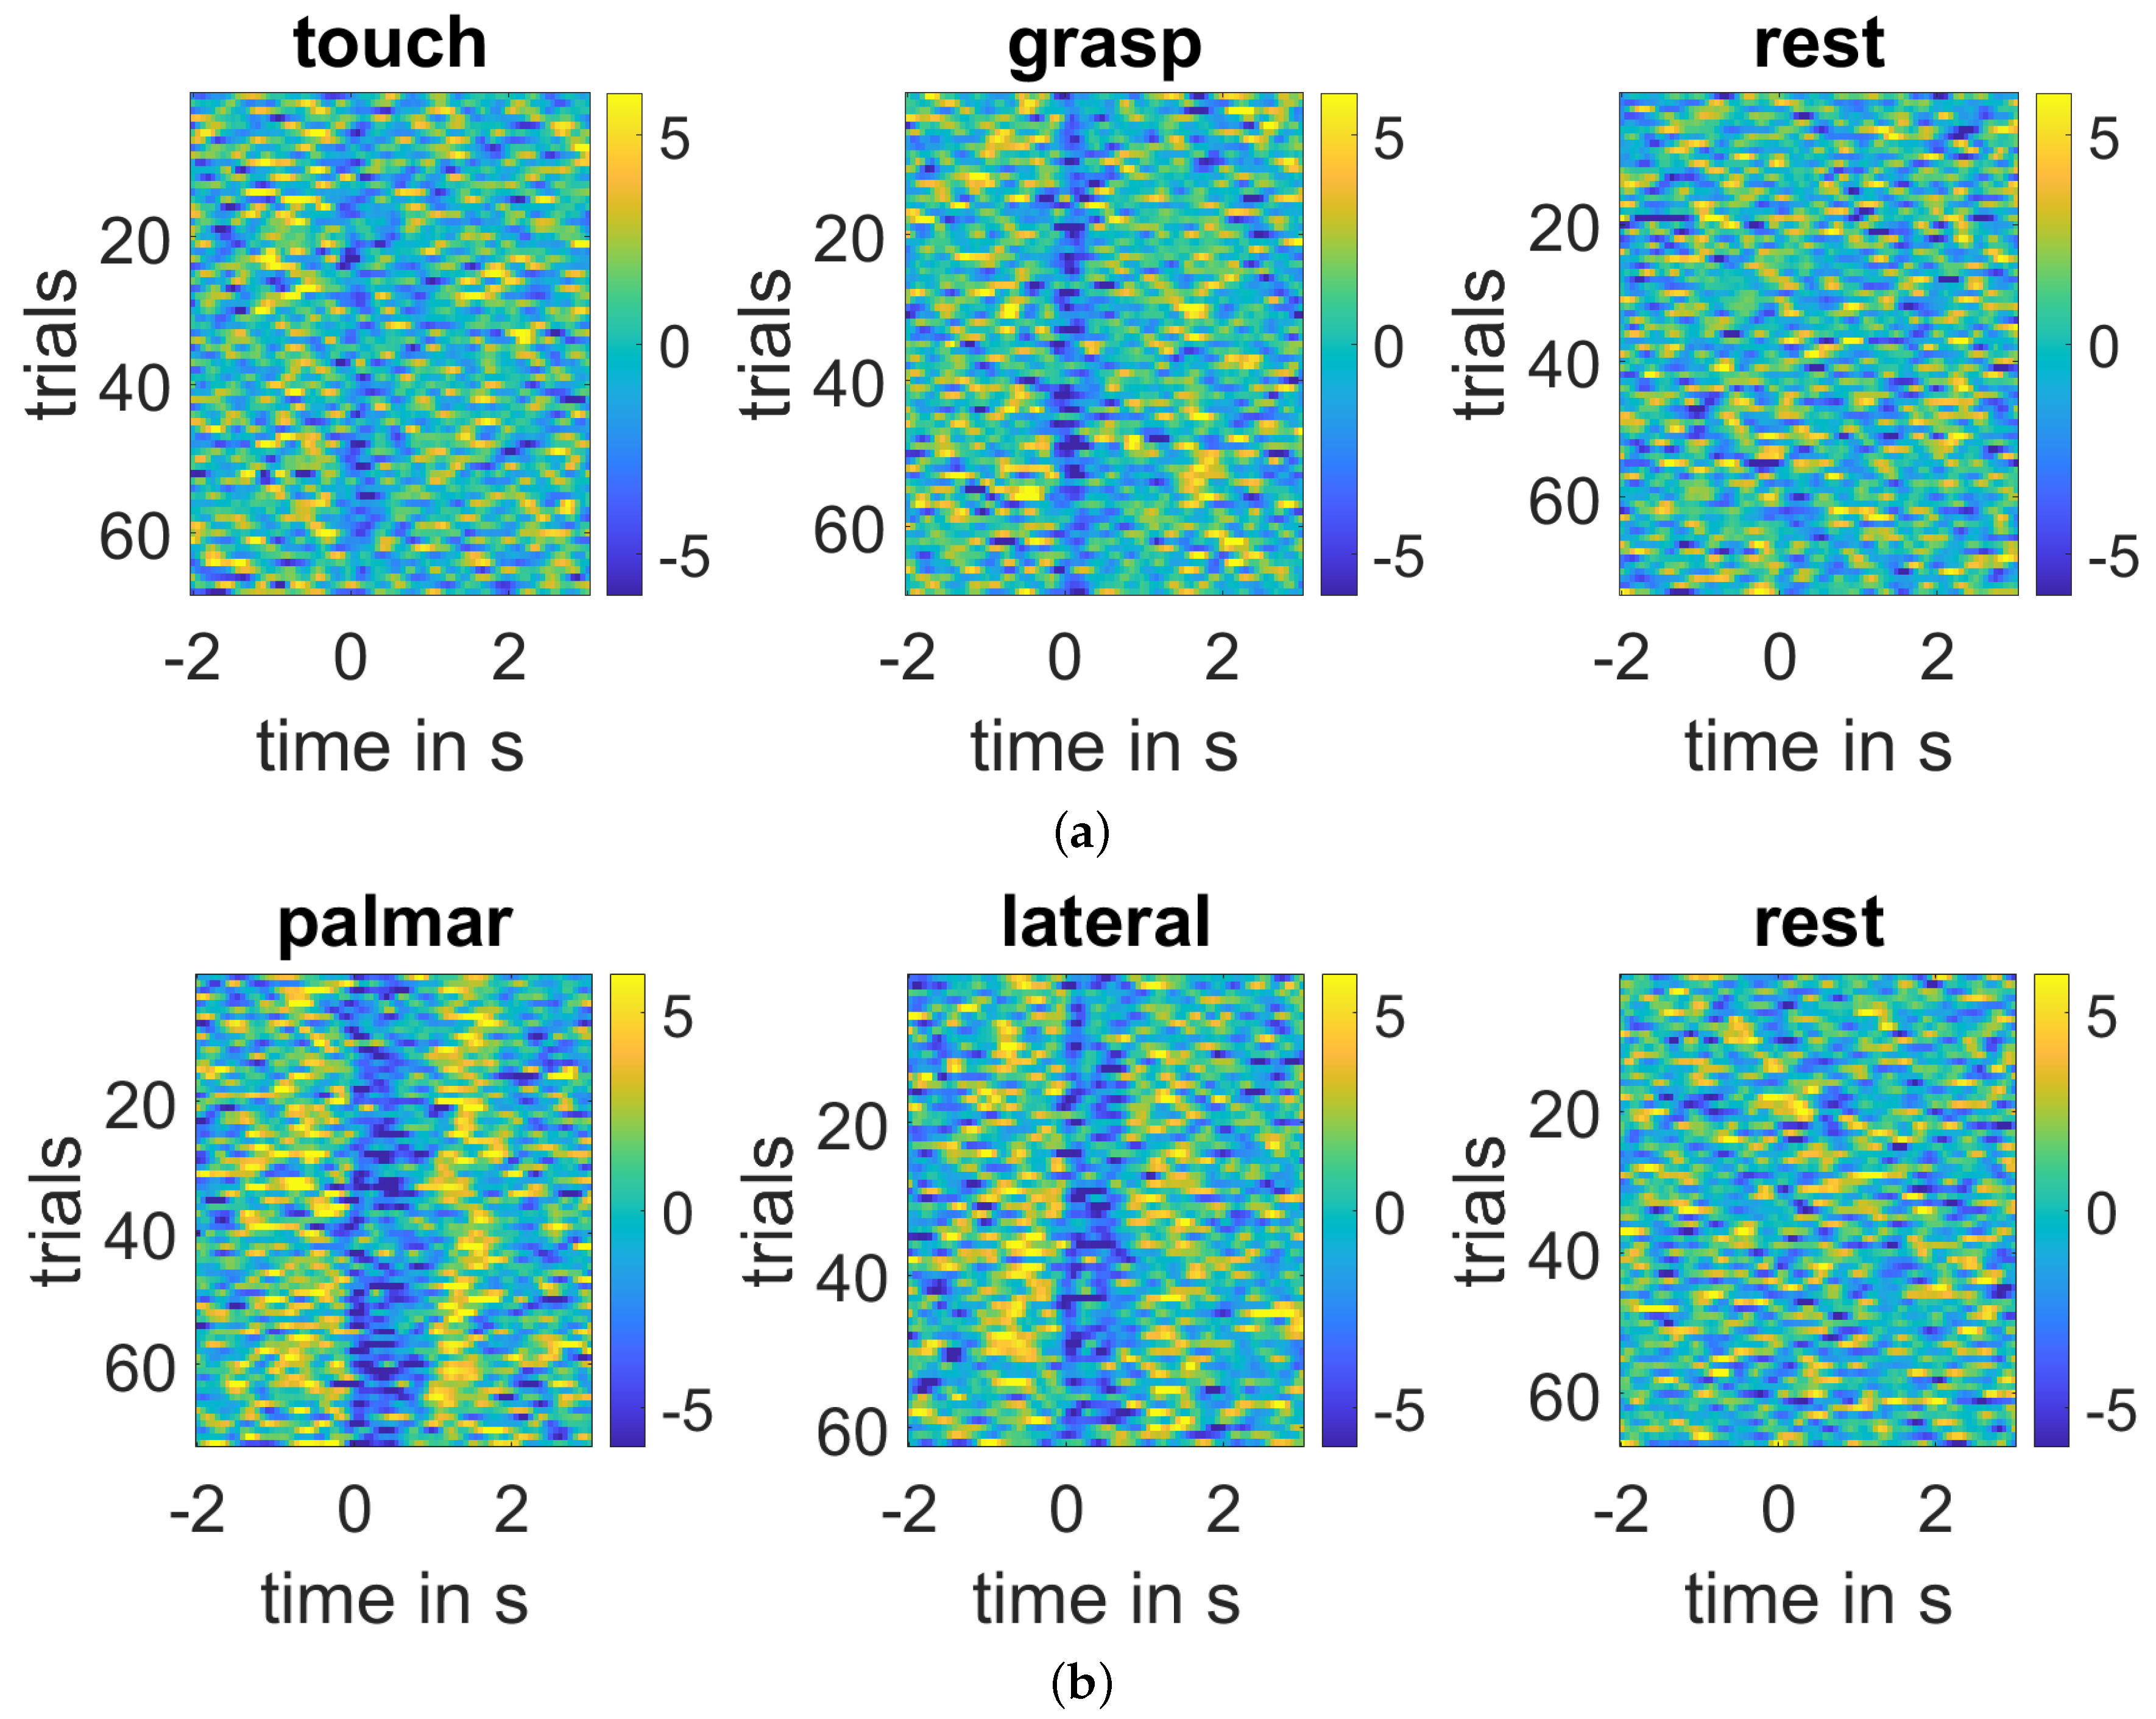
4.1. Pre-Processing, Feature Extraction, and MRCPs

As a result of the pre-processing (see Section 3.2), 3 out of 11 participants (namely, S 002 , S 003 , S 005 ) were rejected from the dataset 1, for the massive presence of artifacts in their EEG recordings. Then, the high quality of the cleaned EEG data after pre-processing is shown in Figure 3. It reports the subset of EEG segments, after synchronization to the movement onset, for different movement classes and for rest periods, in both datasets.
In Figure 3, we can notice that, in case of any movement, negative values are seen around time zero, i.e., the movement onset, which represent the negative peak of the MRCPs. Moreover, all panels show good repeatability across movement repetitions. On the contrary, as expected, in the rest condition, we cannot notice any clear pattern. We also observed (results not reported for space constraints) that a difference in the MRCP peak amplitude was especially noticeable at the EEG electrodes located in the contralateral side of the movement and that this spatial pattern is consistent across several participants, in line with other literature [43]. However, it is also clear that Dataset 1 is more affected by noise compared to Dataset 2, so that, e.g., the touch-related EEG data could show a less pronounced negative peak of the MRCPs (as seen in Figure 3a). We also observed that this behavior is consistent across most of the channels, with no specific spatial pattern (results not reported for space constraints).

4.2. Classification Results

Table 1 and Table 2 report the comparison of the classification performance between the CNN and the baseline models over the unseen validation sets. They show the results of the classification in terms of accuracy. To achieve these performances, we used the CNN model with the best selection of hyperparameters, employing the same architecture for all participants. On the other hand, for sLDA and RF, we considered all possible choices of the sliding window length, with the best window time location, for each participant. The chance level was computed as in Section 3.5, and it was found to be 0.40 . Comparing the classification results among the three classifiers, similar accuracies were observed for all of them, with all values above the chance level. Furthermore, they achieved slightly better results in the Dataset 1, as expected from its higher repeatability across EEG segments (see Figure 3), compared to the Dataset 2. However, for both datasets, the CNN model reached the best average accuracy across all participants ( 0.70 for Dataset 1, 0.64 for Dataset 2). Previous results on Dataset 2 were obtained using sLDA for the binary classification of right hand palmar vs. lateral movements [17]. There, a grand-average participant-specific peak accuracy of 66 , 3 % was reached (individual results were not available), in line with our classification outcomes. sLDA and RF achieved the best classification accuracy at the single-subject level in Dataset 1: thus, a particular configuration (i.e., an optimal choice of the window length and time location) can lead a baseline model to yield higher performance compared to CNN. Nevertheless, especially for the Dataset 2, the CNN showed higher variability in the individual participant accuracies, with some of them reaching very high values ( 0.80 for G12) and others slightly above the chance level ( 0.43 for G02). Finally, from the confusion matrices (not reported here for space constraints), we observed that the rest class was classified with the highest accuracy compared to the other movement classes (best accuracy among the two datasets: 78% for rest, 57% for touch, 62% for grasp, 55% for palmar, 52% for lateral), in line with previous literature [16,17,18]. Precision and recall metrics have also been computed for all subjects, in both dataset (results are reported in Table A1, Table A2, Table A3, Table A4 in the Appendix A). We obtained an average value of 0.68 ± 0.12 both for precision and recall in Dataset 1 (average across subjects and models); similarly, we obtained an average value of 0.60 ± 0.08 for precision and 0.61 ± 0.08 for recall in Dataset 2.
As expected, a critical drawback of the CNN approach is its computational complexity, significantly higher with respect to sLDA and RF: the former use less time points as an input to train the model (either 0.6 s, 0.8 s and 1 s), while the latter took the entire 5 s EEG segment into account. Therefore, the training time for a single model is significantly lower compared to CNN: for a single subject, a single run of classification takes 0.46 s for sLDA, 0.56 s for RF, and 29.16 s for CNN. However, we should notice that sLDA and RF require a significant pre-processing step to select the optimal location of the time window in the EEG segment for the classification. In addition, a 10 times 5-fold CV is applied. Then, overall, the time required to classify one single subject by sLDA increases to 3 min, to 10 min for RF, while the CNN requires 31 min. In addition, CNN implements a more complex architecture compared to sLDA and RF. However, it showed promising advantages over sLDA and RF: indeed, the latter exploit a semi-quantitative pre-processing pipeline, including ICA to clean data from eye movements artifacts. Moreover, for both sLDA and RF, we needed to train a classifier at each time point to select the one that led to the best performance. On the other hand, less pre-processing (i.e., without the need of running ICA) was needed to classify the datasets by means of the CNN; and it is completely automatic. Even if two relatively small datasets were available, we could show that our CNN model can achieve classification accuracies in line with two well-established baseline models. Moreover, we obtained similar performance with a simpler pre-processing pipeline, reducing it to those steps (e.g., filtering and automatic trial rejection) that could be performed in an online modality. This may be explained by the fact that the CNN can behave as an automatic feature extraction method as well as an efficient classifier. As mentioned earlier, the CNN showed the drawback of a higher variability in the individual participant accuracies compared to the baseline models. Therefore, further studies could investigate the inter-individual differences of the CNN performance. Furthermore, CNN needs to have 5 s EEG images as an input, while sLDA and RF could work with shorter windows: thus, further studies are needed to identify the minimal input length for the CNN architecture in order to produce acceptable classification outcomes. This could pave the way for its application in an online scenario, i.e., the assisted living or a BCI system. Finally, CNN could take larger advantage by the spatial information in the EEG dataset, by applying a spatial convolution at its second layer. On the other hand, sLDA and RF did not use this kind of information to enhance their predictions.

5. Conclusions

In this study, we evaluated the classification performance of a DL model, i.e., a CNN, on two different datasets including self-paced fine hand movements (touch, grasp, palmar, and lateral grasp). The classification results of the CNN were compared with two well-established machine learning models, i.e., sLDA and RF. The classification included three classes, i.e., two movements and the rest condition, and it was based on the components of the EEG signals in the 0.3–3 Hz low frequency band. We showed that CNN achieved good performance in both datasets (average accuracy of 0.70 in Dataset 1, 0.64 in Dataset 2, with a chance level of 0.40 ), with similar or superior results compared to the baseline models. All classifiers yielded better results in the first dataset (touch, grasp, and rest), reflecting neurophysiological observations of the MRCPs that were more pronounced in that dataset. We also highlighted that, compared to the baseline models, our CNN did not require strong pre-processing, e.g., ICA, or heavy burden and semi-quantitative pre-processing steps, paving the way for its possible use in online BCI applications.

Author Contributions

Conceptualization, G.B., G.C., and S.C.W.; methodology, G.B. and S.C.W.; resources S.C.W.; software, G.B.; formal analysis, G.B., G.C., and S.C.W.; writing—original draft preparation, G.B. and G.C.; writing—review and editing, G.B., G.C., S.C.W., and G.R.M.-P.; visualization, G.B.; supervision, G.C., S.C.W., and G.R.M.-P.; funding acquisition, G.R.M.-P. All authors have read and agreed to the published version of the manuscript.

Funding

This work was partly supported by EU Horizon 2020 Project MoreGrasp (’643955’). Part of this work was also supported by MIUR (Italian Minister of Education and Research) under the initiative “Departments of Excellence” (Law 232/2016). The APC was funded by REPAC project (initiative SID-Networking 2019 of the University of Padova).

Data Availability Statement

Data sharing not applicable: no new data were created or analyzed in this study. Data sharing is not applicable to this article.

Acknowledgments

The authors thank Andreas Schwarz for his effort designing, implementing and adjusting the paradigm, as well as Sophie Zentner for data recording of data set I.

Conflicts of Interest

The authors declare no conflict of interest.

Abbreviations

BCIbrain–computer interface
CARcommon average reference
CNNconvolutional neural network
DLdeep learning
EEGelectroencephalography
eLuexponential linear unit
EOGelectrooculogram
ICAindependent component analysis
LDAlinear discriminant analysis
MRCPsmovement-related cortical potentials
RFrandom forest
sLDAshrinkage linear discriminant analysis

Appendix A

Table A1. Comparison of classification performance (in terms of precision) in validation from Dataset 1.
SubjectCNNsLDA (0.6 s)sLDA (0.8 s)sLDA (1 s)RF (0.6 s)RF (0.8 s)RF (1 s)
S0000.620.600.640.640.580.580.58
S0010.660.500.520.600.540.560.69
S0040.740.750.730.750.690.730.69
S0060.830.760.720.700.860.740.83
S0070.680.750.790.750.770.730.80
S0080.840.750.790.850.880.790.93
S0090.610.610.670.500.610.570.61
S0100.580.520.540.570.520.500.46
MEAN0.700.660.680.670.680.650.70
STD0.100.110.100.110.140.110.15
Table A2. Comparison of classification performance (in terms of recall) in validation from Dataset 1.
SubjectCNNsLDA (0.6 s)sLDA (0.8 s)sLDA (1 s)RF (0.6 s)RF (0.8 s)RF (1 s)
S0000.620.590.650.640.580.580.60
S0010.650.490.540.620.530.550.68
S0040.760.780.740.760.690.730.71
S0060.830.770.730.700.880.730.87
S0070.690.750.810.780.800.730.79
S0080.840.770.790.850.880.820.94
S0090.620.620.670.510.610.560.64
S0100.590.510.540.570.530.550.54
MEAN0.700.660.680.680.690.660.72
STD0.100.120.100.120.150.110.14
Table A3. Comparison of classification performance (in terms of precision) in validation from Dataset 2.
SubjectCNNsLDA (0.6 s)sLDA (0.8 s)sLDA (1 s)RF (0.6 s)RF (0.8 s)RF (1 s)
G010.790.640.650.650.600.590.66
G020.430.610.550.530.490.630.47
G030.590.510.590.680.590.530.53
G040.580.670.630.610.520.580.54
G050.750.520.620.640.580.620.56
G060.550.500.590.640.680.510.49
G070.590.570.490.530.560.590.50
G080.730.790.750.790.680.770.71
G090.740.690.690.620.570.710.63
G100.630.660.540.550.630.610.63
G110.610.550.590.630.560.490.55
G120.810.560.580.580.660.660.52
G130.580.530.450.560.510.630.51
G140.600.630.680.740.540.590.54
G150.650.630.710.590.570.610.55
MEAN0.640.600.610.620.580.610.56 *
STD0.100.080.080.070.060.070.07
Note. * means p < 0.05 at the Mann–Whitney U test (α = 0.05).
Table A4. Comparison of classification performance (in terms of recall) in validation from Dataset 2.
SubjectCNNsLDA (0.6 s)sLDA (0.8 s)sLDA (1 s)RF (0.6 s)RF (0.8 s)RF (1 s)
G010.800.640.640.650.600.580.67
G020.460.620.540.530.490.630.47
G030.580.530.600.680.580.550.54
G040.590.660.630.620.520.570.52
G050.740.540.620.640.570.620.56
G060.550.520.570.630.680.670.51
G070.600.580.450.530.570.580.49
G080.730.810.750.800.670.770.73
G090.750.690.690.640.590.720.64
G100.640.650.440.510.620.590.63
G110.610.550.620.640.560.480.53
G120.800.570.570.570.660.660.54
G130.590.530.460.540.510.640.50
G140.600.640.670.730.540.580.54
G150.670.630.720.590.570.620.55
MEAN0.650.610.600.620.58 *0.620.56 *
STD0.100.080.100.080.060.070.07
Note. * means p < 0.05 at the Mann–Whitney U test (α = 0.05).

References

  1. Cisotto, G.; Pupolin, S.; Silvoni, S.; Cavinato, M.; Agostini, M.; Piccione, F. Brain-computer interface in chronic stroke: An application of sensorimotor closed-loop and contingent force feedback. In Proceedings of the 2013 IEEE International Conference on Communications (ICC), Budapest, Hungary, 9–13 June 2013; pp. 4379–4383. [Google Scholar]
  2. Silvoni, S.; Cavinato, M.; Volpato, C.; Cisotto, G.; Genna, C.; Agostini, M.; Turolla, A.; Ramos-Murguialday, A.; Piccione, F. Kinematic and neurophysiological consequences of an assisted-force-feedback brain-machine interface training: A case study. Front. Neurol. 2013, 4, 173. [Google Scholar] [CrossRef] [Green Version]
  3. Cisotto, G.; Pupolin, S.; Cavinato, M.; Piccione, F. An EEG-based BCI platform to improve arm reaching ability of chronic stroke patients by means of an operant learning training with a contingent force feedback. Int. J. E-Health Med. Commun. (IJEHMC) 2014, 5, 114–134. [Google Scholar] [CrossRef]
  4. Biasiucci, A.; Leeb, R.; Iturrate, I.; Perdikis, S.; Al-Khodairy, A.; Corbet, T.; Schnider, A.; Schmidlin, T.; Zhang, H.; Bassolino, M.; et al. Brain-actuated functional electrical stimulation elicits lasting arm motor recovery after stroke. Nat. Commun. 2018, 9, 2421. [Google Scholar] [CrossRef] [PubMed]
  5. Ofner, P.; Schwarz, A.; Pereira, J.; Wyss, D.; Wildburger, R.; Müller-Putz, G.R. Attempted Arm and Hand Movements can be Decoded from Low-Frequency EEG from Persons with Spinal Cord Injury. Sci. Rep. 2019, 9, 7134. [Google Scholar] [CrossRef] [Green Version]
  6. Müller-Putz, G.R.; Ofner, P.; Pereira, J.; Pinegger, A.; Schwarz, A.; Zube, M.; Eck, U.; Hessing, B.; Schneiders, M.; Rupp, R. Applying intuitive EEG-controlled grasp neuroprostheses in individuals with spinal cord injury: Preliminary results from the MoreGrasp clinical feasibility study. In Proceedings of the 2019 41st Annual International Conference of the IEEE Engineering in Medicine and Biology Society (EMBC), Berlin, Germany, 23–27 July 2019; pp. 5949–5955. [Google Scholar] [CrossRef]
  7. Furuya, S.; Hanakawa, T. The curse of motor expertise: Use-dependent focal dystonia as a manifestation of maladaptive changes in body representation. Neurosci. Res. 2016, 104, 112–119. [Google Scholar] [CrossRef] [PubMed]
  8. Cisotto, G.; Kita, K.; Uehara, K.; Yoshinaga, K.; Hashimoto, Y.; Sakamoto, T.; Junichi, U.; Takashi, H. Abnormal electroencephalographic oscillations in β and low γ bands in patients with writer’s cramp. (poster presentation). In Proceedings of the Annual Meeting of Society for Neuroscience, Washington, DC, USA, 11–15 November 2017. [Google Scholar]
  9. Packheiser, J.; Schmitz, J.; Pan, Y.; El Basbasse, Y.; Friedrich, P.; Güntürkün, O.; Ocklenburg, S. Using mobile EEG to investigate alpha and beta asymmetries during hand and foot use. Front. Neurosci. 2020, 14, 109. [Google Scholar] [CrossRef]
  10. Shibasaki, H.; Hallett, M. What is the Bereitschaftspotential? Clin. Neurophysiol. 2006, 117, 2341–2356. [Google Scholar] [CrossRef]
  11. Sharma, N.; Pomeroy, V.M.; Baron, J.C. Motor imagery: A backdoor to the motor system after stroke? Stroke 2006, 37, 1941–1952. [Google Scholar] [CrossRef] [Green Version]
  12. Pereira, J.; Sburlea, A.I.; Müller-Putz, G.R. EEG patterns of self-paced movement imaginations towards externally-cued and internally-selected targets. Sci. Rep. 2018, 8, 1–15. [Google Scholar] [CrossRef]
  13. Jochumsen, M.; Niazi, I.K.; Dremstrup, K.; Kamavuako, E.N. Detecting and classifying three different hand movement types through electroencephalography recordings for neurorehabilitation. Med. Biol. Eng. Comput. 2016, 54, 1491–1501. [Google Scholar] [CrossRef] [Green Version]
  14. Jochumsen, M.; Niazi, I.K.; Mrachacz-Kersting, N.; Farina, D.; Dremstrup, K. Detection and classification of movement-related cortical potentials associated with task force and speed. J. Neural Eng. 2013, 10, 056015. [Google Scholar] [CrossRef] [PubMed]
  15. Gu, Y.; Dremstrup, K.; Farina, D. Single-trial discrimination of type and speed of wrist movements from EEG recordings. Clin. Neurophysiol. 2009, 120, 1596–1600. [Google Scholar] [CrossRef]
  16. Schwarz, A.; Ofner, P.; Pereira, J.; Sburlea, A.I.; Mueller-Putz, G.R. Decoding natural reach-and-grasp actions from human EEG. J. Neural Eng. 2017, 15, 016005. [Google Scholar] [CrossRef] [PubMed]
  17. Schwarz, A.; Pereira, J.; Kobler, R.; Müller-Putz, G.R. Unimanual and Bimanual Reach-and-Grasp Actions Can Be Decoded From Human EEG. IEEE Trans. Biomed. Eng. 2019, 67, 1684–1695. [Google Scholar] [CrossRef] [PubMed]
  18. Ofner, P.; Schwarz, A.; Pereira, J.; Müller-Putz, G.R. Upper limb movements can be decoded from the time-domain of low-frequency EEG. PLoS ONE 2017, 12, e0182578. [Google Scholar]
  19. Lotte, F.; Congedo, M.; Lécuyer, A.; Lamarche, F.; Arnaldi, B. A review of classification algorithms for EEG-based brain–computer interfaces. J. Neural Eng. 2007, 4, R1. [Google Scholar] [CrossRef]
  20. Jadhav, P.; Rajguru, G.; Datta, D.; Mukhopadhyay, S. Automatic sleep stage classification using time–frequency images of CWT and transfer learning using convolution neural network. Biocybern. Biomed. Eng. 2020, 40, 494–504. [Google Scholar] [CrossRef]
  21. Cisotto, G.; Zanga, A.; Chlebus, J.; Zoppis, I.; Manzoni, S.; Markowska-Kaczmar, U. Comparison of Attention-based Deep Learning Models for EEG Classification. arXiv 2020, arXiv:2012.01074. [Google Scholar]
  22. Zhang, G.; Davoodnia, V.; Sepas-Moghaddam, A.; Zhang, Y.; Etemad, A. Classification of hand movements from EEG using a deep attention-based LSTM network. IEEE Sens. J. 2019, 20, 3113–3122. [Google Scholar] [CrossRef] [Green Version]
  23. Dose, H.; Møller, J.S.; Iversen, H.K.; Puthusserypady, S. An end-to-end deep learning approach to MI-EEG signal classification for BCIs. Expert Syst. Appl. 2018, 114, 532–542. [Google Scholar] [CrossRef]
  24. Lee, B.H.; Jeong, J.H.; Shim, K.H.; Kim, D.J. Motor Imagery Classification of Single-Arm Tasks Using Convolutional Neural Network based on Feature Refining. In 2020 8th International Winter Conference on Brain-Computer Interface (BCI); IEEE: Piscataway, NJ, USA, 2020; pp. 1–5. [Google Scholar]
  25. Lawhern, V.J.; Solon, A.J.; Waytowich, N.R.; Gordon, S.M.; Hung, C.P.; Lance, B.J. EEGNet: A compact convolutional neural network for EEG-based brain—Computer interfaces. J. Neural Eng. 2018, 15, 056013. [Google Scholar] [CrossRef] [Green Version]
  26. Robinson, N.; Vinod, A.P.; Ang, K.K.; Tee, K.P.; Guan, C.T. EEG-based classification of fast and slow hand movements using wavelet-CSP algorithm. IEEE Trans. Biomed. Eng. 2013, 60, 2123–2132. [Google Scholar] [CrossRef]
  27. Lotte, F.; Bougrain, L.; Cichocki, A.; Clerc, M.; Congedo, M.; Rakotomamonjy, A.; Yger, F. A review of classification algorithms for EEG-based brain–computer interfaces: A 10 year update. J. Neural Eng. 2018, 15, 031005. [Google Scholar] [CrossRef] [Green Version]
  28. Kumar, P.; Saini, R.; Roy, P.P.; Sahu, P.K.; Dogra, D.P. Envisioned speech recognition using EEG sensors. Pers. Ubiquitous Comput. 2018, 22, 185–199. [Google Scholar] [CrossRef]
  29. Steingrüber, H.J.; Lienert, G.A. Hand-Dominanz-Test; HDT: Verlag für Psychologie, Hogrefe, 1971. [Google Scholar]
  30. Oostenveld, R.; Praamstra, P. The five percent electrode system for high-resolution EEG and ERP measurements. Clin. Neurophysiol. 2001, 112, 713–719. [Google Scholar] [CrossRef]
  31. The Mathworks, Inc. MATLAB Version 9.8.0.1359463 (R2020a); The Mathworks, Inc.: Natick, MA, USA, 2020. [Google Scholar]
  32. Makeig, S.; Bell, A.J.; Jung, T.P.; Sejnowski, T.J. Independent Component Analysis of Electroencephalographic Data. Available online: https://papers.nips.cc/paper/1995/file/754dda4b1ba34c6fa89716b85d68532b-Paper.pdf (accessed on 15 April 2021).
  33. Choi, H.; Li, X.; Lau, S.T.; Hu, C.; Zhou, Q.; Shung, K.K. Development of integrated preamplifier for high-frequency ultrasonic transducers and low-power handheld receiver. IEEE Trans. Ultrason. Ferroelectr. Freq. Control. 2011, 58, 2646–2658. [Google Scholar] [CrossRef] [Green Version]
  34. Ludwig, K.A.; Miriani, R.M.; Langhals, N.B.; Joseph, M.D.; Anderson, D.J.; Kipke, D.R. Using a common average reference to improve cortical neuron recordings from microelectrode arrays. J. Neurophysiol. 2009, 101, 1679–1689. [Google Scholar] [CrossRef] [PubMed]
  35. Schwarz, A.; Scherer, R.; Steyrl, D.; Faller, J.; Müller-Putz, G.R. A co-adaptive sensory motor rhythms brain-computer interface based on common spatial patterns and random forest. In Proceedings of the 2015 37th Annual International Conference of the IEEE Engineering in Medicine and Biology Society (EMBC), Milan, Italy, 25–29 August 2015; pp. 1049–1052. [Google Scholar]
  36. Statthaler, K.; Schwarz, A.; Steyrl, D.; Kobler, R.; Höller, M.K.; Brandstetter, J.; Hehenberger, L.; Bigga, M.; Müller-Putz, G. Cybathlon experiences of the Graz BCI racing team Mirage91 in the brain-computer interface discipline. J. Neuroeng. Rehabil. 2017, 14, 1–16. [Google Scholar] [CrossRef]
  37. Faller, J.; Vidaurre, C.; Solis-Escalante, T.; Neuper, C.; Scherer, R. Autocalibration and recurrent adaptation: Towards a plug and play online ERD-BCI. IEEE Trans. Neural Syst. Rehabil. Eng. 2012, 20, 313–319. [Google Scholar] [CrossRef] [PubMed]
  38. Goodfellow, I.; Bengio, Y.; Courville, A.; Bengio, Y. Deep Learning; MIT Press Cambridge: Cambridge, MA, USA, 2016; Volume 1. [Google Scholar]
  39. Bartz, D.; Müller, K.R. Covariance Shrinkage for Autocorrelated Data. Available online: https://papers.nips.cc/paper/2014/file/fa83a11a198d5a7f0bf77a1987bcd006-Paper.pdf (accessed on 15 April 2021).
  40. Shalev-Shwartz, S.; Ben-David, S. Understanding Machine Learning: From Theory to Algorithms; Cambridge University Press: Cambridge, UK, 2014. [Google Scholar]
  41. Breiman, L. Random forests. Mach. Learn. 2001, 45, 5–32. [Google Scholar] [CrossRef] [Green Version]
  42. Müller-Putz, G.; Scherer, R.; Brunner, C.; Leeb, R.; Pfurtscheller, G. Better than random: A closer look on BCI results. Int. J. Bioelectromagn. 2008, 10, 52–55. [Google Scholar]
  43. Rice, N.J.; Tunik, E.; Cross, E.S.; Grafton, S.T. On-line grasp control is mediated by the contralateral hemisphere. Brain Res. 2007, 1175, 76–84. [Google Scholar] [CrossRef] [PubMed] [Green Version]

Short Biography of Authors

Futureinternet 13 00103 i001Giulia Bressan currently works as data science and data warehouse engineer at Reply, Italy. She received her B.Sc. in Information Engineering in 2018 and her M.Sc. in ICT for Internet and Multimedia in 2020 from the University of Padova. She focused her studies on the healthcare applications of ICT, in particular regarding telemedicine and e-health. In 2020 she was a visiting student at the Institute of Neural Engineering (BCI-Lab), Graz University of Technology (TUG) where, in collaboration with the Dept. Information Engineering of the University of Padova, she developed her M.Sc. Thesis project involving the comparison of classification techniques for EEG signals.
Futureinternet 13 00103 i002Giulia Cisotto received her M.Sc. in Telecommunication Engineering in 2010 and PhD in Information Engineering in 2014 from University of Padova (Italy). From 2014 to 2015, she was Research Associate at Keio University. Since 2019, she is non-tenured Assistant Professor at University of Padova and member of SIGNET Lab. She is also Visiting Scientist at NCNP of Tokyo (Japan). In her ten-year research, she gained experience on EEG analysis and BCI for rehabilitation, working with clinical Institutes and healthcare companies (IRCCS San Camillo, IRCCS Santa Lucia, BrainTrends srl, Italy). She has published several Journal papers, conference articles and 2 book chapters (no.citations = 299, h-index = 7). In 2018, she was awarded an IEEE Outstanding Paper Award at IEEE Healthcom. She is reviewer and TPC member for several MDPI, IEEE, Elsevier Journals and international conferences. She is Guest Editor for Frontiers in Human Neuroscience: Brain-Computer Interface. In 2021, she joined the IEEE ComSoc e-Health Technical Committee.
Futureinternet 13 00103 i003Gernot R. Müller-Putz is Head of the Institute of Neural Engineering and PI of the BCI-Lab at the Graz University of Technology (TUG). He received his MSc in electrical and biomedical engineering in 2000, PhD in electrical engineering in 2004, and habilitation in 2008 from TUG. Since 2014 he is Full Professor for semantic data analysis. He has gained extensive experience in biosignal analysis, BCI and EEG-based neuroprosthesis control. He has authored more than 175 peer-reviewed publications and more than 180 contributions to conferences (no.citations = 18,159, h-index = 68). He serves as Editor for Frontiers in Neuroscience, IEEE T-BME and BCI Journal. In 2018, he joined the Board of Directors of the International BCI Society. Since 2019, he is Speciality Editor-in-Chief of Frontiers in Human Neuroscience: Brain-Computer Interfaces. In 2015, he was awarded with an ERC Consolidator Grant “Feel your Reach”. He is founding member and Co-Director of the NeuroIS Society.
Futureinternet 13 00103 i004Selina C.Wriessnegger is Assistant Professor and Deputy Head at the Institute of Neural Engineering (BCI-Lab) of the Graz University of Technology (TUG). She received her PhD from the Ludwig- Maximilians University in 2005 for Human Cognitive and Brain Sciences. In 2004, she was research assistant the IRCCS Santa Lucia Foundation of Rome (Italy). From 2005 to 2008 she was University Assistant at the Karl-Franzens-University Graz. She was visiting professor at SISSA of Trieste (2017) and guest professor at the University of Padova (2019). She has authored more than 90 peer reviewed publications (no.citations = 1732, h-index = 20). Since 2019, she is Associate Editor of Frontiers in Human Neuroscience: Brain-Computer Interfaces. In addition, she was in the organizing committee of several international BCI conferences. Her research interests are neural correlates of motor imagery, subliminal visual information processing, novel applications of BCIs for healthy users, VR in cognitive neuroscience and affective computing.
Figure 1. Pre-processing pipeline.
Futureinternet 13 00103 g001
Figure 2. Schematic representation of the proposed CNN model architecture.
Futureinternet 13 00103 g002
Figure 3. EEG segments (EEG amplitude in V) after synchronization to the movement onset. (a) Dataset 1, representative participant Subject S000, and channel C 1 ; (b) Dataset 2, representative participant Subject G04, and channel C 1 .
Futureinternet 13 00103 g003
Table 1. Comparison of classification performance (in terms of accuracy) in validation from Dataset 1.
SubjectCNNsLDA (0.6 s)sLDA (0.8 s)sLDA (1 s)RF (0.6 s)RF (0.8 s)RF (1 s)
S0000.620.600.640.640.580.580.58
S0010.660.500.520.600.540.560.69
S0040.740.750.730.750.690.730.69
S0060.840.760.720.700.860.740.82
S0070.680.760.800.760.780.730.80
S0080.850.780.780.830.880.800.93
S0090.610.620.670.500.620.580.62
S0100.590.520.540.570.520.500.46
MEAN0.700.660.680.670.680.650.70
STD0.100.110.100.110.140.110.15
Table 2. Comparison of classification performance (in terms of accuracy) in validation from Dataset 2.
SubjectCNNsLDA (0.6 s)sLDA (0.8 s)sLDA (1 s)RF (0.6 s)RF (0.8 s)RF (1 s)
G010.790.650.650.650.610.590.67
G020.430.610.550.530.490.630.47
G030.580.510.590.670.590.530.53
G040.580.670.630.610.530.590.55
G050.750.520.630.650.580.630.56
G060.550.510.600.640.680.530.49
G070.600.580.500.540.580.600.50
G080.720.780.750.780.670.760.73
G090.730.690.690.620.580.710.63
G100.650.650.540.540.630.610.63
G110.610.560.600.630.580.500.56
G120.800.560.580.580.660.660.52
G130.570.530.450.550.510.630.51
G140.600.640.680.750.550.590.55
G150.650.630.710.590.570.610.55
MEAN0.640.610.610.620.590.610.56 *
STD0.100.080.080.070.060.070.07
Note: * means p < 0.05 at the Mann–Whitney U test (α = 0.05).
Publisher’s Note: MDPI stays neutral with regard to jurisdictional claims in published maps and institutional affiliations.

