1. Introduction
The elderly population is growing more rapidly in comparison to other age groups worldwide [
1]. Consequently, the delivery of adequate personal healthcare services for the aging population is not only of great concern of their loved ones, but also is becoming crucial in maintaining a healthy functioning society. In particular, the current healthcare infrastructure would have to be expanded to cope with the increasing demand. Thus, technologies that supports ‘aging in place’, where elderly can live independently and safely at the comfort of their own homes for as long as possible, have been proposed in recent years to mitigate the rising healthcare costs [
2]. The goal is to establish systems to report on health status objectively and automatically, informing caregivers about subject habits, trends and critical conditions.
Presently, most geriatric methods rely on manual administration and on internationally validated questionnaires designed for different medical purposes, to diagnose the physical and cognitive condition of a patient. In practice, such investigations are often carried out through home visits by healthcare professionals, or hospital visits by patients. This approach is labor intense, results in sparse health state reports and thus, is not an appropriate solution for the growing elderly population and their need for long-term monitoring. In particular, when a high visiting frequency (e.g., on a daily basis) is required. Additionally, the response collected through self-reported questionnaires does not fully reflect the objective medical condition of the patients. It is challenging for patients, especially elderly patients, to recall all past events at assessment time, thus early signs of behavior change are often missed. Researchers have found that between 29% and 76% of age-related cognitive impairment are difficult to be detected and assessed in the brief time available during an office visit [
3]. Finally, from a privacy point of view, patients claim that it is not always easy to discuss private health concerns in person, and there should be better options, which could be carried out without interfering with their daily life [
4]. In particular, during onset of an epidemic, such as the COVID-19 global pandemic, home or hospital visits became unavailable, or strictly restricted/limited in many regions. Such challenges require a new healthcare model to be widely applied. Technologies that offer low-cost, scalable solutions through objective and continued remote monitoring, without interfering with user privacy and daily life, become crucial.
Ambient Assisted Living (AAL) systems [
2] provide remote monitoring at the home environment through a connected network of ambient sensors. Different sensor systems were tested, such as the multimedia-based monitoring systems [
5,
6], which rely on video signals captured through surveillance cameras or ambient sounds recorded using microphones installed at the monitoring environment, thus privacy issue is of great concern for such systems to be widely accepted. Depth camera [
7], millimeter-wave sensor [
8] and LiDAR signal [
9]-based systems offer alternative monitoring options with improved privacy experience. However, such systems often come with a non-neglectable cost. Additionally, high-end commercial devices such as ballistocardiographic-based bed sensors [
10] provide detailed sleep analysis through passive monitoring, though the cost-factor could again be a concern for many elderly users. On the other hand, wearable devices in combination with ambient sensor systems enable personalized monitoring, although such systems show reduced adherence for elderly patients [
11], due to the high-maintenance requirements by most wearable devices (e.g., battery charging, and data synchronization with a smart device). Research efforts developed integrated platforms [
12] to minimize the required interaction efforts to improve user experience and adherence.
Binary passive environmental sensors are not just cost effective, they are also efficient with respect to data transfer, storage, and computational needs. Furthermore, once installed they do not require any user interaction, and are the least intrusive from a privacy standpoint. Binary passive infra-red sensor, as well as contact, and pressure sensors, are often deployed in a connected network. Daily activity and health-status information are extracted from raw sensor signals, based on which personalized healthcare services can be provided. Due to the ambiguity of binary sensor signals, such systems are often restricted to be used in single-resident households, to avoid the problem of having to distinguish between different residents [
2]. Additional personalized devices or high-level sensors (e.g., camera and microphone) could be integrated, at the expense of user privacy and usage complexity, to reduce the ambiguity of such systems, to make them applicable in multiple-resident indoor environments. On the other hand, researchers have also explored the feasibility of identifying different individuals by deploying large amounts of binary sensors [
13], at the cost of a higher system complexity.
In this paper, we consider five types of binary sensors [
14], i.e., passive infra-red motion sensors (PIR), contact-based door sensors, pressure-based bed and chair sensors, as well as proximity-based toilet sensors. Up to five sensors (one per type) are deployed at multiple-resident households of elderly people to test the functionality of the system, in terms of whether this simple sensor network could be deployed as a generic AAL system setting, regardless of the number of residents and the structure of the households. Once deployed, our system adaptively learns user behavior patterns in an unsupervised manner, which does not rely on pre-defined knowledge, and does not require any data labeling.
Based on internationally validated geriatric references, aging is often associated with physical, cognitive, psychological, and social health-status changes. The decline of these factors can considerably affect older adults’ quality of life. Given the minimized sensor setting strategy and multiple-resident households of our pilot study, we focus on sleep and outing/visiting analysis as indicators of elder patients’ health status in this paper. Sleep quantity and quality are well-recognized indicators of physical and mental wellness [
15,
16]. We deploy a pressure-based bed sensor at the target subject’s sleep side of the bed, to track personalized sleep activities. Loneliness and lack of social interaction is one of the major health issues associated with aging and thus, a serious concern in elderly care [
17]. Outdoor activity and home visits can be used as reference of not only social activities, but also the capability of carrying out necessary outdoor-based household maintenance activities such as shopping, as well as to make sure that the necessary home-based medical or house-care related assistance have been delivered. Behavior patterns are extracted as groups of activity profiles that share similar features. We conduct both horizontal (across the cohort) analysis, and vertical (personalized behavior tracking over time) analysis. Specifically, user segmentation is conducted by grouping patients with similar behavior patterns across the cohort, resulting in ‘precision cohorts. A user’s change of routine can be observed by tracking the personalized activity patterns over time.
Our objective is to provide a scalable generic solution for long-term practical usage to support independent living of senior adults with mild physical or cognitive impairments, regardless of the different number of residents and structures of the households. The system should be able to alleviate care provider workloads with reduced number of necessary home visits, and reduced medical emergencies by early detection of disease worsening. Our participant population consists of subjects with a mild post-stroke condition and other comorbidities. The sleep profile was used as the main daily activity indicator in our system, due to the sparse sensor setting and the multi-occupancy living condition, which can be enhanced when richer sensor setting becomes available.
The paper is organized as follows.
Section 2 reviews related research literature of binary-sensor-network-based AAL systems.
Section 3 and
Section 4 introduce the sensor setting and the IT architecture of our system. The patient recruitment criteria and study statistics are explained in
Section 5.
Section 6 provides details of the methods applied for daily sleep profile extraction, sleep quality estimation, as well as sleep-based cohort analysis and longitudinal health-status tracking. Outing and visiting detection is introduced in
Section 7. They are important physical and cognitive health-status indicators, thus, improving the personalized monitoring accuracy.
Section 8 introduces and benchmarks the anomaly detection methods. Finally, concluding remarks are drawn in
Section 9.
2. Related Work
Ambient Assisted Living systems can be differentiated along four different dimensions [
2], namely the sensors package, the data collected, the algorithms applied, and the objectives of the system. In this paper, we focus on the use of passive binary environment sensor networks, due to its low-cost, and minimal-intrusive nature. As a result, event-based behavioral data is acquired, which is analyzed by unsupervised algorithms, to eliminate the labeling overhead. The objective is to provide medically relevant notifications to caregivers, so they can intervene at the right time and mitigate medical worsening.
Identifying different activity types is often the fundamental step in sensor-based assisted living systems. In [
18], patient daily activity was extracted using presence sensors deployed in a hospital setting. In [
19], 14 binary sensors were installed at a three-room apartment to recognize 7 pre-defined activity categories. In [
20], activity recognition was achieved by converting annotated binary sensor data into binary activity images in combination with a four-layer (two convolution layers and two fully connected layers) neural network. Recurrent network models were also used to recognize and predict daily activities in densely deployed binary sensor networks [
21,
22]. Most such systems were tested in single-resident environments, and required carefully labeled training data. In [
23], densely distributed binary sensors were deployed at two multi-person households to recognize 27 different activity categories. Sixty to a hundred activity labels were collected as ground-truth per day to train the system.
High-quality sleep is considered a cornerstone of a healthy lifestyle [
24] and is recognized to be an active and dynamic process of physical and mental recovery. Traditionally, sleep quality is quantified using the Pittsburgh Sleep Quality Index (PSQI) [
25], which is a self-report questionnaire consisting of 19 items of 7 aspects. In the medical field, Polysomnography [
26] is conducted as a diagnostic tool to monitor different sleep stages based on neuronal and eye activities during sleeping. Heart rate variability-based sleep analysis is presented in [
24,
27]. Meanwhile, wearable devices that incorporate accelerometers for sleep analysis have been used on a massive scale [
28]. Nocturnal sound-based sleep staging analysis has also been explored in [
29]. In [
30], sleep patterns were inferred by using actigraphy data generated by binary motion sensors scattered around participants’ apartment.
In addition to the typical indoor activities, outings and visits are strong cues of social activity. Outings are often considered to be long inactive periods. In [
31], multiple motion sensors and a door sensor were installed in a single room office. A Naive Bayes classifier and hidden Markov models were then applied to detect visits based on the raw binary sensor signals. Room transitions at each time stamp were used to detect visiting events in [
32]. In [
33], the dwell time, number of sensor firings, and number of transitions between major living spaces are extracted as features from 15-minutes windows, based on which a Support Vector Machine (SVM) classifier was applied. These systems rely on carefully labeled visiting and non-visiting events. However, in real life it is challenging and intrusive to label every visit in the life of elders at their private homes. In [
34], the authors proposed an unsupervised method for visiting detection using room transitions. In [
35], visits were identified when simultaneous activities were detected in bedroom and bathroom. These systems rely on a sensor connection topology, which is carefully crafted, based on the sensor installation floor-map. In [
11], sensor signals between adjacent door activities were represented in a feature space and semi-supervised learning algorithms were trained with partially labeled visiting events.
Human behavior understanding, such as extracting daily routines and behavior habits is crucial for learning about a user’s health condition, and tracking any pattern change, as well as conducting precision cohort analysis. Time, duration and frequency were referred to as the key characteristics of daily activities, and were used individually to identify different behavioral patterns across users [
23]. In [
36], matrix decomposition was used to discover routine clusters from two time-series modalities, specifically from calorie expenditure and steps.
Once a person’s typical habits are learned by a model, long-term behavioral change can be identified as a continuous transformation of the activities of daily living [
37]. Distance measures or outlier detection algorithms can be used to detect behavior deviation from a typical habit. In [
38], several outlier detection algorithms were compared, and the authors found that Isolation Forest, and DBSCAN perform the best. Negative behavioral changes in daily activity, mobility, social life and cognitive status are considered to be indicators of older adult frailty, which considerably affect their quality of life [
39]. A moving-window-based algorithm was applied in [
35,
39], to detect continuous change occurred if a selected number (7 days) of deviations were consecutively detected, where quantity, duration, time and place were used as metrics to represent activity patterns.
3. Sensor Setting
In this section, we discuss the sensor kit selection and design strategy, as well as the deployment protocols that were applied.
3.1. Sensor Design and Selection Strategy
The first concern in designing the AAL sensor kit was to determine a minimal yet expressive set of sensors that can capture relevant user behaviors. Indeed, an extremely rich set of sensors could provide plenty of information, possibly redundant. However, such a setup may be perceived as excessively intrusive by the subjects, therefore limiting the acceptance of the study. A trade-off between these two competing requirements is therefore necessary. To define the most important behaviors that should be captured inside the home, a discussion with representatives of the formal caregivers involved in the project was organized. The following information was considered important to monitor: (1) bed and chair presence patterns, to capture the resting phases; (2) toilet use patterns, both in terms of accesses and timing; (3) door openings as a proxy of social interaction; (4) overall presence and activity in a significant location, possibly close to the entrance area of the main corridor. The AAL sensor kit was designed based on those requirements and, therefore, features 5 sensors in total.
Another key requirement that emerged while planning the study execution is the necessity to standardize the sensor network setup, while keeping the installation time to be within one hour. A quick and transparent deployment procedure is, in fact, important to foster technology acceptability in the user homes. In terms of network design, many wireless communication protocols were taken into consideration, from ZigBee to ZWave or 6LowPan. Such protocols, however, require the presence of a specific edge router that acts as a bridge between the local sensor network and the Internet, thus increasing the cost of each sensor kit. From such considerations it is apparent that a wireless sensor network that allows the obtaining of a scalable installation while optimizing costs consists of exploiting the pre-existing home IT infrastructure, well suits the needs and thus provides a possible solution. The IEEE 802.11 b/g/n WiFi protocol was chosen for networking. This way, each sensor can directly transmit its information over the Internet.
3.2. Sensor Kit
As previously stated, the AAL sensor kit should consist of WiFi-based devices that can monitor the five different types of activities, namely bed, chair, toilet usages, door activities and motion presence, as well as a 4G WiFi router. Consequently, the following sensing technologies are considered:
Bed and chair sensors use pressure-sensitive pads to detect presence. Whenever a sufficient pressure is applied (i.e., a person sitting on the chair or lying over the mattress), the sensor exhibits very low impedance, whereas absence implies high impedance.
Toilet sensor attempts to measure toilet bowl usage by means of an active Infra-Red (IR) illuminator and a photodetector. The IR sensitivity can be trimmed to detect presence only within a given proximity (60 cm in our study), which makes this a selective sensor. In other words, this sensor is specifically triggered when the user is quite near it: proper placement allows the precise counting of toilet bowl uses.
The room activity sensor is a wide-range PIR (Passive IR) sensor that detects motion within the environment. The higher the activity level in the room, the higher the sensor firing counts throughout the day.
Door opening is detected by means of a magnetic contact sensor, featuring a magnetically sensitive switch that closes when a permanent magnet comes in strict proximity. By placing one element on the door and the other one on the door frame, the sensor can detect open/close conditions.
Each of the above-mentioned sensors triggers event-based binary signals, at 1 Hz frequency. A person interacting with such sensors leaves a trace of events that are logged by each of them.
Hardware and firmware were specifically designed to fulfill interoperability and data security constraints as well as ensuring that the information is stored in national servers, hosted by authorized operators. Our selected sensors are low-power and low-quiescent devices powered by batteries. Power saving is achieved by the following strategies. First, the use of super-capacitor technology, allowed to meet the demanding dynamic power range requirements, to fully exploit the battery capacity. Furthermore, sensors triggering are collectively transmitted once per hour, rather than at each occurrence, which provides acceptable latency for long-term data analytics.
3.3. Sensor Network Deployment
The deployment procedure of our AAL system involves the installation of the selected sensor kit and a home WiFi router. Larger or multi-level flats may require the use of an off the shelf wireless range extender, which does not change the overall network architecture.
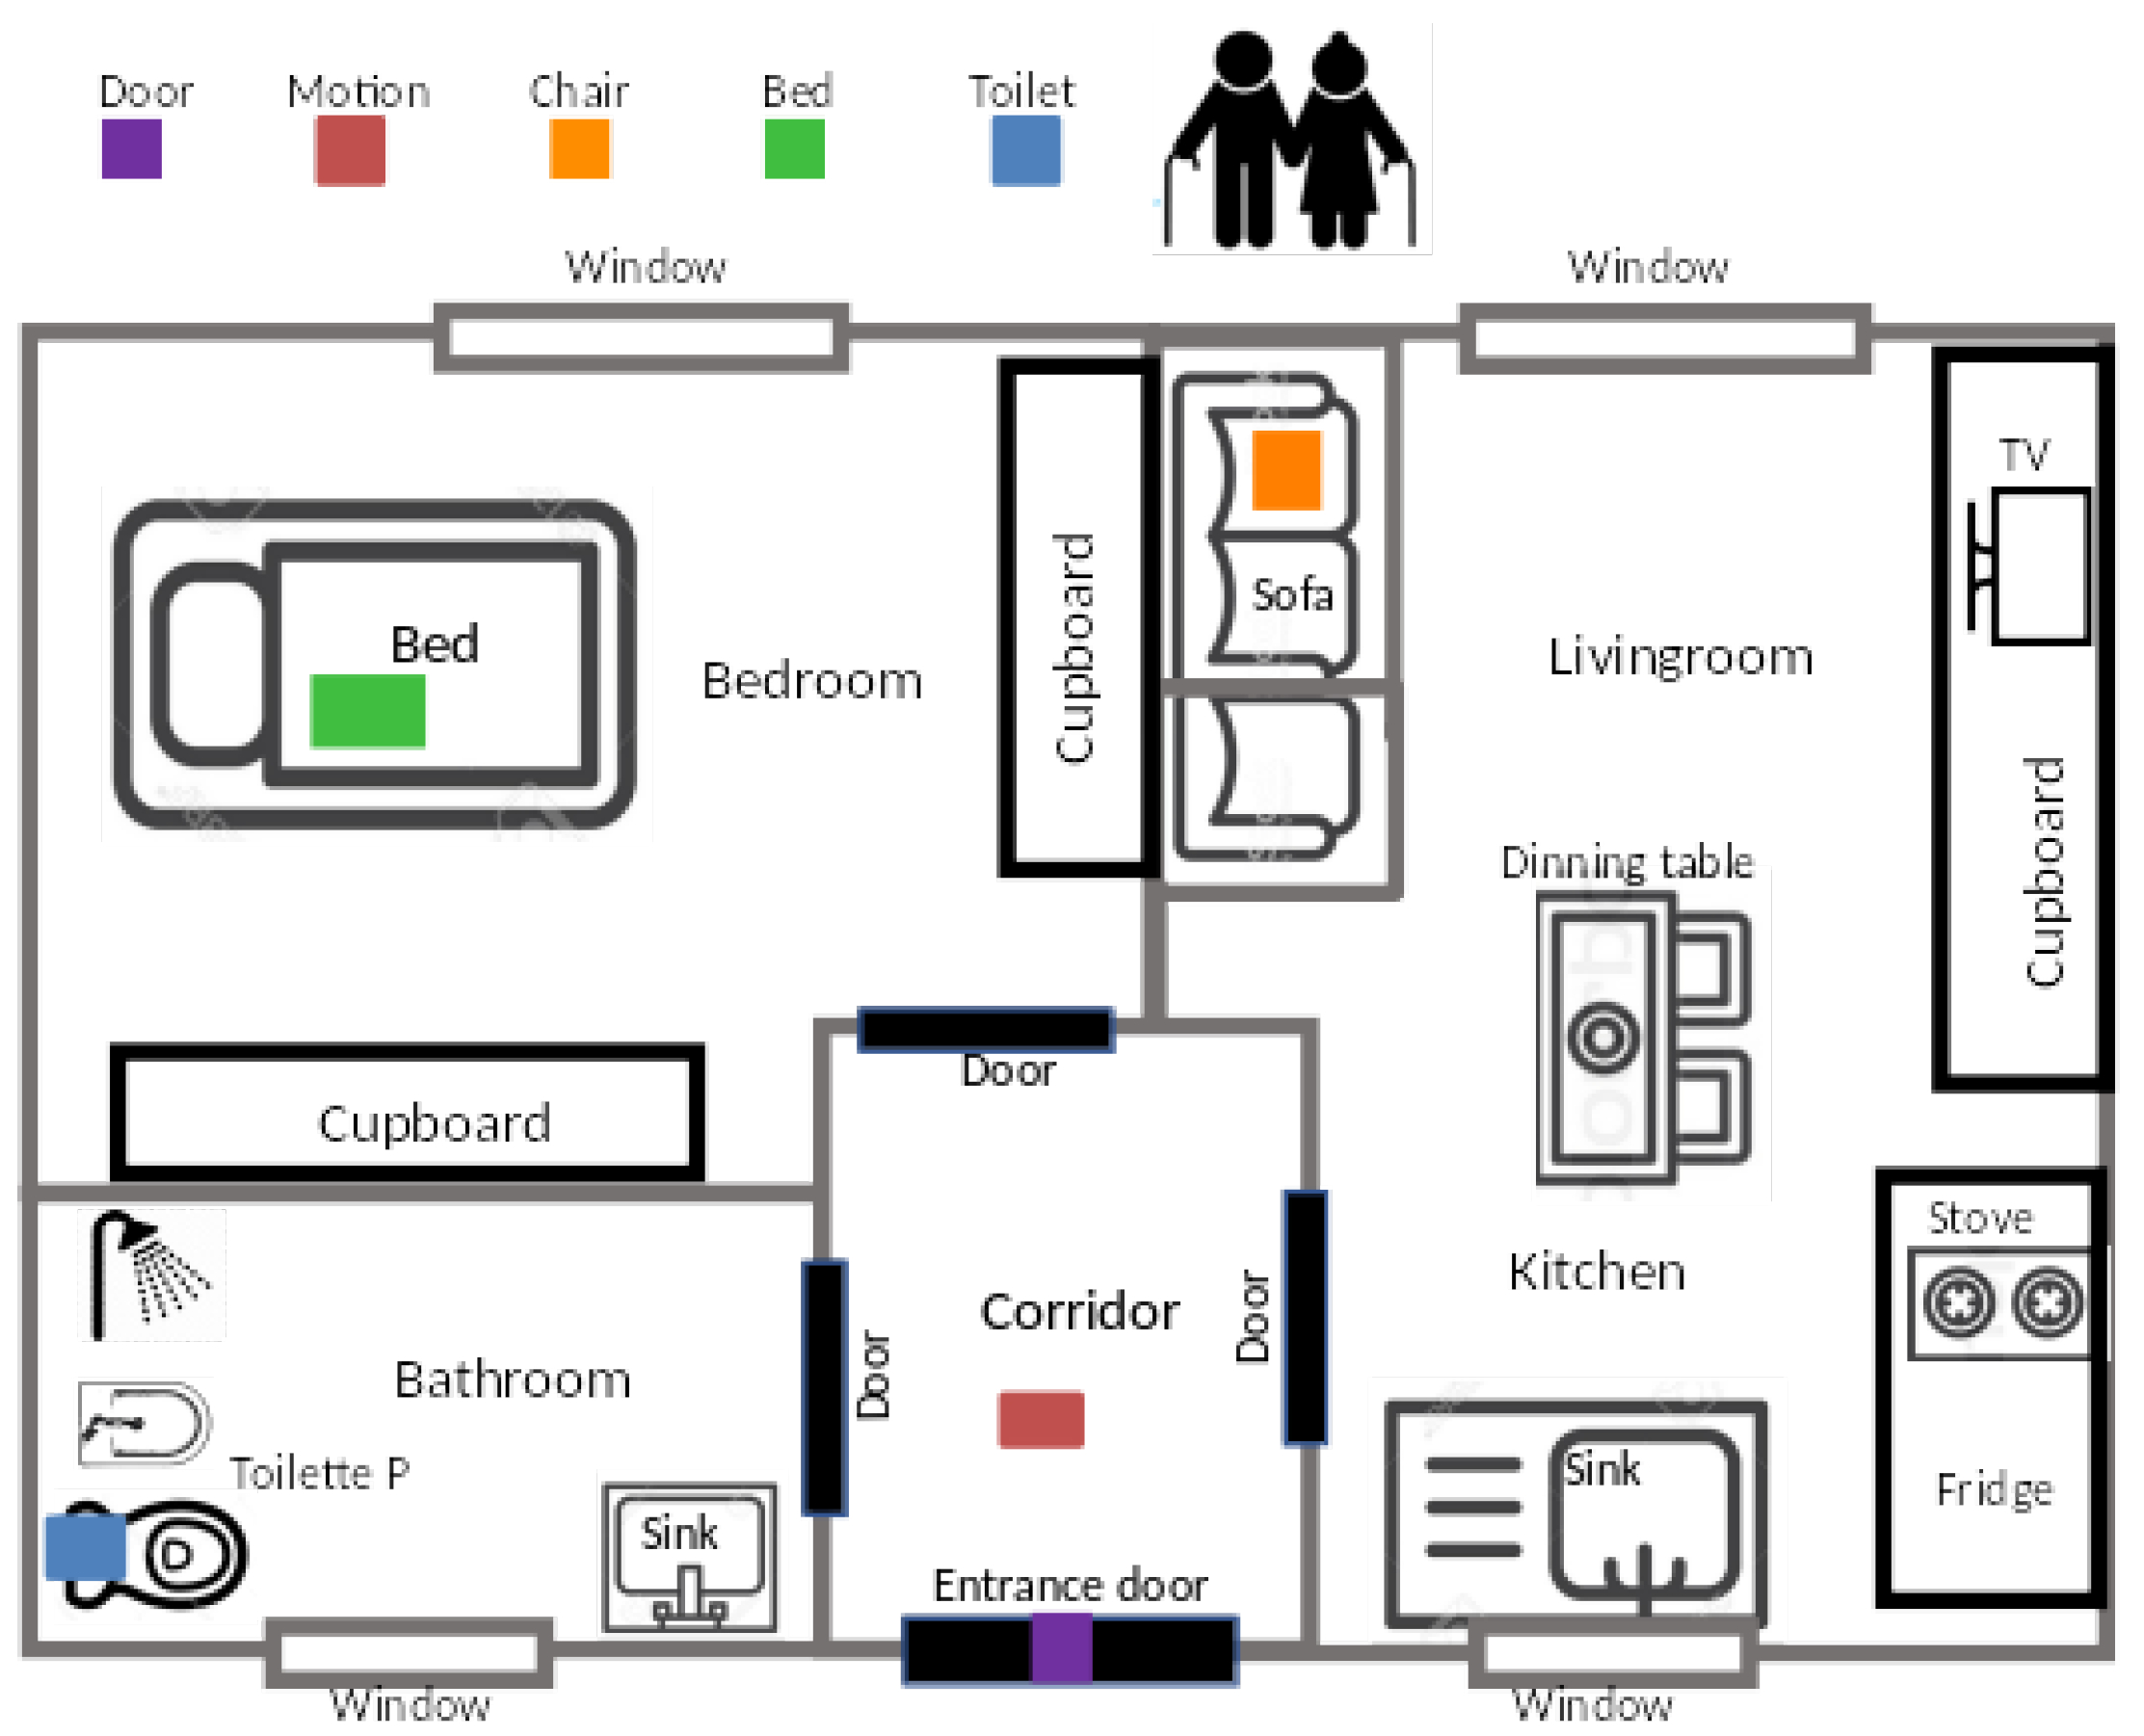
Figure 1 shows a typical installation setup. The WiFi router is placed in the center of the house, to achieve optimal signal coverage for all sensors. The motion sensor is installed at ‘a point of passage’ of the house, which typically could be at the main corridor area. The door sensor is deployed at the main entrance of the house. A full deployment typically requires 45 to 60 min, as measured in the pilot installations.
All devices feature the same micro-controller and network processor, a CC3220 System on Chip (SoC) by Texas Instruments (Dallas, TX, USA). This unit is a Wi-Fi certified product, providing IoT networking security, device identity and keys and is optimized for low-power operation. The certified stack implements both IPv4 and IPv6 protocols, with industry-standard, optimized BSD sockets (both TCP and UDP), secured by SSL/TLS.
6. Sleep Pattern Extraction and Sleep Quality Analysis
Sleep is an important indicator of quality of life and can be observed with the bed sensor in our AAL environment. Due to the sparse sensor setting and the multi-occupancy living condition, sleep profile was used as the main daily activity and health-status indicator in our system. This could be enhanced when richer sensor settings become available. In this section, we report on individual sleeping events, from which we extract daily sleep profiles (including night sleep and naps), sleep behavioral patterns, and derive sleep quality scores based on medical recommendations by sleep experts. Additionally, a horizontal and vertical pattern analysis is conducted to categorize users into sub-groups and to track each user’s health-status trajectory. Finally, we share interesting findings observed from the COVID-19 lockdown period.
We employ a simple pressure-based passive bed sensor, which offers an affordable solution for long-term usage at households of elderly people. Event-based binary signals are triggered when a sensor state (on/off-bed) change is detected. The sensor is calibrated using the weight of the target user, and deployed at the side of the bed where the target user usually sleeps to reduce signal noise that could be triggered by objects or other residents in the households.
6.1. Background Research
Quantity (sleep duration) and quality (absence of sleep disturbances or disorders) are among the most important metrics of a healthy sleep.
Researchers found out that there is a U-shaped association between sleep duration and all-cause mortality, where those who sleep the least and the most are at higher risk of morbidity and all-cause mortality [
45]. Recommendations [
46] by the American Academy of Sleep Medicine and the Sleep Research Society state that less than 7 h of sleep per night on a regular basis is associated with adverse health outcomes, both physically and mentally. Meanwhile, sleep of more than 9 h per night is also not recommended, unless the subjects are young adults or individuals recovering from illnesses or sleep debt. The sleep duration recommended by the National Sleep Foundation [
15] for older adults (⩾65 years) is 7 to 8 h per night, while less than 5 or more than 9 h is not recommended.
In terms of sleep quality, 12 indicators were identified in the National Sleep Foundation’s recommendations [
16], among which there are 4 sleep continuity variables (sleep latency, number of awakenings, length of awakenings after sleep onset, and sleep efficiency), 5 sleep architecture variables (neural activity-related sleep stages), and 3 nap variables (number of naps per day, nap duration, nap frequency). Additionally, panelists claim that the optimal range of the sleep indicators depends on the age of the subject. They have agreed on 9 age categories and suggested different recommendations for each group. For this study, with the youngest patient being 68 years old, we consider the ‘older adults’ (⩾65 years) as the relevant age category for sleep quality guideline. Sleep architecture measurements (i.e., the identification of sleep stages) require sophisticated devices, and are out of the scope of this study. We consider sleep continuity, and nap variables to quantify sleep qualities in our system. Optimal conditions for high sleep quality in the target age group are: (i) falling asleep in less than 30 min, (ii) waking up no more than twice per night, (iii) time being awake after sleep onset of no more than 30 min, and (iv) the ratio of total sleep time to time in bed of ⩾85%. In terms of naps, the fewer naps, and the shorter the nap duration per day the higher the sleep quality.
6.2. Bed Sensor Event Data Pre-Processing
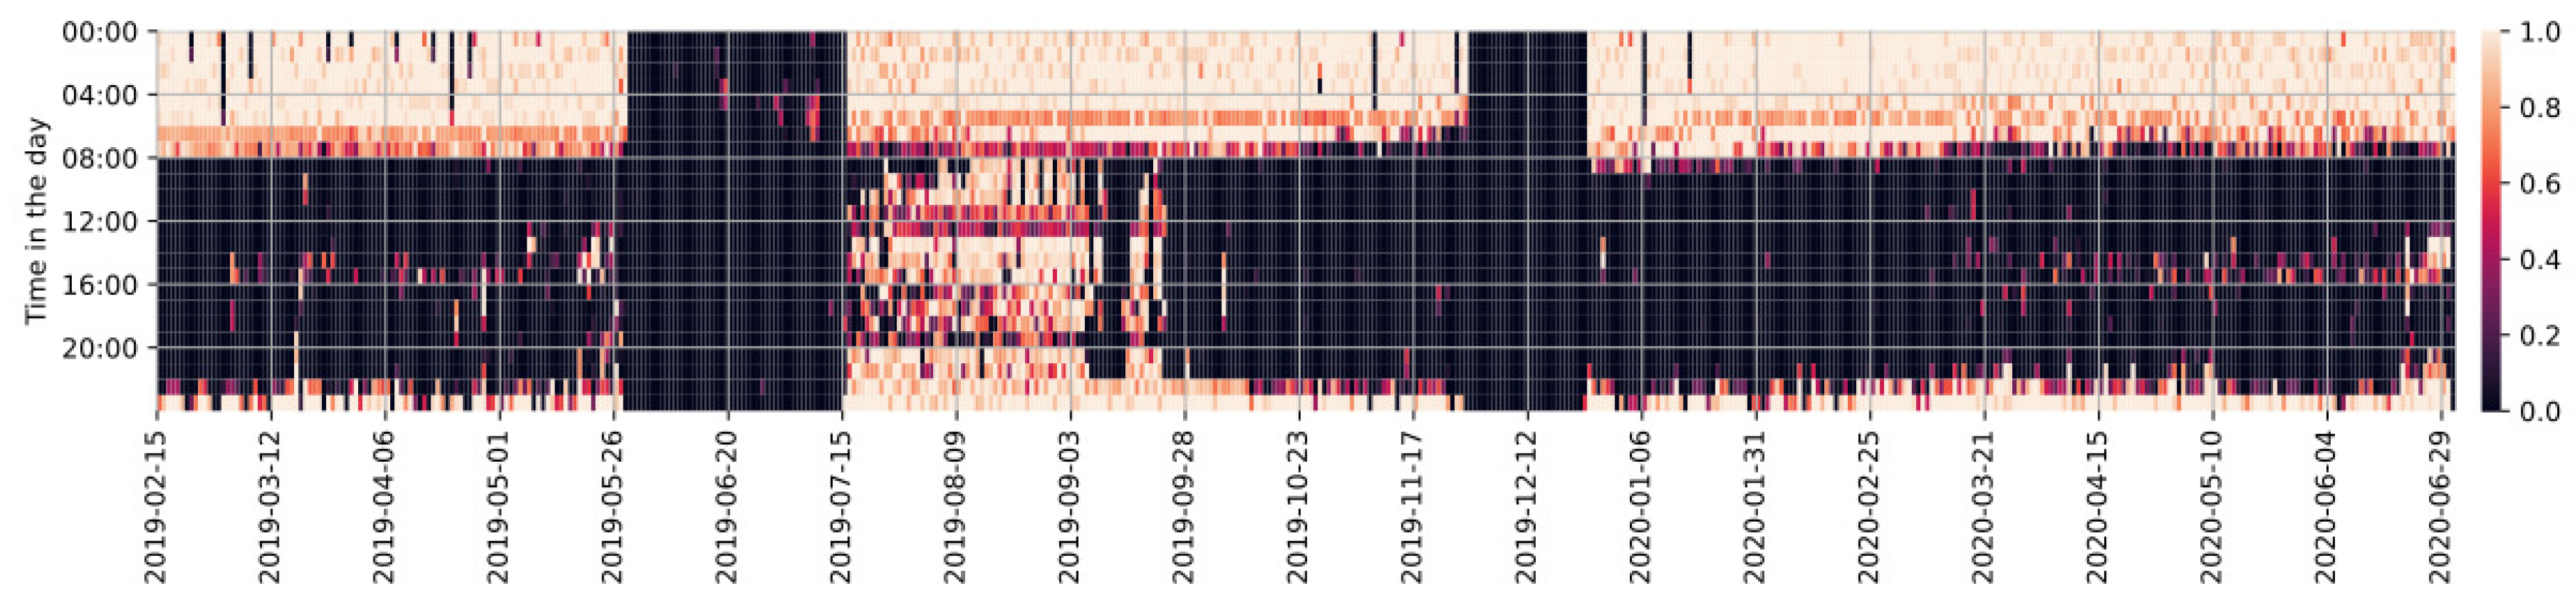
For visualization purpose, we transform the second-based binary signal into and hourly based bedtime diary, by computing the time-percentage the sleep sensor was ‘on’ within each hour.
Figure 3 illustrates the hourly bedtime diary of a user (from February 2019 to the end of June 2020) as a heat-map. We can clearly identify night sleep, which starts and ends with a repeating pattern, while day sleep is visible for only some periods of the time. Furthermore, two periods of close to no sleep are visible, resulting from a hospitalization from May 28 to July 15 in 2019, and a holiday from 28 November to 24 December 2019.
Periods of continuous sleep sensor ‘on’-state are considered to identify individual sleep events (e.g., night sleep, day naps). However, short ‘off’-state periods can occur due to toss and turns, awakenings and other movements in bed. In such cases, it is necessary to merge the over-segmented events. We use medically recommended rules to identify those interruptions, based on which the over-segmented events are merged. Those interruptions will also be taken into consideration as toss and turns, awakenings, or breaks accordingly for sleep quality analysis.
According to the National Sleep Foundation’s (NSF) sleep quality recommendations [
16], sleep interruptions of more than 5 min can be considered to be ‘awakenings’; a break of less than 30 min indicates good sleep; breaks longer than an hour are considered as not ‘appropriate’. Based on these recommendations we defined gaps of less than 5 min as ‘toss and turn’, gaps from 5 to 30 min as ‘awakening’, and gaps from 30 to 60 min as ‘break’, and merge the corresponding segments. Events of less than 10 min duration, which could be caused by sitting on the bed rather than sleeping, are considered to be not relevant and are therefore eliminated. Sleep events of less than 30% efficiency (percentage of ‘on bed’ time of a sleep event), which could result from merging short ‘on bed’ fractions (often sensor noise) with comparably large gaps in between, are also removed in the experiments.
6.3. Event-Based Sleep Analysis
Event-based analysis can be used to extract different sleep types, and identify outlier activities as soon as abnormal characteristics of an event onset is detected. In this section, we introduce the event-based sleep feature representation and pattern extraction methodologies that we applied.
6.3.1. Feature Representation
Time of sleep onset and sleep duration are key differentiators for personal sleep habits. Therefore, the sleep start time (), sleep end time () and sleep duration () are included as features, to represent a sleep event. To encode the periodic nature of ‘time’ as a smooth function, we convert timestamps () into a two-element trigonometric vector representation: ().
As stated in
Section 6.1, sleep continuity variables (number of interruptions, length of interruptions, and sleep efficiency), are important measurements for quantifying sleep quality. We consider three different ‘interruption’ categories for representing a sleep event, i.e., toss and turns, awakenings, and breaks (according to the definitions in the previous
Section 6.2). For each sleep event, we compute the number (
) and total duration (
) of each interruption category, which resulted in 6 additional features. Sleep efficiency is computed as:
. Furthermore, toilet breaks during a sleep event are considered to be of special interest in geriatrics, which we include as an additional descriptor.
6.3.2. Sleep Event Pattern Extraction
With each sleep event represented in the 12-dimensional feature space, we adopt unsupervised algorithms to cluster events into groups of similar behaviors. The resulting clusters demonstrate sleep behavior patterns of the target user.
DBSCAN [
47], a density-based, non-parametric clustering method, groups regions of densely connected samples (within a neighborhood of size
) into clusters. To allow varying densities across clusters, HDBSCAN [
48,
49] conducts a hierarchical clustering scheme, where varying neighborhood distance thresholds are naturally selected. Specifically, selecting the most stable branches of the hierarchy allows the tree to be cut at varying heights, thus resulting in clusters of different density. Additionally, this algorithm does not require prior knowledge about the number of clusters.
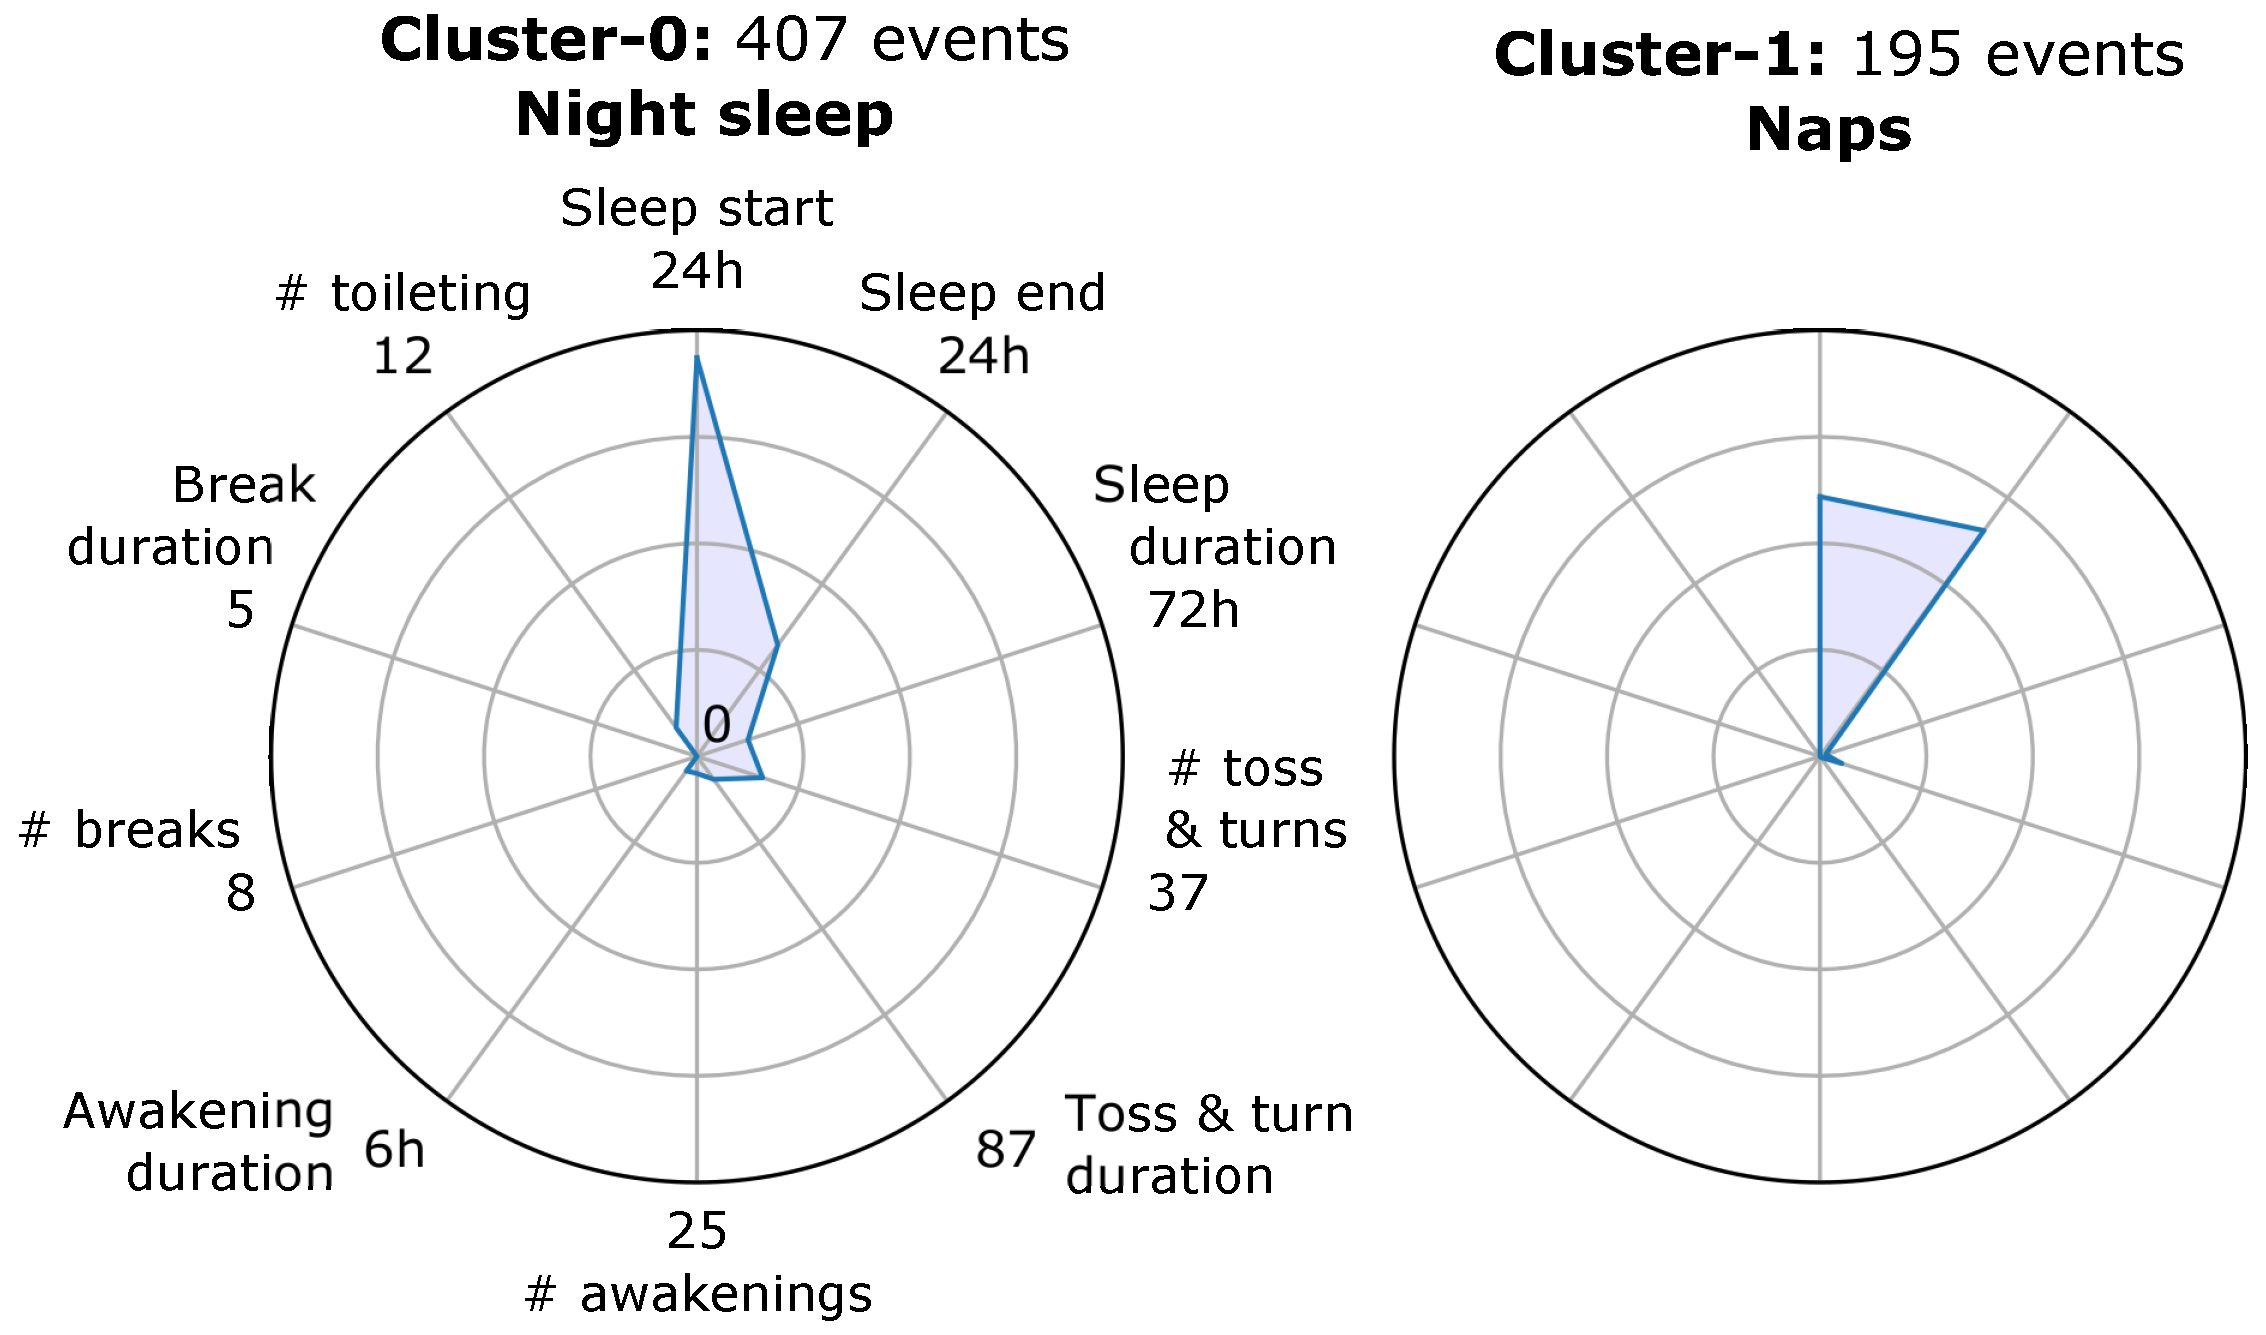
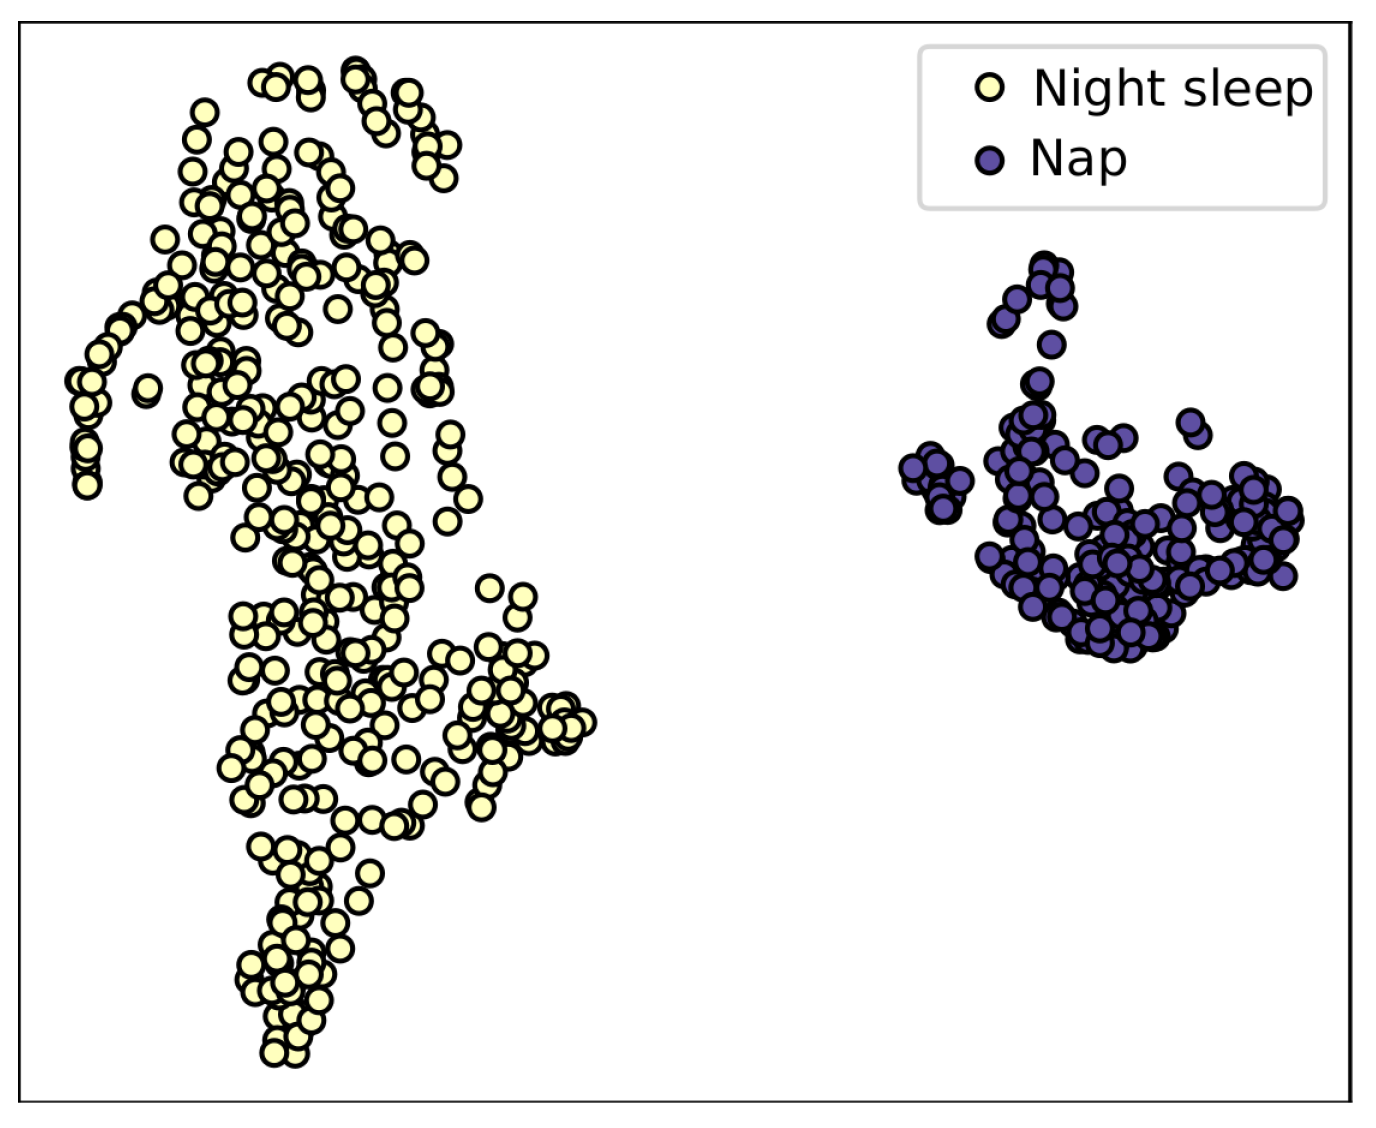
We conduct HDBSCAN on sleep events extracted from each user.
Figure 4 visualizes the centers (median feature of all samples per cluster) of the resulting two clusters, extracted from the user shown in
Figure 3. The first cluster represents the night sleep pattern with the sleep onset at around 10 p.m. and the getting up time at around 8 a.m., with some toss and turns, short awakenings, and toilet breaks. The second cluster illustrates a day-time nap pattern. The user typically takes a short nap in the early afternoon, with few toss and turns. Note, for visualization purposes we use the original time of day to represent the start/end time instead of the two-element sinusoidal cyclic representation.
Figure 5 maps clustering results of the user on a 2-D t-SNE [
50] space. We can see that the extracted sleep patterns align well with the densely distributed groups formed in the t-SNE space.
6.4. Daily Sleep Profile and Sleep Quality Score
In this section, we aim to provide insights into the definition of a sleep quality score based on all sleep events (night sleep and naps) on a given day, considering the sleep quality indicators recommended in [
16]. First, we propose to create a daily sleep profile that reports on the two sleep types separately, and a sleep quality score scheme that combines the appearance of the two.
6.4.1. Daily Sleep Profile
A night sleep is considered to be any sleep event that started before midnight of the given day and ended after, or started before 5am of the next day. Note, a daily sleep profile can contain multiple night sleep events, as derived according to the policy in
Section 6.2, i.e., if there are breaks that last more than an hour at nighttime. Any other sleep events that occur in the given day are considered to be naps.
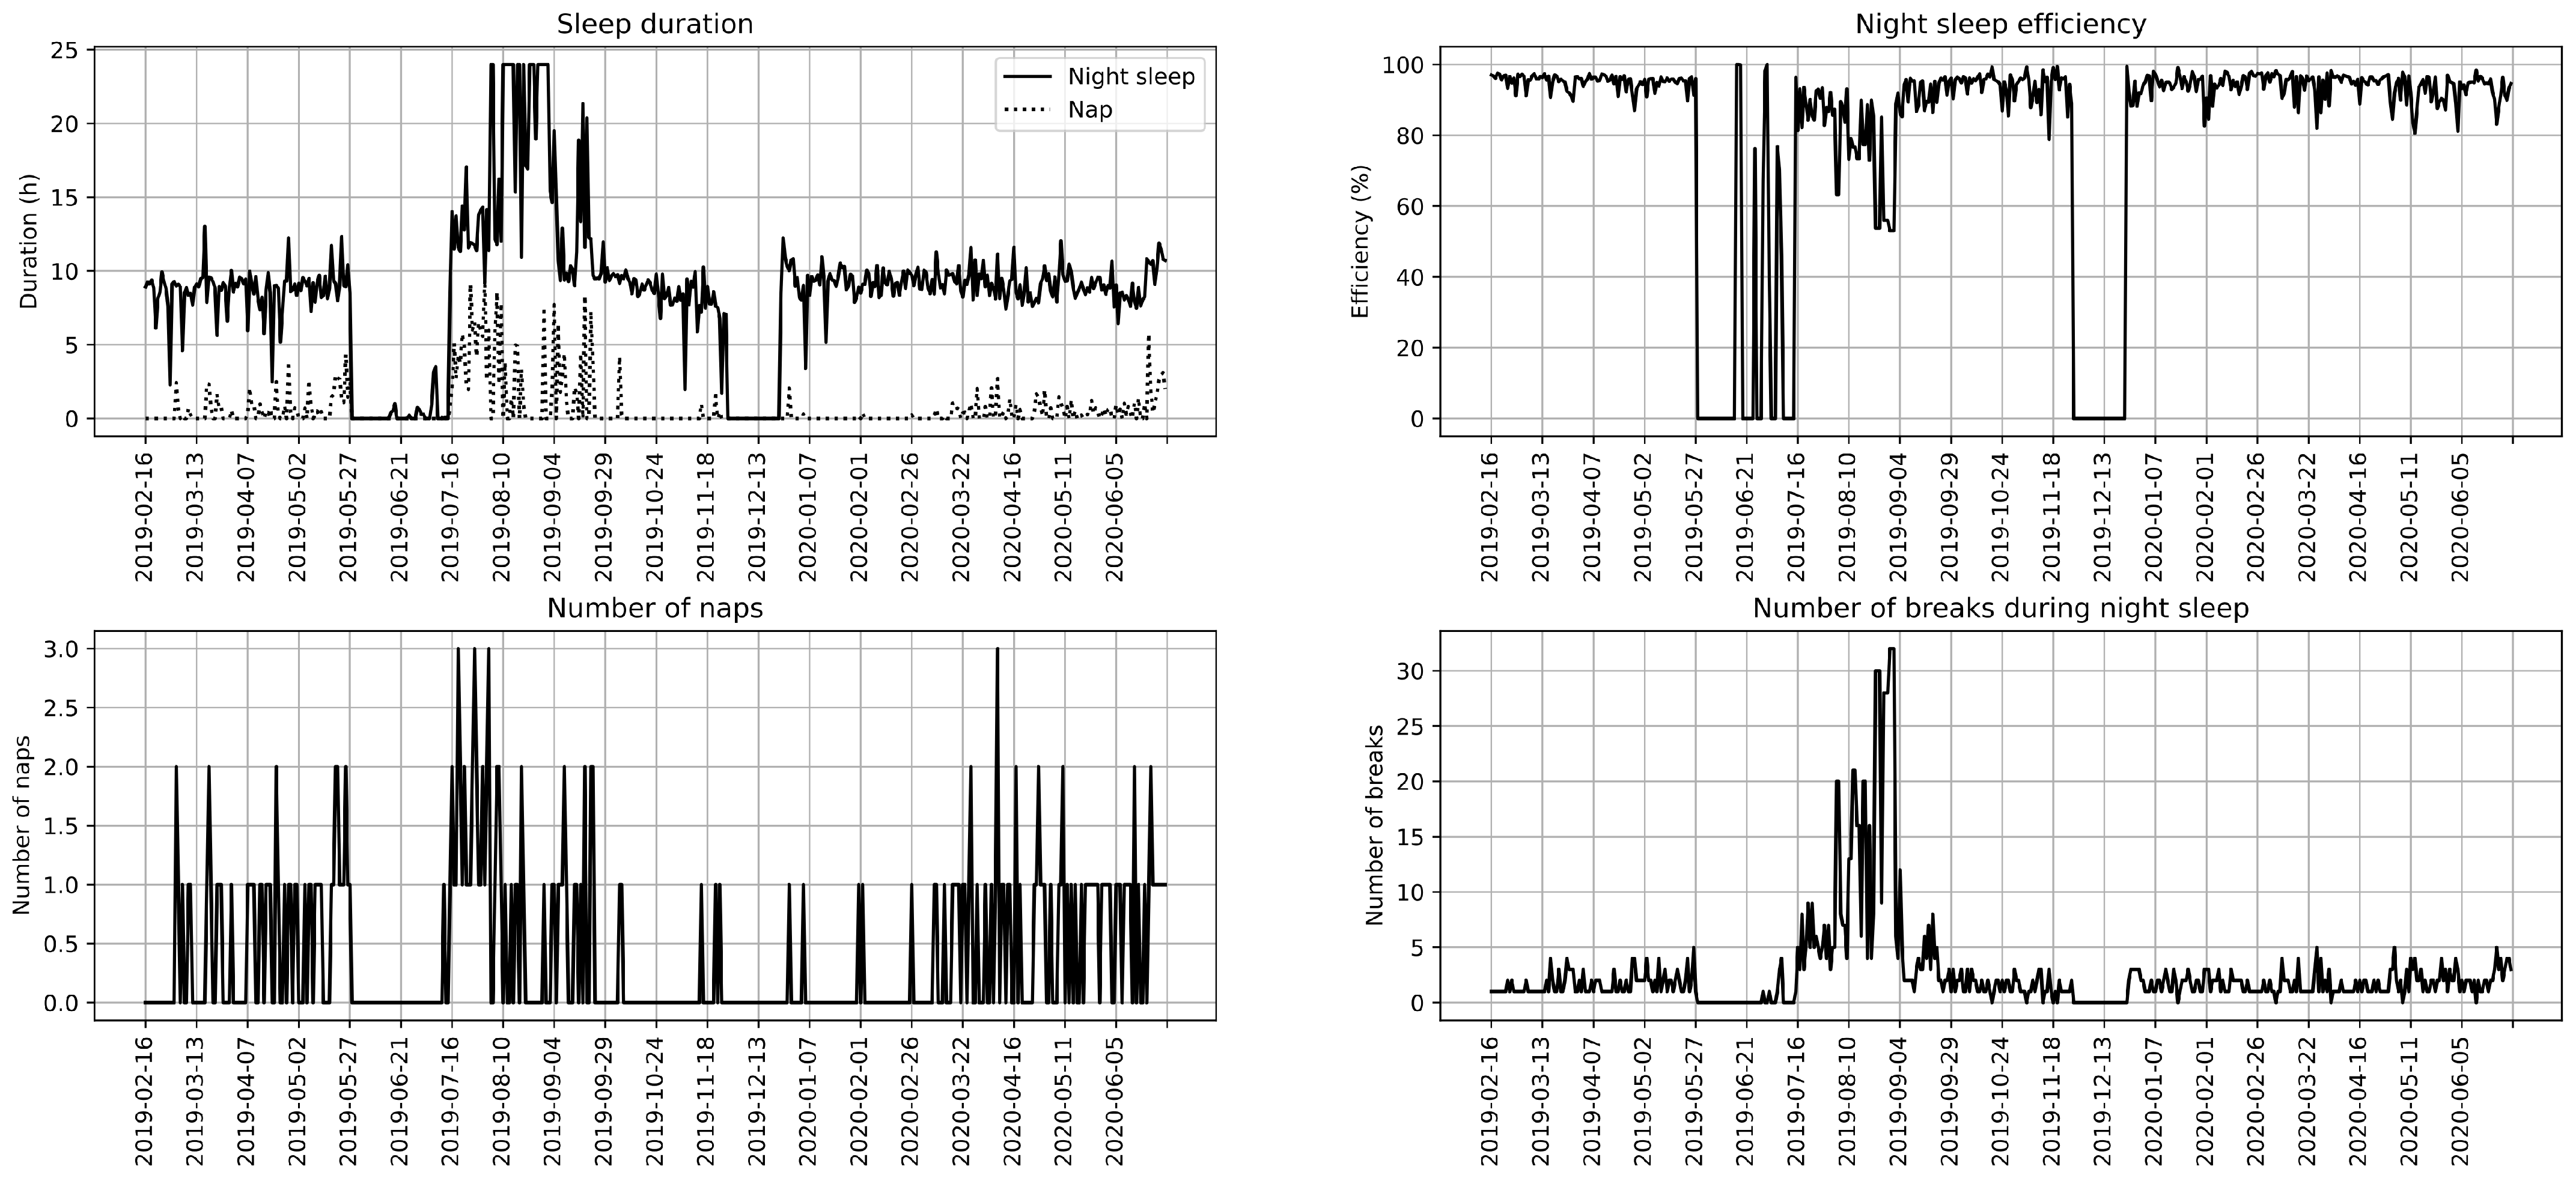
Aiming at providing an effective, yet concise representation, we illustrate the users’ daily sleep profile with sleep indicators (three for night sleeps, and two for naps), according to the guidance provided in [
16]. Specifically, night sleep profiles are composed of duration, number of awakenings/breaks, as well as sleep efficiency; nap profiles are composed of the number of naps and total nap duration.
Figure 6 shows an example of a daily profile of the user shown in
Figure 3.
Given this 5-dimensional representation of the daily sleep profile, we can use the methodology applied in
Section 6.3.2 to extract daily sleep patterns, analogous to the sleep pattern extraction from sleep events.
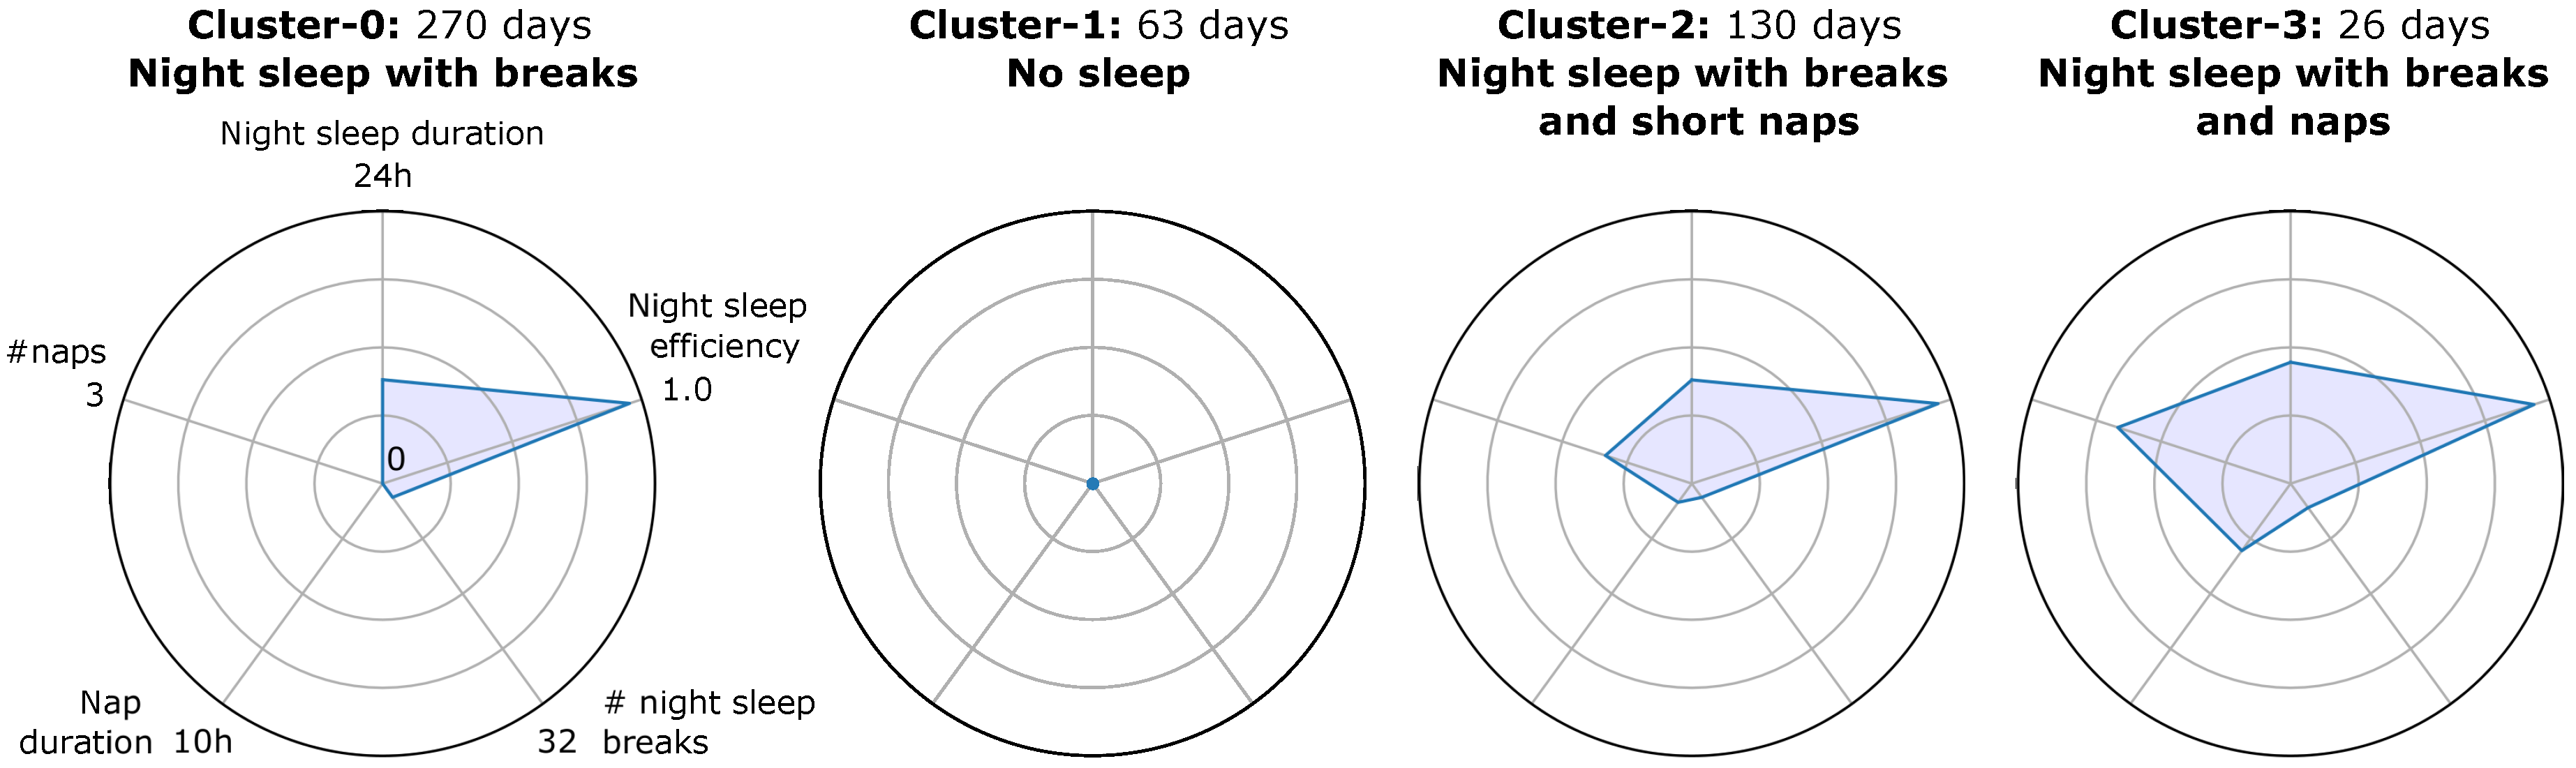
Figure 7 illustrates the four dominating daily sleep patterns extracted from this user. The first cluster refers to days, where only night sleep was detected. The last two clusters show days, where the user had both day and night sleep. More specifically, the last cluster depicts days with a larger number of naps and longer nap durations than cluster 2, which indicate a lower sleep quality according to [
16]. The second cluster indicates days without any sleep onset. Those days can easily be identified in
Figure 3 and are due to holidays or hospitalizations.
From this analysis, caregivers can be informed about the daily sleep patterns of a patient. For this specific user, with a monitoring period of 502 days, 156 days with daily sleeps with both night sleep and naps during the day, 270 days with daily sleep without a nap, and 63 days without sleep-onset were identified. The remaining 13 days do not correspond to any of these daily sleep patterns, due to their dissimilarity to the clusters in the feature space.
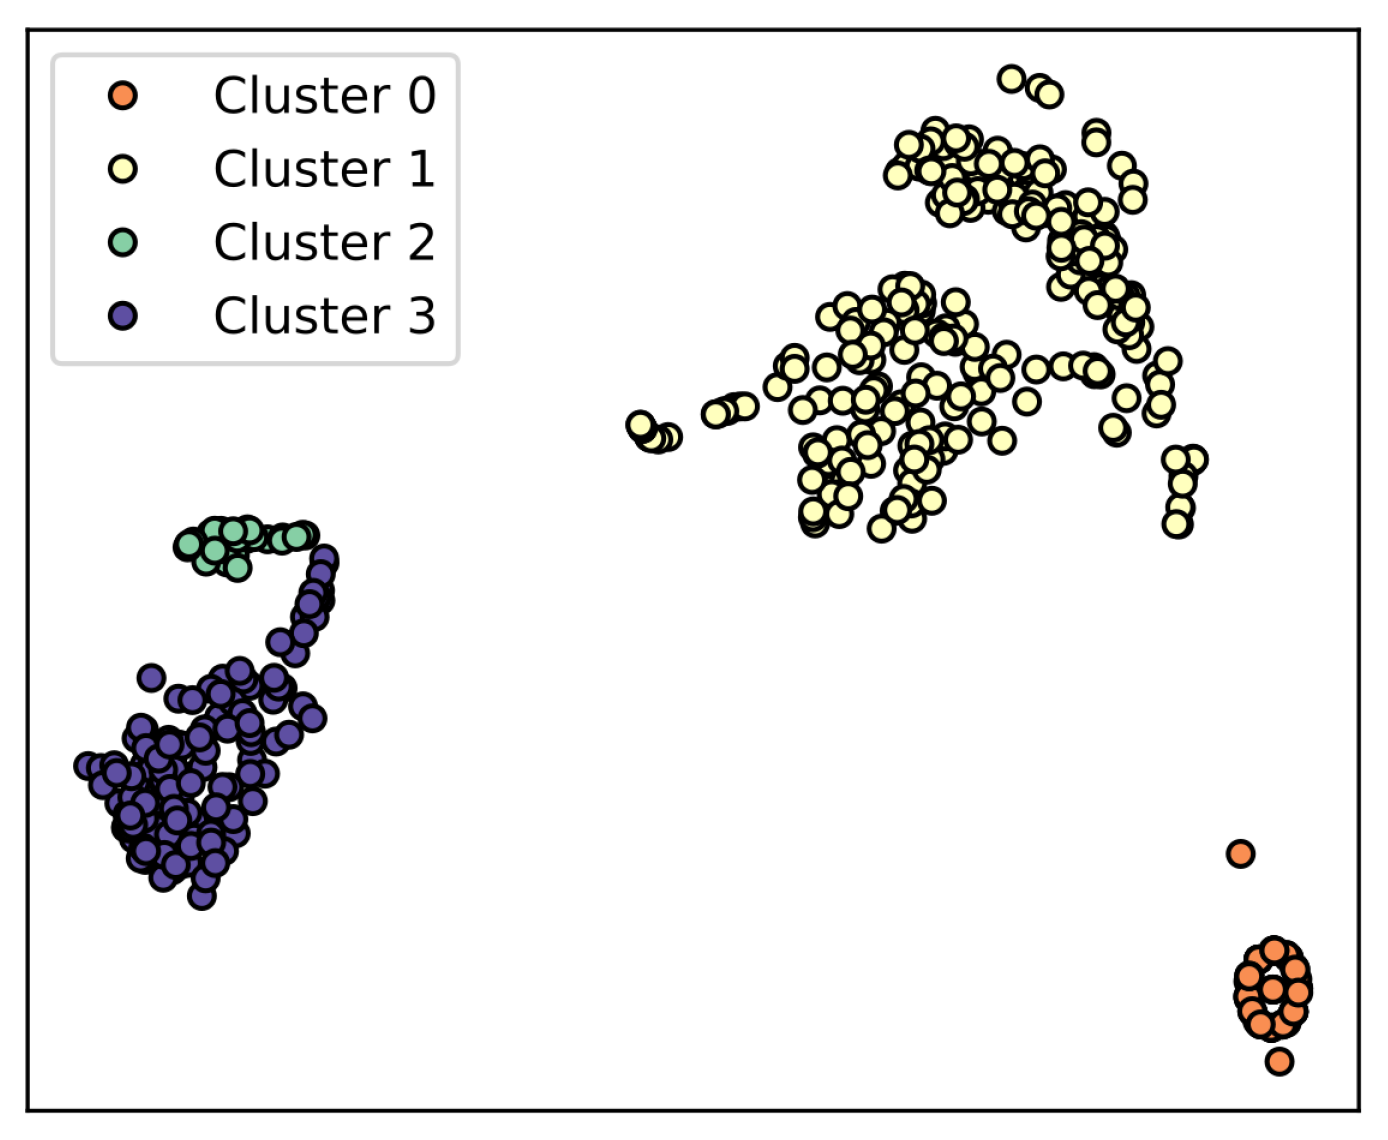
Figure 8 shows the clustered daily profile samples in the t-SNE space. Again, we can see that the extracted daily sleep profile patterns align well with the densely distributed groups that formed in the t-SNE space.
6.4.2. Sleep Quality Score
Additionally, we aim to define a sleep quality score based on the daily sleep profiles, capable of providing a quick overview of a patient’s sleep status to the caregiver. According to the recommended sleep quality guideline for elderly adults in [
16], we propose a scheme that combines night sleep and nap quality features. We adjusted the original quality score scale of the sleep efficiency measurement, because our sensor only detects physical off-bed moments rather than awakenings in a neurological sense or micro movement way, thus it is not rare to see a sleep efficiency score above 80%, and sleep durations longer than 7 h.
Referring to the National Sleep Foundation’s recommendations [
15,
16],
Table 3 illustrates the metrics, scales, and scoring schemes we applied. The overall score range is [0, 16]. A higher sleep score indicates a better sleep quality. Any measurement beyond the listed ‘value ranges’ does not contribute to the sleep score. In practice, we found that night sleep quality often has a greater impact to the overall sleep quality than daily naps. Therefore, the overall range of the night sleep score is [0, 12], while the range of the daily nap score is [0, 4].
Figure 9 shows daily sleep quality scores derived using this scheme, from the same user as shown in
Figure 3. We can see a subtle, but consistent quality drop starting in the middle of May 2019, followed by poor sleep quality scores from 27 May 2019. From the daily profile plot (
Figure 6) an increase in naps can be observed from the middle of May, followed by a sleep-onset absence starting on the 27th of May (which was due to a hospitalization of the patient). Additionally, a quality drop can be observed from March 2020, which is due to increased naps during the day, and reduced sleep efficiency at night. Interestingly, this behavior could be observed among multiple patients across the cohort and was caused by the COVID-19 lockdown, which started on March 8th and ended in May 2020 in Northern Italy. An increased night sleep duration was observed for 6 users, among which 5 were observed to have reduced sleep efficiency. Additionally, increased naps were observed for 3 users. Overall, we observed a sleep score drop for 8 patients.
6.5. Cohort Analysis
Dividing patients into groups (precision cohort) with common characteristics is crucial to providing personalized care. Thus, we conducted the same pattern extraction methodology as discussed in
Section 6.3.2 across the entire patient population, using the daily sleep profile representation (
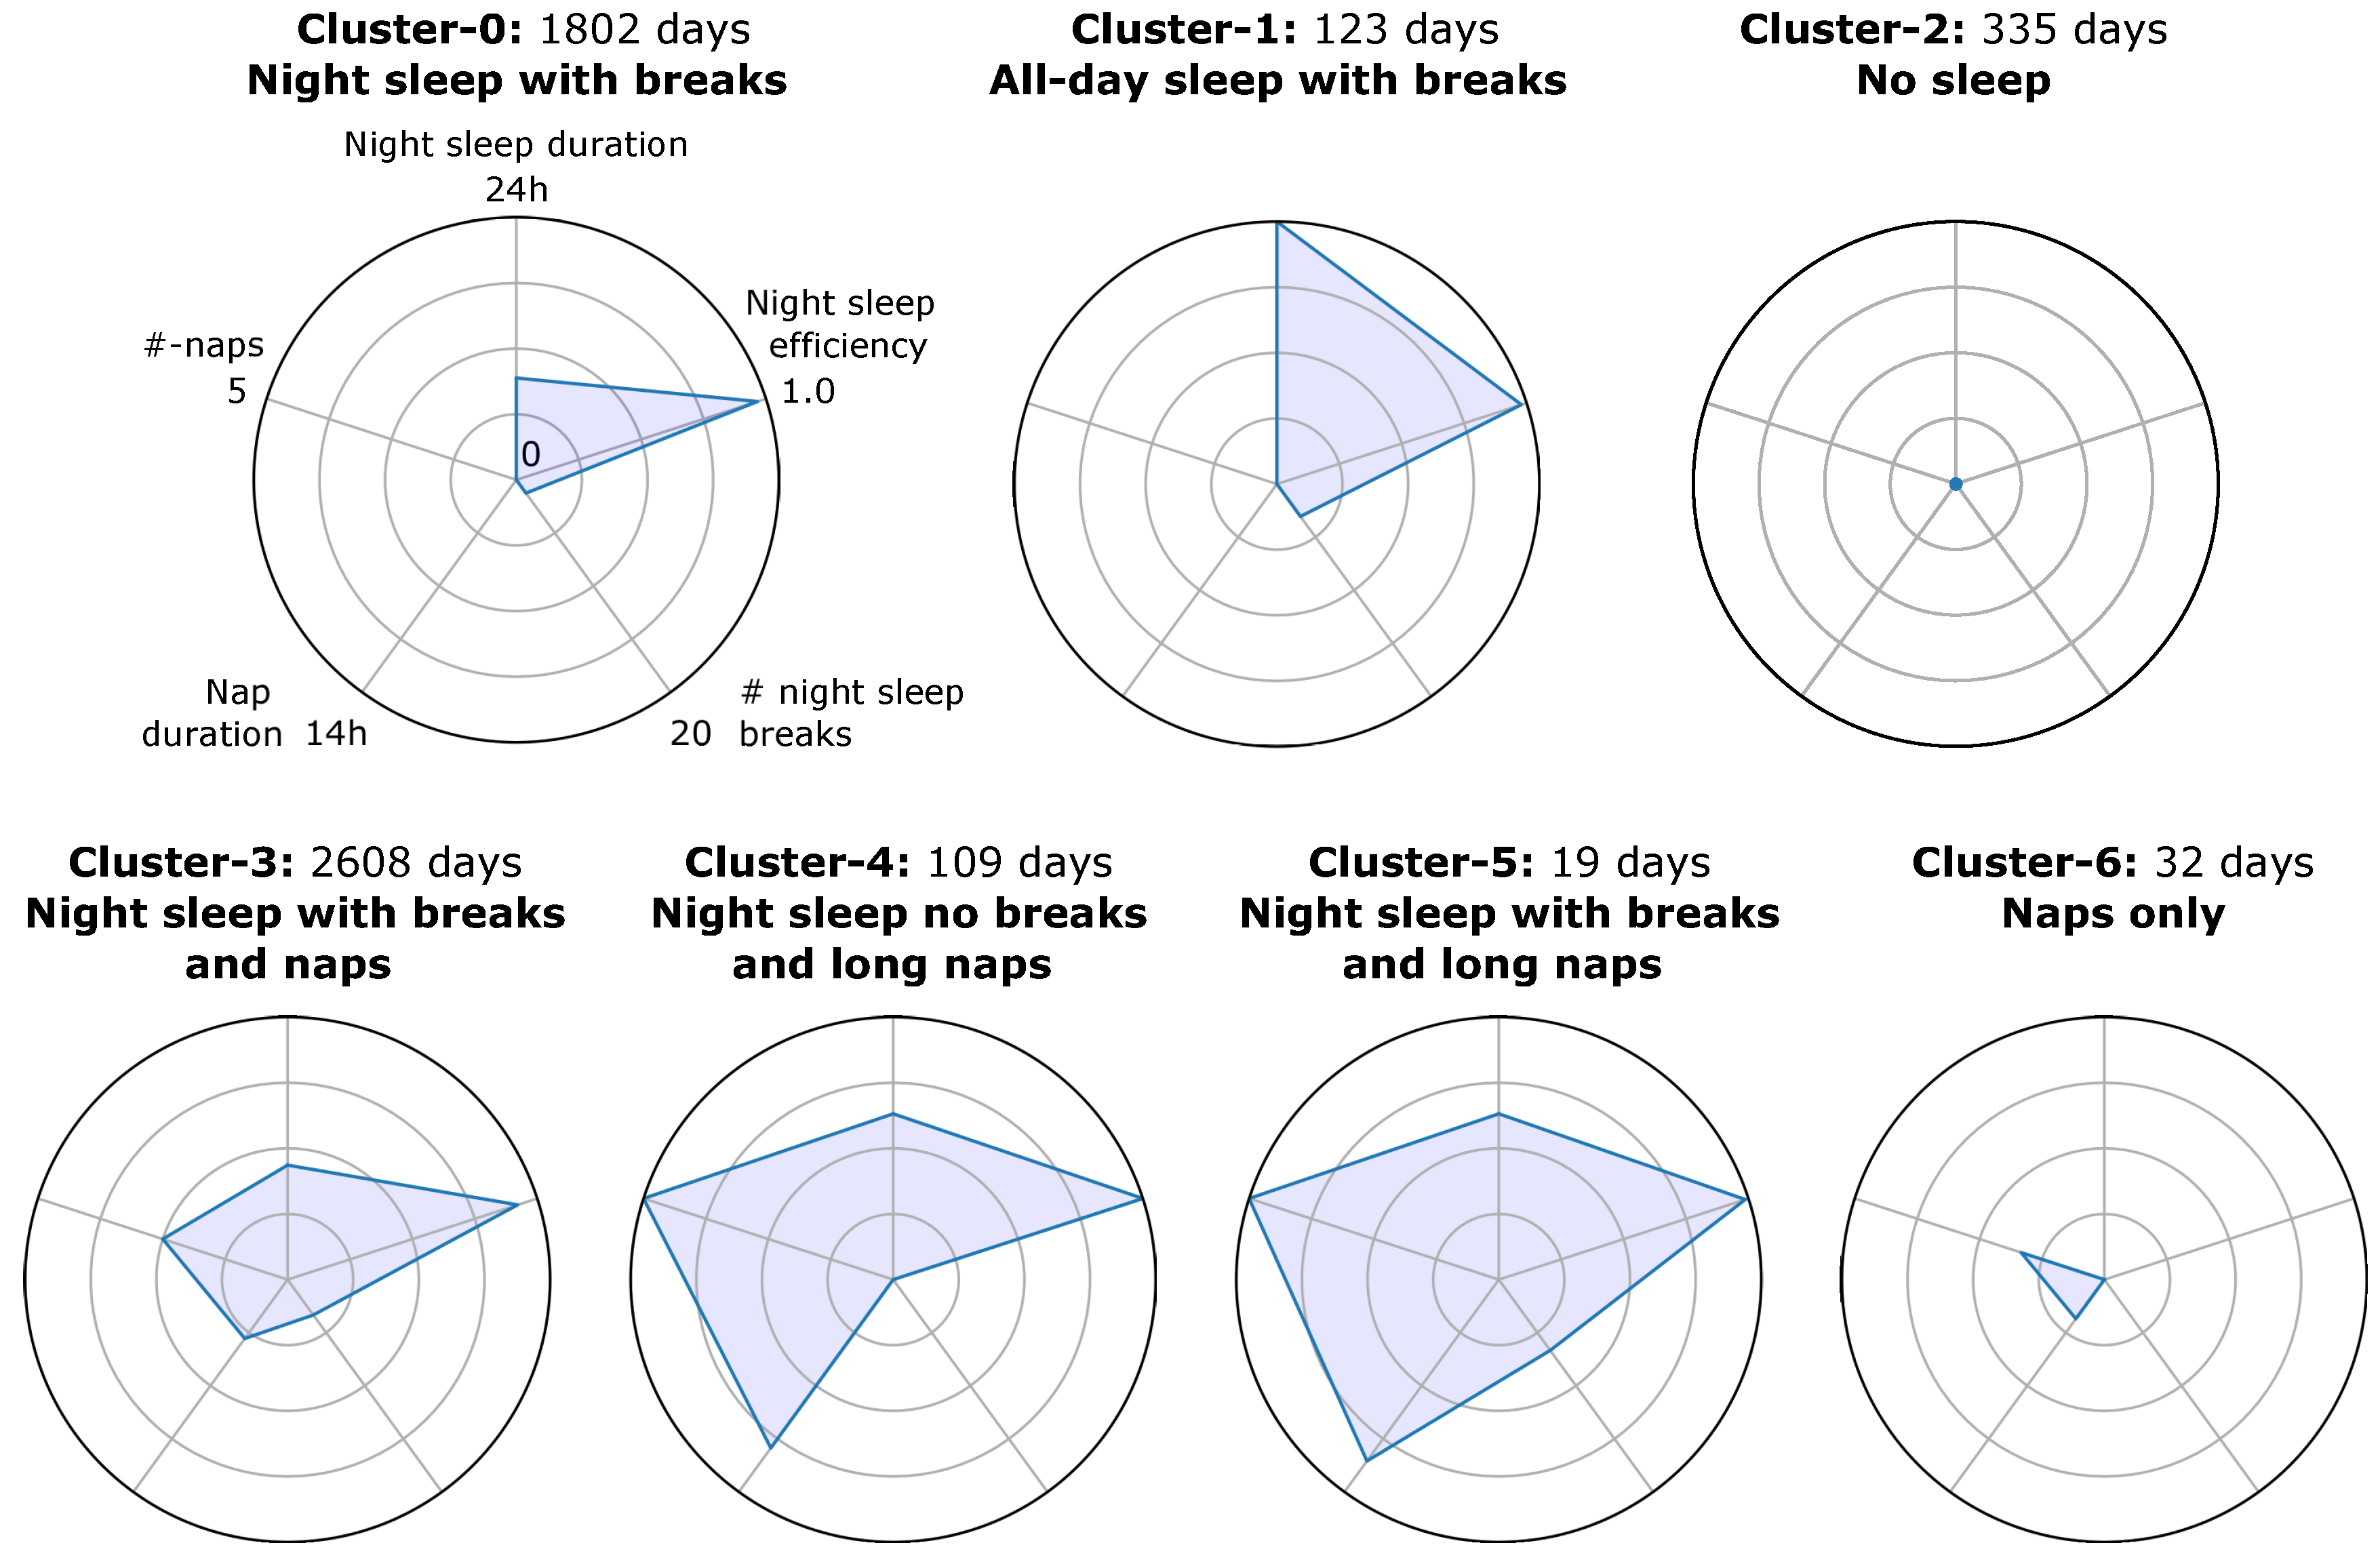
Section 6.4.1) to identify patient groups with similar sleep patterns. The resulting sleep patterns are depicted in
Figure 10. Cluster-0 and cluster-3 are the two most dominating sleep patterns, where cluster-0 represents the healthiest pattern, according to [
16]. Cluster-4 and cluster-5 represent two sleep profile patterns with many long naps. Cluster-1 refers to long night sleep patterns. The last cluster represents days where only a few short naps were recorded. Cluster-2 indicates days without any sleep activities detected, which is often due to the user being away from home. These clusters can be considered to be the ‘behavior pattern dictionary’ of our patient database, and each pattern is referred to as a ‘word’ in the ‘dictionary’. The dictionary can be enriched over time, when new patterns are formed.
Given the extracted ‘dictionary’, a user’s recent sleep profile can be represented by the appearance frequency of each ‘word’.
Table 4 lists the 15 bed-sensor users in our database, and the number of days they were in a respective sleep pattern. Thus, a user’s sleeping pattern during the monitored period can be represented as a ‘bag of words’, indicating the frequency of appearance of each ‘word’. Based on the resulting user representation, a user segmentation was performed with HDBSCAN, resulting in 4 clusters:
Group-A: patients 1, 14, and 15
Group-B: patients 2, 5, 7, 8, and 12
Group-C: patients 4, 6, and 13
Group-D: patients 9, 10, and 11
User 3’s daily sleep pattern could not be assigned to any of the patient groups. The care manager confirmed that this user was in a unique health condition, which keeps him/her in bed most of the time.
6.6. Health-Status ‘Trajectory’ Tracking
Longitudinal behavioral change often infers the elderly patient’s health-status progression trajectory over time. We consider behavior as activity patterns formed over an accumulated period of time. Given the activity pattern dictionary (
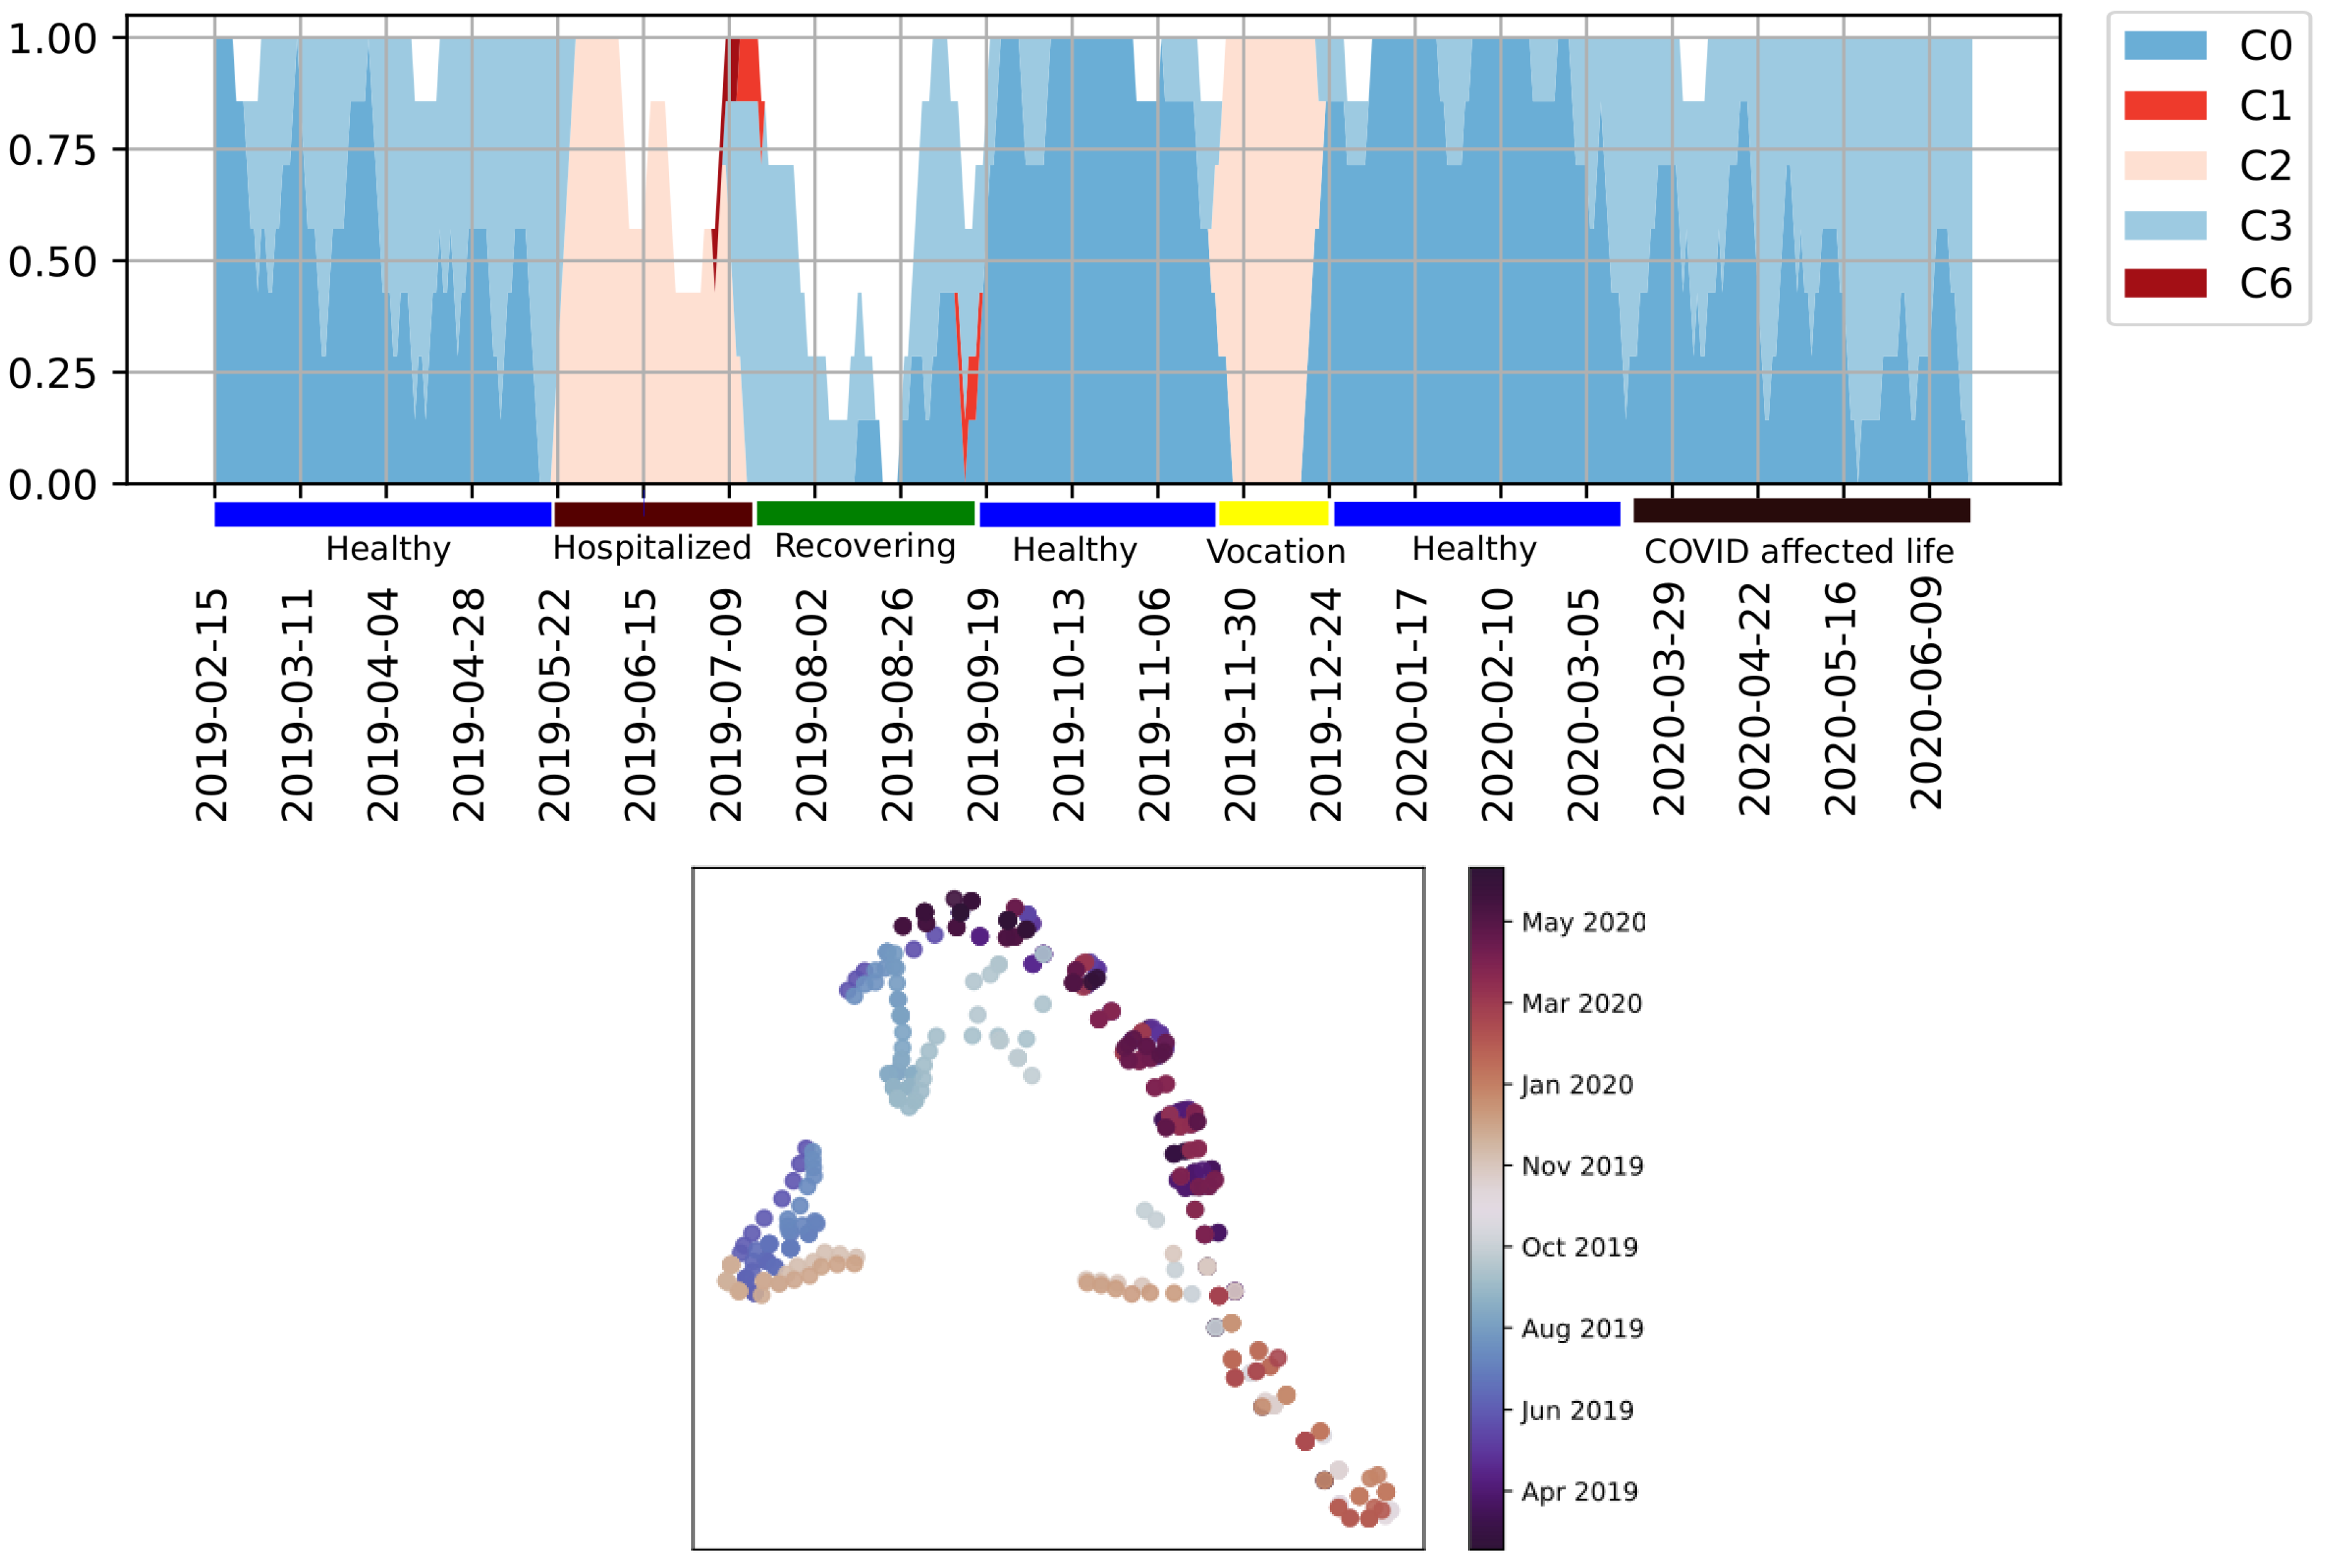
Section 6.5), we represent a patient’s ‘recent’ behavior habit by a ‘bag of words’. The progression of behavior change over time can be tracked as the change of patterns. From
Figure 11 (top), we can observe a decline of ‘C0’ (healthiest sleep pattern) during the initial monitoring phase, which led to a hospitalization in the middle of May 2019; and in the beginning of March 2020, which was due to the COVID lockdown. An increased ‘C0’ and ‘C3’ can be observed in the recovering stage after hospitalization.
Figure 11 (bottom) illustrates the user’s daily sleep profiles in t-SNE space, from which we can observe a seasonal trend, with an isolated group of days where no sleep onset was detected; and behavior patterns deviated from the main trend being days where long sleep duration were detected.
7. Outing and Visiting Detection
Outings and visits are important indicators of elderly people’s quality of life. Outings can be used as an indicator of the capability to carry out outdoor-based activities, such as grocery shopping. Visits can be used as a proxy of social engagement, which in turn is an indicator of major health issues [
17] and is thus important to be detected, possibly facilitating early interventions. Furthermore, detected outings and visits are relevant for reasoning about the absence of bed sensor ‘on’ states, as well as increased indoor motion caused by visitors.
7.1. Data Pre-Processing
In multi-person households, it is challenging to use sparsely deployed binary environmental sensors to track personalized activities, such as outings and visits. Therefore, we define outings as times when nobody is at home, and visits as times of exceptionally increased activity reported by the environmental sensors. Consequently, the detected outings and visits can only be used as an indirect indicator to track the changes of patients’ social and physical health status, instead of being reported as a comprehensive list of the corresponding activities.
In the literature, outings are typically identified as long inactive periods, and visits either based on pre-defined rules (certain overlap of sensor activities), or with supervised algorithms trained using carefully labeled datasets. Our approach is different in the following way: first, we assume that any outing/visiting event happens between adjacent door open/close activities at the entrance. Consequently, outings and visits are identified as inactive and exceptionally increased sensor activities between adjacent door segments. This way, the algorithm can adapt to different households and sensor topology. Please note that we disregard any segment that lasts less than 10 min.
7.2. Outing Detection
As described above, a segment between adjacent door activities is considered to be an outing event, if no sensor activity was detected during this time period. Due to calibration errors, sensors may trigger events with different delays which could result in signals detected right after the beginning or shortly before the end of the segment, even in the case of an actual outing event. To account for this error, we introduce a tolerance buffer before and after any door event. Within the buffer time any sensor activity is neglected. In practice, we found one minute to be a reasonable buffer to be used in our system. Additionally, sensors may trigger short and isolated events by accident. Thus, we employ a noise cut-off threshold to eliminate this type of noise. In practice, we take as the cut-off threshold, with representing the segment duration.
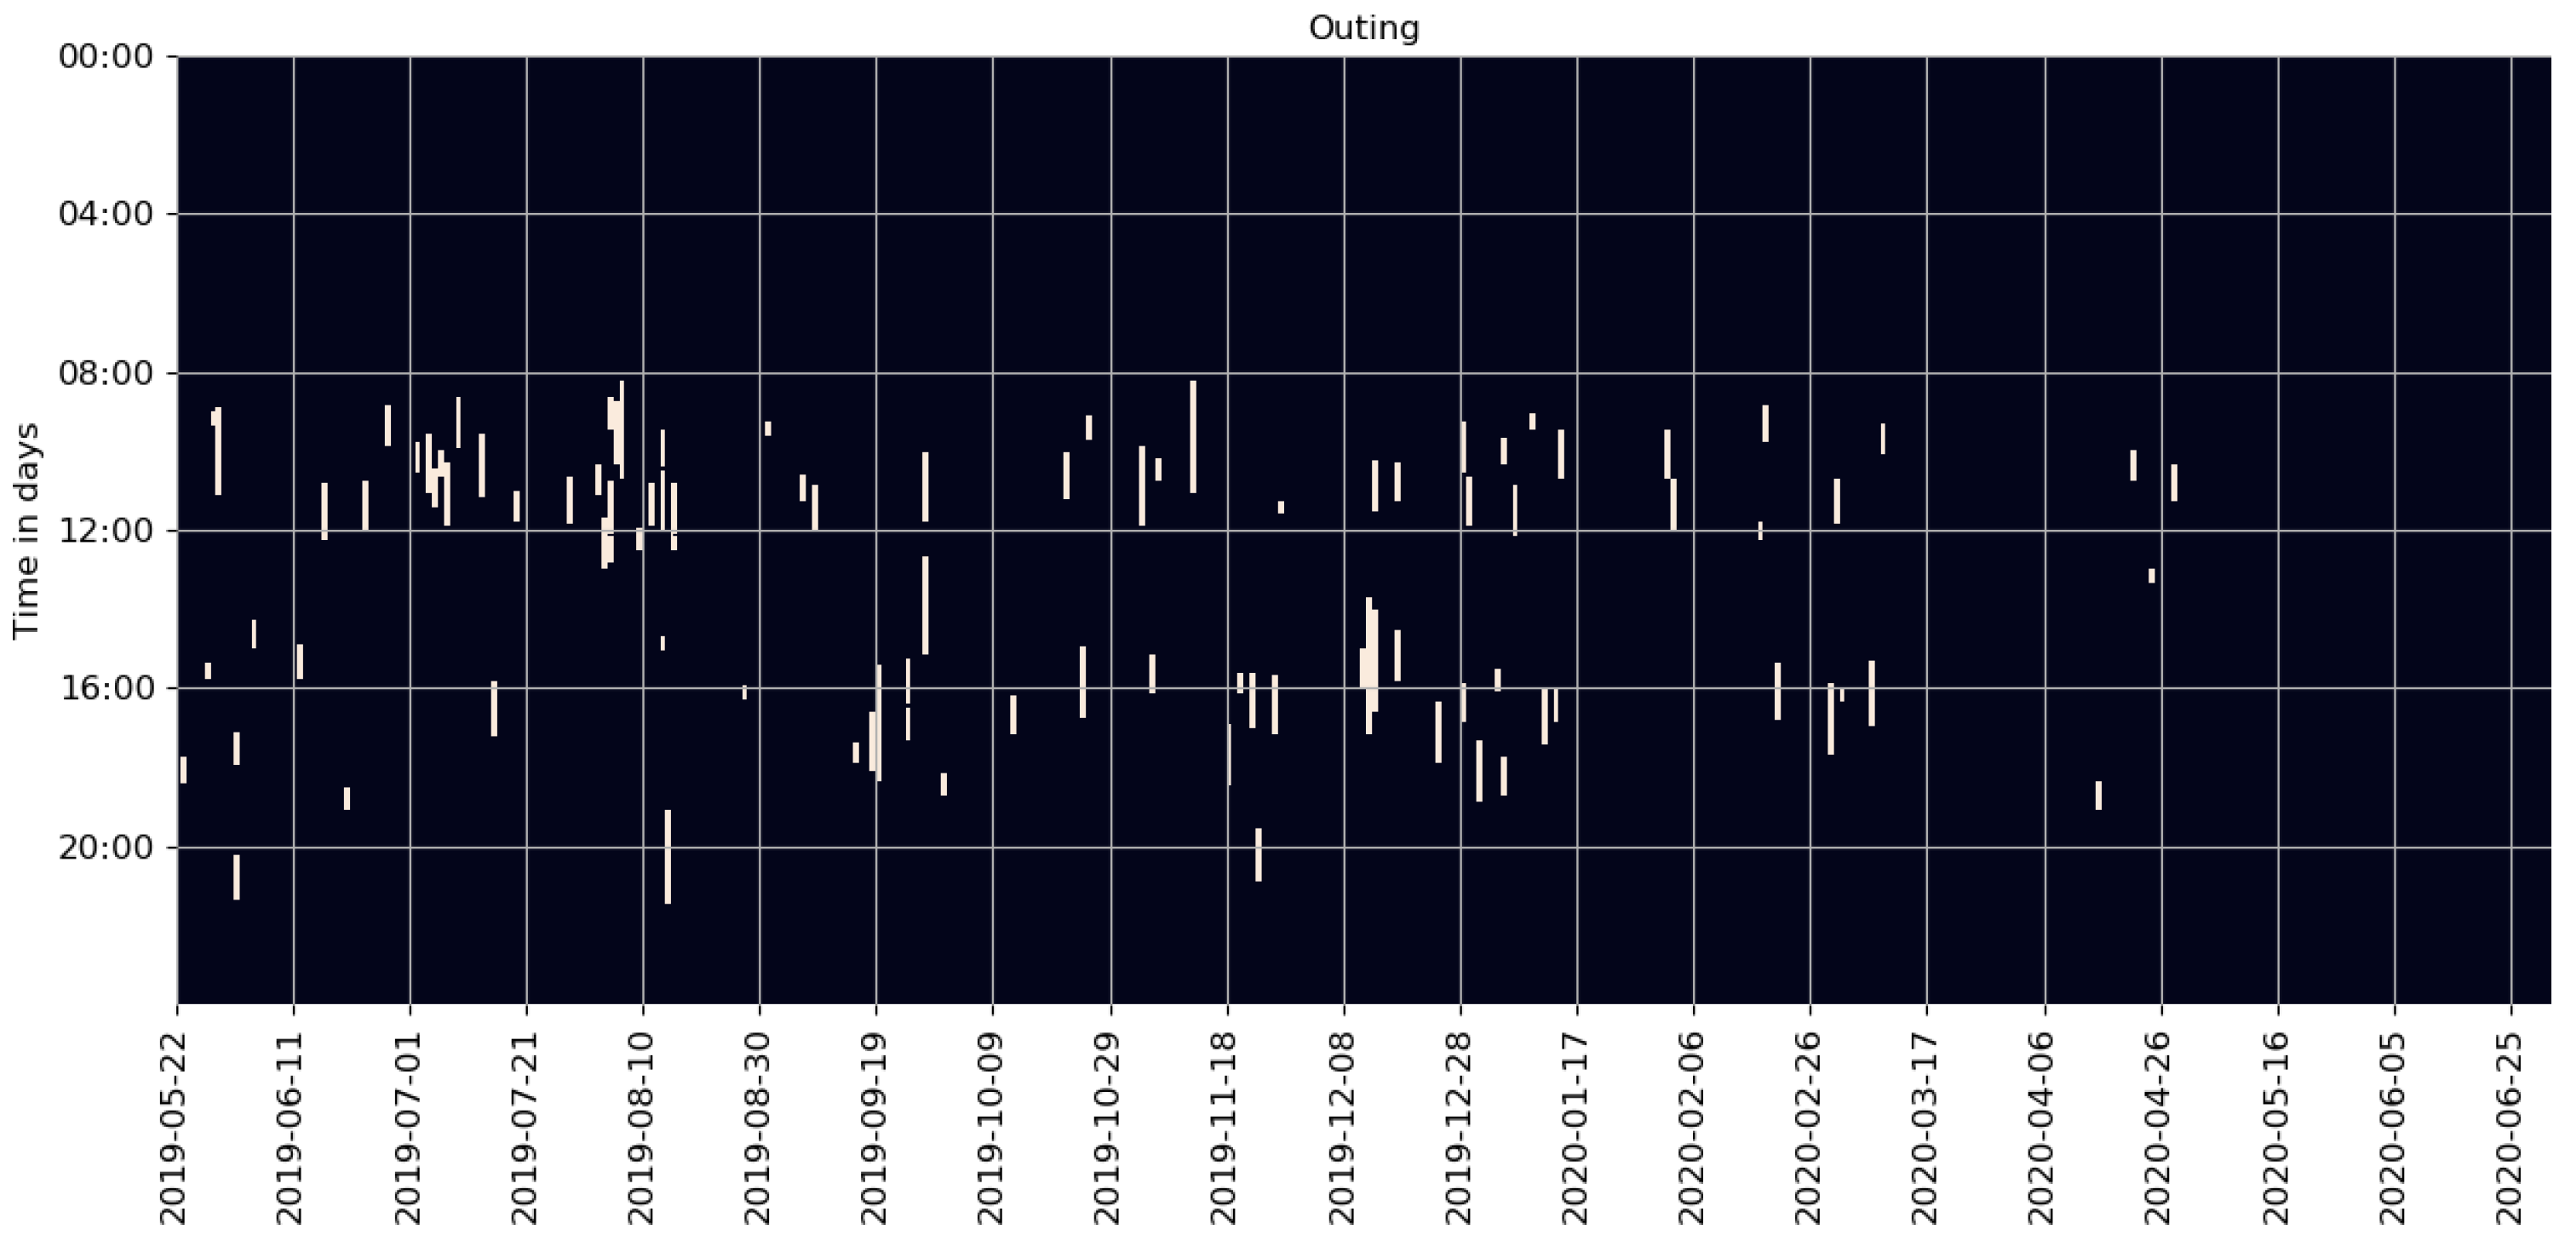
Figure 12 shows outings detected at a household. We can see that outings happened quite often in the morning or around 4 p.m. in the afternoon. However, since March 2020, barely any outings were detected, except for a few cases in April. This is another behavioral change due to the COVID-19 lockdown. We found similar outing reductions across the entire cohort.
7.3. Visiting Detection
Visiting events are considered to be rare occasions where an increased sensor activity is reported, caused by the presence of visitors.
The following features are extracted for a given time segment (between adjacent door activities): segment start time (
), and end time (
), as well as segment duration (
). Furthermore, any signal overlap between sensor pairs
, where
and
indicate the
and the
sensor (
,
,
N is the total number of sensors deployed), as well as the overall signal overlap across all deployed sensors (
). As in
Section 6.3.1, the start and end time are represented in the two-component cyclic manner. By doing so, each segment is represented in a
-dimensional feature space, where
is the number of sensor-pair combinations to compute the signal overlap.
To extract the ‘rare events’, we conduct Isolation Forest [
51] calculations on all candidate segments, represented in the feature space. Each segment is computed with an ‘isolation score’. The lower the isolation score, the more likely the segment is to be ‘normal’. We consider
, where
and
refer to the mean and standard deviation of the isolation scores, as threshold to decide whether the segment is a relatively rare occasion. Selected ‘rare’ events are then post-processed by removing those with sensor active levels lower than the median value of all segments. The objective is to disregard segments which are rare due to other reasons.
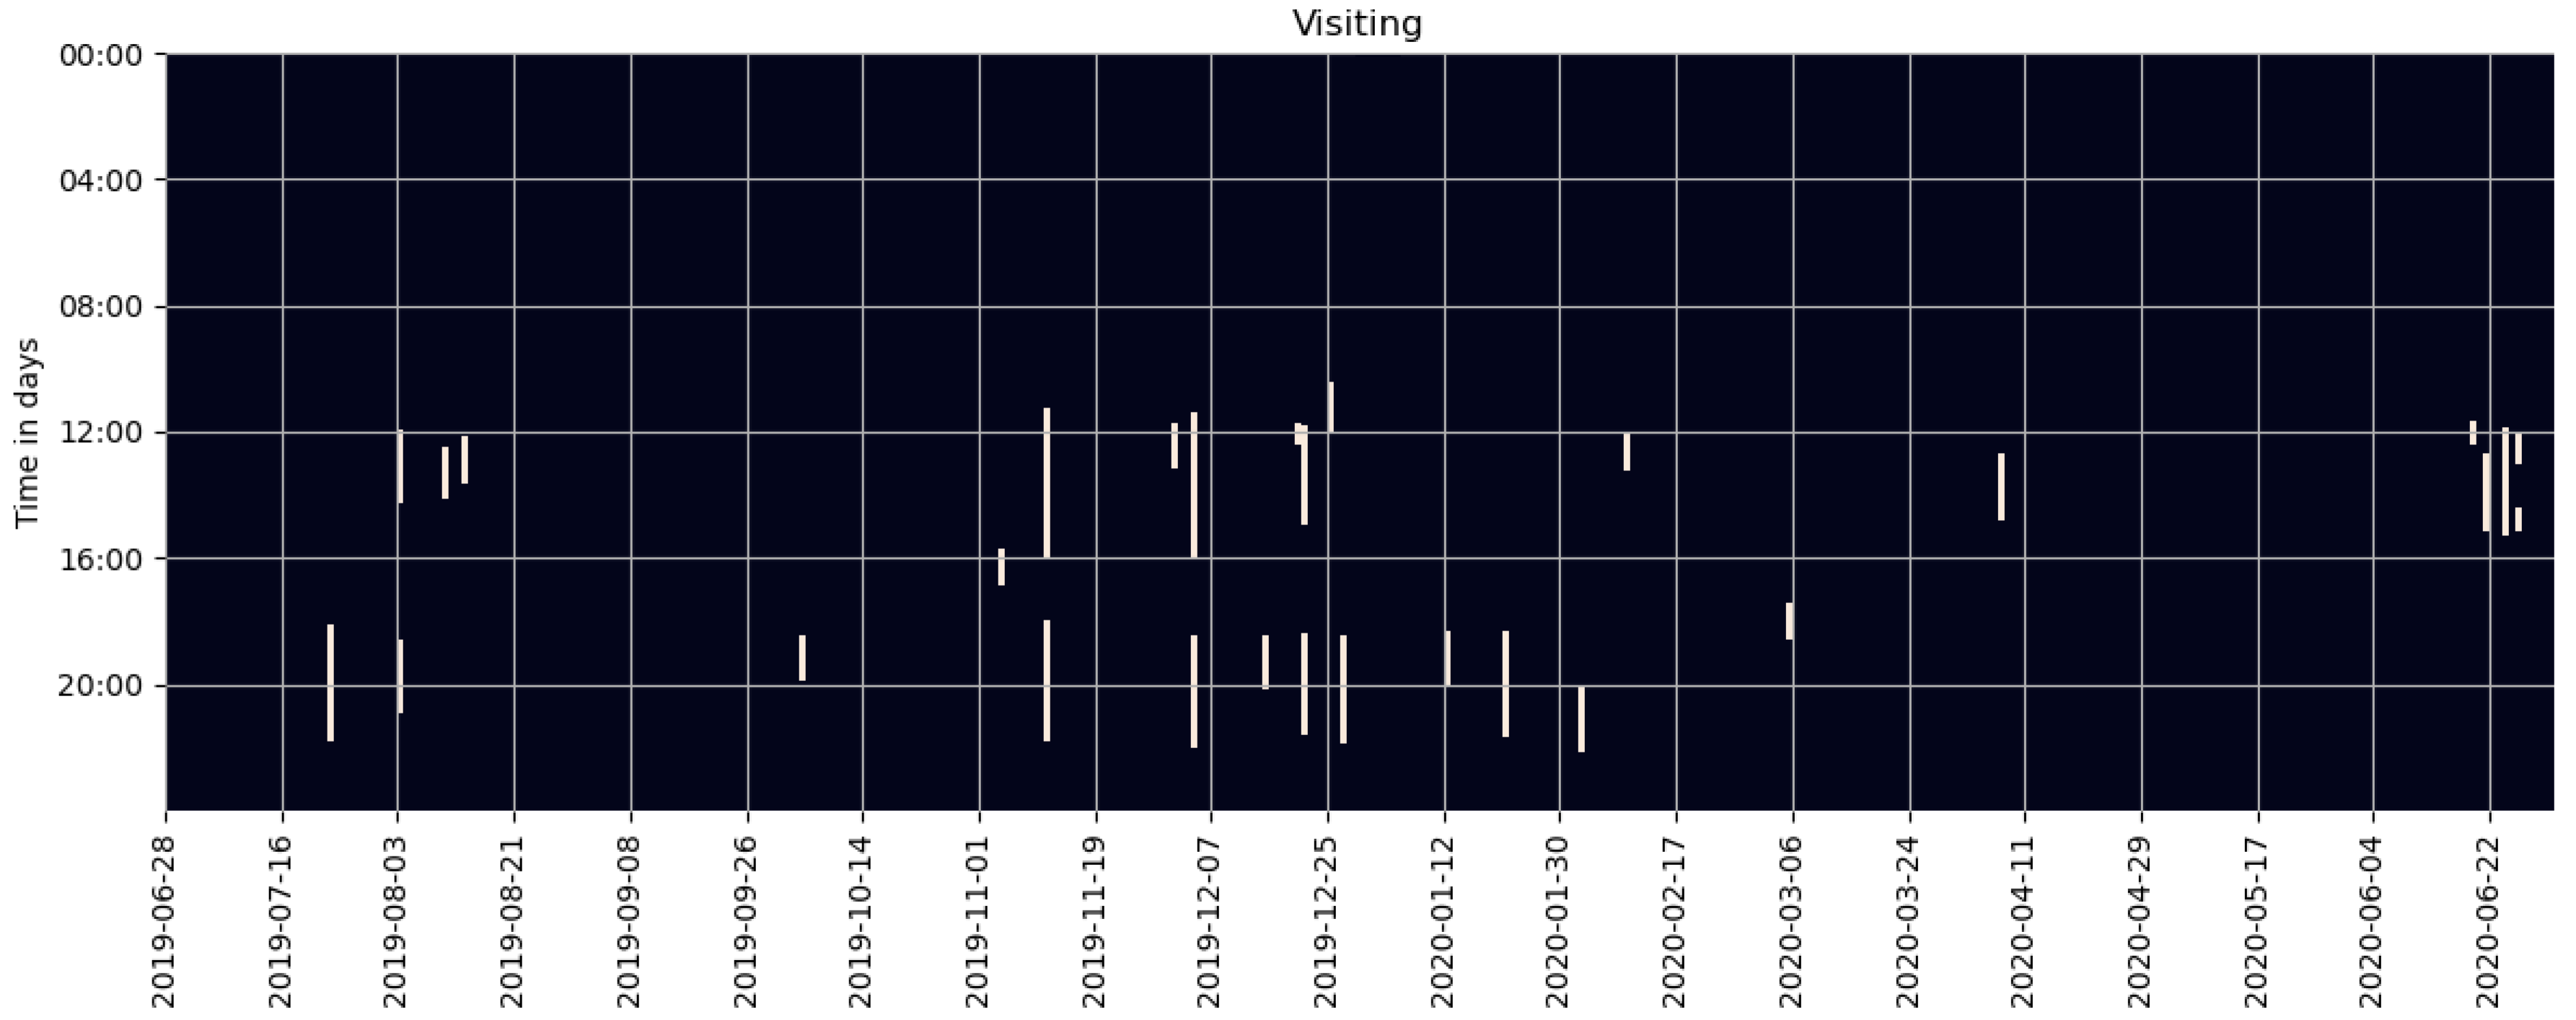
Figure 13 depicts detected visiting events in a household, with an increased occurrence in December in comparison to other periods of the year, i.e., six visits were detected between the middle and the end of December 2019. Additionally, we can see that after 5 March 2020, there were barely any visiting events detected except for on 7 April and in the middle of June. Across the cohort, reduced visiting onsets were generally observed during lockdown times.
8. Behavioral Anomaly and Change Detection
Behavioral anomalies are rare events that deviate from the probability distribution of the “normal” data [
52]. In comparison to other learning tasks, anomaly detection in human-centric systems is typically more challenging due to the following reasons: first, people’s behaviors vary from person to person. Therefore, it is essential to build personalized detection models. Secondly, people’s behaviors evolve over time, either in cyclic patterns or due to external and internal factors (e.g., changing of living environment and style, or adjusting of social, professional and family roles). Thus, it is crucial to train models that actively adapt to new behavior patterns. Additionally, an occasional activity change does not always imply a health-related concern.
Most of the current ambient assistant living systems are focused on detecting sudden behavioral anomalies (point anomalies), which could indicate serious emergencies, e.g., fall detection. On the other hand, long-term behavioral changes may happen in a more subtle way, such as gradually reduced daily mobility, or slightly lower sleep quality over successive days. Such long-term changes may be more subtle compared to short-term emergencies. However, over time, the change might evolve into a significant impairment on a medical scale. Proactive detection of such changes can help geriatricians to discover health-related problems at an early stage, guiding them towards initiating personalized medical interventions.
8.1. Point Anomaly Detection
Typical anomaly detection methods can be grouped into three main categories: rule-based methods, statistic models, and machine learning algorithms. Unlike other approaches, data-driven machine learning methods do not assume any pre-defined rules or statistic data distributions, and could thus be used to learn user-specific, adaptive models. DBSCAN [
53], and Isolation Forest [
51] are often used to detect abnormal data points, based on density and isolation. However, when applied to time-series data, it is challenging for such algorithms to encode the temporal dependency between time steps. Deep neural networks are also used for anomaly detection in time-series data, where convolutional/recurrent networks are learned to predict future elements of a sequence. Prediction errors are then used to recognize anomalous behaviors. Temporal Convolutional Network (TCN) [
54] have shown to be able to efficiently encode long-term time dependency.
8.1.1. Sequence Prediction-Based Anomaly Detection
We formulate abnormal behavior detection in a TCN-based multi-variate time-series prediction framework, where the prediction errors are used as anomaly scores. Due to the sparsity of the sensor setting and the multi-person household nature of our systems, we consider the sleep profile alone to represent the daily activity, based on which abnormal days are identified. Given an input time series
X of length
(memory length), where each data point
in the sequence is a 5-D daily sleep profile representation vector, the model aims to predict sleep activities in the next
(prediction length) days. In this paper, the memory length is 20 days (
), and the prediction length is 1 day (
). The 5-D sleep profile of the coming day is the prediction target. For the TCN structure, we stacked 4 causal CNN layers with increasing dilation and width (1, 2, 4, 8). With a kernel size
, the final receptive field is 16. The output from the TCN layer is passed to a fully connected layer for the final prediction of the target 5-D sleep profile. The Rectified Adam [
55] optimizer is used.
As any deep learning framework, TCN relies on a large amount of training data. However, at the initial stage of an AAL deployment, only a limited amount of personalized data is available. To tackle the cold-start problem, we first train a generic model using data from the other users and later personalize it with data from the specific test user. To minimize the amount of personal data required, only the fully connected layer is retrained, as typically done in transfer learning approaches. To adapt to new behaviors, the model is retrained daily with data collected from the previous N days, regardless of whether there are abnormal days. Additionally, old data is ‘forgotten’ (removed from the training data pool). The lower the number of previous days (N) used in the training, the faster the model adapts to new behaviors, although it could lead to a lower prediction accuracy.
We consider
, where
and
are the mean and standard deviation of the prediction errors of the personalized training data, as the threshold to decide whether the test day is abnormal or normal. The parameter
can be adjusted to achieve higher recall or precision in detecting ‘point anomalies’.
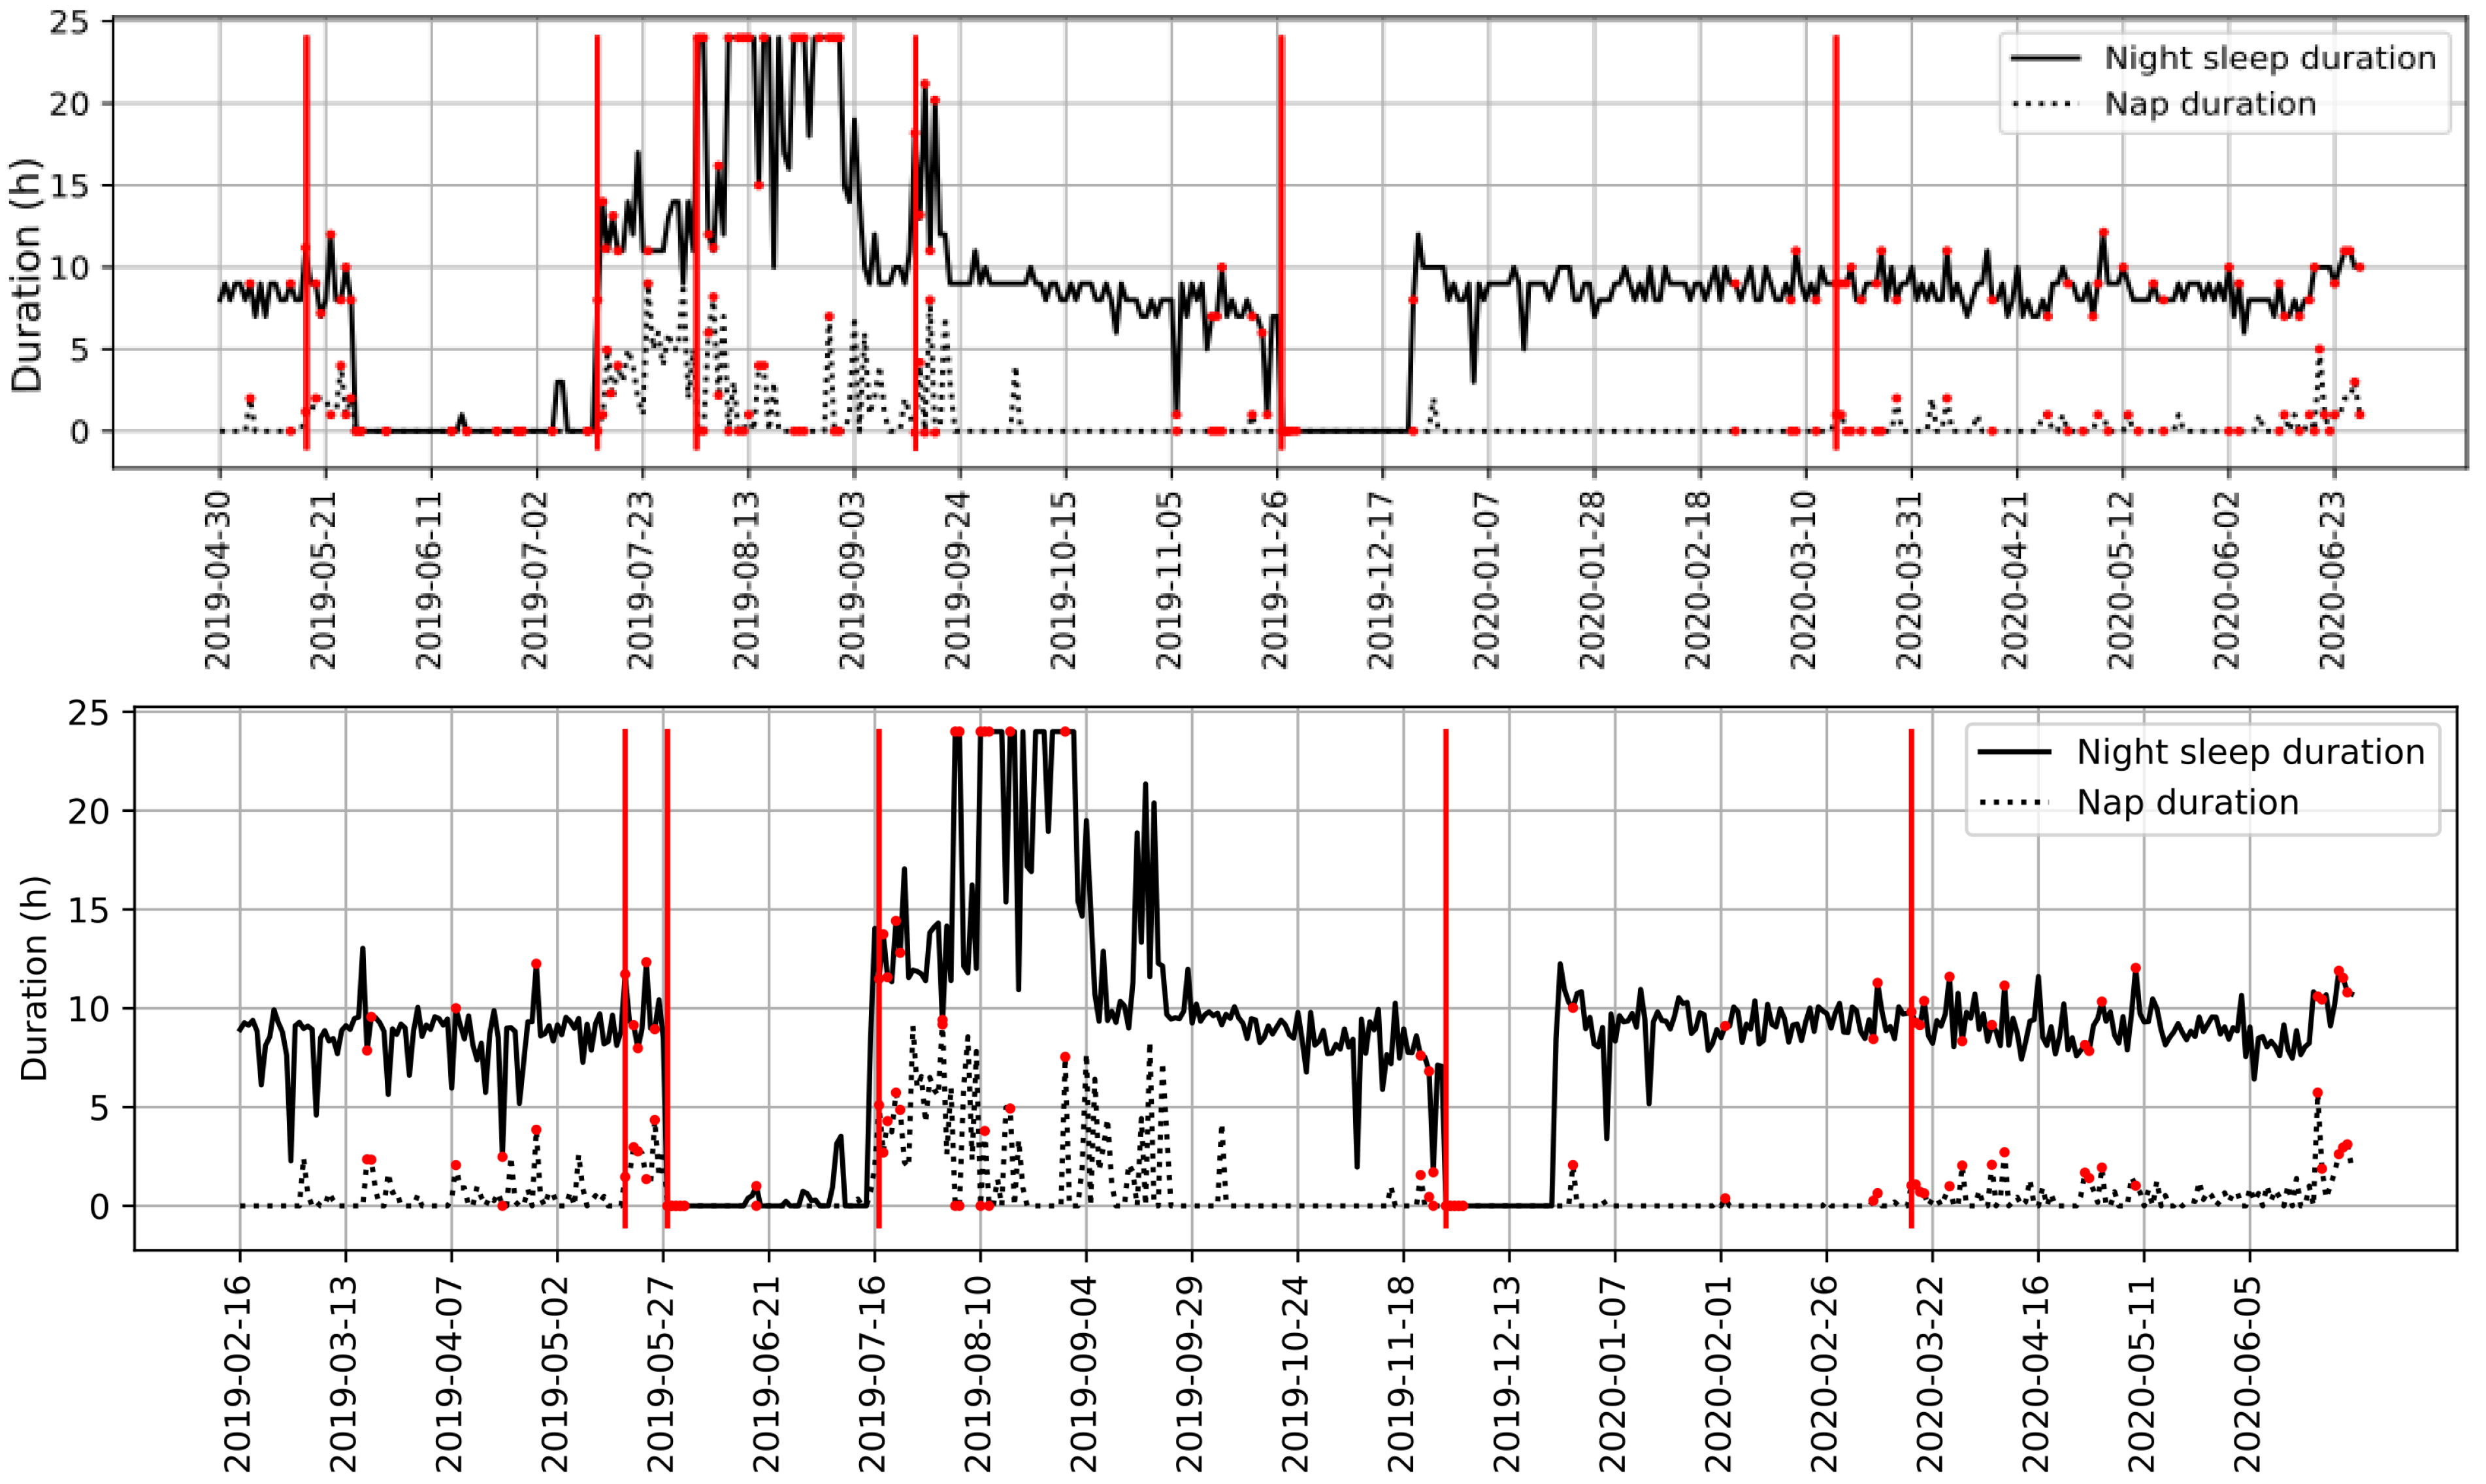
Figure 14 (top) depicts the detected abnormal days (
,
) as red dots. For visualization purposes, we show them on the sleep duration curves. The entire sleep profile can be seen in
Figure 6.
8.1.2. Isolation Forest-Based Anomaly Detection
We also conduct point anomaly detection using Isolation Forest as a baseline. Specifically, given the daily sleep profile representation, we apply the Isolation Forest using the specific user’s data only. The first two weeks of sensor readings after the AAL system deployment are considered to be the initial learning phase, after which we run the Isolation Forest algorithm daily on data from the past
N days and the current day (test day) to compute anomaly scores. As in
Section 8.1.1, we forget data that is older than
N days for the model to adapt to new behavior patterns. A test day is considered to be abnormal if its anomaly score is larger than
, where
and
are the mean and standard deviation of the isolation scores of the reference data (past
N days).
Figure 14 (bottom) depicts the detected abnormal days (
,
) as red dots.
8.2. Long-Term Behavior Change Detection
A point anomaly may not necessarily have to trigger a health-related alarm. It could simply be a one-time change in behavior due to special events. However, consecutive abnormal days could indicate a long-term behavioral change. Thus, we trigger a long-term behavior change alert once
N consecutive abnormal days are detected. Specifically, when five consecutive days are detected as abnormal, we report a long-term change and notify the caregivers, so they can investigate whether the anomaly is of medical relevance by assessing the patient’s data or contacting the patient directly. Detected long-term behavior changes are depicted as red bars in
Figure 14. We can see that six and five long-term changes were detected with sequence prediction and Isolation Forest-based algorithms, respectively. Among them there are sleep absence; as well as sleep quality and quantity triggered changes.
8.3. Anomaly Post-Processing
Long-term behavioral changes could indicate positive or negative health-status changes, or could be caused by other non-health-related reasons, e.g., a patient being away from home. Therefore, it is necessary to prune the detection results, so that the system only reports health-related negative behavior changes, to mitigate the distraction of caregivers.
Specifically, we overlap outing detection results with ‘sleep absence’ changes, and could identify one long-term anomaly (the fifth at the top and the fourth at the bottom of
Figure 14) to be caused by an outing (family vacation). Thus, it did not need to be reported. Additionally, to distinguish positive and negative changes, we compare the average sleep scores (
Section 6.4.2) within a window of 5 days before and after the detected beginning of the change. The long-term anomaly (the second at the top and the third at the bottom of
Figure 14) is therefore a positive improvement, but not an issue to be reported. Thanks to the pruning strategy, 4 and 3 instead of 6 changes were reported as alerts in an observation period of 16 months of this patient with each algorithm.
On the other hand, the first long-term anomaly was detected to begin on 18 May 2019 and 21 May 2019 by each algorithm, and reported 5 days later, which is 5 and 2 days before the hospitalization of the patient (28 May 2019). The second and third long-term anomaly in
Figure 14 (top), and the third long-term anomaly in
Figure 14 (bottom) illustrate increased sleep duration during the recovery phase after hospitalization. Interestingly, the last long-term anomaly was detected on 17 March 2020 by both algorithms, when the patient started to take naps during the day, meanwhile the night sleep efficiency decreased. After submitting the alert, we received feedback from the user through the care manager that in this case the patient was not experiencing any health issue, the prolonged sleeping was due to the COVID-19 lockdown situation.
Across the cohort, there were 4 recorded hospitalizations, and 9 recorded hospital visits. Our system using the TCN-based detection algorithm reported 17 long-term change anomalies, among which 1 was confirmed as a sensor failure; 3 alerts were able to predict hospitalization sessions, 2, 5 and 11 days in advance; 2 alerts were detected prior to hospital visits; and 5 were related to negative behavior changes due to the COVID lockdown. For the remaining 6 alerts, we were not able to get confirmation from the users. Although the Isolation Forest-based algorithm reported 12 long-term change anomalies, among which 8 were relevant with either health-condition decline or sensor failure. Overall, using the extracted sleep profile alone, both the TCN and the Isolation Forest-based systems were able to detect 3 out of the 4 hospitalization sessions in advance. Although the Isolation Forest-based algorithm achieved a slightly higher precision () than the TCN-based detection (), the latter had shown to be more sensitive to subtle behavior change and thus led to a higher recall (11 relevant alerts). Additionally, the detection rate can be improved by incorporating additional sensors that could provide complementary information of daily activities, e.g., sensors installed in the kitchen (digital power meter, fridge door sensor, presence sensor etc.) for inferring nutrition intake.
9. Results Discussion
We deployed a simple binary environmental sensor setting at 19 households of elderly people, to test its application in an elderly care setting. The system enables a well-informed personalized healthcare experience with behavioral pattern extraction, health trajectory tracking, anomaly notifications, and cohort analysis capabilities. The applied behavioral data processing pipeline is depicted in
Figure 15.
Daily activity patterns were extracted using unsupervised learning approaches, based on which the user’s health trajectory was adaptively learned and tracked over time. Additionally, we carefully formed a scheme to quantify binary-bed-sensor-based sleep quality scores. Health-related anomalies were detected as collective behavior changes over time. Methods to reduce false notifications are also reported, which is crucial to reduce distraction of caregivers. Outing and visits were extracted not only as physical and social activity indicators, but the detected outings were also used to remove non-health-related ‘behavioral’ changes.
Population-wide behavioral patterns can be extracted by grouping daily activity profiles observed in the cohort, resulting in a behavior ‘dictionary’. Each user is then represented by a bag of ‘words’ in the dictionary, based on which user segmentation can be conducted to enable risk group stratification.
Finally, we observe shared behavior pattern changes across the cohort during the COVID-19 lockdown phase in Northern Italy. Specifically, a large percentage of users prolonged their night sleep duration and increased the number/duration of naps during the day, resulting in a decreased sleep efficiency. Additionally, reduced outing/visiting frequencies were detected across the cohort during the lockdown.
The proposed system is generic and can be customized to fit various sensor settings, household structures and personalized needs. It relies on unsupervised approaches, thus mitigating the manual labeling workload. Additionally, the passive nature of the sensors minimizes user input and interaction, thus improving adherence and mitigating missing data. Such systems could complement the current healthcare experience, without interfering with patients’ daily life or compromising their privacy. Future work includes expanding the system with additional environmental sensors, which could be used to infer other activity types, such as kitchen usage, shower/bathing, motion (with densely deployed PIR sensors), and personalized devices with a user friendly device management platform that enables personalized activity tracking with improved user experience; considering user feedback as partially labeled examples to optimize the accuracy of the system; implementing real-time anomaly detection and data exchange; incorporating medically advised intervention into the care system. A wide deployment of such system could improve elderly patients’ quality of life at large, and alleviate the pressure on the healthcare system through reduced hospital re-admission.

 ,
, 


