Abstract
A data center undertakes increasing background services of various applications, and the data flows transmitted between the nodes in data center networks (DCNs) are consequently increased. At the same time, the traffic of each link in a DCN changes dynamically over time. Flow scheduling algorithms can improve the distribution of data flows among the network links so as to improve the balance of link loads in a DCN. However, most current load balancing works achieve flow scheduling decisions to the current links on the basis of past link flow conditions. This situation impedes the existing link scheduling methods from implementing optimal decisions for scheduling data flows among the network links in a DCN. This paper proposes a predictive link load balance routing algorithm for a DCN based on residual networks (ResNet), i.e., the link load balance route (LLBR) algorithm. The LLBR algorithm predicts the occupancy of the network links in the next duty cycle, according to the ResNet architecture, and then the optimal traffic route is selected according to the predictive network environment. The LLBR algorithm, round-robin scheduling (RRS), and weighted round-robin scheduling (WRRS) are used in the same experimental environment. Experimental results show that compared with the WRRS and RRS, the LLBR algorithm can reduce the transmission time by approximately 50%, reduce the packet loss rate from 0.05% to 0.02%, and improve the bandwidth utilization by 30%.
1. Introduction
An increasing number of computing tasks are offloaded to a cloud center by various user applications [1]. Therefore, the frequency of data communications between nodes in data center networks (DCNs) are increased, and the volume of data transmitted by DCNs also grows rapidly. Popular applications readily cause load imbalance in the internal links of DCNs, and some bottleneck links are liable to be congested. At the same time, neglected links are fully utilized, thereby preventing the DCN from being maximized. Through flow scheduling, DCNs can select an appropriate path and transmission rate for a specific data flow, such that all links in the DCNs tend to be equally occupied. Thus, a traffic scheduling algorithm can reduce the congestion of the bottleneck link and improve the overall efficiency of a DCN [2].
Existing flow scheduling methods can be divided into two categories [3]. The first category is to propose and design a new architecture model for optimizing traffic scheduling. This category can be further divided into two subcategories according to different starting points [4].
The first subcategory entails the distribution of flow as the starting point. The DCN involves two types of data traffic composition [5].A small flow with a large number but a small scale is called a mice flow. A large stream with a small number but a large scale is called the elephant flow. Although small flows account for a large proportion in number, their scale is far from that of large flows. Therefore, determining the load balance in network traffic depends on a few large flows [6]. The LABERIO algorithm aims to evaluate the degree of network balance by setting a threshold of that balance and calculating the degree of network load balance according to the state of all links [7]. When the balance degree exceeds the balance threshold, the largest stream on the link with the highest load is selected for scheduling. However, after the completion of the regulation of large flows, the subsequent processing of small flows is unreasonable. In general, the emergence of network link fragmentation and low resource utilization of network links are due to the unreasonable scheduling of small flows [8].
The second subcategory involves the flow table in OpenFlow as the starting point [9]. By improving some current routing scheduling mechanisms, the purpose of load balancing is realized [10]. An example is a real-time virtual machine management framework based on a software defined network (SDN) [11]. Experimental results show that the proposed management structure can effectively realize load balancing and improve link utilization. However, the increasing complexity of the network scale means that the burden of the controller will be seriously aggravated in this method, thereby leading to an increasing computation time of the topology update [12,13].
The second category of flow scheduling methods develops a new algorithm to optimize the flow control operation [14]. Typical algorithms include the round-robin scheduling (RRS) [15], weighted round-robin scheduling (WRRS) [16], and source IP hash scheduling [17]. However, the above various algorithms have their own problems. For example, source IP hashing will cause an unbalanced server load [17].
The above research reduces network delay and improves link load balancing by optimizing the routing calculation and multi-path scheduling strategy. However, with the increase of the network center scale, the real-time link usage acquisition becomes more complex, and the burden of the controller increases. Thus, the computation time of the topology update becomes increasingly large, a situation which leads to lowered network performance.
To better improve the degree of load balancing, this study employs a prediction method to predict the link utilization in the next duty cycle. This approach reduces the burden of the controller in real-time monitoring network link conditions.
The spatio-temporal residual networks (ST-ResNet) algorithm [18,19] entails a deep understanding of spatiotemporal data and maximizes the characteristics of spatiotemporal data itself [20]. Each link in the Fat-tree structure has the characteristics of spatiotemporal data in data transmission, and as a result, the link is also spatiotemporal data. Based on the ST-ResNet model [21], the ST-ResNet algorithm is suitable for predicting the link utilization state in the next duty cycle in a DCN. Then, according to the prediction results, a link load balancing oriented predictive routing algorithm (i.e., the LLBR algorithm) is proposed. The LLBR algorithm uses ST-ResNet to train the previous usage of the link [22], thereby predicting the utilization state of network links in the next duty cycle. Therefore, LLBR can optimize the load balancing and improve the network performance [23,24].
In view of the above introduction of load balancing, this work proposes a method that can predict the occupancy state of the link in the next time slot and make decisions for traffic scheduling by means of design and research. The goal is to realize the load balance of and improve the utilization rate of the link. The difference between this method and the existing methods is that the former can ascertain the state of the link in the next time slot and prepare for traffic scheduling in advance. In realizing this goal, we found that network links and real traffic lines have the same characteristics of spatiotemporal data through research. First, we modified the original residual network algorithm, divided the occupancy state of the network links by time period as the training data, and then combined it with the LLBR algorithm we proposed to make the decision of routing distribution. Finally, the validity of the LLBR algorithm is verified through comparison with RRS and WRRS which are commonly used in load balancing.
The rest of this article is organized as follows: Section 2 introduces the typical topology and load balancing algorithm of the DCN. Section 3 presents the design of the LLBR. Section 4 provides the simulation experiments on the designed LLBR and the analysis of the experimental results. Finally, Section 5 gives the conclusions of this work.
2. Related Work
This section, introduces the topology of a DCN and then summarizes the advantages and disadvantages of load balancing in a DCN. Finally, the RRS and WRRS algorithms are presented.
The rapid growth and scalability of data is a challenging task in DCNs. Research on DCN topology can be divided into two categories: server-centered and network device-centered topologies. In the server-centered topology, the network topology is constructed in a recursive way. The server is not only a computing unit, but also a routing node, so it will actively participate in packet forwarding. In the network device-centered topology, network traffic routing and forwarding are all completed by switches or routers [25].
Server-centered topologies include the DCell, FiCoon, Bcube topologies [26]. The DCell topology recursively constructs a large-scale network through a low-end port switch and multi-port server. The limitations of DCell include a cross-sectional bandwidth and network latency [27]. By contrast, network device-centered topology include the Tree, Fat-Tree, and VL2 topologies [28]. In the Fat-Tree structure, the topology of the network is divided into three levels, namely, the core, the aggregation, and the access layers. The Fat-Tree bisection bandwidth increases with the expansion of the network size, so it can provide high throughput transmission service for data center. Multiple parallel paths occur between the source and destination nodes in the communication between the servers of different pods, such that the network has acceptable fault tolerance performance and generally no single point of failure arises. Replacing high performance switching equipment greatly reduces network equipment overhead. Moreover, the network diameter is small, a feature which can ensure the real-time network requirements of video, online meeting, and other services. The topology structure is also regular and symmetrical, thereby making it conducive to network cabling, automatic configuration, optimization, and upgrading [29].
The software defined network (SDN) paradigm is usually adopted by DCNs to provide centralized control and network program ability by separating network control and data forwarding functions [30]. Thus, SDN can simplify network management and greatly promote the improvement of network performance and network innovation ability so as to solve the load balancing problem of DCNs [31].
The separation of network control and data forwarding is the key element to the success of SDN technology [32]. However, the centralized control mode in logic also generates the challenge of scalability [33]. Although the OpenFlow protocol in SDN has attracted great attention [34], many technical problems remain unresolved in terms of the OpenFlow protocol itself or the SDN control separation architecture [35]. The main problems include the scalability of the control plane [36], the design of the SDN forwarding plane, and the consistency of the SDN control logic. The main goal of improving the scalability of the control plane is to reduce the overhead between the data plane and controller, that is, to reduce network congestion, improve network transmission efficiency, reduce network delay, and ensure network load balance so as to reduce the burden of the controller, improve the efficiency of the data plane and enhance network performance.
In order to reduce the training time and improve the training efficiency in the comparative test, we chose the polling algorithm with a faster training speed than the recurrent neural network (RNN) this kind of algorithm [37]. The following is an overview of the RRS and WRRS algorithms.
The RRS algorithm is implemented by forwarding requests to different servers in turn. The advantages of this algorithm are simplicity, stateless scheduling, and the omission of the need to record the current connection state. The RRS algorithm is implemented on the premise that all servers have the same processing performance and the current response speed and the number of connections of each server are irrelevant. However, this algorithm readily causes load imbalance between servers when the time between service requests varies greatly. Therefore, this algorithm is suitable for all servers with the same hardware and software configuration, and when the service requests are relatively balanced [15].
The server processing performance index of the WRRS algorithm is the weight. The algorithm allocates the request to each server by the way of weight and rotation. The server with the highest weight gets the connection first. That server can handle more requests than a counterpart with lower weight. Servers with the same weight can handle the same number of connections. However, the disadvantage of the WRRS algorithm is that when a machine with a large weight is visited, the machine with a small weight will be in the idle state, thereby resulting in a waste of resources [16].
This work combines the technical characteristics of the DCN, OpenFlow and ResNet. We investigated the control plane routing update paradigm and the link load in the scalability problem of the control plane and designed an efficient routing update algorithm and a network resource scheduling strategy so as to improve network performance. Therefore, this study proposes a predictive routing algorithm for the routing decision and topology forwarding module of the OpenFlow controller, thereby optimizing the performance in terms of transmission time, bandwidth, jitter delay, packet loss rate, and network resource allocation to improve the network performance of DCNs.
This algorithm is developed according to the characteristics of spatio-temporal data [38] and uses deep convolution algorithm to predict the utilization state of network links in the next duty cycle [39]. According to the results of the number of times the link is used, a link load balancing-oriented predictive routing algorithm is designed to optimize the link load balancing.
3. Algorithm Design
This section proposes and designs an LLBR algorithm. By predicting the network link situation in the future cycle, the path calculation is performed to realize the link load balance. First, the algorithm introduces the traffic architecture diagram on the basis of the LLBR algorithm, describes the creation of a network link occupancy prediction model, and finally explores the implementation of the ST-ResNet algorithm and the LLBR algorithms.
3.1. Framework of Traffic Scheduling
This section introduces the traffic scheduling framework according to the LLBR algorithm (Figure 1). This framework describes the prediction of the usage frequency of all links in the next time period and then calculates the network path on the basis of the prediction result. The link load balancing scheduling strategy is therefore optimized. The framework model of the traffic scheduling consists of two modules: the module for the dynamic routing decision layer and for the routing using the dynamic routing decision layer.
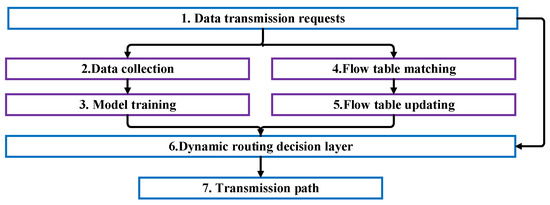
Figure 1.
Traffic scheduling architecture diagram.
The module of the dynamic routing decision layer predicts the next cycle usage of the link. It predicts the link occupation state, selects the transmission path, and updates the flow table. When transmitting data flow in a DCN, the route is selected according to the flow table of the switches. Meanwhile, the link occupation state is collected by the controller to train the network state prediction model which is constructed according to the ST-ResNet. Finally, the next cycle usage of the link is predicted according to the prediction model, and the path is calculated by the LLBR algorithm to form the dynamic routing decision layer.
In the route distribution using the dynamic routing decision layer, the optimal path is directly calculated through the decision layer when data transmission requests are made in the network, and then the path is issued for data transmission.
3.2. Link Occupancy Prediction Model
The link occupancy prediction function of the LLBR algorithm first establishes a data model for the network link occupancy. Then, using the data model as the input data, a neural network structure is designed to predict the network link occupancy in the next duty cycle according to the ST-ResNet.
In the LLBR algorithm, the occupancy state of the link is monitored by the Floodlight controller and the occupancy state data of the link are collected. The collected data is used to train the parameters of the model. Network data collection consists of two parts: the establishment of the network request and the storage of the link occupation state.
The network request is a random discrete function (Equation (1)) hat follows the Poisson distribution to generate two non-repeated random numbers [40]. Then, the random number is mapped to the terminal ID according to the mapping of Equation (2).
x is the random number generated by the Poisson distribution, is the maximum ID number of the terminal, and is the minimum ID number of the terminal. is the minimum value of the generated random number, and is the maximum value of the generated random number. is the final mapping result.
The controller is used to collect the occupancy status of the link, and the collected data is divided into two datasets (namely, the DATA and DATE datasets) and are saved in HDF5 format. The DATA dataset is a three-dimensional array. The first dimension represents the number of data transmitted by the link. The second and third dimensions form a two-dimensional array(Figure 2). The number of links between two ports is calculated using Equation (3).
where is the number of links used from s to d, and is the number of links used from d to s. is the total number of this links used. As shown in Figure 2, the four ports were taken as examples to record the usage times of the links between each port within an hour, and the recorded data was mapped into the grid as shown in Figure 2b for the succeeding neural network training. As shown in Figure 2a, the network is bi-directional. The number from r2 to r4 is 2 and the number from r4 to r2 is 1, so the total number of uses of the link is 3. The total number of uses is recorded in Figure 2b, from which we observe that the intersection of r2 and r4 is 3. The DATE data set represents the timestamp generated by each piece of data. For example, the time of data transmission is 13:00 on 8 January 2021, and the storage format of DATE is 2021010813.
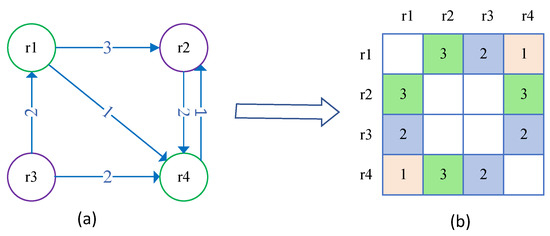
Figure 2.
Link usage statistics. (a) Simulate the number of times a link is used between different ports; (b) The number of times a link is used is mapped to the grid.
The network link occupancy prediction model uses the deep residual neural network to divide the terminal link into the grid shown in Figure 2b through the understanding of spatio-temporal data. Then, the link usage times of one cycle are projected onto the grid to form a two-dimensional image. The data of multiple cycles form the link data. The architecture of the network link occupancy prediction model consists of three modules (Figure 3). First, the input data is divided according to the characteristics of the simulated network, and then the three groups of characteristic data are merged to generate three residual networks. Finally, three residual networks constitute the prediction model through the convolution and residual units.
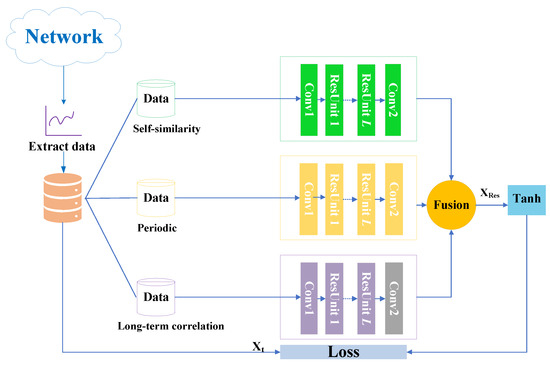
Figure 3.
Structure diagram of prediction model.
(1) Partitioning of input data
Network traffic in a DCN has the characteristics of self-similarity, periodicity, and long correlation. Therefore, the input data can be divided according to different time intervals. The data of the last 3 h were taken as the simulation of the self-similarity characteristic, those of 24 h a day as the simulation of the periodicity characteristic, and those of one week as the simulation of the long correlation characteristic to form three residual networks. The three residual networks obtain the corresponding data through convolution.
(2) Fusion of three sets of characteristic data
A convolution can capture nearby dependencies, and a bunch of convolutions can further capture the dependencies of the entire network. Therefore, by fusing the three residual networks after convolution processing, we can obtain Equation (4):
where, ∘ is the Hadamard multiplication (i.e., unit multiplication). , and are adjustable learning parameters affected by the long-term correlation characteristics, periodic characteristics, and self-similarity characteristics, respectively , and are the corresponding network outputs of the long-term correlation characteristics, periodic characteristics, and self-similarity characteristics. Finally, the format of the fused data is converted, and the value of the t interval is defined as Equation (5):
where, is a hyperbolic tangent function, and Equation (5) ensures that the output value is between −1 and 1.
(3) Generation of the predictive model
The input data are repeatedly trained through the model. When the mean square error between the predicted value and the true value is small or constant, the current model parameters are saved. Then, model parameters will be used as the parameters of the prediction model to predict the link occupancy state of the next duty time. We can obtain Equation (6):
3.3. Implementation of the Algorithm
The ST-ResNet algorithm is a link frequency prediction algorithm that conforms to the characteristics of spatio-temporal data. Then, the LLBR algorithm is used to optimize the link load balancing scheduling strategy according to the prediction results. This section first describes the ST-ResNet algorithm and then introduces the LLBR.
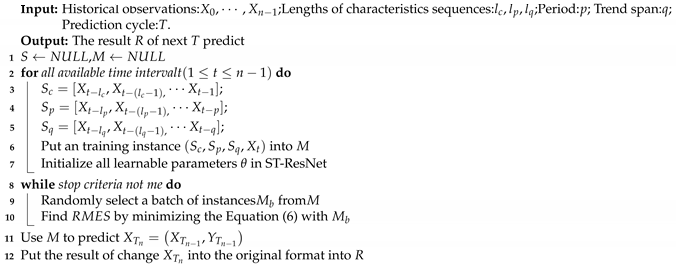
The prediction model based on the ST-ResNet algorithm is obtained through model training, and the link usage frequency in the network is subsequently predicted to ascertain the link occupation state in the next time period. The specific steps of the St-ResNet algorithm are as follows:
- (1)
- The data is divided into three groups according to the network characteristics: long-term correlation characteristics , periodic characteristics and self-similarity characteristic , and , , and are the time intervals;
- (2)
- Through Equation (4), three groups of data are fused to obtain the input data ;
- (3)
- The input data is formatted by Equation (5), such that all values are between −1 and 1 and the output value is obtained;
- (4)
- The above operation is repeated until the between the predicted value and the real value is small or remains unchanged;
- (5)
- The current model is saved as a prediction model.
To ensure the accuracy and timeliness of the prediction model, the parameters of the model must be trained periodically and constantly updated. Then, the calculation method of the network route and the issuing of the route are performed according to the updated prediction model. The prediction algorithm is shown in Algorithm 1.
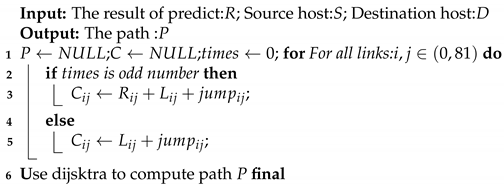
The LLBR algorithm involves path calculation after the prediction model is obtained. First, the algorithm reads the predicted link usage times in HDF5 format into a two-dimensional array and then it evaluates whether each link has an odd number of uses. if so, the algorithm calculates the total estimated cost of the link, i.e., . We can thus obtain Equation (7):
where is the delay of the link, is the number of hops from the network request source switch to the link, and is the predicted use times of the link.
If the number of times the link is used is even, then the current link usage is disregarded. We can ascertain the cost of the link through Equation (8).
Meanwhile, the predicted situation of this sub-link is halved for the next use. Finally, the path with the least estimated cost is calculated by the Dijkstra algorithm [41]. The specific description of the LLBR algorithm is shown in Algorithm 2.
| Algorithm 1: ST-ResNet Algorithm. |
 |
The Djikstra algorithm is the shortest path algorithm from one to the other vertices and solves the shortest path problem in the graph. The main feature of the Djikstra algorithm is that an array is used to save the shortest path distance from the starting point to other points, and the strategy of a greedy algorithm is adopted to traverse each time to the adjacent node of the nearest and unvisited vertex from the starting point and constantly update the array until it is extended to the end point. This work uses the Djikstra algorithm as a part of the LLBR algorithm to calculate the path with the least cost [41].
| Algorithm 2: LLBR Algorithm. |
 |
4. Simulation Experiment
To verify the effectiveness and feasibility of the LLBR algorithm proposed in this paper, an experimental simulation environment was constructed. The proposed LLBR algorithm was verified experimentally by simulating the Fat-Tree topology of the data center network. In the same experimental environment, the experimental results of different network performance indicators of the LLBR, WRRS and RRS algorithms were compared and analyzed.
4.1. Experimental Environment
The K = 8 Fat-Tree network topology was constructed on Mininet, as shown in Figure 4 (several switches and hosts were omitted). The topology consisted of 128 hosts and 80 switches. The Poisson distribution was used to simulate the request of data transmission in a DCN. A Floodlight controller collected the link occupation state of the data traffic transmission in the DCN. The Keras learning library was utilized to implement the model.
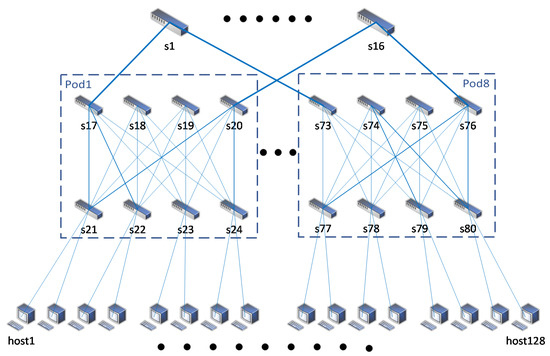
Figure 4.
Fat-Tree topology (K = 8).
4.2. Simulation Result
In this section, the simulation results for the transmission time, bandwidth, delay jitter, and packet loss rate of the three algorithms are compared and analyzed. The transmitted data in the experiment measure 185 Kbytes.
Figure 5 depicts the cumulative distribution function of the time spent on the transmission data recorded by the three algorithms at 22 terminals within an hour. The LLBR algorithm had 90% port transfer time within 250 ms, while the RRS and WRRS algorithms had 40% port transfer time above 250 ms(Figure 5). The LLBR algorithm had a gentle transmission time, whereas the transmission time jitters of the WRRS and RRS algorithms were relatively large. Thus, the LLBR algorithm was reasonable for data transmission link allocation and reduced the delay.
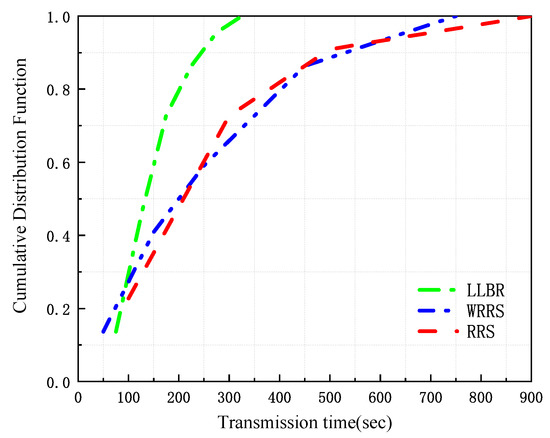
Figure 5.
Transmission time of three algorithms.
Figure 6 shows the cumulative distribution function of the bandwidth used to transmit data in the DCN as recorded by 22 terminals within an hour using the three algorithms. The bandwidth of the LLBR algorithm was better than that of the WRRS and RRS algorithms (Figure 6). Thus, the LLBR algorithm improved link utilization and reduced the numbers of idle links.
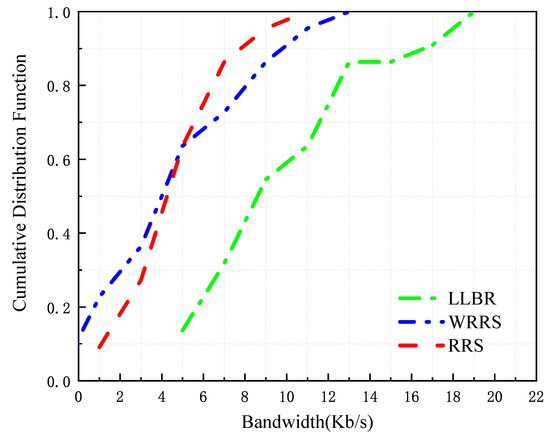
Figure 6.
Transmission bandwidth of three algorithms.
Figure 7 presents the cumulative distribution function of the delay jitter of the transmitted data recorded by 22 terminals within an hour using the three algorithms. When the LLBR algorithm and WRRS algorithms were used for data transmission, the delay jitter of 90% of the ports was within 1000 ms. By contrast, the delay jitter of 90% of the ports was all over 2000 ms when RRS algorithm was used for data transmission. This outcome indicated that the LLBR algorithm could be used to reasonably transfer large-scale and small-scale flows on the corresponding links, thereby reducing network congestion.
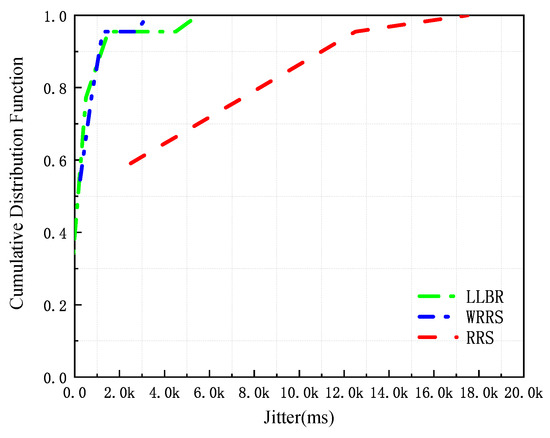
Figure 7.
Delay jitter of three algorithms.
Figure 8 illustrates the cumulative distribution function of the packet loss rate of the DCN transmitted by the 22 terminals recorded within an hour using the three algorithms. The packet loss rate of the LLBR algorithm was 0.02%, a figure which was far lower than that of the other two algorithms. Thus, the LLBR algorithm guaranteed the data transmission and reduced packet loss.
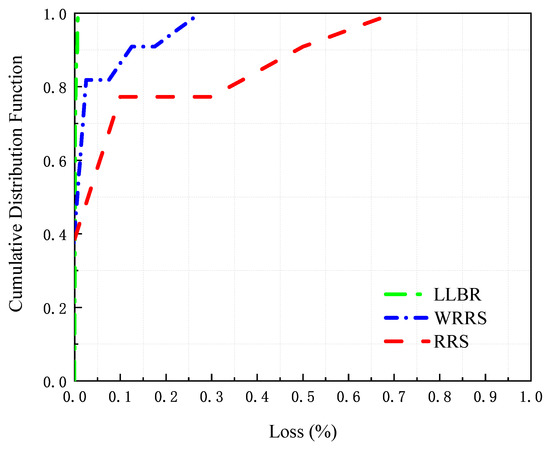
Figure 8.
Packet loss rate of three algorithms.
5. Conclusions
Many online services, parallel computing applications, and machine learning applications rely on data center infrastructure. These applications generate extensive traffic in a DCN, thereby making traffic scheduling an important means to improve resource utilization, ensure fair sharing, and guarantee application performance.
Through the analysis of the network transmission link in a DCN, this work confirms that a network link has the characteristics of spatio-temporal data during data transmission. Therefore, we modified the original ST-ResNet algorithm. The input of the algorithm is changed to the occupancy state of the link, and the output standard is the mean square deviation between the predicted data and the current real data. Thus, the link occupancy status of the next duty time can be predicted. To make better use of the predicted results, we propose the LLBR algorithm, which determines the path used for data transmission So as to achieve load balance and improve the user’s Quality of Experience (QoE). Experiments show that the LLBR algorithm can reasonably allocate the transmission path for the data in the next duty time. In the DCN, reasonable traffic scheduling can be performed by applying the LLBR algorithm to improve the utilization rate of resources, ensure fair sharing, and guarantee the performance of various applications.
Author Contributions
Conceptualization, Y.L., J.Z., Q.W. and W.L.; investigation, Y.L., J.Z., Q.W. and P.L.; methodology, Y.L., J.Z. and Q.W.; validation, Y.L., J.Z. and Q.W.; writing—original draft preparation, J.Z.; supervision, Y.L.; writing—review and editing, Y.L., J.Z. and W.L. All authors have read and agreed to the published version of the manuscript.
Funding
This publication has emanated from a joint research conducted with the financial support of the S&T Major Project of the Science and Technology Ministry of China under the Grant No. 2017YFE0135700.
Data Availability Statement
Not applicable.
Conflicts of Interest
The authors declare no conflict of interest.
References
- Shang, Y.; Li, D.; Zhu, J.; Xu, M. On the Network Power Effectiveness of Data Center Architectures. IEEE Trans. Comput. 2015, 64, 3237–3248. [Google Scholar] [CrossRef]
- Zhao, S.; Zhu, Z. On Virtual Network Reconfiguration in Hybrid Optical/Electrical Datacenter Networks. J. Light. Technol. 2020, 38, 6424–6436. [Google Scholar] [CrossRef]
- Ghorbani, S.; Yang, Z.; Godfrey, P.B.; Ganjali, Y.; Firoozshahian, A. DRILL: Micro Load Balancing for Low-latency Data Center Networks. In Proceedings of the Conference of the ACM Special Interest Group on Data Communication, Los Angeles, CA, USA, 21–25 August 2017. [Google Scholar]
- Bok, K.; Choi, K.; Choi, D.; Lim, J.; Yoo, J. Load Balancing Scheme for Effectively Supporting Distributed In-Memory Based Computing. Electronics 2019, 8, 546. [Google Scholar] [CrossRef]
- Sufiev, H.; Haddad, Y.; Barenboim, L.; Soler, J. Dynamic SDN Controller Load Balancing. Future Internet 2019, 11, 75. [Google Scholar] [CrossRef]
- Amiri, E.; Hashemi, M.R.; Raeisi, K. Policy-Based Routing in RIP-Hybrid Network with SDN Controller. In Proceedings of the 4th National Conference on Applied Research Electrical Mechanical Computer and IT Engineering, Tehran, Iran, 4 October 2018. [Google Scholar]
- Zhexin, X.U.; Shijie, L.I.; Xiao, L.; Yi, W.U. Power control mechanism for vehicle status message in VANET. J. Comput. Appl. 2016, 36, 2175–2180. [Google Scholar]
- Zhao, H.; Tan, M.; Tang, C.; Xia, S.; Peng, Z. Logic carrying network building method based on link load balancing. In Proceedings of the 2019 IEEE 1st International Conference on Civil Aviation Safety and Information Technology (ICCASIT), Kunming, China, 17–19 October 2019. [Google Scholar]
- Mondal, A.; Misra, S.; Maity, I. Buffer Size Evaluation of OpenFlow Systems in Software-Defined Networks. IEEE Syst. J. 2018, 13, 1359–1366. [Google Scholar] [CrossRef]
- Swami, R.; Dave, M.; Ranga, V. Defending DDoS against Software Defined Networks using Entropy. In Proceedings of the 2019 4th International Conference on Internet of Things: Smart Innovation and Usages (IoT-SIU), Ghaziabad, India, 18–19 April 2019. [Google Scholar]
- You, S.Y.; Wang, Y.C. An Efficient Route Management Framework for Load Balance and Overhead Reduction in SDN-Based Data Center Networks. IEEE Trans. Netw. Serv. Manag. 2018, 15, 1422–1434. [Google Scholar]
- Craig, A.; Nandy, B.; Lambadaris, I.; Ashwood-Smith, P. Load balancing for multicast traffic in SDN using real-time link cost modification. In Proceedings of the 015 IEEE International Conference on Communications (ICC), London, UK, 8–12 June 2015. [Google Scholar]
- Huang, X.; Bian, S.; Shao, Z.; Xu, H. Dynamic Switch-Controller Association and Control Devolution for SDN Systems. In Proceedings of the 2017 IEEE International Conference on Communications (ICC), Paris, France, 21–25 May 2017. [Google Scholar]
- Zhang, J.; Zheng, Y.; Qi, D. Deep Spatio-Temporal Residual Networks for Citywide Crowd Flows Prediction. In Proceedings of the AAAI Conference on Artificial Intelligence, Phoenix, AL, USA, 12–17 February 2016. [Google Scholar]
- Liu, G.; Wang, X. A Modified Round-Robin Load Balancing Algorithm Based on Content of Request. In Proceedings of the 2018 5th International Conference on Information Science and Control Engineering (ICISCE), Zhengzhou, China, 20–22 July 2018. [Google Scholar]
- Li, D.C.; Chang, F.M. An In–Out Combined Dynamic Weighted Round-Robin Method for Network Load Balancing. Comput. J. 2007, 50, 555–566. [Google Scholar] [CrossRef][Green Version]
- Nair, N.K.; Navin, K.S.; Chandra, C.S.S. A survey on load balancing problem and implementation of replicated agent based load balancing technique. In Proceedings of the Communication Technologies, Thuckalay, India, 23–24 April 2015. [Google Scholar]
- Isyaku, B.; Mohd Zahid, M.S.; Bte Kamat, M.; Abu Bakar, K.; Ghaleb, F.A. Software Defined Networking Flow Table Management of OpenFlow Switches Performance and Security Challenges: A Survey. Future Internet 2020, 12, 147. [Google Scholar] [CrossRef]
- Leonardi, L.; Bello, L.L.; Aglianò, S. Priority-Based Bandwidth Management in Virtualized Software-Defined Networks. Electronics 2020, 9, 1009. [Google Scholar] [CrossRef]
- Chen, J.; Zheng, X.; Rong, C. Survey on Software-Defined Networking. IEEE Commun. Surv. Tutorials 2015, 17, 27–51. [Google Scholar]
- Xie, S.; Girshick, R.; Dollár, P.; Tu, Z.; He, K. Aggregated Residual Transformations for Deep Neural Networks. In Proceedings of the 2017 IEEE Conference on Computer Vision and Pattern Recognition (CVPR), Honolulu, HI, USA, 21–26 July 2016. [Google Scholar]
- Mao, H.; Schwarzkopf, M.; Venkatakrishnan, S.B.; Meng, Z.; Alizadeh, M. Learning Scheduling Algorithms for Data Processing Clusters. In Proceedings of the ACM Special Interest Group on Data Communication, Budapest, Hungary, 20–24 August 2018. [Google Scholar]
- Chen, L.; Lingys, J.; Chen, K.; Liu, F. AuTO: Scaling deep reinforcement learning for datacenter-scale automatic traffic optimization. In Proceedings of the 2018 Conference of the ACM Special Interest Group, Buffalo-Niagara Falls, NY, USA, 18–20 June 2018. [Google Scholar]
- Agarwal, S.; Kodialam, M.; Lakshman, T.V. Traffic engineering in software defined networks. In Proceedings of the IEEE Infocom, Turin, Italy, 14–19 April 2013. [Google Scholar]
- Dong, S.; Kaixin, Z.; Yaming, F.; Jie, C. Dynamic Traffic Scheduling and Congestion Control across Data Centers Based on SDN. Future Internet 2018, 10, 64. [Google Scholar]
- Xia, W.; Zhao, P.; Wen, Y.; Xie, H. A Survey on Data Center Networking (DCN): Infrastructure and Operations. Commun. Surv. Tutor. 2017, 19, 640–656. [Google Scholar] [CrossRef]
- Wang, X.; ERickson, A.; Fan, J. Hamiltonian Properties of DCell Networks. Comput. J. 2015, 58, 2944–2955. [Google Scholar] [CrossRef]
- Kiriha, Y.; Nishihara, M. Survey on Data Center Networking Technologies. IEICE Trans. Commun. 2013, E96.B, 713–721. [Google Scholar] [CrossRef]
- Qian, Z.; Fan, F.; Hu, B.; Yeung, K.L.; Li, L. Global Round Robin: Efficient Routing with Cut-Through Switching in Fat-Tree Data Center Networks. IEEE/ACM Trans. Netw. 2018, 26, 2230–2241. [Google Scholar] [CrossRef]
- Modi, T.; Swain, P. FlowDCN: Flow Scheduling in Software Defined Data Center Networks. In Proceedings of the 2019 IEEE International Conference on Electrical, Computer and Communication Technologies (ICECCT), Coimbatore, India, 20–22 February 2019. [Google Scholar]
- Malik, A.; de Fréin, R.; Al-Zeyadi, M.; Andreu, J. Intelligent SDN Traffic Classification using Deep Learning. In Proceedings of the 2020 2nd International Conference on Computer Communication and the Internet (ICCCI), Nagoya, Japan, 26–29 June 2020. [Google Scholar]
- Hao-Ming, D.; Hui, J.; Si-Guang, C. SDN-based Network Controller Algorithm for Load Balancing. Comput. Sci. 2019, 46, 312–316. [Google Scholar]
- Abdelaziz, A.; Fong, A.T.; Gani, A.; Khan, S.; Alotaibi, F.; Khan, M.K. On Software-Defined Wireless Network (SDWN) Network Virtualization: Challenges and Open Issues. Comput. J. 2017, 60, 1510–1519. [Google Scholar] [CrossRef]
- Zhang, L.; Li, D.; Guo, Q. Deep Learning from Spatio-temporal Data using Orthogonal Regularizaion Residual CNN for Air Prediction. IEEE Access 2020, 8, 66037–66047. [Google Scholar] [CrossRef]
- Kalra, S.; Leekha, A. Survey of convolutional neural networks for image captioning. J. Inf. Optim. Sci. 2020, 41, 239–260. [Google Scholar] [CrossRef]
- Yu, C.; Zhao, Z.; Zhou, Y.; Zhang, H. Intelligent Optimizing Scheme for Load Balancing in Software Defined Networks. In Proceedings of the 2017 IEEE 85th Vehicular Technology Conference: VTC2017-Spring, Sydney, Australia, 4–7 June 2017. [Google Scholar]
- Lipton, Z.C.; Berkowitz, J.; Elkan, C. A Critical Review of Recurrent Neural Networks for Sequence Learning. Computer Sci. 2015, 8, 326–337. [Google Scholar]
- Krizhevsky, A.; Sutskever, I.; Hinton, G. ImageNet Classification with Deep Convolutional Neural Networks. Neural Inf. Process. Syst. 2012, 25. [Google Scholar] [CrossRef]
- Huong, T.T.; Khoa, N.D.D.; Dung, N.X.; Thanh, N.H. A Global Multipath Load-Balanced Routing Algorithm based on Reinforcement Learning in SDN. In Proceedings of the 2019 International Conference on Information and Communication Technology Convergence (ICTC), Jeju Island, Korea, 16–18 October 2019. [Google Scholar]
- Zhang, Y.; Harrison, P.O. Performance of a Priority-Weighted Round Robin Mechanism for Differentiated Service Networks. In Proceedings of the International Conference on Computer Communications and Networks, Arlington, VA, USA, 9–11 October 2006. [Google Scholar]
- Ahmed, A.M.; Ahmed, S.H.; Ahmed, O.H. Dijkstra algorithm applied: Design and implementation of a framework to find nearest hotels and booking systems in Iraqi. In Proceedings of the 2017 International Conference on Current Research in Computer Science and Information Technology (ICCIT), Slemani, Iraq, 26–27 April 2017. [Google Scholar]
Publisher’s Note: MDPI stays neutral with regard to jurisdictional claims in published maps and institutional affiliations. |
© 2021 by the authors. Licensee MDPI, Basel, Switzerland. This article is an open access article distributed under the terms and conditions of the Creative Commons Attribution (CC BY) license (http://creativecommons.org/licenses/by/4.0/).