1. Introduction
In September 1985, Mexico’s strongest earthquake of the 20th century devastated extended areas of Mexico City. Around thirty-thousand buildings were damaged or destroyed during that event. Broad sectors of services and commerce halted in the country’s most populated area for weeks and months [
1]. As a university student at the time, I could not attend classes for more than three weeks while all the university buildings were assessed for safety and utility and transport got restored. Phone telecommunications were not completely fixed for six months. During that time, the internet was not part of our daily lives, so all notices about the re-starting of activities were delivered through newspapers or television. The possibility of remote, online education was impossible at that time.
Thirty-five years later, the COVID-19 pandemic has made things worse and some things better. More than 152,000 deaths in Mexico due to the pandemic have been reported at the date of this writing (21,000 in the Mexico City area). This compares to the 40,000 deaths estimated in the 1985 earthquake, still considered the most devastating event of the last century in Mexico City. The present confinement has been extended by months, particularly in the schools, a situation sustainable in education mainly because of the internet [
2]. It has also served to support general commerce, government services, and entertainment services. However, if the pandemic had occurred in 1985, education’s sustainability would have been untenable. Nevertheless, the internet is not the only factor contributing to education’s success during the pandemic; other social and economic factors have been identified that support diverse sectors of the student population in new ways [
3].
After various suspensions of academic activities for weeks to months due to the COVID-19 pandemic beginning in March 2020, sustaining public education in Mexico became extremely limited on several levels due to the absence of technology and the variable teacher experience. However, private education responded faster because it was better adapted to distance learning. Contending with the students’ different degrees of self-discipline and their moods during the confinement, educators found that the digital education intervention unveiled profound differences in social opportunities throughout the student population [
4]. The scenario was better in higher education, having more uniformity due to standards and alliances among universities [
5]. Despite those alliances, there were differences in student access to personal computers [
2]. During the first scholastic period of the COVID-19 confinement (beginning in March), the author experienced what is reported here. The confinement forced a different focus on teaching and interesting student behavior, providing evidence that access to services and technology is the fundamental requirement for hybrid learning success [
6].
After fulfilling the first scholastic period, a second educative cycle from August to December 2020 provided continuity for better preparing education strategies. With more robust and diverse methods and applications, public and private educational institutions educated millions of Mexican students. Public universities implemented laptop loan programs, and private universities developed a more substantial and broader scaffolding to sustain academic life.
Higher education is usually associated with high performance and complex learning. It has been documented in the last few decades that society and industry have exerted growing pressure on universities to offer more relevant and useful student training to benefit the economy and society [
7]. Thus, one trend in higher education has been to develop specific skills to close education and workforce gaps. Distance Learning (DL) initially emerged precisely to benefit education for employability. It has had the same intention through the years, at least for technical and higher education, as analyzed in [
8], for instance. This distance learning concept has evolved, becoming emancipated, and diversified, not necessarily focusing on its effectiveness in providing professional work skills.
This article aims to gather and analyze information to assess the hybrid learning model implemented for a first-semester, higher education physics course based on skills development. The course integrated different content sections, such as math applied to physics, computational physics, and theoretical physics, considering a broad range of collaborative student performance, engagement, and social behavior factors in Distance Learning (DL). The research aimed to identify if a designed pedagogical method under DL forced by the COVID-19 pandemic effectively fulfilled the learning objectives of a skill-based model previously offered in face-to-face instruction. The changes in the delivery of high school and higher education, combined with the current complexity of learning due to the pandemic, created significant challenges for the teachers. A contextual literature review about the hybrid approaches related to Education is performed in
Section 2.
Section 3 presents the research questions, objectives, type of research, and associated methods. A description of the course organization and learning design is presented in
Section 4 to establish the basis for analyses. From the data collected, several analyses related to the research objectives were developed in
Section 5. The discussion of findings and critical issues during the course and recommendations are included in
Section 6.
Section 7 presents the conclusions and future work for the course.
3. Materials and Methods
Educative research is sometimes associated with learning performance. Learning often cannot be measured directly due to the many variables present in each learning situation. This report concerns the relationship between Tec 21 model objectives and the DFM strategy imperative, together with the social behaviors observed during the intervention, considering them valuable factors to understand the learning dynamics during the COVID-19 pandemic. In this section, the elements analyzed in the research are presented.
3.1. Research Questions
The research questions arose from the course objectives and delivery, based on observation of the learning dynamics. They were:
Did the DFM effectively facilitate the SBE approach established by the Tec 21 Educative Model in which the learning block was developed?
Which dynamics emerged during the DFM’s delivery? Did the dynamics converge to facilitate appropriate behaviors that accomplished learning?
Was the learning performance equitably represented among the students and sections? If not, which had problems and why?
Despite being limited to the specific experience reported in this work, these questions were crucial for the DFM and Tec 21 during the crisis, considering that blended learning was the best solution for humankind to meet the emergency without stopping education. During the COVID-19 crisis, the educational performance was determined by efficient access to technology and the attitudes toward learning and previously acquired learned skills, as reported by [
35].
3.2. Research Objectives
This article reports the outcomes of the following research objectives emerging from quantitative analyses of the previous questions. The objectives were:
To assess the learning content in the DFM learning block sections developed under the Tec 21 Educational Model during the COVID-19 confinement.
To analyze the comparative performance by section, gender, and type of activity (individual or team) generated under the DFM.
To highlight noteworthy behaviors of the Physics section students, who learned the content and developed the problem solutions to the challenge under the DFM, and their exit perceptions.
3.3. Method, Participants and Data Collection
The current study is mixed research. Despite the primary analysis being conducted quantitatively, complementary information came from systematic observation and interpretation, reported in the Discussion section. Some outcomes must be considered as insights and guides for future research because there is still a lack of historic information under the Tec 21 model just initiated in 2019 and, of course, the emergency DFM that had to be developed suddenly because of the COVID-19 pandemic.
Data were recovered from Canvas and Zoom interactions and some parallel resources to develop active learning activities. It includes each grade assigned to each student in each activity and section. The presented information comprehends the block’s overall sections to compare or subscribe to the Physics section in the entire block context. Data sources included detailed grades and metadata for individual and team activities, homework, and examinations (percentage value in the entire course, date of delivery, type of activity—individual or by teams—themes included, etc.). All grades were reported on a 0 to 100 scale.
Additionally, a comprehensive video-story was recorded session by session as observational input for the Physics section. The recordings were reviewed to determine the participation by gender, students participating actively in the sessions, etc. Zoom automatically recorded the attendance through sessions programmed under the mandatory register; thus, a list of attendants was provided by Zoom. Other pertinent issues such as problems with technology or services, family issues hindering the class attendance, etc., were recovered from messaging registers or e-mail. For statistical techniques in the quantitative analysis, all the measurements used for statistical or graphical purposes were metric scale measurements (nominal or ordinal, and always well-ordered measurements). The established frequencies, averages, and analytical dispersion were validated in subsequent statistical analyses [
36] as established by each of the research objectives.
In the following sub-sections, the description and report of each analysis highlight the most notable findings. The population being analyzed corresponded to a pair of blocks with 28 and 32 first-year students, respectively. They were taught by the same teachers in the different sections of the block. The Physics section classes were delivered on Monday, Thursday, and Friday, one from 7:00 to 9:00 a.m. and the other from 9:00 to 11:00 a.m. (other sections had the same timetable but reverted, thus delivering a four-hour session each day for each class from 7:00 to 11:00 a.m. with the same treatment). In the entire group of students, 35.7% were female. The two classes were not differentiated by gender.
The socioeconomic description of the population corresponded to middle-class students ranging ages between 16 and 19 years old. Most had easy access to the internet but not necessarily with the best quality and stability, as observed during the teaching process. A minority of the students declared problems with technology, internet access, family issues, and inadequate devices. The university is in an urban area of Mexico City with all services available, although the internet and electrical services suffered occasional cuts. Utility and internet services in most Latin American cities are not perfect, and family subscription to these services is diverse; the family dues impacted the students. They could also have other siblings or younger ones in various educational levels where computers were mandatory or not, thus being forced to compete by the requirement for such devices in the pandemic context.
As a complement to the data analyses, the students’ opinion was considered as sensitive qualitative input. In this study, the author’s institution systematically applies a final exit survey evaluating several aspects of the teaching process in each implementation. Questions in the survey included opinions about the teacher, course design, and teacher-student interactions. Such data could allow discerning some aspects of the primary quantitative analysis. In the following section, the research objectives are addressed through the appropriate data collection and observations during the teaching and learning process.
5. Analysis and Outcomes
Several analyses of different aspects of the research questions were conducted, based on the data and meta-data collected through the entire learning process. First, a general view of the process is presented—average grades and general behavior—to detect patterns. Then, an analysis of grades considering groups or sections is performed to attend to the research questions.
5.1. Storyline Records: An Analysis of Behavioral Trends
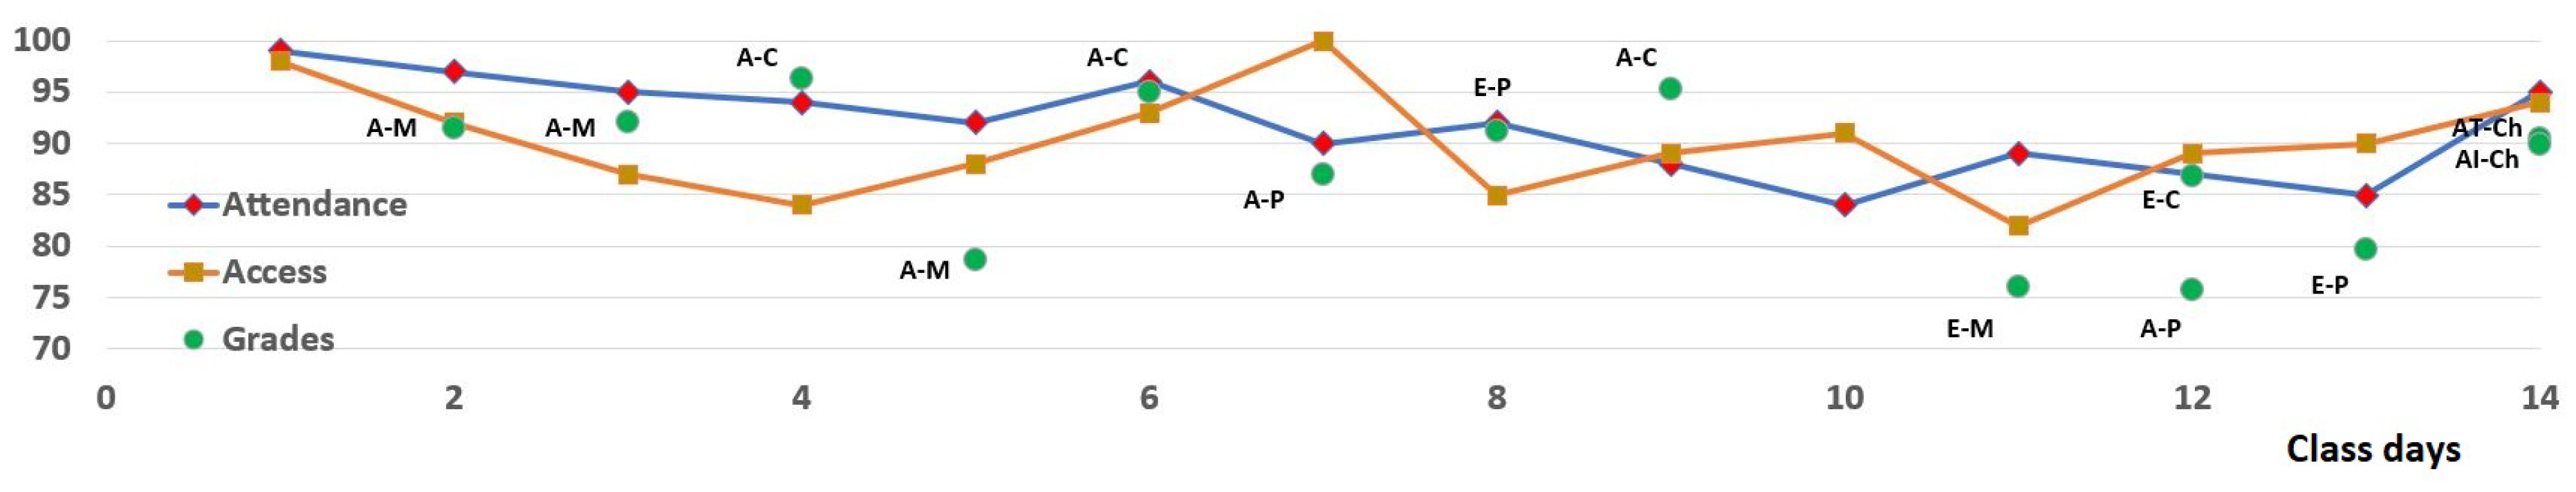
A storyline for the course development showing average grades, attendance, and LMS access is shown in
Figure 3, presenting the most meaningful learning period events. Thus, attendance of video-classes (blue lines with red diamonds) is collected from the Zoom registers class by class and presented on a 0–100% scale for the entire population. The tracking of accesses to the materials (orange lines with brown squares) in uniform periods of class-days, was also measured on a 0–100% scale of the maximum access achieved (0–100%, occurring on the 7th class day). Additionally, for the graded tasks in the overall course sections, learning activities (A) and examinations (E), their respective average performances were reported for the entire group of students identified by sections (green dots): Mathematics (M), Physics (P), Computational Sciences (C), and the Challenge (Ch). In the last section, the activities were differentiated for individual performances (via individual oral presentations, AI) and team performances (via the team reports and programming products, AT).
The storyline reveals several issues. The first one is a slight decrease in attendance through time, possibly due to the recorded classes. It dropped around compared with just in a typical face-to-face course (experienced in the 2019 application). The access to materials peaks somewhat before the examinations. Note that the course is concise and fast, and the peaks appear just one or two sessions before the examinations. There are no apparent trends in the activities’ average grades, neither by section nor type (A or E); all fall between 85 and 100 points, with drops to the 75–80 range for some specific activities (A-M, E-M, A-P, E-P).
5.2. Analysis of Performances by Section and Type of Activity
Comparisons between individual and team performances were useful in DL, BL and OL to discriminate certain behavioral aspects in the learning dynamics (see [
37]). Notably, the trends shadow the individual performance and show how social learning could support low to mid-performing students.
To analyze the individual and team behavior in terms of course performances, we compared average individual and team grades by type (Activity: teamwork or Examination: individual) and by section (Mathematics, Physics, Computational Sciences, and Challenge). Thus, in each section, the weighted average for each grade for each student was performed as a component of the entire block value. A quantile analysis was performed to analyze the behavior of performance distribution in each section. A quartile distribution was preferred for its simplicity. The data were closely conglomerated in general, thus not requiring refinement. Quartile analysis is valid for metric variables (as grade scales are) to reveal characteristics of the inner statistical distribution.
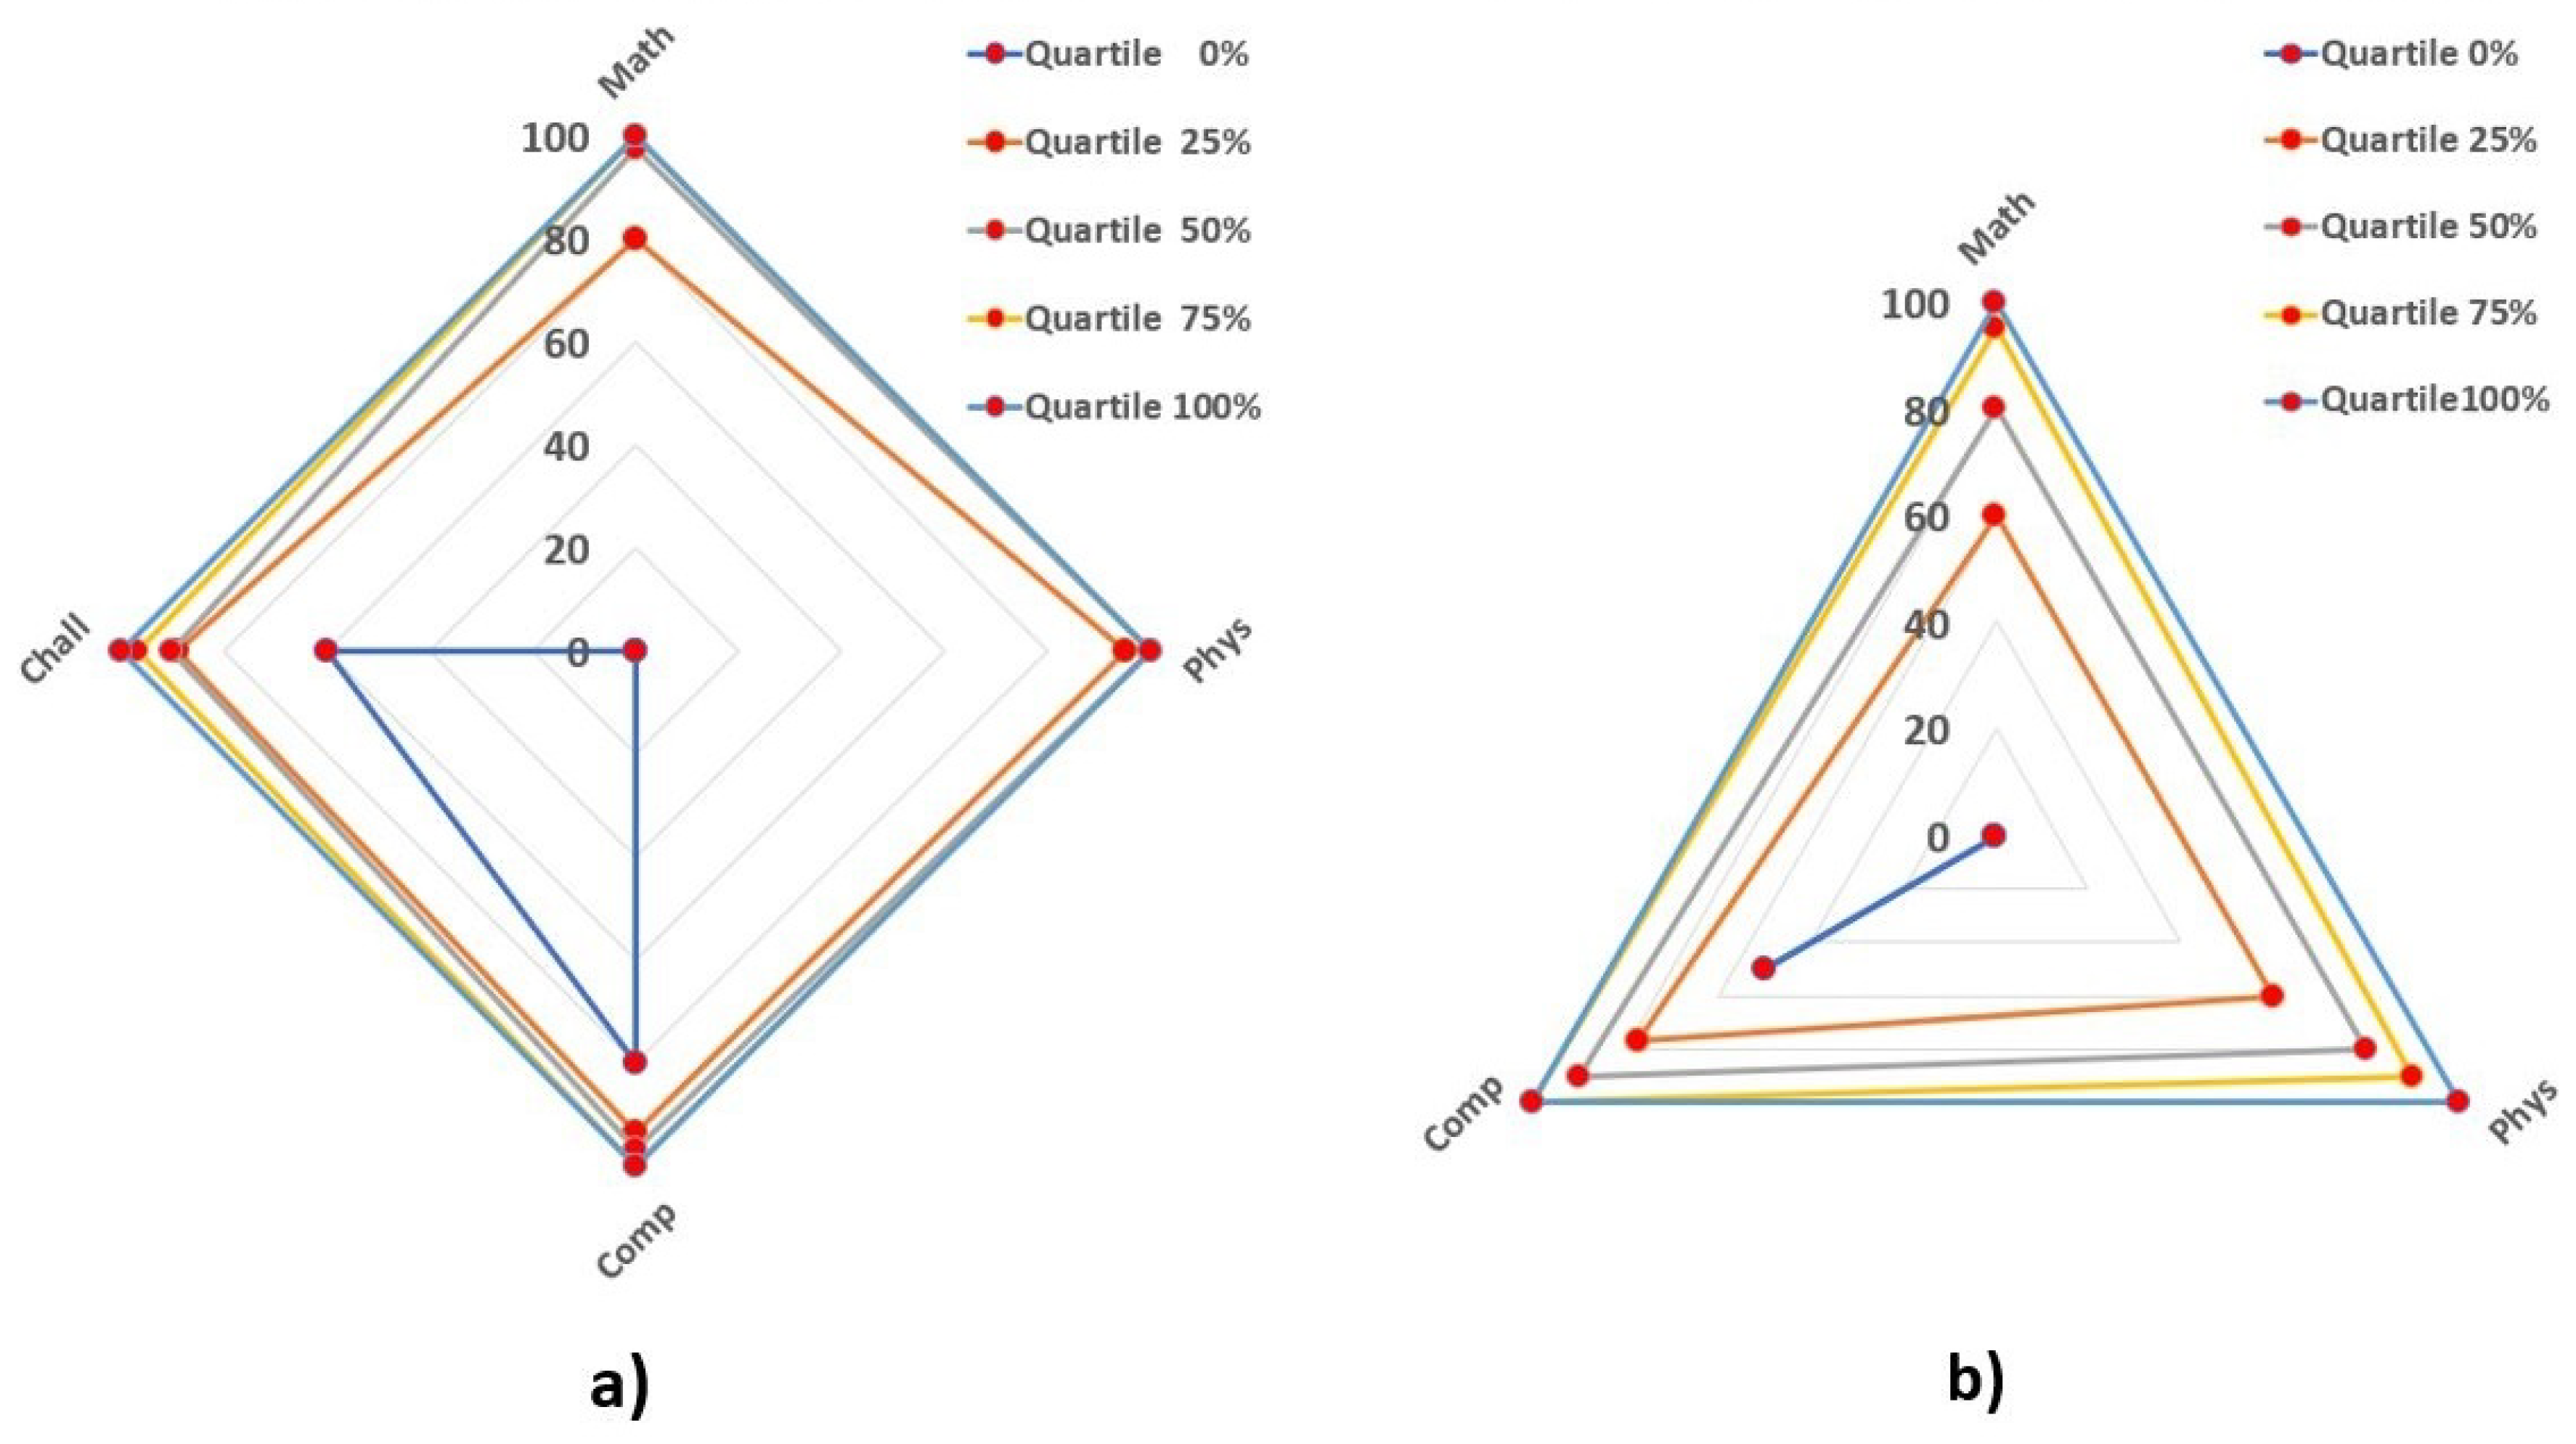
The corresponding quartile distribution was constructed for the individual and team performance average of students in each section.
Figure 4 presents the five limits for the quartile distribution of each measurement. Data are also directly reported in
Table A1 of
Appendix A. Thus, the inner space between the lines depicts the performance amplitude in each quartile (interquartile ranges, IQR). No individual examination was considered in the Challenge domain because it had a different character, oral instead of written. Note that teams conducted the activities while the examinations were individual.
For the Math and Physics sections, the zero quartiles (
) in the Activity grades begin at zero (
Figure 4a), meaning that the activities were dropped or completely failed by some students, which did not happen in Computational Sciences. Note the large dispersion in the activity grades in the Math and Challenge sections, not occurring with the same magnitude in Physics and Computational Sciences. For examinations,
Figure 4b (see
Table A1), shows that the Computational Sciences section has a narrower dispersion. Furthermore, in team activities, this section exhibits such narrower behavior notably. In terms of the second quartile (
, constructed with the second and fourth limits) centered in the median, there is a remarkable drop in the Challenge section of Team performances and an elevation in the Computational Sciences section for Individual performances (see [
38] for interpretation of the quartile distribution).
Because there was interest in the differentiation between individual and social learning to quantify the performance impact of the COVID-19 quarantine and students’ learning behavior, a splitting of the performances in both arenas was performed. Individual performances lower than teamwork performances can indicate hidden low-performance students affecting the team grade. Higher individual performances than teamwork performances denote low collaboration or disorganization within the team. Furthermore, gender is commonly associated with disadvantages in Education (see [
39]), so this possible differentiation factor was considered. A more in-depth view of those aspects is addressed below.
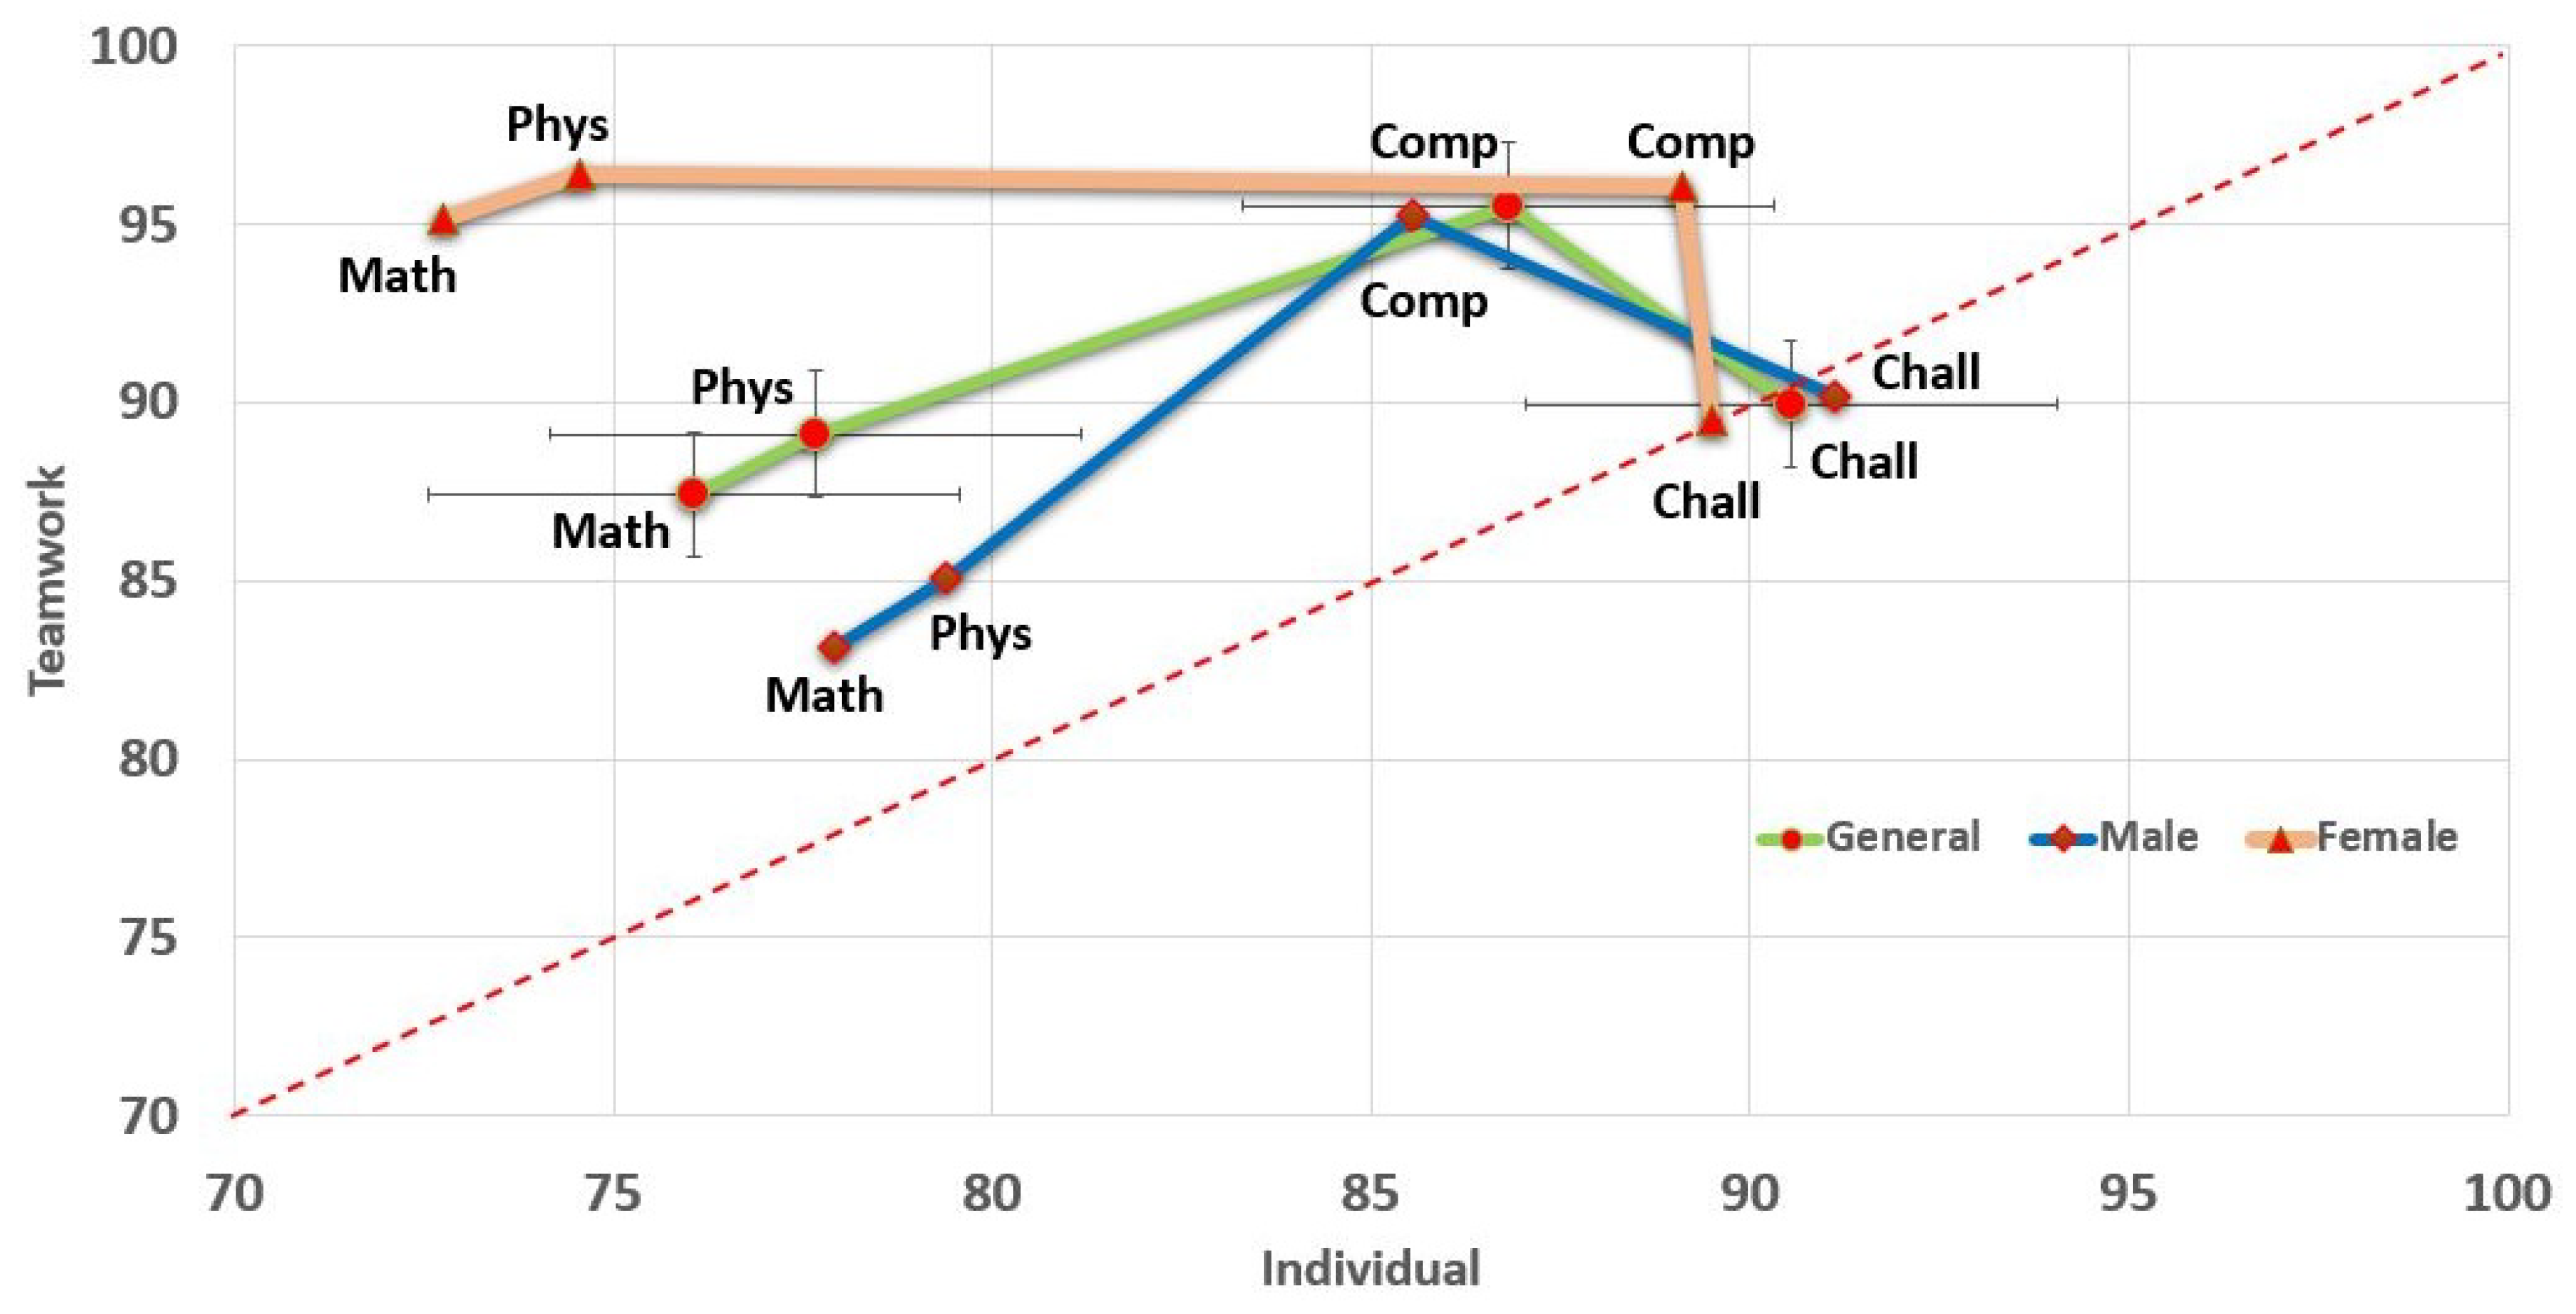
The average individual versus the average team performance under a statistical similitude assumption was associated with a dispersion plot, presented in
Figure 5. It compares gender performance in each section (red triangle markers joined by the peach line for the female gender and square red markers joined by the blue line for the male gender) together with the general population (similarly using circular red markers joined by a green line). The lines are used only to mark each group represented. The corresponding data are included in
Table A2 as a reference. There, the horizontal axis measures the average individual performance and the vertical axis measures the teamwork average. Red markers show each corresponding comparison by sections and gender, as explained.
Note the large gap in performance between Computational Sciences and Challenge versus Math and Physics in the individual domain. This could be due to the teacher’s style and/or the orientation of section contents. However, the design included rubrics for each activity. Each rubric sweeps grade ranges from 0 to 100 based on the elements absent/present in each deliverable activity (including the examinations). In this sense, the teacher style for grading becomes limited as a factor of that difference. Another more feasible explanation (more acceptable as a cause) is that the Computational Sciences section is more oriented to practice than theory, making a sensible difference from the Math and Physics sections. Another comparative difference is that in Computation Sciences, the higher individual grades went to the female gender; for Math and Physics, the male gender. Furthermore, for the Challenge performance, the individual and team grades were almost equal, while for the content sections, teams generally performed better than the individuals.
For the overall grade averages (shown in green), the standard deviation is reported as thin, black, vertical and horizontal error lines. The ranges comprehend the gender average grades;
Figure 5 shows how, in the Math section’s individual domain, the deep dispersion is explained by gender (almost located in the lower limit). Otherwise, in the teamwork domain, the Math and Physics sections’ dispersion is deeper but not necessarily explained by gender: both sections’ teamwork averages for each gender are not within the standard dispersion bar extremes.
The Discussion section comments more on gender behavior. Did the female gender boost the team performance? Was the individual performance meaningfully higher for the male gender? Were the differences in performance meaningful by gender in each type of evaluation and section?
5.3. Impact on the Challenge Performance of Individual and Teamwork Performances
A premise of the Tec 21 Educational Model is that in the courses, the performance exhibited in resolving the Challenge should be correlated with team members’ individual performances. Nevertheless, other factors related to the organization and team homogeneity could be necessary for a successful outcome. In this subsection, an analysis of that aspect was performed, considering the 12 teams in the course (six in each group). An analytical comparison was developed for each one: their members’ examinations averages (E) and their corresponding standard deviation (
E), plus the average of Teamwork activities (other than the challenge), and, finally, the Challenge grade (Ch).
Table 1 reports these figures for each team.
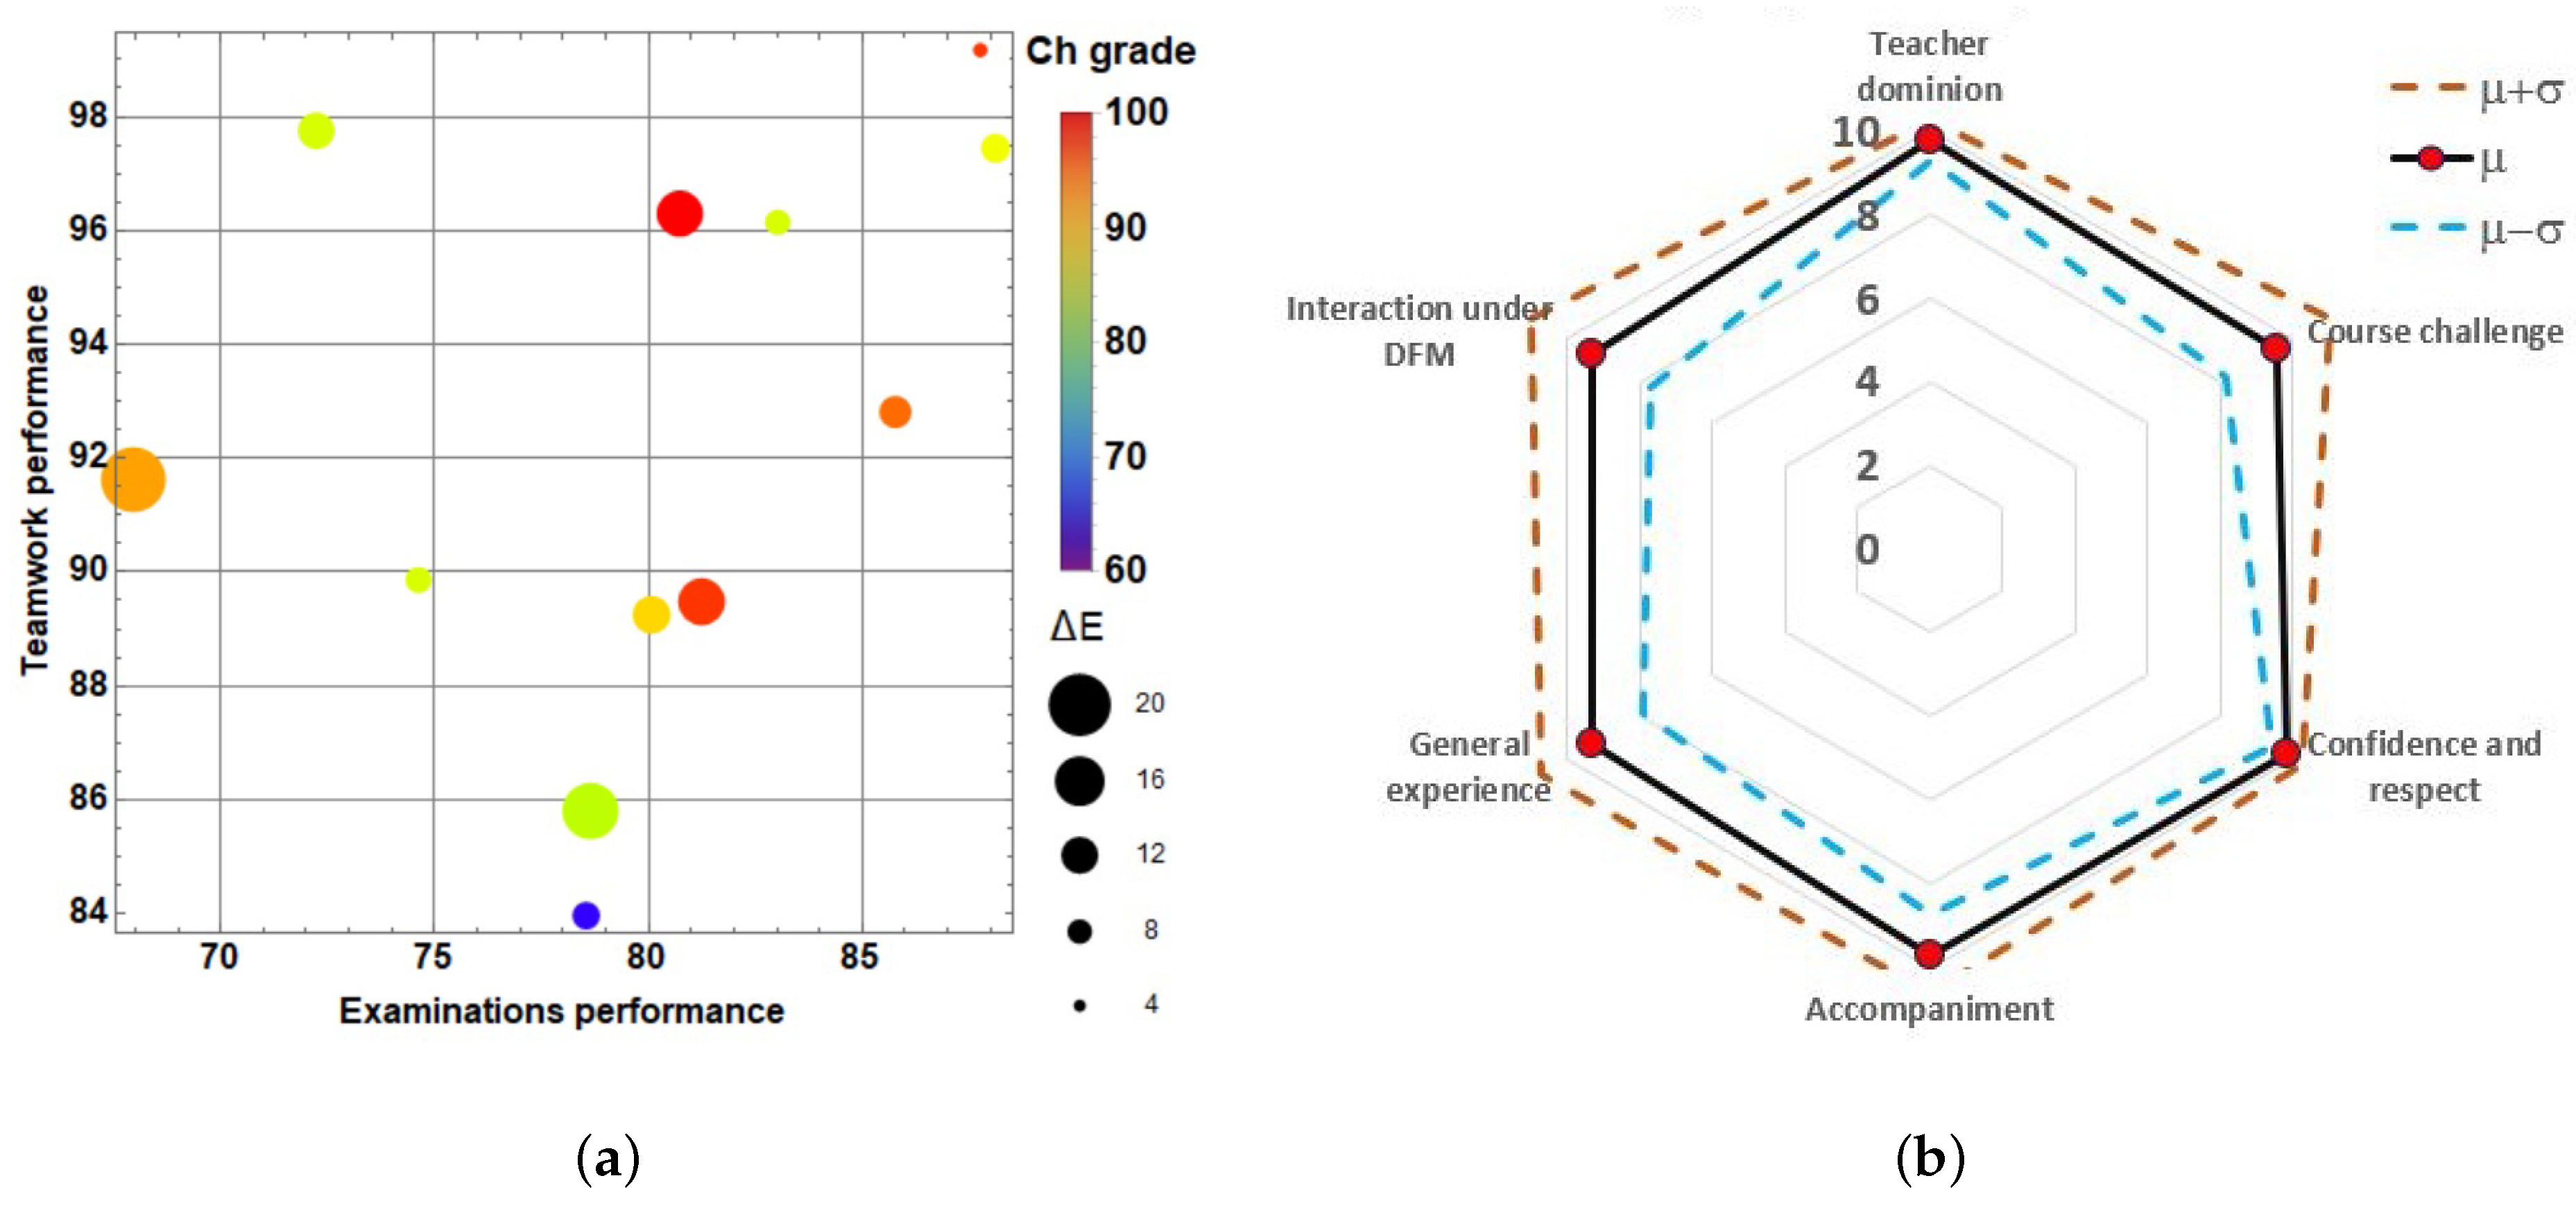
As a graphical insight,
Figure 6a presents the data in the form of a dispersion or scatter plot. A dispersion plot is a visual statistical tool to display a set of data (typically for two variables, although a higher number of data sets could be considered) to identify functional behavior trends [
40]. It may be supplemented by regression analysis (linear or non-linear) to explain a complex multi-factorial dependence.
Figure 6a exploits some properties to explain some expected factors in the Challenge performance.
Then, for
Table 1 data, each team is represented as a dot allocated as a function of its E performance and TW performance as they were depicted previously (for the overall activities without distinguishing the section and excluding only the challenge). The size of the dot reflects
E. Finally, the grade obtained exclusively on the challenge, Ch, is represented as the dot color. The dots’ color and sizes are shown in the graphical scale to the dispersion plot’s right (
Figure 6a).
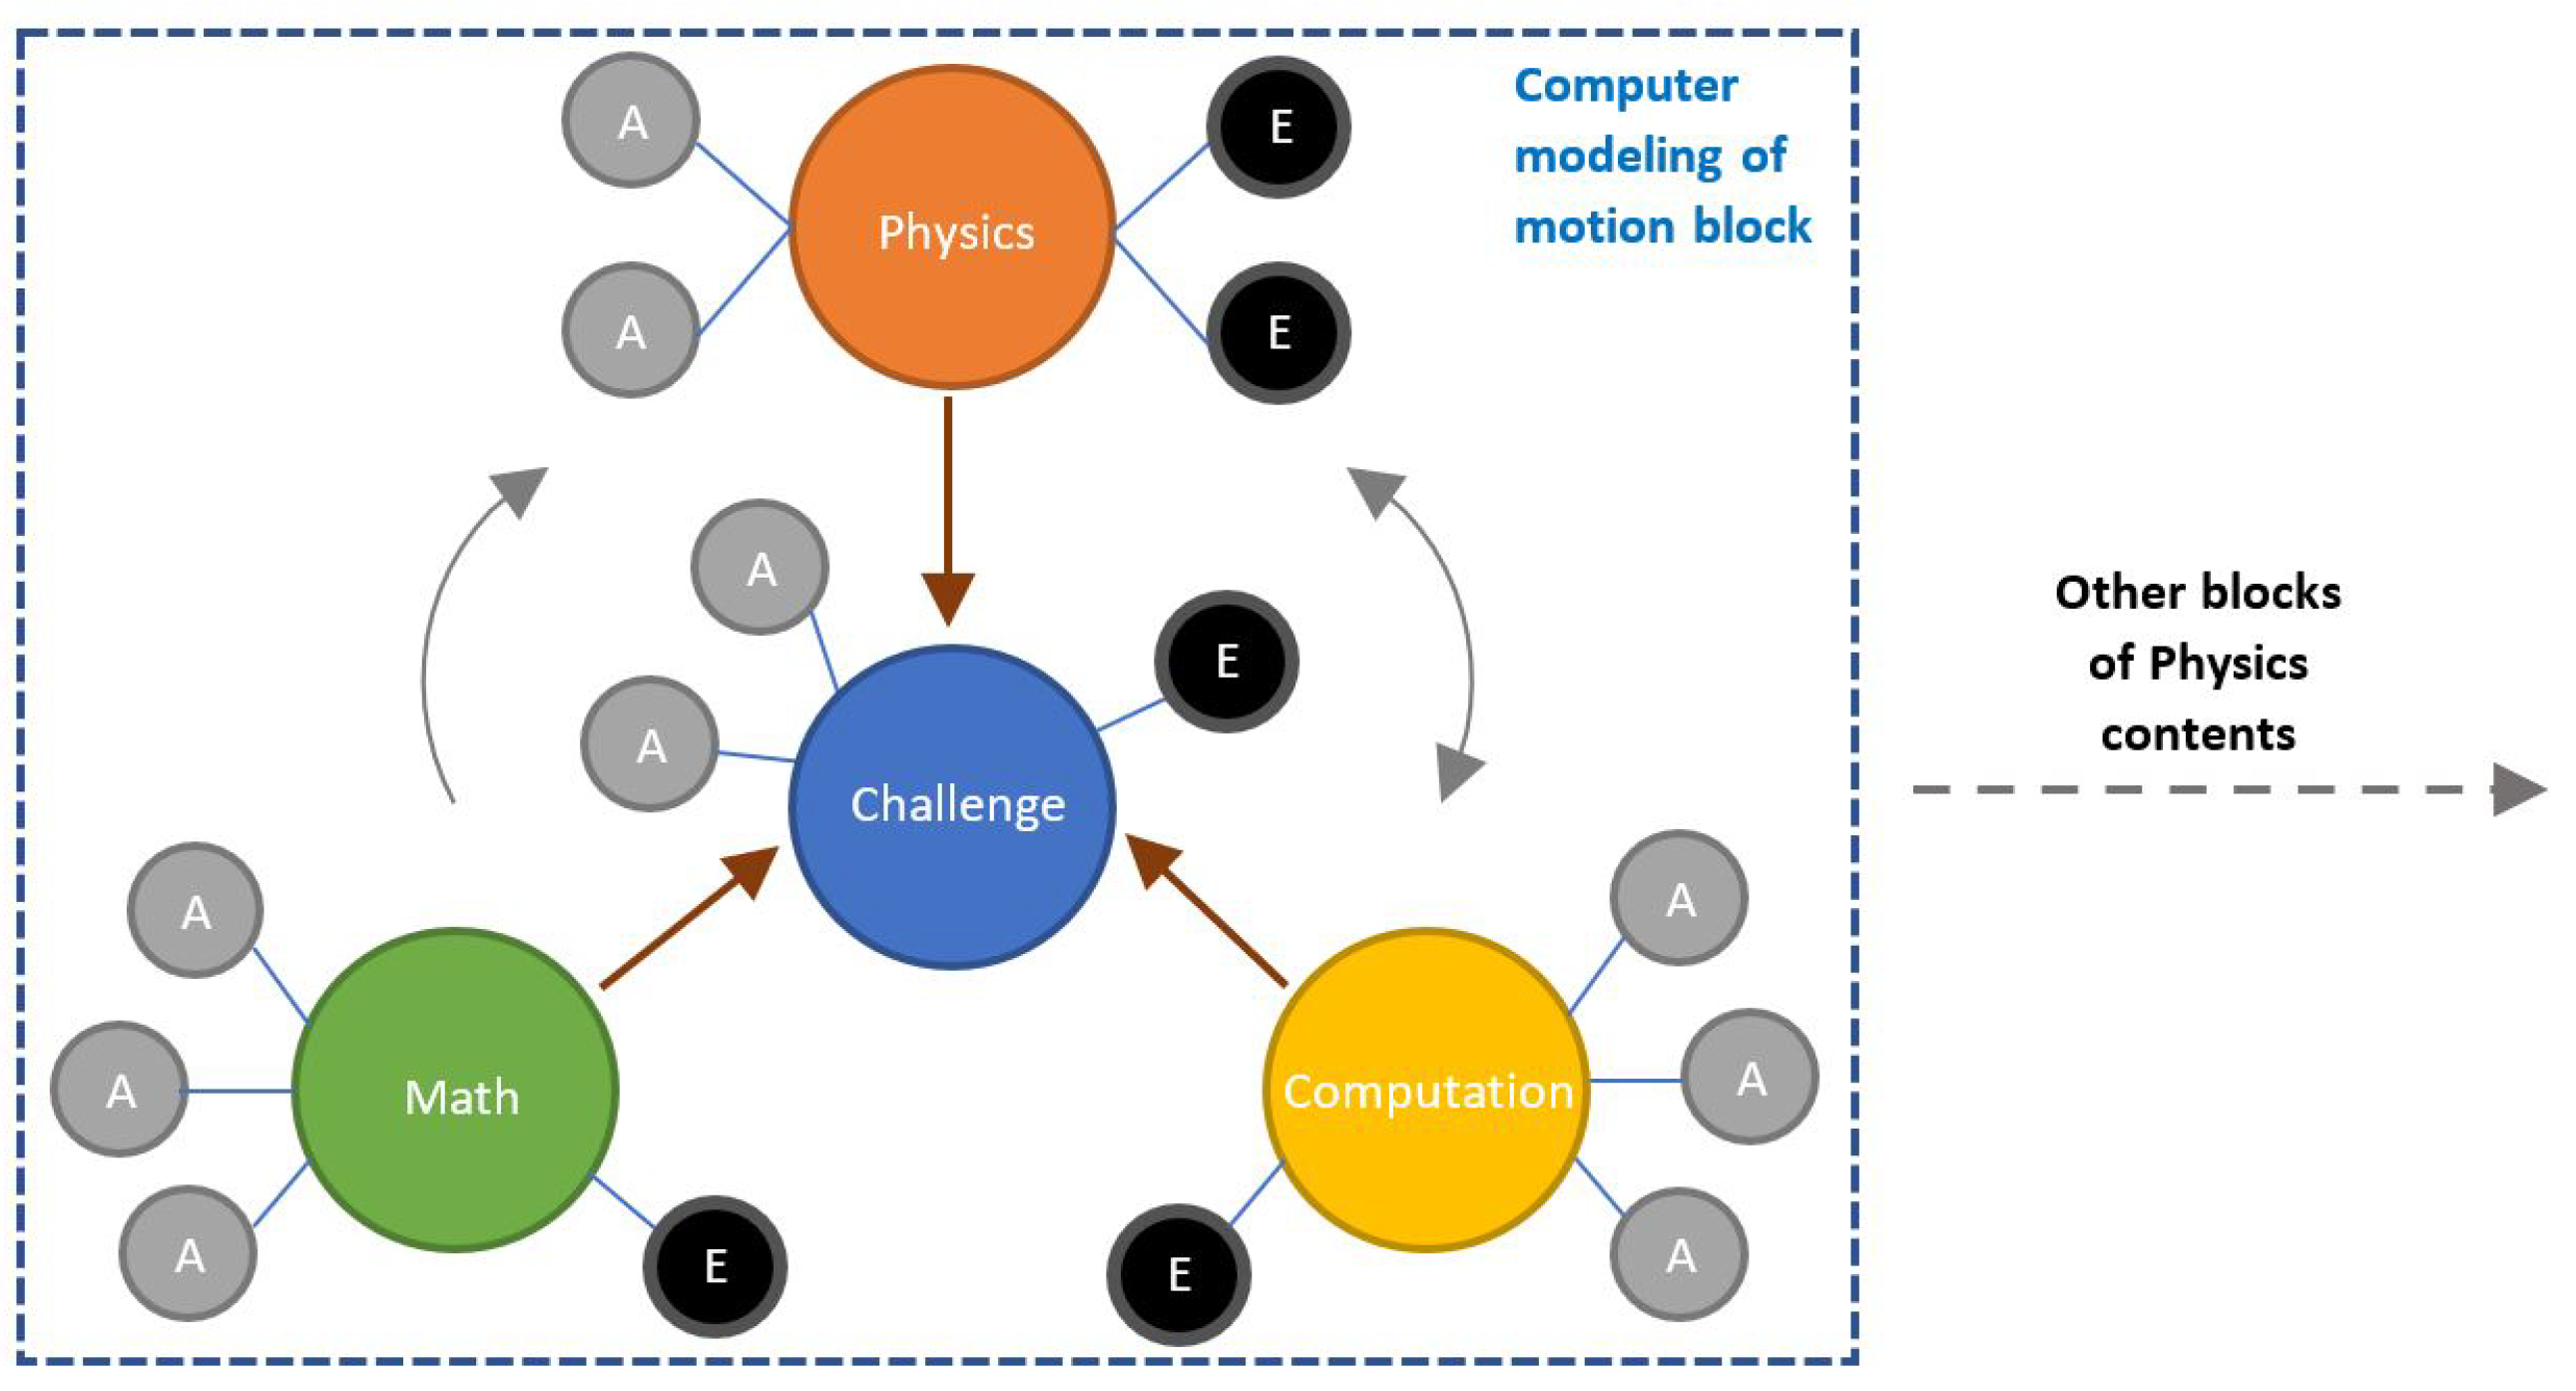
At first glance, the teams’ average Examination performances do not appear to be a decisive factor for success. Despite having been reported as a cohesiveness factor, their dispersion appears weak (see [
41]). So, the average Teamwork performance does not appear as a main meaningful factor as expected. These combined factors are the Tec 21 model’s assumption for the course, as represented in
Figure 1. However, which of these sets of parameters is most relevant for the quality of the outcome? This crucial element in the research is discussed in the next section because it is at the core of the course, derived from the Tec 21 Model.
5.4. Students’ Exit Opinion Survey
Tecnologico de Monterrey applies a student opinion survey that gathers data on several aspects of the teacher and course design performance at the end of each course. This survey includes students’ opinions about (1) the teacher’s mastery of the contents, (2) the course challenge, (3) teacher confidence and respect during the course, (4) teacher’s accompaniment, (5) global evaluation of the overall experience, and finally, (6) the effectiveness of the DFM design on the interactions. The last item was recently added due to the DFM; all the other questions are common in the exit surveys for the programs under the SBE. The survey is applied in the present form to the entire group of students under the SBE model without distinguishing the program; this survey was not just for the students in the Computer Sciences pathway. Like other exit surveys applied to Higher Education students worldwide to assess teacher performance, self-performance, or university services [
42], this survey evaluates university teachers in the same learning period and is always applied online. Differently designed surveys could be found for blocks, single courses, and even services. Its design is to promote the most number of student responses. It was applied with particular emphasis during the confinement period like many other initiatives worldwide (see [
43,
44]). This opinion survey has brought transcendent meaning to the institution to know students’ perception of their digital education because these outcomes are compared with previous outcomes of applications under the face-to-face methodology.
The precise questions or inquiries included in the survey are reported in
Table 2. Those elements in the survey are evaluated using a 0 to 10 scale, worst to best. The averages for the entire groups of students (
) are presented clockwise from the top in
Figure 6b for the Physics section. Together, the range of one standard deviation (
) is marked with dotted lines to exhibit the opinion dispersion graphically. Such limits do not have a statistical basis; no more in-depth attention will be put on the distribution. Instead, consider just the general meaning of the central tendency and dispersion measurements. Note particularly the large dispersion for questions (2), (5) and (6).
Table 2 includes as a comparison the outcomes corresponding to the 2019 survey.
Some important survey precedents are: the outcomes for the 2019 and 2020 applications are compared in
Table 2, the mean (
) and standard deviation (
). In general, the outcomes were higher and more consistent compared with the single previous face-to-face course in 2019 for questions (3) and (5). This fact could be explained by the new approach’s novelty and the complete set of resources prepared for several learning styles. The outcome in (3) could be explained because video-conferencing automatically requires distance compared with face-to-face contact. Dispersion in questions (2) and (5) about being challenged in the course and the general experience exhibits similar behavior but smaller dispersion. More discussion should be appointed to questions (4) and (6) referring to specific aspects of the DFM. Question (4) about accompaniment obtained a lower value (despite the teaching circumstances) than the perfect evaluation in 2019 but with a larger dispersion. Question (6), without a previous comparison point, exhibited the largest dispersion.
6. Discussion
Some aspects of the data, instruments, and analysis should still be aligned with the observations made. There should be an investigation if there are real differences in the performances in sections and, particularly, genders and if the learning elements as teamwork activities add value to the challenge development. Finally, an analysis of how the findings relate to the students’ opinion survey is needed.
6.1. Course Development’S Figures and Their Interpretation in the Confinement Context
The most notable behavior in the storyline presented in
Figure 3 is the drop off in attendance (7% on average) compared with the face-to-face course (2% on average), despite the final grade outcomes. The conclusion is that the students were committed to their responsibilities and reviewed the recorded classes when necessary. Furthermore, students were prompted to notify the teacher about possible absence through Remind. Only half the students did, but by tracking and matching the notifications with the absences, the other half of absences could be explained by factors such as: (a) health emergencies (55%), (b) service problems with electricity or internet access (37%), and (c) other priority diverse situations to attend (8%). These percentages derive from half of the 7% of total absences in the course period. In any case, many other institutions recommend a flexible attendance policy (see [
45]).
The high evaluations in questions (4) and (6) of the student opinion survey show the largest dispersions (possibly due to the impossibility of attending the tutored classes at the established times, even though the sessions were recorded). Question (6) recognizes the effort put into the students’ learning in the DFM course design (classes and tutoring). The Physics section’s effort to include additional videos of problem-solving and recording all video broadcasts and their posting on the VC page were viewed positively by the students. Additional videos and extra materials supported the challenge before the Computational Sciences’ teacher intervention, all of them managed mainly out of the Physics section’s class time.
6.2. Differences in Performances by Section and Type of Activity
Two primary considerations surround the course composition in four sections. The first one relates to the dispersion of outcomes in each section for individual performances and teamwork performances. Note for Math and Physics that the three higher quartiles are populated by students with individual task grades above 60 (
Figure 4b). The same is true for the Computational Sciences section, but the lower quartile does not include students dropping to zero in their grades. Math had the lowest grades, shown in
Figure 4b and
Figure 5. These facts reveal how some students could not dominate the more formal elements present in the Math and Physics sections at the end of the course. The Computational Science concepts are more practical than abstract. However, students took the most advantage of the Math and Physics concepts to resolve the Challenge, as observed in
Figure 4a. In teamwork, the teams improved their grades together, particularly in the Challenge section, which combined elements of the other three sections. The latter is one of the block’s primary objectives to provide Math and Physics skills in solving realistic problems [
32].
The second consideration to comment about the sections comprising relates to differences by gender in each section, a sensitive concern about female education opportunities during the pandemic [
46]. This issue is addressed in the next sub-section.
6.3. Additional Differences in the Performances: Type, Gender, and Section
This section revisits the differences by sections but now including gender as an additional discriminant in the analysis. Appreciating the Physics teacher, both genders became committed to the course (classes and work) without noticeable distinctions. Some of the students commonly turn-off their cameras (a behavior permitted in the course) and switch them on to ask questions or collaborate with their partners in teamwork time. Both genders practiced such behavior without loss of representation.
Differences suggested in
Figure 5 can be statistically analyzed. By considering the input data for those plots grouped by gender and section for each type of performance, two ANOVA tests for two factors were performed. ANOVA tests (in this case, a two-factor test) compare the mean value of groups extracted from some population as a null hypothesis assuming independence in the selection, normality, and equality in the variance, versus the differences in those parameters in the alternative hypothesis. Based on a
t-distribution to fit small samples, the current analysis fulfills this test’s premises [
47]. ANOVA tests are shown in
Table 3: (a) the upper part for individual performances and (b) the lower one for teamwork performances.
Note that only the individual performance
, so there is a meaningful difference among sections, not observed in the teamwork performance. Neither are differences by gender observed in any kind of performance. Those facts, then, are consistent with
Figure 5.
6.4. Evaluating Tec 21 Model in the Block under the DFM
As the institution’s primary interest is the DFM’s impact on the SBE in the course, then assessing this during emergency confinement is imperative. It is still one of the main interests for the author to assess course design decisions, but together with other punctual aspects emerging from the course’s digital delivery. Because the Challenge is an indicator of the SBE model’s success for the course as planned by the institution, this analysis focuses on it, then considers causal factors of some other performances emerging in the knowledge sections (Math, Physics, and Computation).
For the “before” purpose and focusing on the data in
Figure 6 and
Table 1, we performed a regression analysis to describe E dependence on
E, TW, and Ch variables. Two assumptions were considered (see [
47]). The first one is that functional dependence is parametric (the predictors have a concrete form in such dependence); otherwise, non-parametric dependence requires extensive data sets not available in the current situation. The second one is that the dependence is barely linear, justified because short ranges are considered for E (
in
Table 1). The dependence on those factors is expected to be partial (due to the complexity of the behavior), so this assumption is sufficient to justify an insight about it.
Thus, from the data in
Table 2, the adjusted square correlation coefficient,
for increasing sets of the assumed independent variables E,
, and TW was obtained. In that analysis, it was found that TW provided the highest
compared with other single elections. It becomes maximally increased to
by adding
(compared with adding any other two variables, one at a time). Finally, it increases to
when considering the three variables. Other order combinations reduce
. These computations show that the primary variable of explanation is TW, followed by
, and, lastly, E with a small contribution. For the complete regression model,
is obtained. Despite being small, it becomes meaningful to establish certain explanations [
47]. An expected outcome was then tested; a successful team in the single activities commonly predicts a good outcome in the Challenge resolution. A secondary factor (measured through the Examinations) is the skill dispersion in the team, notably more than the proper mean, E. Performing the associated ANOVA test [
47] with
for the multiple coefficients of correlation and the data shown in
Table 2 and
Table 4, we obtain
, thus indicating a clear underlying correlation.
Some aspects found in the analysis commonly escape teachers in the daily development and delivery of the class. Absorbed by their own sections, teachers can lose attention to their students’ success in the Challenge development (despite the expectation they should resolve it with little assessment and feedback). Nevertheless, the analysis showed some correlation between the Challenge performance and the sessions’ work, which, together with the students’ opinion survey, reflects the students’ need for broad accompaniment from the professors, even outside the sections they teach.
6.5. Summarizing the Relations between the Findings with the Research Questions
At this point, answering the research questions to some degree should be synthetically performed. This research’s main intention that the DFM effectively supports the Tec 21 Educational Model’s objectives for this specific Physics course has been verified. In SBE, knowledge acquisition is not the primary interest but rather, a growing ability to apply it to professional situations. In the analysis presented, the elements in the Math and Physics sections adequately support the development of the Challenge, even if some elements of specialized, theoretical knowledge would escape some graduating students. As the Tec 21 model states [
32], a growing mastery of knowledge and skills should be gained gradually, building on the various courses’ offerings in each pathway and program. Still, some attitude changes result from implementing the DFM in comparison with the face-to-face pedagogy. As has been shown, attendance and team dynamics changed. Student attendance in classes was still a considerable success, partially helped by the flexibility of recorded classes. Differences in the individual performances by section and gender were exhibited. However, more longitudinal research studies should be performed in this type of course as future work to draw concrete conclusions about the DFM’s impact on learning.
As stated, the consistent performance through the sections was disrupted. Math and Physics sections have disadvantages in the DFM despite the technological deployment to reproduce similar or better learning experiences than the face-to-face approach. A more extensive follow-up should be performed to reach conclusions about this. Nevertheless, for the Tec 21 Model, this aspect is being fulfilled adequately for its short-term goals. In this research, the course challenge offered across disciplinary sections and the quality or effectiveness of the DFM interactions was causal for the observed behaviors. For the Challenge development outcomes, the teamwork performance as the primary explanation for individual performance did not sufficiently correlate. Team member composition is notable because this aspect is sensitive to how teams internally organize themselves. Thus, a distance learning model could produce obstacles to organizing and optimizing teams. Unfortunately, this aspect was not included deliberately in the survey. In other research, the author has found this aspect crucial in the students’ opinion surveys (as reported by [
6]). More in-depth research should be performed for the current course and model to benefit similar DFM courses in the Tec 21 Model.
6.6. Relating the Course Design and Teacher Support with the Student Performance
The students’ opinion survey summarizes and sometimes highlights several blind spots exhibited through the delivery. Until the publication of the outcomes, each teacher is not entirely sure about students’ possible perceptions of the different issues surveyed. This fact intensifies under the DFM because the teacher does not have a close perception of hidden student behaviors.
Despite this, by comparing the outcomes in
Table 2, one sees that a similar or even higher impact on students occurred due to the course design, delivery, and teacher accompaniment. This phenomenon has been reported in the literature as social behavior [
48]. After such outcomes, there were several critical aspects identified for success in the delivery. These are discussed below.
6.6.1. To Prepare Several Channels for the Delivering
Include several delivery methods (live or recorded), several kinds of support materials (notes or videos), and several purpose materials (mandatory or supplementary). In the course design, those different methods were planned for different parts through the course objectives, and some were created ongoing.
6.6.2. To Keep in Touch
Keeping in touch with the students was an essential aspect for the teacher. In the face-to-face course during Fall 2019, students required much help to solve physics problems. Then, covering this aspect became a big concern for the teacher designing the digital course because the dynamics and delivery would be completely different. Thus, the idea to record the tutoring session, publish the lesson notes, and include additional problem-solving videos was considered in the class, and the idea to use several integrated communication channels (Remind, Canvas, e-mail, VC page, etc.).
6.6.3. To Consider the Learning Styles
This fact was essential to try to avoid students dropping the course. Thus, each class began with some illustrative videos of the theoretical concepts to be covered. Then, the theory was promptly presented, including the fundamental principles and formulas. Afterward, a series of problems were solved step-by-step, covering each study unit’s topics and increasing the complexity level. In parallel, other problem sets were recorded and included in the daily agenda with exercises to be delivered by the students working in teams to promote social learning. Then, the Rally before the Examination offered the opportunity to gain points for each problem correctly solved and additional points to the winners (those solving the most problems correctly and faster).
6.6.4. To Support the Challenge Resolution Creatively
The teacher prepared materials (notes, videos) to orient students to the challenge solution without losing challenge complexity. Instead, they engaged them with partial outcomes and simulations that gave them ideas to improve. Those materials were delivered during the Zoom sessions; others were recorded (but always introduced in the class, which was important).
6.6.5. To Keep Coordinated with Teacher Partners
The correct delivery of materials must be on time and harmonically support the other section teachers’ contents, remembering that Physics was the core course content and the complex product was the Challenge.
Definitively, those global experiences under DFM and the collaboration with other teachers to deliver the course, while integrating technological elements to achieve the course objectives, became a unique experience in recovering the learning and communication channels of the face-to-face approach (sometimes incorrectly), being clear about them. This perspective has established a new way to prepare the class considering complementary elements not previously used in the face-to-face approach. Most of the new materials could be combined in a new version of the course based on blended learning.
7. Conclusions
The current report presents an assessment of a Physics course under SBE for Computer Science students offered under a BL model necessitated by the COVID-19 confinement. Because the pandemic occurred during the second scholastic period (semester), the course had to be deliberately planned under an online, blended learning scheme. The original approach was to apply physical simulations that combined programming skills with physics knowledge. In the Tec 21 Educational Model, in which the course is embedded, three teachers collaborated to deliver four complementary sections: Math, Physics, Computational Sciences, and a Challenge (a dare to combine those disciplines in a product of physical simulation).
Throughout the COVID-19 pandemic, the block was delivered under a Digital Flexible Model (DFM), an approach to teach all the course contents digitally and employ the teaching strategies developed for it. The findings concluded that the students’ overall performance in skills development was well-balanced and attained Skill Based Education (SBE) goals. The teamwork in all four sections allowed students to develop relevant knowledge from each other uniformly. Despite this, students’ individual performances in the Math and Physics sections were lower than the applied sections, Computational Sciences and the Challenge. The student opinion outcomes for the teacher performance in the course design and delivery attained notably high notable values. Thus, some transcendental reflections about Education derived from the principal findings of this research are discussed below.
Regarding the first research question in the Introduction section, the effectiveness of SBE under the DFM implemented was validated. This evidence about the effectiveness of the author’s institution’s implementation of the planned DFM during the pandemic for non-traditional SBE was crucial. This finding’s value was to assess if its delivery was useful to promote the skill development planned. The use of a Challenge in the current course as a learning activity led to the acquisition of theoretical knowledge in the skill development terrain. It is a useful contribution for assessing DL schemes (particularly BL), having a notable impact on skills development, clearly observable and supported by the work’s analyses (see tracking such concern in similar schemes not under the pandemic conditions in [
8]). This analysis’s generalization or scalability to similar Higher Education courses is possible if the courses are oriented to SBE by including observable elements (such as a challenge). Our work had professional skills to be attained that were considered in designing the course delivery (Physics section here). It included the observable elements of a challenge resolution in the Physics section and supported by the Computational Sciences and Challenge sections. This was crucial, going beyond merely observing performance in the most theoretical contents, Math and Physics.
On another topic, the author believes that under the pandemic, each teacher has the responsibility to assess their outcomes and reflect on improving their actions in an accountability exercise (see [
49]). In that sense, this report’s contribution is to close the gap between digital education and employability education in Higher Education through a specific SBE program, whose premises do not automatically follow an alternative digital scheme. This course design attended to a student sector in technical Science and Engineering programs, a limitation toward generalizing this project. Furthermore, most participating students had an adequate technological background in the availability of devices, connectivity, and complementary services. Those aspects delimit the findings presented as an essential basis to strive for more ambitious goals. Other findings have also been identified in the overall digital experiences processes; they should be highlighted. Additionally, note that the form of the technological design solution is still a limitation in the current analysis (for example, combining video-classes with sporadic face-to-face interventions) because the guidelines for the DFM were introduced by the institution (mainly in the approach of using Zoom and conforming the section to the learning block) and were suddenly wrought by the pandemic restrictions.
As humankind, we learned more about Technology and Education in 2020 than in the previous ten years. It is surprising that just some years ago, ML seemed to have an uncertain future [
11], when today it has been the best solution for academic continuity during the COVID-19 pandemic. Possibly, if the educative sector had prepared itself to improve its learning approaches systematically, its current experience would be better. The author’s institution has done this in a big way, which played a vital success role in the study case presented here.
Other recent findings of the success of digital education point to aspects of physical and mental health, teacher attrition, access to internet services and devices, digital knowledge gaps, and others [
11,
50], which, in this case, became emergency concerns in already existing programs in the institution. In the current presentation, despite the socioeconomic level of students, those aspects were present in some students due to the entire complicated situation: parents’ loss of employment, several children in the family competing for devices and access, lack of appropriate digital learning spaces, continuous access to quality internet, a closer involvement in family situations during confinement, particularly health issues, and so on.
In a world where Education changes rapidly, becoming more complex and specialized, future education trends look to be a contest among several actors: society, industry, and academia moving toward a distant point still undefined [
50]. This approach considered that technology should serve a Physics course under SBE where three teachers in different disciplines come together to teach a group of students through distance education. The task became possible, thanks to educative technologies and the systemic boost given by the institution to update teachers continuously, as recognized by [
19]. In the author’s experience during the COVID-19 confinement, the mastery of apps and devices improved considerably despite the time demands of continuously developing BL in their courses. In any event, apart from those technologies, the teachers’ and students’ human spirit worldwide embraced technology as here to support our human activities, still in an imperfect stage for some, a promising stage for others. It depends on us, the capitalization we get from this crisis, both at the personal and country levels. What do we do to improve this experience?
As teachers, we have changed our minds or not about the effective use of technology and the contributions brought about by the COVID-19 pandemic, significantly adapting our teaching style to new modes of teaching. In the end, each teacher must be comfortable in their design, being effective in improving their students’ learning. It would be regrettable if we forgot everything we learned in 2020, just returning to the comfort of our face-to-face courses, using our old teaching versions. Face-to-face courses under the new-normal or the normal should become enriched by this experience. Certainly, the materials, technology, and activities developed or created for this contingency remain valuable under a blended learning scheme [
4].
The same is true for educational institutions. To construct the approach shown in this report, the educators invested lots of hours to create repositories of examinations, problem-solving videos, the VC page, and other supplementary resources to support the students’ learning. Such preparation became very exhausting, as it has been pointed out in the various experiences around the world [
51]. COVID-19 served to hasten learning to use technology and applications and provided a rich exercise of real educative design and curricular construction [
52,
53]. Those resource materials could have a long-life, with or without the COVID-19 pandemic. Then, definitively the effort has been made with absolute durability. We have also learned, teachers and students, to move Education forward to a more flexible, digital, and responsible realm.
For some institutions and its teachers, the last years’ investment has returned its value during the COVID-19 pandemic. It has also allocated us to new levels of course orientation: based on skills, research, traditional teaching, etc. In the current context analyzed, the teachers and the institution were clear about the resources, approaches, and technology necessary to construct a strategy to react quickly in the best possible way. The students in this study also commonly had adequate resources and services to fulfill the online course requirements. Nevertheless, every teacher must resolve other ongoing issues. For instance, in the initial part of the confinement, the author taught a Numerical Methods course, which was easy to implement due to constructing a BL approach for it over several years. For the current experience in the Physics section, other new elements were present, the main one, how to present calculations digitally in a fluid way? The technology was there, but still, hours of preparation had to be invested in arriving at an adequate solution, which also still required additional resources and advice.
Like, technology, Education will continue evolving in the next years. The COVID-19 pandemic has sped up humankind’s knowledge about alternative and improved ways to deliver education. Nevertheless, during the pandemic, others experienced variables such as battles against government or administration over policies and inertia from countries, educative councils, or schools [
15]. In comparison, the internet is evolving into faster and more powerful versions. In 2015, one-half of the world had access to the internet; in 2020, during the COVID-19 pandemic, this fraction barely reached 60% [
54]. The remaining number of people without internet access is still large, worrisome when considering a worldwide event that necessitates it. Unfortunately, such an event is warned in several possible scenarios in our immediate future (see as an instance the analysis presented in [
55]), thus making urgent the need to capitalize on the experience of Education during the COVID-19 pandemic. The future of Education for each teacher, school, and country was here, among us, in 2020. Our next decisions will determine our level of participation in the further evolution of Education.


