1. Introduction
Smart factories and smart manufacturing are some of the important emerging smart cities’ applications. Objects, products, systems, processes, services, and things in general terms are utilizing the emerging technologies such as Internet of Things (IoT) and cyber physical systems (CPS) to monitor their lifetime cycles. Nowadays, a product can be equipped with a mini microcontroller with a set of sensors and actuators along with internet connectivity that empowers manufacturers and users to track it from anywhere at any time. Industry 4.0 coins such product as a smart product.
A smart object, product, system, and process consists of both a physical part and its complementing digital counterpart, also referred to as virtual and cyber part, and more recently referred to as its digital twin. NASA [
1] describes digital twin as a simulation of a system or product mirroring the physical model into a virtual model, i.e., a highly detailed simulation model replicating physical semantics and behavior of a system into a flying twin. Although a lot of work has been steered in the direction of digital twin in various applications, a holistic, end-to-end conceptual model of a digital twin is yet in early stages of development. The creation of a digital twin model consists of several stages such as dynamic data collection from mobile sensors, data communication, real-time data simulation and modeling, machine learning and data analysis, visualization and business intelligence, and security. Although a lot of work has been done in each of these stages in isolation, there is a lack of interconnectivity between these stages for designing a digital twin model that presents the impact of each stage for a digital twin in a holistic manner.
The rest of the paper is organized as follows.
Section 2 elaborates on the related work and proposes an end-to-end conceptual model for digital twin. The physical space layer is presented in
Section 3.
Section 4 presents the communication network layer followed by virtual space layer in
Section 5, the data analytics’ visualization layer is described in
Section 6. Application and security layers are discussed in
Section 7 collectively. Two use cases are proposed in
Section 8 and followed by the conclusion in
Section 8.
2. Literature Review
The induction of digital twins began with the aviation industry before escalating in the manufacturing domain. A number of manufacturing-, power grid-, and consumer electronics-focused corporations such as Tesla, Siemens, and General Electric are adopting the digital twin concept for their consumer products and their products’ life cycle management during manufacturing and operation [
2]. In [
3], the authors developed a methodology to capture real-time sensor data from cyber physical systems technologies communicating current status of factory objects to the object’s real-time digital twin model. Based on this model, the users can monitor the current status of a factory’s objects. In [
4,
5,
6,
7], the authors have provided a comprehensive review and survey on different characteristics and applications of a digital twin and its increasing demand in Industry 4.0 manufacturing technologies. The potential need for a holistic framework and architecture that links the physical object with the virtual (digital) instance of the object is presented.
In [
8], the authors proposed the initial stages to mimic a digital twin model for smart farming, which is only feasible when multiple systems and processes involved in smart farming are orchestrated together. Similarly, a use-case scenario for implementing digital twin in laser welding manufacturing technology was presented in [
9]. Limited work has been done focusing on a complete modular architecture of a digital twin in the context of Industry 4.0 that leverages the data from the physical layer followed by lightweight protocols for communication, edge processing, modeling, and 3D visualization [
10].
With the rapid evolution of the Internet of Things, the concept of “smart objects” is also emerging as a valuable asset to IoT applications as it can leverage the large amount of data and services provided by the mesh network of IoT devices. A ‘smart object’ is empowered with the ability to sense the physical world events and human activities and interact with the users based on the user input to make control decisions [
11]. The surrounding environment is integrated with smart objects, sensors, and a network of intelligent systems. These smart objects are capable of making optimal decisions and render customized IoT services in anticipation of the requirements of the nearby visitors or inhabitants [
12]. In addition to a digital twin communicating with a physical object in real time, these digital twins can also be designed similarly to a smart object in order to be more adaptive and aware in close interaction with the surrounding environment and human activities with the help of ambient intelligence.
It is worth mentioning that most of the existing work and models do not efficiently incorporate the application, features, and design framework for an intelligent digital twin model, which is important for realization of an autonomous cyber physical system. With the help of current IoT technologies such as 5G cellular communication, data analytics, artificial intelligence, machine learning, and cloud computing, a digital twin can be revolutionized to understand how the products and machinery are performing in real time and to make fast and accurate predictions for the future as well as detect potential failures.
The proposed work is different from the existing work because it proposes an end-to-end conceptual model for a digital twin. On the other hand, most of the existing work on digital twins has focused only on the simulation aspect of the digital twin for emulating the mechanical process and the physical component of a machinery in the virtual layer of the architecture or the cloud. The proposed conceptual model incorporates different communication technologies and machine learning algorithms as well as security for simulating a digital twin. These layers are essential for seamless integration of data in real time from the physical layer up to the application layer encapsulated with a security framework for predictive maintenance. For example, our proposed digital twin model was used during the manufacturing and operation. In other words, the proposed digital twin collects the product’s real-time operational data and surrounding environment parameters. For example, while a vehicle is on the move, our proposed model can collect the real-time operational parameters of the vehicle such as speed, anti-lock braking system (ABS system), and wheel pressure. Another example is that it can monitor the vital signs of a human while he/she is on the move. Other existing digital twins deal with static objects, while ours is dealing with static and dynamic objects.
A digital twin can be coupled with data analytics and spatial intelligence graphs that capture interaction and communications between people, physical equipment, sensors, and devices to bring out the best possible business insights.
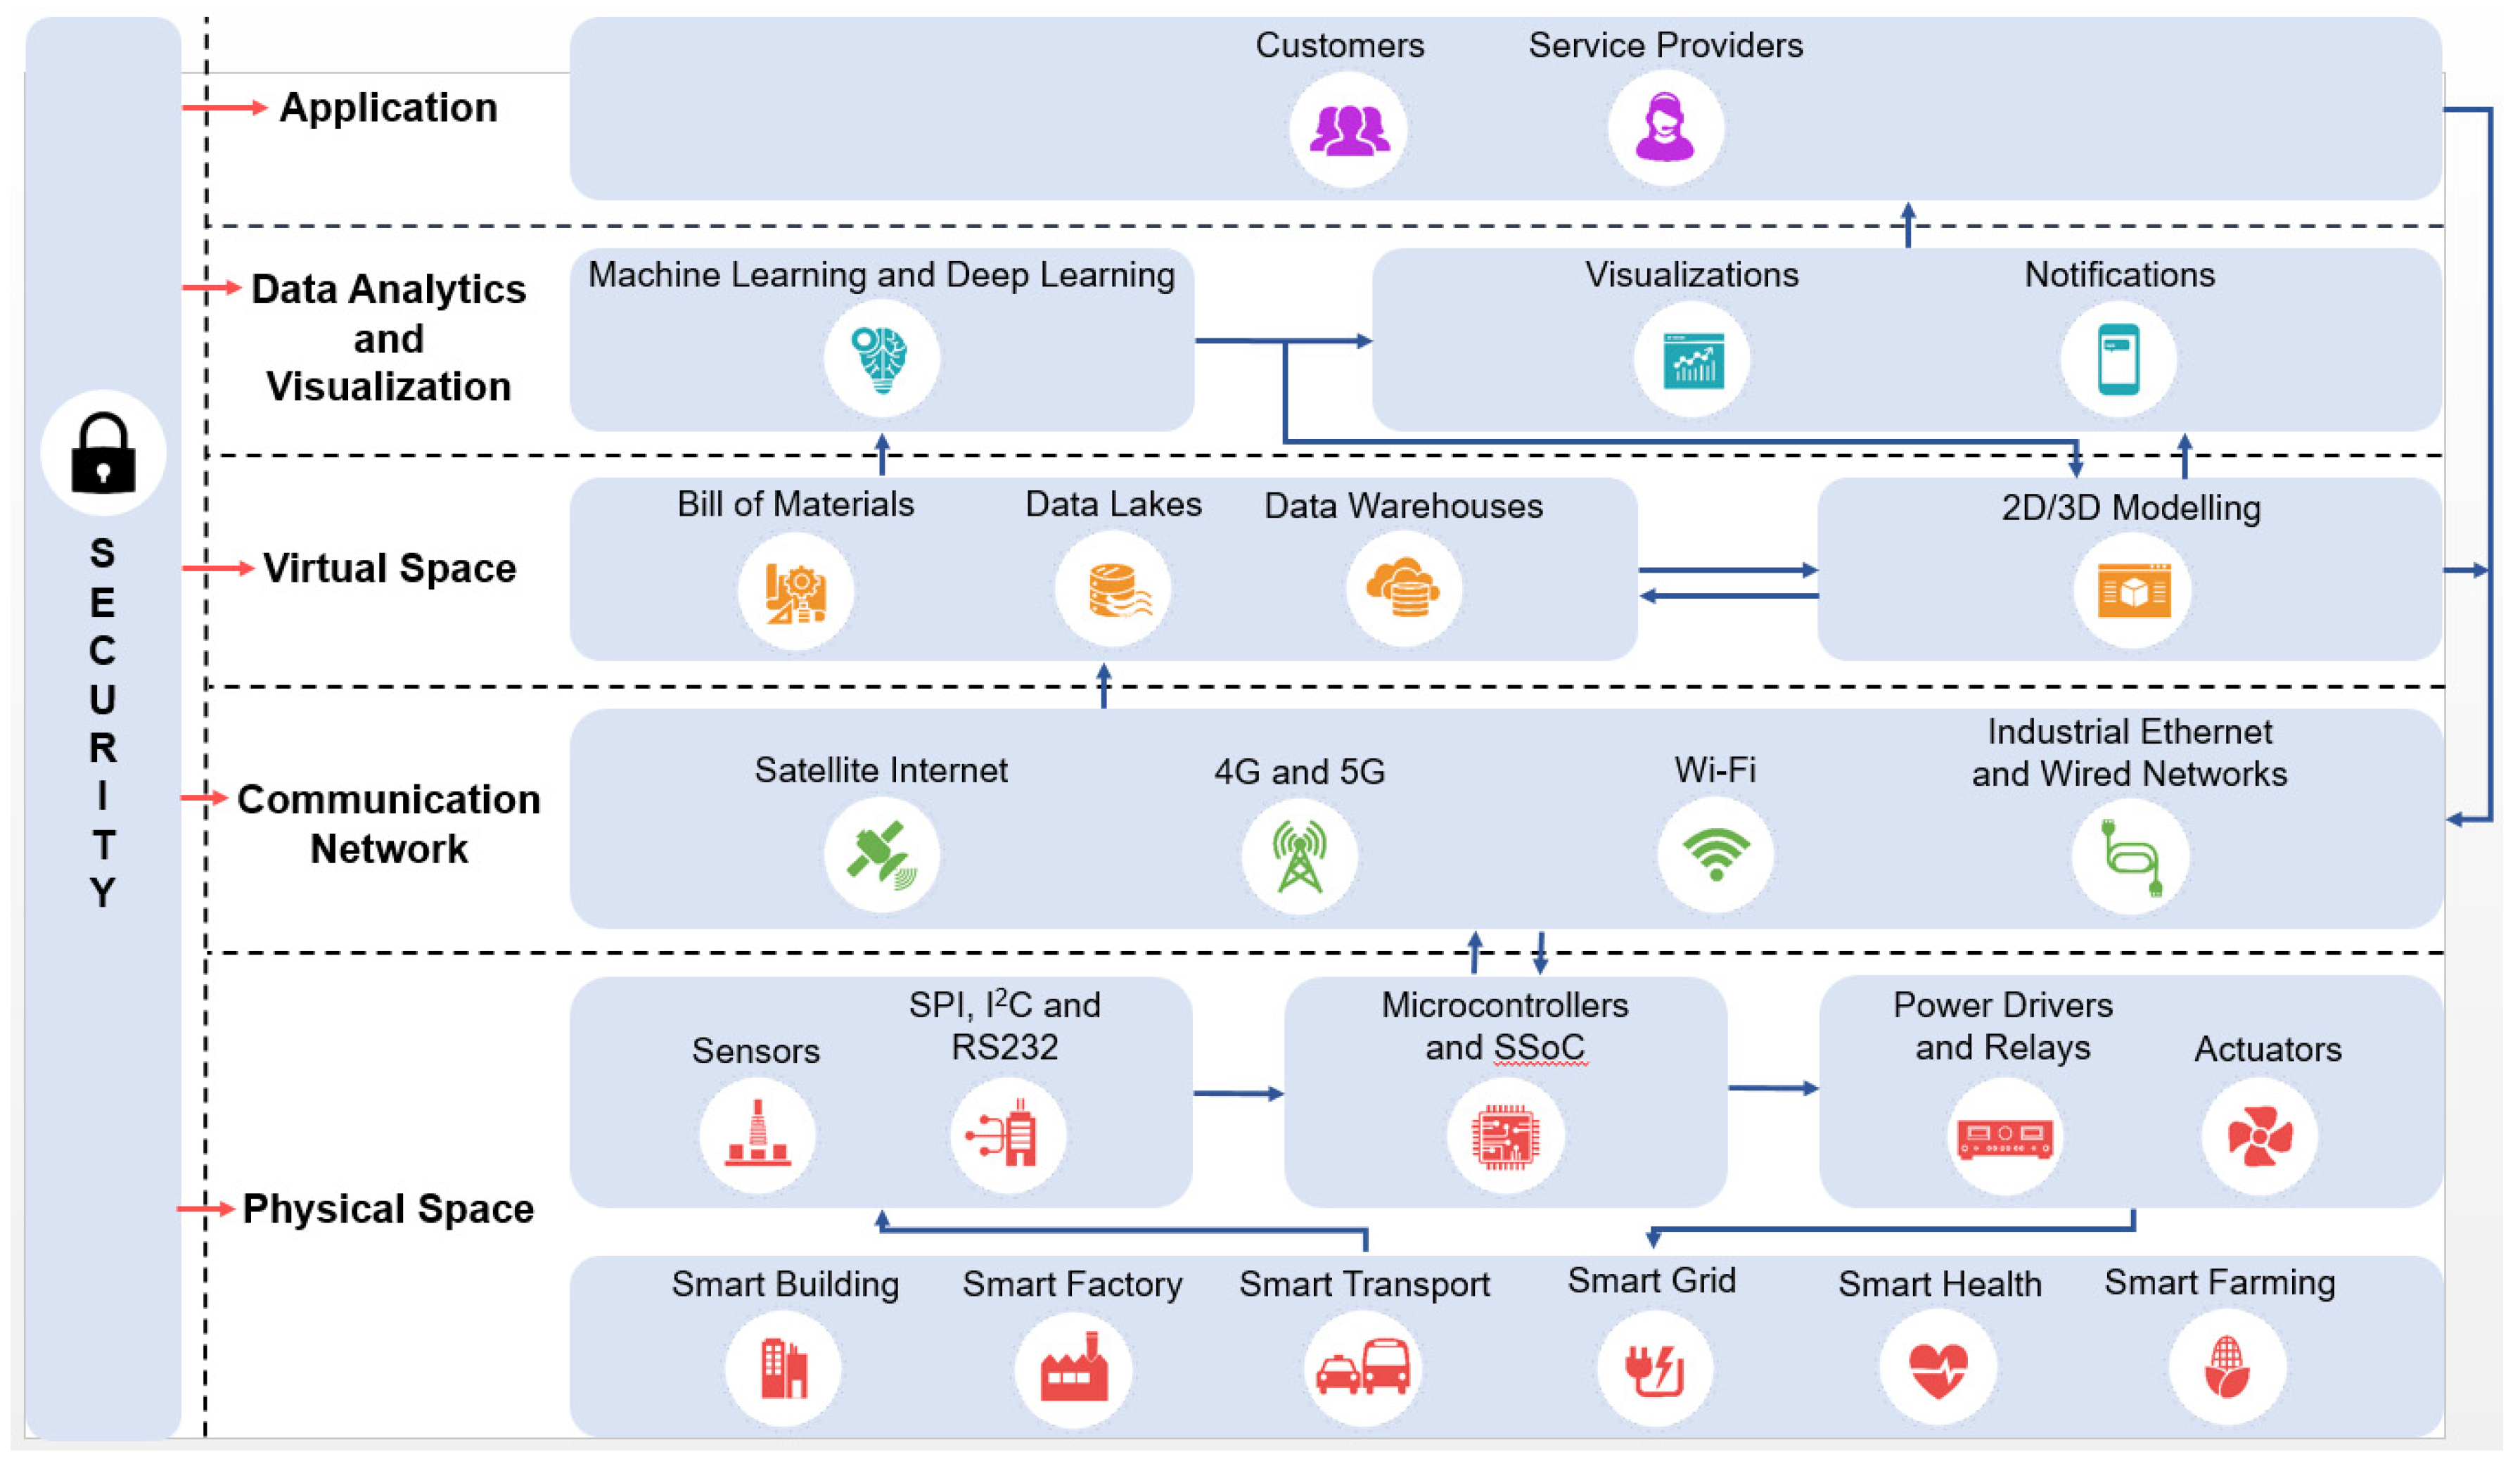
Figure 1 shows the proposed end-to-end conceptual model for a digital twin. The physical part of an object and its digital twin complement each other and can be modeled by several layers: Physical space, communication, virtual space, data analytics and visualization, and application layers, as well as a security layer that overlaps with all previous layers. The product’s data such as its operational status and surrounding environment parameters are collected by an edge computing device. This data are transmitted to cloud-based services or enterprise computer centers to be augmented with the pre-stored data of the product such as its bill of material (BOM), historical data, and 2D and 3D models. Using all this data, processing, analyzing, and data-mining algorithms are implemented for the purpose of early warning, schedules, and predictions, dynamic optimization, visualization, and action on the physical object.
3. Physical Space Layer
In the context of IoT and Industry 4.0, any object, product, or system consists of two spaces: The physical space and the digital space. This section describes the basic building blocks of the physical space. The physical space layer (PSL) consists of the physical objects, sensors, signal conditioning circuits, edge computing devices, power driving circuits, and actuators. The sensors collect the physical object’s operational and surrounding environment parameters. The sensors convert the object’s non-electrical phenomena into electrical signals after which the signal conditioning circuit shifts, scales, and/or amplifies these signals to be compatible with the edge computing device’s digital, analog, and serial communication ports.
Once the parameters are collected, some local decisions are made (with the aid of the edge computing devices) to command some actuators through the driving circuits to operate based on a process algorithm. Furthermore, selected object operational and surrounding parameters will be transmitted through the communication layer for the purposes of data storage and processing in the above layers. The edge computing device, single system on a chip (SoC), could be a low-cost, low-power, compact, stamp-sized microcontroller [
13] or a credit card-sized microcomputer [
14].
These edge computing devices are equipped with high speed CPU’s, a large program and data memory, gigabyte Secure Digital (SD) storage, and large number of digital and analog ports. Furthermore, they also have wired communication ports, such as RS485, I2C, SPI, USB, and CAN. Moreover, they contain proprietary ports such as cameras, GPS, keypads, and LCD. Additionally, wireless access points, Ethernet ports, GPRS, and Bluetooth ports are also available on these devices. In addition to the sensors, signal conditioning circuits, and edge computing devices, there are driving circuits such as power amplifiers, relays, silicon-controlled rectifiers (SCRs), and triodes for alternating current (TRIACs) [
15]. These driving circuits provide the interface between the edge computing device’s output ports and the physical object to be actuated according to the process algorithm. Some of the edge computing devices and microcontroller/microcomputing units have add-on hardware on the top (HAT) [
16]. These add-on boards have several sensors that can be interfaced with the edge computing device. Each of these HATs have open source software libraries that can be included and invoked in the user program to configure and collect data from these sensors.
4. Communication Network Layer
The communication network layer (CNL) is the second layer of the digital twin model, implemented right above the PSL. The main purpose of the CNL is to effectively transmit/receive the data collected by the sensors (which include the operational and environmental parameters)/actuators, as well as the edge-computing processing results, to the higher layers for further processing and analysis, as will be elaborated in the next section. In other words, the communication layer is essentially the ‘bridge’ that connects the physical space with the cyber/virtual space. As the virtual space cloud or enterprise services may not necessarily be in the same geographical location as the physical space, the digital twin specifically needs large area wireless networks for its communications systems. These include mobile communications technologies and satellite communication networks.
Mobile communication networks have been around for decades, starting with circuit-switched first-generation (1G) network, which allowed voice transmission of speeds up to 2.4 kbps. In contrast to 1G, 2G network stepped up from just voice transmission to further include the facilities of Short Message Service (SMS) and Multimedia Messaging Service (MMS). The 2G network offered data rates of 64 kbps and a bandwidth that ranged between 30 kHz to 200 kHz. Next, the mostly packet-switched 3G wireless technology provided users with broadband-like internet access while on the move. The 3G has data rates of 2 Mbps for stationary users, 384 kbps for low-mobility users, and 144 kbps for high-mobility users, along with a bandwidth of 20 MHz [
17]. The digital twin has certain network requirements that must be met in order to be fully functional. As large amounts of real-time big data are being gathered from potentially hundreds of sensors at a time, a high bandwidth and high data rate are required to relay them all at once to the virtual space layer above. Moreover, after all necessary analysis and insights have been performed by software technologies in use, the results must be communicated back to the PSL, for instance, to the actuators, with no perceivable delay. Thus, a successful implementation of the digital twin also demands a very low latency. Another important factor to consider for the digital twin is the network and scalable capacity of the communication technology. In other words, a single base station should be able to hold as many simultaneous connections as possible (network capacity), and increasing the hardware components of the communications system should result in a significant improvement in the network (scalable capacity), so that the digital twin can collect as much data as possible and be spread across the entire product or manufacturing process.
The aforementioned mobile communication networks are not nearly sufficient in meeting the demands of the digital twin, hence, 4G and (more importantly) 5G networks must be considered for the implementation of the digital twin.
- (1)
The 4G Cellular Network
The 4G is the first communication technology to be purely packet-switched and provides users with an ultra-broadband experience. Facilities such as multimedia applications, video conferencing, video calls, and high-definition (HD) streaming were achievable with smooth connectivity. The 4G offers data rates up to 100 Mbps for outdoor environments and one Gbps for indoor environments. The 4G networks have a latency of 100 ms; however, the available bandwidth provided by 4G has not changed from the previous generation and is still 20 MHz. The 4G base station systems boast an increased coverage of 31 km. The 4G networks have a scalable capacity of 50 to 500 bits/s/Hz/km
2. In addition, 4G is the first large area wireless network to support vertical handoff (allow a moving user to switch between 4G to other networks and vice versa), whereas all previous generation networks have only supported horizontal handover [
17].
- (2)
The 5G Cellular Network
The 5G technology is to be completely launched by the year 2020. It is a leap from 4G technology as it will provide a bandwidth of 1 GHz and data rates up to 10 Gbps. Furthermore, 5G networks will have a latency of less than 1 ms and a scalable capacity of 50,000 bits/s/Hz/km
2. The 5G networks will have the ability to support nearly 65,000 connections at any given time. These features will enable applications that are time sensitive, such as real-time communications, with great precision and accuracy. Since 5G technology will operate on the radio frequencies of 28 GHz and 60 GHz for increased bandwidth, it is utilizing the millimeter wave (mm wave) technology. However, millimeter waves are highly susceptible to interference and cannot travel long distances without significant attenuation. Hence, base stations for 5G must be placed no more than 200 m or 300 m from each other, but these base stations will be much smaller than traditional base stations of earlier generation communication technologies [
18].
Table 1 shows some of the important parameters of the abovementioned communication networks.
5. Virtual Space Layer
The virtual space layer (VSL) consists of two sublayers: Data aggregation and data modeling. The data aggregation layer collects in-network sensor data from the underlying sensors communicated via the CNL layer for further storage and processing. The data modeling sublayer creates dynamic 3D models of the physical object or system, based on the present data available in the data aggregation sublayer.
5.1. Data Aggregation
The data aggregation sublayer involves the aggregation of the operational and environmental sensor data received via the CNL, as well as historic data of the physical object or system, its design specifications, and bill of materials (BOM) so that it may be used by the data modeling sublayer and the layers above. Data received can be of three types: Structured, semi-structured, and unstructured.
Table 2 provides examples of each type of data based on the context of the digital twin. Aggregation of data can take place either on the enterprise premises or on the cloud platform. The aggregation step is essentially ingesting the data sent over by the PSL as well as pre-existing data of the physical object or system, which must then be transferred to infrastructures of databases, called data repositories.
Two types of data repositories that can be used for the digital twin are data lakes and data warehouses. Data lakes, often called “schema-on-read”, store structured, semi-structured, and unstructured data in its raw form, i.e., its form prior to being stored in the repository, tagged with metadata. Data lakes scale easily at a reasonable cost and, hence, are ideal for fast storage of massive amounts of data. The information in the data lakes will only be structured once they need to be used for further operations such as analysis. Data lakes are usually a combination of different technologies such as databases (SQL and NoSQL), cloud storage (Amazon S3, Microsoft’s Azure Storage, Google Cloud Storage, etc.), and Hadoop Distributed File System. On the other hand, data warehouses can aggregate data over multiple sources like data lakes; however, the data must be organized and structured before storage, which means they are “schema-on-write”. Hence, data warehouses contain data that are easily analyzed when accessed. Some popular vendor tools for data warehouses include AWS Redshift (Amazon, Washington, USA), Google Big Query (Mountain View, CA, USA), Azure SQL Data Warehouse (Redmond, WA, USA), Oracle Autonomous Data Warehouse (Redwood City, CA, and Snowflake (San Mateo, CA, USA).
In the context of the digital twin, data lakes can be used for the rapid, real-time storage of operational and surrounding environmental sensors’ data, which can then be structured according to the provided schema and stored in the data warehouses in non-real time.
On the other hand, data warehouses can contain the previously attained historical data, design specifications, and BOM. The information stored in these two types of data repositories will be used to create dynamic 3D models and for further analysis by the layers above.
5.2. Data Modeling
The data modeling sublayer builds dynamic 3D models of the physical object or system that is being monitored. As the physical object is going through changes, the sensors in the PSL capture them and send them to the virtual layer, specifically to the data aggregation sublayer, where it is stored in data repositories. The data modeling sublayer will then read the updated data from the data repositories and dynamically create 3D models that take new data into consideration and reflect the current state of the physical object or system. Additionally, the model is extended with the physical information and temporal and contextual aspects of the machine relative to its operating environment such as the status of the machine, location, temperature, pressure, movement, process flow, and energy consumption. This builds the model to be more dynamic and robust in close interaction with the real world. The 3D modeling software that creates models and maps programmatically is particularly useful for this purpose. There are many programmatic modeling software types available, such as Google Sketchup [
19], where the modeling process can be automated using the Ruby API. Another option available is Simio Simulation Software [
20], which builds base 3D models of the physical object or system using design specifications, BOM, and historic data, and then dynamically updates the model based on sensor readings from the PSL.
6. Data Analytics and Visualization Layer (DAVL)
Once the data is available at the VSL, the DAVL can access the data repositories to mine the data and report results to management. The aim of data mining is to assess the condition of the physical object or system and predict possible failures and maintenance requirements for the foreseeable future.
The digital twin of a system, product, or process can be used efficiently to monitor and remotely manage the physical item using data analytics and business intelligence tools and technologies. It allows programming maintenance schedules, load balancing, and predicting failures and disruptions. Using the digital twin model, design specifications, and BOM data, we can construct the raw data available in the VSL into a knowledge base that reflects machine health and operational performance. This will transform the digital twin into a data-driven digital twin model in which the operational parameters of machine sensors or machine components have to be rectified or adapted continuously in the operation stage of the manufacturing process. Additionally, using advanced machine learning algorithms and data analytics, we can integrate real-time streaming sensor data with other operational inputs to create an operational data-driven digital twin. This operational digital twin will provide a more holistic and dynamic virtual representation of the whole manufacturing system, end-to-end processes, and operations. Thus, these analytics are important to be combined with a digital twin in order to reduce system downtime, improve production efficiency, and perform predictive quality maintenance.
The data analytics sublayer involves two main tasks: (1) Perform relatively complex computations on the sensors’ big data that could not have been achieved through edge processing and (2) employ machine learning or deep learning algorithms to predict the condition of the physical object or system in the foreseeable future. First, based on real-time sensors’ data, historic data, BOM, and design specifications, a classifier can be built utilizing supervised machine learning or deep learning algorithms. These techniques are further elaborated as follows.
6.1. Complex Tasks that Include Data Cleaning and Processing
Some of the data wrangling and pre-processing techniques subjected to a multi-variate sensor data set involve outlier detection, smoothing/discretization, feature extraction, data reduction, and imputation (omitting missing values) from the raw sensor data. Smoothing on sensor data is crucial for eliminating outliers before fitting the data into a machine learning model. Many discretization approaches have been discussed in the context of sensor data. Discretization is based on defining sensor values into nominal values based on a predefined interval of their respective threshold values. For instance, equal frequency, equal width binning, entropy minimization, and Boolean reasoning are some examples to perform discretization on sensory data. Discretization is important because most of the data mining algorithms, such as k-means clustering or naïve Bayes classification, require nominal or categorical data values instead of continuous data for training the model [
21].
Attribute reduction methods such as principle component analysis (PCA) can be instrumental in data transformation into an independent set of attributes. Additionally, it is useful for selecting sensor attributes that reflect the most variation, thereby reducing complexity in a strongly dimensional dataset while still preserving the trends and patterns.
6.2. Supervised Machine Learning Using Classification and Regression Techniques on Sensor Data
Supervised machine learning is largely used in industrial automation since it has a prior knowledge of input data and target labels that are instrumental in performing predictive quality analytics, root cause analysis, etc. A potential use case for applying classification algorithm is to detect component failure via labels of failure vs. no failure in the sensor readings. Common classification algorithms include naïve Bayes, logistic regression, k-means classification, random forest, support vector machines, and artificial neural networks. Using one of these classification techniques, predictive maintenance using multiclass classification can be conducted since there are multiple causes that can be attributed to a potential failure of sensors or machinery component [
22]. Another important supervised machine learning (ML technique is regression to predict future sensor readings. Using the regression techniques, remaining useful time (RUL) can be estimated for a sensor/machine component, i.e., the number of remaining days before the next failure.
The artificial neural networks (ANN) is a very significant machine learning algorithm that is loosely based on analysis of the human brain modeled as a network of billions of neurons. Since sensor readings are highly dimensional in nature sampled over a small frequency, ANNs are highly suitable for sensor data that contain multiple distinctive parameters over a large time span. Using ANN technique, if the interdependence between the sensor readings is sufficiently strong, the sensor readings for dysfunctional or lost sensors can be predicted from the remaining ones.
7. Application and Security Layers
A large amount of data transmitted to the virtual space digital twin is inherent in a manufacturing process. This data can significantly help in improving the production efficiency, manufacturing flexibility, and visibility. This data can be turned into actionable insights with the help of manufacturing business intelligence tools and techniques that record all the activity for each machinery component and/or sensor. For example, the collected sensor data can be analyzed to provide predictive maintenance recommendations to reduce the machine downtime. Additionally, digital diagnostic and analytic results in VSL can be synthesized into meaningful dashboard charts, graphs, and reports. These dashboard reports can help identify important key performance indicators (KPIs) that are vital for industrial automation decisions and forecasts by different stakeholders. Different alerts and notification systems can be automated based on the processed results to empower the stakeholders to act quickly for addressing the underlying issues with the sensors/machinery component/system. Additionally, these reports can be further analyzed to determine weakness in the production with respect to design specifications and take necessary measures to mitigate them for the future. Depending on the application domain implementing a digital twin, it can add tangible value and answer key strategic questions for a variety of industries. One such use-case example of the automotive industry utilizing the proposed end-to-end conceptual model for digital twin is discussed in
Section 8 of the paper. Another use-case example for application of proposed end-to-end conceptual model of digital twin in smart healthcare monitoring for mobile patients is in the scope of future work.
As the digital twin’s technology is becoming a strategic disruptive trend that is digitally transforming industrial and manufacturing industries, it is also attracting the interest of cyber attackers. Just like any smart technology, digital twins can contain vulnerabilities and encounter attacks at their various layers. Security is unfortunately overlooked in new technological trends. Therefore, organizations must be fully aware of the potential vulnerabilities and threats and be proactive in implementing the countermeasures.
Each of the used layers in digital twins can be vulnerable to various attacks. Attacks on the physical layer include physical attacks against the used sensors, which include damaging, replacing, and stealing the sensors. Solutions for sensor authentication and validation are needed to ensure that the original sensors are not tampered with and are producing reliable data. Attacks on the communication layer include disrupting the service via denial of service attacks in addition to packet injection, sniffing, hijacking, and spoofing. This can impact the large, generated volume of real-time data that is collected and being transmitted to the digital twin. The transmitted data have to be secure and trusted with the use of cryptography. Firewalls, antivirus, and intrusion detection systems must be deployed to protect the system from external and internal attacks. Attacks against the application layer include buffer overflows and authentication attacks. Strong authentication methods should be deployed. Software needs to also be carefully developed to meet the quality and security requirements. Software hardening employs various techniques to make the software resilient to cyberattacks. Attacks against the data analytics layer include data manipulation and the alteration of analytical algorithms. Secure transmission and data encryption are needed to secure the data. Data should be validated for correctness. Vulnerability assessments must be regularly performed to secure the system. Users need to better understand the cyber security threats and vulnerabilities and help make the system resilient to cyberattacks. Organizations must implement security from the ground up, while understanding the security measures implemented at each layer.
8. Use Case
In this paper, we will take a case study to demonstrate an application of digital twin model in smart transportation. A high-level framework of sensing, communication, and control between the physical and virtual space of a vehicle is represented in
Figure 2. As shown in
Figure 2, we have referred to different physical sensors such as camera, radar, gyroscopic sensor, GPS, tire pressure sensor, speed sensor, and sound sensor for the automobiles to capture real-time parametric values from the vehicles and communicate them to the virtual space layer in real time. The virtual space layer will communicate efficient control decisions to actuate the ABS, vehicle’s speed, steering control, and motion planning.
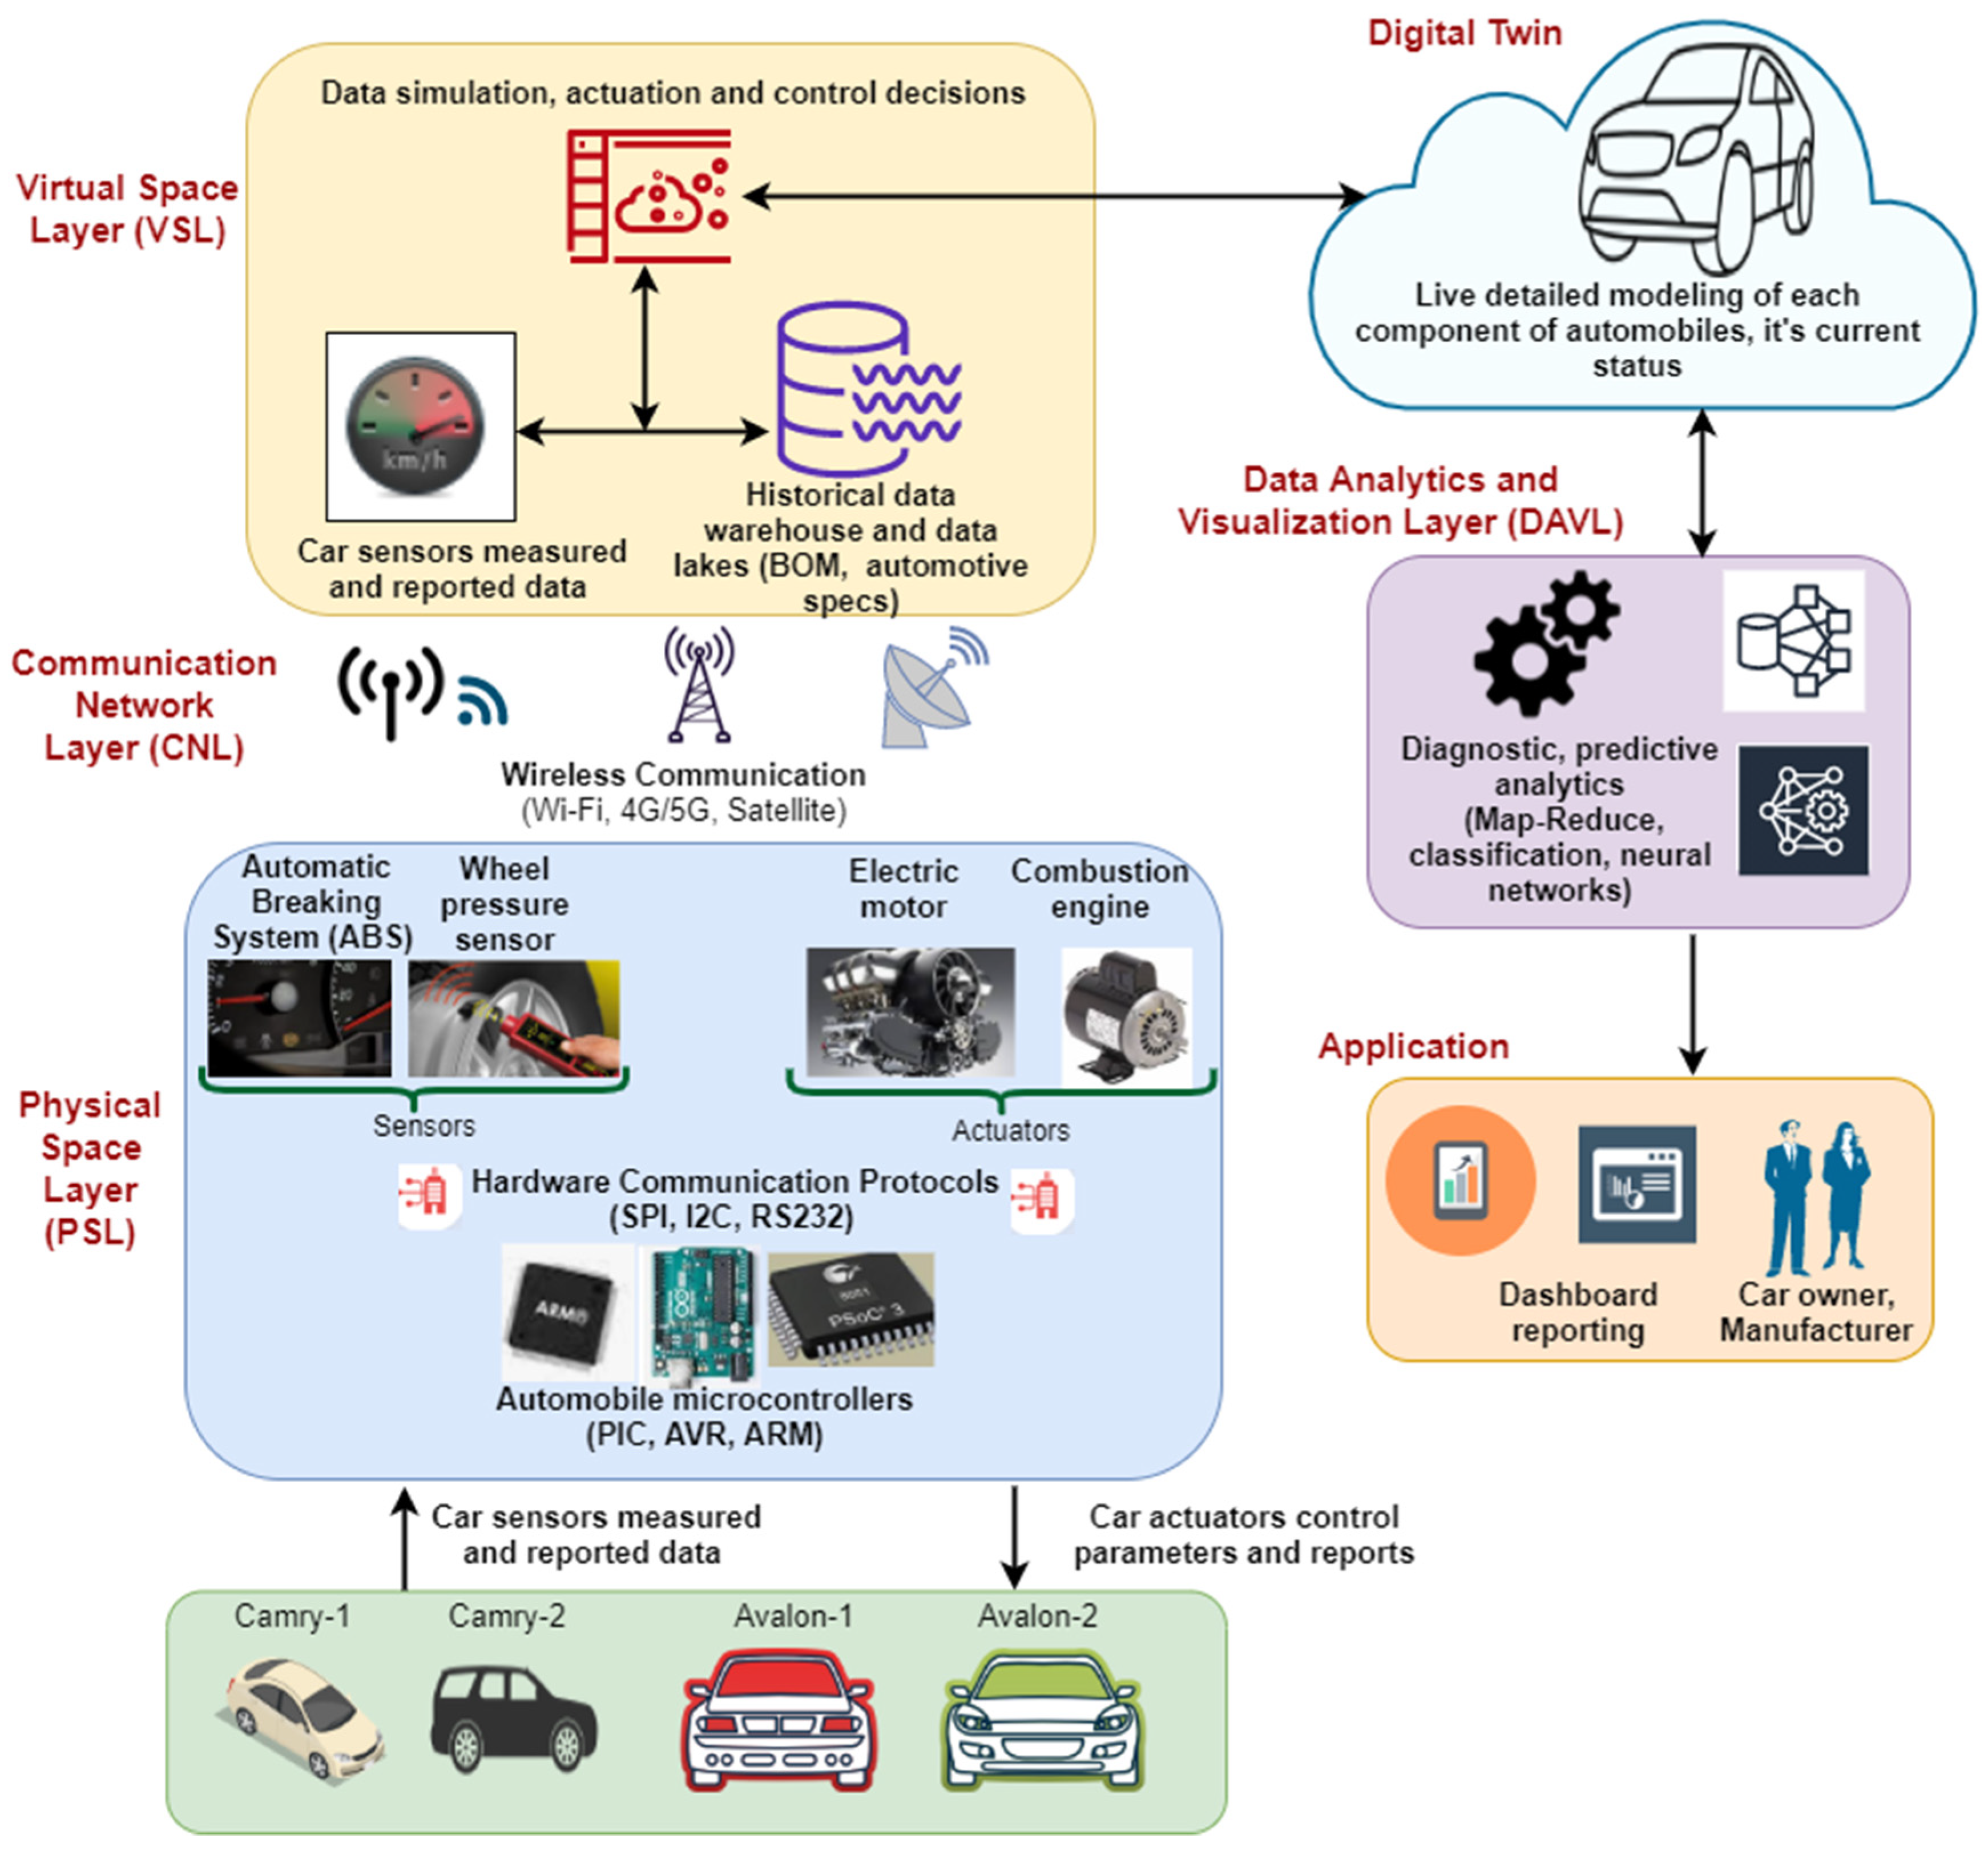
To further elaborate on the proposed end-to-end conceptual model of a digital twin in the context of cars, assume that we have four different types of cars of two models, namely, Toyota Avalon and Camry. The system collects a set of physical parameters from the cars while they are on the move: ABS, transmission, mileage, and tire status from the on-board car sensors. The vehicle’s 2D/3D models, bill of materials (BOM), and historical data are stored in the virtual twin in the virtual space layer, as shown in
Figure 3.
In the data analytics and visualization layer of the end-to-end conceptual, model as presented in
Figure 3, complex big data analytics and ML processing algorithms are conducted to perform automated decision making based on real-time, measured sensor data from the cars and historical data. The data are stored on an off-the-shelf, high-end cluster designed using commodity hardware such as Hadoop Distributed File Storage system (HDFS) consisting of multiple data nodes distributed geographically.
One such example is of a MapReduce processing algorithm, as shown in
Figure 4. This algorithm comprises four distinct stages, i.e., splitting, mapping, shuffling, and reducing. The functions associated with each stage are discussed as follows.
- (1)
Splitting: This involves the logical division of data across cluster nodes in accordance with the parameters/sensor readings as measured by different automobiles. For example, data node 1 of the cluster stores the ABS status for all the cars, the data node 2 stores the transmission parameter for all, the data node 3 is responsible for storing the tire status, and data node 4 stores the mileage covered with respect to each car.
- (2)
Mapping: In this phase, the data split across each cluster are sent to a mapping function to return an aggregated value for each type of car model with respect to a specific parameter. For example, the mapping function in data node 1 returns an aggregated output for ABS for each car’s model (Avalon and Camry). Similarly, mapping function from other data nodes returns the sum of transmission, tire status, and mileage values for each model of the cars.
- (3)
Shuffling: In this phase, multiple outputs from the mapping stage are consolidated and relevant records are clubbed together, according to their respective car model. For example, different parameters of all Camrys and Avalons will be clubbed together on different data nodes of the cluster.
- (4)
Reduce: In this phase, the outputs from the shuffling stage are combined together into a single output depending upon the status query from the stakeholder. In other words, this stage summarizes the complete dataset of the cars and presents it to the stakeholder based on their respective requirement.
The analytics and processing data from the DAVL layer will be leveraged with the 2D/3D simulation modeling to plan and predict breakdowns and to highlight failure patterns [
23]. After the processing and analytics phase, these results will be communicated to different levels of stakeholders for data monetization and visualization in terms of dashboard graphs, charts, tables, and reports. These stakeholders will have different privileges to monitor the cars, namely, individual car owner, local dealer, state dealer, country dealer, and car manufacturer, as shown in
Figure 4. In order to validate the performance of the proposed model, some evaluation metrics that can be used are accuracy for predicting failures in the vehicular sensors in real time, total latency and throughput for end-to-end communication from physical space to virtual space of digital twin and vice versa, speed for the analytics’ model in the DAVL stage, and scalability.
Another use-case application for the proposed model is in the context of a smart healthcare patient monitoring system wherein the vitals of a mobile human can be monitored continuously from the physiological sensors attached to the human’s body. These sensors as well as human avatars will be replicated in the virtual space as a digital twin. Additionally, data about the patient’s health history will be collected and stored as electronic medical records (EMRs) and electronic health records (EHRs) in the virtual space of the proposed model unlike the BOM data in industrial use. This medical record dataset can be accessed from [
24]. The collective data from real-time sensors and health history dataset in the virtual space of the digital twin will help in making accurate predictions on the status of a human’s health while he/she is in motion. The proposed end-to-end digital twin conceptual model in a smart healthcare application is demonstrated in
Figure 5. A corresponding processing and analytics’ paradigm for a smart healthcare digital twin in DAVL layer is represented in
Figure 6.
It is worth mentioning that the evaluation metrics for both use case models will remain the same.
9. Conclusions and Future Work
With the growth of IoT technologies and Industrial 4.0 revolution for cyber physical systems, the application services and power of digital twin in industries are also increasing. A digital twin can represent the complete physical system, component, or machinery to only not only help in leveraging a product’s life cycle management but also to intelligently control, monitor, adapt, and secure the full physical infrastructure in real time.
In this work, we proposed an end-to-end conceptual model for a digital twin. This facilitates a seamless integration between the physical and virtual digital world of industrial machinery/equipment in the manufacturing process. This will help in higher flexibility, higher production, and better maintenance of the manufacturing and automation process, thus improving the overall factory and plant efficiency. So far, we have only considered one use-case example for the application of a digital twin in automotive industry by applying the proposed end-to-end conceptual model. For future work, we will focus on the implementation of the complete proposed model of a digital twin to measure its effectiveness with respect to various qualitative and quantitative metrics with a real-time data set. Further extension of the proposed model can be its implementation in other relevant, smart city applications such as smart healthcare for remote patient monitoring.
Author Contributions
Conceptualization, A.R.A.-A., R.G., and T.Z.B.; methodology, A.R.A.-A., R.G., T.Z.B., and T.L.; software, A.R.A.-A. and R.G.; validation, A.R.A.-A., R.G., T.Z.B., T.L., F.A., and A.A.N.; formal analysis, A.R.A.-A., R.G., and T.Z.B.; investigation, A.R.A.-A., R.G., T.Z.B., T.L., F.A., and A.A.N.; resources, A.R.A.-A., R.G., T.Z.B., and A.A.N.; data curation, A.R.A.-A., R.G., T.Z.B., T.L. and F.A.; writing—original draft preparation, A.R.A.-A.,T.Z.B., and T.L.; writing—review and editing, A.R.A.-A., R.G., T.Z.B., T.L., and F.A.; visualization, A.R.A.-A., R.G., T.Z.B., and A.A.N.; supervision, A.R.A.-A. All authors have read and agreed to the published version of the manuscript.
Funding
This research received no external funding.
Conflicts of Interest
The authors declare no conflict of interest.
References
- Shafto, M.; Conroy, M.; Doyle, R.; Glaessgen, E.; Kemp, C.; LeMoigne, J.; Wang, L. DRAFT Modeling, Simulation, Information Technology & Processing Roadmap Technology Area 11, NASA. 2010. Available online: https://www.nasa.gov/pdf/501321main_TA11-MSITP-DRAFT-Nov2010-A1.pdf (accessed on 25 September 2020).
- Constantinescu, C.; Giosan, S.; Matei, R.; Wohlfeld, D. A holistic methodology for development of Real-Time Digital Twins. Procedia CIRP 2020, 88, 163–166. [Google Scholar] [CrossRef]
- Danilczyk, W.; Sun, Y.; He, H. ANGEL: An Intelligent Digital Twin Framework for Microgrid Security. In Proceedings of the 2019 North American Power Symposium (NAPS), Wichita, KS, USA, 13–15 October 2019; pp. 1–6. [Google Scholar] [CrossRef]
- Raza, M.; Kumar, P.M.; Hung, D.V.; Davis, W.; Nguyen, H.; Trestian, R. A Digital Twin Framework for Industry 4.0 Enabling Next-Gen Manufacturing. In Proceedings of the 2020 9th International Conference on Industrial Technology and Management (ICITM), Oxford, UK, 11–13 February 2020; pp. 73–77. [Google Scholar] [CrossRef]
- Jones, D.; Snider, C.; Nassehi, A.; Yon, J.; Hicks, B. Characterising the Digital Twin: A systematic literature review. CIRP J. Manuf. Sci. Technol. 2020, 29, 36–52. [Google Scholar] [CrossRef]
- Minerva, R.; Lee, G.M.; Crespi, N. Digital Twin in the IoT Context: A Survey on Technical Features, Scenarios, and Architectural Models. Proc. IEEE 2020, 1–40. [Google Scholar] [CrossRef]
- Liu, M.; Fang, S.; Dong, H.; Xu, C. Review of digital twin about concepts, technologies, and industrial applications. J. Manuf. Syst. 2020. [Google Scholar] [CrossRef]
- Alves, R.G.; Souza, G.; Maia, R.F.; Tran, A.L.H.; Kamienski, C.; Soininen, J.-P.; Aquino, P.T.; Lima, F. A digital twin for smart farming. In Proceedings of the 2019 IEEE Global Humanitarian Technology Conference (GHTC), Seattle, WA, USA, 17–20 October 2019; pp. 1–4. [Google Scholar] [CrossRef]
- Papacharalampopoulos, A.; Stavropoulos, P.; Petrides, D. Towards a digital twin for manufacturing processes: Applicability on laser welding. Procedia CIRP 2020, 88, 110–115. [Google Scholar] [CrossRef]
- Korzun, D.G.; Balandina, E.; Kashevnik, A.; Balandin, S.; Viola, F. Ambient Intelligence Services in IoT Environments; IGI Global: Hershey, PA, USA, 2019. [Google Scholar]
- Kortuem, G.; Kawsar, F.; Sundramoorthy, V.; Fitton, D. Smart objects as building blocks for the Internet of things. IEEE Internet Comput. 2009, 14, 44–51. [Google Scholar] [CrossRef]
- Rolle, R.P.; Martucci, V.D.O.; Godoy, E.P. Architecture for Digital Twin implementation focusing on Industry 4.0. IEEE Lat. Am. Trans. 2020, 18, 889–898. [Google Scholar] [CrossRef]
- Particle Company News and Updates|Particle, Particle. Available online: https://www.particle.io (accessed on 25 September 2020).
- Raspberry Pi: Adafruit Industries, Unique & Fun DIY Electronics and Kits, Adafruit.com. Available online: https://www.adafruit.com/category/105 (accessed on 25 September 2020).
- Kuphaldt, T.R. “Lessons in Electric Circuits”, Volume III—Semiconductors, 7th ed.; Design Science: Long Beach, CA, USA, 2009. [Google Scholar]
- “Raspberry Pi HATs, pHATS & GPIO”, The Pi Hut. 2020. Available online: https://thepihut.com/collections/raspberry-pi-hats (accessed on 25 September 2020).
- Ezhilarasan, E.; Dinakaran, M. A Review on Mobile Technologies: 3G, 4G and 5G. In Proceedings of the 2017 Second International Conference on Recent Trends and Challenges in Computational Models (ICRTCCM), Tindivanam, India, 3–4 February 2017; pp. 369–373. [Google Scholar] [CrossRef]
- Panwar, N.; Sharma, S.; Singh, A.K. A survey on 5G: The next generation of mobile communication. Phys. Commun. 2016, 18, 64–84. Available online: https://www.sciencedirect.com/science/article/pii/S1874490715000531 (accessed on 25 September 2020). [CrossRef]
- “3D Design Software|3D Modeling on the Web SketchUp”, SketchUp. Available online: https://www.sketchup.com/ (accessed on 25 September 2020).
- “Simulation, Production Planning and Scheduling Software|Simio”, Simio.com. Available online: https://www.simio.com/ (accessed on 25 September 2020).
- García, S.; Luengo, J.; Sáez, J.A.; López, V.; Herrera, F. A Survey of Discretization Techniques: Taxonomy and Empirical Analysis in Supervised Learning. IEEE Trans. Knowl. Data Eng. 2012, 25, 734–750. [Google Scholar] [CrossRef]
- Kammerer, K.; Hoppenstedt, B.; Pryss, R.; Stökler, S.; Allgaier, J.; Reichert, M. Anomaly Detections for Manufacturing Systems Based on Sensor Data—Insights into Two Challenging Real-World Production Settings. Sensors 2019, 19, 5370. [Google Scholar] [CrossRef] [PubMed]
- Yun, S.; Park, J.-H.; Kim, W.-T. Data-centric middleware based digital twin platform for dependable cyber-physical systems. In Proceedings of the 2017 Ninth International Conference on Ubiquitous and Future Networks (ICUFN), Milan, Italy, 4–7 July 2017; pp. 922–926. [Google Scholar] [CrossRef]
- Al-Dmour, J.; Sagahyroon, A.; Al-Ali, A.; Abusnana, S. A fuzzy logic–based warning system for patient’s classification. Health Inform. J. 2017, 25, 1004–1024. [Google Scholar] [CrossRef] [PubMed]
© 2020 by the authors. Licensee MDPI, Basel, Switzerland. This article is an open access article distributed under the terms and conditions of the Creative Commons Attribution (CC BY) license (http://creativecommons.org/licenses/by/4.0/).

 ,
, 


