Coverage and Energy Efficiency Analysis for Two-Tier Heterogeneous Cellular Networks Based on Matérn Hard-Core Process

Department of Communication Engineering, Nanjing Institute of Technology, Nanjing 211167, China
*
Author to whom correspondence should be addressed.
Future Internet 2020, 12(1), 1; https://doi.org/10.3390/fi12010001
Submission received: 8 November 2019
/
Revised: 17 December 2019
/
Accepted: 17 December 2019
/
Published: 19 December 2019
Abstract
:Due to the dense deployment of base stations (BSs) in heterogeneous cellular networks (HCNs), the energy efficiency (EE) of HCN has attracted the attention of academia and industry. Considering its mathematical tractability, the Poisson point process (PPP) has been employed to model HCNs and analyze their performance widely. The PPP falls short in modeling the effect of interference management techniques, which typically introduces some form of spatial mutual exclusion among BSs. In PPP, all the nodes are independent from each other. As such, PPP may not be suitable to model networks with interference management techniques, where there exists repulsion among the nodes. Considering this, we adopt the Matérn hard-core process (MHCP) instead of PPP, in which no two nodes can be closer than a repulsion radius from one another. In this paper, we study the coverage performance and EE of a two-tier HCN modelled by Matérn hard-core process (MHCP); we abbreviate this kind of two-tier HCN as MHCP-MHCP. We first derive the approximate expression of coverage probability of MHCP-MHCP by extending the approximate signal to interference ratio analysis based on the PPP (ASAPPP) method to multi-tier HCN. The concrete SIR gain of the MHCP model relative to the PPP model is derived through simulation and data fitting. On the basis of coverage analysis, we derive and formulate the EE of MHCP-MHCP network. Simulation results verify the correctness of our theoretical analysis and show the performance difference between the MHCP-MHCP and PPP modelled network.
1. Introduction
In recent years, in order to meet the increasing data rate requirements of users, the traditional cellular networks have evolved into heterogeneous cellular networks (HCNs) [1,2]. HCNs include macro base stations (MBSs) for wide coverage and several kinds of micro base stations for small coverage, such as Pico base stations (PBSs), femto base stations, etc [3].
The Poisson point process (PPP)-based model can not only reflect the randomness of the BS distribution, but can also give easy analysis results [4]. Thus, the existing performance analysis for HCN is mostly based on the PPP model [5,6]. However, in reality, the deployment of base stations (BSs) is not completely random, and there is usually a certain spatial correlation between them. Non-PPP models, such as the Poisson Cluster Processes (PCP), Ginibre Point Process, Hard-core Processes, etc., can better reflect the spatial characteristics of base station deployment than PPP [7,8,9,10].
It is very difficult to analyze the interference statistical characteristics of HCN based on non-PPP models in theory, which hinders the performance analysis and optimization of HCN using non-Poisson models [11]. Fortunately, an approximate signal to interference ratio (SIR) analysis method based on PPP is developed in [12,13,14]. The method approximately evaluates the coverage of HCN based on the non-PPP model by scaling the SIR threshold in the corresponding PPP model. The scaling coefficient of the SIR threshold is called SIR gain; the method is called as approximate SIR analysis based on PPP (ASAPPP). Using the ASAPPP method, the authors of [15] give the approximate SIR distribution of the network based on Ginibre Point process and Square Lattice, respectively. The authors of [16] analyze the approximate SIR distribution of the network based on Poisson Hole Process (PHP). However, [15,16] only cover the one-tier cellular network model. [17] derives the coverage probability of the two-tier HCN modelled by PPP and PCP, but the derivation process is too complicated and the results can only be obtained by numerical computation. [18] and [19] analyze the distribution of the conditional success probability for HCN based on PPP and non-PPP, respectively. According to the principle of nearest BS access, [20] investigate the approximate SIR distribution of K-tier HCNs with the use of ASAPPP method. However, due to channel fading, the nearest BS may not be able to provide the maximum receiving power for the target user.
With the dense deployment of BSs in HCN, more and more attention has been paid to the energy efficiency (EE) of HCN [21,22,23,24]. In [25,26,27,28,29], the EE of HCN under the PPP model is studied, and the strategies to optimize the EE are proposed from the aspects of transmit power, BS sleeping, BS density and so on. Also under the PPP model, [30,31,32] analyzes the relationship between EE and spectral efficiency (SE), [33,34,35,36,37] analyze or optimize the Area SE and EE of HCN. However, the EEs of HCNs based on non-PPP models have not been analytically investigated.
Due to the dense deployment of BSs in HCN, it is usually necessary to keep a certain distance between BSs in order to reduce mutual interference. The Matérn hard core process (MHCP) is a special PPP, whose condition is that the distance between all points is greater than a certain distance. It has been verified that, in practice, the deployment of BSs is repulsive, and MHCP can better model the distribution of these BSs [9,10]. Based on this consideration, we use two independent MHCPs to model the distributions of MBSs and PBS and we abbreviate the two-tier HCN as MHCP-MHCP.
In 5G and future mobile networks, the traffic growth of mobile communications comes not only from public telecommunication users but also from dedicated telecommunication users of vertical industries [38]. To meet the explosive traffic growth and provide a better quality of experience (QoE), dense deployed HCNs will provide a higher system throughput and spectrum utilization than conventional networks. To achieve the above key performance metrics, scholars have proposed various spectrum sharing technologies [39,40,41]. In dense deployed HCN, the number of public telecommunication users and dedicated telecommunication users is very large, so the traffic characteristics of public telecommunication systems and dedicated telecommunication systems are inconsistent in time and space. In such a way, the application of spectrum sharing technology in HCN is very meaningful [40].
In this paper, we focus on the EE of the two-tier MHCP-MHCP network. We first derive the asymptotic coverage probability of the MHCP-MHCP network. Based on the works in [12,13,14,15,16], we extend the ASAPPP method to analyze and obtain the coverage performance of MHCP-MHCP. Unlike the work in [20], we adopt the maximum receiving power criterion instead of the nearest BS criterion. In this paper, we approximate each MHCP tier to PPP tier, so we call this approximation method as “each tier ASAPPP (ET-ASAPP)”. On the basis of the coverage analysis, we derive and formulate the EE for the MHCP-MHCP network.
The main contributions of this paper are as follows. First, we derive the asymptotic SIR gain in the MHCP model relative to that in the PPP model. Based on this, we derive the coverage probability of the MHCP-MHCP network with the use of the “ET-ASAPPP” method. Then, we derive and formulate the EE of the MHCP-MHCP network. Finally, we compare the coverage probability and EE of the MHCP-MHCP network with that of the PPP-PPP network.
The remainder of this paper is organized as follows. Section 2 introduces the system model. Section 3 gives the ASAPPP Approach for Single-Tier MHCP Network. The coverage probability and EE of the MHCP-MHCP network are derived in Section 4 and Section 5, respectively. Simulation results are discussed in Section 6 and the conclusion is given in Section 7.
2. System Model
MBSs and PBSs in the two-tier HCN are modelled as independent MHCP (k = 1,2) in . The density, transmit power, and target SIR for each tier of BS are denoted as , and βk, respectively. We abbreviate the network based on this model as MHCP-MHCP. Moreover, mobile user equipment (MUEs) are modelled as PPP in with density λu. According to Slivnyak’s theorem in random geometry, the MUE located at the represented origin is selected as the typical MUE [38]. The path loss and fast fading are taken into account when modelling the channel gain, the path loss exponent is denoted as α and the fast fading experienced by the tagged UE and all the BSs are assumed to be Rayleigh fading. Assuming that the serving BS is located at point , then the received power at the tagged MUE can be written as , where α > 2 and stand for the path-loss exponent and the Rayleigh fading, respectively.
In HCNs, if orthogonal frequency division multiple access (OFDMA) is adopted, there is only inter cell interference but no intra cell interference in the network. The intercell interference will dominate noise in HCNs of even modest density [4]. As a result, the noise power has no effect on the SINR values. However, if the latest non-orthogonal multiple access techniques are adopted, HCN may not be an interference limited network [42,43]. Considering the mathematical tractability, we assume universal frequency reuse. As such, except the serving BS of the typical MUE, all the other BSs in the HCN are potential interferers. Therefore, in this paper, we analyze SIR instead of SINR. SIR of the tagged MUE is
where represents the Rayleigh fading between tagged UE and other base stations except the serving BS. Then, the coverage of tagged MUE can be given by
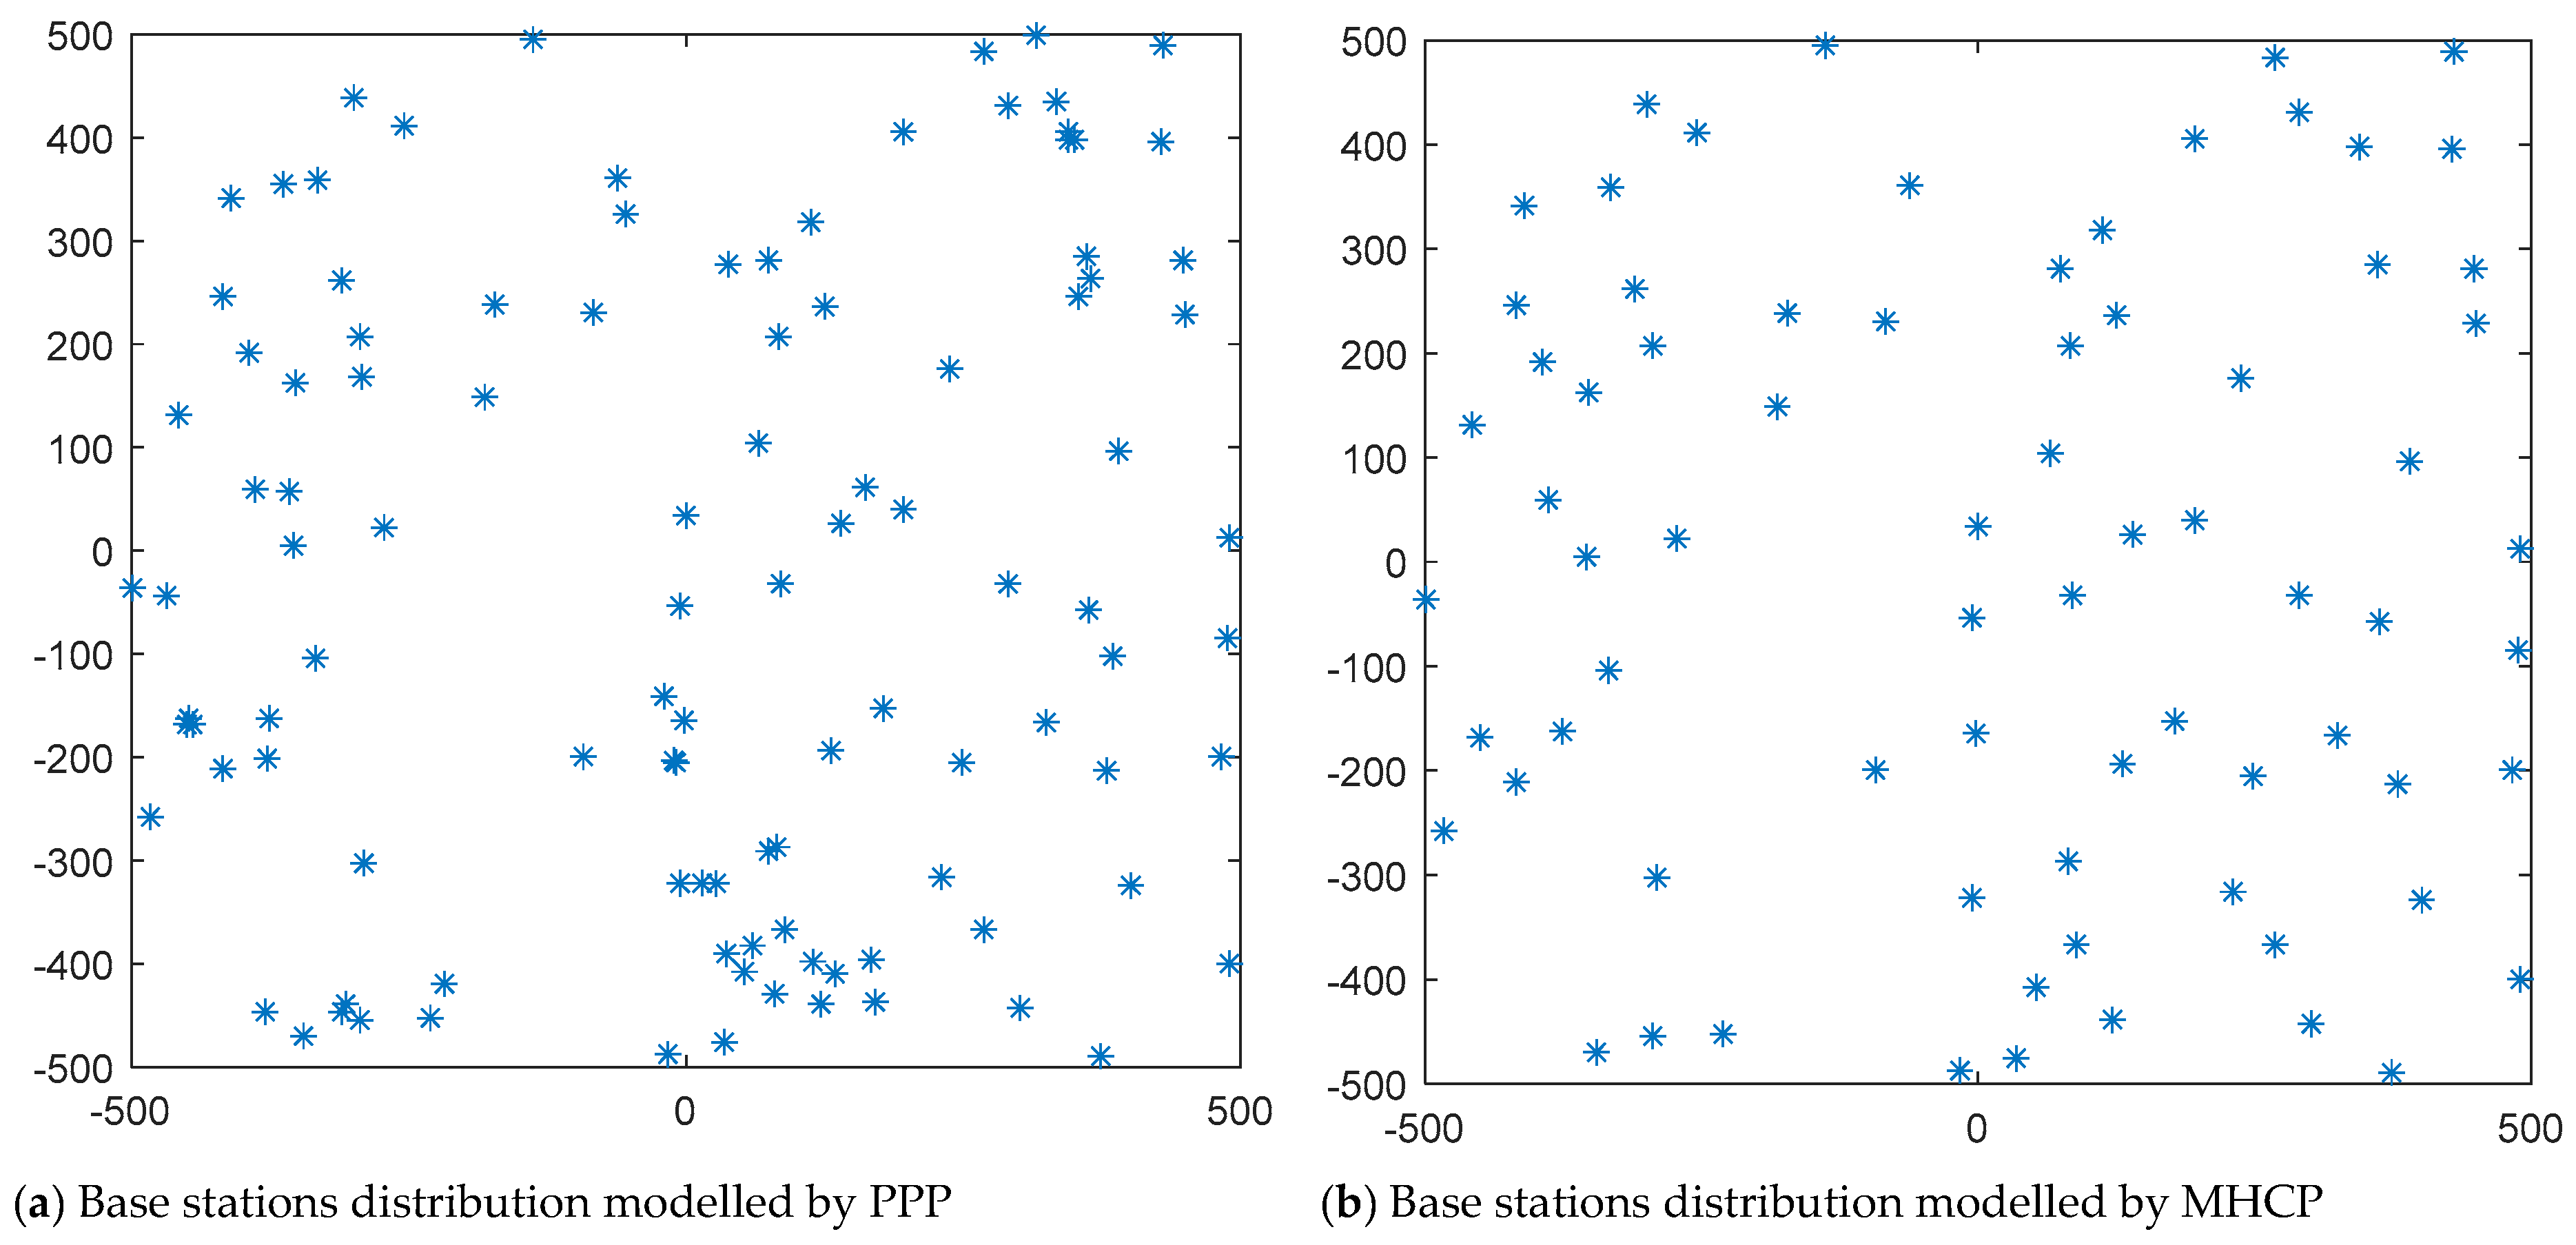
The single-tier MHCP can be obtained as follows. First, we create an initial PPP ΦPPP with intensity λPPP and give each point x (x ∈ ΦPPP) an independent mark m(x). m(x) is a random variable uniformly distributed among [0, 1]. We find all the points that have neighbours within the exclusion radius and have smaller m (x), then flag these points. Last, we remove all flagged points. Formally, . Where b(x,r) denotes a ball centred at x with radius r, Φ represents the set of all removed points. Following the steps above, the remaining points form a MHCP ΦMHCP. The BSs distribution modelled by PPP with density 10−4 m−2 is shown in Figure 1a. The relevant BSs distribution modelled by MHCP with repulsion radius 50 m is shown in Figure 1b.
The density of ΦMHCP can be calculated as [9]
Where λMHCP represents the density of ΦMHCP, r represents the repulsion radius, and λPPP is the density of ΦPPP before removing points.
3. The ASAPPP Approach for Single-Tier MHCP Network
In interference-limited networks, the coverage probability is equivalent to the complementary cumulative distribution function (ccdf) of SIR. Recently, it has been observed that the coverage of cellular networks based on non-PPP models can be approximated by adjusting the SIR threshold of the corresponding network based on a PPP model with the same density. The adjusting coefficient is called SIR gain and the method is called ASAPPP [13,14,15,16,17,18,19,20]. Using this method, the SIR gain for the MHCP modelled network can be expressed as
where MISR is mean interference-to-signal ratio (MISR), MISRPPP represents the MISR for PPP-modelled network, and MISRMHCP represents the MISR for MHCP-modelled network. For a network with BSs located at Φ and the serving BS located at x0, the MISR at the typical user is defined as [13,14,15,16]
where I is the sum of all interference powers, and is the signal power average over the fading. In the case of equal transmit powers, the MISR of PPP is derived as [15,16,17]
In addition, MISRMHCP can be obtained by simulation and data fitting. Then, we can get the value of GMHCP.
4. Coverage Probability of MHCP-MHCP Network
We assume the open access strategy, i.e., the tagged MUE, choose to access the BS which can deliver the maximum received SIR. That is to say, the tagged MUE at the origin is in coverage if: , where βk is the SIR threshold for the k-th tier. It has been proved that, in the PPP-modelled network, if βk > 1 (0 dB), the tagged MUE can only access one base station at most [4]. On the basis of these existing conclusions, the coverage probability for tagged MUE in the MHCP-MHCP network in open access can be derived as follows:
In step (a), ASAPPP method is used, by scaling the SIR threshold of networks based on PPP models, we can get the approximate SIR distribution based on the MHCP model, where Gk is the SIR scaling factor of the k-th tier based on the MHCP model. However, due to the mutual exclusion between BSs in the MHCP modelled network, such processing will lead to increased interference and reduce the coverage of the results. Thus, the interference from is upper bounded by the interference from a PPP with the same density. So, the coverage provided by step (a) will be slightly lower than the actual coverage. Step (b) follows from the assumption that [4]. Step (c) follows from the Campbell theorem [44]. The derivation of Step (d) is based on the Rayleigh fading channel. Here is the Laplace transform of the cumulative interference from all the tiers when the tagged MUE access to a BS in k-th tier. Due to the stability of the point process, the interference is independent of the location xk. Therefore, we denote by . In the PPP-PPP network, is derived as [4]
where , λi represents the density of the BSs in k-th tier in PPP-PPP network. Since we use the ASAPPP method, each tier of the MHCP network is approximated to the PPP network with the same density by SIR threshold scaling. λk is numerically equal to λk-MHCP. Substituting (8) into (7), the coverage probability of a tagged MUE in the MHCP-MHCP network can be derived as
Step (a) follows from the transformation from Cartesian coordinate to polar coordinate. Step (b) follows from . In the above derivation, we approximate each MHCP tier to PPP tier, so we call this approximation method “ET-ASAPPP”.
5. Energy Efficiency of the MHCP-MHCP Network
In this paper, the energy efficiency is defined as the ratio of total downlink channel capacity to total power consumption in the MHCP-MHCP network, that is
where is the total downlink channel capacity, is the total power consumed by all the BSs in the MHCP-MHCP network. Firstly, we characterize the total downlink channel capacity, then analyze the total power consumption of all BSs and model the network EE.
5.1. Downlink Channel Capacity
In this paper, the total downlink channel capacity is defined as
where A is the area of the MHCP-MHCP network, is the probability of the tagged MUE accesses to the BS in k-th tier, is the downlink channel capacity between a k-th tier BS and the tagged MUE. For simplicity without loss of generality, we assume that each BS allocates bandwidth equally to all MUEs accessing it. Thus, can be expressed as
where step (a) follows from the assumption that and are independent, is the bandwidth that each BS can allocate to users, and represents the number of UEs accessing the tagged BS in the k-th tier. According to [25,45], is given as
where is the proportion of the MUE coverage contributed by the BS in k-th tier. In open access mode, in PPP-modelled two-tier HCN can be expressed as [4]
Since the ASAPPP method is adopted in this paper, each tier of the MHCP network is approximated to the PPP network with the same density by SIR threshold scaling. Thus, in MHCP-MHCP networks can be written as
Substituting (15) into (13) and then (13) to (12), can be obtained. Moreover, the probability of the tagged MUEs accessing the BSs in the k-th tier can be written as
According to (16) and (12), we can obtain the total downlink minimum achievable data rate of the MHCP-MHCP network as
5.2. Total Power Consumption
In this paper, the total power consumption of all the BSs in the MHCP-MHCP network is defined as
where represents the power consumption of a BS in the k-th tier. In general, the BS consists of static power consumption and transmit power consumption [46,47]. In this paper, we use the linear power consumption model given in [42], which is
where is number of the transmit antenna elements of a BS in k-th tier, is the static power expenditure, and is the slope of power consumption related to load. Combining BS density and area of the MHCP-MHCP network, the total power consumption of all BSs in the MHCP-MHCP network can be written as
Substituting (17) and (20) into (10), the energy efficiency of the MHCP-MHCP network can be expressed as
6. Data Fitting and Simulation Analysis
In this section, we first find the expression of the MISR for the MHCP network. It should be noted that the theoretical derivation of the MISR expression for the non-PPP network is too complex to implement. Thus, we use simulation and data fitting to get the expression of MISRMHCP. Then, a series of numerical simulations are carried out to verify the accuracy of our derived coverage and energy efficiency expressions. In order to keep the derivation tractable, we do not consider the MUEs’ QoS requirements and we assume that each BS equally allocates the frequency resource among its associated MUEs. Furthermore, the downlink channel capacity is calculated based on the preset target SIRs, and the target SIRs for MBSs and PBSs are set to be the same in the simulation. For the power consumption model, we refer to the statistics proposed in [48]. The simulation parameters are shown in Table 1.
Figure 2 shows the relationship between MISRMHCP and path loss. We use the fitting toolbox cftool in MATLAB to obtain the mathematical model of MISR about path loss as
The correlation coefficients fitted for each tier of the MHCP network are given in Table 2.
Then we can use MISRMHCP to calculate GMHCP according to Equation (4), and then substitute GMHCP into Equation (9) to obtain the approximate coverage of the two-tier MHCP-MHCP network. It should be noted that the fitting results in Table 2 are related to the repulsion radius.
Figure 3 compares the coverage probabilities of the MHCP-MHCP network with that of the PPP-PPP network, and both simulation and theoretical approximations of coverage are given. The target SIRs for MBSs and PBSs are set to be the same. It can be seen from Figure 3 that the theoretical results are in good agreement with the simulation results, which further verifies the effectiveness of the proposed ET-ASAPPP method.
It can also be seen that the approximate coverage of MHCP-MHCP is the lower bound of simulation coverage. What is more, the coverage performance of the MHCP-MHCP network is significantly better than that of the PPP-PPP network. This is because there are repulsion radiuses between BSs in MHCP-modelled networks, BSs are not completely randomly distributed, while the BSs in PPP-modelled networks are completely randomly distributed. Therefore, the interference between BSs in PPP-modelled networks is larger than that in MHCP-modelled networks, and the coverage performance of MHCP-MHCP networks is significantly higher than that of PPP-PPP networks. It should be noted that, since the ASAPP method is used to derive the coverage of the MHCP-MHCP network, we assume that the equivalent SIR threshold is greater than 1, i.e., (0 dB). So, when the SIR threshold is relatively small, there is a certain gap between the theoretical approximation and simulation value. When the SIR threshold rises to make the equivalent SIR threshold greater than 0 dB, the theoretical approximation values are consistent with the simulation values.
Figure 4 compares the EE of the MHCP-MHCP network with that of the PPP-PPP network. We observe the relationship between the EE and the transmit power of the PBS. The transmit power of the MBS is fixed to 20 W, and the transmit power of the PBS is variable. Both the target SIR for the MBSs and the target SIR for PBSs are set to 10 dB. It can be seen that in the whole PBS transmit power region, there are only subtle differences between simulation values and theoretical approximated values, which proves the correctness of our theoretical derivation.
From Figure 4, we can see that the EE of the MHCP-MHCP network is about 1.2 × 10⁶ to 1.3 × 106 bits/Joule higher than that of the PPP-PPP network under the same parameters, which means that the EE of the MHCP-MHCP network is much higher than that of the PPP-PPP network. This is due to the relative regularity of base station deployment in the MHCP-MHCP network, which greatly reduces the mutual interference between BSs. Compared with the PPP-PPP network, the MHCP-MHCP network can improve downlink minimum achievable data rates with the same power consumption. It can also be seen that EE shows a trend of rising first and then declining. This is because, with the increase of the transmit power of the PBS, more users choose to access PBS, so EE is on the rise. However, with the further increase of the transmit power of PBS, the interference between the BSs is also increased, which leads to the decline of the MUE’s downlink rate, so the EE is gradually reduced. Therefore, EE is a convex function of the transmit power of the PBS and there exists an optimal transmit power of PBS which can maximize the EE. Furthermore, it has been pointed out that EE can be improved by optimizing BS density [29]. We also compare EE of the MHCP-MHCP network with that of the PPP-PPP network which uses the optimization algorithms proposed in [29]. It can be seen from Figure 4 that even if the fixed BS density is adopted, the EE of the MHCP-MHCP network is still higher than that of the PPP-PPP network adopting the optimal BS density.
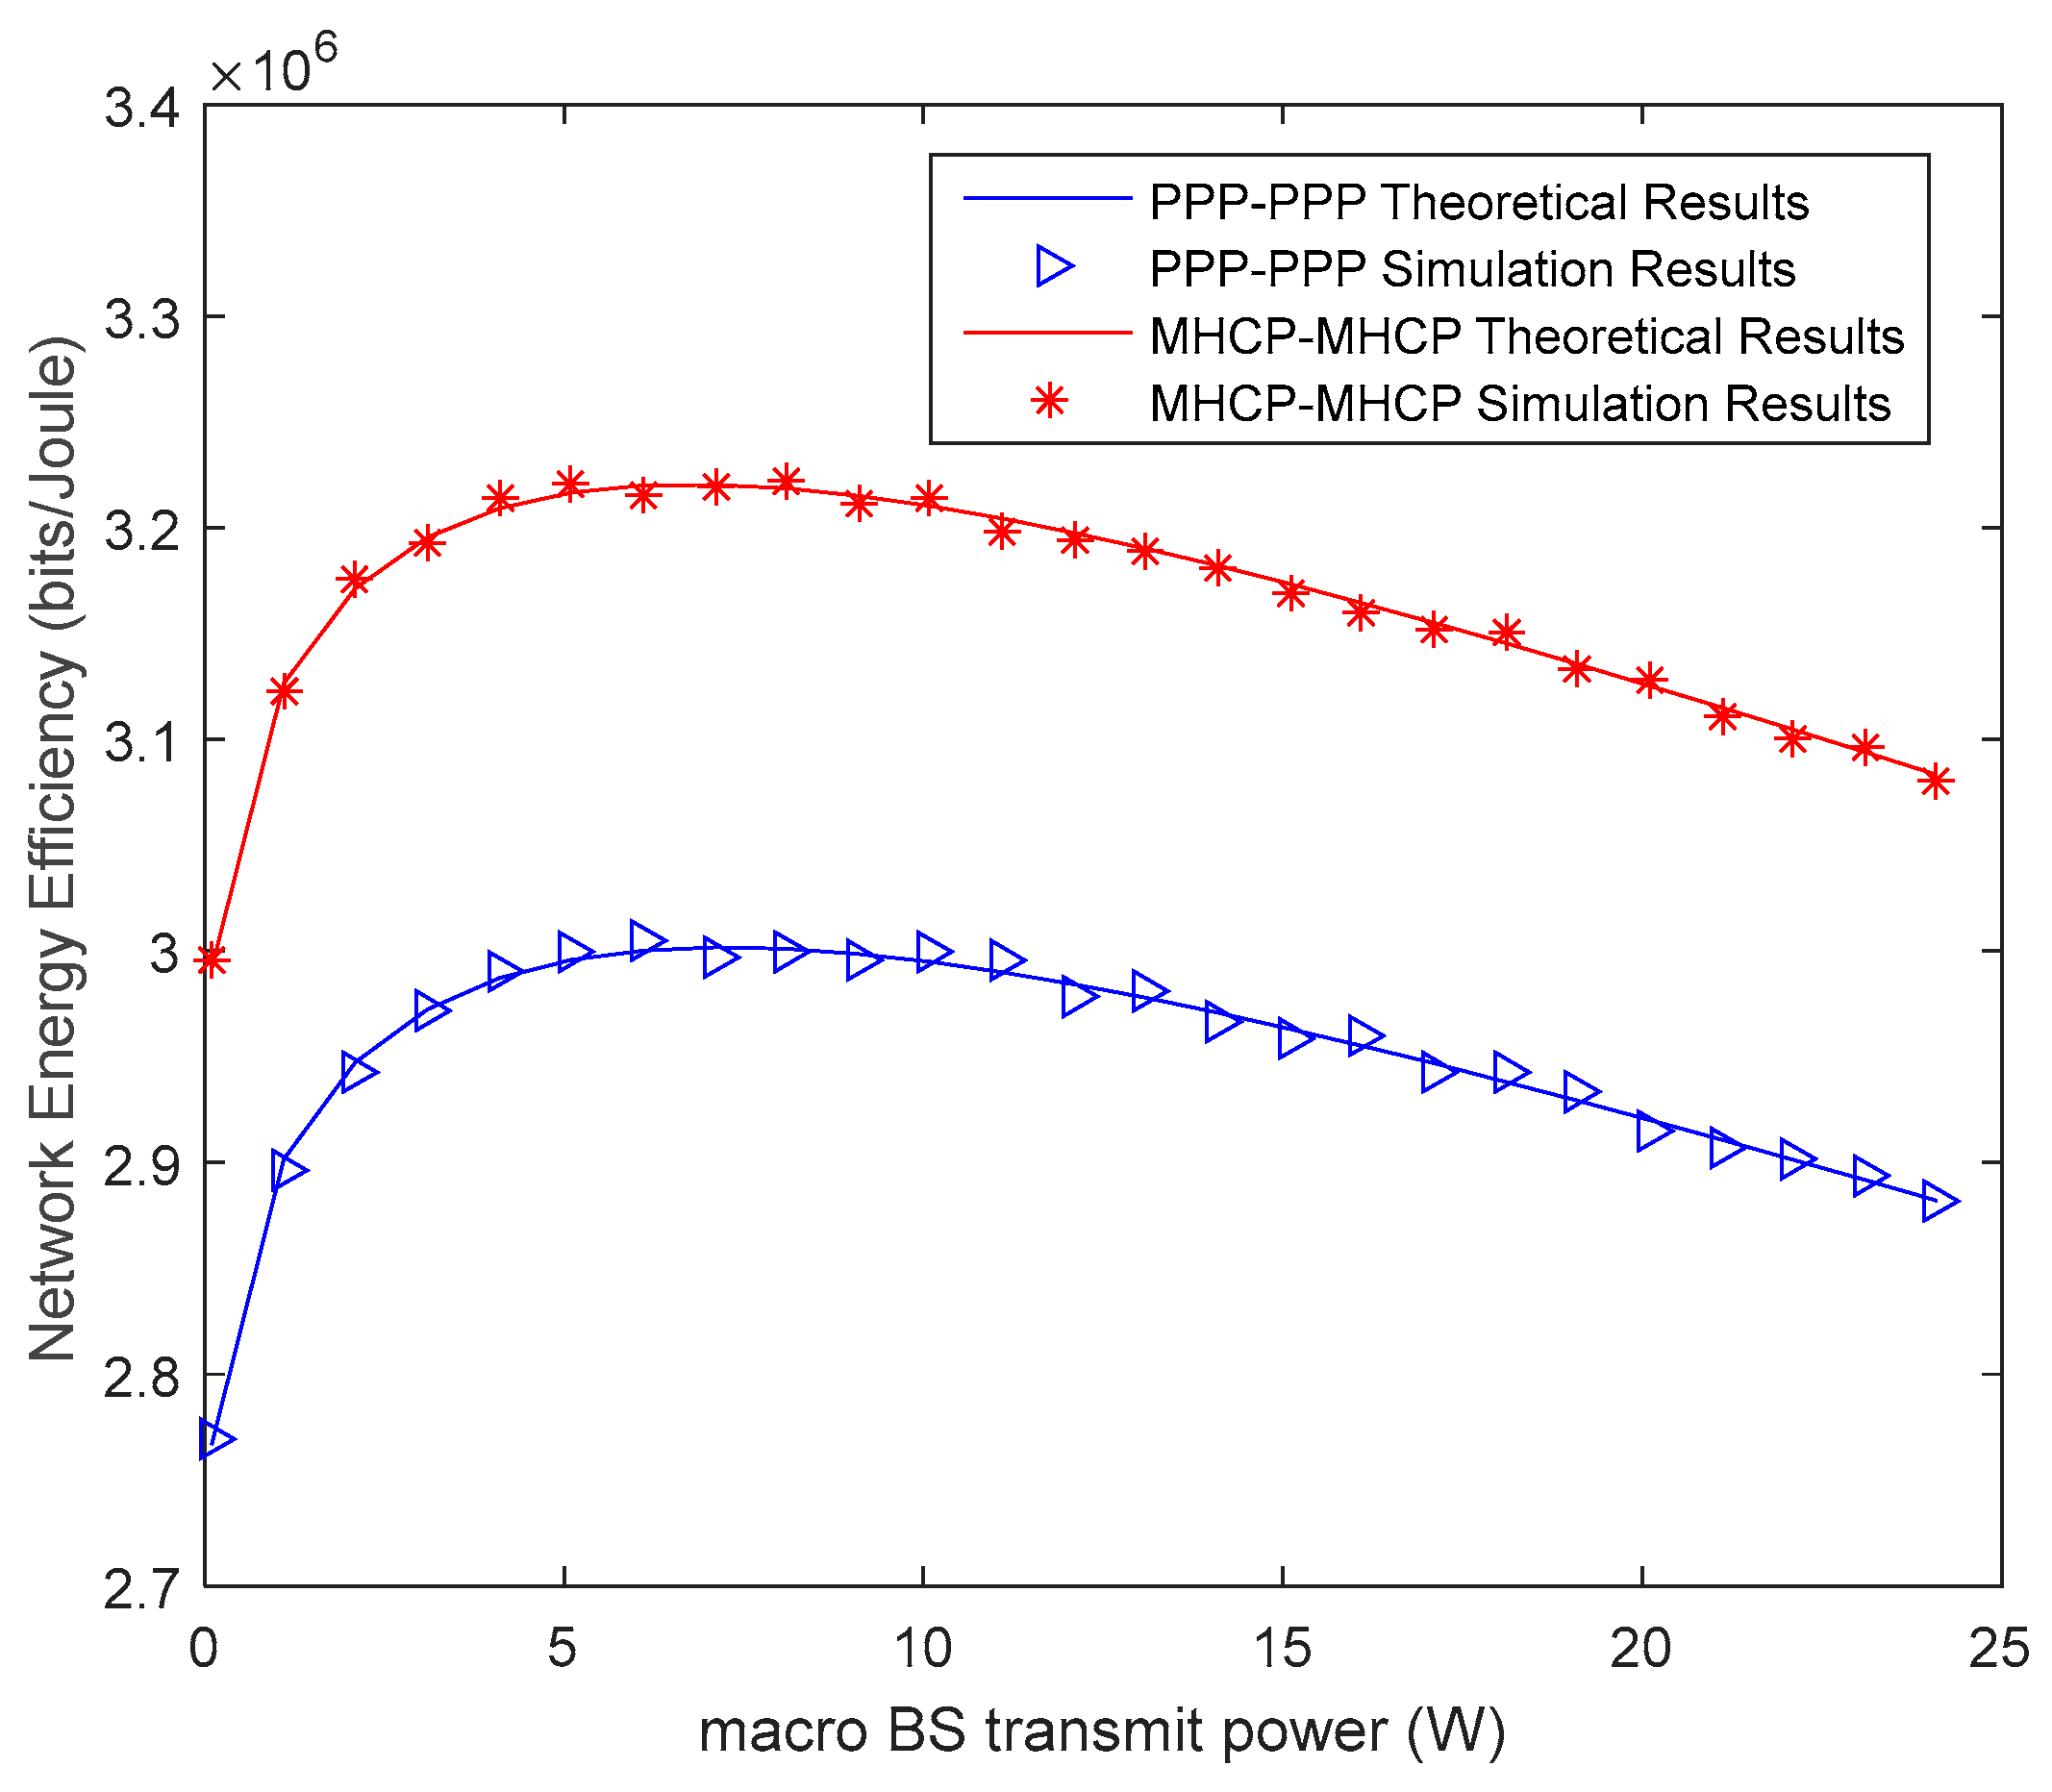
Figure 5 shows the relationship between the EE and the transmit power of the MBS. The transmit power of the PBS is fixed to 0.13 W, and the transmit power of the MBS is variable. It can be seen that the EE of the MHCP-MHCP network is about 1.2 × 10⁶ to 1.3 × 106 bits/Joule higher than that of the PPP-PPP network under the same parameters. Similar to Figure 4, the EE shows a trend of rising first and then declining, so it is a convex function of the transmit power of the MBS. Therefore, there exists an optimal transmit power of MBS which can maximize the EE.
7. Conclusions
In this paper, we studied the coverage performance and EE of the two-tier MHCP-MHCP network. MISR gain for the MHCP-modelled network is given through simulation and data fitting. The approximate coverage expression of the MHCP-MHCP network was derived with the use of the ET-ASAPPP method. Furthermore, we derived and formulated the expression of the EE of the MHCP-MHCP network. Simulation results verified the correctness of the theoretical analysis and prove the effectiveness of the proposed ET-ASAPPP method. We found that the coverage and EE of the MHCP-MHCP network is much better than that of the PPP-PPP network, which means that MHCP is more suitable for modeling the actual BS deployment with mutual exclusion. Furthermore, when the BS densities and MBS transmit power are fixed, there exists an optimal PBS transmit power which can maximize the EE. Similarly, when the BS densities and PBS transmit power are fixed, there exists an optimal MBS transmit power which can maximize the EE. Therefore, we can improve the EE through the joint optimization of the MBS transmit power and PBS transmit power.
Author Contributions
Conceptualization, J.Y.; methodology, J.Y.; simulation, Z.P. and L.G.; formal analysis, J.Y. and Z.P.; writing—original draft preparation, J.Y. and Z.P.; writing—review and editing, L.G. All authors have read and agreed to the published version of the manuscript.
Funding
This work was supported by the National Natural Science Foundation of China No. 61701221, 61901211, the Natural Science Foundation of Jiangsu Province (China) No. BK20160781, Jiangsu Higher Education Institutions Natural Science Foundation No. 18KJB510017, Nantong Science and Technology Project, No. JC2018127.
Acknowledgments
The authors would like to thank Chen Yonghong of Nantong University for sharing her insight.
Conflicts of Interest
The authors declare no conflict of interest.
References
- Kamel, M.; Hamouda, W.; Youssef, A. Ultra-Dense Networks: A Survey. IEEE Commun. Surv. Tutor. 2016, 18, 2522–2545. [Google Scholar] [CrossRef]
- Wang, H.; Leung, S.; Song, R. Uplink Area Spectral Efficiency Analysis for Multichannel Heterogeneous Cellular Networks with Interference Coordination. IEEE Access 2018, 6, 14485–14497. [Google Scholar] [CrossRef]
- Saha, C.; Afshang, M.; Dhillon, H.S. Enriched K-Tier HCN Model to Enable the Analysis of User-Centric Small Cell Deployments. IEEE Trans. Wirel. Commun. 2016, 16, 2835–2849. [Google Scholar]
- Dhillon, H.S.; Ganti, R.K.; Baccelli, F.; Andrews, J.G. Modeling and Analysis of K-Tier Downlink Heterogeneous Cellular Networks. IEEE J. Sel. Areas Commun. 2012, 30, 550–560. [Google Scholar] [CrossRef] [Green Version]
- Madhusudhanan, P.; Restrepo, J.G.; Liu, Y.; Brown, T.X. Analysis of Downlink Connectivity Models in a Heterogeneous Cellular Network via Stochastic Geometry. IEEE Trans. Wirel. Commun. 2016, 15, 3895–3907. [Google Scholar] [CrossRef]
- Wang, Y.; Zhu, Q. Modeling and Analysis of Small Cells Based on Clustered Stochastic Geometry. IEEE Commun. Lett. 2016, 21, 576–579. [Google Scholar] [CrossRef]
- Saha, C.; Afshang, M.; Dhillon, H.S. 3GPP-Inspired HetNet Model Using Poisson Cluster Process: Sum-Product Functionals and Downlink Coverage. IEEE Trans. Commun. 2018, 66, 2219–2234. [Google Scholar] [CrossRef]
- Deng, N.; Zhou, W.; Haenggi, M. The Ginibre Point Process as a Model for Wireless Networks with Repulsion. IEEE Trans. Wirel. Commun. 2015, 14, 107–121. [Google Scholar] [CrossRef]
- Flint, I.; Kong, H.; Privault, N.; Wang, P.; Niyato, D. Analysis of Heterogeneous Wireless Networks Using Poisson Hard-Core Hole Process. IEEE Trans. Wirel. Commun. 2017, 16, 7152–7167. [Google Scholar] [CrossRef]
- Kong, H.B.; Flint, I.; Wang, P.; Niyato, D.; Privault, N. Modeling and analysis of wireless networks using poisson hard-core process. In Proceedings of the IEEE International Conference on Communications, Paris, France, 21–25 May 2017; pp. 1–6. [Google Scholar]
- Kalamkar, S.S.; Haenggi, M. A Simple Approximation of the Meta Distribution for Non-Poisson Cellular Networks. In Proceedings of the 2018 IEEE International Conference on Communications (ICC), Kansas City, MO, USA, 20–24 May 2018; pp. 1–6. [Google Scholar]
- Haenggi, M. The Mean Interference-to-Signal Ratio and Its Key Role in Cellular and Amorphous Networks. IEEE Wirel. Commun. Lett. 2014, 3, 597–600. [Google Scholar] [CrossRef]
- Ganti, R.K.; Haenggi, M. Asymptotics and Approximation of the SIR Distribution in General Cellular Networks. IEEE Trans. Wirel. Commun. 2016, 15, 2130–2143. [Google Scholar] [CrossRef] [Green Version]
- Guo, A.; Haenggi, M. Asymptotic Deployment Gain: A Simple Approach to Characterize the SINR Distribution in General Cellular Networks. IEEE Trans. Commun. 2015, 63, 962–976. [Google Scholar] [CrossRef]
- Takahashi, Y.; Chen, Y.; Kobayashi, T.; Miyoshi, N. Simple and Fast PPP-based Approximation of SIR Distributions in Downlink Cellular Networks. IEEE Wirel. Commun. Lett. 2018, 7, 898–901. [Google Scholar] [CrossRef]
- Yang, J.; Pan, Z.Y.; Hu, H.; Bao, Z.Y. Approximate Coverage Analysis of Heterogeneous Cellular Networks Modelled by Poisson Hole Process. In Proceedings of the 2018 IEEE 18th International Conference on Communication Technology (ICCT), Chongqing, China, 8–11 October 2018; pp. 424–427. [Google Scholar]
- Miyoshi, N. Downlink Coverage Probability in Cellular Networks with Poisson–Poisson Cluster Deployed Base Stations. IEEE Wirel. Commun. Lett. 2018, 8, 5–8. [Google Scholar] [CrossRef] [Green Version]
- Haenggi, M. The meta distribution of the SIR in Poisson bipolar and cellular networks. IEEE Trans. Wirel. Commun. 2016, 15, 2577–2589. [Google Scholar] [CrossRef]
- Kalamkar, S.S.; Haenggi, M. Simple Approximations of the SIR Meta Distribution in General Cellular Networks. IEEE Trans. Commun. 2019, 67, 4393–4406. [Google Scholar] [CrossRef]
- Wei, H.; Deng, N.; Zhou, W.; Haenggi, M. Approximate SIR Analysis in General Heterogeneous Cellular Networks. IEEE Trans. Commun. 2016, 64, 1259–1273. [Google Scholar] [CrossRef]
- Chen, Z.; Qiu, L.; Liang, X. Area Spectral Efficiency Analysis and Energy Consumption Minimization in Multiantenna Poisson Distributed Networks. IEEE Trans. Wirel. Commun. 2016, 15, 4862–4874. [Google Scholar]
- Logambigai, R.; Kannan, A. Energy conservation routing algorithm for wireless sensor networks using hybrid optimisation approach. Int. J. Commun. Netw. Distrib. Syst. 2018, 20, 352–371. [Google Scholar] [CrossRef]
- Su, L.; Yang, C.; Chih-Lin, I. Energy and Spectral Efficient Frequency Reuse of Ultra Dense Networks. IEEE Trans. Wirel. Commun. 2016, 15, 5384–5398. [Google Scholar] [CrossRef]
- Thompson, J.; Ge, X.; Wu, H.C.; Irmer, R.; Jiang, H.; Fettweis, G.; Alamouti, S. 5G WIRELESS COMMUNICATION SYSTEMS: PROSPECTS AND CHALLENGES PART 2. IEEE Commun. Mag. 2014, 52, 24–26. [Google Scholar] [CrossRef]
- Zhang, T.; Zhao, J.; An, L.; Liu, D. Energy Efficiency of Base Station Deployment in Ultra Dense HCNs: A Stochastic Geometry Analysis. IEEE Wirel. Commun. Lett. 2016, 5, 184–187. [Google Scholar] [CrossRef]
- Jie, Y.; Zhenjian, T.; Han, H.; Yonghong, C. Energy-efficient picocell base station power control in heterogeneous cellular network. In Proceedings of the IEEE 17th International Conference on Communication Technology (ICCT), Chengdu, China, 27–30 October 2017; pp. 553–557. [Google Scholar]
- Di Renzo, M.; Zappone, A.; Lam, T.T.; Debbah, M. System-Level Modeling and Optimization of the Energy Efficiency in Cellular Networks—A Stochastic Geometry Framework. IEEE Trans. Wirel. Commun. 2018, 17, 2539–2556. [Google Scholar] [CrossRef]
- Lorincz, J.; Matijevic, T. Energy-efficiency analyses of heterogeneous macro and micro base station sites. Comput. Electr. Eng. 2014, 40, 330–349. [Google Scholar] [CrossRef]
- Li, L.; Peng, M.; Yang, C.; Wu, Y. Optimization of Base-Station Density for High Energy-Efficient Cellular Networks with Sleeping Strategies. IEEE Trans. Veh. Technol. 2015, 65, 7501–7514. [Google Scholar] [CrossRef]
- Coskun, C.C.; Ayanoglu, E. Energy- and Spectral-Efficient Resource Allocation Algorithm for Heterogeneous Networks. IEEE Trans. Veh. Technol. 2018, 67, 590–603. [Google Scholar] [CrossRef]
- Aydin, O.; Jorswieck, E.A.; Aziz, D.; Zappone, A. Energy-Spectral Efficiency Trade-Offs in 5G Multi-Operator Networks with Heterogeneous Constraints. IEEE Trans. Wirel. Commun. 2017, 16, 5869–5881. [Google Scholar] [CrossRef]
- Zhao, G.; Chen, S.; Zhao, L.; Hanzo, L. Energy-Spectral-Efficiency Analysis and Optimization of Heterogeneous Cellular Networks: A Large-Scale User-Behavior Perspective. IEEE Trans. Veh. Technol. 2018, 67, 4098–4112. [Google Scholar] [CrossRef] [Green Version]
- Zhao, G.; Chen, S.; Qi, L.; Zhao, L.; Hanzo, L. Mobile-Traffic-Aware Offloading for Energy- and Spectral-Efficient Large-Scale D2D-Enabled Cellular Networks. IEEE Trans. Wirel. Commun. 2019, 18, 3251–3264. [Google Scholar] [CrossRef]
- Luo, Y.; Shi, Z.; Bu, F.; Xiong, J. Joint Optimization of Area Spectral Efficiency and Energy Efficiency for Two-Tier Heterogeneous Ultra-Dense Networks. IEEE Access 2019, 7, 12073–12086. [Google Scholar] [CrossRef]
- Krauss, R.; Brante, G.; Rayel, O.K.; Souza, R.D.; Onireti, O.; Imran, M.A. Energy Efficiency of Multiple Antenna Cellular Networks Considering a Realistic Power Consumption Model. IEEE Trans. Green Commun. Netw. 2019, 3, 1–10. [Google Scholar] [CrossRef] [Green Version]
- Cai, Y.; Ni, Y.; Zhang, J.; Zhao, S.; Zhu, H. Energy efficiency and spectrum efficiency in underlay device-to-device communications enabled cellular networks. China Commun. 2019, 16, 16–34. [Google Scholar]
- Mollahasani, S.; Onur, E. Density-Aware, Energy- and Spectrum-Efficient Small Cell Scheduling. IEEE Access 2019, 7, 65852–65869. [Google Scholar] [CrossRef]
- 3GPP. Study on Future Railway Mobile Communication System. Technical report/Specification #: 22.889. Available online: https://portal.3gpp.org/desktopmodules/Specifications/SpecificationDetails.aspx?specificationId=3162 (accessed on 18 December 2019).
- Vamvakas, P.; Tsiropoulou, E.E.; Papavassiliou, S. Dynamic Spectrum Management in 5G Wireless Networks: A Real-Life Modeling Approach. In Proceedings of the IEEE INFOCOM 2019—IEEE Conference on Computer Communications, Paris, France, 29 April–2 May 2019; pp. 2134–2142. [Google Scholar]
- Lin, S.; Kong, L.; Gao, Q.; Khan, M.K.; Zhong, Z.; Jin, X.; Zeng, P. Advanced Dynamic Channel Access Strategy in Spectrum Sharing 5G Systems. IEEE Wirel. Commun. 2017, 24, 74–80. [Google Scholar] [CrossRef]
- Vamvakas, P.; Tsiropoulou, E.E.; Papavassiliou, S. Dynamic provider selection & power resource management in competitive wireless communication markets. Mob. Netw. Appl. 2018, 23, 86–99. [Google Scholar]
- Ding, Z.; Lei, X.; Karagiannidis, G.K.; Schober, R.; Yuan, J.; Bhargava, V.K. A Survey on Non-Orthogonal Multiple Access for 5G Networks: Research Challenges and Future Trends. IEEE J. Sel. Areas Commun. 2017, 35, 2181–2195. [Google Scholar] [CrossRef] [Green Version]
- Vamvakas, P.; Tsiropoulou, E.E.; Papavassiliou, S. On Controlling Spectrum Fragility via Resource Pricing in 5G Wireless Networks. IEEE Netw. Lett. 2019, 1, 111–115. [Google Scholar] [CrossRef]
- Stoyan, D.; Kendall, W.; Mecke, J. Stochastic Geometry and Its Applications, 2nd ed.; John Wiley and Sons: Hoboken, NJ, USA, 1996; pp. 54–66. [Google Scholar]
- Singh, S.; Dhillon, H.S.; Andrews, J.G. Offloading in Heterogeneous Networks: Modeling, Analysis, and Design Insights. IEEE Trans. Wirel. Commun. 2013, 12, 2484–2497. [Google Scholar] [CrossRef] [Green Version]
- Sui, X.; Zhao, Z.; Li, R.; Zhang, H. Energy Efficiency Analysis of Heterogeneous Cellular Networks with Downlink and Uplink Decoupling. In Proceedings of the 2015 IEEE Global Communications Conference (GLOBECOM), San Diego, CA, USA, 6–10 December 2015; pp. 1–7. [Google Scholar]
- Lorincz, J.; Matijevic, T.; Petrovic, G. On interdependence among transmit and consumed power of macro base station technologies. Comput. Commun. 2014, 50, 10–28. [Google Scholar] [CrossRef]
- Auer, G.; Giannini, V.; Desset, C.; Godor, I.; Skillermark, P.; Olsson, M.; Imran, M.A.; Sabella, D.; Gonzalez, M.J.; Blume, O.; et al. How much energy is needed to run a wireless network? IEEE Wirel. Commun. 2011, 18, 40–49. [Google Scholar] [CrossRef]
Figure 1.
Base stations distribution modelled by the Poisson point process (PPP) and Matérn hard-core process (MHCP).
Figure 1.
Base stations distribution modelled by the Poisson point process (PPP) and Matérn hard-core process (MHCP).

Figure 2.
Mean interference-to-signal ratio (MISR) simulation for a single-tier MHCP network.
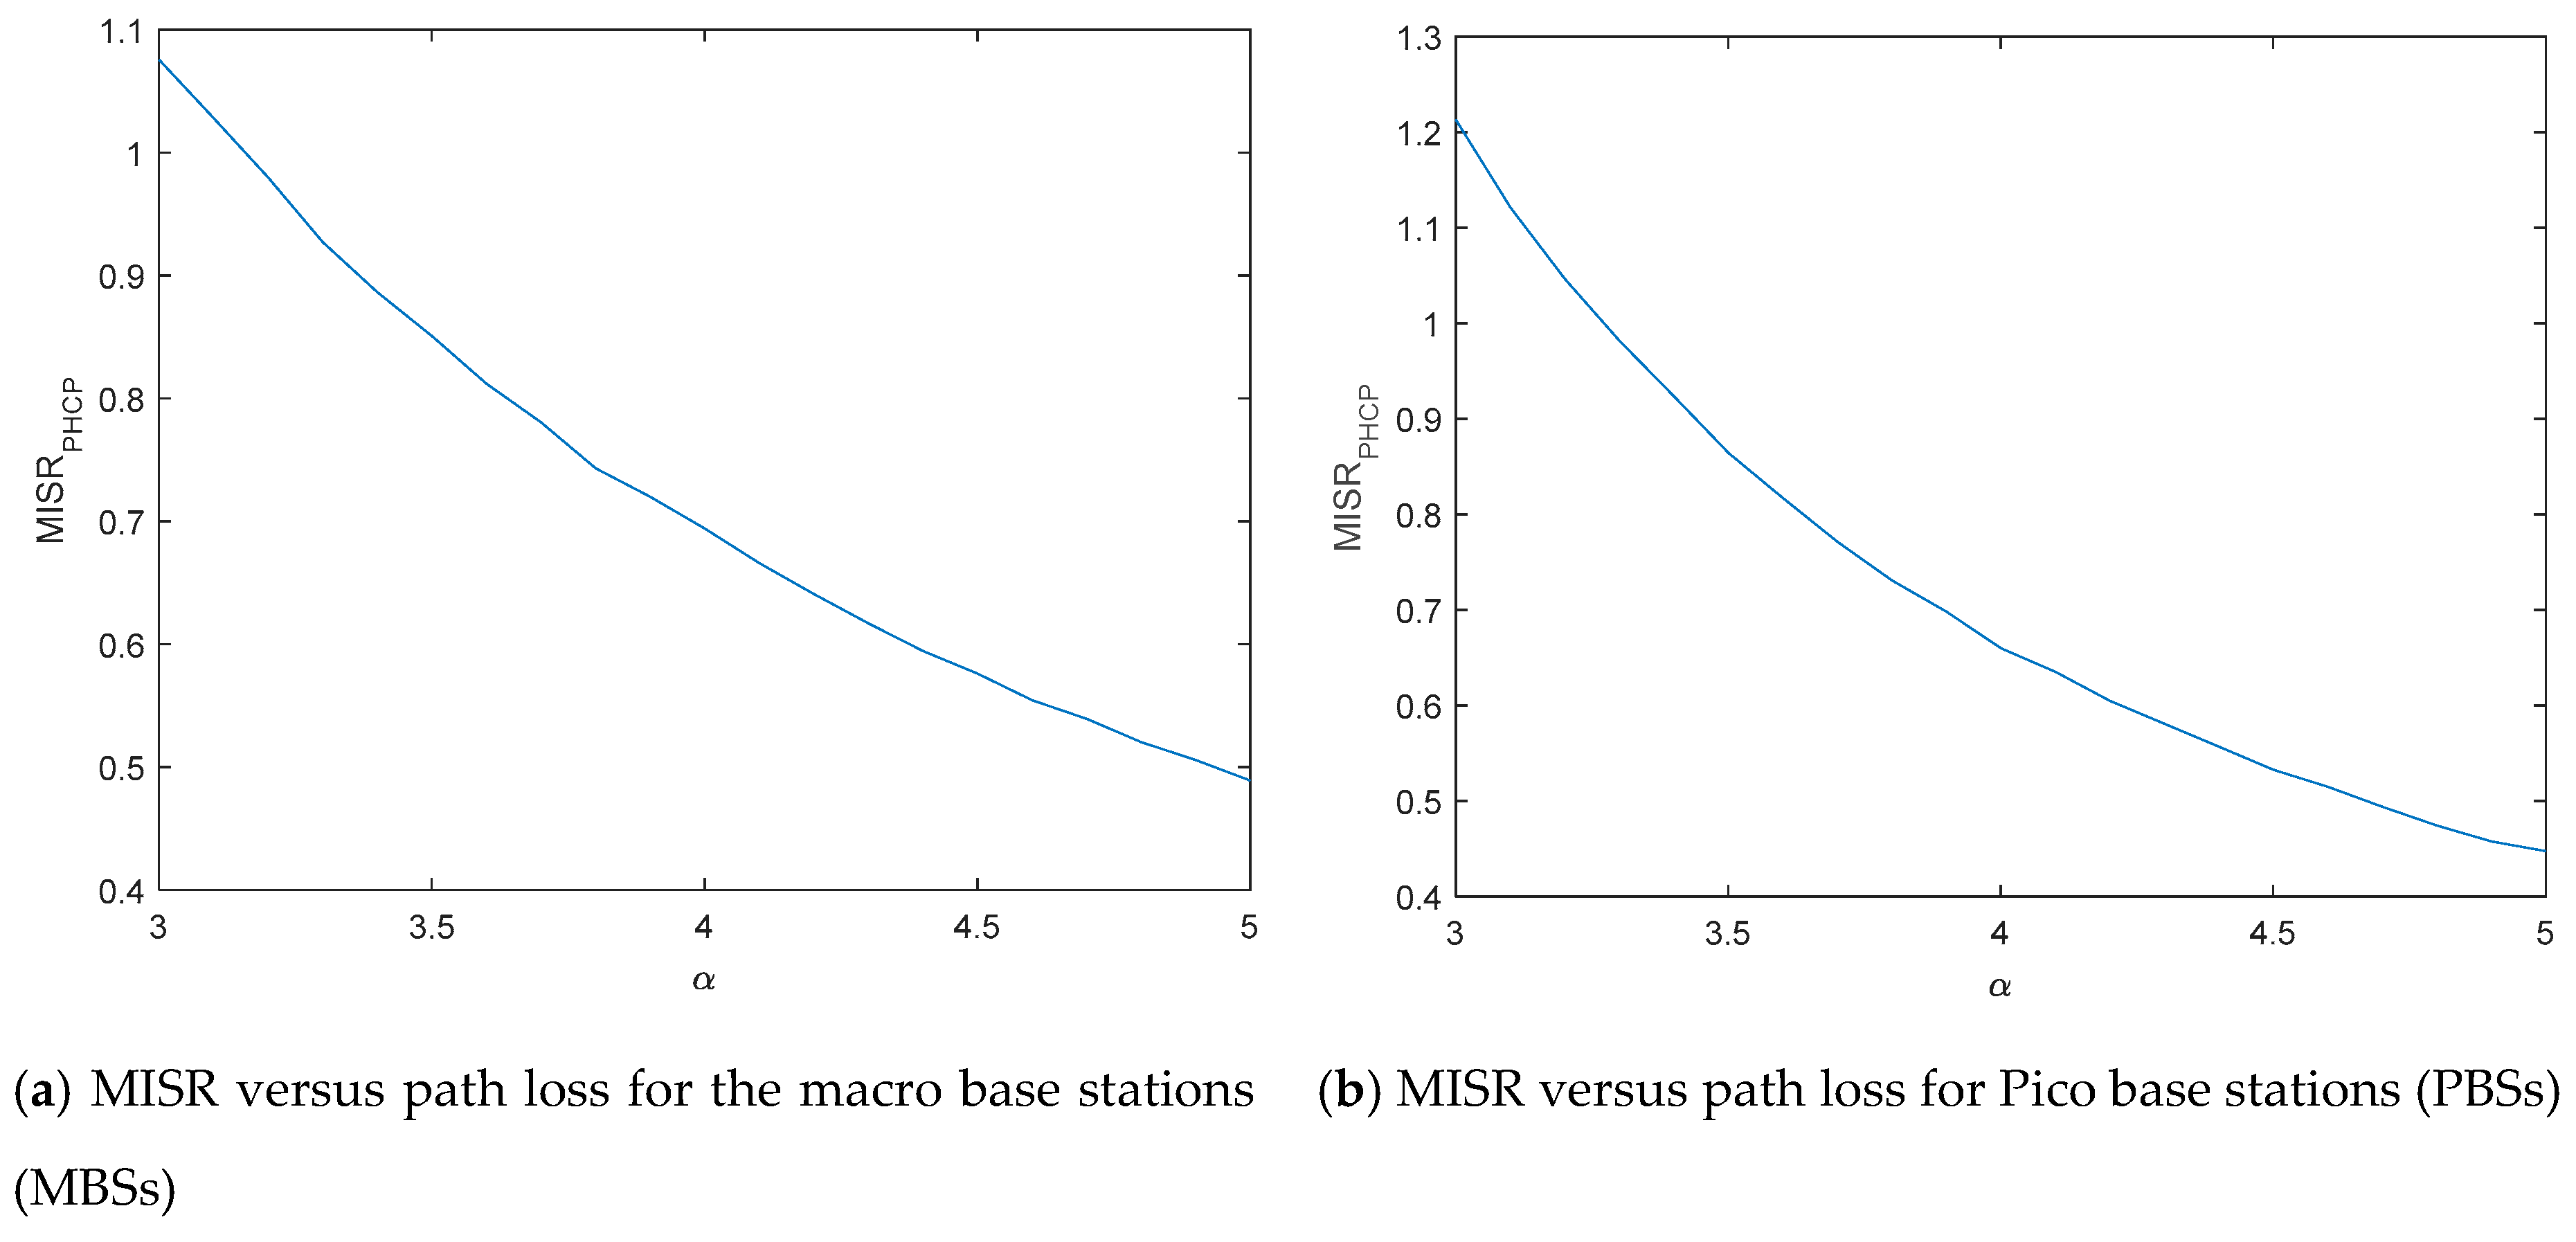
Figure 3.
Coverage probability for the two-tier PPP-PPP network and two-tier MHCP-MHCP network.
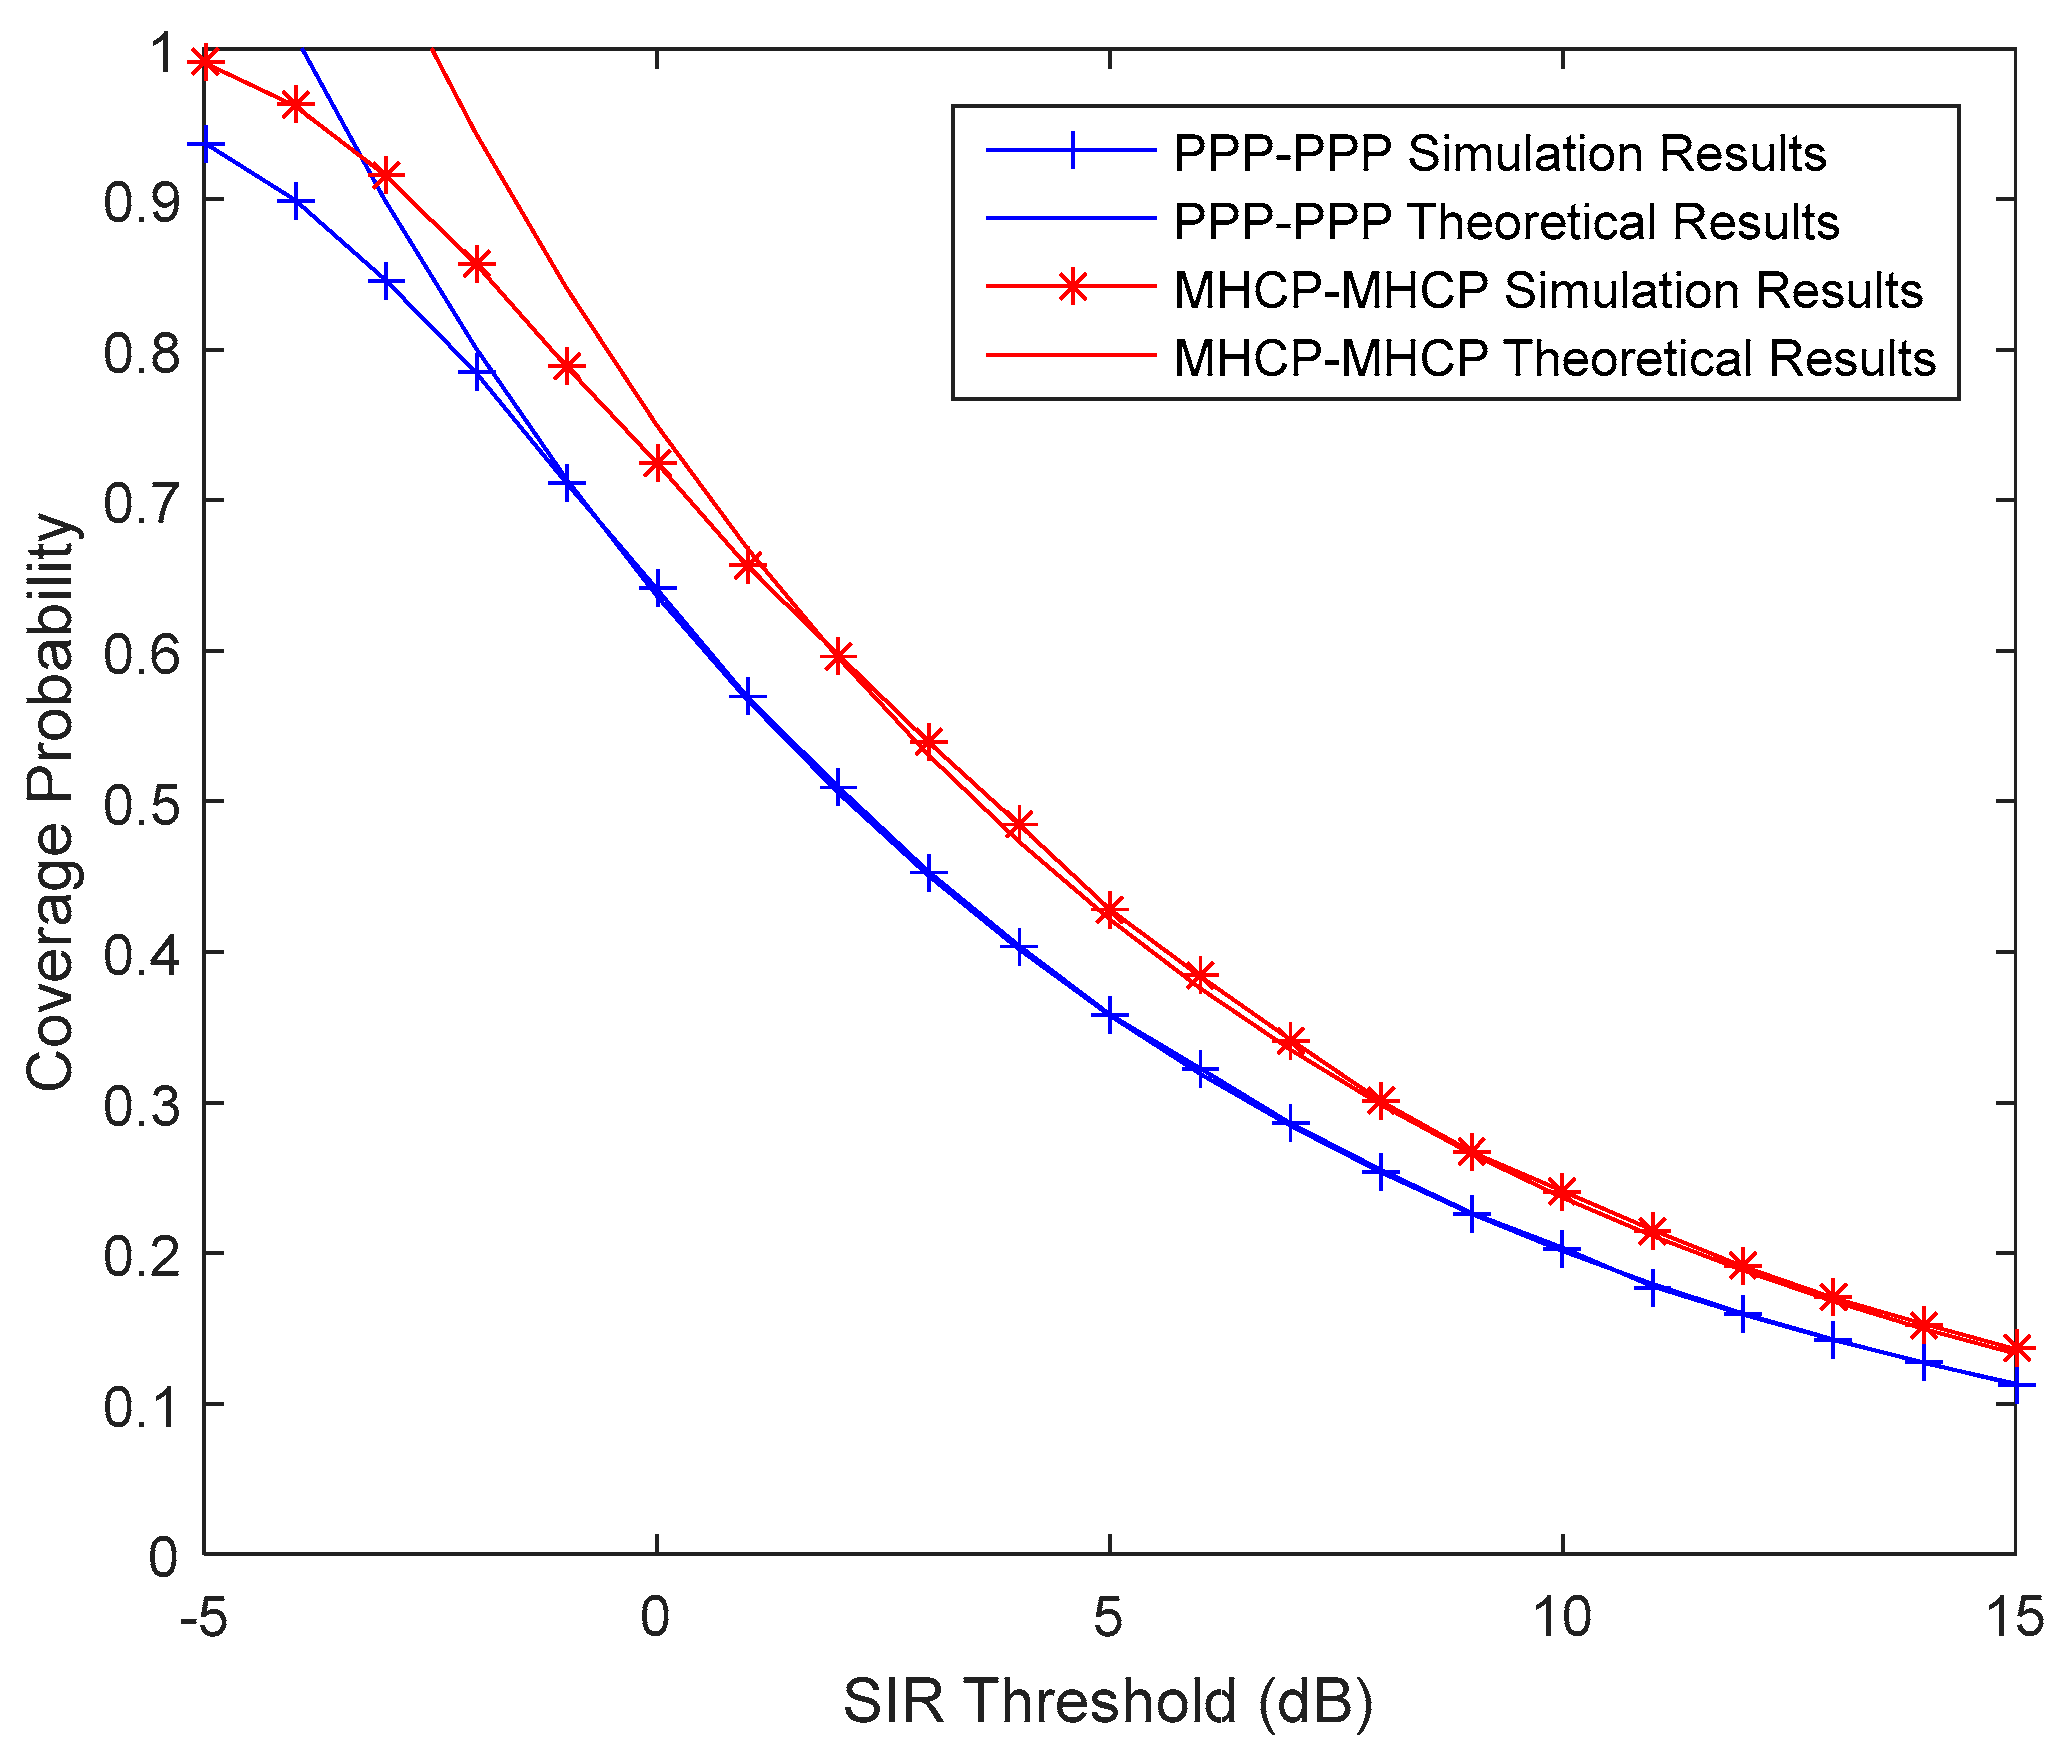
Figure 4.
Network energy efficiency (EE) versus picocell base station (BS) transmit power.
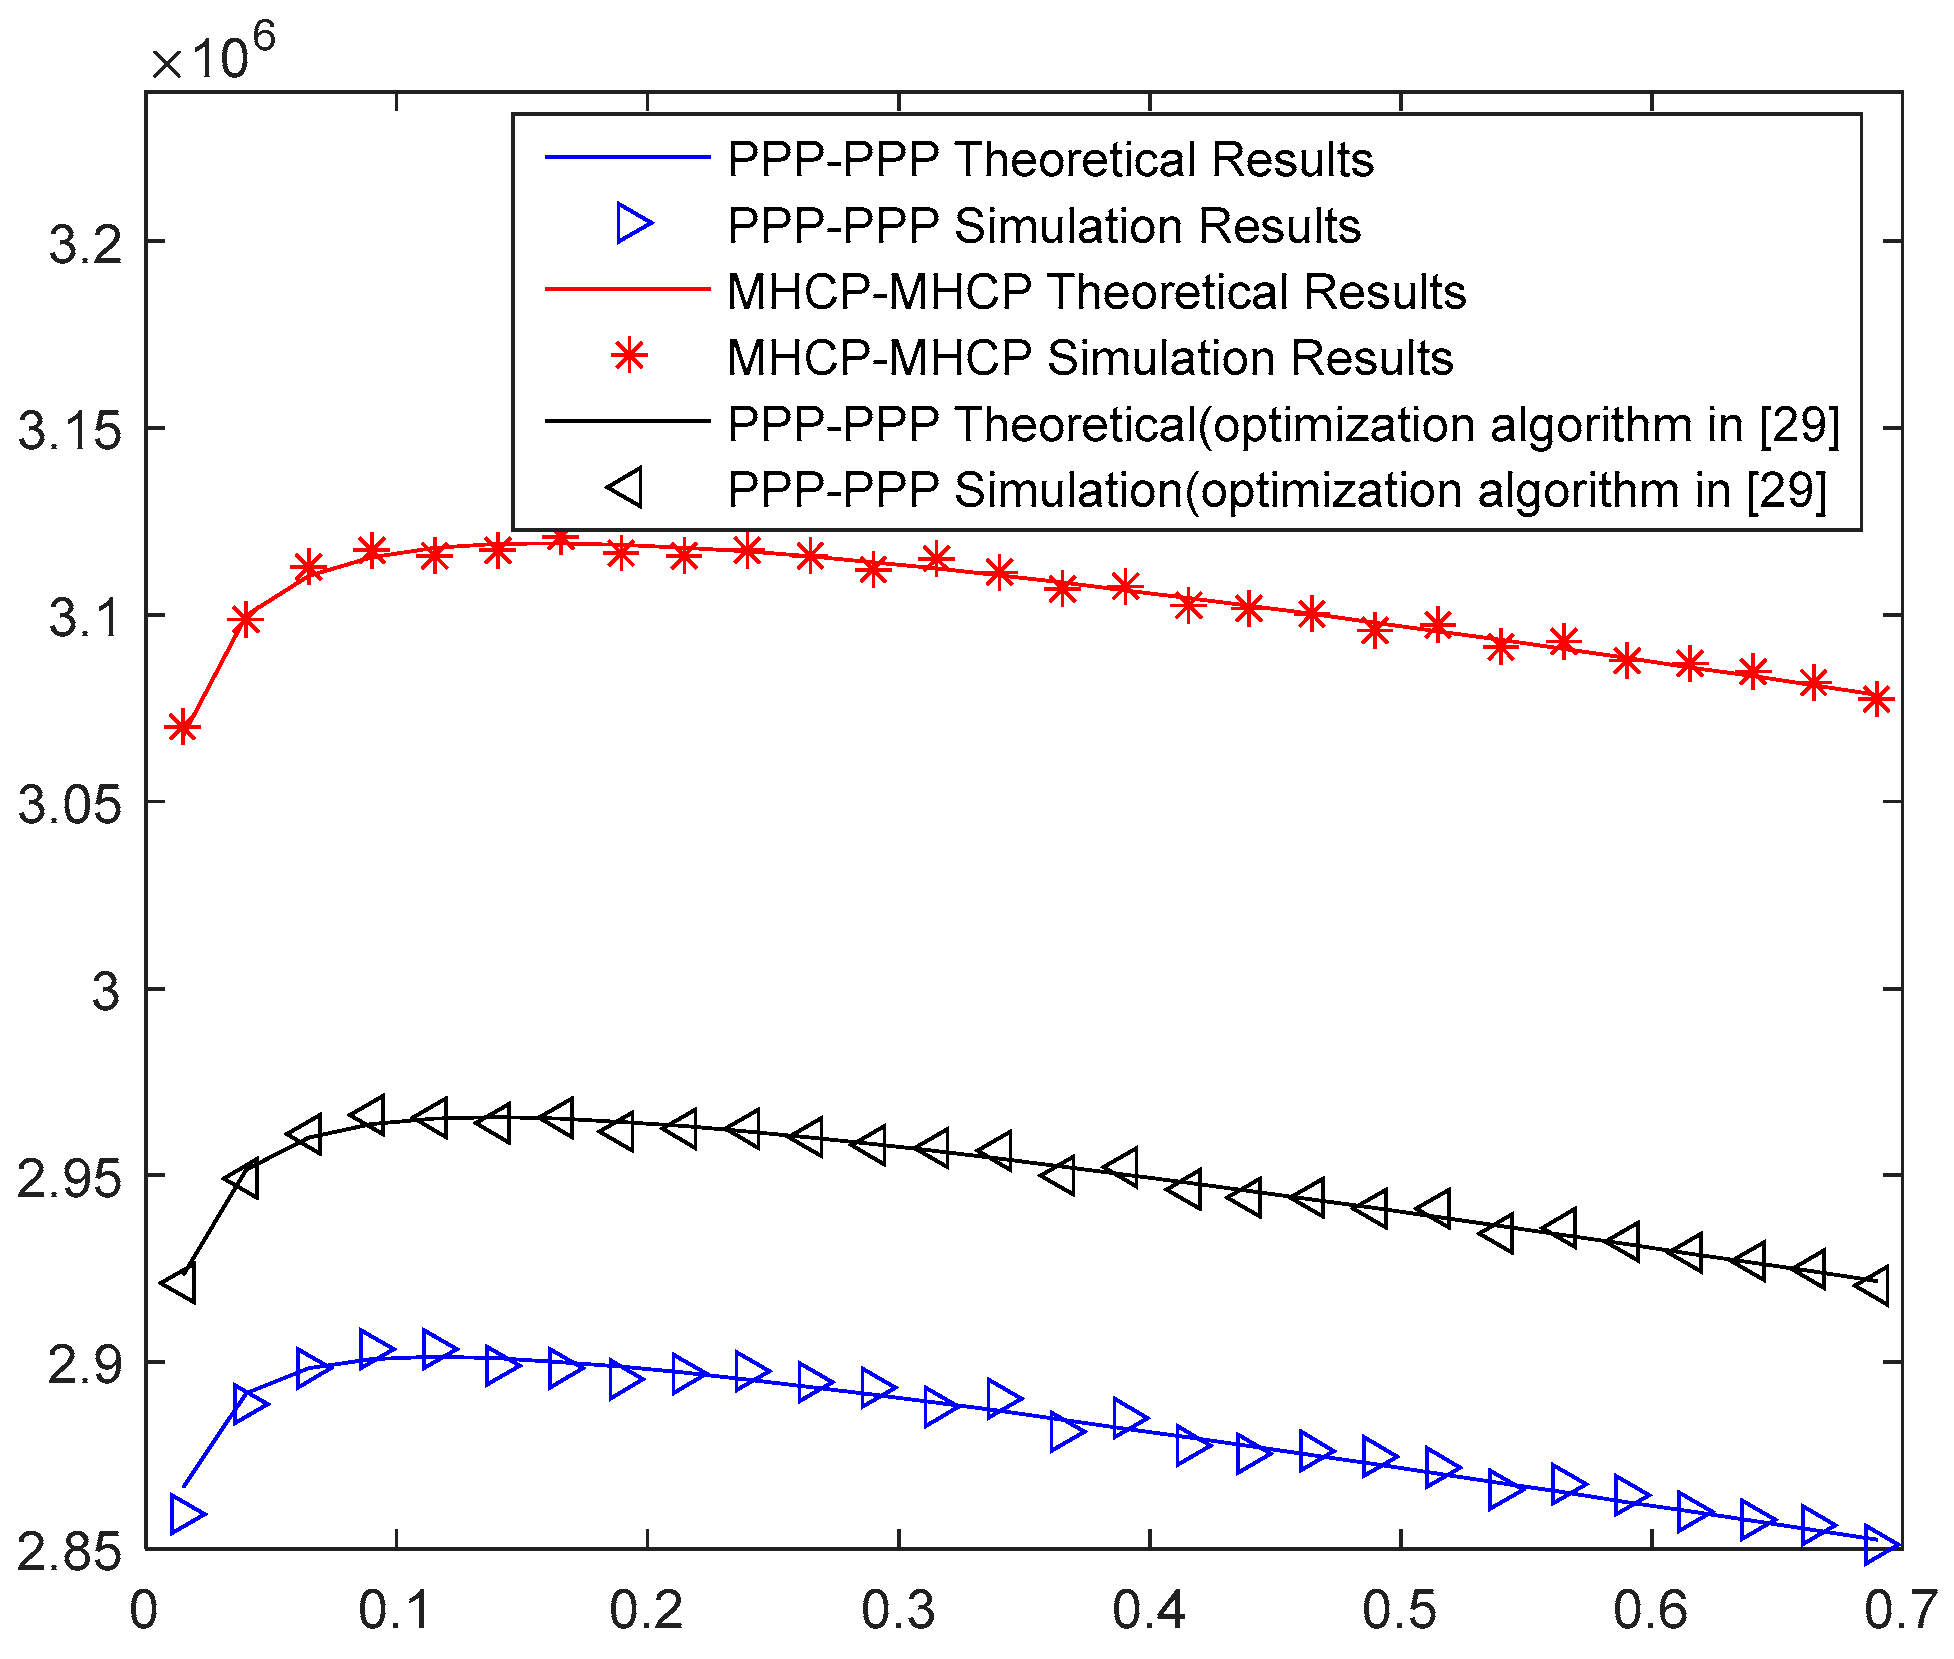
Figure 5.
Network energy efficiency versus macrocell BS transmit power.

Table 1.
Simulation parameters.
| Parameters Name | Values |
|---|---|
| Bandwidth | 107 Hz |
| MHCP-MHCP network area | 1000 × 1000 m2 |
| density of MUs, λu | 0.15 m−2 |
| density of MBSs, λ1-MHCP | 2 * 10−5 m−2 |
| density of PBSs, λ2-MHCP | 2 * 10−4 m−2 |
| repulsion radius of MBSs | 100 m |
| repulsion radius of PBSs | 50 m |
| path-loss exponent, α | [3, 5] |
| circuit power consumption of MBS, PC1 | 130 W |
| transmit power of MBS, PT1 | 20 W |
| number of transmit antenna elements of MBS, NTR1 | 6 |
| slope of power consumption depends on load of MBS, θ1 | 4.7 |
| circuit power consumption of PBS, PC2 | 6.8 W |
| transmit power of PBS, PT2 | 0.13 W |
| number of transmit antenna elements of PBS, NTR2 | 2 |
| slope of power consumption depends on load of PBS, θ2 | 4.0 |
Table 2.
Fitted correlation coefficients (with 95% confidence bounds).
| Coefficients Name | a | b | c |
|---|---|---|---|
| 1-th tier network (MBSs) | 5.917 (5.55, 6.285) | −1.551 (−1.641, −1.461) | 0.001449 (−0.04122, 0.04412) |
| 2-th tier network (PBSs) | 18.09 (16.82, 19.36) | −2.602 (−2.678, −2.527) | 0.1721 (0.1558, 0.1883) |
© 2019 by the authors. Licensee MDPI, Basel, Switzerland. This article is an open access article distributed under the terms and conditions of the Creative Commons Attribution (CC BY) license (http://creativecommons.org/licenses/by/4.0/).
Share and Cite
MDPI and ACS Style
Yang, J.; Pan, Z.; Guo, L. Coverage and Energy Efficiency Analysis for Two-Tier Heterogeneous Cellular Networks Based on Matérn Hard-Core Process. Future Internet 2020, 12, 1. https://doi.org/10.3390/fi12010001
AMA Style
Yang J, Pan Z, Guo L. Coverage and Energy Efficiency Analysis for Two-Tier Heterogeneous Cellular Networks Based on Matérn Hard-Core Process. Future Internet. 2020; 12(1):1. https://doi.org/10.3390/fi12010001
Chicago/Turabian StyleYang, Jie, Ziyu Pan, and Lihong Guo. 2020. "Coverage and Energy Efficiency Analysis for Two-Tier Heterogeneous Cellular Networks Based on Matérn Hard-Core Process" Future Internet 12, no. 1: 1. https://doi.org/10.3390/fi12010001
Note that from the first issue of 2016, this journal uses article numbers instead of page numbers. See further details here.