Article

MU R-CNN: A Two-Dimensional Code Instance Segmentation Network Based on Deep Learning

1
School of Information Engineering, Xijing University, Xi’an 710123, China
2
Shaanxi Key Laboratory of Integrated and Intelligent Navigation, Xi’an 710068, China
3
Beijing Jiurui Technology co., LTD, Beijing 100107, China
4
Xi’an University of Posts and Telecommunications, Xi’an 710121, China
5
Dongfanghong Middle School, Anding District, Dingxi City 743000, China
6
Unit 95949 of CPLA, HeBei 061736, China
7
Xi’an Haitang Vocational College, Xi’an 710038, China
*
Author to whom correspondence should be addressed.
Future Internet 2019, 11(9), 197; https://doi.org/10.3390/fi11090197
Submission received: 29 July 2019 / Revised: 23 August 2019 / Accepted: 7 September 2019 / Published: 13 September 2019
(This article belongs to the Special Issue Manufacturing Systems and Internet of Thing)

Abstract

:
In the context of Industry 4.0, the most popular way to identify and track objects is to add tags, and currently most companies still use cheap quick response (QR) tags, which can be positioned by computer vision (CV) technology. In CV, instance segmentation (IS) can detect the position of tags while also segmenting each instance. Currently, the mask region-based convolutional neural network (Mask R-CNN) method is used to realize IS, but the completeness of the instance mask cannot be guaranteed. Furthermore, due to the rich texture of QR tags, low-quality images can lower intersection-over-union (IoU) significantly, disabling it from accurately measuring the completeness of the instance mask. In order to optimize the IoU of the instance mask, a QR tag IS method named the mask UNet region-based convolutional neural network (MU R-CNN) is proposed. We utilize the UNet branch to reduce the impact of low image quality on IoU through texture segmentation. The UNet branch does not depend on the features of the Mask R-CNN branch so its training process can be carried out independently. The pre-trained optimal UNet model can ensure that the loss of MU R-CNN is accurate from the beginning of the end-to-end training. Experimental results show that the proposed MU R-CNN is applicable to both high- and low-quality images, and thus more suitable for Industry 4.0.

1. Introduction

Computer vision (CV) is an interdisciplinary subject, involving computer engineering, physics, physiology, artificial intelligence, signal processing, and applied mathematics, etc. In the past two decades, it has developed vigorously and been widely used in various fields. In CV, object identification and tracking based on vision object analysis and processing has been deeply involved in various fields of the national economy. It plays an important role in tracking and detection [1,2,3], computer engineering [4,5], physical sciences, health-related issues [6], natural sciences, and the industrial academy [7] among other fields. The utilization of vision systems can greatly improve the ambient perception and adaptability of intelligent manufacturing, making it an increasingly indispensable key functional component of intelligent manufacturing. With the development of computer vision and semiconductor technology, vision sensors have gradually become a research hotspot in academia and industry. At the same time, some vision sensor products are widely put into use, especially in the field of industrial manufacturing and video monitoring [8,9,10,11,12,13,14]. One advantage of CV over humans is the ability to use a wide variety of cameras to produce images that simplify visual problems. For example, the RGB-D (Red Green Blue and Depth) camera [8,11], which has attracted much attention in industry and academia, has been put into practice in many conditions by virtue of depth information.
Industry 4.0 is a term for the industrial automation revolution. In Industry 4.0, the integration of the Internet of Things (IoT) technology and the production process has created new opportunities for intelligent manufacturing [15,16,17,18,19]. IoT technology provides the means for comprehensive monitoring of industrial operations through ubiquitous sensing, and forms a closed data product management cycle that records information from any stage to influence processes and decisions at other stages. Further, data from each stage of the production process can be used to increase product quantity, flexibility, and productivity. To achieve this vision, information must be collected by sensing technology from the objects among the entire intelligent factory. Among all possible solutions, the most popular way to identify and track all the objects is to add tags [15]. However, most companies still use cheap QR (the most popular two-dimensional (2D) code) tags to identify objects, so the QR tag detection and segmentation algorithm based on computer vision has become indispensable.
One example of the widespread use of QR tags in Industry 4.0 is the product traceability system (PTS) [20,21,22]. In recent years, the safety of consumer products, such as food and drugs, has become a major research challenge, e.g., the horse meat scandal in Europe, mad cow disease, and African swine fever. In response, both the manufacturing and sales sides have become more customer-oriented and need to address these issues more quickly. PTS is used to ensure the authenticity of the product throughout its life cycle, thereby reducing the possibility of adverse publicity, minimizing recall costs, stopping the sale of unsafe products, and making extensive use of cheap barcode or QR tags. Another example of using the 2D code in Industry 4.0 smart workshops is the automated guided vehicle (AGV) for visual navigation [23]. The AGV is an important part of Industry 4.0 [24]. With the gradual development of factory automation, computer integrated manufacturing system technology, and the automated three-dimensional warehouse, as a piece of necessary automatic handling equipment and a high-precision delivery platform, AGV has been rapidly developed in its application scope and technical level. Autonomous navigation is one of the most challenging in AGV [23,24,25,26,27]. The combination of 2D tag and vehicle camera can realize the autonomous high-precision positioning of visual navigation.
In the smart factory of in Industry 4.0, images of products labeled with QR tags can be captured by visual sensors, which then combined with computer vision (CV) technology to locate and segment the tags, and to read the information in the tags. In CV, instance segmentation [28] can be used to detect the position of tags while segmenting each instance. Instance segmentation is a challenging issue because it requires the correct detection of all objects in an image, while also precisely segmenting each instance. The standard performance measure that is commonly used for instance segmentation is intersection-over-union (IoU). In this paper, it has been proven that, due to the rich texture of QR tags, even a small misalignment may cause a large decrease of IoU. Currently, Mask R-CNN [29] is used to realize instance segmentation, and it introduces bilinear interpolation operation in RoiAlign layer to solve misalignment problem, but the completeness of the instance mask cannot be guaranteed, resulting in a low IoU of QR tag mask. In order to solve QR tag instance segmentation problem, a network named mask UNet region-based convolutional neural network (MU R-CNN) is proposed in this paper. Because UNet [30] can achieve good segmentation of fine textures, in the proposed MU R-CNN, we added a UNet branch to the Mask R-CNN [29] in order to reduce the impact of low image quality on IoU through texture segmentation. Our UNet branch does not depend on the features of Mask R-CNN, so the training process of the UNet branch can be carried out independently, in advance. In particular, because the copy and crop channels in the up-sampling section of UNet enable the network to transfer contextual information from the shallow layer to the deeper layer, and thus can effectively combine low-resolution and high-resolution information to achieve the purpose of precise segmenting texture of QR tag from noise polluted candidate images. So, the UNet branch in this paper can effectively reduce the impact of image noise on IoU. In order to optimize the IoU, dice-loss is calculated by the UNet branch‘s prediction output and ground truth, which is then used to measure the IoU loss. Experimental results show that the proposed Mask UNet Region-based Convolutional Neural Network (MU R-CNN) can achieve stable improvement on all backbone networks. Furthermore, compared with the existing state-of-the-art QR detection-based algorithms in [31], the MU R-CNN is applicable to both high- and low-quality images, which is more suitable for Industry 4.0. In the future, with the application of various new vision sensors that are becoming more and more popular, if the tag instance segmentation algorithm such as the proposed MU R-CNN is added to other state-of-the-art target tracking algorithms based on computer vision, it will vigorously promote the related research community.

2. Related Works

Since the emergence of QR code, the detection algorithm has always been a hot research topic. Li [31] and Zhang [32] conducted detection through position detection patterns (PDP). PDP-based methods are mainly focused on the images with high resolution, e.g., Li [31] proposed a method based on run-length coding, and the experiment shows that their method is time-saving and suitable for real-time application. Dubská [33] use lines to locate the QR code images. Dubská [33] located QR code by searching two sets of lines which meet the requirement that they are vertical to each other, and the detection method of the segment is the Hough transform. Li [34] use morphological methods, but the speed is slow. Grósz [35] and Chou [36] use the neural network (NN) method, and achieve good effect. Lin [37] use HOG and Adaboost to locate the location of QR codes. In [38], we proposed a QR code positioning method based on BING and Adaboost-SVM.
From the above references, it can be noticed that Lin [37] and Yuan [38] belongs to the general object detection method and Ref. [31,32,33,34,35,36] to the dedicated QR code detection method. These dedicated QR code detection methods are also designed on the basis of the general object detection principle.
On the other hand, general object detection methods can be usually divided into three steps: first, identify some areas that may contain targets on a given image (these areas are often referred to as “candidate regions” or “candidates”), then extract features from these candidate regions, and finally classify these features as the input of classifiers.
As the first step of the general objects positioning method, candidate region selection is to roughly locate the location of the target. The target can appear anywhere in the image, and the size of the target can vary. The naïve candidate selection algorithm is based on the sliding window, which reduces algorithm efficiency because it is a simple exhaustive method with high time complexity and much redundancy. In addition, the size and aspect ratio of sliding windows are usually fixed, for targets with large changes in size and proportion, good candidates cannot be obtained. As mentioned above, a typical sliding window detector has many redundant candidate regions and requires a large number of classifiers to evaluate an image. One approach to overcome the tension between computational tractability and high detection quality is the notion of “detection proposal” (sometimes called “objectness” or “selective search”). Later, more efficient and accurate region selection algorithms were developed, such as Selective Search, Edge Boxes [39] and so on. Hosang [40] provided an in-depth analysis of twelve detection proposal methods along with four baselines regarding proposal repeatability, ground truth annotation recall on PASCAL, ImageNet, and MS COCO, and their impact on DPM, R-CNN, and Fast R-CNN detection performance. According to Hosang [40], methods such as Selective Search and Edge Boxes seem to strike a better balance between recall and repeatability, if precise proposals are required. However, compared with the region proposal network (RPN) [41] based on CNN, Selective Search, Edge Boxes and other above-mentioned detection proposal methods are still much slower.
The second step of general objects positioning method is extracting features from candidate regions. In traditional machine learning, manual features are generally used as the input of a model. It is difficult to design a robust manual feature for a specific target due to the diverse shapes of the target, complex background changes, angle of view and illumination changes, etc. The quality of the feature will directly affect subsequent classification stage.
After obtaining the features of candidate target area, the third step is classification. These manual features in candidate target area extracted in the second step are classified as the input of classifier. Common classification algorithms include SVM, Adaboost, etc. After completing the task of object detection or instance segmentation, some standard should be used to measure the quality of the algorithm. The standard performance measure that is commonly used for detection and instance segmentation is IoU. For example, it has been widely used in Pascal VOC, MS COCO and other data sets. Given an image, the IoU measures the similarity between the predicted and the ground-truth region for an object present in the image and is defined as the size of the intersection divided by the union of the two regions. Therefore, the improvement of instance segmentation should take the improvement of IoU as the main target.
Therefore, the main problems of traditional target detection algorithms are summarized as follows: Firstly, candidate region selection algorithms have high time complexity or generate a lot of redundant candidates; Secondly, the design of manual features is difficult, and features are lack robustness to various changes of the target. For feature extraction, in the field of deep learning, manual features are no longer used, but neural network is used for feature learning. The common tool is convolutional neural network (CNN). To solve methods of the target detection problem in CNN, there are roughly two categories of methods. One is a two-stage algorithm based on region proposal, such as the R-CNN series [41], and the other is a one-stage algorithm based on the regression method, which is typically represented by a YOLO series [42,43,44] and Single Shot MultiBox Detector (SSD) [45].
In two-stage target detection algorithms based on CNN, region proposal can be implemented in two ways. The first way is the traditional candidate selection algorithm, such as Edge Boxes [39], etc. This kind of algorithm uses the information of image color, texture, edge and so on. These methods are more efficient and accurate than the violent enumeration method of sliding window. Such methods can be summarized as region proposal + CNN, typically represented by R-CNN or Fast R-CNN. Another way of implementing region proposal is to use the region proposal network (RPN) for candidate selection, whose core idea is to use CNN to generate candidate regions. The typical representation is Faster R-CNN [41].
For the one-stage algorithms, CNN first extracts feature map from input image, and then carries out direct regression operation on these feature map to predict the borders and categories of the targets. As the region proposal process is omitted, the detection speed of the target is greatly improved, but positioning is not accurate enough.
In Industry 4.0 and other QR tag application occasions, after detecting the target position, QR tag texture semantic segmentation is also required to decode the information which have encoded in the QR tag. Instance Segmentation can detect the position of tags while segmenting each instance. By doing this, both the detection and texture segmentation of QR tags can be solved simultaneously. However, instance segmentation is a challenging task in computer vision, because it requires classification and location at the instance level, while semantic segmentation requires classification at the pixel level. Early methods of instance segmentation, such as Deepmask [46], Sharpmask [47] and InstanceFCN [48], use Faster R-CNN to classify and locate instances, but the shortcoming of Faster R-CNN is that the spatial misalignment of target positioning [29]. In [49] FCIS presents the first fully convolutional end-to-end solution for instance-aware semantic segmentation task. K. He [29] through experimental verification shows that FCIS exhibits systematic errors on overlapping instances and creates spurious edges, and the effect was worse than the Mask R-CNN which is proposed in Ref. [29]. Mask R-CNN is a simple, flexible and general object instance segmentation framework, and it added a segmentation branch to the Faster R-CNN to segment the instance while detecting. In order to fix the misalignment of Faster R-CNN, Mask R-CNN replaces the RoIPooling layer with the RoiAlign layer, introduces bilinear interpolation operation to solve misalignment problem, and adds a parallel FCN layer, achieving good results in the instance segmentation task.
After detecting the target, it is usually necessary to obtain the track and motion information of the target in the image sequence through object tracking technology, and then the high-level behavior of the object can be understood through the analysis of the motion information. Object tracking technology has been involved in computer vision, pattern recognition, intelligent signal processing, control science and other fields, while research on object tracking technology has also promoted the development of these related fields. The object tracking process has a strong spatio-temporal relationship. By exploiting and utilizing these relationships to extract robust features for tracking, the tracking performance can be stable. The state of the art features and algorithms used in different areas of object tracking and understanding are demonstrated in Ref. [50,51,52,53,54,55,56,57,58,59,60,61,62,63,64,65,66,67,68].

3. Our Contributions

3.1. Problem Presentation and Our Solution

As mentioned above, in Industry 4.0 applications, QR tags are expected to have high positioning accuracy and fine texture semantic segmentation. According to the current research status, the existing instance segmentation algorithms based on deep learning has greater advantages in robustness and can adapt to a variety of complex application scenarios.
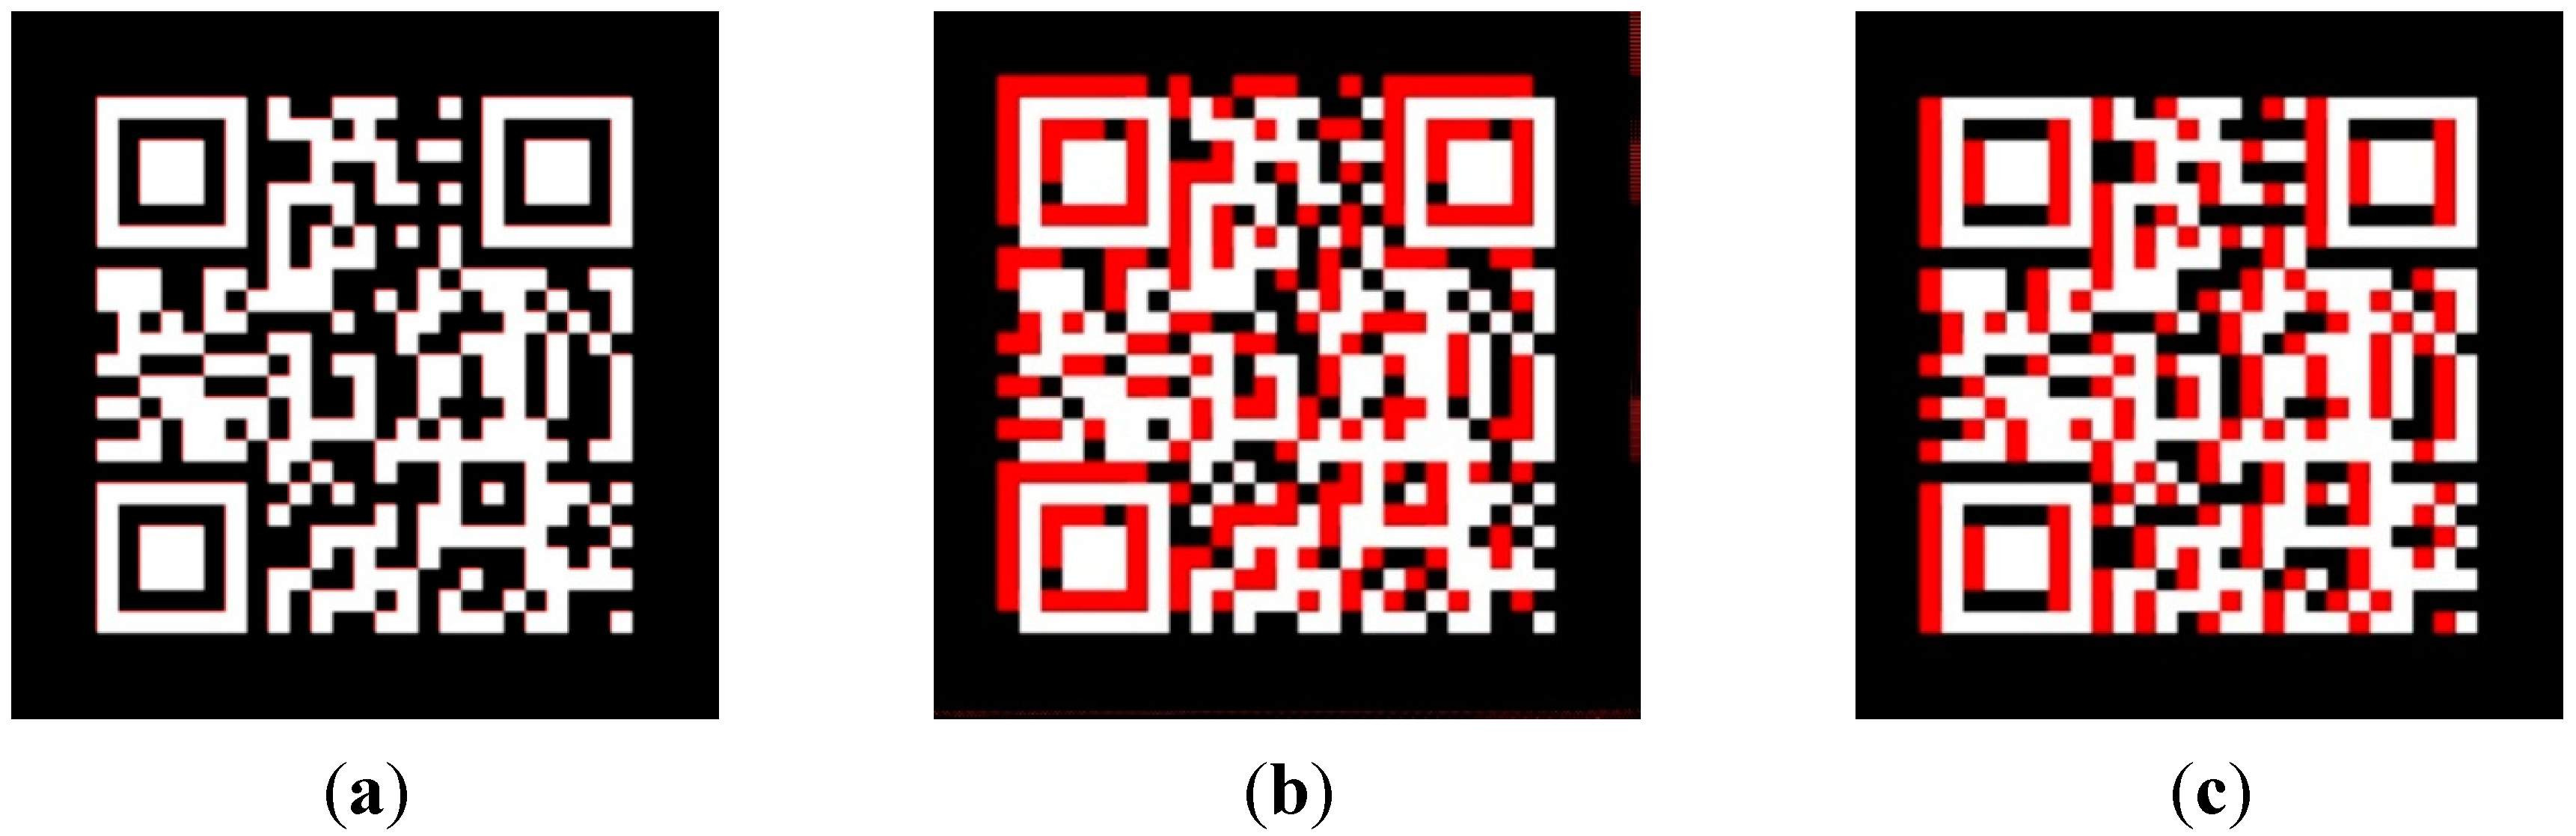
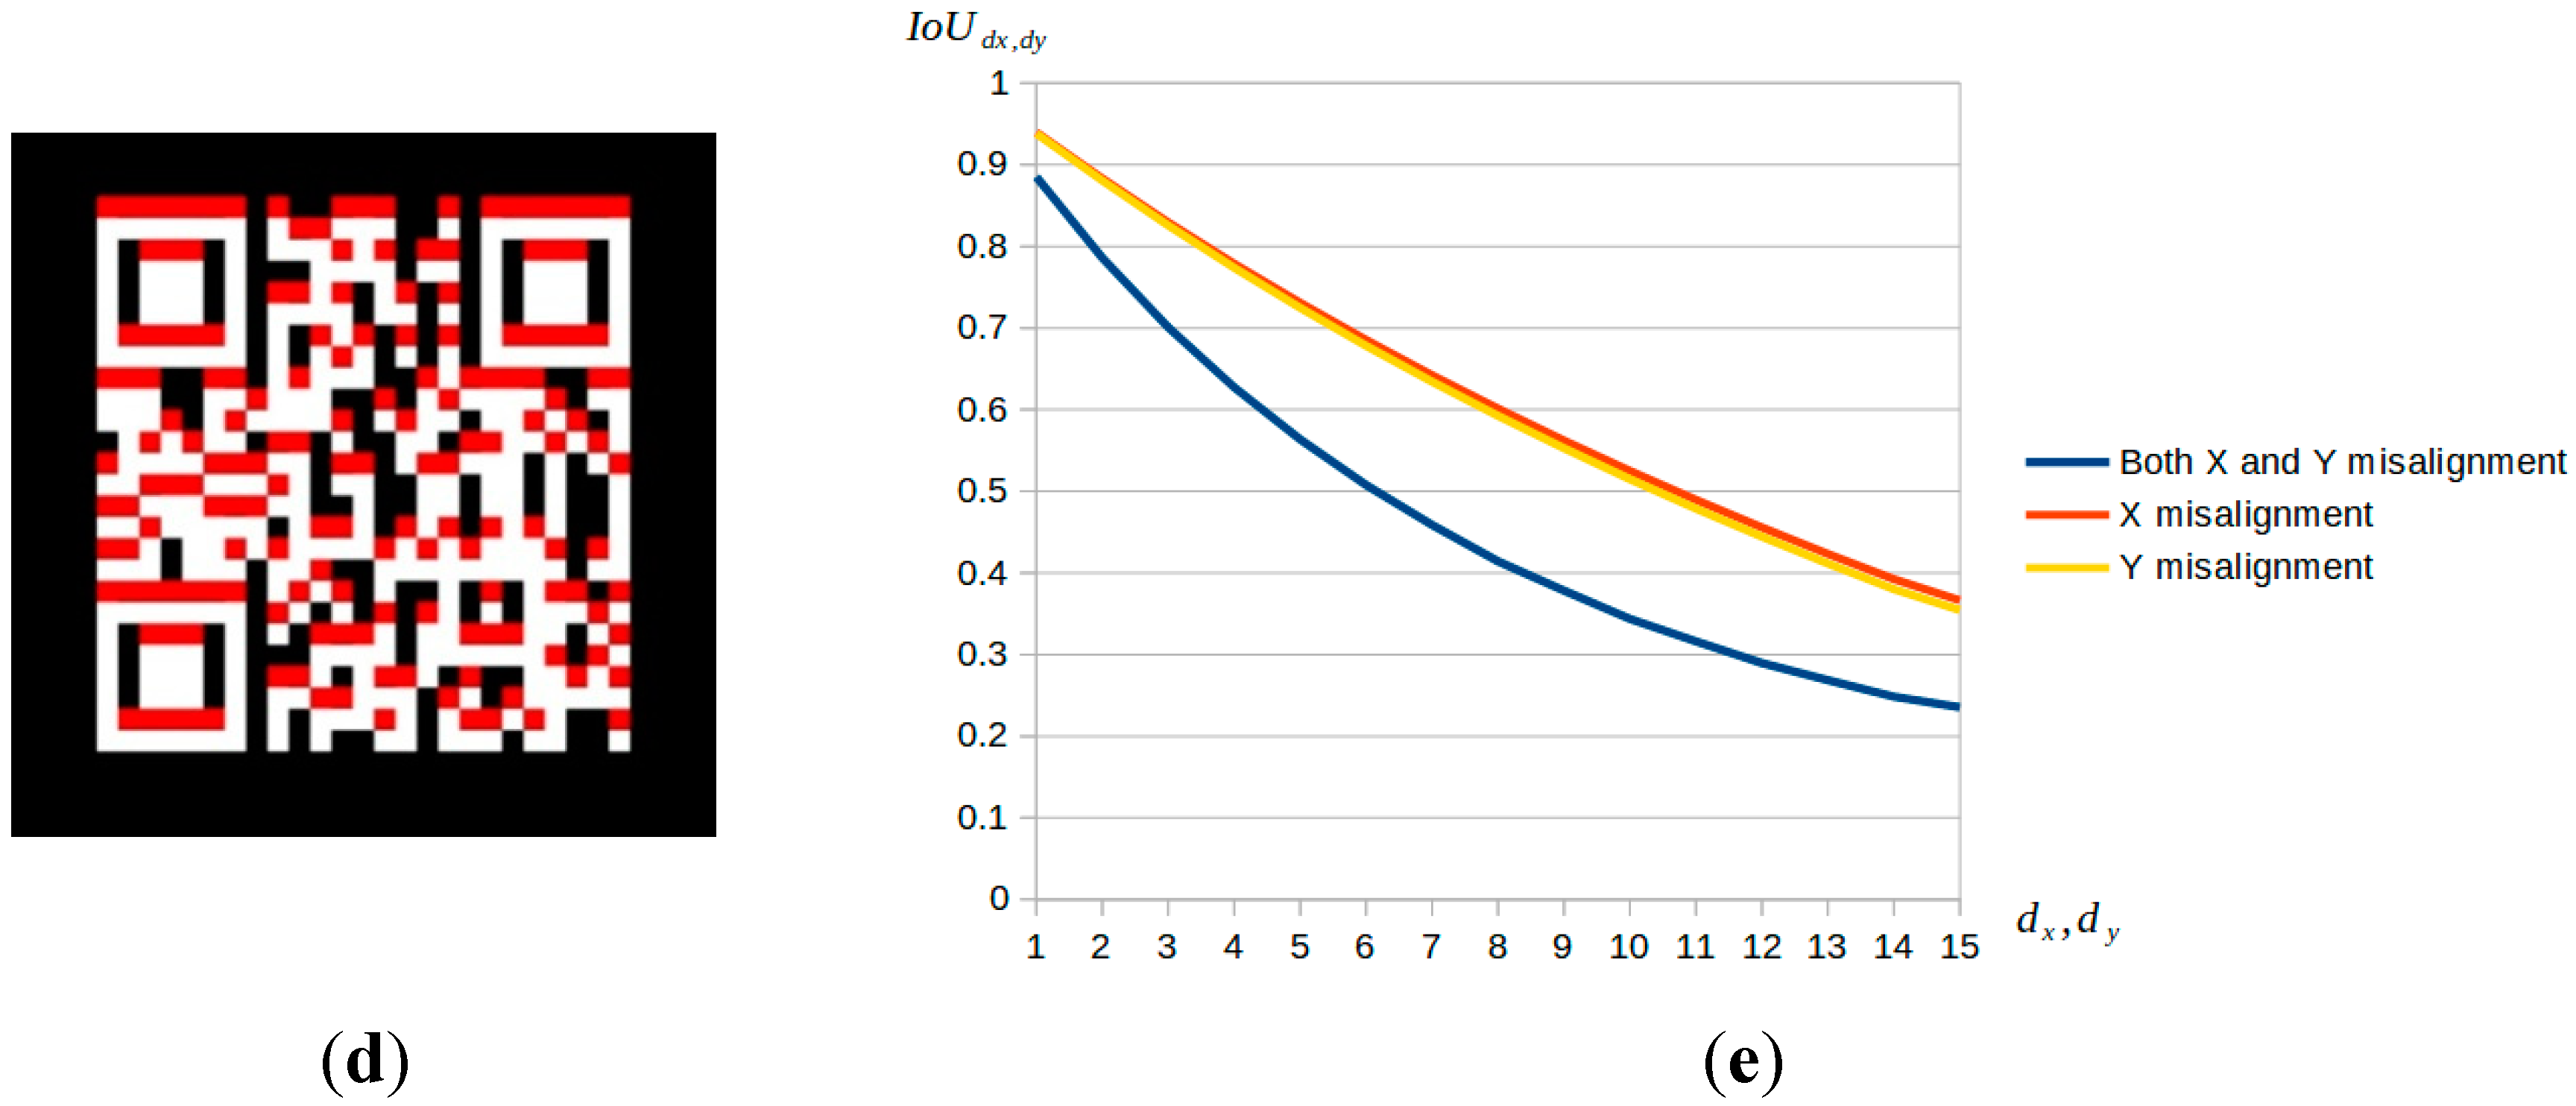
However, instance segmentation is a challenging task, because it requires classification and location at the instance level, while semantic segmentation requires classification at the pixel level. Moreover, QR tag instance segmentation also has special difficulties, which are manifested because QR tags have rich textures, and even small misalignment can cause large IoU reduction. Hence it is difficult for instance segmentation of QR tag. An example of small misalignment causing large IoU reduction problem in QR tag instance segmentation is showed in Figure 1. As can be observed a QR code example image with a size of 512 × 512 pixels is illustrated in Figure 1, the red layer is the predicted output of a neural network (assuming that the output does not have any quality degradation, and is exactly the same as the ground truth image, and it has only misalignment) and white layer is ground truth (GT). Let variables d x and d y to represent the number of pixel misalignment of neural network prediction result and ground truth (GT) in the x and y directions, and set I o U d x , d y to represent the corresponding IoU while d x and d y pixels misalignment. Figure 1a–d display I o U 1 , 1 , I o U 15 , 15 ,   I o U 15 , 0 and I o U 0 , 15 , respectively. Figure 2a shows the I o U d x , d y when d x = d y = 1 , and can also write represented as I o U 1 , 1 . At this time, the offset of predicted output and GT is barely visible to human eyes. But in this case, it turns out that I o U 1 , 1 = 0.885 , and this means the IoU is decrease a lot relative to the change in d x = d y = 1 . Further, the same situation can be observed for I o U 15 , 15 , I o U 15 , 0 and I o U 0 , 15 . As d x and d y go up, I o U d x , d y goes decrease very fast. Figure 2e shows the change curve of I o U d x , d y while d x or d y changes. From the three curves, it can be seen that the value of I o U d x , d y decreases rapidly with the increase of d x or d y .
From the above example, we can deduce that, due to the rich texture of the QR tag, misalignment may cause a sharp decrement of IoU. K. He [29] proved that, in Faster R-CNN, quantization in the RoIPooling layer introduced misalignment between candidate region and the extracted features. Although this may not affect the classification, it has a significant negative effect on predicting pixel-accurate masks.
Hence, it is necessary to find a network that has solved the misalignment problem well as the basis of our research. Mask R-CNN fixed the misalignment problem of Faster R-CNN by using RoiAlign instead of RoIPooling.Therefore, this paper mainly focuses on the research of Mask R-CNN. However, for the segmentation of QR tag instance, Mask R-CNN has the following disadvantages: it is inappropriate to use classification confidence to measure the mask quality since it only serves for distinguishing the semantic categories of proposals, and is not aware of the actual quality and completeness of the instance mask [69]. However, the quality of the instance mask is quantified as the IoU between the instance mask and its ground truth, this makes the quality of Mask R-CNN’s instance mask very poor. Figure 2 shows the predicted output of Mask R-CNN model.
In order to enable Mask R-CNN to predict high-quality instance mask, it is necessary to optimize IoU during training period, and also modify existing evaluation methods of the mask quality and modify mask loss.
However, the problem is how can we optimize the IoU in training? It is possible to directly use binary image of candidate region and its ground truth to calculate IoU. The following example will prove that this method is bad. 
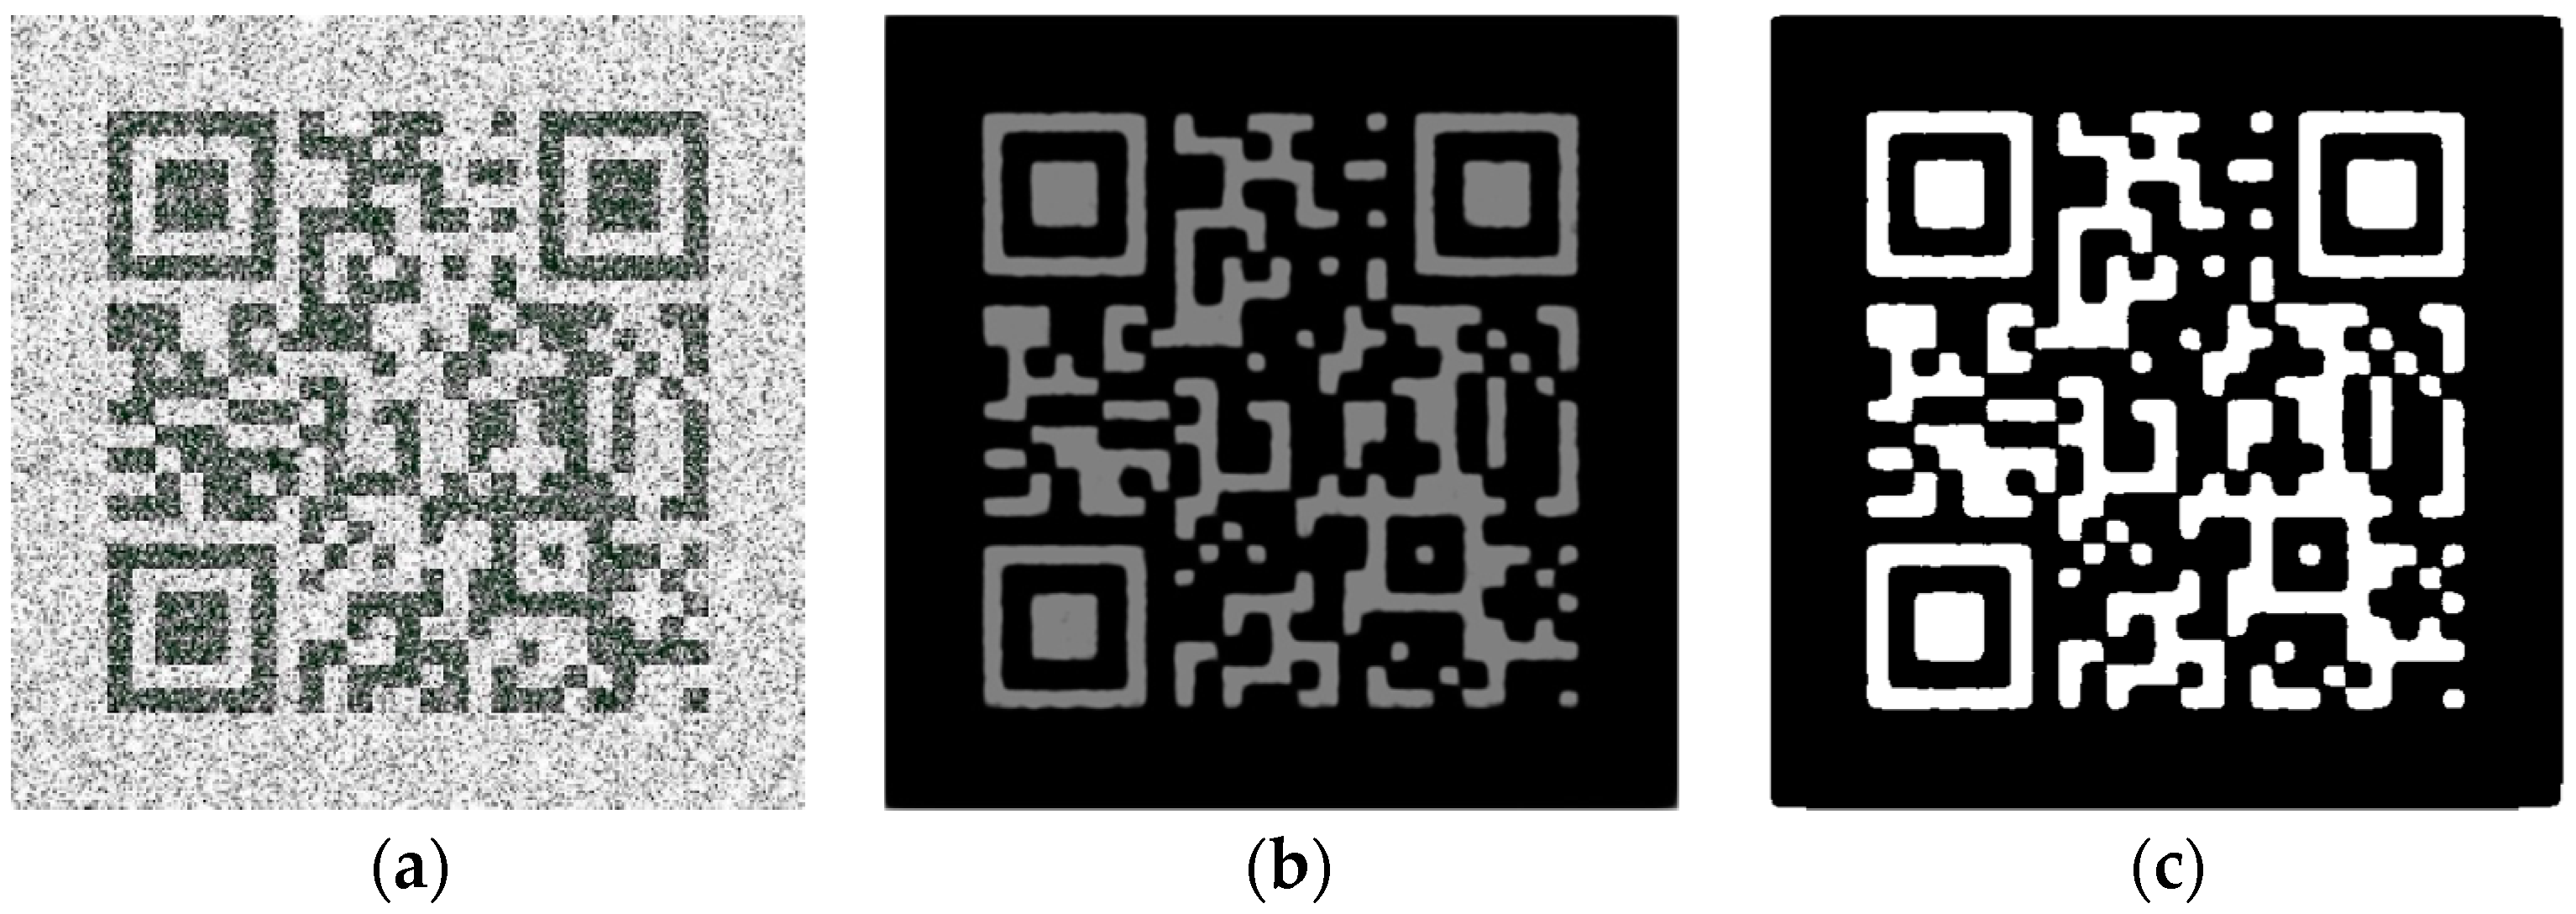
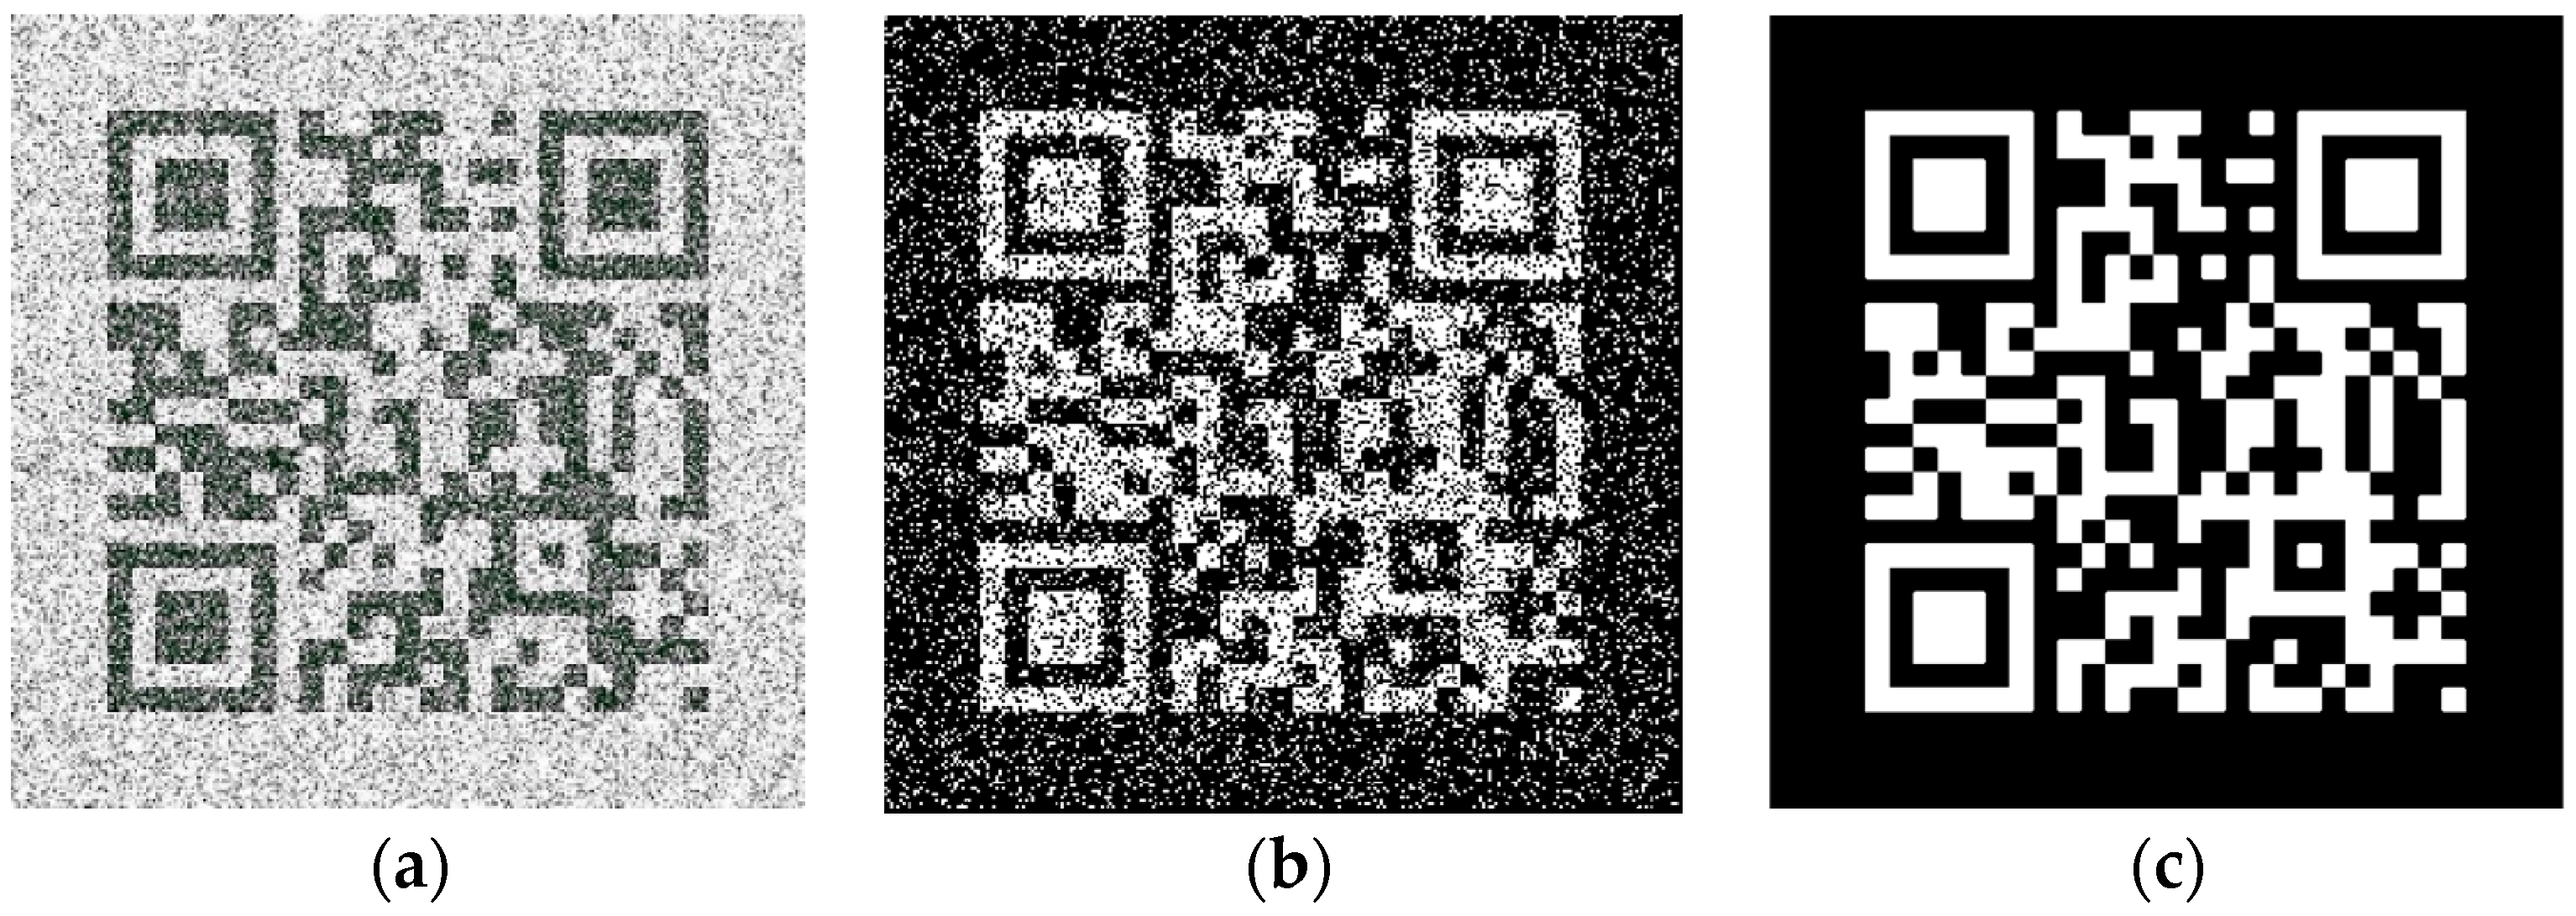
Figure 3a shows a QR tag image with noise pollution, Figure 3b exhibits a binary image of Figure 3a, and Figure 3c is its ground truth. For QR tags, the effective information part is usually printed in black. In Figure 3c, the reason why the effective information part of QR tag is shown. Generally speaking, the ground truth will be marked as white and the background marked as black in most data sets. This paper follows this general rule and marks ground truth as white to facilitate the use of this algorithm in other data sets in the future. Therefore, in the binary image showed in Figure 3b, in order to get the correct value of IoU, it is necessary to invert the gray pixel value during binarization process. The IoU value of Figure 3b,c is 0.55, where the misalignment d x and d y are both zero. The reduction of IoU is caused by noise pollution in candidate image, which has no relationship with misalignment. Therefore, low-quality candidate images can lower the value of IoU, disabling it from accurately measuring the completeness of the instance mask, and also making it difficult to obtain a high-quality mask image.
Therefore, when calculating the IoU of candidate areas, methods should be adopted to conduct texture segmentation of the candidate image, so as to obtain high-quality texture image. Then, calculate the IoU with ground truth. In this paper, we propose to add UNet [30] branch to Mask R-CNN to segment the texture of candidate image and obtain enhanced texture information. After binarization of output image from UNet branch, we calculate the IoU value with ground truth.
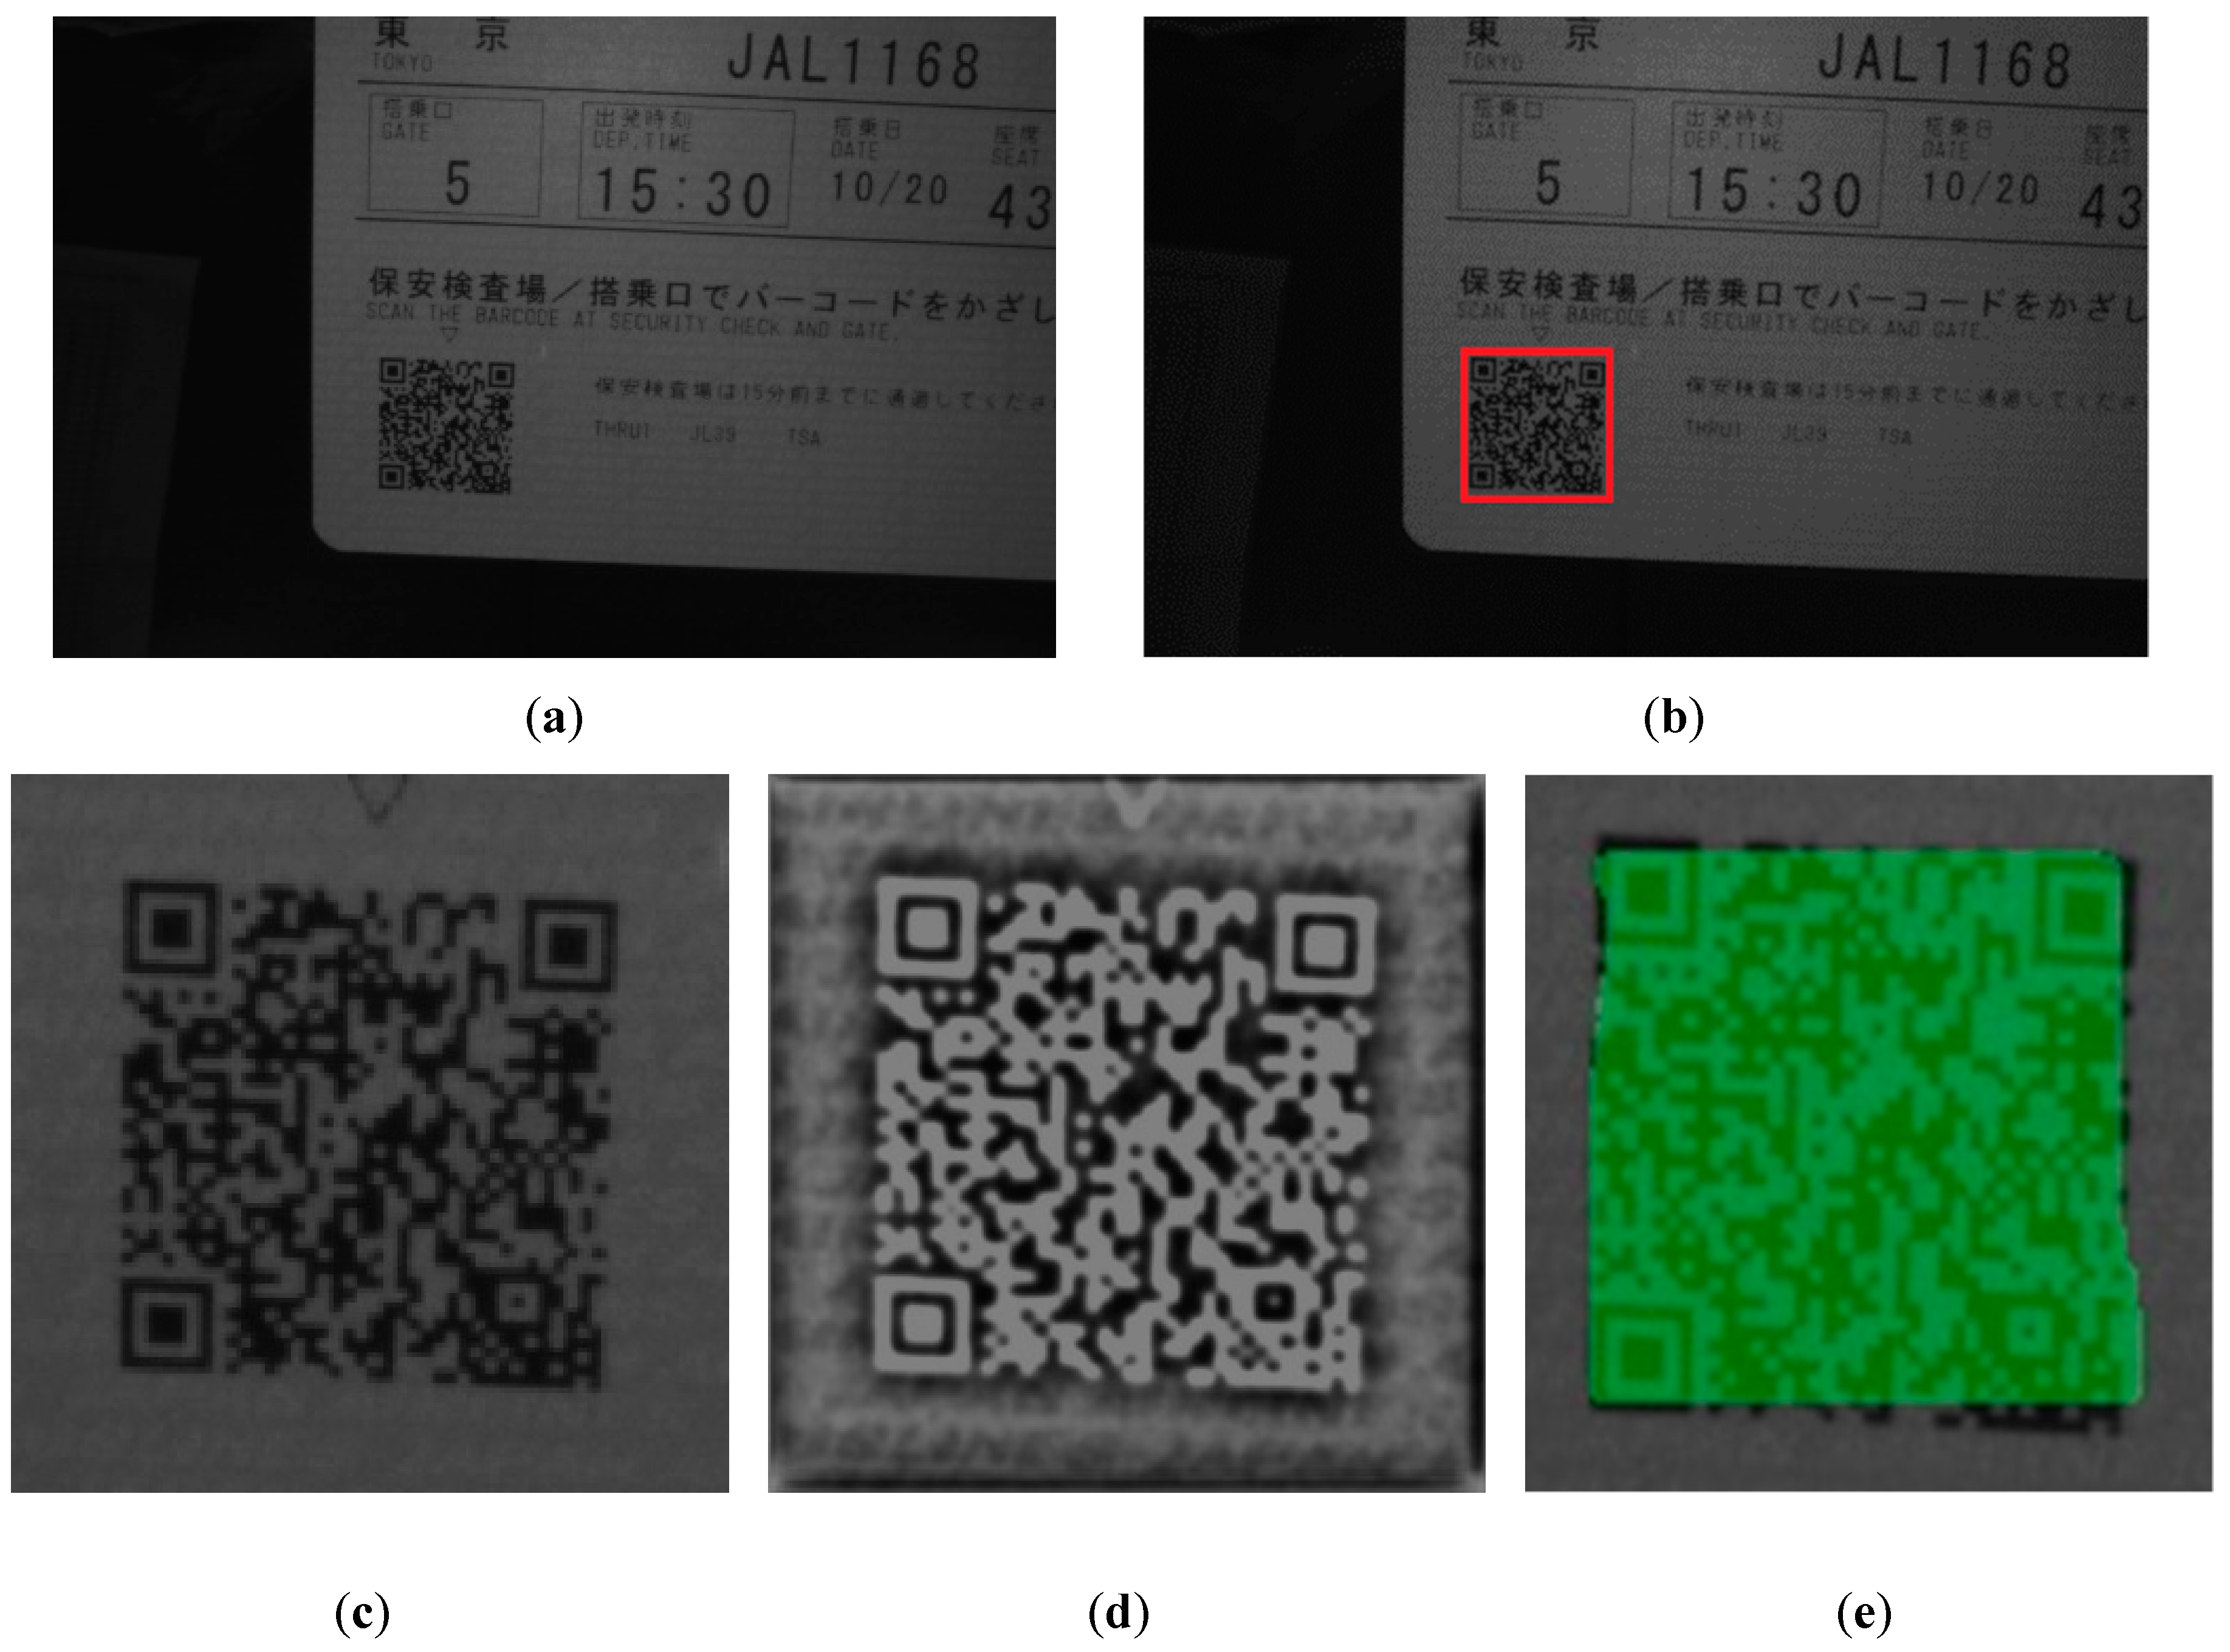
Here is an example to illustrate the effect of our proposed adding UNet branch method. For a noise polluted candidate image shown in Figure 4a, after a pre-trained UNet branch’s prediction, the gray scale image shown in Figure 4b is obtained, and the image shown in Figure 4c is then obtained after binarization. Comparing with Figure 4b and a, it can be seen that the image has removed most influence of noise. It can also be observed that the texture of QR tag is highlighted and the texture enhancement effect is achieved. By calculating the IoU of Figure 4c and ground truth, and we get I o U 0 , 0 = 0.81 , where d x = d y = 0 , and the value of I o U 0 , 0 is 0.26 higher than the obtained value by using Figure 3b. Although there are still some irregular edges and incomplete details compared with ground truth. By using UNet branch texture segmentation, the corresponding IoU of low-quality image and ground truth is greatly improved.
From Ref. [29] we realize that, previous researches on Mask R-CNN mainly focused on the instance segmentation of natural images. As a precise segmentation mask may not be critical in natural images, Mask R-CNN pays less attention to the quality of the fine texture mask. However, as shown in 
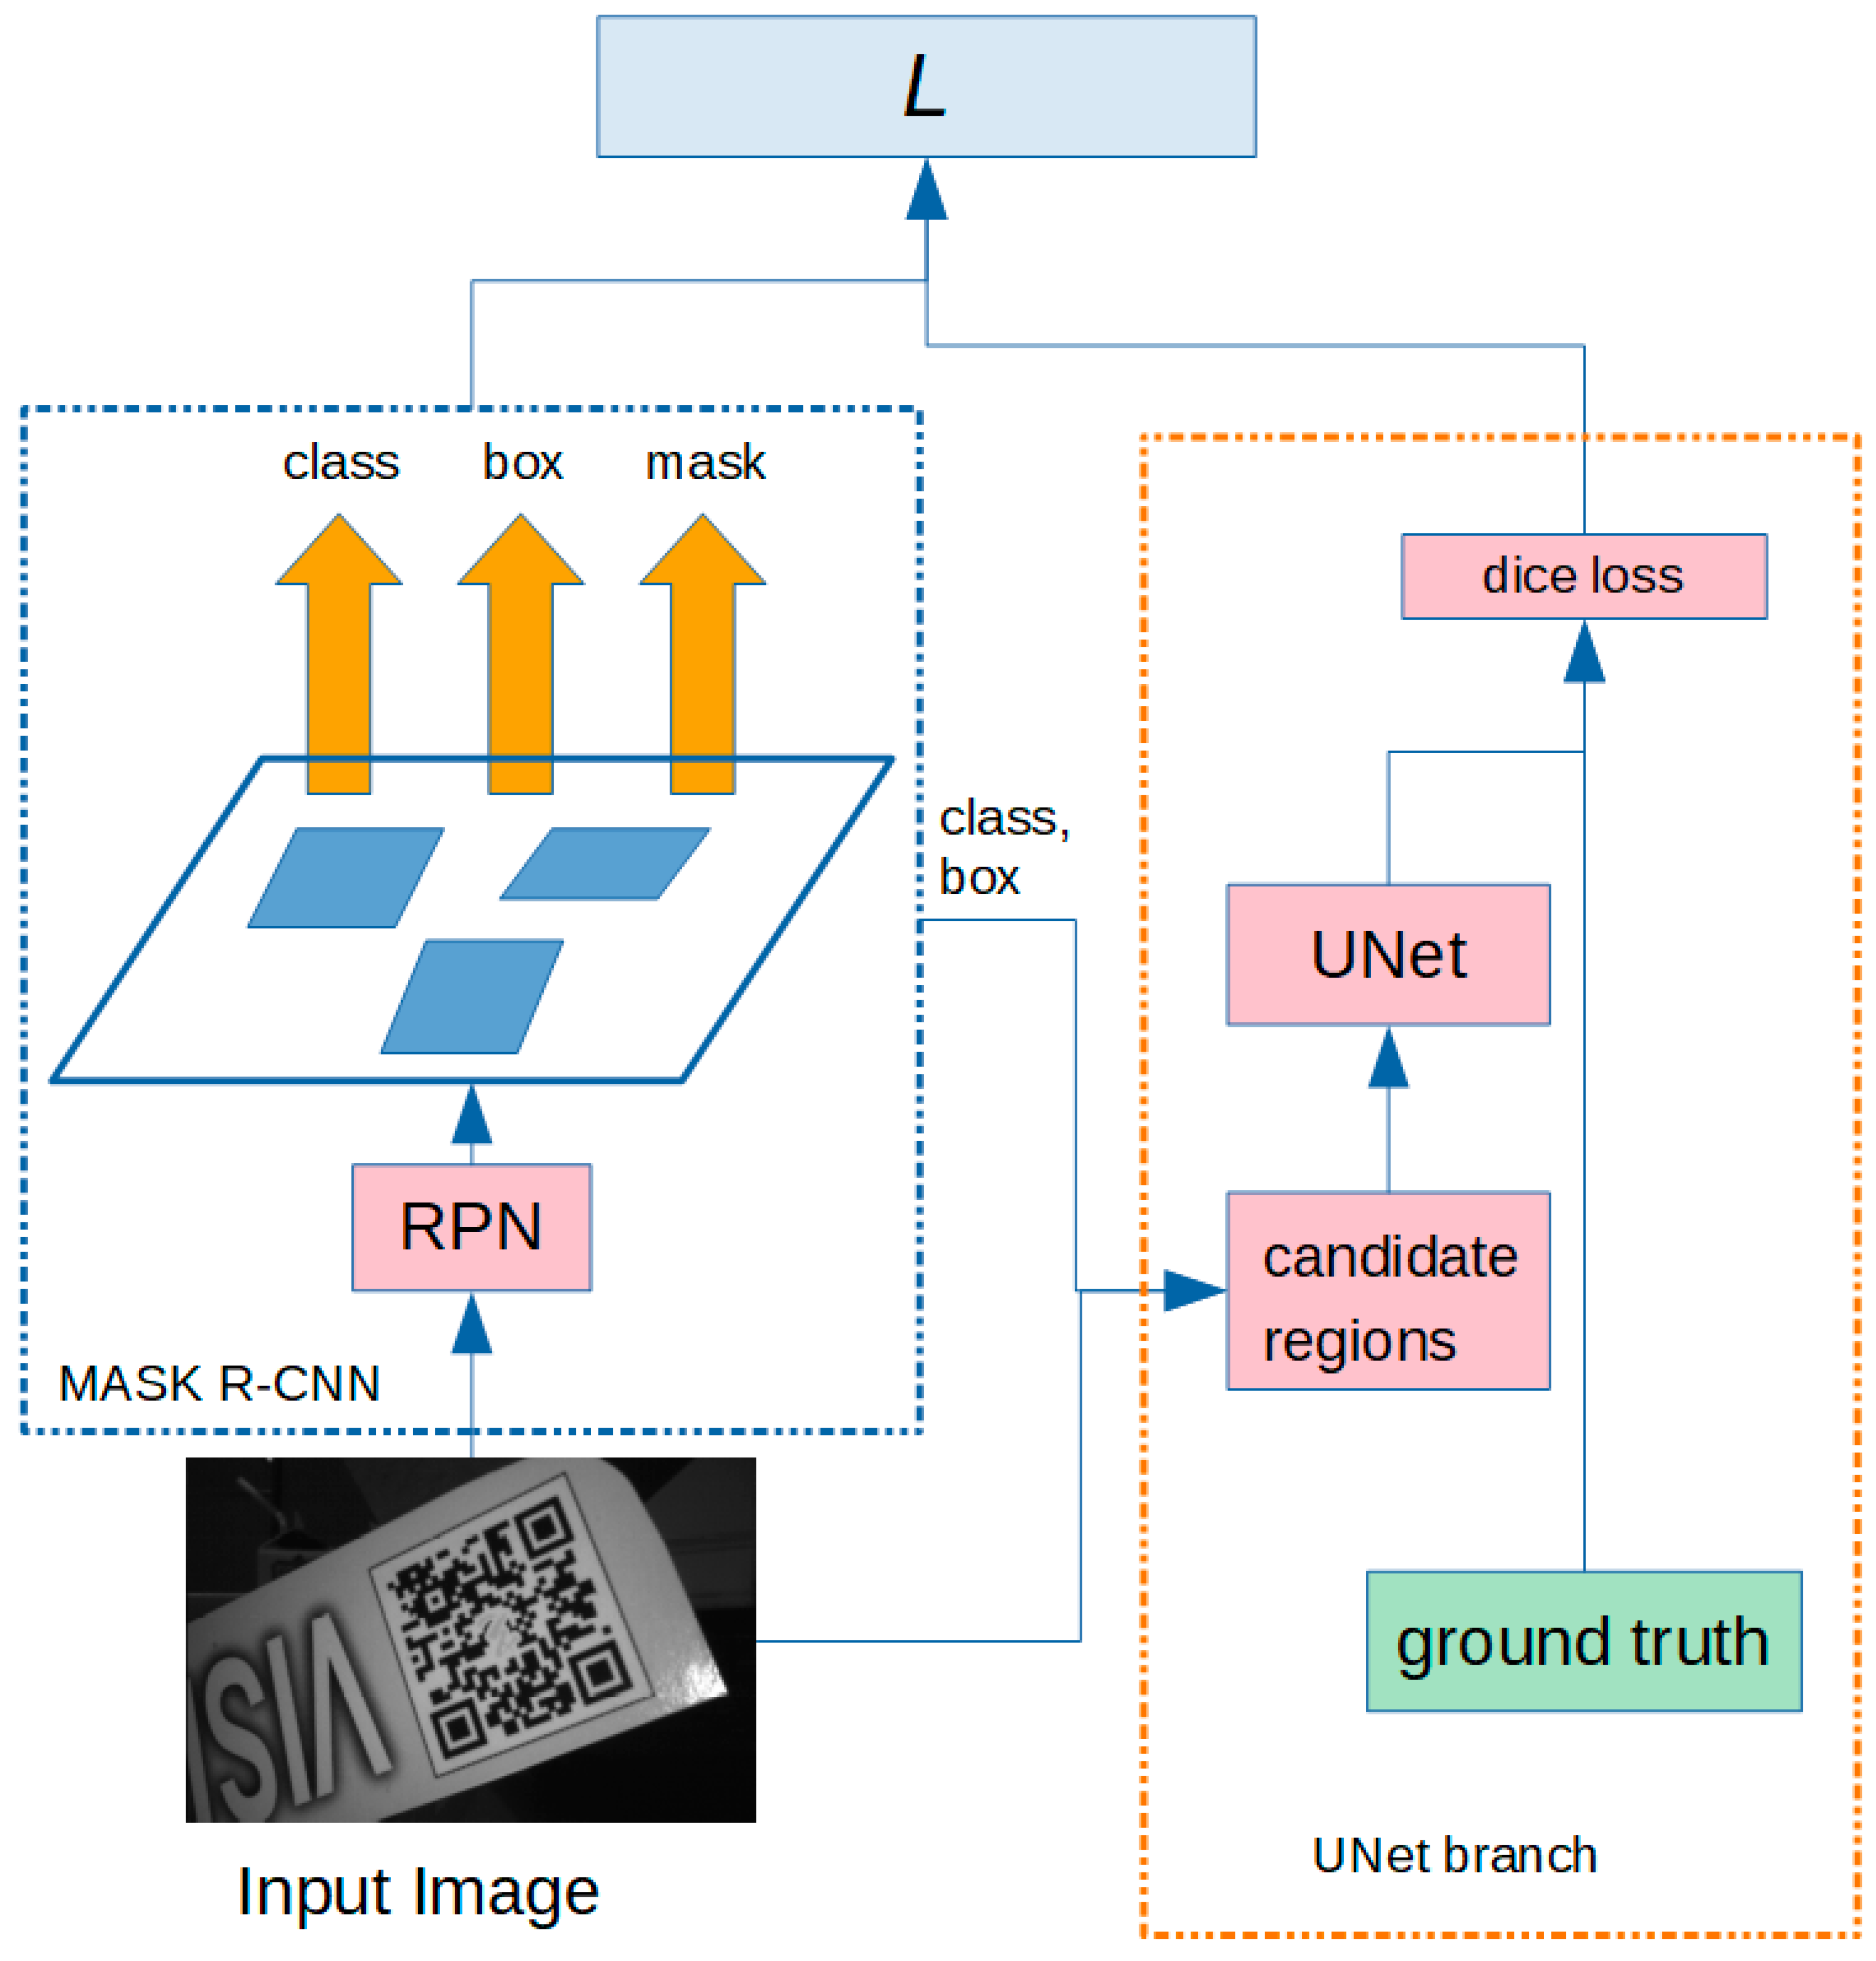
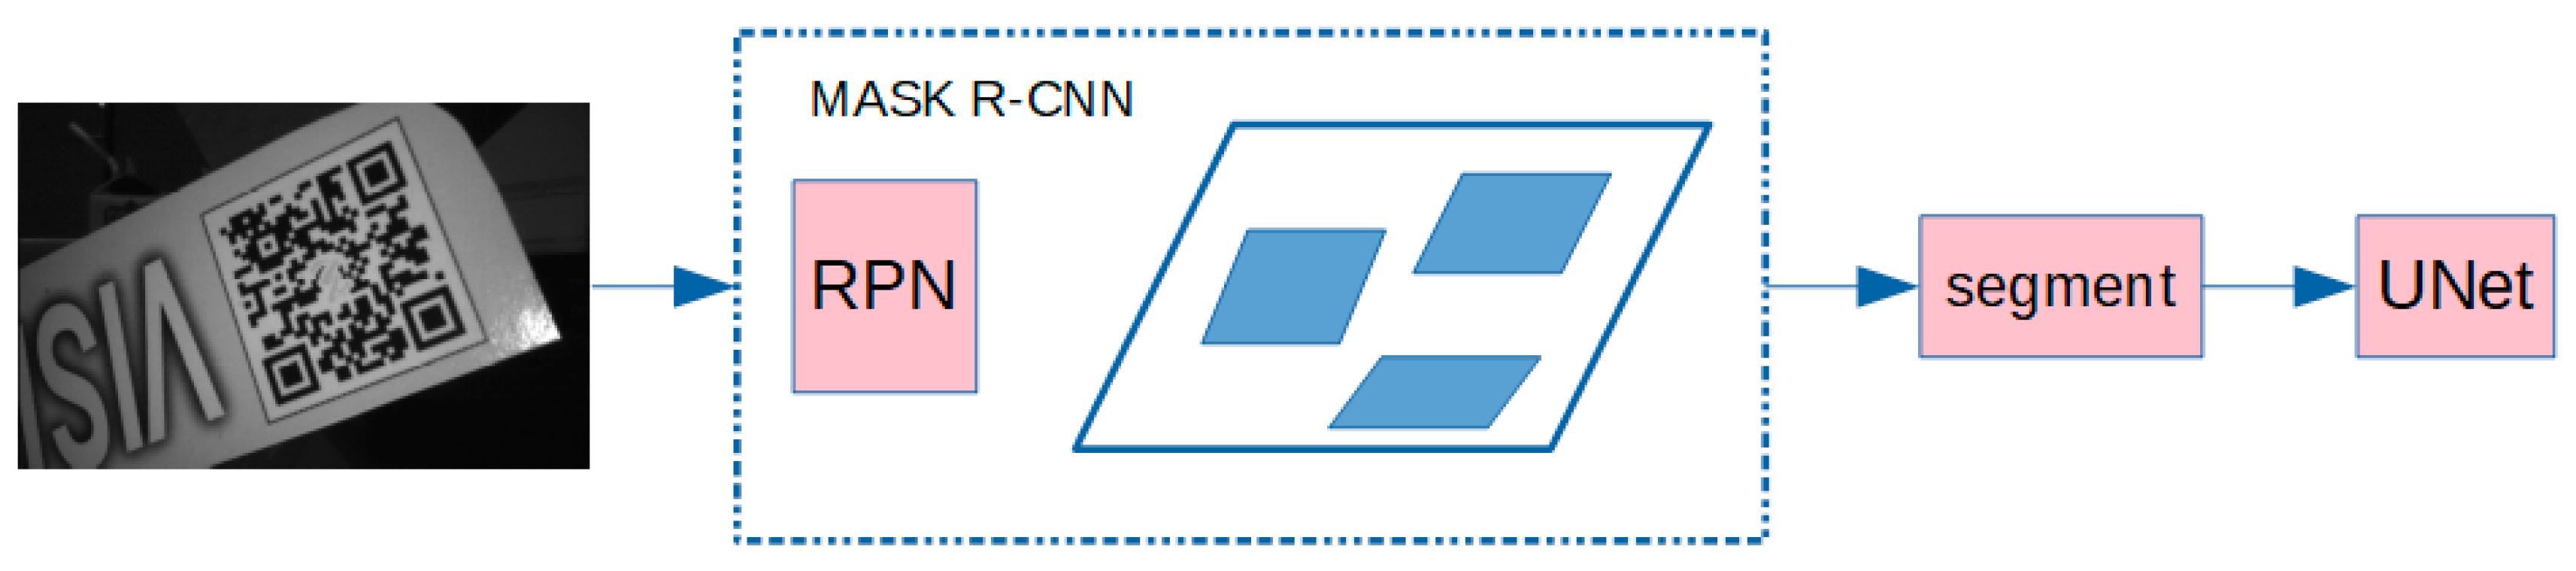
Figure 2, due to the rich texture of the QR tag, low-quality candidate images can lower the value of IoU, making it lacking the ability to accurately measure the mask quality, thus QR tag mask demands a higher level of accuracy than what is desired in natural images. Therefore, it is necessary to propose a network that can reduce the impact of low image quality on IoU calculation. According to the structure of UNet, it can effectively combine low resolution information (providing basis for object classification recognition) and high-resolution information (providing basis for accurate segmentation and positioning) to achieve the purpose of precise segmenting and effective enhancement of texture. Therefore, we modified Mask R-CNN, added UNet branch to evaluate IoU, and proposed our QR tag instance segmentation network. For the convenience of expression, our proposed network is entitled the Mask UNet Region-based Convolutional Neural Network, or MU R-CNN for short. The network structure of MU R-CNN is shown in Figure 5.
To resolve the problem of poor QR tags’ instance mask of Mask R-CNN, this paper uses pixel-level IoU between the predicted mask and its ground truth mask to describe instance segmentation quality. As shown in Figure 5, our proposed MU R-CNN mainly consists of two parts: Mask R-CNN branch and UNet branch. The input image first enters Mask R-CNN branch, and the outputs of Mask R-CNN branch are the position, category and mask information of the candidate regions in the image. In Mask R-CNN branch, RPN was constructed in the same way as [29]. The network architecture for UNet branch is shown in Figure 6. According to the position and category information output by Mask R-CNN branch, we segment candidate images in the input image, and then the candidate images are input into the pre-trained UNet model for prediction, and the prediction results are the fine segmentation of candidate region’s texture information.
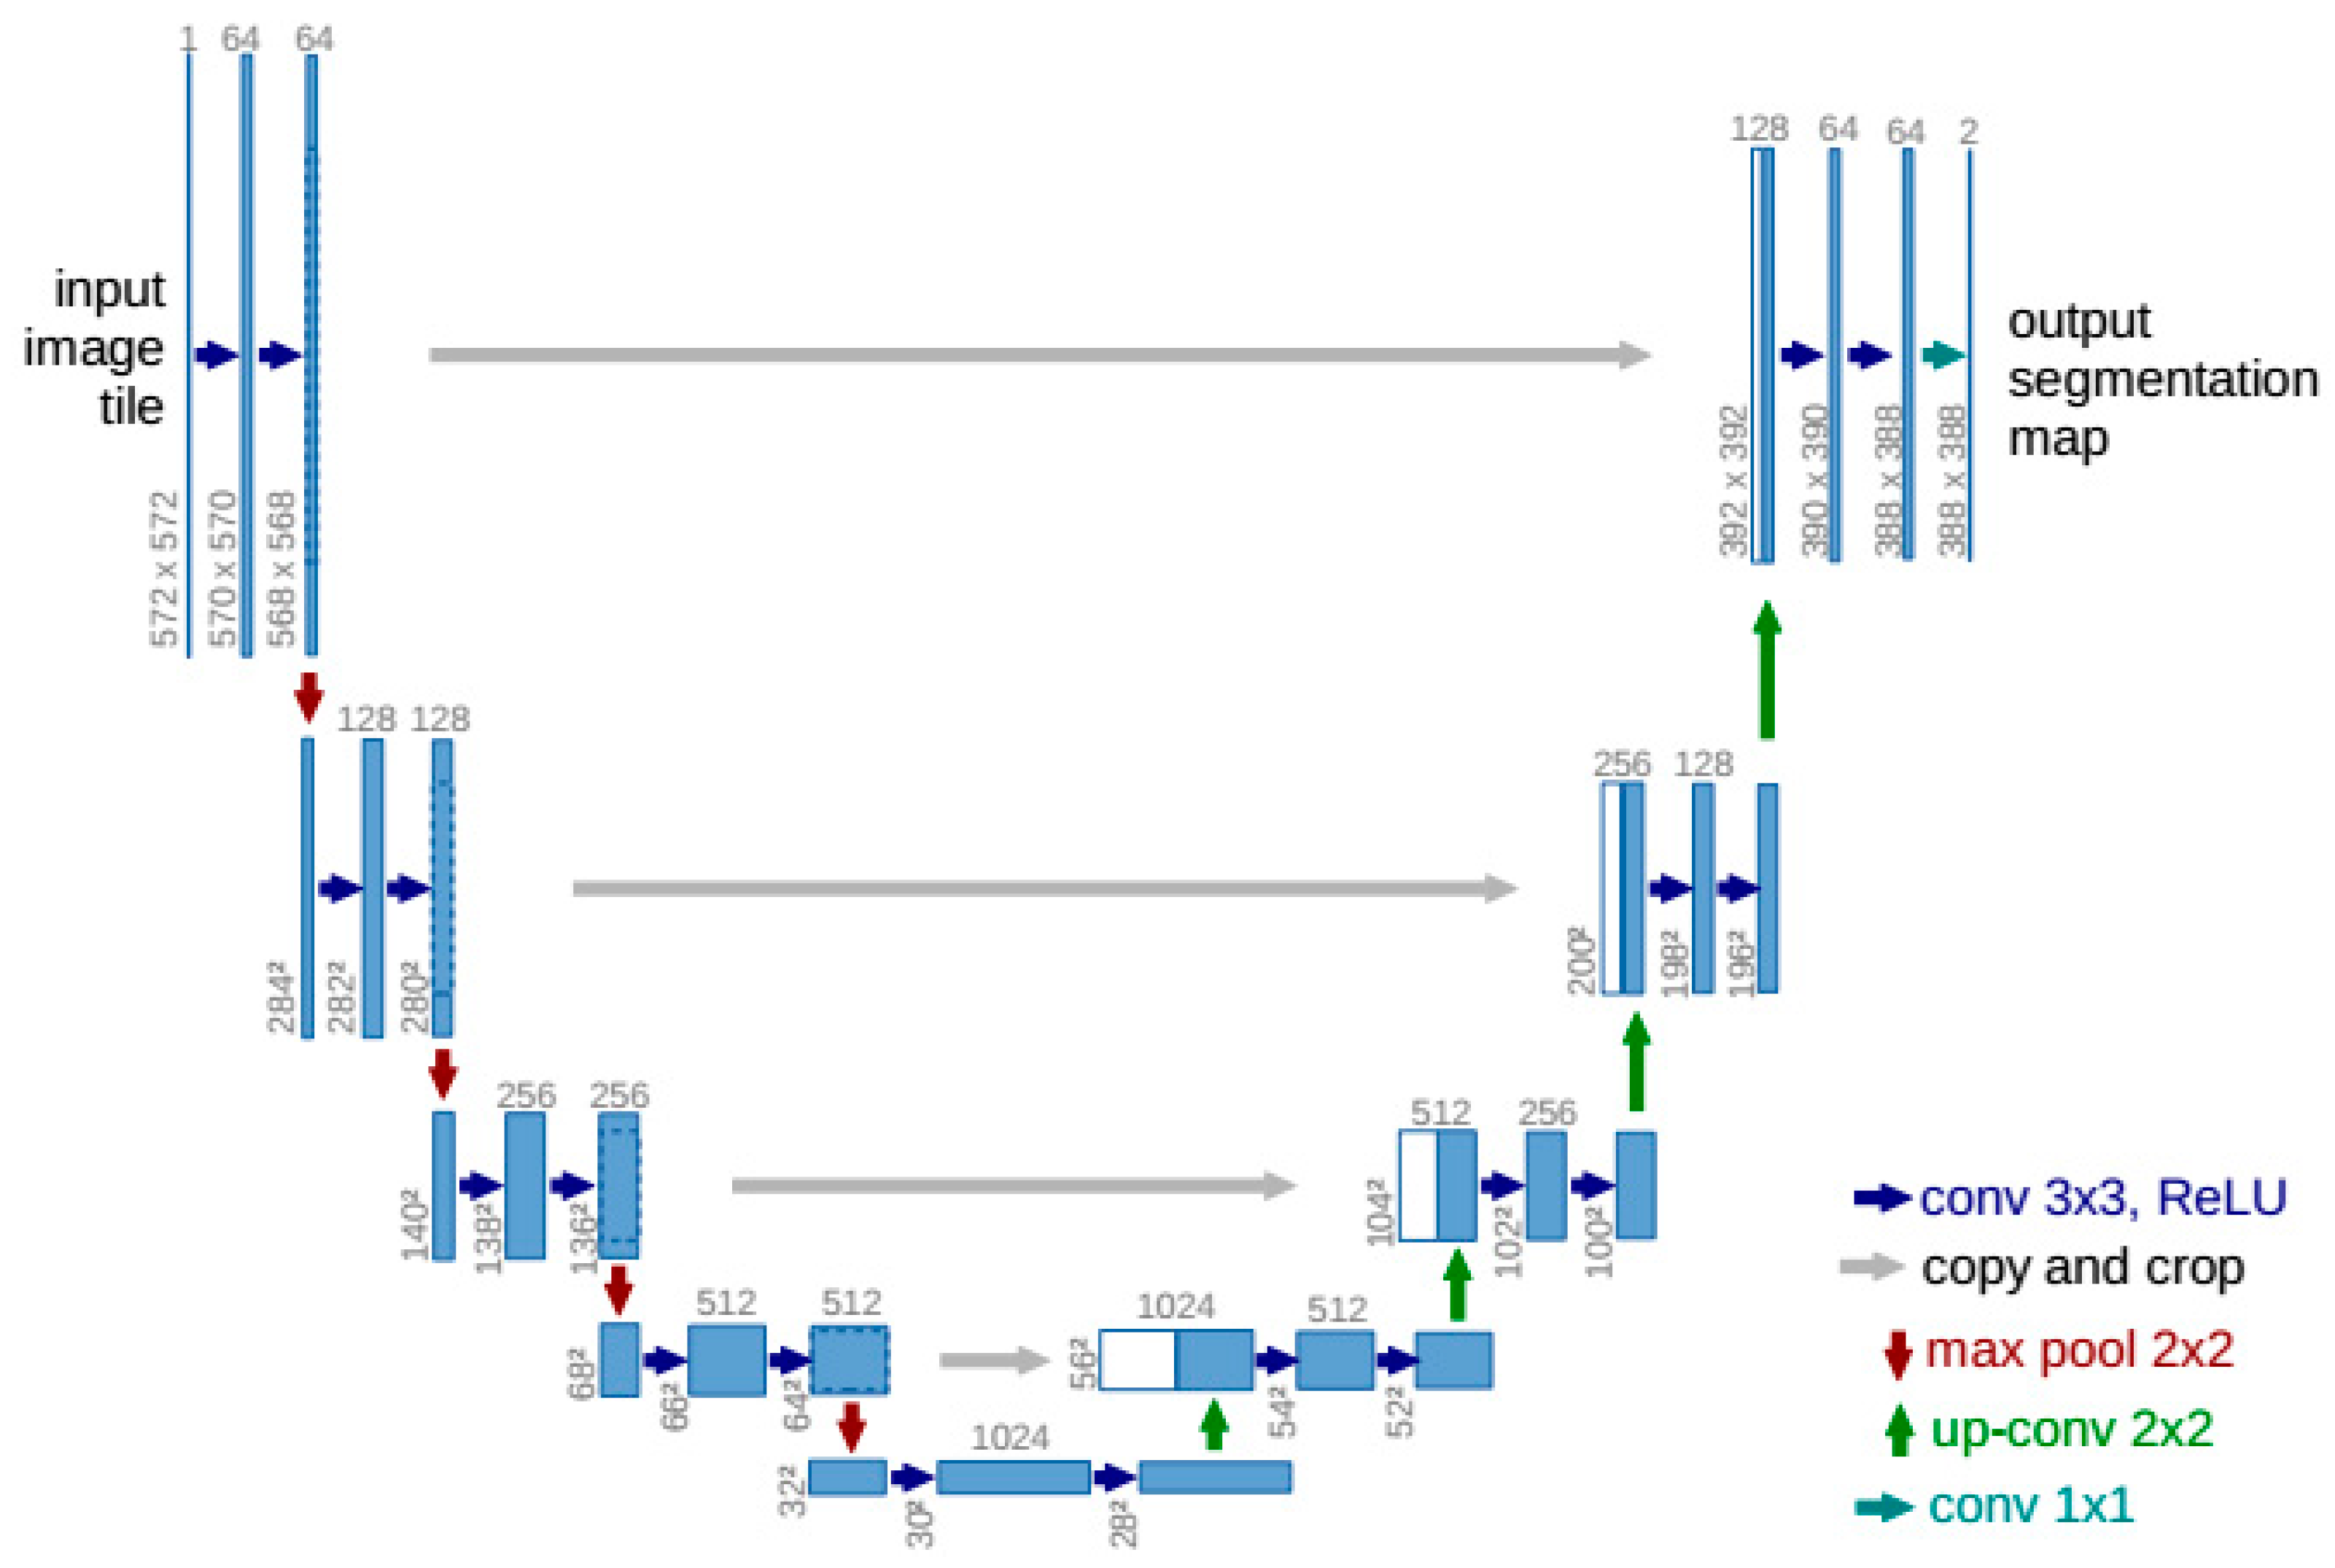
The main structure of UNet model [30] consists of a convolution compression part and up-convolution reduction part, as shown in Figure 6.
In the convolution compression part, the structure based on two 3×3 convolution layers and one 2×2 maximum pooling layer is adopted repeatedly. Thus, by using the de-sampling effect of the pooling layer, features are extracted layer by layer. In the up-convolution reduction part, the up-convolution of 2×2 is firstly carried out, then two 3×3 convolution layers are connected, and the structure is repeated. In the output layer, a 1×1 convolution layer is used to map the feature graph to the required number of classes. The structure of the UNet model is based on the main idea of FCN [48] and is better than FCN. It can be seen that UNet has a similar structure compared with the u-shaped symmetry. The first half is a classical VGGNet-16 [70], while the second half is a reverse up-sampling process. The most important improvement of UNet is the addition of copy and crop channels in the up-sampling section, which enables the network to transfer contextual information from the shallow layer to the deeper layer. This structure allows UNet to achieve better segmentation of small targets and fine textures than FCN.
From the structure of UNet, the convolution layer in the network is 3×3. According to K. Simonyan’s conclusion in VGGNet-16 [70], two 3×3 convolution layers (without spatial pooling in between) has an effective receptive field of 5×5, three such layers have a 7×7 effective receptive field, and this conclusion is verified by experiments. Compared with a 5×5 or 7×7 convolution of a single layer, multiple layers of 3×3 convolution can increase the network depth and improve the non-linear capacity of the network, but has fewer network parameters, making the network more concise and efficient. The 2×2 pool layer ensures that the scale drops slowly to give smaller targets a chance to train.
Earlier in this article, it is stated that low quality images can lower the IoU significantly, making it lacking the ability to accurately measure the completeness of the instance mask. In this paper, using UNet branch for texture segmentation to achieve de-noising effect is a key innovation of our MU R-CNN, as shown in Figure 4b. Texture segmentation can achieve good de-noising effect and reduce the impact of low image quality on the IoU, so no additional de-noising algorithm is needed.
In order to optimize the IoU in the training, we need to add a IoU loss in the MU R-CNN. Because dice-loss [71,72,73] is an approach for directly optimizing the IoU measure in deep neural networks, we choose dice-loss to determine IoU loss.
In the MU R-CNN of this paper, dice-loss can be calculated by formula (1) [73].
L I o U = 1 2 i N p i g i i N p i 2 + i N g i 2 p i , g i = { 0 ,   b a c k g r o u n d   p i x e l 1 ,   o b j e c t               p i x e l
where, N is the total number of pixels in the ground truth image, and p i and g i represent the value of the ith pixel in the binary image of UNet prediction output and ground truth, respectively.
After obtaining dice-loss, it is then added to MU R-CNN in accordance with Equation (2):
L = L c l s + L b o x + L m a s k + λ × L I o U
where, L c l s , L b o x and L m a s k represent class, bounding box and mask loss respectively, which are calculated according to the same method of Mask R-CNN [29]. λ is a balancing parameter. L I o U is the dice-loss calculated by formula (1), and L is the total loss of MU R-CNN.
After the completion of the instance segmentation stage, the QR target is tracked by hidden Markov models (HMM). The parameters of the HMM model in this paper are shown in Equations (3)–(11).
{ S , V , A , B , π }
S = { s i } ;   i = 0 , 1
V = { v j } ;   j = 0 , 1 , , N
A = { a i , j } ;   i , j = 0 , 1 ;
B = { b i , j } ;   i = 0 , 1 ;   j = 0 , 1 , , N
π = { π i } ;   i = 0 , 1
O = { o t } ;   t = 0 , 1 , , T ;   o t = { v j , t } ;   j = 0 , 1 , , N
Ω = { ω t } ;   t = 0 , 1 , , T ;   ω t = { s i , t } ;   i = 0 , 1
λ = ( A , B , π )
Formula (3) indicates the HMM model is composed of 5 parameters, and the meanings of these five parameters are explained in formulaes (4)–(8). S in formula (4) is state transition set, and it stands for a set of states, and s 0 means the detected target is true positive, while s 1 means false positive. V in Equation (5) is observations state set, and it stands for a set of observation states, and N stands for number of observations of each state being the output. In this paper, N = 3, v 0 , v 1 , v 2 respectively represent the classification confidence of the target output by MU R-CNN, bonding box’s aspect ratio and the ratio of the white pixels number divided by black pixels number in binarization mask image output by the UNet branch. A in Equation (6) is state transition matrix. B in Equation (7) is confusion matrix. π in Equation (8) is the initial probability distribution. o t in Equation (9) stands for observation of time t. ω t in Equation (10) stands for state of time t. λ in Equation (11) represent the HMM model parameters.
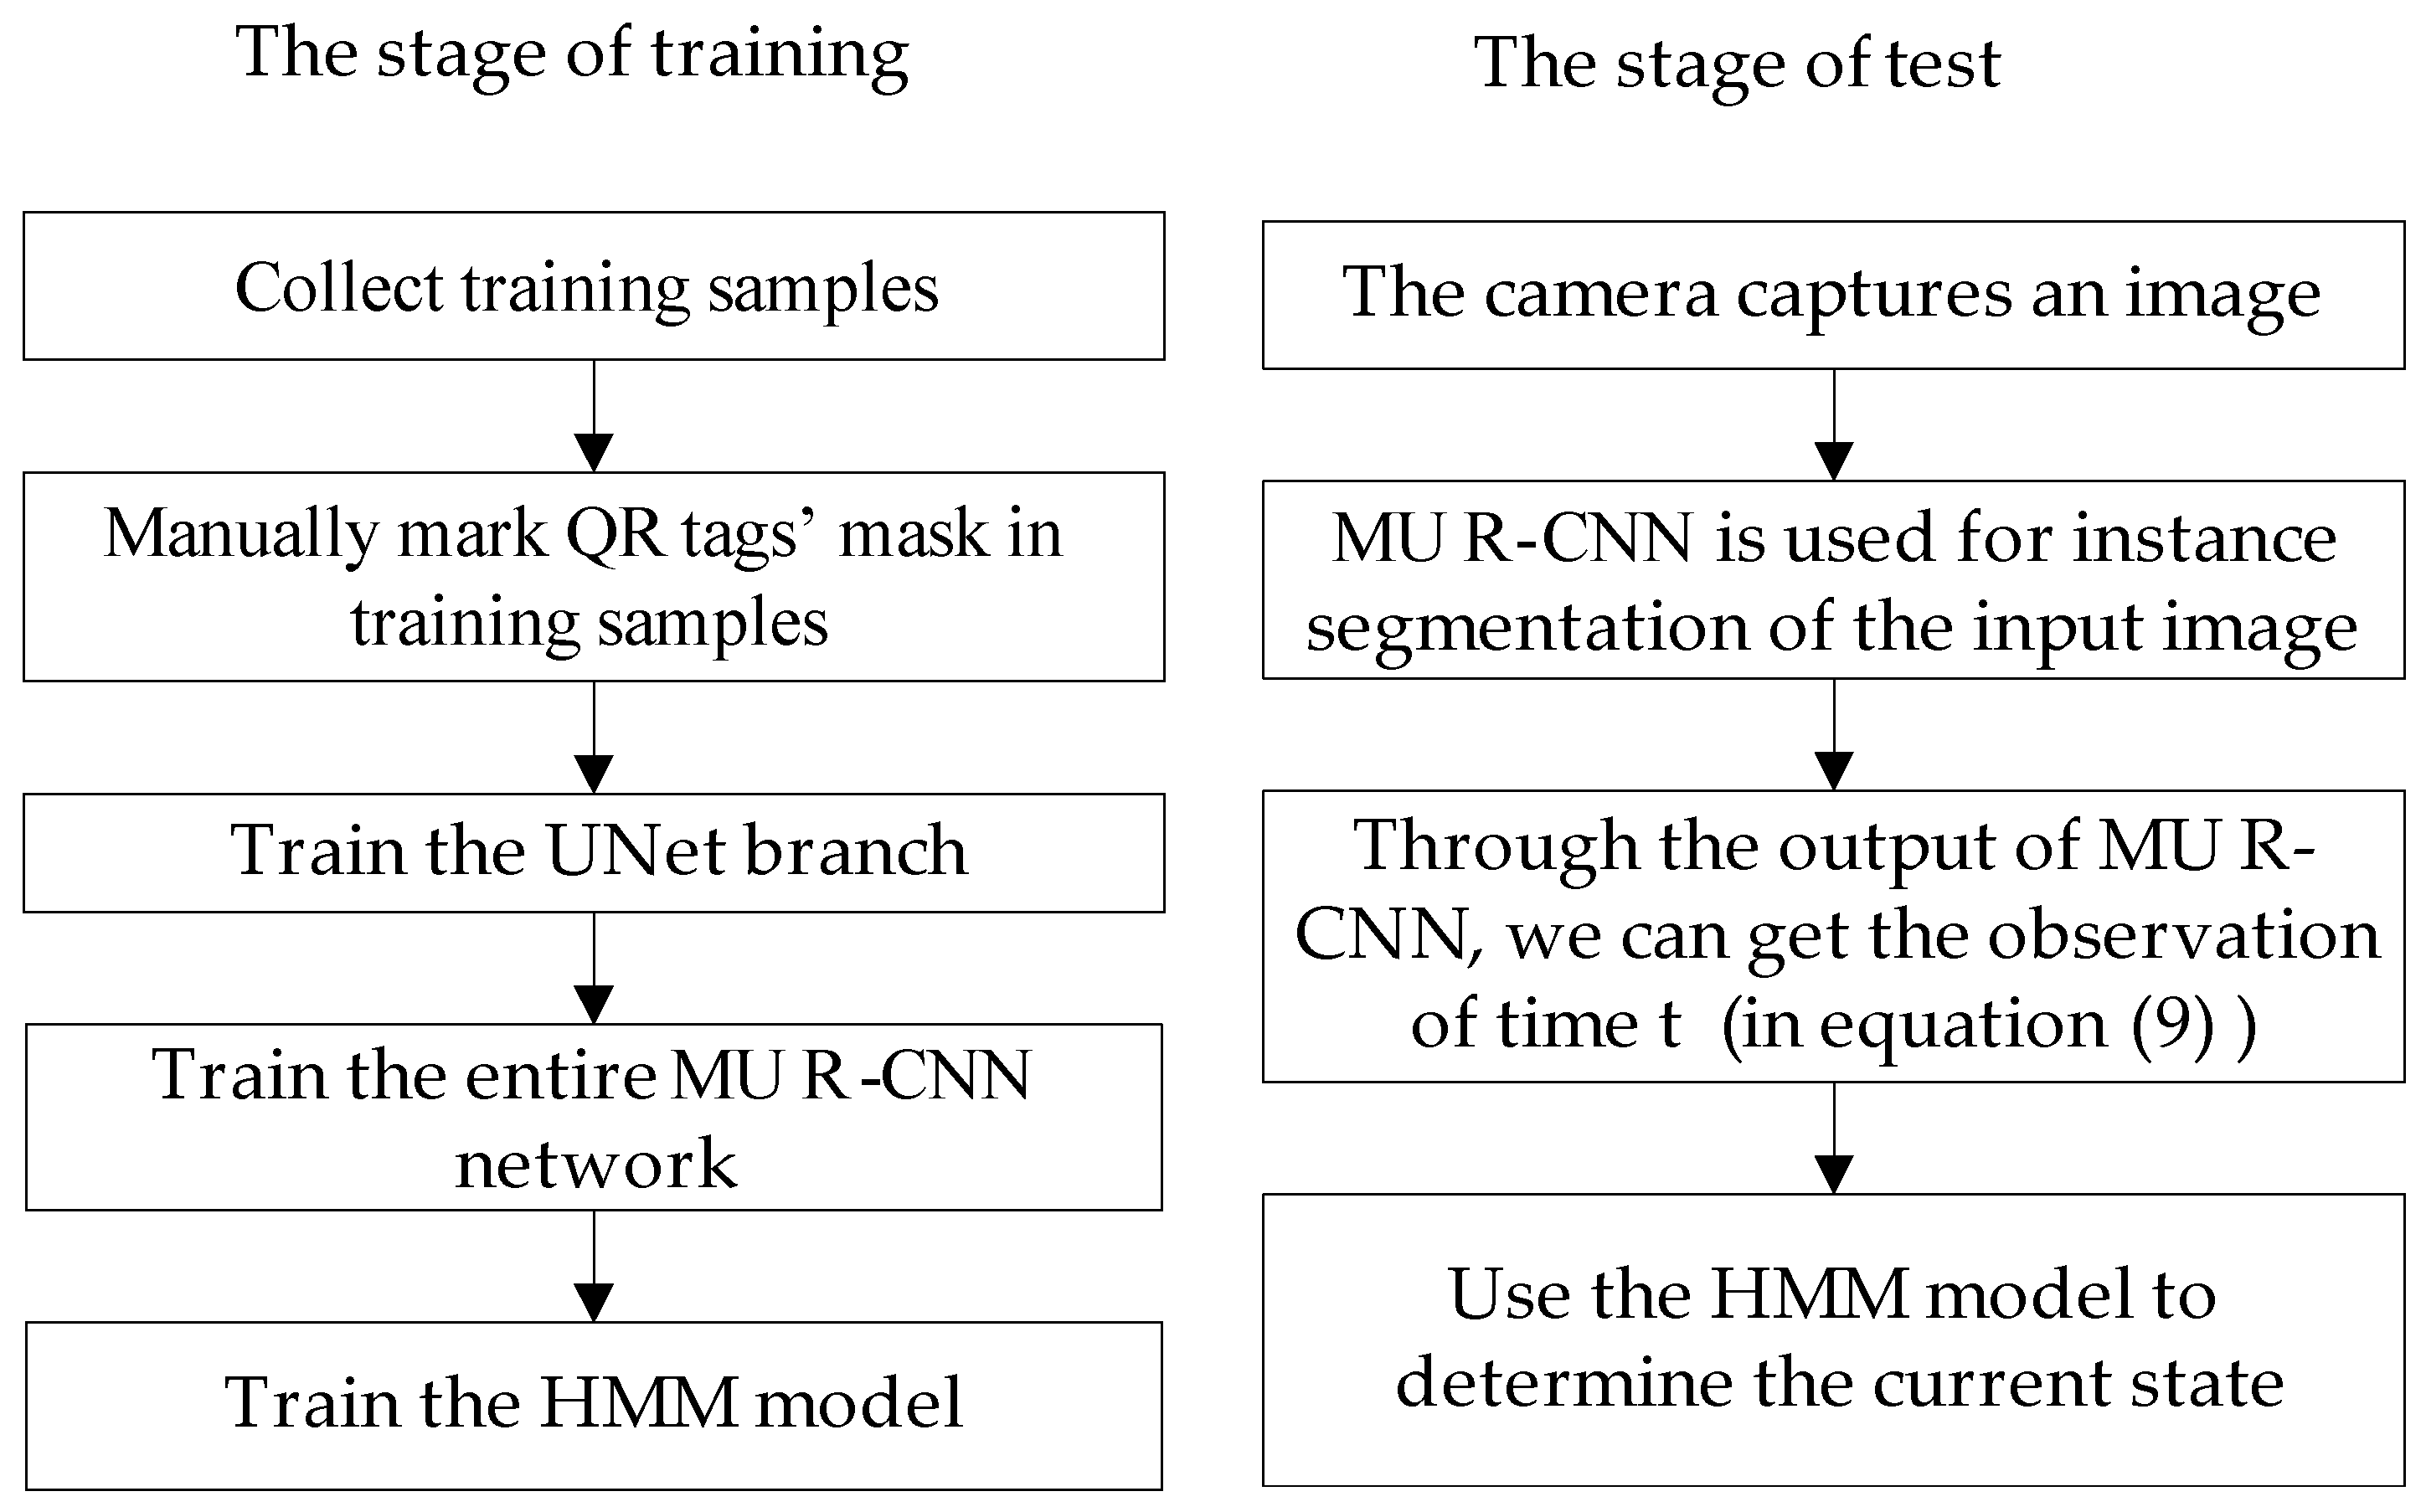
After setting up the MU R-CNN and HMM model, we build the system architecture as shown in Figure 7.

3.2. Training of MU R-CNN

The training of UNet branch should be completed before the whole MU R-CNN starts training. The advantage of above process is that before the training of MU R-CNN, UNet branch model has already got the optimal result after training, so as to ensure accurate L I o U from the beginning. Thus, the training of MU R-CNN is divided into two steps. In the first step, the UNet branch is trained, and in the second the whole network is trained.

3.2.1. UNet Branch Training

The data set adopted for UNet training in this paper contains 60 training samples, among which 20 are manually added QR code images with Gaussian and Salt-Pepper noise, and the rest 40 are directly manually cut images from complex background. Some example images are shown in Figure 8:
In order to avoid over fitting and increase the robustness, the data augmentation method described in [30] is applied to provide 30 augmented samples per training sample, and finally to form training set of 1860 images. The training set and corresponding GT were input into UNet, and after 1000 epochs training process, the trained model was finally obtained, denoted as M U N e t . The training process of the UNet branch is summarized as shown in Table 1.

3.2.2. End-to-End Training of MU R-CNN

The proposed MU R-CNN is mainly composed of Mask R-CNN and UNet branch. Among them, Mask R-CNN branch consists of two stages, and they are termed as region proposal network (RPN) and region-based convolutional neural network (R-CNN), respectively. During training of MU R-CNN, the input image first passes through RPN to obtain coarse screening candidate regions. Then, RoIAlign is used to extract features from each candidate region, and classification, boundary box and mask regression are carried out. We set the output candidate region of R-CNN as R i , and represent by formula (12):
{ R i | i = 0 , 1 , 2 , , N }
where N is the total number of candidate regions output by Mask R-CNN. R i is then sent to the pre-trained M U N e t for texture segmentation, as shown in Figure 4b. After the texture segmentation of all candidate images, binarization is carried out. Then, the binary image was combined with its ground truth to calculate L I o U according to formula (1). Finally, the loss of the entire MU R-CNN network is calculated according to Equation (2). The training process is an end-to-end procedure. The training data set and network parameter setting information will be presented in the experimental section.
We summarized the training process of the MU R-CNN network as shown in Table 2.
We noticed that Z. Huang [69] also proposed a similar method to improve the quality of instance mask by adding IoU measure branch (named MaskIoU) to Mask R-CNN. The difference between our proposed MU R-CNN and Mask Scoring R-CNN (MS R-CNN for short) in [69] is that the weight of MaskIoU branch in MS R-CNN is trained at the same time as Mask R-CNN branch, while our UNet branch in MU R-CNN adopts the pre-trained optimal results, so as to ensure that L I o U in MU R-CNN is accurate at the beginning of the MU R-CNN end-to-end training. In addition, MaskIoU in [69] uses the concatenation of features from RoIAlign layer and the bounded mask as the input of MaskIoU head. However, the input of the UNet branch in this paper uses the segmented candidate images from the input image. In this way, the UNet branch does not depend on the features of the Mask R-CNN, so the training process of the UNet branch can be carried out independently, in advance. In particular, as dice-loss is an approach for directly optimizing IoU measure in deep neural networks, we choose dice-loss to determine IoU loss, which makes it easier to achieve better training results. Finally, because the copy and crop channels in the up-sampling section of UNet enable the network to transfer contextual information from the shallow layer to the deeper layer, and thus it can effectively combine low-resolution and high-resolution information to achieve the purpose of precise segmenting texture of QR tag from noise polluted candidate images. So, the UNet branch can effectively reduce the impact of image noise on IoU, while on the other hand the IoU measure branch MaskIoU in Ref. [69] has no such de-noising function. Hence the proposed algorithm in this paper has great advantages over Ref. [69] in QR tag instance segmentation.

3.3. MU R-CNN Prediction

After training, we can use the trained model to instance segment the images collected in the application field. Figure 9 shows a schematic diagram of the MU R-CNN prediction process, and Figure 10 shows an example of using MU R-CNN to instance segment a QR tag from a test image.
As can be seen from Figure 9, the prediction process of MU R-CNN is divided into three stages:
First, input the test image into MASK R-CNN branch for prediction boundary box and class information (as shown in Figure 10b), and then segment the candidate images (as shown in Figure 10c). Finally, input the candidate images into UNet branch to obtain the final instance segmentation of QR tag (as shown in Figure 10d). In Figure 10e, we show the instance segmentation result of Mask R-CNN for compare. Obviously, it is difficult to distinguish the texture of QR tag with the result of Mask R-CNN. By comparing our MU R-CNN results in Figure 10d, we can see that the texture is very clear and the contrast very high, which will make the subsequent QR decoding process easier. In the output information of MU R-CNN, boundary box and class information can be used for QR tag detection, and the mask information output by the UNet branch can achieve segmentation at the semantic level.
We summarized the prediction process of the MU R-CNN as shown in Table 3.

4. Experiments

4.1. Instance Segmentation Experiment

We adopt the following experimental environment to train MU R-CNN: NVIDIA GeForce GTX 1080Ti GPU, 11G of video memory. The learning rate during training is set to 0.001, total epochs is 300, number of classes (including background) is two, batch number chosen during training is one, and other experimental settings are the same as in Mask R-CNN [29]. In Equation (2), we adopt that λ = 2 . We use COCO evaluation metrics AP (averaged over IoU thresholds) to report the results, including APm, [email protected], [email protected], and APb, [email protected], [email protected]. Where [email protected], [email protected], [email protected] and [email protected] represent the use of IoU threshold values of 0.5 or 0.75 to determine whether the predicted mask or bounding box is positive in the evaluation, and m and b represent mask and bounding box, respectively. APm and APb represent the average values of AP (for masks and bounding boxes respectively) within the interval of [0.5:0.05:0.95] of IoU, and 0.05 is the step size.
Five data sets are used to verify the proposed algorithm, and are represented as:
{ D i | i = 1 , 2 , 3 , 4 , 5 }
Data set D 1 : self-built data set, which contains 14,000 images from industrial application scenarios. This data set includes a total of 18409 QR tags. D 1 is then divided into two parts D 1 t and D 1 p . D 1 t contains 7000 images (including 8774 QR code) which are used for training, D 1 p contains 7000 images (including 9635 QR code) which are used to test the effectiveness and robustness of the algorithm.
For the Data set D 2 and D 3 , similar as the data sets used in Ref. [36] and [31,34], they can be used to compare the algorithm proposed in this paper with those in relevant literatures. In Ref. [31,34], D 3 is divided into two databases named as “dataset1” and “dataset2”, and we denoted them as D 3 , 1 and D 3 , 2 , respectively.
The samples in the datasets D 1 and D 2 are mostly from complex background, and QR tags have the rotation, uneven brightness, and blurring features, etc. These features can be used to test the stability of low-quality images. Some images in D 3 , 1 have complex backgrounds, and most images in D 3 , 2 have simpler backgrounds.
Since the deep network heavily depends on the characteristics of the input images, for our experiments, we composite the data set of complex scenes after T. Yang [74]’s method by superimposing QR tag on the COCO val2017 and UAV123 [75] datasets, which is named as D 4 and D 5 . COCO val2017 contains 5000 images with complex backgrounds and superimpose them with QR tags to form data set D 4 . UAV123 is a UAV-based data set proposed to study how to deal with strong camera motion, target scale and illumination changes in single-target tracking, and it contains 123 video sequences, totaling more than 110 k frames of video images. We randomly selected some images from each video sequence, and a total of 5,000 images were chosen and superimposed with QR tags to form data set D 5 . We randomly divided D 4 data set into two parts: D 4 t and D 4 p , which are used for training and prediction respectively, accounting for 60% and 40% of the total number of D 4 images. Use the same method to divide D 5 into D 5 t and D 5 p .
In order to describe the datasets used in this article more clearly, Table 4 lists the number of images in each data set and how many images are used for training and testing.
The final training data set was named as D t r (13,000 images with 14,774 QR tags) which contains D 1 t , D 4 t and D 5 t , and the test set was named as D p r (11935 images with 14574 QR tags) that contains D 1 p , D 2 , D 3 , D 4 p and D 5 p .
We train the model based on D t r training set and evaluate it on D p r to verify the performance of MU R-CNN with different backbone networks, and we conduct experiments using ResNet-18 FPN, ResNet-50 FPN and ResNet-101 FPN respectively. We use APm and APb to report instance segmentation and detection results, respectively. As Table 5 shows, the proposed MU R-CNN is insensitive to different backbone networks.
Table 6 shows the results of comparing MU R-CNN with related networks in D 1 p , D 2 , D 3 , D 4 p and D 5 p dataset respectively. It can be seen from the results that, on each data set, MU R-CNN shows a better effect.
According to the system architecture in Figure 7, after completing instance segmentation, we need to use HMM to track the target. For this reason, a video segment (named as D 6 t ) is collected for HMM model training, and this video segment has 900 frames while each frame has one QR tag. After the training, the HMM model is obtained (named as HMM 0 ). Then, three additional video segments (named as D 6 p 1 , D 6 p 2 and D 6 p 3 respectively, and each video segment also has 900 frames) are used to test the H M M 0 model.
In order to compare with the “MU R-CNN + HMM” scheme proposed in Figure 7, we add HMM module to the algorithm in Ref. [38] for comparison. In Ref. [38], we proposed a QR code detection algorithm based on BING and AdaBoost-SVM, which can quickly detect QR tags, but does not have the function of instance segmentation. Observations state v 0   and   v 1 in formula (5) can be directly obtained by using the algorithm in Ref. [38], but v 2 cannot be directly obtained. Since v 2 represents the ratio of the white pixels number divided by black pixels number in binary mask image, we used the traditional Gaussian and Median filtering method to de-noise the detected target region, and then binarization by OTSU algorithm to obtain the v 2 state. The HMM model was also trained on the data set D 6 t , and the obtained HMM model was named as H M M 1 . Then, H M M 1 was tested in data set D 6 p 1 , D 6 p 2 and D 6 p 3 respectively. The experimental results are shown in Table 7.

4.2. Compare with the Relevant QR Location Algorithm

The experimental results compared with related algorithms are shown in Table 8. The precision results of the proposed method are similar to that of [31]. In [31], 100 QR code images with high resolution in the selected angle are chosen for the experiment, but it doesn’t mean which 100 high resolution images are selected, so this article have to test in all D 3 , where all images in D 3 also contain low quality images. Compared with Ref. [36], the proposed MU R-CNN has a higher recall rate. In Table 8, n is the total number of images in the test data set, and t is the time used for detection.

4.3. Experiment of Visual Navigation Application Beside Industry 4.0

In order to discern whether it is possible to use the proposed MU R-CNN in applications beside Industry 4.0, the following experiments are carried out. In the previous section, we mentioned that visual navigation based on 2D tags has been widely used in AGV applications of Industry 4.0. In addition to AGV, 2D tag positioning can also be used in other visual navigation fields besides Industry 4.0. For example, it can guide unmanned aerial vehicles (UAV) for autonomous landing. UAV is increasingly used in target tracking, danger rescue and other tasks, which requires higher and higher guidance efficiency and accuracy [75,76]. Like manned aircraft, the mission consists of three stages: take-off, cruise, and landing. However, the take-off and cruise phases are easier to complete than the landing phase, which can be achieved through relatively simple program control. In the landing stage, the probability of an accident is often higher than the other two stages due to the complicated operation and many ground interference factors. Current navigation technologies for autonomous landing include inertial navigation, GPS and visual navigation. The biggest disadvantage of inertial navigation is that the errors will be continuously dispersed with the passage of time, so cannot be used independently. GPS is the most widely used and relatively mature technology. It uses navigation satellites to achieve positioning and has the advantage of simple use. However, as GPS is a weak radio signal, it is easily interfered by other radio signals and obstructed by obstacles, which restricts the autonomous landing environment of UAV. Visual navigation has the following technical advantages: no ground and air navigation auxiliary equipment are required, so it is low cost; it is mainly reliant on the airborne camera to obtain navigation information; it is not affected by electromagnetics, has low power consumption and a strong anti-interference capability.
Visual navigation based on cooperative target is a reliable method for autonomous landing of UAV [74,75,76,77,78,79,80,81,82,83]. Accurate positioning of the cooperative target is the basis of autonomous landing system. Examples of cooperative target patterns are as follows:
As can be seen from Figure 11, the cooperative targets are generally composed of black and white colors, with certain coding rules, and have strong visual characteristics. Broadly speaking, the cooperative targets shown in Figure 11 are also some sort of 2D code, but the pattern is simpler and contains less coding information than QR code. Therefore, 2D code instance segmentation methods can also be applied to such cooperative targets, at the same time QR tags can also be used for cooperative targets of the autonomous landing of UAV. One significant advantage of the QR code relative to the above cooperative targets is its high capacity, error correction, and high security. The coding algorithm of QR code itself has a strong self-error-correction ability, which can improve the probability of correct decoding in the case of contamination and partial absence, thus improve the robustness of cooperative target detection in a complex environment.
Due to the lack of UAV system hardware as shown by T. Yang [74], which made it unachievable to obtain the complex aerial dataset in Ref. [74], in order to compare the effects of YOLOv3 network adopted by Ref. [74] in UAV environment with our MU R-CNN network, this article uses the D 5 p data set for testing. The test results are shown in Table 9.
In Table 9, TP, FP, and FN denote the true positive, false positive and false negative counts, respectively. As can be seen from the results in Table 9, in the D 5 p data set, both networks have good effects, and MU R-CNN is only slightly better than YOLOv3, indicating that both of them can meet the requirements of autonomous landing of UAV.

5. Discussion

As shown in Table 5, compared with Mask R-CNN, both the instance segmentation and detection results of our MU R-CNN can achieve a stable improvement on all backbone networks. Especially for [email protected], all the values of MASK R-CNN are 0, and our MU R-CNN reaches 13.83 with ResNet-101 FPN backbone, which demonstrates the superiority of QR tag instance segmentation by the proposed MU R-CNN. Compared with MS R-CNN, the APm value of our MU R-CNN is also about 6AP higher. In terms of QR tag detection, our APb improved by about 1 AP and 2AP compared with MS R-CNN and Mask R-CNN, respectively. The detection effect of MU R-CNN is about 8AP higher than that of YOLOv3, indicating that under the complex background environment, the detection ability of MU R-CNN for QR tag is significantly better than that of YOLOv3. Since the test set D pr contains diversity information, especially D 1 p from the factory environment, and D 2 and D 4 p are mostly from complex background, therefore, the test results on the D pr data set can indicate the applicability of MU R-CNN to industry environment.
From the QR tag tracking results shown in Table 7, the “MU R-CNN + HMM” method proposed in this paper is much better than the “algorithm in Ref. [38] + HMM” method. We conclude that the main reason for this is that their observation state v 2 in HMM is quite different. In the “MU R-CNN + HMM” method, mask output from UNet branch of MU R-CNN is used to calculate v 2 , while the method “algorithm in Ref. [38]+ HMM” uses Gaussian, median filtering de-noise and OTSU binarization to calculate v 2 . The results in Table 7 show that the “MU R-CNN + HMM” method is more accurate, which verifies the good instance segmentation effect of MU R-CNN on QR tag.
Both MU R-CNN and YOLOv3 show good results for QR tag detection in the images taken by the UAV’s onboard camera as shown in Table 9, possibly because the background of the UAV123 data set is relatively clean, making the detection task easier to complete. Figure 12 shows some of the images in D 5 p , which are clean and of high quality. In a UAV autonomous landing mission, if the cooperative target encodes the landing site information, after detecting the target position, QR tag texture semantic segmentation is also required to decode the information which have encoded in the QR tag. MU R-CNN can detect the position of cooperative targets while segmenting each instance. By doing this, QR tag texture semantic segmentation result can be used for subsequent QR decoding, conveniently. But YOLOv3 has no instance segmentation function, so MU R-CNN has better adaptability than YOLOv3.
Li s. in [31] selected 100 high-quality images from D 3 for implementation. Hence, according to the comparison results illustrated in Table 8, the algorithm in Ref. [31] is only suitable for locating QR tags with high-quality images. However, the proposed MU R-CNN is applicable to both high- and low-quality images, so the algorithm proposed in this paper is more suitable than Ref. [31] for PTS, AGV, and other applications in the context of Industry 4.0. While our MU R-CNN improves the detection ability of QR tags in low-quality images, its prediction speed is higher than that reported by Li s. [31]. The reason is that our MU R-CNN adopts GPU (NVIDIA GeForce GTX 1080Ti in our experiments) acceleration and Li’s [31] results adopt CPU. Although adding GPU hardware requires extra costs, in recent studies, with the continuous development of deep learning technology and the wide attention of academia and industry on the application of GPU, GPU hardware will gradually become popular and its price will become cheaper and cheaper. Therefore, in the field of computer vision, adopting GPU will be the future development trend. In the future, this paper will further study the application scenario of MU R-CNN for other targets and possible improvement methods, so as to further improve the structure of the MU R-CNN.

6. Conclusions

Already, 2D code has been widely used in Industry 4.0, visual navigation and other fields, and its application environment is becoming increasingly complex. Therefore, it is urgent to study a highly robust 2D code instance segmentation algorithm to improve the automation level of the whole system. Due to the advantages of high capacity, strong error correction ability and high security, QR code has become the most widely used 2D code, but its instance segmentation in complex environments is a difficult problem. Due to the rich texture of QR tags, even small misalignment may cause a large decrease of IoU, which makes it necessary to adopt a network that can accurately locate. At the same time, low-quality candidate images can lower the value of IoU, disabling it from accurately measuring the completeness of the instance mask, and also making it difficult to obtain a high-quality mask image. In order to solve these problems, MU R-CNN network is proposed in this paper. We utilize the UNet branch to reduce the impact of image quality on IoU through texture segmentation, and in order to optimize IoU, dice-loss is calculated by using output of UNet and ground truth, which is then used to determine the IoU loss. Because dice-loss is an approach for directly optimizing the IoU measure in deep neural networks, choosing dice-loss to determine IoU loss makes it easier to achieve better training results.
The difference between our proposed MU R-CNN and MS R-CNN is that the MaskIoU branch in MS R-CNN is trained at the same time as the Mask R-CNN branch, while our UNet branch adopts the pre-trained optimal results, so as to ensure that L I o U in the MU R-CNN is accurate at the beginning of the end-to-end training. In addition, MaskIoU in MS R-CNN depends on the features of the Mask R-CNN branch, so it cannot be trained independently. However, our UNet branch does not depend on the features of Mask R-CNN, so the training process of UNet branch can be carried out independently, in advance. Finally, because the copy and crop channels in the up-sampling section of UNet enable the network to transfer contextual information from the shallow layer to the deeper layer, low-resolution and high-resolution information can effectively be combined to achieve the purpose of precisely segmenting the texture of a QR tag from noise polluted candidate images. So, the UNet branch in this paper can effectively reduce the impact of image noise on IoU, while on the other hand, the MS R-CNN branch used by MaskIoU has no such de-noising function. Hence the proposed algorithm in this paper has great advantages over the MS R-CNN in QR tag instance segmentation.
The experimental results showed that not only the Average Precision (AP) of mask was significantly improved, but also AP of bounding box was improved. Compared with the relevant QR tag detection algorithm, MU R-CNN’s effect is better than relevant methods. Because MU R-CNN can be applied to both high- and low-quality images, it has a broad application prospect in Industry 4.0, visual navigation, and other fields with complex and changeable environments.
However, our algorithm still needs improvement. For example, in the results shown in Table 7, the "MU R-CNN + HMM" method still has some false positive frames. It is probably because the proposed fusion method of HMM and MU R-CNN is not perfect, and some improved algorithms of HMM, such as the Gaussian mixture-based HMM [57] and embedded HMMs [66] will be studied in the future.

Author Contributions

Conceptualization, B.Y., Y.L., F.J., X.X. and Y.G.; Data curation, B.Y., Y.L., J.Z. and X.S.; Formal analysis, B.Y. and X.X.; Funding acquisition, B.Y., F.J. and J.G.; Investigation, B.Y., Y.L., Y.G. and D.Z.; Methodology, B.Y., F.J. and X.X.; Project administration, B.Y., Y.L. and X.S.; Resources, B.Y. and J.G.; Software, B.Y. and J.Z.; Supervision, B.Y., Y.L. and J.G.; Validation, B.Y., Y.G. and D.Z.; Visualization, B.Y., J.Z. and X.S.; Writing – original draft, B.Y.; Writing – review & editing, B.Y. and F.J.

Funding

This research was funded by the scientific research foundation of Xijing University (No. XJ170204), Shaanxi Key Laboratory of Integrated and Intelligent Navigation open foundation (No. SKLIIN-20180211), the natural science foundation research project of Shaanxi province, China (Grant No.2018JM6098), the research foundation for talented scholars of Xijing University (Grant No. XJ17B06), Natural Science Foundation of China (61473237, 61801382), National Science and Technology Major Project of the Ministry of Science and Technology of China (project number: ZX201703001012-005), the China Postdoctoral Science Foundation (No. 2018M633679), Key Project of Natural Science Foundation of Shaanxi Province (project number: 2019JZ-06).

Acknowledgments

The authors would like to express their gratitude for the research conditions provided by academician He Jifeng’s studio, the research center for internet of things and big data technology of Xijing University and Shaanxi Key Laboratory of Integrated and Intelligent Navigation. The authors also would like to express their gratitude for the experimental equipment provided by Beijing Jiurui Technology co., LTD.

Conflicts of Interest

The authors declare no conflict of interest.

References

  1. Uddin, M.T.; Uddiny, M.A. Human activity recognition from wearable sensors using extremely randomized trees. In Proceedings of the International Conference on Electrical Engineering and Information Communication Technology, Dhaka, Bangladesh, 21–23 May 2015. [Google Scholar]
  2. Jalal, A.; Quaid, M.A.K.; Sidduqi, M.A. A Triaxial acceleration-based human motion detection for ambient smart home system. In Proceedings of the IEEE International Conference on Applied Sciences and Technology, Islamabad, Pakistan, 8–12 January 2019. [Google Scholar]
  3. Ahmed, A.; Jalal, A.; Rafique, A.A. Salient Segmentation based Object Detection and Recognition using Hybrid Genetic Transform. In Proceedings of the IEEE ICAEM Conference, Singapore, 23–26 January 2019. [Google Scholar]
  4. Ahad, A.R.; Kobashi, S.; Tavares, J.M.R.S. Advancements of image processing and vision in healthcare. J. Healthc. Eng. 2018, 2018. [Google Scholar] [CrossRef] [PubMed]
  5. Jalal, A.; Nadeem, A.; Bobasu, S. Human body parts estimation and detection for physical sports movements. In Proceedings of the IEEE International Conference on Communication, Computing and Digital Systems, Islamabad, Pakistan, 6–7 March 2019. [Google Scholar]
  6. Jalal, A.; Mahmood, M. Students’ Behavior Mining in E-learning Environment Using Cognitive Processes with Information Technologies. In Education and Information Technologies; Springer: Berlin/Heidelberg, Germany, 2019. [Google Scholar]
  7. Jalal, A.; IjazUddin. Security architecture for third generation (3G) using GMHS cellular network. In Proceedings of the IEEE Conference on Emerging Technologies, Islamabad, Pakistan, 12–13 November 2007. [Google Scholar]
  8. Chen, I.K.; Chi, C.; Hsu, S.; Chen, L. A real-time system for object detection and location reminding with RGB-D camera. In Proceedings of the 2014 IEEE International Conference on Consumer Electronics, Las Vegas, NV, USA, 10–13 January 2014. [Google Scholar]
  9. Jalal, A.; Mahmood, M.; Hasan, A.S. Multi-features descriptors for human activity tracking and recognition in Indoor-outdoor environments. In Proceedings of the IEEE International Conference on Applied Sciences and Technology, Islamabad, Pakistan, 8–12 January 2019. [Google Scholar]
  10. Leila, M.; Fonseca, G.; Namikawa, L.M.; Castejon, E.F. Digital image processing in remote sensing. In Proceedings of the Conference on Computer Graphics and Image Processing, Rio de Janeiro, Brazil, 11–14 October 2009. [Google Scholar]
  11. Jalal, A.; Kim, Y.; Kim, D. Ridge body parts features for human pose estimation and recognition from RGB-D video data. In Proceedings of the IEEE International Conference on Computing, Communication and Networking Technologies, Hefei, China, 11–13 July 2014. [Google Scholar]
  12. Jalal, A.; Quaid, M.A.K.; Hasan, A.S. Wearable Sensor-Based Human Behavior Understanding and Recognition in Daily Life for Smart Environments. In Proceedings of the IEEE Conference on International Conference on Frontiers of Information Technology, Islamabad, Pakistan, 17–19 December 2018. [Google Scholar]
  13. Mahmood, M.; Jalal, A.; Sidduqi, M.A. Robust spatio-temporal features for human interaction recognition via artificial neural network. In Proceedings of the IEEE Conference on International Conference on Frontiers of Information Technology, Islamabad, Pakistan, 17–19 December 2018. [Google Scholar]
  14. Prochdxka, A.; Kolinovd, M.; Fiala, J.; Hampl, P.; Hlavaty, K. Satellite image processing and air pollution detection. In Proceedings of the IEEE International Conference on Acoustics, Speech and Signal Processing, Istanbul, Turkey, 5–9 June 2000. [Google Scholar]
  15. Fernández-Caramés, T.M.; Fraga-Lamas, P. A Review on Human-Centered IoT-Connected Smart Labels for the Industry 4.0. IEEE Access. 2018, 6, 25939–25957. [Google Scholar] [CrossRef]
  16. Jeong, S.; Na, W.; Kim, J.; Cho, S. Internet of Things for Smart Manufacturing Systems: Trust Issues in Resource Allocation. IEEE Internet Things J. 2018. [Google Scholar] [CrossRef]
  17. Wan, J.; Chen, B.; Imran, M.; Tao, F.; Li, D.; Liu, C.; Ahmad, S. Toward Dynamic Resources Management for IoT-Based Manufacturing. IEEE Commun. Mag. 2018, 56, 52–59. [Google Scholar] [CrossRef]
  18. Yang, C.; Shen, W.; Wang, X. The Internet of Things in Manufacturing: Key Issues and Potential Applications. IEEE Syst. Man Cybern. Mag. 2018, 4, 6–15. [Google Scholar] [CrossRef]
  19. Meng, Z.; Wu, Z.; Gray, J. RFID-Based Object-Centric Data Management Framework for Smart Manufacturing Applications. IEEE Internet Things J. 2019, 6, 1–10. [Google Scholar] [CrossRef]
  20. Khan, T. A Cloud-Based Smart Expiry System Using QR Code. In Proceedings of the 2018 IEEE International Conference on Electro/Information Technology (EIT), Rochester, MI, USA, 3–5 May 2018. [Google Scholar]
  21. Liu, Y.; Gao, H. Traceability Management for the Food Safety along the Supply Chain Collaboration of Agricultural Products; No. 2; Agriculture, Forestry and Fisheries: Arcadia, South Africa, 2018; Volume 7, pp. 58–64. [CrossRef]
  22. Dong, S.; Xu, F.; Tao, S.; Wu, L.; Zhao, X. Research on the Status Quo and Supervision Mechanism of Food Safety in China. Asian Agric. Res. 2018, 10, 32–38. [Google Scholar]
  23. Qing, X.; Zhiwei, X.; Duxiao, F. Vision navigation AGV system based on QR code. Transducer Microsyst. Technol. 2019, 38, 83–90. [Google Scholar]
  24. Van Parys, R.; Verbandt, M.; Kotzé, M.; Coppens, P.; Swevers, J.; Bruyninckx, H.; Pipeleers, G. Distributed Coordination, Transportation & Localization in Industry 4.0. In Proceedings of the 2018 International Conference on Indoor Positioning and Indoor Navigation (IPIN), Nantes, France, 24–27 September 2018. [Google Scholar]
  25. Meng, J.; Kuo, C.; Chang, N.Y. Vision-based range finder for automated guided vehicle navigation. In Proceedings of the 2016 IEEE Workshop on Advanced Robotics and its Social Impacts (ARSO), Shanghai, China, 8–10 July 2016. [Google Scholar]
  26. Kumar, V.S.C.; Sinha, A.; Mallya, P.P.; Nath, N. An Approach towards Automated Navigation of Vehicles Using Overhead Cameras. In Proceedings of the 2017 IEEE International Conference on Computational Intelligence and Computing Research (ICCIC), Coimbatore, India, 14–16 December 2017. [Google Scholar]
  27. Rozsa, Z.; Sziranyi, T. Obstacle Prediction for Automated Guided Vehicles Based on Point Clouds Measured by a Tilted LIDAR Sensor. IEEE Trans. Intell. Transp. Syst. 2018, 19, 2708–2720. [Google Scholar] [CrossRef] [Green Version]
  28. Romera-Paredes, B.; Torr, P.H.S. Recurrent Instance Segmentation. In European Conference on Computer Vision; Springer International Publishing: Amsterdam, The Netherlands, 2016; pp. 312–329. [Google Scholar] [Green Version]
  29. He, K.; Gkioxari, G.; Dollar, P.; Girshick, R. Mask R-CNN. IEEE Trans. Pattern Anal. Mach. Intell. 2018. [Google Scholar] [CrossRef] [PubMed]
  30. Ronneberger, O.; Fischer, P.; Brox, T. UNet: Convolutional networks for biomedical image segmentation. In International Conference on Medical Image Computing and Computer-Assisted Intervention; Springer: Berlin/Heidelberg, Germany, 2015; pp. 234–241. [Google Scholar]
  31. Li, S.; Shang, J.; Duan, Z.; Huang, J. Fast detection method of quick response code based on run-length coding. IET Image Process. 2018, 12, 546–551. [Google Scholar] [CrossRef]
  32. Zhang, X.; Luo, H.; Peng, J. Fast QR code detection. In Proceedings of the 2017 International Conference on the Frontiers and Advances in Data Science (FADS), Xi’an, China, 23–25 October 2017; pp. 151–154. [Google Scholar]
  33. Dubská, M.; Herout, A.; Havel, J. Real-time precise detection of regular grids and matrix codes. J. Real Time Image Process. 2016, 11, 193–200. [Google Scholar]
  34. Li, J.H.; Wang, W.H.; Rao, T.T.; Zhu, W.B.; Liu, C.J. Morphological segmentation of 2-D barcode gray scale image. In Proceedings of the 2016 International Conference on Information System and Artificial Intelligence, Hong Kong, China, 24–26 June 2016; Volume 8, pp. 62–68. [Google Scholar]
  35. Grósz, T.; Bodnár, P.; Tóth, L.; Nyúl, L.G. QR code localization using deep neural networks. In Proceedings of the 2014 IEEE International Workshop on Machine Learning for Signal Processing (MLSP), Reims, France, 21–24 September 2014; pp. 1–6. [Google Scholar]
  36. Chou, T.H.; Ho, C.S.; Kuo, Y.F. QR code detection using convolutional neural networks. In Proceedings of the 2015 International Conference on Advanced Robotics and Intelligent Systems (ARIS), Taipei, Taiwan, 29–31 May 2015; pp. 1–5. [Google Scholar]
  37. Lin, Y.-L.; Sung, C.-M. Preliminary study on QR code detection using HOG and AdaBoost. In Proceedings of the 2015 7th International Conference of Soft Computing and Pattern Recognition (SoCPaR), Fukuoka, Japan, 13–15 November 2015; pp. 318–321. [Google Scholar]
  38. Yuan, B.; Li, Y.; Jiang, F.; Xu, X.; Zhao, J.; Zhang, D.; Guo, J.; Wang, Y.; Zhang, S. Fast QR code detection based on BING and AdaBoost-SVM. In Proceedings of the 2019 IEEE 20th International Conference on High Performance Switching and Routing (HPSR), Xi’An, China, 26–29 May 2019. [Google Scholar]
  39. Zitnick, C.L.; Dollár, P. Edge boxes: Locating object proposals from edges [M]. In Computer Vision-ECCV 2014; Springer: Berlin/Heidelberg, Germany, 2014; pp. 391–405. [Google Scholar]
  40. Hosang, J.; Benenson, R.; Dollár, P.; Schiele, B. What makes for effective detection proposals? IEEE Trans. Pattern Anal. Mach. Intell. 2016, 38, 814–830, Date of Publication: 07 August 2015. [Google Scholar] [CrossRef] [PubMed]
  41. Ren, S.; He, K.; Girshick, R.; Sun, J. Faster R-CNN: Towards real-time object detection with region proposal networks. In Proceedings of the International Conference on Neural Information Processing Systems; MIT Press: Montréal, QC, Canada, 2015; pp. 91–99. [Google Scholar]
  42. Redmon, J.; Divvala, S.; Girshick, R.; Farhadi, A. You only look once: Unified, real time object detection. In Proceedings of the IEEE Conference on Computer Vision and Pattern Recognition, Las Vegas, NV, USA, 27–30 June 2016; pp. 779–788. [Google Scholar]
  43. Redmon, J.; Farhadi, A. YOLO9000: Better, Faster, Stronger. In Proceedings of the IEEE Conference on Computer Vision and Pattern Recognition (CVPR), Honolulu, HI, USA, 21–26 July 2017; Best Paper Honorable Mention. Available online: https://arxiv.org/abs/1612.08242 (accessed on 10 September 2019).
  44. Redmon, J.; Farhadi, A. YOLOv3: An Incremental Improvement. arXiv 2018, arXiv:1804.02767. [Google Scholar]
  45. Liu, W.; Anguelov, D.; Erhan, D.; Szegedy, C.; Reed, S.; Fu, C.Y.; Berg, A.C. SSD: Single Shot MultiBox Detector. In Proceedings of the European Conference on Computer Vision, Amsterdam, The Netherlands, 10–16 October 2016; pp. 21–37. [Google Scholar]
  46. Pinheiro, P.O.; Collobert, R.; Dollar, P. Learning to segment object candidates. In Proceedings of the 28th International Conference on Neural Information Processing Systems, NIPS’15, Montreal, QC, Canada, 7–12 December 2015; Volume 2, pp. 1990–1998. [Google Scholar]
  47. Pinheiro, P.O.; Lin, T.Y.; Collobert, R.; Dollar, P. Learning to refine object segments. In Proceedings of the European Conference on Computer Vision; Springer: Amsterdam, The Netherlands, 2016; pp. 75–91. [Google Scholar]
  48. Dai, J.F.; He, K.M.; Li, Y.; Ren, S.Q.; Sun, J. Instance-sensitive fully convolutional networks. In Proceedings of the European Conference on Computer Vision; Springer: Amsterdam, The Netherlands, 2016; pp. 534–549. [Google Scholar]
  49. Li, Y.; Qi, H.Z.; Dai, J.F.; Ji, X.Y.; Wei, Y.C. Fully convolutional instance-aware semantic segmentation. In Proceedings of the IEEE Conference on Computer Vision and Pattern Recognition (CVPR), Honolulu, HI, USA, 21–26 July 2017; pp. 2359–2367. [Google Scholar]
  50. Rathore, M.M.U.; Ahmad, A.; Paul, A.; Wu, J. Real-time continuous feature extraction in large size satellite images. J. Syst. Archit. EUROMICRO 2016, 64, 122–132. [Google Scholar] [CrossRef]
  51. Jalal, A.; Kamal, S.; Azurdia-Meza, C.A. Depth maps-based human segmentation and action recognition using full-body plus body color cues via recognizer engine. J. Electr. Eng. Technol. 2019, 14, 455–461. [Google Scholar] [CrossRef]
  52. Mahmood, M.; Jalal, A.; Evans, A.H. Facial Expression Recognition in Image Sequences Using 1D Transform and Gabor Wavelet Transform. In Proceedings of the IEEE conference on International Conference on Applied and Engineering Mathematics, Taxila, Pakistan, 4–5 September 2018. [Google Scholar]
  53. Yoshimoto, H.; Date, N.; Yonemoto, S. Vision-based real-time motion capture system using multiple cameras. In Proceedings of the IEEE Conference on Multisensor Fusion and Integration for Intelligent Systems, Tokyo, Japan, 1 August 2003. [Google Scholar]
  54. Jalal, A.; Kamal, S.; Kim, D.-S. Detecting Complex 3D Human Motions with Body Model Low-Rank Representation for Real-Time Smart Activity Monitoring System. KSII Trans. Internet Inf. Syst. 2018, 12, 1189–1204. [Google Scholar] [Green Version]
  55. Farooq, F.; Ahmed, J.; Zheng, L. Facial expression recognition using hybrid features and self-organizing maps. In Proceedings of the IEEE International Conference on Multimedia and Expo, Hong Kong, China, 10–14 July 2017. [Google Scholar]
  56. Huang, Q.; Yang, J.; Qiao, Y. Person re-identification across multi-camera system based on local descriptors. In Proceedings of the IEEE Conference on Distributed Smart Cameras, Hong Kong, China, 30 October–2 November 2012. [Google Scholar]
  57. Piyathilaka, L.; Kodagoda, S. Gaussian mixture based HMM for human daily activity recognition using 3D skeleton features. In Proceedings of the International Conference on Industrial Electronics and Applications (ICIEA), Melbourne, VIC, Australia, 19–21 June 2013. [Google Scholar]
  58. Jalal, A.; Kamal, S.; Kim, D. A depth video-based human detection and activity recognition using multi-features and embedded hidden Markov models for health care monitoring systems. Int. J. Interact. Multimed. Artif. Intell. 2017, 4, 54–62. [Google Scholar] [CrossRef]
  59. Jalal, A.; Kim, Y.H.; Kim, Y.J.; Kamal, S.; Kim, D. Robust human activity recognition from depth video using spatiotemporal multi-fused features. Pattern Recognit. 2017, 61, 295–308. [Google Scholar] [CrossRef]
  60. Jalal, A.; Kamal, S.; Kim, D. Individual Detection-Tracking-Recognition using depth activity images. In Proceedings of the 12th IEEE International Conference on Ubiquitous Robots and Ambient Intelligence (URAI), Goyang, Korea, 28–30 October 2015; pp. 450–455. [Google Scholar]
  61. Kamal, S.; Jalal, A.; Kim, D. Depth Images-based Human Detection, Tracking and Activity Recognition Using Spatiotemporal Features and Modified HMM. J. Electr. Eng. Technol. 2016, 11, 1921–1926. [Google Scholar] [CrossRef]
  62. Jalal, A.; Kamal, S.; Kim, D. Human depth sensors-based activity recognition using spatiotemporal features and hidden markov model for smart environments. J. Comput. Netw. Commun. 2016, 2016, 1–11. [Google Scholar] [CrossRef]
  63. Jalal, A.; Kamal, S.; Kim, D. Facial Expression recognition using 1D transform features and Hidden Markov Model. J. Electr. Eng. Technol. 2017, 12, 1657–1662. [Google Scholar]
  64. Wu, H.; Pan, W.; Xiong, X.; Xu, S. Human activity recognition based on the combined SVM & HMM. In Proceedings of the International Conference on Information and Automation, Hailar, China, 28–30 July 2014. [Google Scholar]
  65. Kamal, S.; Jalal, A. A hybrid feature extraction approach for human detection, tracking and activity recognition using depth sensors. Arab. J. Sci. Eng. 2016, 41, 1043–1051. [Google Scholar] [CrossRef]
  66. Jalal, A. Depth Silhouettes Context: A new robust feature for human tracking and activity recognition based on embedded HMMs. In Proceedings of the 12th IEEE International Conference on Ubiquitous Robots and Ambient Intelligence, Goyang, Korea, 28–30 October 2015; pp. 294–299. [Google Scholar] [CrossRef]
  67. Farooq, A.; Jalal, A.; Kamal, S. Dense RGB-D Map-Based Human Tracking and Activity Recognition using Skin Joints Features and Self-Organizing Map. KSII Trans. Internet Inf. Syst. 2015, 9, 1856–1869. [Google Scholar]
  68. Jalal, A.; Kamal, S.; Farooq, A. A spatiotemporal motion variation features extraction approach for human tracking and pose-based action recognition. In Proceedings of the IEEE International Conference on Informatics, Electronics and Vision, Fukuoka, Japan, 15–18 June 2015. [Google Scholar]
  69. Huang, Z.; Huang, L.; Gong, Y.; Huang, C.; Wang, X. Mask Scoring R-CNN. In Proceedings of the IEEE Conference on Computer Vision and Pattern Recognition CVPR, Long Beach, CA, USA, 16–20 June 2019. [Google Scholar]
  70. Simonyan, K.; Zisserman, A. Very Deep Convolutional Networks for Large-scale Image Recognition. arXiv 2014, arXiv:1409.1556. [Google Scholar]
  71. Fidon, L.; Li, W.; Garcia-Peraza-Herrera, L.C.; Ekanayake, J.; Kitchen, N.; Ourselin, S.; Vercauteren, T. Generalised Wasserstein dice score for imbalanced multi-class segmentation using holistic convolutional networks. In Brainlesion: Glioma, Multiple Sclerosis, Stroke and Traumatic Brain Injuries. BrainLes 2017; Lecture Notes in Computer Science; Crimi, A., Bakas, S., Kuijf, H., Menze, B., Reyes, M., Eds.; Springer: Cham, Switzerland, 2018; Volume 10670. [Google Scholar] [CrossRef]
  72. Rahman, M.A.; Wang, Y. Optimizing intersection-over-union in deep neural networks for image segmentation. In Advances in Visual Computing. ISVC 2016; Lecture Notes in Computer Science; Bebis, G., Boyle, R., Parvin, B., Koracin, D., Porikli, F., Skaff, S., Entezari, A., Min, J., Iwai, D., Sadagic, A., et al., Eds.; Springer: Cham, Switzerland, 2016; Volume 10072. [Google Scholar] [CrossRef]
  73. Milletari, F.; Navab, N.; Ahmadi, S.-A. V-net: Fully convolutional neural networks for volumetric medical image segmentation. In Proceedings of the 2016 Fourth International Conference on 3D Vision (3DV), Stanford, CA, USA, 25–28 October 2016; pp. 565–571. [Google Scholar]
  74. Yang, T.; Ren, Q.; Zhang, F.; Xie, B.; Ren, H.; Li, J.; Zhang, Y. Hybrid Camera Array-Based UAV Auto-Landing on Moving UGV in GPS-Denied Environment. Remote Sens. 2018, 10, 1829. [Google Scholar] [CrossRef]
  75. Mueller, M.; Smith, N.; Ghanem, B. A Benchmark and Simulator for UAV Tracking. In Proceedings of the 2016 European Conference on Computer Vision (ECCV), Amsterdam, The Netherlands, 10–16 October 2016; pp. 445–461. [Google Scholar]
  76. Kanellakis, C.; Nikolakopoulos, G. Survey on Computer Vision for UAVs: Current Developments and Trends. J. Intell. Robot Syst. 2017, 87, 141–168. [Google Scholar] [CrossRef] [Green Version]
  77. Yang, T.; Li, G.; Li, J.; Zhang, Y.; Zhang, X.; Zhang, Z.; Li, Z. A Ground-Based Near Infrared Camera Array System for UAV Auto-Landing in GPS-Denied Environment. Sensors 2016, 16, 1393. [Google Scholar] [CrossRef] [PubMed]
  78. Li, J.; Ma, X.; Chen, H.; Duan, X.; Zhang, Y. Real-time Detection and Tracking Method of Landmark Based on UAV Visual Navigation. J. Northwestern Poly Tech. Univ. 2018, 36, 294–301. [Google Scholar] [CrossRef] [Green Version]
  79. Sharp, S.; Shakernia, O.; Shankar, S. A vision System for Landing an Unmanned Aerial Vehicle. In Proceedings of the IEEE International Conference on Robotics and Automation, Seoul, Korea, 21–26 May 2001. [Google Scholar]
  80. Sven, L.; Niko, S.; Peter, P. A vision based onboard approach for landing and position control of an autonomous multirotor UAV in GPS-denied environments. In Proceedings of the International Conference on Advanced Robotics, Munich, Germany, 22–26 June 2009. [Google Scholar]
  81. Lin, S.; Garratt, M.A.; Lambert, A.J. Monocular vision based real-time target recognition and tracking for autonomously landing an UAV in a cluttered shipboard environment. Auton. Robot. 2017, 41, 881–901. [Google Scholar] [CrossRef]
  82. Araar, O.; Aouf, N.; Vitanov, I. Vision based autonomous landing of multirotor UAV on moving platform. J. Intell. Robot. Syst. 2017, 85, 369–384. [Google Scholar] [CrossRef]
  83. Shirzadeh, M.; Asl, H.J.; Amirkhani, A.; Jalali, A.A. Vision-based control of a quadrotor utilizing artificial neural networks for tracking of moving targets. Eng. Appl. Artif. Intell. 2017, 58, 34–48. [Google Scholar] [CrossRef]
Figure 1. Quick response (QR) tags have rich textures, and even small misalignment can cause large IoU reduction. (ad) display I o U 1 , 1 ,   I o U 15 , 15 , I o U 15 , 0 and I o U 0 , 15 respectively. Figure 2e shows the change curve of I o U d x , d y . The red, orange and blue curve show the change of IoU when d x goes from 1 to 15, d y goes from 1 to 15, and d x = d y goes from 1 to 15, respectively.
Futureinternet 11 00197 g001aFutureinternet 11 00197 g001b
Figure 2. The predicted output of Mask R-CNN model, the quality of mask is very poor. (a) and (b) show two examples of the Mask R-CNN’s predicting results
Futureinternet 11 00197 g002
Figure 3. (a) is a noisy image of a QR tag; (b) is the binarization image of the image in (a); (c) is the ground truth of the image in (a).
Futureinternet 11 00197 g003
Figure 4. (a) is the same image as Figure 3a; (b) is prediction result of UNet branch; (c) is the binarization image of the image in (b).
Futureinternet 11 00197 g004
Figure 5. Network structure of MU R-CNN proposed in this paper.
Futureinternet 11 00197 g005
Figure 6. The network structure of UNet.
Futureinternet 11 00197 g006
Figure 7. The system architecture of our QR tag instance segmentation and tracking.
Futureinternet 11 00197 g007
Figure 8. Partial samples for UNet training.
Futureinternet 11 00197 g008
Figure 9. Prediction process using trained MU R-CNN model.
Futureinternet 11 00197 g009
Figure 10. A prediction example of MU R-CNN. (a) Input image. (b) Bounding box predicted by Mask R-CNN branch; (c) The candidate image segmented from the input image, and for blurry image, the texture of QR tag is usually not clear enough; (d) Instance mask of MU R-CNN network prediction output; (e) Instance mask of Mask R-CNN network prediction output.
Futureinternet 11 00197 g010
Figure 11. Cooperative targets of UAV autonomous landing based on Visual Navigation in related literatures. (a) T. Yang [74]; (b) J. Li [78]; (c) Sharp. S. [79]; (d) L. Sven [80].
Futureinternet 11 00197 g011
Figure 12. Images from dataset D 5 p obtained by superimposing QR tags on UAV123 images, and the background of UAV123 data set is clean.
Futureinternet 11 00197 g012
Table 1. Training process of UNet branch.
StepsOperating Process
1Select 60 training images
2Mark ground truth manually
3The training images and their corresponding ground truth were augmented in pairs to obtain the training set after data augmentation
4The training set after data augmentation is sent to UNet for training
5Start training until the number of epochs reaches 1000, and the learning rate during training is set to 0.00001; eventually we got M U N e t
Table 2. Training process of total MU R-CNN.
StepsOperating Process
1First, the training image is input into the Mask R-CNN branch to obtain the candidate region R i
2 R i is then sent to the pre-trained M U N e t to output a texture segmented QR tag image I i , u n e t
3After the texture segmentation of all candidate region images, binarization is carried out
4Dice loss L I o U is calculated according to the formula (1)
5Calculate the loss of the entire MU R-CNN according to Equation (2)
6Start end-to-end training
7After training, the MU R-CNN model is obtained.
Table 3. Prediction process of total MU R-CNN.
StepsOperating Process
1First, input the test image into Mask R-CNN branch, and get output candidate regions R i
2Segment the candidate images in the input image according to the bounding box and class of R i
3Candidate images are then sent to the pre-trained M U N e t to output texture segmented QR tag image, and this is the final output of the MU R-CNN network
Table 4. The datasets used in this article.
DatasetTotal NumberTrain Subset NameNumber of Train SubsetTest Subset NameNumber of Test Subset
D 1 14,000 images/18409 QR tags D 1 t 7000 images/8774 QR tags D 1 p 7000 images/9635 QR tags
D 2 125 images/129 QR tags---125 images/129 QR tags
D 3 810 images/810 QR tags---810 images/810 QR tags
D 4 5000 images/5000 QR tags D 4 t 3000 images/3000 QR tags D 4 p 2000 images/2000 QR tags
D 5 5000 images/5000 QR tags D 5 t 3000 images/3000 QR tags D 5 p 2000 images/2000 QR tags
Table 5. Both detection and instance segmentation results on D pr dataset. APm denotes instance segmentation results and APb denotes detection results.
BackbonenetworkAPm[email protected][email protected]APb[email protected][email protected]
ResNet-18 FPNMASK R-CNN4.2115.53055.6178.2464.88
MS R-CNN5.5816.981.6357.2281.6268.79
MU R-CNN10.0525.756.5358.8082.0569.66
ResNet-50 FPNMASK R-CNN6.8724.73062.0887.1573.26
MS R-CNN8.8926.383.2362.4386.8373.14
MU R-CNN13.8134.389.9364.1587.7274.27
ResNet-101 FPNMASK R-CNN8.6628.13065.6689.9576.45
MS R-CNN10.6029.635.4866.0290.3676.81
MU R-CNN17.3840.1313.8367.7091.6878.31
-YOLOv3---59.5383.9270.01
Table 6. Comparing MU R-CNN and related networks in D 1 p , D 2 , D 3 , D 4 p and D 5 p dataset. The backbone of MU R-CNN, MS R-CNN and MASK R-CNN are all ResNet-101 FPN.
DatasetNetworkAPm[email protected][email protected]APb[email protected][email protected]
D 1 p MASK R-CNN8.4827.85066.6690.3477.63
MS R-CNN10.2929.344.9166.7589.7977
MU R-CNN16.9340.1213.8968.7392.578.43
D 2 MASK R-CNN8.4627.98063.3587.4373.83
MS R-CNN10.4529.415.462.3988.2574.27
MU R-CNN17.240.0213.6464.5388.9375.64
D 3 MASK R-CNN8.828.27068.1791.8378.44
MS R-CNN10.8129.835.6669.2891.9778.94
MU R-CNN17.4940.2213.9770.8293.5980.53
D 4 p MASK R-CNN8.4928.05062.5487.7173.69
MS R-CNN10.4729.425.3563.4188.5974.68
MU R-CNN17.2439.9413.6164.8989.5275.97
D 5 p MASK R-CNN9.0728.5067.5892.4478.66
MS R-CNN10.9830.156.0868.2793.279.16
MU R-CNN18.0440.3514.0469.5393.8680.98
Table 7. Comparison of tracking effects between H M M 0 and H M M 1 .
AlgorithmDatasetImage NumberTrue PositiveFalse PositivePrecision
MU R-CNN + HMM D 6 p 1 900892899.11
D 6 p 2 900897399.67
D 6 p 3 9008891198.78
algorithm in Ref. [38]+ HMM D 6 p 1 9008544694.89
D 6 p 2 9008584295.33
D 6 p 3 9008485294.22
Table 8. The performances of proposed algorithm compared with relevant algorithms.
AlgorithmData SetnRecallPrecisiont(ms)
MU R-CNN
with ResNet-101 FPN
D 3 8109999.2629
D 2 12598.498.427
Li S. in [31] D 3 100-97–98.552–58
Chou T. in [36] D 2 12595.2--
Table 9. Comparison of the effects of MU R-CNN and YOLOv3 in UAV environment.
NetworkTotal TargetsTPFPFNPrecisionRecallF1-Measure
MU R-CNN200019981299.9599.999.92
YOLOv319922899.9099.699.75

