Article

Evaluating the Degree of Uncertainty of Research Activities in Industry 4.0

1
Department of Agriculture, University of Udine, Via delle Scienze 206, I-33100 Udine, Italy
2
Centro Ricerche e Studi dei Laghi, Corso di Porta Vittoria 31, I-20122 Milano, Italy
3
SEA TUSCIA, Tuscia University, Via San Camillo de Lellis, 01100 Viterbo, Italy
4
Department of Agricultural and Forestry Sciences (DAFNE), Tuscia University, Via San Camillo de Lellis, snc, I-01100 Viterbo, Italy
*
Author to whom correspondence should be addressed.
Future Internet 2019, 11(9), 196; https://doi.org/10.3390/fi11090196
Submission received: 5 August 2019 / Revised: 27 August 2019 / Accepted: 9 September 2019 / Published: 11 September 2019

Abstract

:
Research and development (R&D) are always oriented towards new discoveries, based on original terms or hypotheses, and their concluding outcomes are often uncertain. The present work focused on the degree of uncertainty for R&D activities. In fact, uncertainty makes it difficult to quantify the time and resources needed to achieve a final outcome, create a work plan and budget, and finalize the resulting “innovative” products or services that could be transferred or exchanged in a specific market. The present work attempts to indicate the degree of uncertainty of the research activities developed by a set of firms. The method used aimed to quantify the five criteria defined by the Manual of Frascati. Through the creation of an uncertainty cloud, a cone of uncertainty was defined following an approach based on project management. The evaluation grid was characterized by the decomposition of the different variables divided into quartiles, which allowed for the detection of the evolution of the project and each of its component. The ancillary objective aim was to also observe the development degree of these industries towards a framework of Industry 4.0.

1. Introduction

Research and development (R&D) is always oriented towards new discoveries, based on original innovation topics or hypotheses [1,2,3,4,5,6,7,8], and their concluding outcome is often uncertain [9,10,11]. The present work focused on the degree of uncertainty of R&D activities. In fact, uncertainty makes it difficult to quantify the time and resources needed to achieve an outcome, develop a useful plan, and budget and finalize the resulting “innovative” products or services that could be transferred or exchanged in a specific market [12,13,14,15].
Innovation is particularly critical and risky in dynamic and uncertain markets where the product or service uses new and uncertain technologies [3,7,10,12,16,17,18,19]. The literature on new product development offers several tools to support, while on approaches and methods for measuring the degree of uncertainty is restricted for R&D activities [9,10,20,21,22,23,24]. An uncertainty theory was instituted as a division of mathematics grounded on monotonicity, normality, self-duality, and countable subadditivity axioms [25,26,27,28,29]. From a management viewpoint, uncertainty is associated with the lack of precise knowledge regardless of the reason for this deficit [10,11,14,30]. Each decision or set of decisions has related advances or losses which are typically reliant on numerous random variables and, therefore, highly uncertain [14]. Thus, uncertainty is a term generally used in several contexts [31,32,33], revealing, in general, other related concepts:
  • Uncertainty: lack of certainty, an inadequate state of knowledge in which it is intolerable to define precisely the current state, future outcomes or more than one conceivable result (e.g., [2,33]).
  • Uncertainty measure: a series of possible states in which results or probabilities are assigned to each possible state or result—this also includes the application of a probability density function to continuous variables.
  • Risk: A state of uncertainty in which some possible results have an unwanted effect or a significant loss.
  • Risk measurement: a series of measured uncertainties in which some results are possible losses, and the extent of such losses—also including the formulates of loss on continuous variables.
The definition of R&D assumed in the present paper is provided in the Manual of Frascati [34]. The Frascati framework offers information approximating the funding and the performance of R&D [35,36]. It includes a set of creative activities carried out in a systematic way with the aim of to develop and increase new knowledge and to use existing knowledge for new applications. The Manual of Frascati outlines and defines the common characteristics of the R&D activities, the objectives—which may be specific or general—and the criteria for identifying them, with the aim of providing guidance for the measurement of other related activities. Five criteria must be met to classify an R&D activity, mainly:
  • “novelty”, since the activity must produce new results;
  • “originality”, since each activity must be aimed at developing new concepts and ideas;
  • “uncertainty of the results”, as at an early stage, it is not possible to define precisely the type of result and the costs in relation to the objectives to be achieved;
  • “orderliness”, since the activity must be conducted in a planned and accountable manner, and both the process and the results must be retained;
  • “reproducibility”, since the results of the activity must ensure the transferability of knowledge and the reproducibility of the results within other R&D activities.
The present work attempts to indicate the degree of uncertainty of the research activities developed by a set of firms. The method used aims to quantify the five criteria defined by the Manual of Frascati. Through a cloud as a validated scientific method [37,38,39,40,41], a cone of uncertainty was defined following an approach based on project management. The evaluation grid is characterized by the decomposition of the different variables divided into quartiles, which allows to detect the evolution of the project in each its component. The ancillary objective aimed also to observe the development degree of these industries towards a framework of Industry 4.0.

2. Industry 4.0 in Italy

The term “Industry 4.0” is commonly used to identify the technological transformation that is currently taking place in all domains of the economy: production, consumption, transport, and communications [42,43,44,45,46]. Such transformation is driven by the interlacing of digitization (with devices and processes capable of transmitting and processing huge masses of data) and automation (the availability of machines capable of carrying out tasks of medium–high complexity) [17,47]. The transition to Industry 4.0 is characterized by a dual nature: on the one hand, great opportunities associated with the creation of new wealth and greater well-being, through productivity gains; the satisfaction of new needs, through new products or new process; and the greater efficiency of production processes, thanks to the implementation of process innovations [48,49].
The National Enterprise Plan 4.0 (formerly “Industry 4.0”) is a recent chance for all firms in Italy that want to seize the opportunities related to the fourth industrial revolution [48,49,50,51,52,53].
All measures that have proved to be effective have been strengthened and targeted in a 4.0 logic in order to fully respond to emerging needs [54,55]. Among the main actions is the tax credit, which aims to reward those who invest in the future [2,16,55].
However, many firms are unenthusiastic about the 4.0 evolution, as R&D is often a component that generates a high degree of different natures of uncertainty (e.g., economic, social, technological, legal) [1,48,49,56]. In fact, the novelty and the great complication of the phenomenon of Industry 4.0 cause a high risk of uncertainty during R&D investigations [9].

3. Degree of Uncertainty in Industry 4.0

Selected determinants were defined by the phenomenon of uncertainty in the area of Industry 4.0 in the literature [1,48,49,57,58]. The concept of Industry 4.0 is a German discovery that occurred 2011 [56,59]. It is consequently fraught with a high level of uncertainty in numerous characteristics (technological, legal, economic, social, etc.) [56]. Uncertainty regarding Industry 4.0 is triggered by the high intricacy of the subject and a deficiency of current guidance in the direction of the comprehension of the visions and concepts [60,61,62,63,64,65]. Particularly, this phenomenon is interesting for evaluating several case studies on communication among the main network components of Industry 4.0 based on massive amounts of data collected regarding self-control, beyond a secure internal network [61,62,63].
Moreover, Industry 4.0 includes the creation of new, not previously known business models of cooperation and new values chains, based on a very extensive scale of the relationships among all parties setting up the new ecosystem [56]. The baseline concepts of Industry 4.0 are the integration of new IT systems—where the old systems were not designed for the Internet of Things—very high complexity and dynamism for this new environment, and the tools used for big data analysis [66,67,68]. Currently, researchers are looking for processes to implement Industry 4.0 in other countries with solutions that are more favorable to the local context [17], which will result in the transfer of production. This will lead to product development that is not developed on the spot, which will improve the strong position in the export markets of countries that are characterized by a current cost advantage and will increase the complexity of the manufactured parts [69,70,71,72].
These abovementioned issues can be associated with the following dimensions of the theory of uncertainty [69,70]. Uncertainties in behavioral terms—as a composite, which is the result of internal factors (relating to Industry 4.0) and external (situational)—is induced by the complexity and dynamics of the environment (suppliers, customers, network security, etc.) [56,73,74]. Furthermore, subjective uncertainty (in structural terms) results from the cognitive limitations of policymakers, referring to information management generated in the system and subsystems of Industry 4.0, particularly, in terms of its acquisition, processing, and storage. Relational uncertainty (in structural terms) is formed at the interface between organizations and the environment through a complex web of interactions between firms that adopt Industry 4.0 and their stakeholders. This uncertainty will be shaped by the dynamics of the business environment and the difficultly in predicting the behavior of different groups of stakeholders. Moreover, structural uncertainty (in terms of a binary way of describing uncertainty) will occur when there are opportunities to identify the chain of cause and effect relationships regarding the analyzed events (economic, technological, social, legal, etc.); but, due to the huge dynamic development of Industry 4.0, it will not be possible to determine probable future events based on present conditions. Finally, indeterminacy (in terms of a binary way of describing uncertainty) concerns the present and includes mainly countries such as Poland, where there is a lack of clear information about the validity of changing ambition, lack of full knowledge of the cause and effect relationships occurring between the variables and uncertainty, and the available courses of action and their consequences [56].
Additional potential areas of uncertainty referring the technological (communication) aspects, in particular decentralized intelligence, are where intelligent drive and control technologies network with other devices with decentralized autonomy [71,72].
Industry 4.0 should suggest (and receive) analytical business strategies in the future industrial revolution, i.e., Industry 4.0. Such development necessitates the application of specific tools and, consequently, the data collected can be methodically dealt with to explain uncertainties and, thus, used to make more “informed” conclusions [57].

4. Methodology

The literature offers different studies on the subject concerning the activities of research and development in advanced countries, such as the UK and Germany [17], while it is less advanced in Italy. This is due to the uncertainty of these activities and because of a certain cultural background which makes it difficult to implement Industry 4.0 in Italy, as opposed to other countries, such as Germany. Offering a method to reduce the degree of uncertainty can be an incentive in an economy such as the Italian one.
The present work explored the degree of uncertainty that emerged during the R&D activities conducted by a set of Italian firms (Figure 1), mainly related to the manufacturing industry [9] and most of which were located in northern Italy. These firms considered as positive the benefits offered by the National Enterprise Plan 4.0, namely, the tax credits. Data collection occurred over a period of two years (2016–2018), during which 190 projects were analyzed. The analysis was carried out at two levels:
  • Direct survey with the entrepreneur and the internal research team (always being projects of a corporate nature and industrial development);
  • A technical analysis of the documentation supporting the project idea.
The two analysis thresholds were the starting point for the compilation of the positioning grid from which the uncertainty graph was generated.
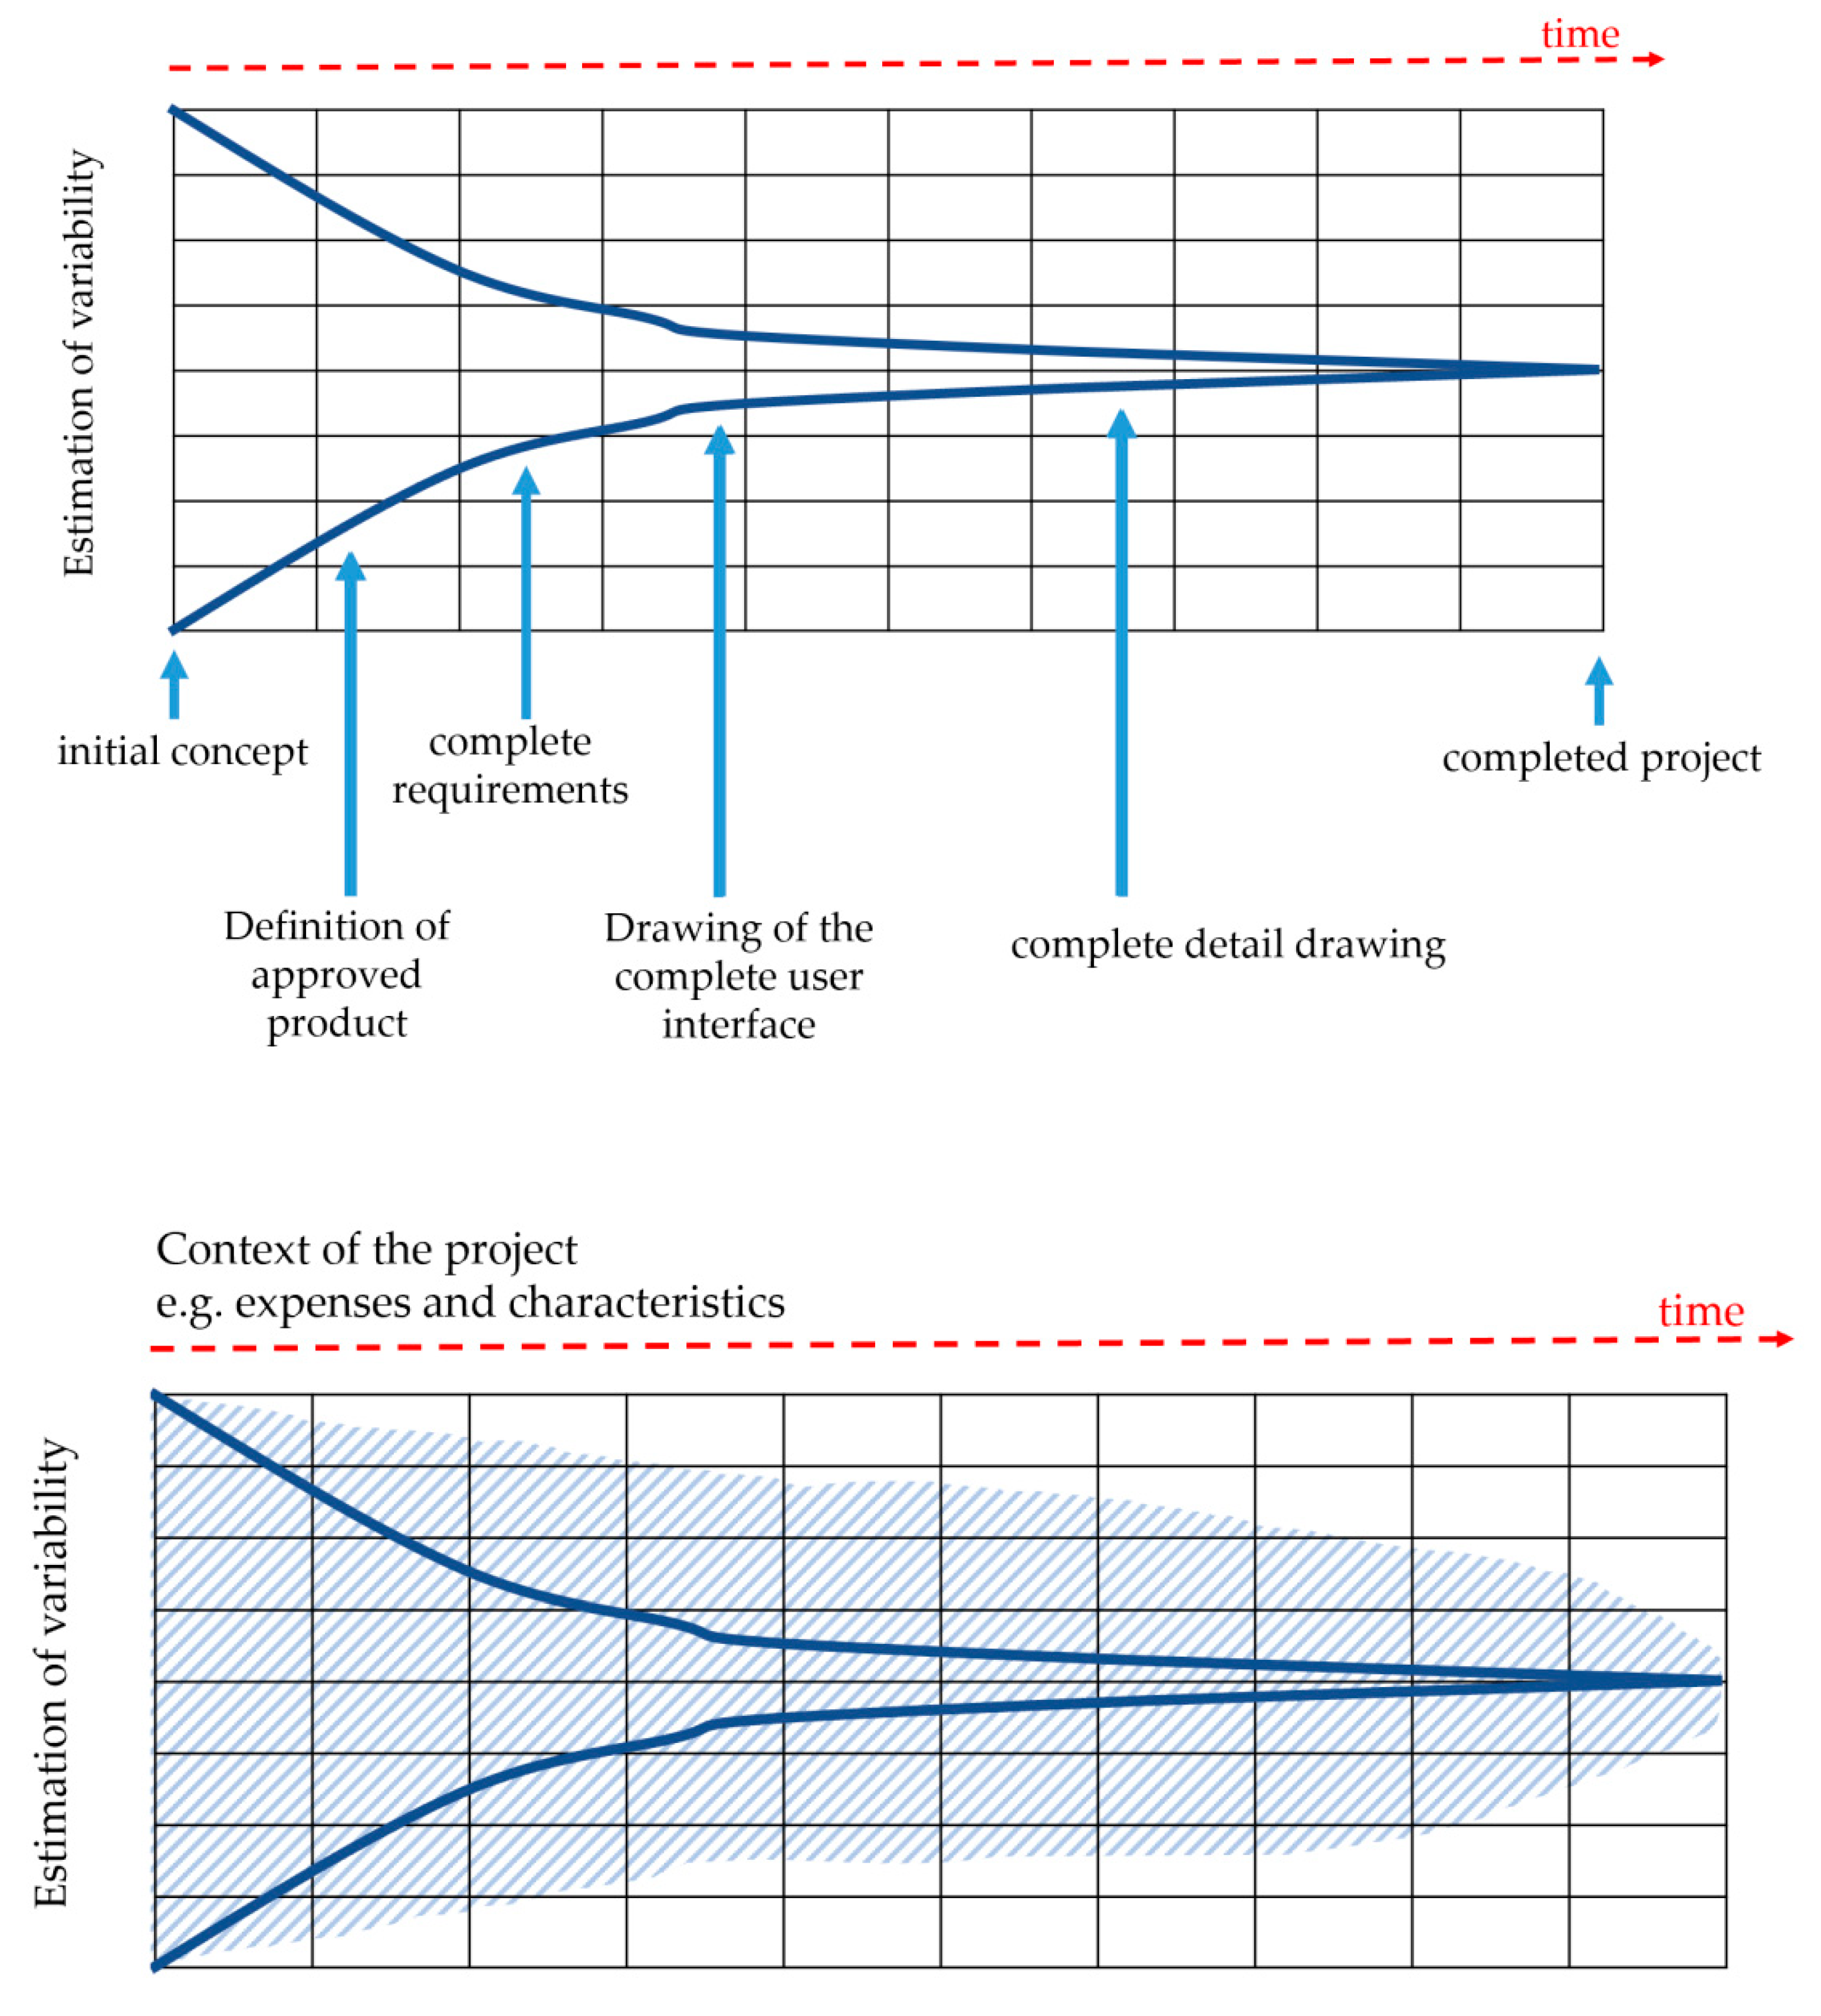
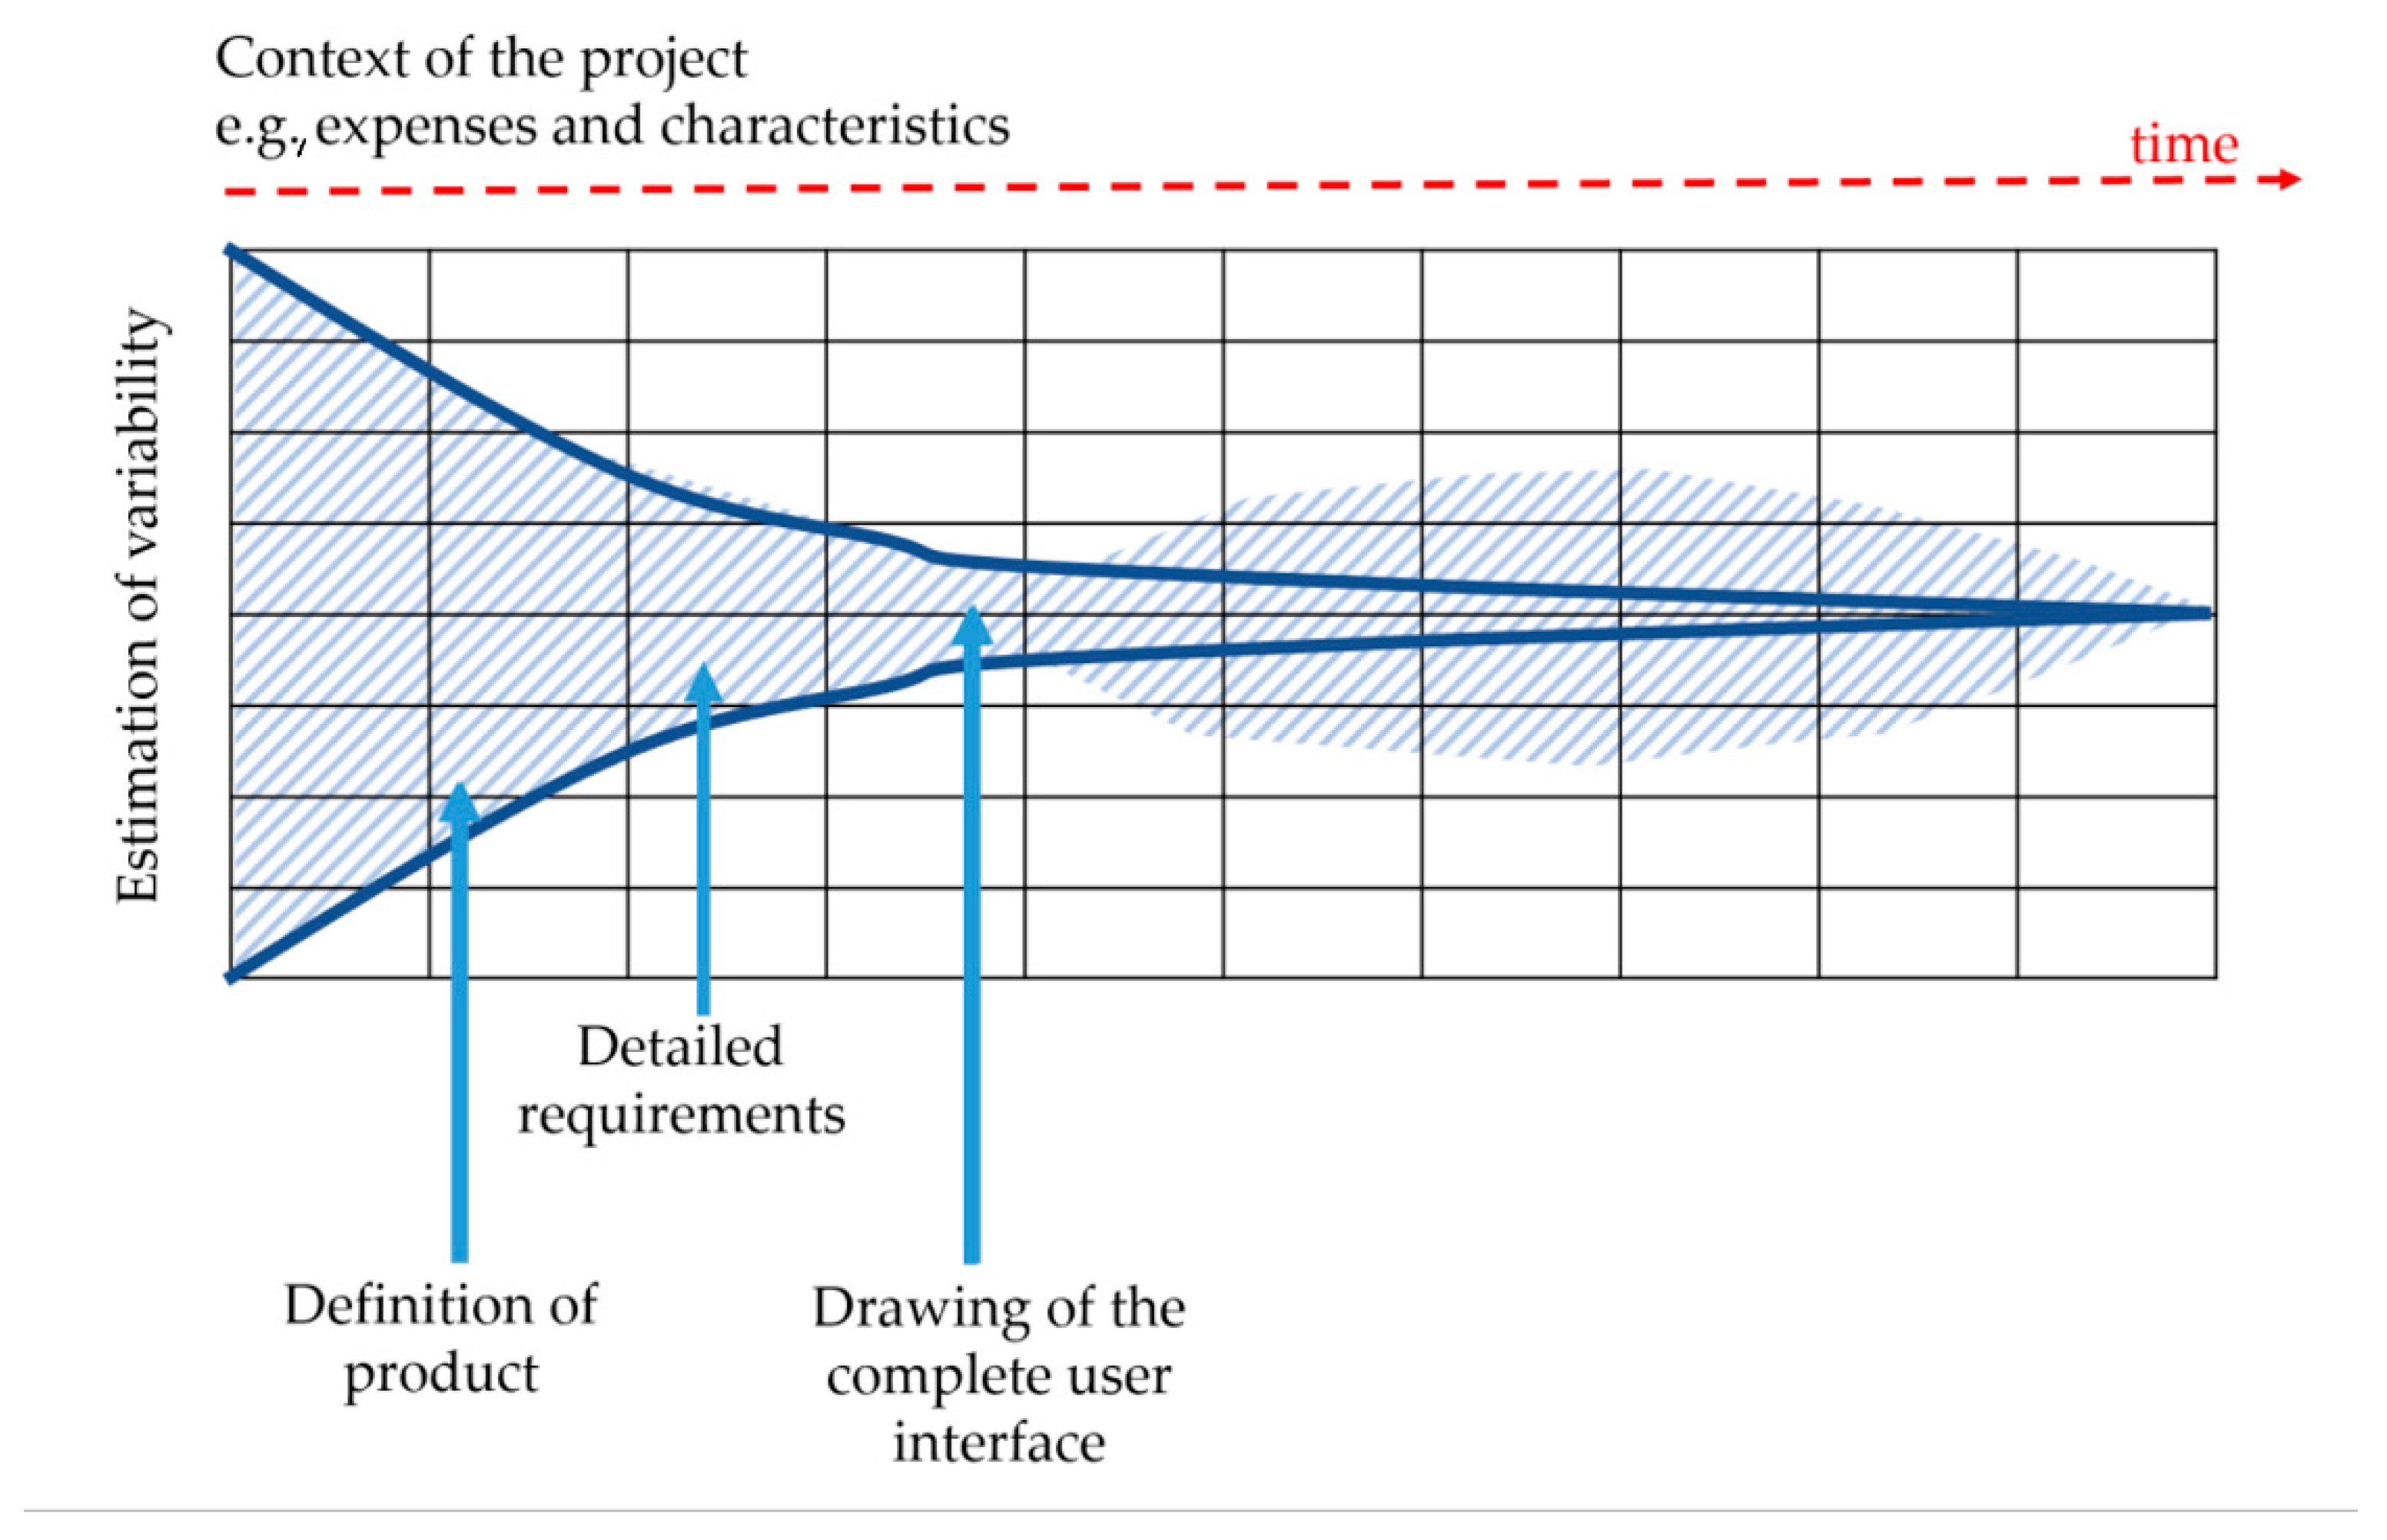
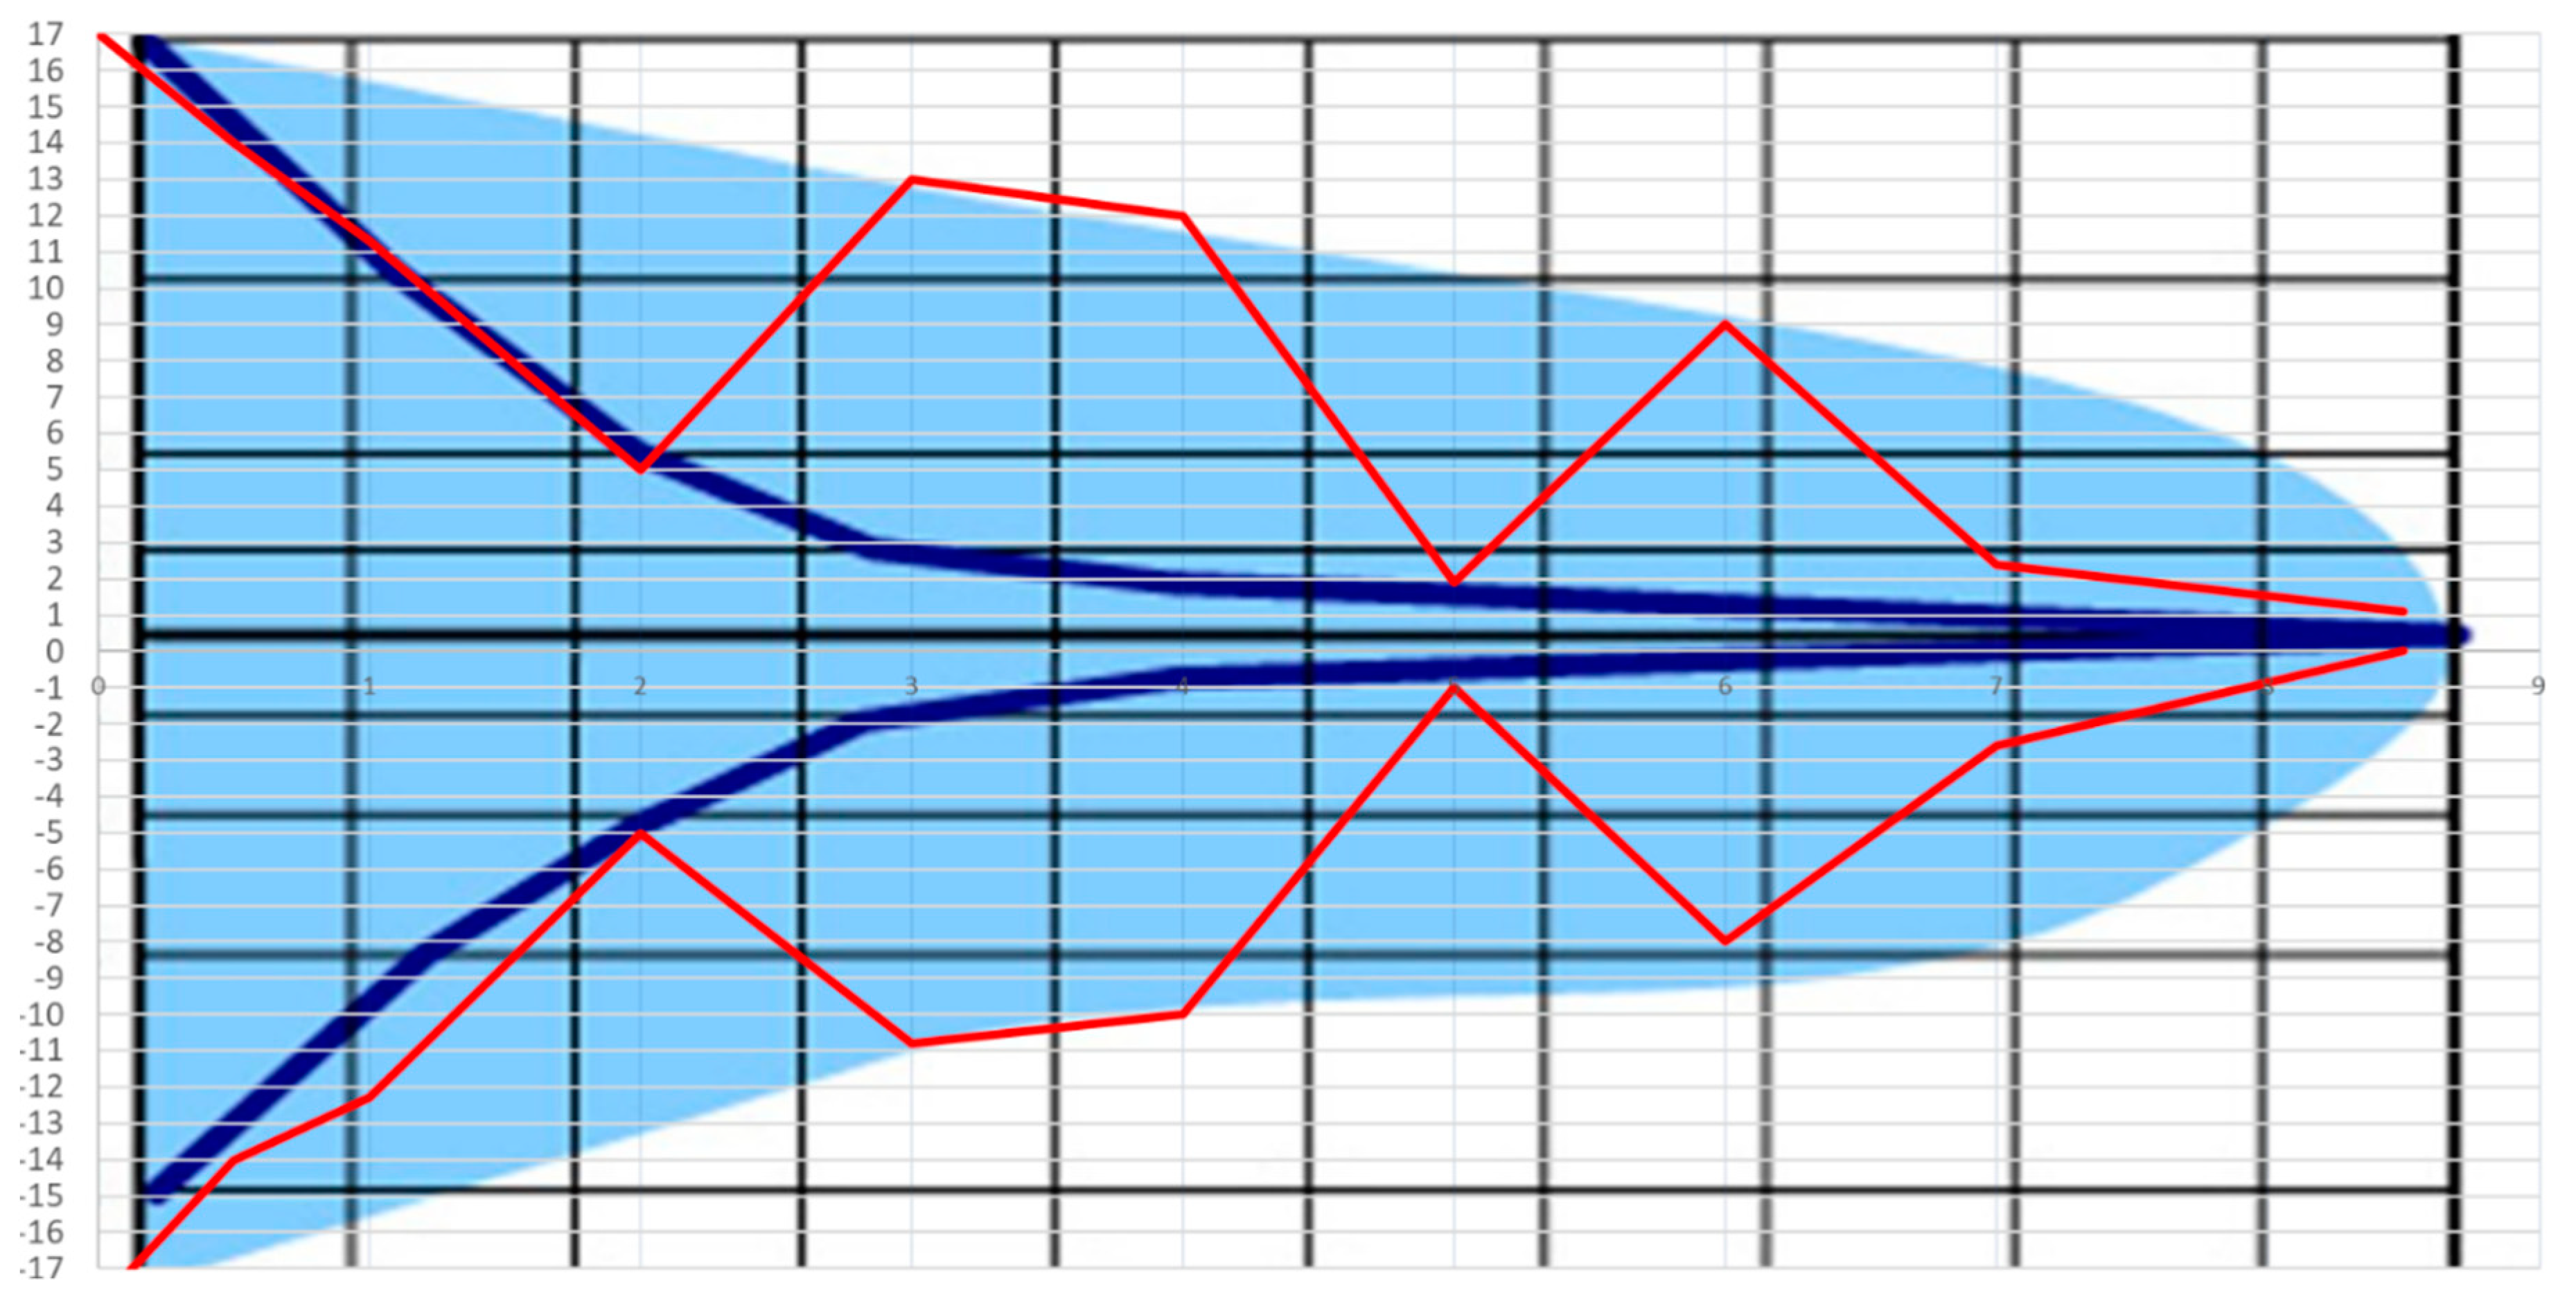
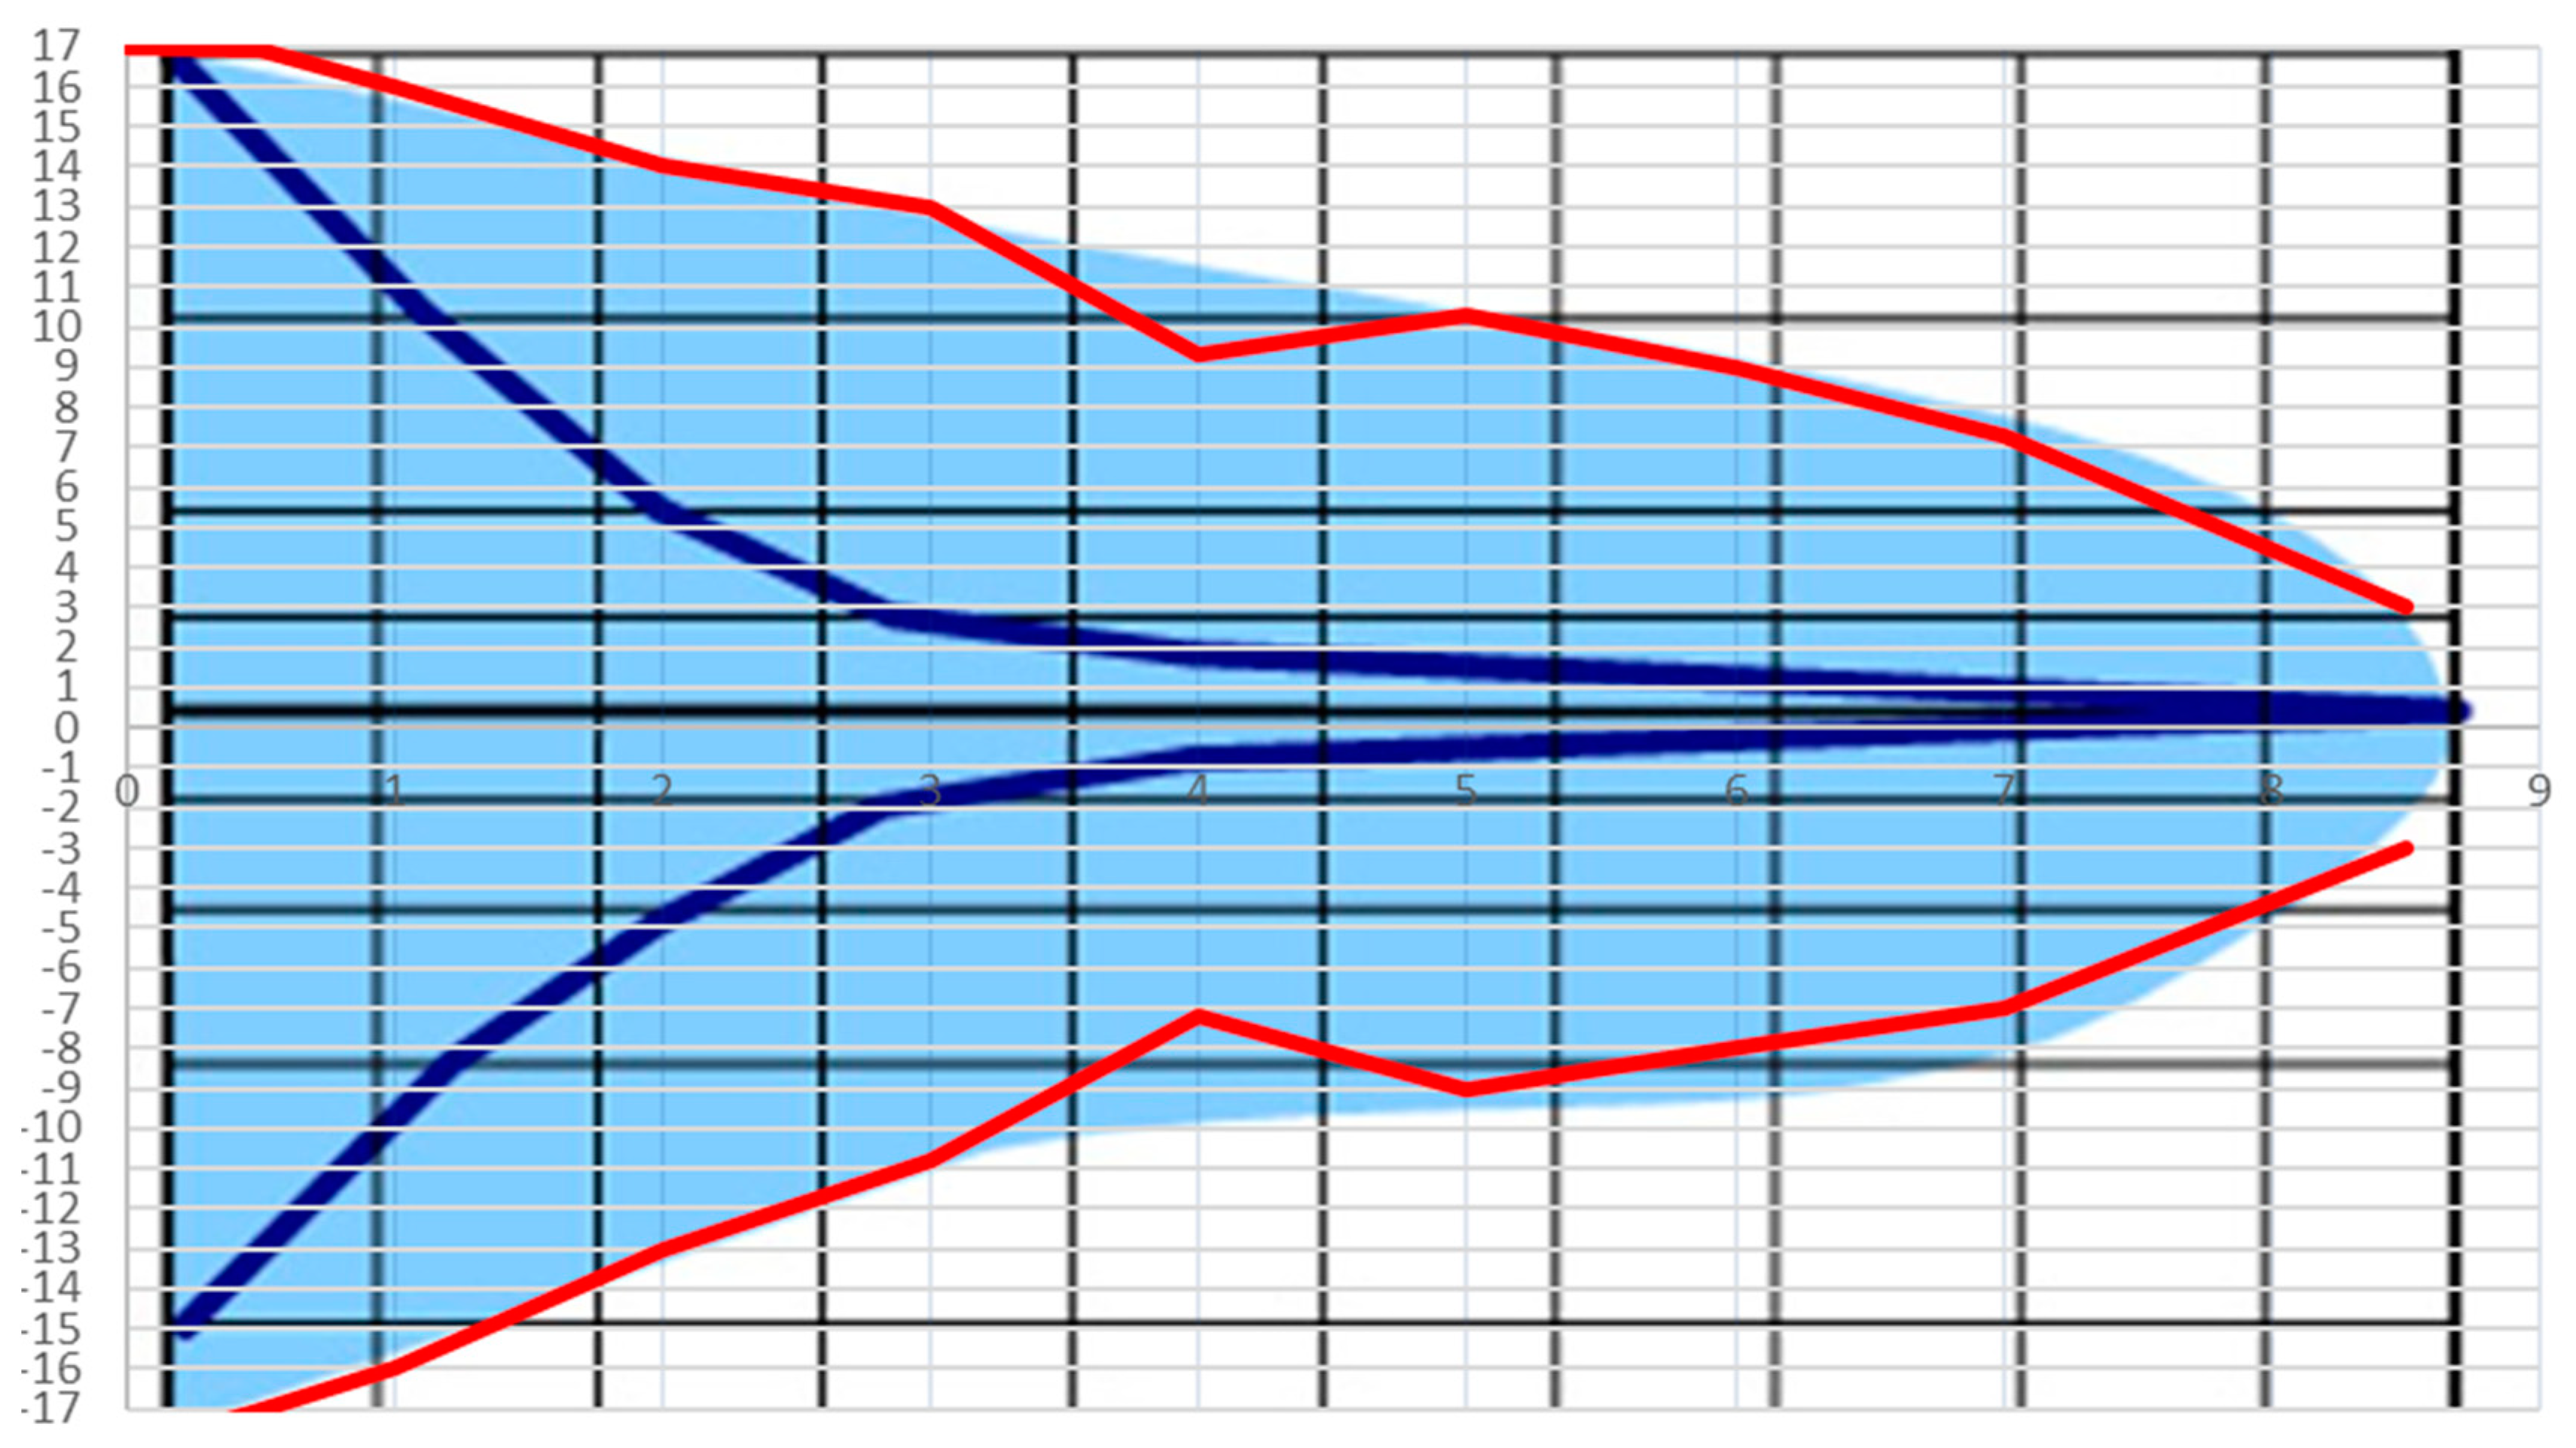
The approach used measured the degree of uncertainty of each research project. The temporal dimension marks four phases: conception, conceptualization, design, and prototyping. The uncertainties of a project have an evolution consistent with that indicated and known in the bibliography as a “cone of uncertainty” [75,76]. The phenomenon known as the “cone of uncertainty” is determined by the tendency of estimates to be quite imprecise in a specific part of a project. At the beginning of a project there is still limited information about the scope, the specifications of the various deliverables, and the resources involved. As a result, time and cost and the overall effort are rather vague. Therefore, a planning phase is needed that will help to explain all these aspects and to build the project plan. As the project progresses and passes from the planning phase to the implementation phase, more and more precise information is acquired and, therefore, the cone of uncertainty is reduced as illustrated in Figure 2. The horizontal axis represents time and on it are represented the various phases that a project goes through from the beginning to the completion of the work (the terms used refer to a software development project, but the phenomenon concerns all types of projects). The vertical axis represents the margin of error in the estimates. This margin is usually significantly reduced after one-third of the time has elapsed since the start of the project. Of course, this trend is not only linked to time but also to the ability to use that time to collect information. If this does not happen, a cloud of uncertainty is generated that envelops the project to the end as in the adjacent representation [37,38,39,40,41]. The cone of uncertainty is reduced only through a decision-making process that gradually eliminates variability. By deciding what should be done and what should not be done, defining the resources that will be used, and defining the expected quality level and the budget allocated, the variability of the estimates is reduced and allows to manage the next phase of implementation. During the work, the data related to the progress of the project will permit to make other decisions aimed at further reducing the margins of variation.
The cone of uncertainty can have significant effects especially in large projects, so it may be important to wait for a detailed analysis to be carried out before making binding commitments in the face of information that has not yet been sufficiently verified. A similar observation applies to those types of projects (such as research and development projects) which by their very nature have high margins of variability. Figure 2 clearly exposes how the various initial steps reduce the cloud of uncertainty. This allows key variables to be better focused and commitments to be made only when the variability margin is within acceptable limits. Of course, project estimates and plans based on them need to be reviewed periodically during the work to ensure that the objectives are achieved. This has helped to further reduce the uncertainty cone and eliminate the uncertainty cloud [37,38,39,40,41].

5. Results

The methodological approach has a dual practical and operational value, seen either within a project team or an external evaluator. In fact, thanks to the evaluation of the ex-ante project, it is possible to determine the level of risk of the project right from the start, defining it in practice, and if necessary, developing alternative solutions or reserve budgets in the event that the uncertainty factor is extremely high.
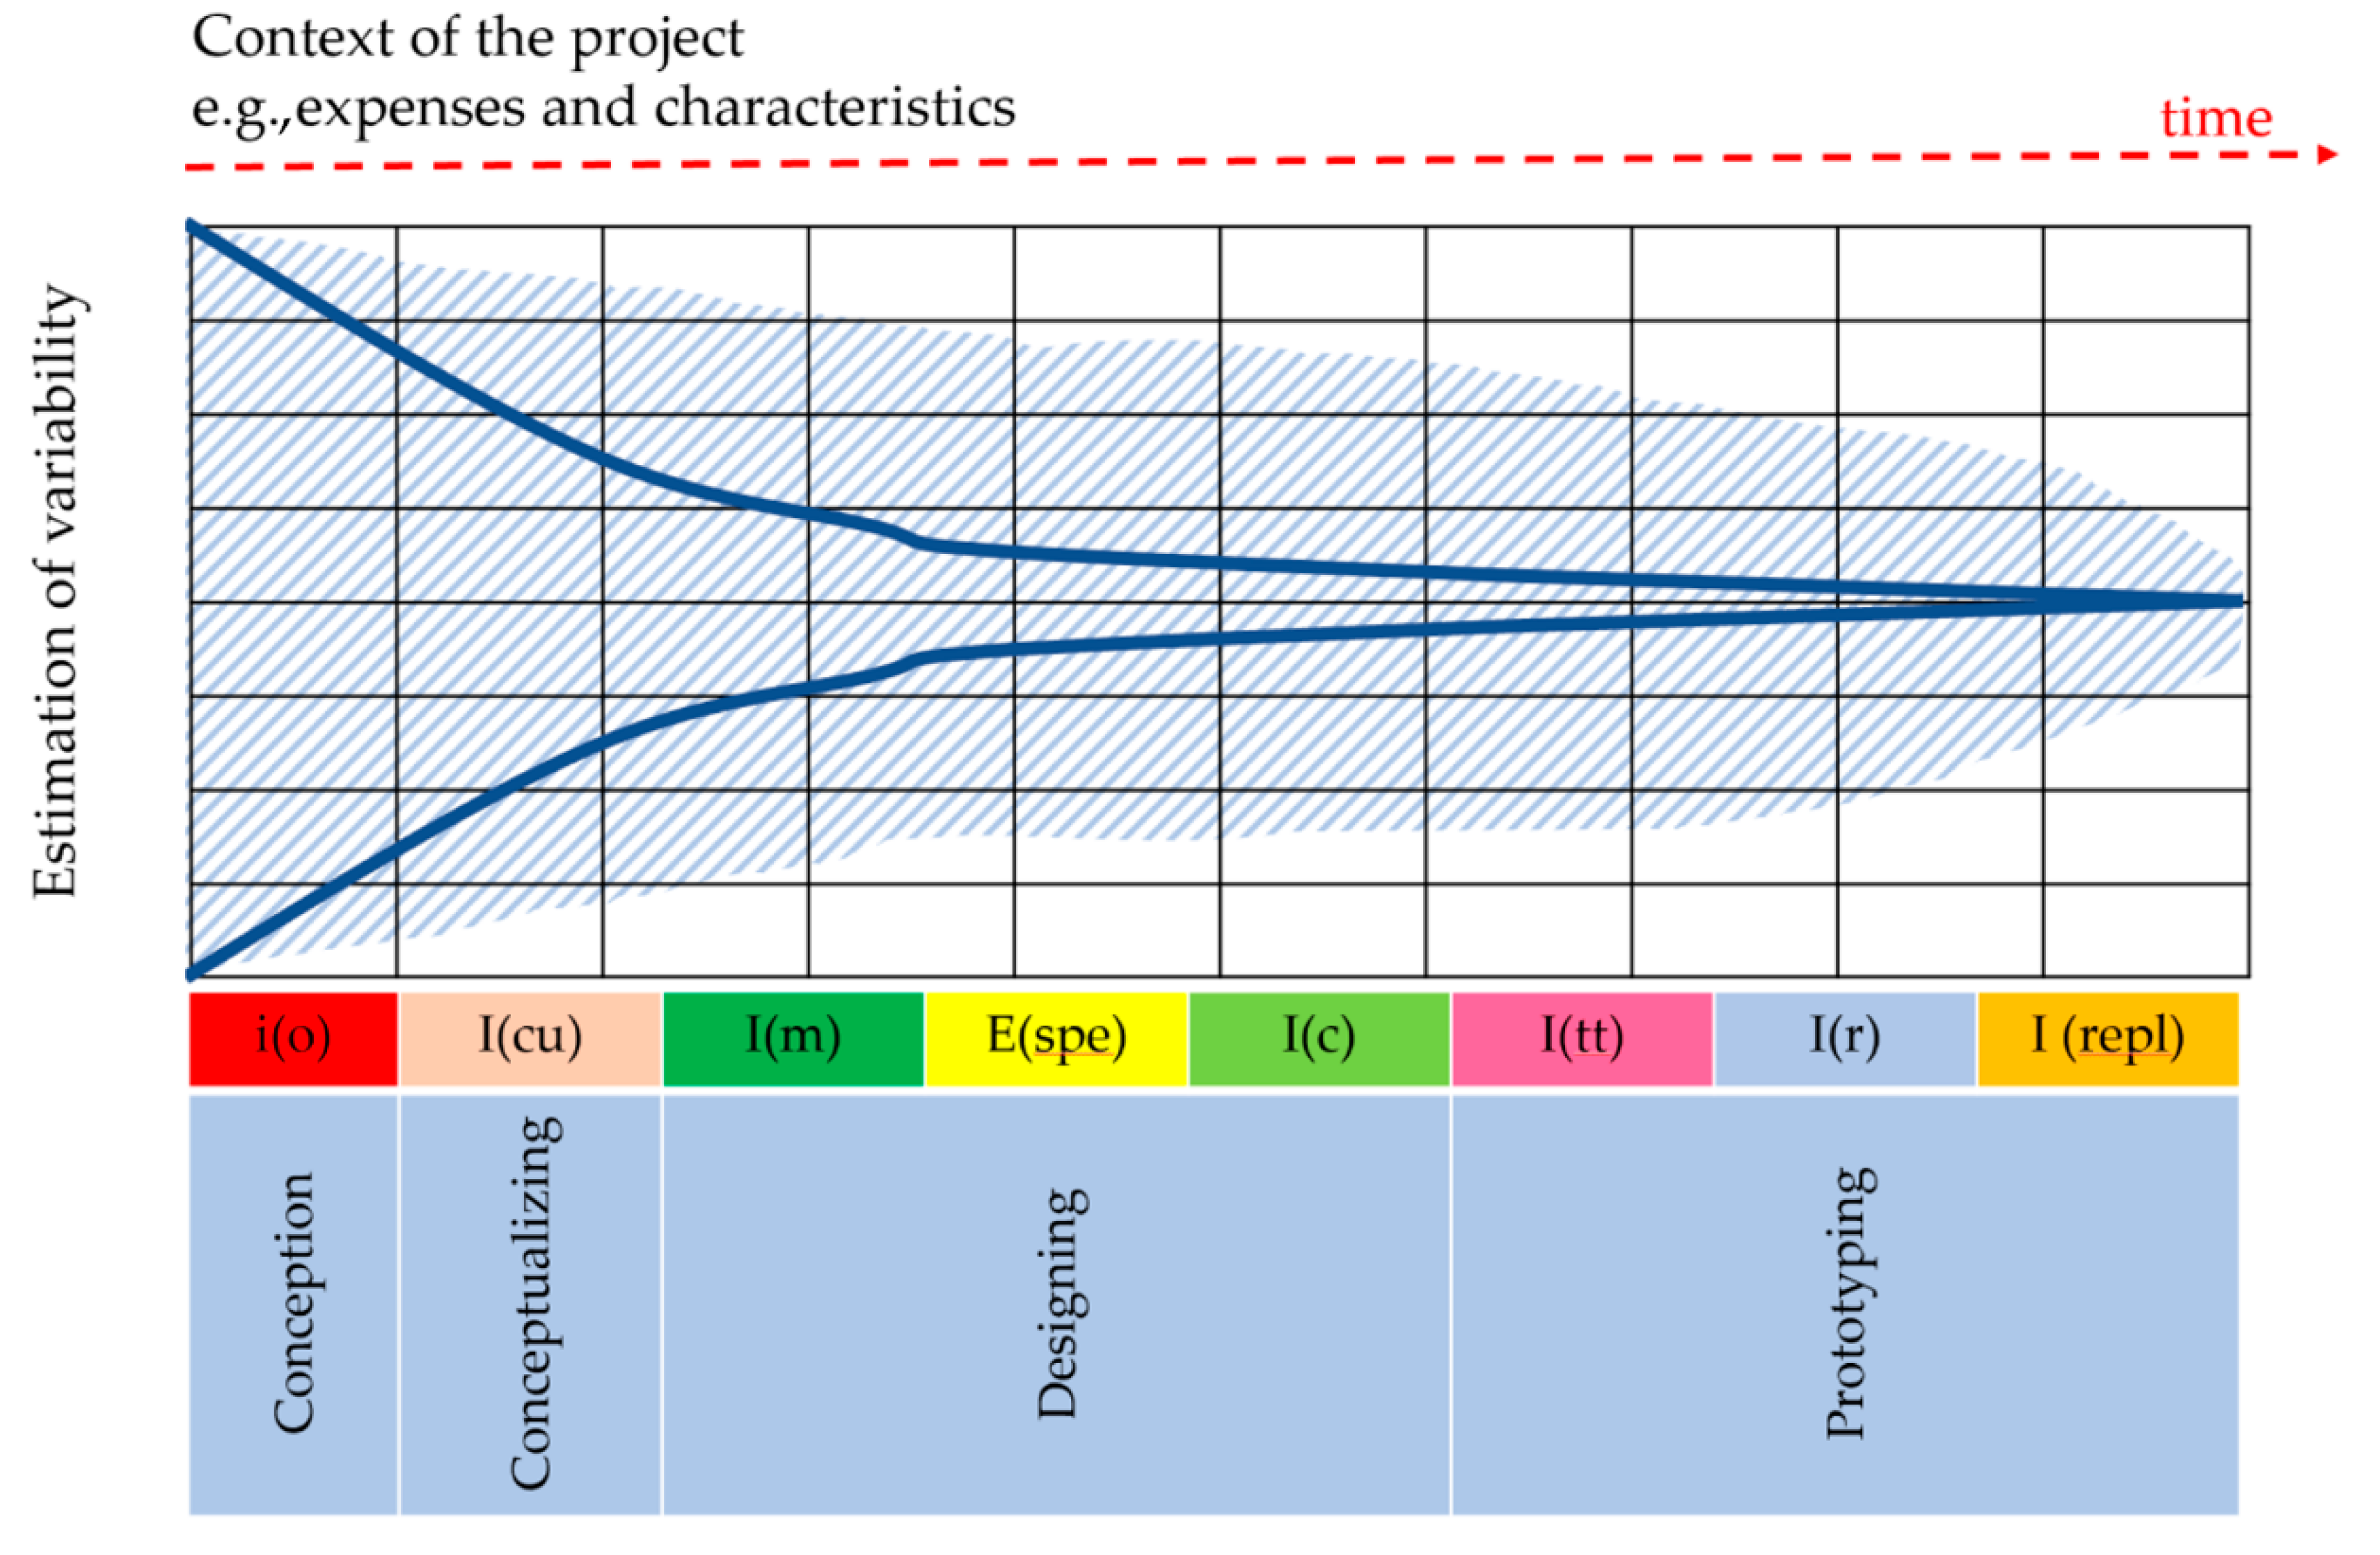
The reduction in uncertainty is reflected in the net sizing and modification of project risks after the end of development (Figure 3 and Table 1). Though the terms are usually used in many ways and contexts, very high specialists in decision making theory, statistics, and other fields have demarcated quantities of uncertainty and risks. Each project has been analyzed in its actions according to a standard and a protocol of analysis of the uncertainty generated by the following relation:
Uncertainty = f(o) × f(cu) × f(m) × f (e spe) × f(c) × f(tt) × f(r) × f(repl)
where:
  • f(o) = uncertainty related to the objectives;
  • f(cu) = uncertainty related to the human and relational components of the firm;
  • f (m) = methodological uncertainty;
  • f (e spe) = uncertainty related to experimental errors;
  • f (c) = cost uncertainty;
  • f(tt) = uncertainty related to technology transfer;
  • f (r) = uncertainty of result;
  • f (replication) = uncertainty in replicability.
It was therefore possible to construct a graph and a cloud of uncertainty, in which the greater the adhesion to the cone, the smaller the uncertainty, vice versa, the greater the cloud is extended, the greater the uncertainty.
The estimated variability results from the degree of uncertainty of the projects processed. The assessment of each level of uncertainty analysis was defined by a set of summary judgments. Following specific descriptors, every keyword was labeled with a degree of uncertainty (Table 2).

5.1. Method of Analysis of the Degree of Novelty of the Project

Research operates in accordance with the methodological approach contained in the Frascati Manual. for the measurement of the degree of creativity and novelty, the present analysis referred to the following principles in the Manual of Frascati [34]: (i) in the business sector, the potential for innovation in R&D projects must be assessed by comparing it with the existing knowledge base in the sector. The R&D activity within the project must lead to new results for businesses that are not already used in this area. Activities aimed at copying, imitating or decoding knowledge are excluded from research and development as they are not new knowledge; and (ii) a research and development project must have as its objective the creation of new ideas that improve state-of-the-art processes, products, and services. With the intention of developing an objective element, for each project in the present analysis, we compared the design idea with the following fields: competitors and similar firms; firms in the sector; technical literature; scientific literature; and firms that deal with technical and scientific issues but are not in the sector.
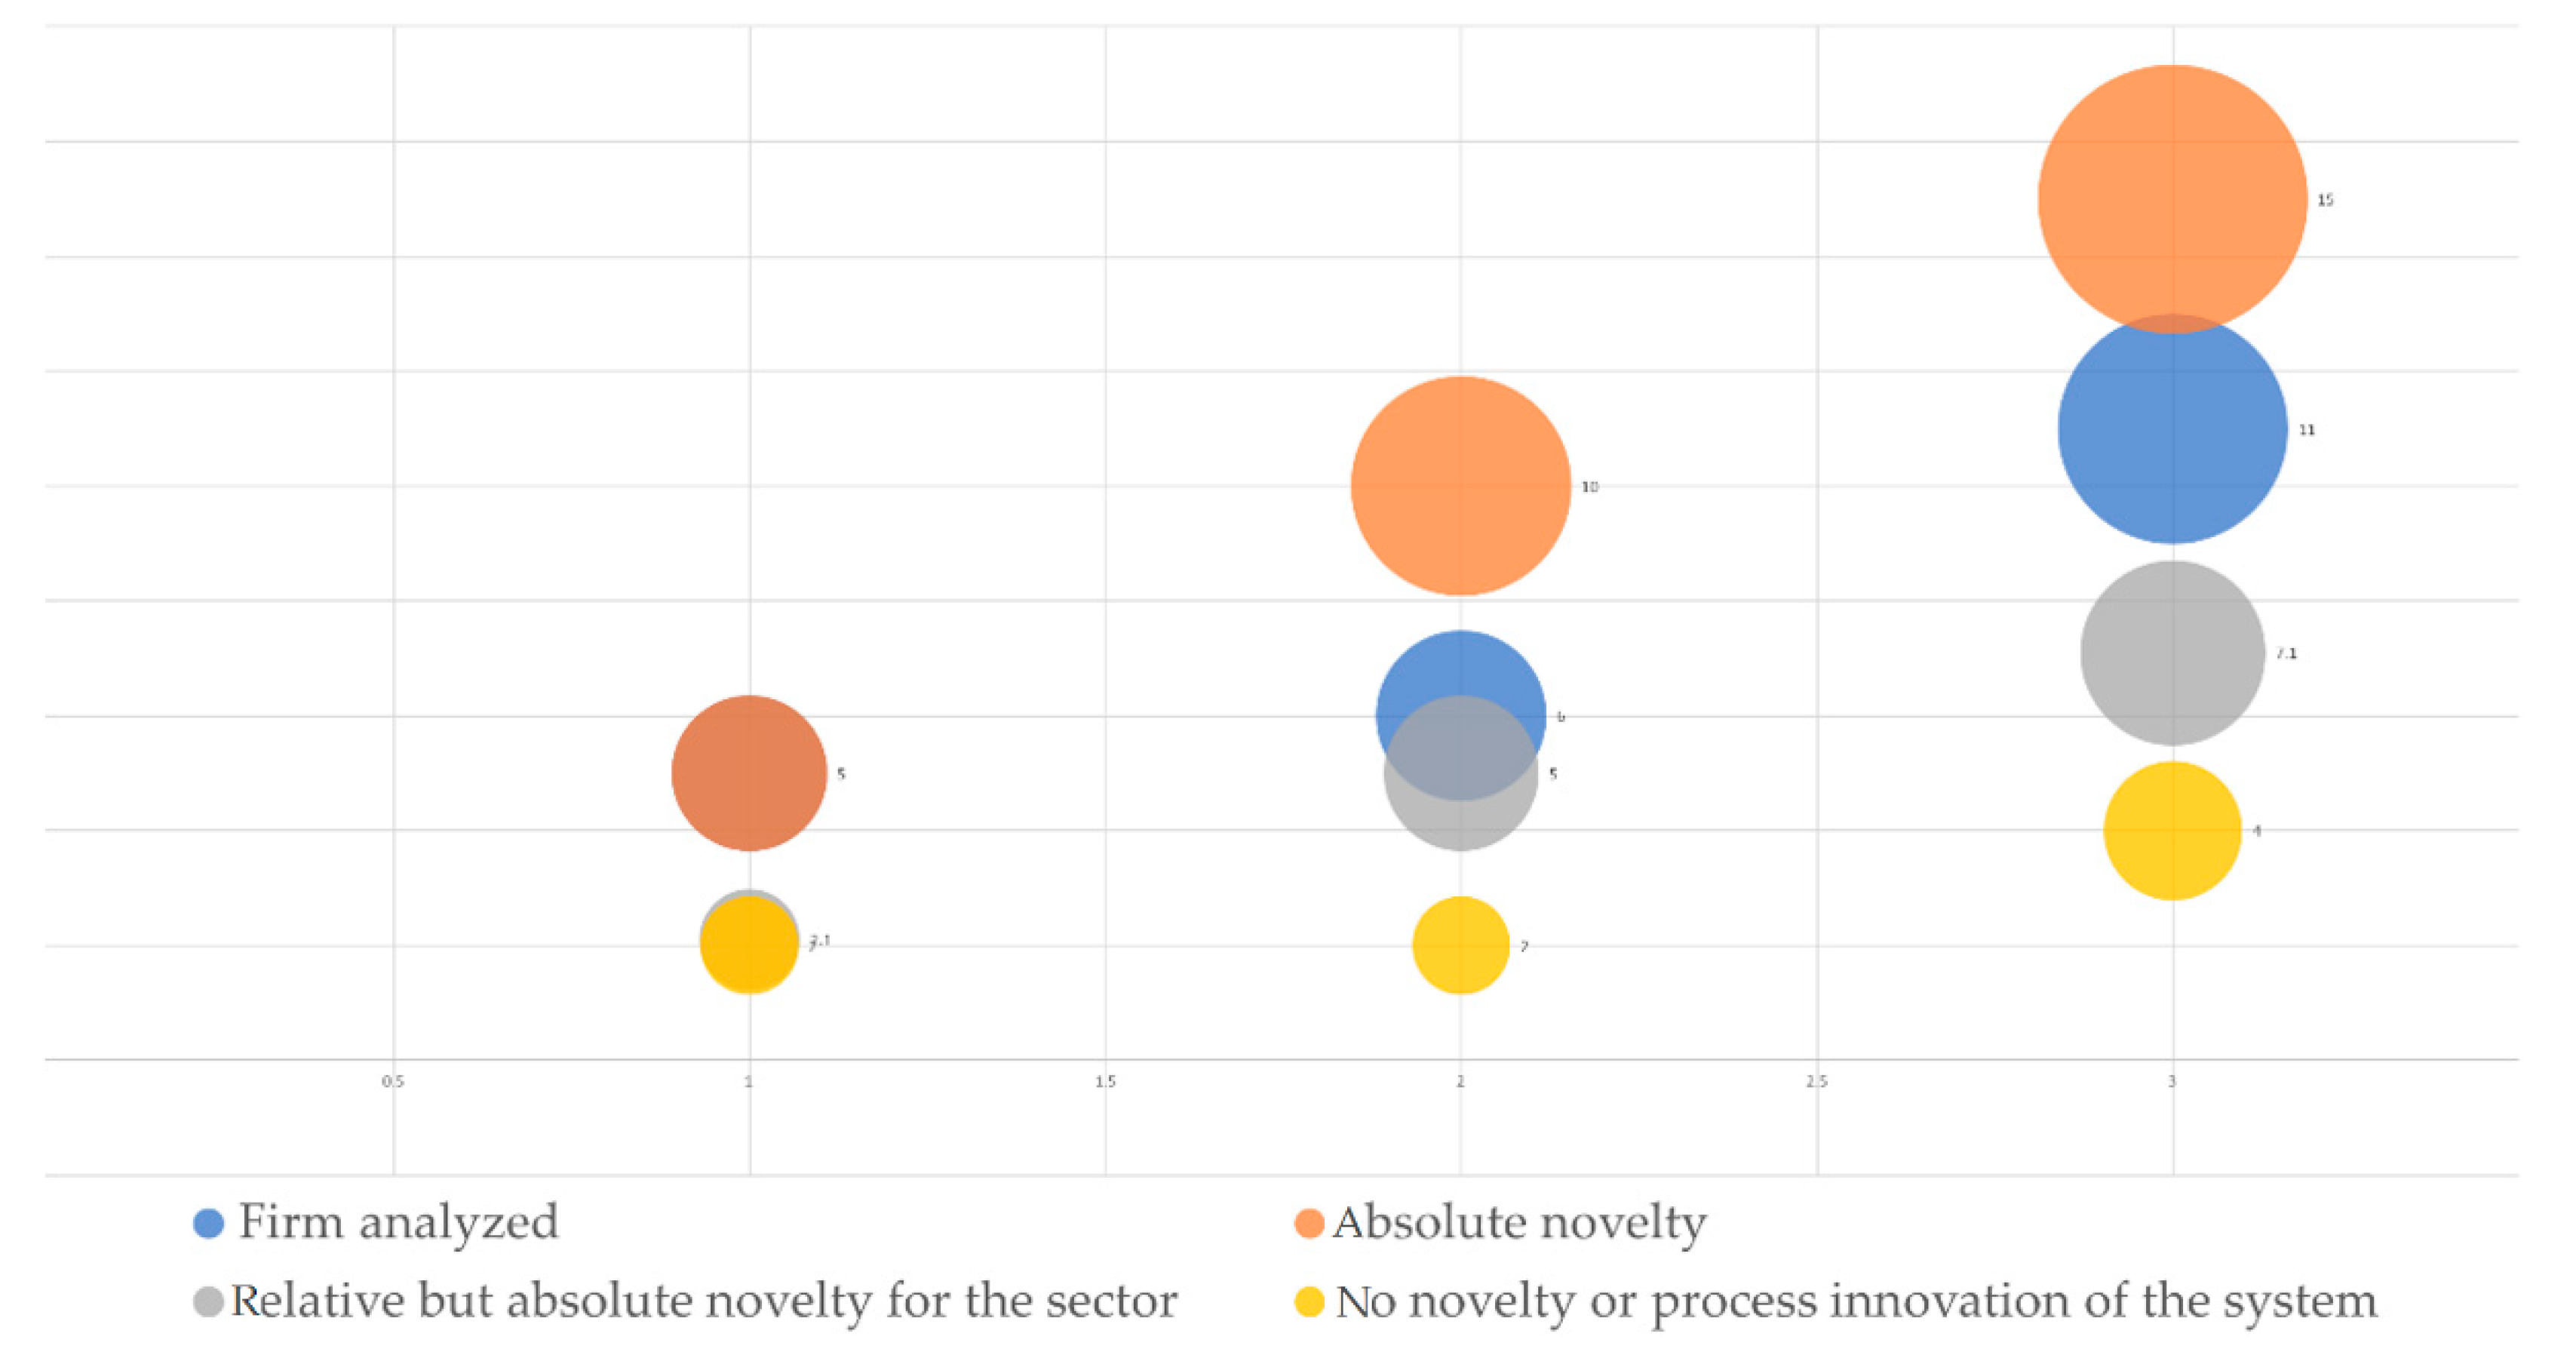
For each comparison, we assigned a score based on the relevance, uniqueness or non-uniqueness of the idea and built a sphere of novelty. As will be seen in the graphs, there were three types of spheres: (i) absolute novelty; (ii) related news; and (iii) not new or non-significant improvements. All projects were analyzed and evaluated, representing both graphically and analytically where:
Innovation factor of projects = f(a) + f(b),
where F(a) determines the sources of innovation research and F(b) determines the degree of innovation with respect to sources, including (i) positive elements (score +2): single elements or not detected; (ii) partial elements (score +1): elements present but original in use; and (iii) negative elements (score 0): known or mature elements used in a non-original way (Figure 4 and Table 3). If no similar cases were found in the sector, an absolute novelty both at the technical and scientific levels was detected. The main elements of innovation are the application of algorithms; ideas based on different logic compared to commercially available products (e.g., use of sensors); innovation in potential calculation; topics not previously explored scientifically; the first model in absolute terms of quantification; and evaluation of systems for rapid reading of scenarios.

5.2. Measuring the Degree of Uncertainty

In the conception phase, the degree of uncertainty was very high, however, it declined over time during the other phases (Figure 5). At the beginning of each phase, the degree of uncertainty rose and then decreased at the termination of each phase of the project. In the end, the overall degree of uncertainty of the projects considered was practically zero, exposing the high quality of the research developed.
As can be seen from the graphic representation, the project was within a very high degree of uncertainty, given the complexity of the scientific and experimental action (Figure 6) [13].
The P factor determines the separation from elements related to production and productivity of the research, the project must be excluded from everything related to production and sales in direct and indirect terms during the entire study. A research and development project should aim to create new innovation ideas. This excludes from R&D any routine modification of products or processes and, therefore, the workers’ concern is on creativity in this field. Consequently, a research and development project requires the contributions of a researcher [34].
  • P > 1: Project unrelated to the production model and only known from research reports;
  • ES: A firm that produces hydraulic elements that wants to study new filtering technologies, with the help of experiments that do not relate in any way to the world of production or the existing market;
  • P < 1: Project directly or indirectly linked to aspects of production;
  • ES: A firm that works on orders, a firm that has already the studied technology in production, a firm that already sells the studied or developed technology;
  • (C): Factor C determines the scientific consistency with the context; the firm must produce research on elements not already present within the range of know-outs and skills of the sector, territory or firm
  • C > 1: Consistent with the scientific and innovation context;
  • ES: The technology or process does not present in territorial, corporate or international competences;
  • C < 1: Inconsistent;
  • ES: New, mature or already widespread technology or process.

5.3. Classification of the Research

The classification of the research detected (i) basic research (RB), which is experimental or theoretic research assumed chiefly to acquire new knowledge about the basics of a phenomena and noticeable facts, deprived of specific requests or potential uses; (ii) applied research, which is an original investigation to acquire new knowledge. However, it is primarily intended for a specific and practical purpose or objective; and (iii) experimental growth through a systematic effort, based on knowledge expanded from research and work experience and the production of supplementary information, intended for constructing new products or processes or enlightening current products or processes [34].

5.3.1. D: Definition of the Search

  • Process (Proc)
  • Product (Prod)
  • Method (Met)
  • Knowledge (With)
  • Model (Mod)
  • Business (Bus)
  • Technician (tec)
  • Organizational (Management)
Research and development can be found in the social sciences, the humanities and the arts, as well as in the natural sciences and engineering [12,13,23,41,59]. The Manual of Frascati [34] places more emphasis on the social sciences and the humanities and the arts than previous editions. This does not require changes in definitions and conventions but requires greater attention to the boundaries that define what is and what is not research and development. In addition, the countries that use this manual are at different stages of economic development and this chapter tries to meet their different needs [34]. This manual follows the convention of the System of National Accounts in which the term “product” refers to a good or service. Throughout the manual, “process” means the transformation of inputs into outputs, and their delivery, or into organizational practices [34].

5.3.2. Novelty

The objective determination of novelty, by parameter (yes) objective determination of novelty, focused on, for example, territory, country, firm versus sector, sector, and international context. Otherwise, the level must be demonstrated in the literature or in technical regulations. In the business sector (the areas of the Frascati are defined in Section 3), the potential novelty of R&D projects must be assessed by comparing it with the existing knowledge base in the sector [34].

5.3.3. Creative

Creativeness, or the determination of a principle or logic that is not present, is not available or not used systematically with a mature technology known within the field of experimentation [34]. Also, in this case, it is possible to determine the creative level with the following:
  • Absolute creativity (completely innovative element);
  • Relative creativity (new and creative elements for a given scenario or application);
  • Comparison creativity (analysis and comparison with respect to comparison, validation or comparison).

5.3.4. Uncertainty Factor

The uncertainty factor is expressed according to different guidelines:
  • (Ir) Uncertainty of the result (not being a mature or normally validated process, the research carried out did not always have a positive result, because it develops, codifies, and carries out new activities and actions both at the firm level and in terms of territory or scenario, and for some research also at the international or global level);
  • (ic) Uncertainty of costs. In this case, being unable to delineate the certainty of a result, it was not always possible to respect the budget assigned to the single activity of research.
  • (im) Uncertainty of methodology. In this case, the experimental process saw the application of either new methodologies or methods applied in contexts never before studied and tested.
Human behavioral uncertainty occurs in organizational models where the specificity of the behavior of one or more subjects involved in the experimentation may lead to the non-achievement of the experiment. Uncertainty in the objective often occurs during the experimental phase or when the study needs to recalibrate the objectives related to the following factors: non-economic sustainability, unattainable target, objective not aligned with time requirements, and objectives varied according to experimental results.

5.3.5. Systematicity

Research and development are formal activities carried out systematically. In this context, “systematic” means that research and development are conducted in a planned manner, with records of both the process followed and the results [34]. In order to make every study systemic and systematic, the development model in synergy with the firm defines and traces the methodology applied within the study or experimentation.

5.3.6. Replicability

An R&D project should enable the transfer of new ideas and information to ensure its use and to enable other researchers to reproduce the results in their research and development activities. This also includes research and development that has produced negative results where an initial hypothesis is not confirmed or where a product cannot be developed as originally intended. As the aim of research and development is to increase the existing knowledge base, results cannot remain silent (i.e., remain in the minds of researchers alone), as they, and the associated knowledge, would be at risk of being lost. The codification of knowledge and its dissemination is standard practice in universities and research institutes, although there may be restrictions on knowledge arising from contract work or collaboration. Again, there may be multiple levels of disclosure within the trial:
  • Intra-firm closed (strategic project for the firm that is shared and disclosed only at certain levels);
  • Intra-firm open (project disclosed to firm personnel from all sectors);
  • Extra-firm market (project disclosed to other firms or customers);
  • Extra-firm tc (project disseminated on channels of a technical or sectoral nature);
  • Info science (project disseminated at the level of non-reported scientific journals);
  • Info top science (project published in whole or in part in peer-reviewed scientific journals).

5.4. Classification of the Research as a Function of the Methods Carried Out and of the Reading of the Results

The following are the keys to understanding the tools developed within the project. These tools are in fact innovative, fall within the logic of the Manual of Frascati, and are an integral part of the experimentation carried out. The main fields of action on which the experimentation was carried out are defined, as well as the relative spheres of reference for the individual documents drawn up. The function of the project is represented by the variables:
F (Industry 4.0) = f(sic) × f(gest) × f(dida) × f(sani) × f(pry)
where:
  • F: sic (occupational safety aspects);
  • F: gest (event management aspects);
  • F: dida (didactic aspects);
  • F: sani (aspects of sanitation, hygiene, and management of the drink),
  • F: aspects of the pry (elements of privacy);
Each logical function was developed on different target levels:
  • DLI: employer/entrepreneur;
  • Op: operator;
  • UV: visitor user;
  • Ter: another firm or another user;
  • Didr: teaching operator.
For each type of study area, the following documents were produced, which are briefly described below. The annexes are the tools to enable the firm to develop an advanced model of open cellar and are the guides for the individual figures involved in the visit to the firm.
The project produced the following tools to replicate the design logic as required by the regulations and the tax credit, e.g., articles that analyze the phenomenon of open cellars, specific manuals covering the operational tools, and specific teaching modules (Table 4).

5.5. Systematic Nature of the Research Project

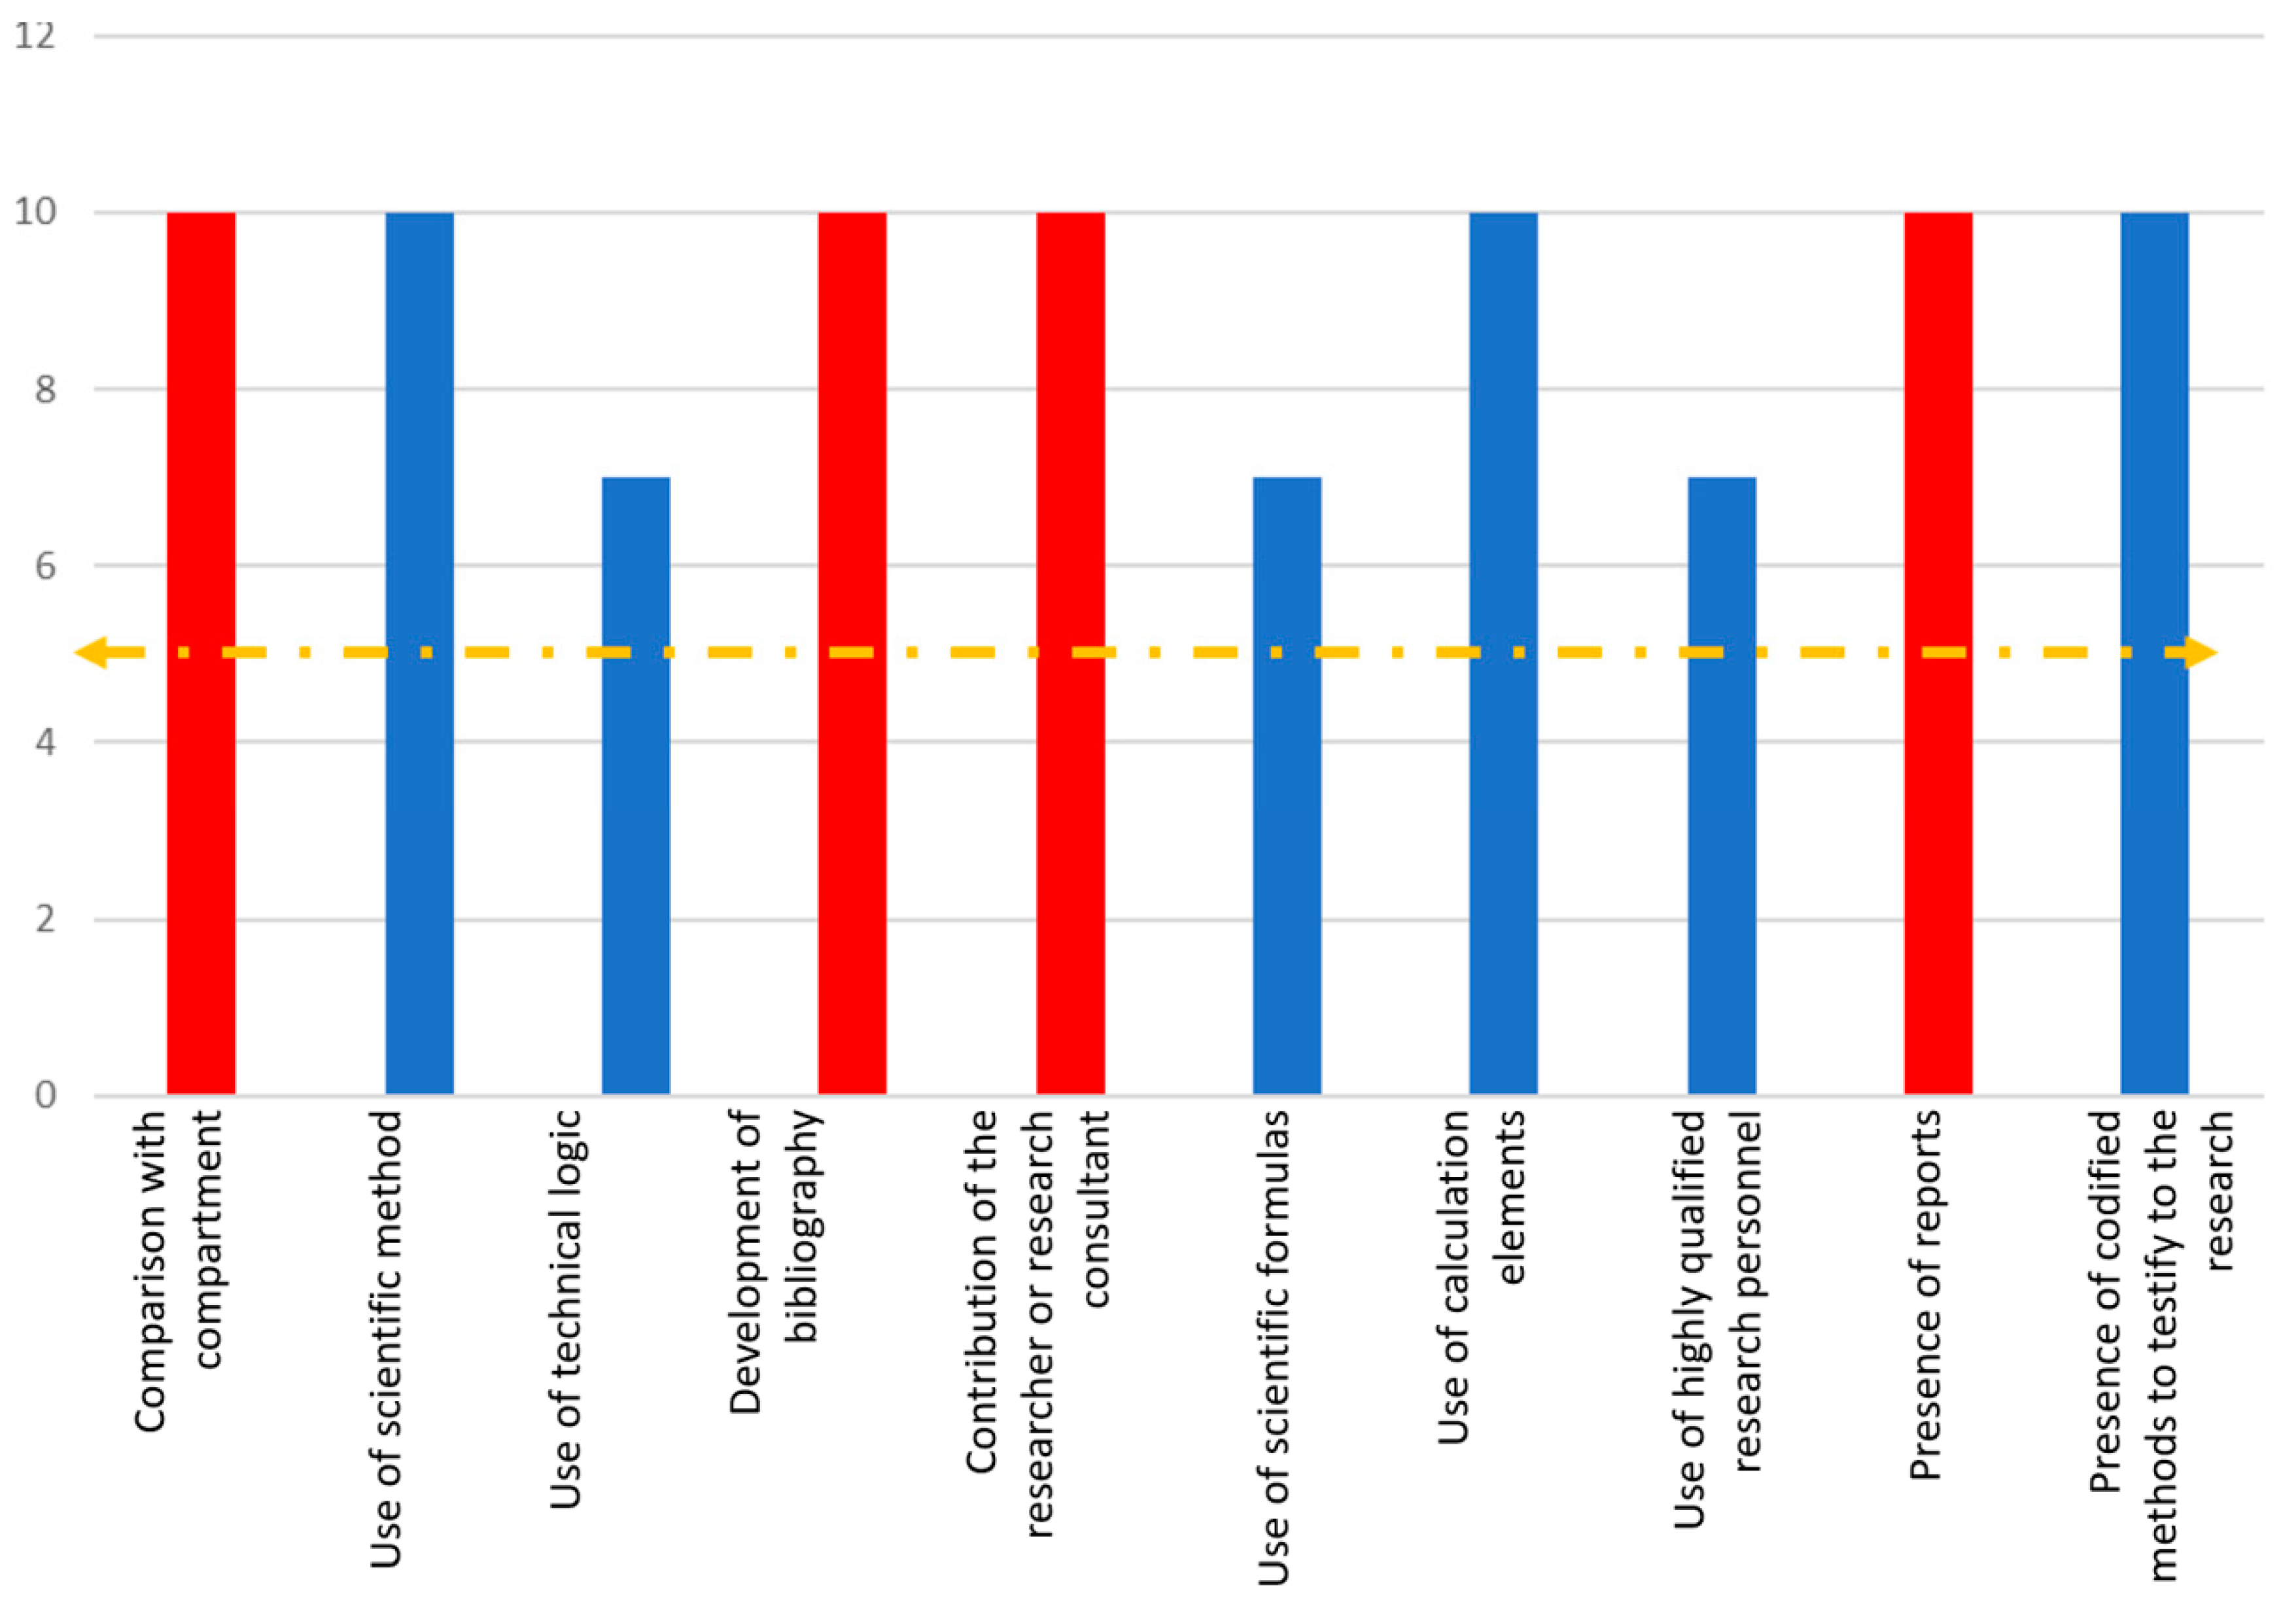
Research and development are formal activities carried out systematically. In this context, “systematic” is a research and development process, which is conducted via a strategic method, with records of both the process followed and the results. To verify this, it is necessary to identify the purpose of the R&D project and the sources of funding for the R&D activities carried out. The availability of such records is consistent with a research and development project aimed at meeting specific needs and with its own workers and financial resources. Although the management and reporting structure described above are more easily found in larger projects, it may also apply to small-scale activities where it would be sufficient to have one or more employees or consultants (provided a researcher has been included) to produce solutions to a requirement (Figure 7).

6. Discussion

By means of the five criteria of the Manual of Frascati (i.e., novelty, originality, uncertainty, orderliness, and reproducibility), the aim of the present work was to define uncertainty as a cloud. Through a cloud, a cone of uncertainty was defined following an approach based on project management derived from a matrix. The cloud is a scientific method [37,38,39,40,41]. The evaluation grid is characterized by the decomposition of the different variables (e.g., technology [1,17,34,45,47,51,55]) divided into quartiles, which allows for the detection of the evolution of the project for each of its components and for the outline of an evaluation grid. The line moves according to the progressive degrees of uncertainty. The curve was divided into many units that defined the temporal development of the project and each of those were given parameters. A project was more certain if it was graphically located within the blue band of the cloud. From this, it emerged that the more multiplicities there were, the more uncertain the project; the newer the method, the more uncertain it was; the more known the statistical error, the less uncertain the project itself. Even though a little literature has already drawn a cloud of uncertainty [37,38,39,40,41], the originality of the present work is the formulation of a mathematical formula with the intention of perceiving the degree of uncertainty of a project.
Secondly, novelty was evaluated using bubbles with four references: competitor firms, technical firm, scientific firm, and firms from other sectors that have developed the same idea. A comparison was made by identifying the sources and the state-of-the-art processes, products, and services. With a higher number of sources, the novelty score was higher; by assigning points, novelty was capable of being represented in a bubble graph, which organized the bubbles into three columns, with an objective parameter which allowed for the analysis of a project.
The third level dealt with orderliness. Through a bar graph, the activities carried out (e.g., working with a researcher, a scientific method or using calculations) helped define both the basic and accessory parameters. Replicability, on the other hand, was a pyramid: if the project is disseminated (e.g., through a scientific article), the pyramid grows since the project has a greater chance of effective replicability. Otherwise, if the project remains within the firm, the pyramid is small since it is less replicable in other business contexts. Finally, creativity was not measured, as it is something intrinsic [77,78,79,80,81,82,83,84,85]. However, the more innovation is shared, the more extensive the greater exponentiality of creativity. Therefore, an exponential was formed according to creativity.
Academic research can benefit from the approach use of measure uncertainty for R&D activities to get a better understanding of the potential use of Industry 4.0 [5,7,9,17,21,22,56,86,87,88,89]. The present work explored the degree of uncertainty that emerged during the R&D activities carried out by a set of Italian firms, mainly related to the manufacturing industry [9]. The firms considered the National Enterprise Plan 4.0 in Italy as a positive strategy mostly due to the available tax credits. The data collection was conducted over two years (2016–2018), in which 190 projects were analyzed. The analysis was carried out at two levels: (i) direct surveys with the entrepreneur and the internal research team, the projects always being of a corporate nature and related to industrial development; and (ii) a technical analysis of the documentation supporting the project idea. The two analysis thresholds were consequently the starting point for the creation of the positioning grid from which the uncertainty graph was produced. Furthermore, the methodological approach had a dual practical and operational value, either within a project team or an external evaluator. In fact, thanks to the evaluation of the ex-ante project, it was conceivable to determine the level of risk of the project right from the start, defining in practice, if necessary: (i) alternative solutions and (ii) reserve budgets in the event that the uncertainty factor is extremely high.

7. Conclusions

In this study, we aimed to create a draft of a potential methodology that supports firms in their realization of R&D projects, as defined by the Frascati Manual and the concepts of Industry 4.0.
Uncertainty is a situation in which the viewer of any phenomena, in every place and time, is not able—with comprehensive certainty—to describe the additional course of this phenomenon [11,56]. Numerous elements can affect the uncertainty of Industry 4.0, both in terms of chances and pressures [56]. Owing to the novelty of the matter and the great complication of the phenomenon of Industry 4.0, the main consequence is to reduce the degree of uncertainty during the R&D investigations with the intention of minimizing the potential undesirable effects happening in Industry 4.0 [7,56]. Uncertainty as a cognitive class manifests itself in a lack of information essential to make decisions and the inability to forecast the effects of decisions and to evaluate the influence of events happening in a specific situation [59]. The multidimensional nature of the uncertainty and the purpose of its complexity and dynamic changes, should be observed from diverse standpoints [56]. Uncertainty is an independent measure which relates to the detached risks and concerns that are problematic or impossible to estimate [63]. When the probability of certain events is quantifiable, then one should talk about the risks, as there is uncertainty in the strict sense [60]. There are several examples of methods to overcome the uncertainty in Industry 4.0 in the literature [58,77,78,79], such as mastering complex systems for suitable simulation and optimization models and software. The main concepts for overcoming uncertainty are rooted in guaranteeing data security—development of new systems that are safe from cyber-attacks [48,49]. Moreover, we can identify distinct systems that are potentially related to Industry 4.0 and its surroundings due to the fact of their importance and probability of occurrence. Industry 4.0 must be understood as a priority for Europe by administrations and policy makers, who must advocate and create an “infrastructure” for promoting entrepreneurship [17,47,51,72].

Author Contributions

Conceptualization, A.C. and S.C.; methodology, S.C. and A.C.; software, A.C and S.C.; validation, I.Z. and G.E.; formal analysis, S.C., G.E., I.Z. and A.C.; investigation, S.C. and A.C.; data curation, S.C.; writing—original draft preparation, S.C., I.Z. and A.C.; supervision, A.C.

Funding

This research received no external funding.

Conflicts of Interest

The authors declare no conflict of interest.

References

  1. Bollinger, L.; Hope, K.; Utterback, J.M. A review of literature and hypotheses on new technology-based firms. Res. Policy 1983, 12, 1–14. [Google Scholar] [CrossRef]
  2. Brown, S.L.; Eisenhardt, K.M. Product development: Past research, present findings, and future directions. Acad. Manag. Rev. 1995, 20, 343–378. [Google Scholar] [CrossRef]
  3. Calantone, R.J.; Cavusgil, S.T.; Zhao, Y. Learning orientation, firm innovation capability, and firm performance. Ind. Mark. Manag. 2002, 31, 515–524. [Google Scholar] [CrossRef]
  4. Granstrand, O. Towards a theory of the technology-based firm. Res. Policy 1998, 27, 465–489. [Google Scholar] [CrossRef]
  5. Homburg, C.; Alavi, S.; Rajab, T.; Wieseke, J. The contingent roles of R&D-sales versus R&D-marketing cooperation in new-product development of business-to-business firms. Int. J. Res. Mark. 2017, 34, 212–230. [Google Scholar]
  6. Salunke, S.; Weerawardena, J.; McColl-Kennedy, J.R. The central role of knowledge integration capability in service innovation-based competitive strategy. Ind. Mark. Manag. 2019, 76, 144–156. [Google Scholar] [CrossRef]
  7. Sirilli, G. Ricerca e Sviluppo. Il Futuro del Nostro Paese: Numeri, Sfide, Politiche; Il Mulino: Bologna, Italy, 2005. [Google Scholar]
  8. Wales, W.J. Entrepreneurial orientation: A review and synthesis of promising research directions. Int. Small Bus. J. 2016, 34, 3–15. [Google Scholar] [CrossRef]
  9. Klomp, L. Measuring output from R&D activities and innovation statistics. In Proceedings of the ISI 53 Conference, Seoul, Korea, 22–29 August 2001. [Google Scholar]
  10. Lynn, G.S.; Akgün, A.E. Innovation strategies under uncertainty: A contingency approach for new product development. Eng. Manag. J. 1998, 10, 11–18. [Google Scholar] [CrossRef]
  11. Thanos, C. Research data reusability: Conceptual foundations, barriers and enabling technologies. Publications 2017, 5, 2. [Google Scholar] [CrossRef]
  12. Kline, S.J.; Rosenberg, N. Studies on Science and The Innovation Process: Selected Works of Nathan Rosenberg; World Scientific Publishing Co Pte Ltd.: Washington, DC, USA, 2010; An overview of innovation; pp. 173–203. [Google Scholar]
  13. Moffat, R.J. Describing the uncertainties in experimental results. Exp. Therm. Fluid Sci. 1988, 1, 3–17. [Google Scholar] [CrossRef] [Green Version]
  14. Uusitalo, L.; Lehikoinen, A.; Helle, I.; Myrberg, K. An overview of methods to evaluate uncertainty of deterministic models in decision support. Environ. Model. Softw. 2015, 63, 24–31. [Google Scholar] [CrossRef] [Green Version]
  15. White, G.H. Basics of estimating measurement uncertainty. Clin. Biochem. Rev. 2008, 29, S53. [Google Scholar] [PubMed]
  16. Caloffi, A.; Bellandi, M. Enterprise and innovation policy in Italy: An overview of the recent facts. Rev. d’écon. Ind. 2017, 2, 129–141. [Google Scholar]
  17. Muscio, A.; Ciffolilli, A. What drives the capacity to integrate Industry 4.0 technologies? Evidence from European R&D projects. Econ. Innov. New Technol. 2019, 1–15. [Google Scholar] [CrossRef]
  18. Pervaiz, K.; Zairi, M. Benchmarking for brand innovation. Eur. J. Innov. Manag. 1999, 2, 36–48. [Google Scholar]
  19. Read, A. Determinants of successful organizational innovation: A review of current research. J. Manag. Prac. 2000, 3, 95–119. [Google Scholar]
  20. Baker, S.R.; Bloom, N.; Davis, S.J. Measuring economic policy uncertainty. Q. J. Econ. 2016, 131, 1593–1636. [Google Scholar] [CrossRef]
  21. Kerssens-van Drongelen, I.; Nixon, B.; Pearson, A. Performance measurement in industrial R&D. Int. J. Manag. Rev. 2000, 2, 111–143. [Google Scholar]
  22. Mohanty, R.P.; Agarwal, R.; Choudhury, A.K.; Tiwari, M.K. A fuzzy ANP-based approach to R&D project selection: A case study. Int. J. Prod. Res. 2005, 43, 5199–5216. [Google Scholar]
  23. Pich, M.T.; Loch, C.H.; Meyer, A.D. On uncertainty, ambiguity, and complexity in project management. Manag. Sci. 2002, 48, 1008–1023. [Google Scholar] [CrossRef]
  24. Skeffington, R.A. Quantifying uncertainty in critical loads:(A) literature review. Water Air Soil Pollut. 2006, 169, 3–24. [Google Scholar] [CrossRef]
  25. Gao, J.; Gao, X. A new stock model for credibilistic option pricing. J. Uncertain Syst. 2008, 2, 243–247. [Google Scholar]
  26. Li, X.; Liu, B. Hybrid logic and uncertain logic. J. Uncertain Syst. 2009, 3, 83–94. [Google Scholar]
  27. Li, X.; Liu, B. Maximum entropy principle for fuzzy variables. Int. J. Uncertain. Fuzziness Knowl.-Based Syst. 2007, 15, 43–52. [Google Scholar] [CrossRef]
  28. Liu, B. Fuzzy process, hybrid process and uncertain process. J. Uncertain Syst. 2008, 2, 3–16. [Google Scholar]
  29. Peng, J. A general stock model for fuzzy markets. J. Uncertain Syst. 2008, 2, 248–254. [Google Scholar]
  30. Refsgaard, J.C.; Van der Sluijs, J.P.; Højberg, A.L.; Vanrolleghem, P.A. Uncertainty in the environmental modelling process-a framework and guidance. Environ. Model. Softw. 2007, 22, 1543–1556. [Google Scholar] [CrossRef]
  31. Colyvan, M. Is probability the only coherent approach to uncertainty? Risk Anal. Int. J. 2008, 28, 645–652. [Google Scholar] [CrossRef]
  32. Nilsen, T.; Aven, T. Models and model uncertainty in the context of risk analysis. Reliab. Eng. Syst. Saf. 2003, 79, 309–317. [Google Scholar] [CrossRef]
  33. Walker, W.E.; Harremoës, P.; Rotmans, J.; Van Der Sluijs, J.P.; Van Asselt, M.B.; Janssen, P.; Krayer von Krauss, M.P. Defining uncertainty: A conceptual basis for uncertainty management in model-based decision support. Integr. Assess. 2003, 4, 5–17. [Google Scholar] [CrossRef]
  34. OCSE Frascati Manual 2015. Guidelines for Collecting and Reporting Data on Research and Experimental Development, The Measurement of Scientific, Technological and Innovation Activities; OECD Publishing: Paris, France, 2015. [Google Scholar] [CrossRef]
  35. Robbins, C. Linking Frascati-based R&D spending to the System of National Accounts: An application to US data. In Proceedings of the Group on Measurement of Non-Financial Assets, Canberra, Australia, 29 March–1 April 2005. [Google Scholar]
  36. Esposti, R.; Pierani, P. Building the knowledge stock: Lags, depreciation, and uncertainty in R&D investment and link with productivity growth. J. Product. Anal. 2003, 19, 33–58. [Google Scholar]
  37. Dari-Mattiacci, G.; Deffains, B. Uncertainty of law and the legal process. JITE 2007, 163, 627–656. [Google Scholar] [CrossRef]
  38. Klinke, A.; Renn, O. Systemic risks as challenge for policy making in risk governance. Forum Qual. Soz. Forum Qual. Soc. Res. 2006, 7. [Google Scholar]
  39. Nishizawa, M.; Renn, O. Responding public demand for assurance of genetically modified crops: Case from Japan. J. Risk Res. 2006, 9, 41–56. [Google Scholar] [CrossRef]
  40. Weiss, C. Communicating uncertainty in intelligence and other professions. Int. J. Intell. Count. Intell. 2008, 21, 57–85. [Google Scholar] [CrossRef]
  41. Wolpert, D.M.; Ghahramani, Z. Computational principles of movement neuroscience. Nat. Neurosci. 2000, 3, 1212. [Google Scholar] [CrossRef]
  42. Barreto, L.; Amaral, A.; Pereira, T. Industry 4.0 implications in logistics: An overview. Procedia Manuf. 2017, 13, 1245–1252. [Google Scholar] [CrossRef]
  43. Buer, S.V.; Strandhagen, J.O.; Chan, F.T. The link between Industry 4.0 and lean manufacturing: Mapping current research and establishing a research agenda. Int. J. Prod. Res. 2018, 56, 2924–2940. [Google Scholar] [CrossRef]
  44. Erol, S.; Jäger, A.; Hold, P.; Ott, K.; Sihn, W. Tangible Industry 4.0: A scenario-based approach to learning for the future of production. Procedia CiRp 2016, 54, 13–18. [Google Scholar] [CrossRef]
  45. Ghobakhloo, M. The future of manufacturing industry: A strategic roadmap toward Industry 4.0. J. Manuf. Technol. Manag. 2018, 29, 910–936. [Google Scholar] [CrossRef]
  46. Xu, L.D.; Xu, E.L.; Li, L. Industry 4.0: State of the art and future trends. Int. J. Prod. Res. 2018, 56, 2941–2962. [Google Scholar] [CrossRef]
  47. Rossini, M.; Costa, F.; Tortorella, G.L.; Portioli-Staudacher, A. The interrelation between Industry 4.0 and lean production: An empirical study on European manufacturers. Int. J. Adv. Manuf. Technol. 2019, 102, 3963–3976. [Google Scholar] [CrossRef]
  48. Zambon, I.; Cecchini, M.; Egidi, G.; Saporito, M.G.; Colantoni, A. Revolution 4.0: Industry vs. agriculture in a future development for SMEs. Processes 2019, 7, 36. [Google Scholar] [CrossRef]
  49. Zambon, I.; Egidi, G.; Rinaldi, F.; Cividino, S. Applied Research Towards Industry 4.0: Opportunities for SMEs. Processes 2019. [Google Scholar] [CrossRef]
  50. Bortolini, M.; Ferrari, E.; Gamberi, M.; Pilati, F.; Faccio, M. Assembly system design in the Industry 4.0 era: A general framework. IFAC-Pap. OnLine 2017, 50, 5700–5705. [Google Scholar] [CrossRef]
  51. Ciffolilli, A.; Muscio, A. Industry 4.0: National and regional comparative advantages in key enabling technologies. Eur. Plan. Stud. 2018, 26, 2323–2343. [Google Scholar] [CrossRef]
  52. Galati, F.; Bigliardi, B. Industry 4.0: Emerging themes and future research avenues using a text mining approach. Comput. Ind. 2019, 109, 100–113. [Google Scholar] [CrossRef]
  53. Piccarozzi, M.; Aquilani, B.; Gatti, C. Industry 4.0 in management studies: A systematic literature review. Sustainability 2018, 10, 3821. [Google Scholar] [CrossRef]
  54. Lezzi, M.; Lazoi, M.; Corallo, A. Cybersecurity for Industry 4.0 in the current literature: A reference framework. Comput. Ind. 2018, 103, 97–110. [Google Scholar] [CrossRef]
  55. Lucchese, M.; Nascia, L.; Pianta, M. Industrial policy and technology in Italy. Econ. Politica Ind. 2016, 43, 233–260. [Google Scholar] [CrossRef]
  56. Magruk, A. Uncertainty in the sphere of the industry 4.0-potential areas to research. Bus. Manag. Educ. 2016, 14, 275–291. [Google Scholar] [CrossRef]
  57. Lee, J.; Kao, H.A.; Yang, S. Service innovation and smart analytics for industry 4.0 and big data environment. Procedia CIRP 2014, 16, 3–8. [Google Scholar] [CrossRef]
  58. Ślązak, Ł. Integracjaobrabiarek z systemamiinformatycznymiprzedsiębiorstw w aspekciekon- cepcjiprzemysł 4.0. Mechanik 2015, 3, 246–252. [Google Scholar]
  59. Jędralska, K.; Czech, A. O naturzeniepewności i jejinterpretacjach. Master Bus. Adm. 2011, 3, 9–18. [Google Scholar]
  60. Mosterman, P.J.; Zander, J. Industry 4.0 as a cyber-physical system study. Softw. Syst. Modeling 2016, 15, 17–29. [Google Scholar]
  61. Schumacher, A.; Erol, S.; Sihn, W. A maturity model for assessing Industry 4.0 readiness and maturity of manufacturing enterprises. Procedia Cirp 2016, 52, 161–166. [Google Scholar] [CrossRef]
  62. Pan, M.; Sikorski, J.; Kastner, C.A.; Akroyd, J.; Mosbach, S.; Lau, R.; Kraft, M. Applying industry 4.0 to the Jurong Island eco-industrial park. Energy Procedia 2015, 75, 1536–1541. [Google Scholar] [CrossRef]
  63. Sittón, I.; Rodríguez, S. Pattern extraction for the design of predictive models in industry 4.0. In Trends in Cyber-Physical Multi-Agent Systems. The PAAMS Collection-15th International Conference, PAAMS 2017. Advances in Intelligent Systems and Computing. Volume 619; Springer International Publishing: Cham, Switzerland, 2017; pp. 258–261. [Google Scholar]
  64. Oesterreich, T.D.; Teuteberg, F. Understanding the implications of digitisation and automation in the context of Industry 4.0: A triangulation approach and elements of a research agenda for the construction industry. Comput. Ind. 2016, 83, 121–139. [Google Scholar] [CrossRef]
  65. Wittenberg, C. Human-CPS Interaction-requirements and human-machine interaction methods for the Industry 4.0. IFAC-PapersOnLine 2016, 49, 420–425. [Google Scholar] [CrossRef]
  66. Lu, Y. Industry 4.0: A survey on technologies, applications and open research issues. J. Ind. Inf. Integr. 2017, 6, 1–10. [Google Scholar] [CrossRef]
  67. Penas, O.; Plateaux, R.; Patalano, S.; Hammadi, M. Multi-scale approach from mechatronic to Cyber-Physical Systems for the design of manufacturing systems. Comput. Ind. 2017, 86, 52–69. [Google Scholar] [CrossRef]
  68. Fernández-Caramés, T.; Fraga-Lamas, P.; Suárez-Albela, M.; Vilar-Montesinos, M. A fog computing and cloudlet based augmented reality system for the industry 4.0 shipyard. Sensors 2018, 18, 1798. [Google Scholar] [CrossRef] [PubMed]
  69. Wawiernia, A. Taksonomianiepewności. Zarządzanie Finans. 2013, 11, 445–454. [Google Scholar]
  70. Alleman, G.; Coonce, T.; Price, R. Increasing the Probability of Program Success with Continuous Risk Management. Meas. News 2018, 27. [Google Scholar]
  71. Bartodziej, C.J. The Concept Industry 4.0; Springer Gabler: Wiesbaden, Germany, 2017; pp. 27–50. [Google Scholar]
  72. Balta-Ozkan, N.; Boteler, B.; Amerighi, O. European smart home market development: Public views on technical and economic aspects across the United Kingdom, Germany and Italy. Energy Res. Soc. Sci. 2014, 3, 65–77. [Google Scholar] [CrossRef]
  73. Enkel, E.; Gassmann, O.; Chesbrough, H. Open R&D and open innovation: Exploring the phenomenon. R&D Manag. 2009, 39, 311–316. [Google Scholar]
  74. Talbot, S.; Lefebvre, E.; Lefebvre, L.A. Closed-loop supply chain activities and derived benefits in manufacturing SMEs. J. Manuf. Technol. Manag. 2007, 18, 627–658. [Google Scholar] [CrossRef]
  75. Schneider, J. Making space for the “nuances of truth”: Communication and uncertainty at an environmental journalist’ workshop. Sci. Commun. 2010, 32, 171–201. [Google Scholar] [CrossRef]
  76. Janasz, K. Ryzykoiniepewność w gospodarce–wybraneaspektyteoretyczne. Studia Prace Wydziału Nauk Ekonomicznych Zarządzania 2009, 14, 87–98. [Google Scholar]
  77. Kopp, R. Przemysł 4.0 ijegowpływnaprzemysłkuźniczy. Obróbka Plastyczna Metali. 2014, 25, 75–85. [Google Scholar]
  78. Stein, V.; Wiedemann, A. Risk governance: Conceptualization, tasks, and research agenda. J. Bus. Econ. 2016, 86, 813–836. [Google Scholar] [CrossRef]
  79. Szulewski, P. Concepts of industrial automation products for Industry 4.0. Mech. 2016, 7, 574–578. [Google Scholar] [CrossRef]
  80. Boubaker, K.; Colantoni, A.; Allegrini, E.; Longo, L.; Di Giacinto, S.; Monarca, D.; Cecchini, M. A model for musculoskeletal disorder-related fatigue in upper limb manipulation during industrial vegetables sorting. Int. J. Ind. Ergon. 2014, 44, 601–605. [Google Scholar] [CrossRef]
  81. Rajabi Hamedani, S.; Villarini, M.; Colantoni, A.; Moretti, M.; Bocci, E. Life Cycle Performance of Hydrogen Production via Agro-Industrial Residue Gasification—A Small Scale Power Plant Study. Energies 2018, 11, 675. [Google Scholar] [CrossRef]
  82. Lempert, R.; Zmud, J. Recrafting scenario practice to achieve robust long-term decisions. In Delivering Tomorrow, Logistics 2050. A Scenario Study; Deutsche Post AG: Bonn, Germany, 2012; pp. 166–172. [Google Scholar]
  83. Dewett, T. Linking intrinsic motivation, risk taking, and employee creativity in an R&D environment. R&D Manag. 2007, 37, 197–208. [Google Scholar]
  84. Kachelmeier, S.J.; Reichert, B.E.; Williamson, M.G. Measuring and motivating quantity, creativity, or both. J. Account. Res. 2008, 46, 341–373. [Google Scholar] [CrossRef]
  85. Kaufmann, G. What to measure? A new look at the concept of creativity. Scand. J. Educ. Res. 2003, 47, 235–251. [Google Scholar] [CrossRef]
  86. Zambon, I.; Piergentili, A.; Salvati, L.; Monarca, D.; Matyjas-Łysakowska, P.; Colantoni, A. Applied Research for a Safer Future: Exploring Recent Job Accidents in Agriculture, Italy (2012–2017). Processes 2018, 6, 87. [Google Scholar] [CrossRef]
  87. Monarca, D.; Cecchini, M.; Guerrieri, M.; Colantoni, A. Conventional and alternative use of biomasses derived by hazelnut cultivation and processing. In Proceedings of the VIIth International Congress on Hazelnut, Viterbo, Italy, 23–27 June 2008. [Google Scholar]
  88. Zambon, I.; Colantoni, A.; Cecchini, M.; Mosconi, E. Rethinking sustainability within the viticulture realities integrating economy, landscape and energy. Sustainability 2018, 10, 320. [Google Scholar] [CrossRef]
  89. Marucci, A.; Zambon, I.; Colantoni, A.; Monarca, D. A combination of agricultural and energy purposes: Evaluation of a prototype of photovoltaic greenhouse tunnel. Renew. Sustain. Energy Rev. 2018, 82, 1178–1186. [Google Scholar] [CrossRef]
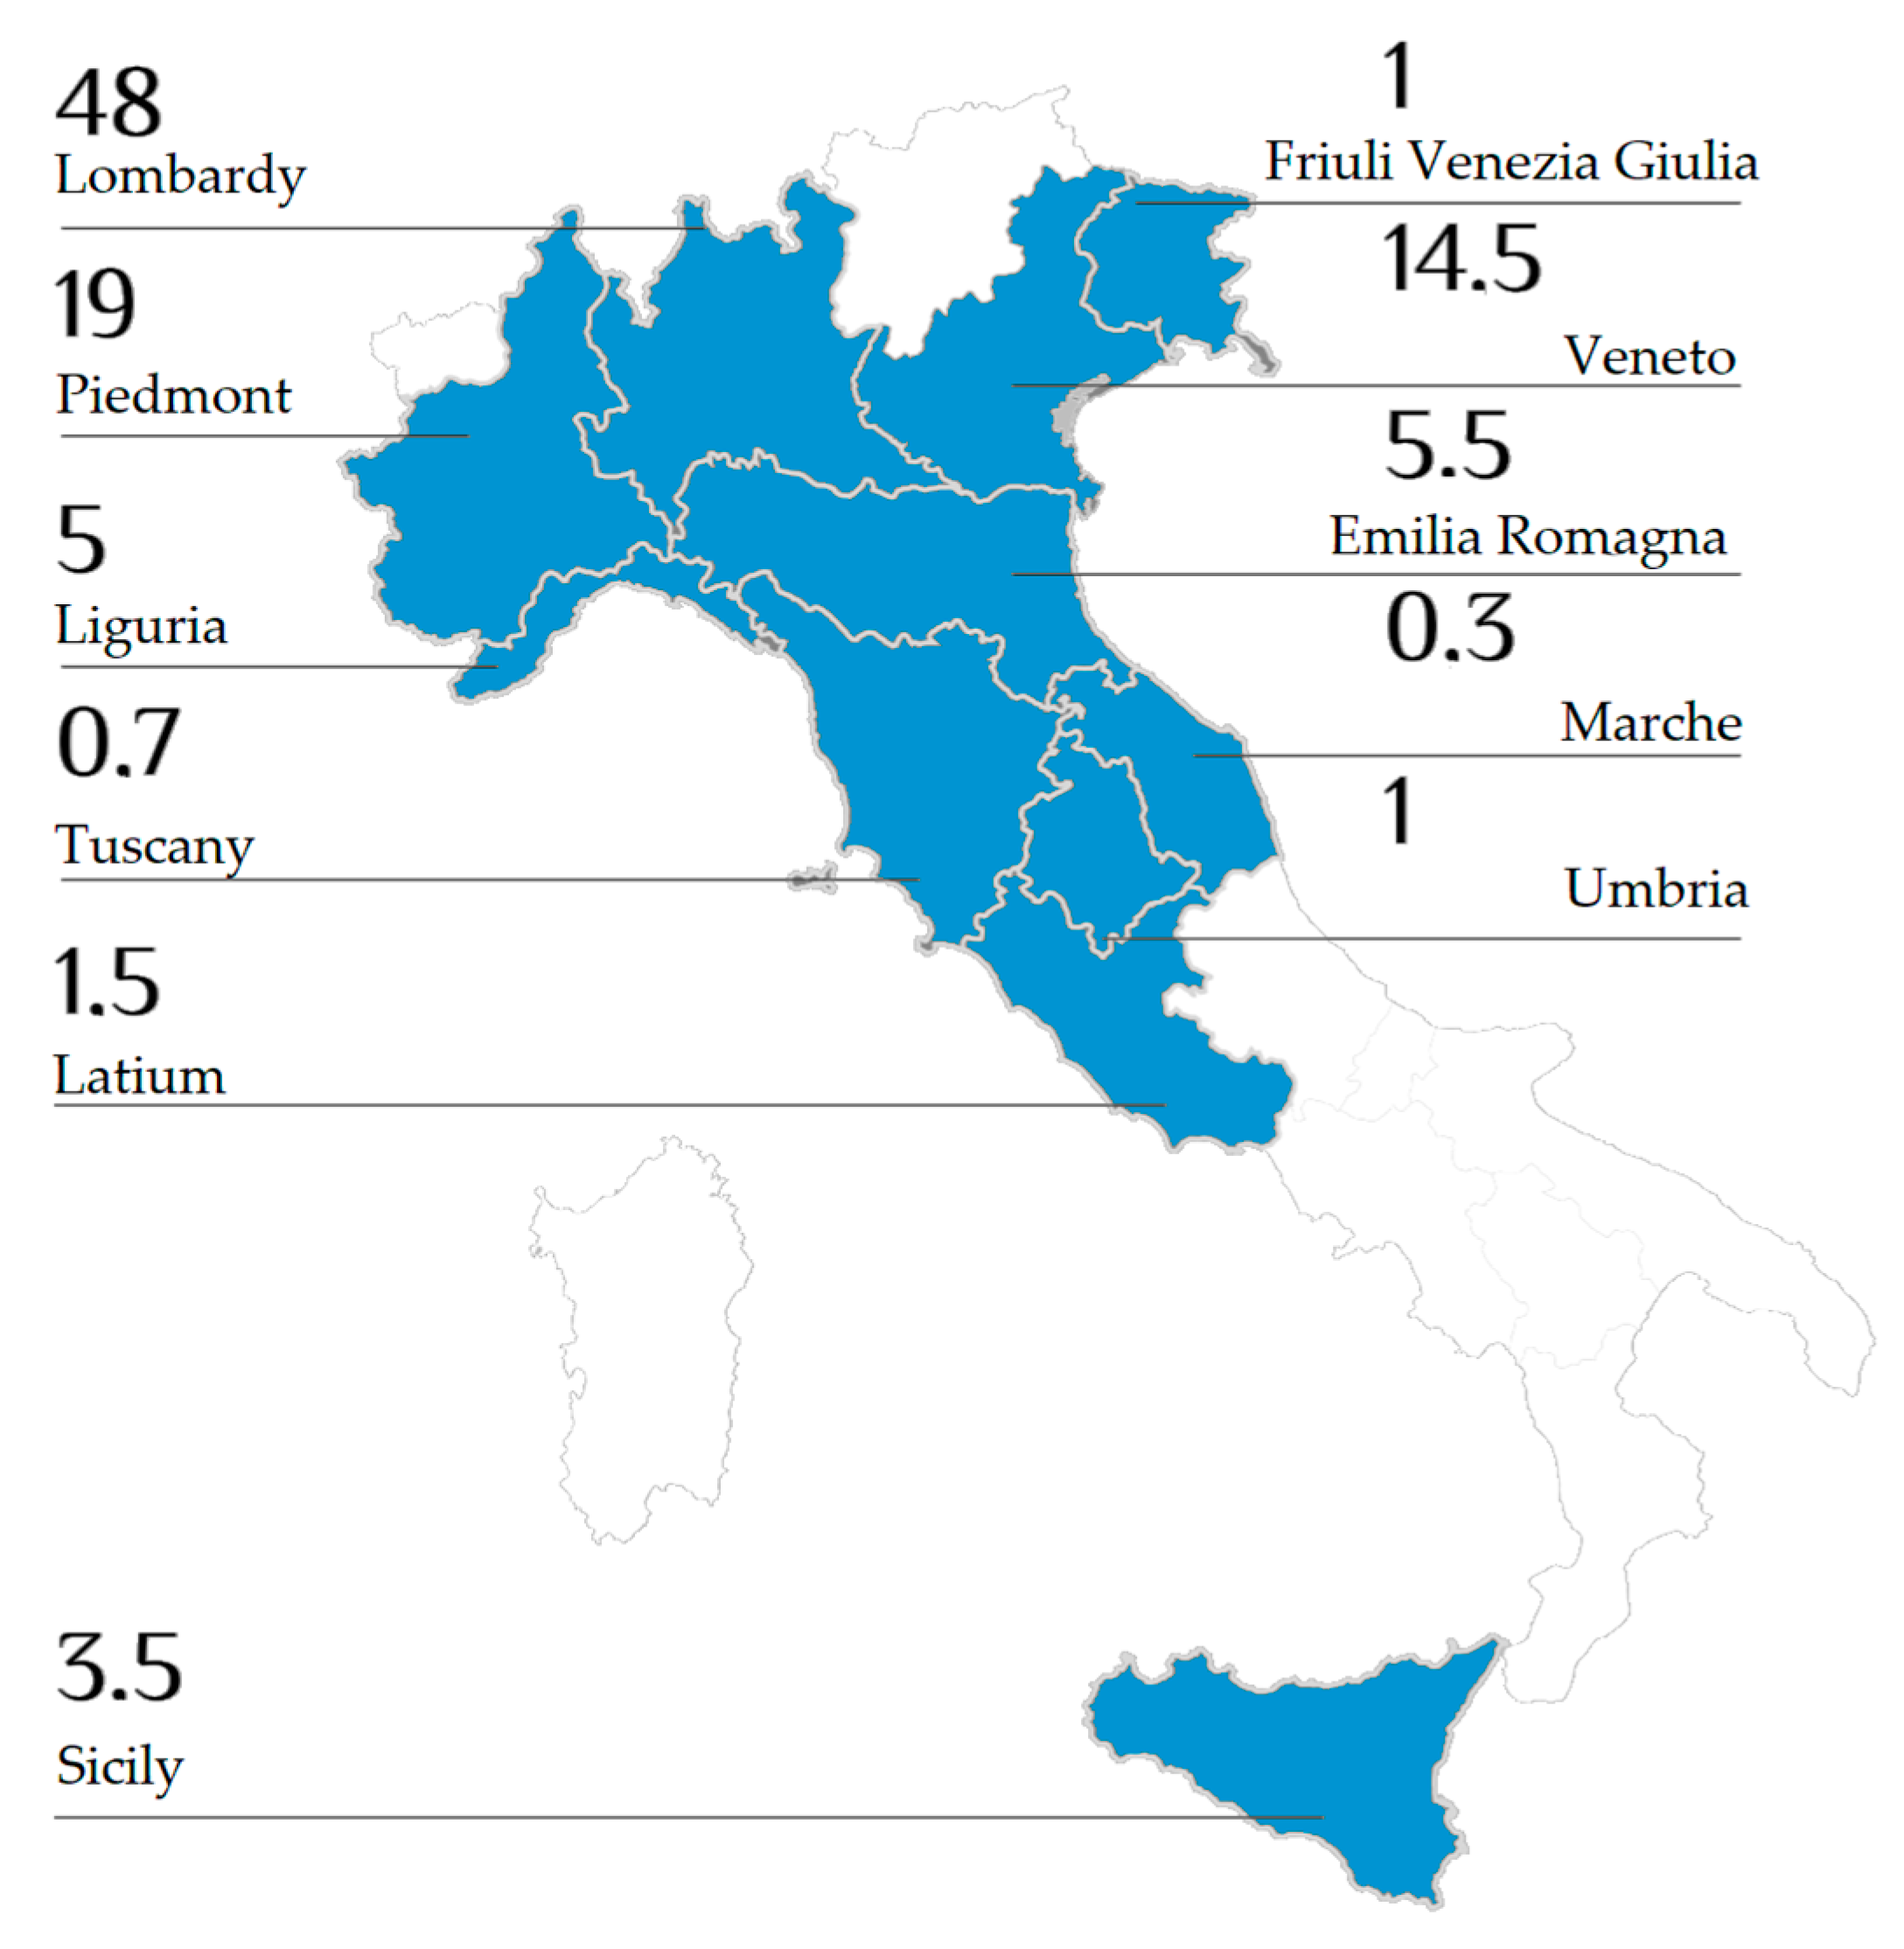
Figure 1. Geographic distribution of firms selected by region in Italy (in % terms).
Futureinternet 11 00196 g001
Figure 2. Uncertainty cone.
Futureinternet 11 00196 g002aFutureinternet 11 00196 g002b
Figure 3. Development of the uncertainty phases based on the coded parameters.
Futureinternet 11 00196 g003
Figure 4. Calculation of the innovation factor of the project.
Futureinternet 11 00196 g004
Figure 5. Uncertainty graph by trend line in red and in blue the trend line normalized.
Futureinternet 11 00196 g005
Figure 6. The variables within the pre-research analysis phase by trend line in red and in blue the trend line normalized
Futureinternet 11 00196 g006
Figure 7. The basic parameters considered to be systematic are in red, the minimum required level of the parameters is represented by the orange line, and the accessory parameters of systematicity is in blue.
Futureinternet 11 00196 g007
Table 1. Project uncertainty analysis (descriptive analysis).
Project Analytical Component of Project-Specific Uncertainty
VariableDescriptorContextualized Descriptor
i (m)Uncertainty of methodology, also in this case, the experimental process saw the application of either new methodologies or methods applied in contexts never studied and testedNew and innovative method, not widespread in the sector and high in complexity
VariableDescriptorContextualized Descriptor
I (r)Uncertainty of results (not being a process already mature or validated, normally the research carried out do not always have a positive result, precisely because they are being developed, code and implement new activities and actions both at business level and in the territory or scenario and for some research also at international or global level) Result not present in other studies, not guaranteed and with high variability
VariableDescriptorContextualized Descriptor
i (c)Uncertainty of costs, also in this case, not possible to delineate a certainty of the result, and it was not always possible to respect the budget assigned to the single activity of research Uncertain costs, given also the complexity of the research action
VariableDescriptorContextualized Descriptor
i (cu)human behavioral uncertainty, occurs in organizational models where the specificity of the behavior of one or more subjects involved in the experimentation may lead to the failure to achieve the experiment Possible negative impact on experimenters testing, difficulty in the method of relief given the complexity
VariableDescriptorContextualized Descriptor
i (o) Uncertainty of objective often in experimentation during the experimental action or study should be recalibrated objectives for the following factors arising from some specifics described below:Single objective but with very high technical and scientific complexity
Non-economic sustainability
Target not reachable
Objective not aligned with time requirements
Objective varied according to some experimental results
VariableDescriptorContextualized Descriptor
E (Spe)Experimental error comes from the uncertainty of the measurement or from the experimental errors determined statistically. This type of error is calculated based on specific elements of statistical analysisExperimental error not known at the beginning
VariableDescriptorContextualized Descriptor
i (tt)Uncertainty of technique and technology (use of new systems whose performance is unknown). Use of different mature technologies that, when related to each other, generate new functional problems. Prototype system Absolutely new technology in the application and survey phases
VariableDescriptorContextualized Descriptor
i (Repl)Replicability stems from the uncertainty of replicating the results and disseminating the results of experimentation and researchPossibility of replication that may be linked to secret scientific publications
Table 2. Assessment of each level of uncertainty analysis for summary judgments.
ValueKeyword
I (o)
Easy to achieve objective
Objective already achieved with other systems in the firm
Objective related only to production logic
Easy to achieve objective with complexity only related to aspects related to production
Only technical objective with little scientific value
Unique experimental objective without testing and simulation
Objective related to basic research with numerous sources available
This is a complex average objective that can be solved by well-known research projects in the sector that have already been published.
Objective with several sub-actions
Objective completely unrelated to knowledge
Objective does not present in the business logic
Objective does not present in the technical literature
Objective providing for preliminary studies in scientific literature
XMultiple objectives (general
Complex objective does not present in the scientific literature, and it is challenging to investigate at a high level
Objective providing for preliminary studies in scientific literature
Multiple objectives with complex, interlinked sub-actions
I (CU)
Project that impacts on a few subjects
Presence of only technical or mechanical contents
Presence of only basic study and research
Project with relations only at a technical level that have little impact on relational aspects
Superficial relations
Activity with low cognitive effects, iteration network activity
Human environment prevailing in the research theme
Project that impacts on organizational and relational environments
Project that has a significant impact on behavioral relationships
Project that has a significant impact on human relations
Project that impacts on cognitive, methodological, or learning logic and systems
XProject that impacts on many subjects or complex organizations
Project that impacts on social areas and relevant scales
I (m)
Method present in the literature and mature
Multi-coded methods
Methods present in the literature but not mature
More methods of applied disciplinary fields
New and encoded methods
Methods applied for the first time in the sector
XNew methods to be compared with methods in the literature
New development of methods
E (SPE)
Presence of certain and calculated statistical and instrumental errors
Presence of either only instrumental or statistical error
Presence of only some parameters and data for the calculation of uncertainty factors
XAbsence of statistical or data processing methods for numerical analyses
I (c)
Costs determined with a specific component prevalently linked to third-party shares
Determination of the analytical costs and simulation of the three scenarios
Definition of a specific session of cost analysis in the pre-project phase with determination of the budget
XHypothesized or simulated costs
Irtt
Mature technology used in a new way
Mature technologies interfaced with each other in an unencoded manner
XUse of experimental technology and a known component
Technology used in a sector other than that of application
Known technology significantly modified to be considered as new
Experimental technology
New and untested technology
I (r)
Known result in other similar firms
Result known to non-similar firms
Result not easily predictable
XUncertain or complex results
Results linked to several experimental objectives
I (REPL)
Easily replicable result
Result characterized by a complex path with the need for specific actions to be replicated
Result characterized by a complex path with the need for a progressive path to be replicated (e.g., training, procedures, manual, protocols)
XResult characterized by numerous variables with a specific study for replicability on an intra- and extra-firm scale
Table 3. Evaluation table.
SourceF(a)F(b)
Competitors and similar firms12
Firms in the sector12
Technical literature12
Scientific literature12
Firms that deal with technical and scientific issues but are not in the sector12
Table 4. Classification of the research as a function of the methods used and the reading of the results.
Category TypeFileTargetDescription
F: sicA.1DLIRoad maps and checklist
F: sicA.2OPOperating procedures
F: sicA.3DidrOperating procedures
F: sicA.4–A.5UVExample of a document and information to be provided
F: sicA.6Ter
Category typeFileTargetDescription
F: GestB.1DLIExplication
F: GestManaging DLI–opSoftware
F: GestCounting DLI–opSoftware
Category typeFileTargetDescription
F: SaniC.1DLIElements of analysis
F: SaniC.2DLI–opChecklist
F: SaniC.3DLI–op– DidrOperator procedures
Category typeFileTargetDescription
F: DidaD.1DidrElements of analysis
F: DidaD.2Didr–DLIChecklist
F: DidaD.3DLIOperator procedures
F: DidaD.4Didr–DLIliterature materials
Category typeFileTargetDescription
F: pryE.1DLI–DidrElements of analysis