1. Introduction
The Internet of Things (IoT) represents the next major step for the Internet as it evolves from a communication substrate that connects computers to one that connects and embraces everyday objects (things). This has the potential to revolutionize many different sectors of the economy and society more generally, e.g., enabling smart cities, smart transport systems, intelligent management of energy supplies, etc., all enabled by data collection from sensors. Most research in the Internet of Things has been carried out in cities and urban areas more generally (see
Section 3).
We see great potential and, indeed in many ways, an even bigger potential for transformation in applying Internet of Things concepts to rural areas to both gain a better understanding of the natural environment and to manage this environment through appropriate interventions. However, the deployment of Internet of Things technology in the natural environment poses new challenges around, for example, the limitations of power and Internet connectivity and hostile operational conditions.
The focus of this paper is on the Environmental IoT project, a first attempt to instrument and manage an environmental catchment in all its facets, across different geographical locations and at all its scales. We also take this a stage further, building on our experiences in the Environmental Virtual Observatory pilot project [
1]. This project utilised cloud computing to offer a shared repository of data, models, and other tools and artifacts to allow a range of stakeholders to visualise data, to run models, to feed data into models, to deal with uncertainty in models, and to discuss the results with other stakeholders and communities. The Internet of Things and cloud computing are strongly complementary technologies that, when combined, can provide a complete, end-to-end technological infrastructure for a step change in our understanding of complex environmental factors.
This research has the potential to have major impact on many aspects of rural life—on farmers and associated agricultural businesses, the water industry, tourists and tourism related businesses, and society more generally. This has the potential to completely transform these associated businesses, enabling critical areas such as integrated land and water management, coastal zone protection, and precision agriculture. We are particularly interested though in new kinds of science and associated management strategies that stem from bringing real-time data sets together and from observing related interdependencies.
Current practices in the environmental and earth sciences focus heavily on standalone data logger systems, with some early initiatives starting to embrace wireless sensor networks for environmental modelling (e.g., References [
2,
3,
4,
5]). These initiatives, though, tend to focus on particular environmental facets at particular scales, e.g., focusing on habitat monitoring [
6,
7], glaciology [
8], permafrost [
9], and volcanoes [
10]. While wireless networks have become quite sophisticated in many cases, they need a step change in their interoperability, scope, and usability to become functioning Environmental IoT’s, which also need to encompass a widespread deployment of spatially distributed devices with embedded identification, sensing, and/or actuation capabilities [
11]. The development of a full Environmental IoT would also provide analytical tools to understand the functioning of natural systems based on real-time networks of sensors deployed widely across the landscape. Combined with other existing environmental data (maps of geology, topography, soils, etc.) and model outputs (rain and flood forecasts, etc.), the Environmental IoT can provide the basis for decision and support systems for an adaptive management of natural resources and for raising alerts. One of the major factors in the slow uptake of the technology from the lab to the field is because most of these systems rely on nonstandard, custom-designed elements that need specialised expertise [
5].
This paper reports in detail on experiences from the design and live deployment of an Environmental IoT targeting specific local and regional environmental applications (hillslope to river catchment) using inexpensive off-the-shelf technologies and deploying the system for a particular environmental issue: flood and pollution monitoring and alerts in rural environments. Our central hypothesis is that our combination of IoT technology coupled with Cloud Computing enables a paradigm shift in our understanding and management of the natural environment, especially related to understanding ecosystem interdependencies, in times of unprecedented environmental change.
The key contribution of this paper is an evaluation of this hypothesis in terms of the technological, scientific, and methodological aspects:
Technological: the presentation of a complete end-to-end systems architecture embracing cloud and IoT infrastructure designed to operate effectively in the target operational environment;
Scientific: the assessment of the potential impact of IoT/cloud technology on environmental and earth sciences;
Methodological: a reflection on the methodological approaches required to facilitate the desired cross-disciplinary conversation to develop and utilise an Environmental IoT infrastructure.
The paper is structured as follows.
Section 2 discusses the target deployment environment for the Environmental IoT infrastructure, highlighting the key challenges being addressed by the infrastructure.
Section 3 then provides a more in-depth assessment of the related work, supporting our view that the application of IoT principles in the natural environment has been limited in scope and vision.
Section 4 presents in detail the design and deployment of the Environmental IoT platform, and
Section 5 then discusses the experiences of this work.
Section 6 provides a more high-level discussion around the technological, scientific, and methodological aspects discussed above. Finally,
Section 7 presents concluding remarks.
2. The Target Deployment Environment
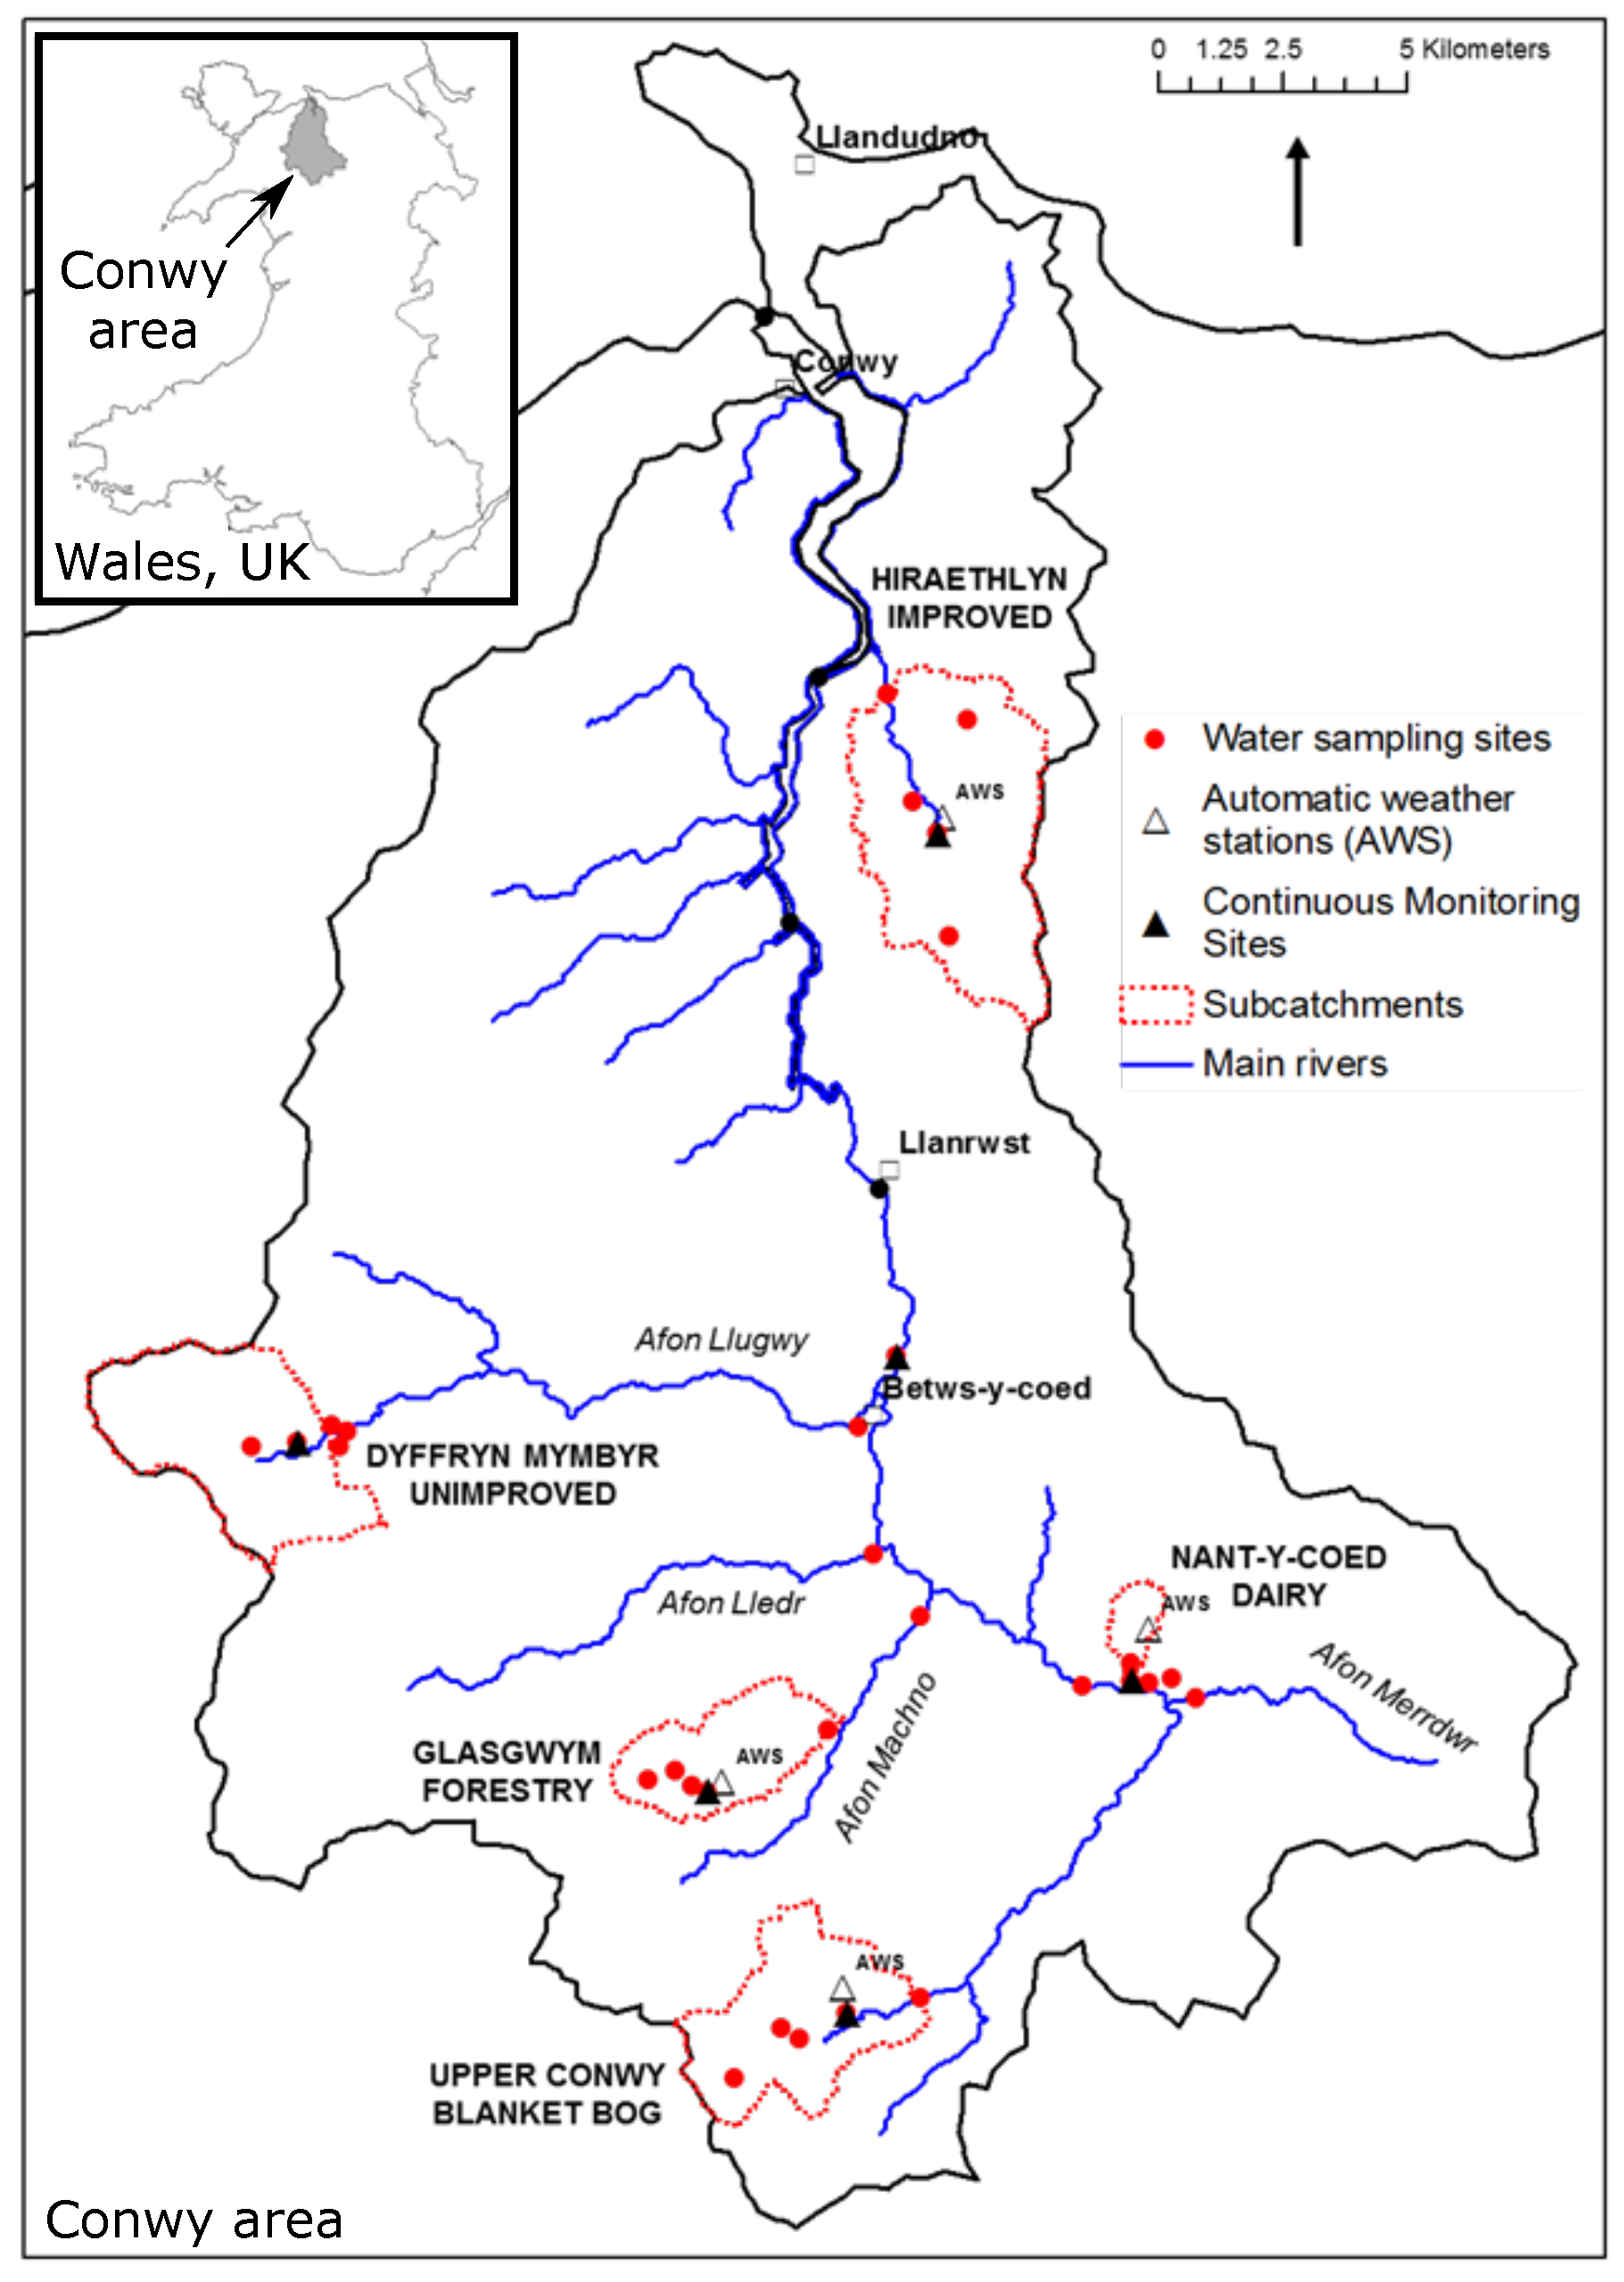
We focus on one specific geographic region around Conwy in North Wales (see
Figure 1), a typical rural area supporting important industries including agriculture, forestry, tourism, and fishing but facing huge challenges brought about by climate change and conflicting demands on land/water resources. The Conwy river rises in the Snowdonia National Park in the Migneint range which has high rainfall providing water resources and important carbon storage and biodiversity in peatland habitats. The Conwy flows through intensive agricultural land out to an estuary important for the shellfish industry, conservation, and tourism. The lower Conwy was recently in the national news due to intensive flooding of several larger towns. Such extreme events are consistent with climate change predictions. The major shellfisheries and tourist beaches close to the Conwy estuary are continually subject to contamination, to risk of closure, or to loss of blue flag status due to microbial pollution from rural wastewater treatment plants and agricultural runoff. These pollution events are becoming increasingly frequent and are also exacerbated by floods, storms in general, and periods of drought.
One of the main challenges in the Conwy and many other catchments/landscapes is the potential conflict arising from the needs of different industries, e.g., agriculture, water, tourism, and urban development, and the need for decision support tools to future-proof against climate change. The GDP associated with Wales and the UK indicate that something is missing in local and national economies to varying degrees, and balancing their requirements is a major challenge for both government and industry alike. In the past, “silo management” has often resulted in a development by one industry negatively impacting on a second (e.g., the intensification of agriculture reducing water quality), and there is a move towards a more holistic consideration of these challenges (cf. Natural Environment White Paper [
12]). However, a major problem identified in delivering this vision is the fragmented and inaccessible nature of the resources (i.e., data, models, and tools) needed for a more integrated approach.
This problem is illustrated by the following scenario:
- A
Representatives from the Conwy shellfish industry contacted Prof. Emmett to ask why their shellfish products had just been rejected by Europe based on their high microbiological pollutant load and risk to public health. The industry wanted to know where the pollution was coming from, what caused the pollution to occur in the last month, and what safeguards they could put in place for the future. The professor used the Environmental IoT to identify any recent anomalous events in the Conwy catchment, which she suspected was the source of the problem. She determined that the recent movement of livestock into lowland areas combined with high rainfall and spring tides had caused a significant transfer of nutrients and faecal bacteria into coastal waters. She advised that the use of a mobile APP would allow them to predict when these events might happen in the future and when their waters would be safe to harvest shellfish again.
An Environmental IoT provides a major opportunity to fill this gap, bringing together data and assets from across different domains (soil, water, plant ecology, and animals) and organisations (e.g., public, regulatory, and industry) to enable integrated problem solving for the agriculture and water industries but with a clear potential to link to other critical industries in the future.
3. Related Work
As mentioned in the introduction, the vast majority of Internet of Things research to date has been focused on smart city and home environments [
13]. The instrumentation of the natural environment using IoT technology has received less attention. The key practical differences here are the lack of wide-area connectivity, lack of mains power sources, physical locations that are hard to access, and the often harsh environmental conditions. We survey the most closely related work in this area below. Our deployment is the first to deliver a holistic IoT solution for the natural environment, enabling a real-time study of multiple dimensions of that environment simultaneously.
One of the first experimental testbeds of a multi-tiered architecture for habitat monitoring was proposed by Cerpa et al. [
14] in 2001. Using the mote technology developed by Kris Pister at the University of California, Berkeley [
15], the authors introduced the principles of building long-lived wireless sensor networks, adaptive self-configuration, and its application to habitat monitoring. Their goal was to integrate these building blocks into a deployable system.
Researchers at UC Berkeley in collaboration with biologists at the College of the Atlantic deployed the first-documented tiered wireless sensor network architecture for habitat monitoring, such as detecting the presence of birds on Great Duck Island (GDI), Maine [
16]. They deployed two networks for a total number of about 150 nodes in both single-hop and multi-hop configurations. The initial deployment comprised of 32 nodes using UC Berkeley motes, including temperature, photoresistor, barometric pressure, humidity, and infrared sensors. Two years later, the researchers analysed a rich set of data captured from these sensors from a systems perspective regarding the lifetime of nodes and network performance, reliability, routing, and yield [
17].
Researchers from Princeton University deployed a 30-node wireless sensor network with mobile base stations called ZebraNet at the Mpala Research Center in central Kenya which aimed at monitoring and tracking wildlife, particularly zebras, for biology researchers [
18]. The ZebraNet system included nodes (tracking collars carried by animals) operating as a peer-to-peer network for transferring data. The collar, working as a wireless computing device, was comprised of a GPS, flash memory, a wireless transceiver, and a CPU. ZebraNet was the first project to design protocols for sensor networks having a mobile base station.
The University of California, Los Angeles’s (UCLA) Center for Embedded Network Sensing (CENS) deployed the Extensible Sensing System (ESS) for habitat sensing at the James Reserve in California. CENS was a multidisciplinary collaborative project to develop and deploy wireless sensing systems to monitor the biological, ecological, seismological, and different environmental phenomena.
Researchers at the University of Southampton deployed an environmental sensor network called GlacsWeb [
19] to monitor and study the dynamics of glaciers in hostile environments. The system comprised of 9 nodes (probes) inserted in the glacier, a Base Station on the surface of the glacier having a differential GPS, and a Reference Station working as a gateway for transferring data. Each node was equipped with pressure, temperature, and orientation (tilt) sensors for monitoring the melting behaviour of glaciers. GlacsWeb developed a low-power sensor network supporting the transfer of sensor readings to a web accessible database.
Cardell-Oliver et al. [
20] designed and implemented a reactive, event-driven wireless sensor network for the environmental monitoring of soil moisture. A novelty of their implementation is how their network reacts to extreme events such as intensive rainfall to send frequent readings and to collect the most interesting data, reverting to a less frequent collection in periods of lower rainfall. They used Mica2 433 MHz motes with MDA300 sensor boards comprising of soil moisture and rainfall sampling nodes, a base node connected to a Superlite GSM gateway and routing nodes. They evaluated their network by taking into account three performance parameters, i.e., responsiveness, robustness, and longevity of the network.
Researchers at UC Berkeley deployed a wireless sensor network, termed “Macroscope in the Redwoods”, to monitor the complex spatiotemporal variations of the microclimate of a redwood tree [
21]. The sensor node was a Mica2Dot, a repackaging of the Mica2 manufactured by Crossbow. The mote consisted of an Atmel ATmega 128 microcontroller operating at 4 MHz, a 433-MHz radio, and 512 KB of flash memory. The measured biological parameters were temperature, relative humidity, and light levels. Although Macroscope was deployed at a small scale, it had the potential to measure the microclimate phenomena of a redwood tree at a spatiotemporal large scale. Further, it provided useful knowledge regarding deployment methodology and data analysis.
LOFAR-agro (Low Frequency Array) is the first deployment of a large-scale sensor network in precision agriculture to protect potato crops from Phytophthora, a fungal disease, with close monitoring of the microclimate [
22]. In this project, around 100 nodes were deployed in a potato field to measure the temperature and relative humidity of the environment, known to be the main factors in causing the disease. The researchers experienced a range of unanticipated technical challenges due to poor design, improper application of software engineering principles, semantic mismatches, programming bugs, and insufficient time for testing.
Researchers at Harvard University in collaboration with researchers at the University of North Carolina and the University of New Hampshire deployed a sensor network on an active volcano in Volcan Reventador, northern Ecuador to measure seismic and infrasonic signals [
10]. The network comprised of 16 stations with seismic and acoustic sensors. Each node consisted of a Moteiv TMote Sky, a descendant of the UC Berkeley’s Mica mote, an 8-dBi 2.4GHz external omnidirectional antenna, a seismometer, a microphone, and a custom hardware interface board. The network was deployed for more than three weeks and collected data from several events. The model was based on event triggering which detected 230 eruptions and captured about 107 Mbytes of data.
In a collaborative project called “Life Under Your Feet”, researchers at John Hopkins University and with Microsoft deployed an experimental wireless sensor network in a Baltimore urban forest to monitor soil ecology [
23]. They used MicaZ from Crossbow Inc. with a MTS101 data acquisition board comprising of ambient light and temperature sensors. They attached Watermark soil moisture sensors and a soil thermistor to the board. They reported a mixture of previously known and new observations from the operation of their testbed, such as reprogramming the motes, sensor nodes and calibration cost, the importance and challenge of low-level programming, the need for fast and efficient routing infrastructure and network design, and reliable delivery and high quality of data.
Bishop-Hurley et al. [
24] designed and tested a prototype of a neck-collar-based virtual fencing system to monitor and control livestock movement and behaviour. They conducted an experiment on 25 steers at the Belmont Research Station, Australia for over a month. The electronics used in the experiment consisted of the Fleck WSN (Wireless Sensor Network) device in combination with a control board which could produce an electrical pulse. Two 6-volt batteries placed in the collar’s compartments, were used to charge and power the Fleck. For radio communication, they used a 433 MHz wave flex whip antenna. A statistical analysis was done on observational and videotaped data to see how animals reacted to the stimuli. The experiment showed that the sensory cue has the potential to be used for monitoring livestock in large grazing systems.
Sensor networks have also been used to detect and monitor river flooding [
25], with the capability of integrating remote fixed-network grids for computationally intensive flood-modelling and also performing on-site grid computation. Also in the natural environment, the GreenOrbs [
26] project is an extremely large deployment of sensor nodes in a forest environment to help understand canopy coverage over time.
SensorScope was an outdoor wireless sensor network deployed on top of a rock glacier in Switzerland for environmental monitoring in harsh weather conditions [
27]. The researchers deployed 16 sensing stations on a
m area for a couple of months to measure air temperature and humidity, surface temperature, incoming solar radiation, wind speed and direction, and precipitation. They opted for a Shockfish TinyNode sensor mote platform composed of a Texas Instruments MSP430 microcontroller running at 8MHz and a Semtech XE1205 radio transceiver. They designed and implemented the communication stack from scratch for their stations with TinyOS. SensorScope mainly aimed at providing a low-cost, efficient, and reliable WSN with an emphasis on improved data collection techniques and, to a great extent, deployed successfully in outdoor harsh environments.
Corke et al. [
28] reported experiences learned from their wireless sensor networks deployed over six years to understand the natural and agricultural environments and the major challenges they pose in Australia. They developed and deployed sensor networks for different applications such as cattle monitoring, ground water and lake water quality monitoring, virtual fencing, and rainforest monitoring, highlighting the technological challenges they faced, which technology they used for each application, and what lessons they learned from each deployment.
All of the above work suggests a strong need for Environmental Internet of Things developments, with high interest from multiple different domains of science. However, work to date remains relatively tightly focused on single dimensions of the environment, lacking a broader view that can fuse data across multiple scientific domains to build a holistic environmental perspective. Further to this, we note that a large proportion of the above works are technology-oriented and often fail to deeply involve scientists in the domain of study throughout the design process. In contrast to these two points, our work takes a multidimensional perspective on an environmental IoT deployment and has deeply involved soil scientists, hydrologists, and animal behaviour scientists from the first stages of design through to actual deployment and maintenance.
5. Deployment Experiences of an Environmental IoT
In this section, we report on some of the main deployment and operations stage of the project. Our deployment site is situated in a field in a region called Hiraethlyn, which is found in Conwy, North Wales.
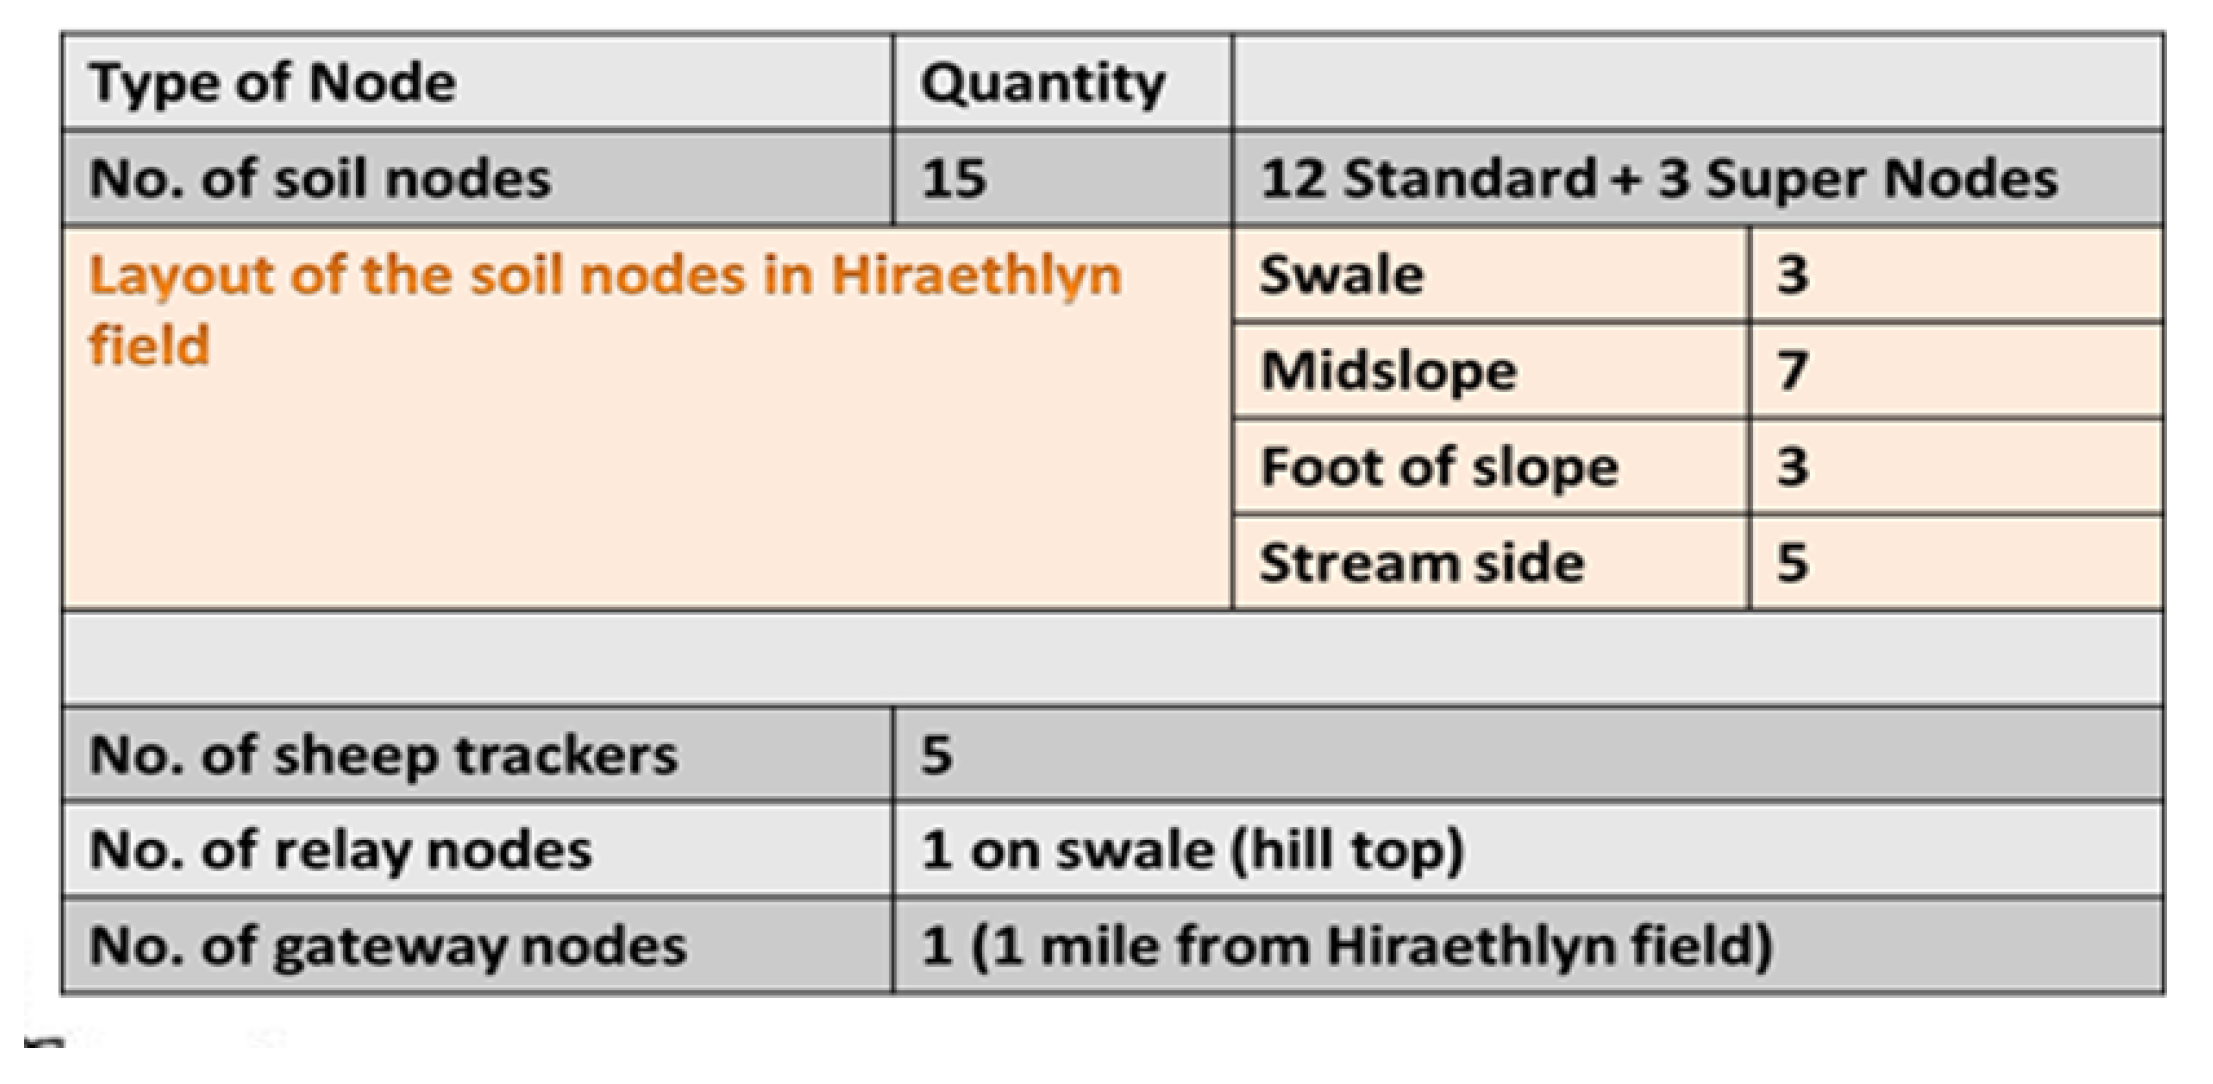
Figure 12 shows the number of the nodes in the field, and
Figure 3 shows the layout of the soil nodes according to the topology of the field (swale, midslope, and foot of slope).
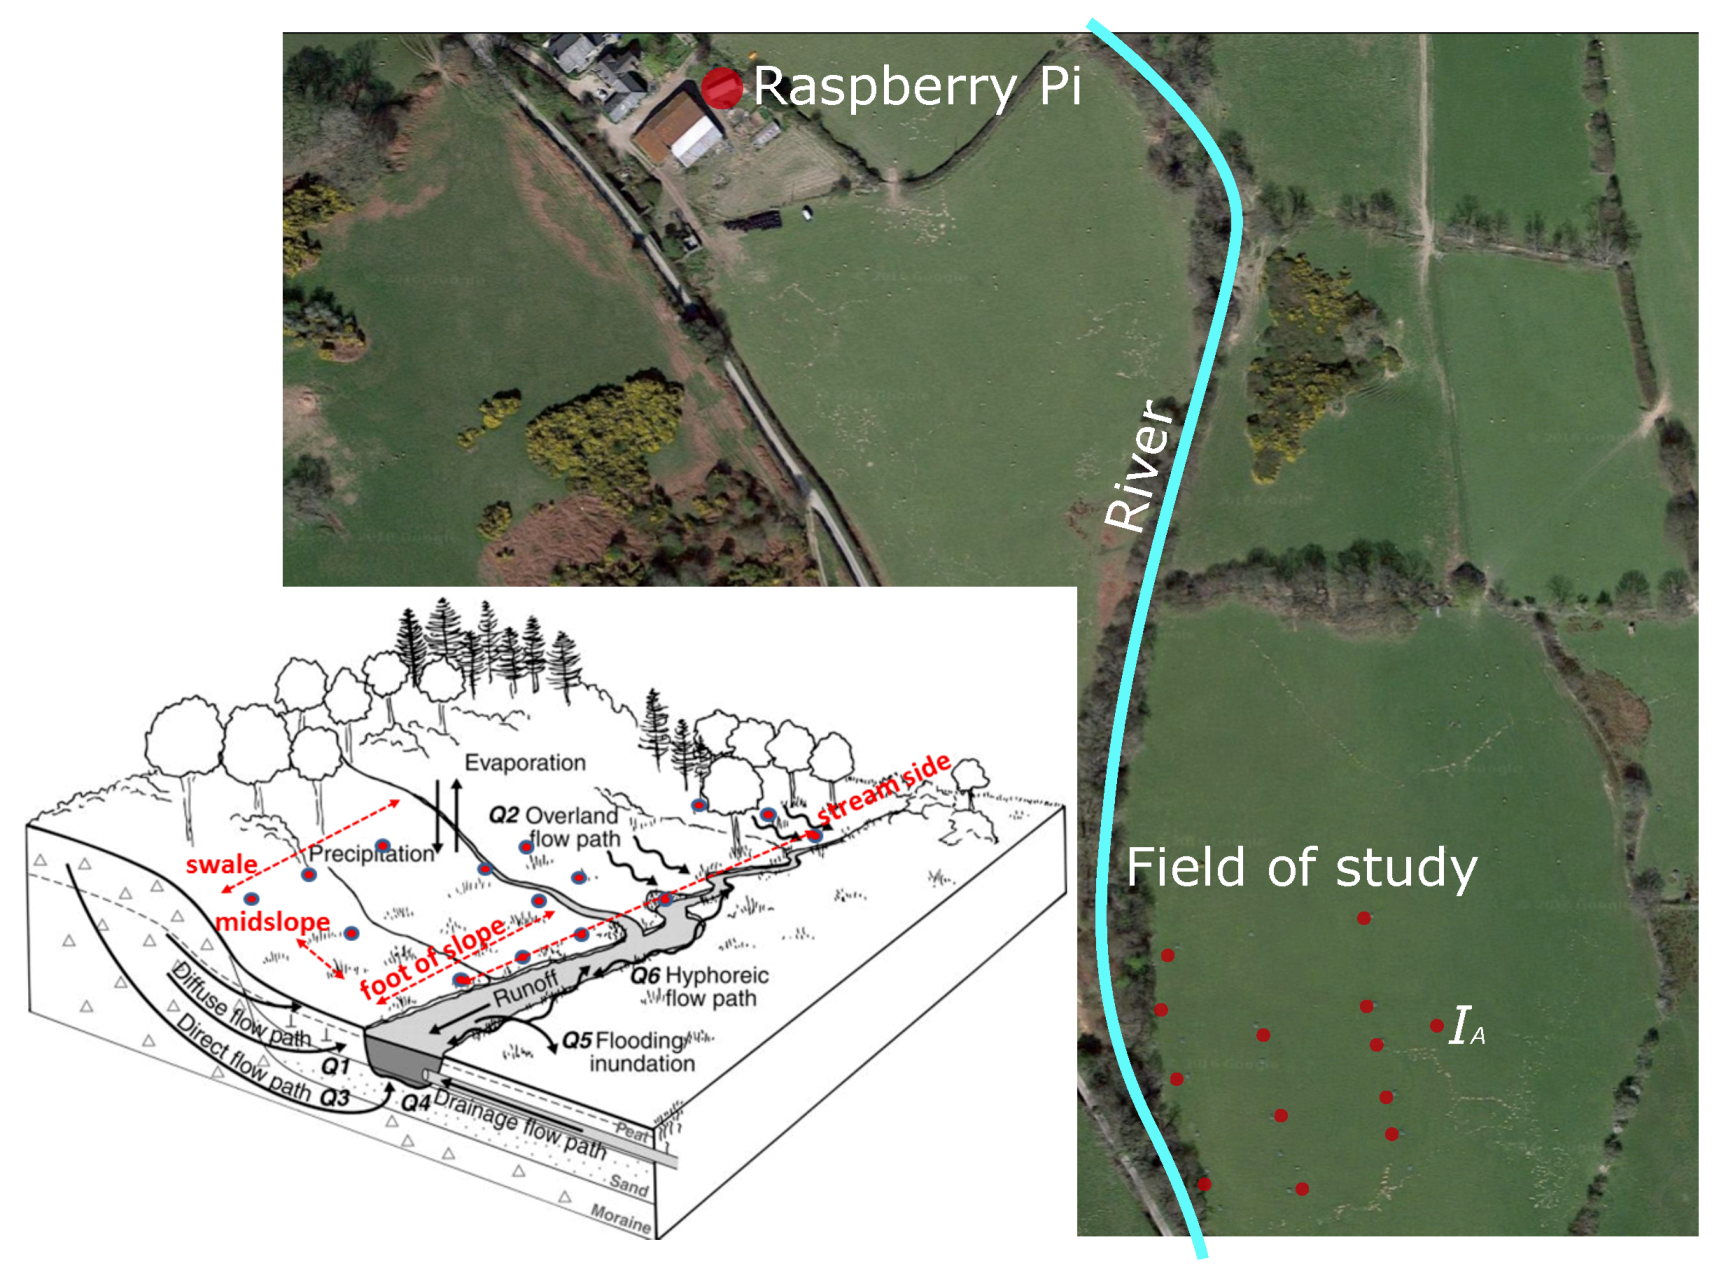
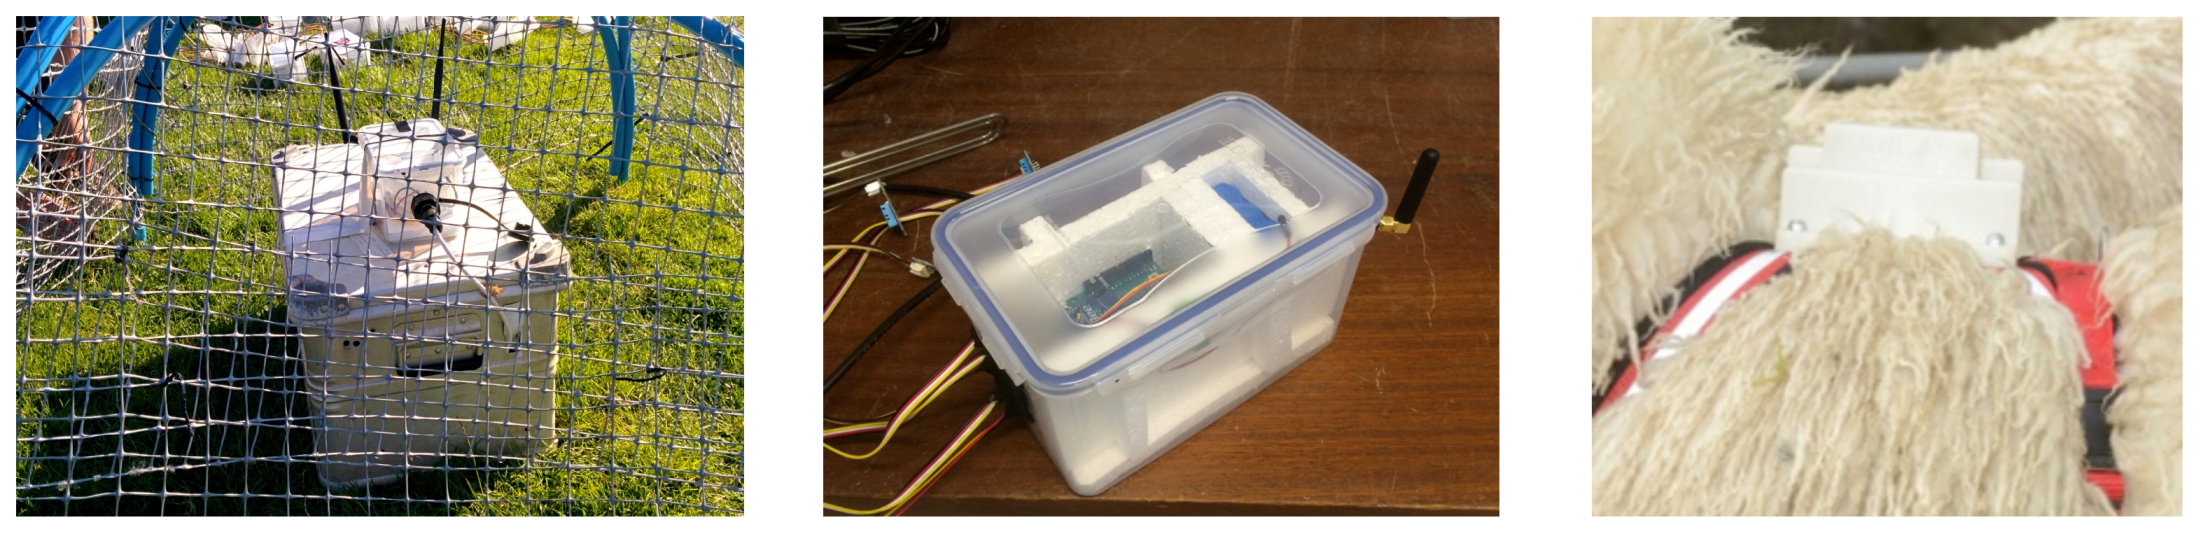
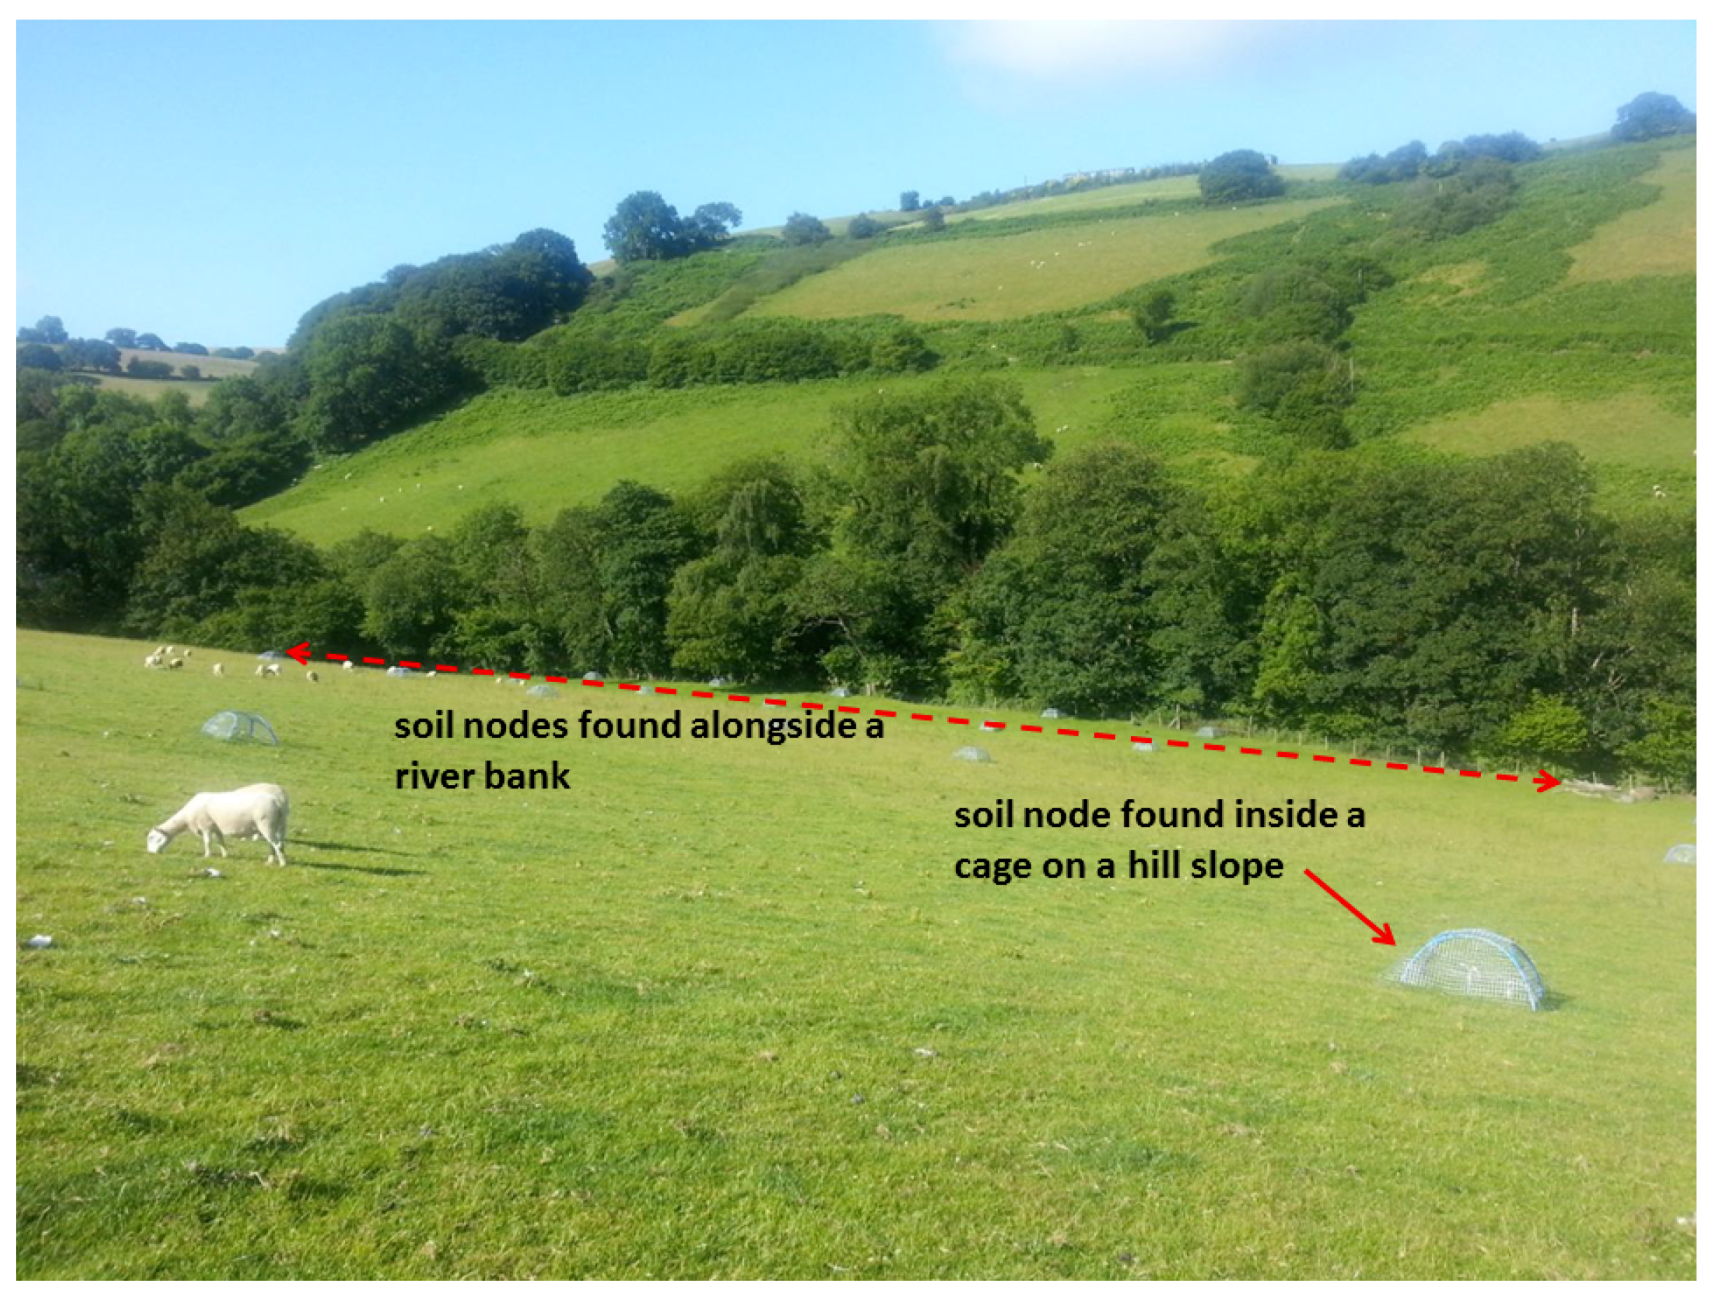
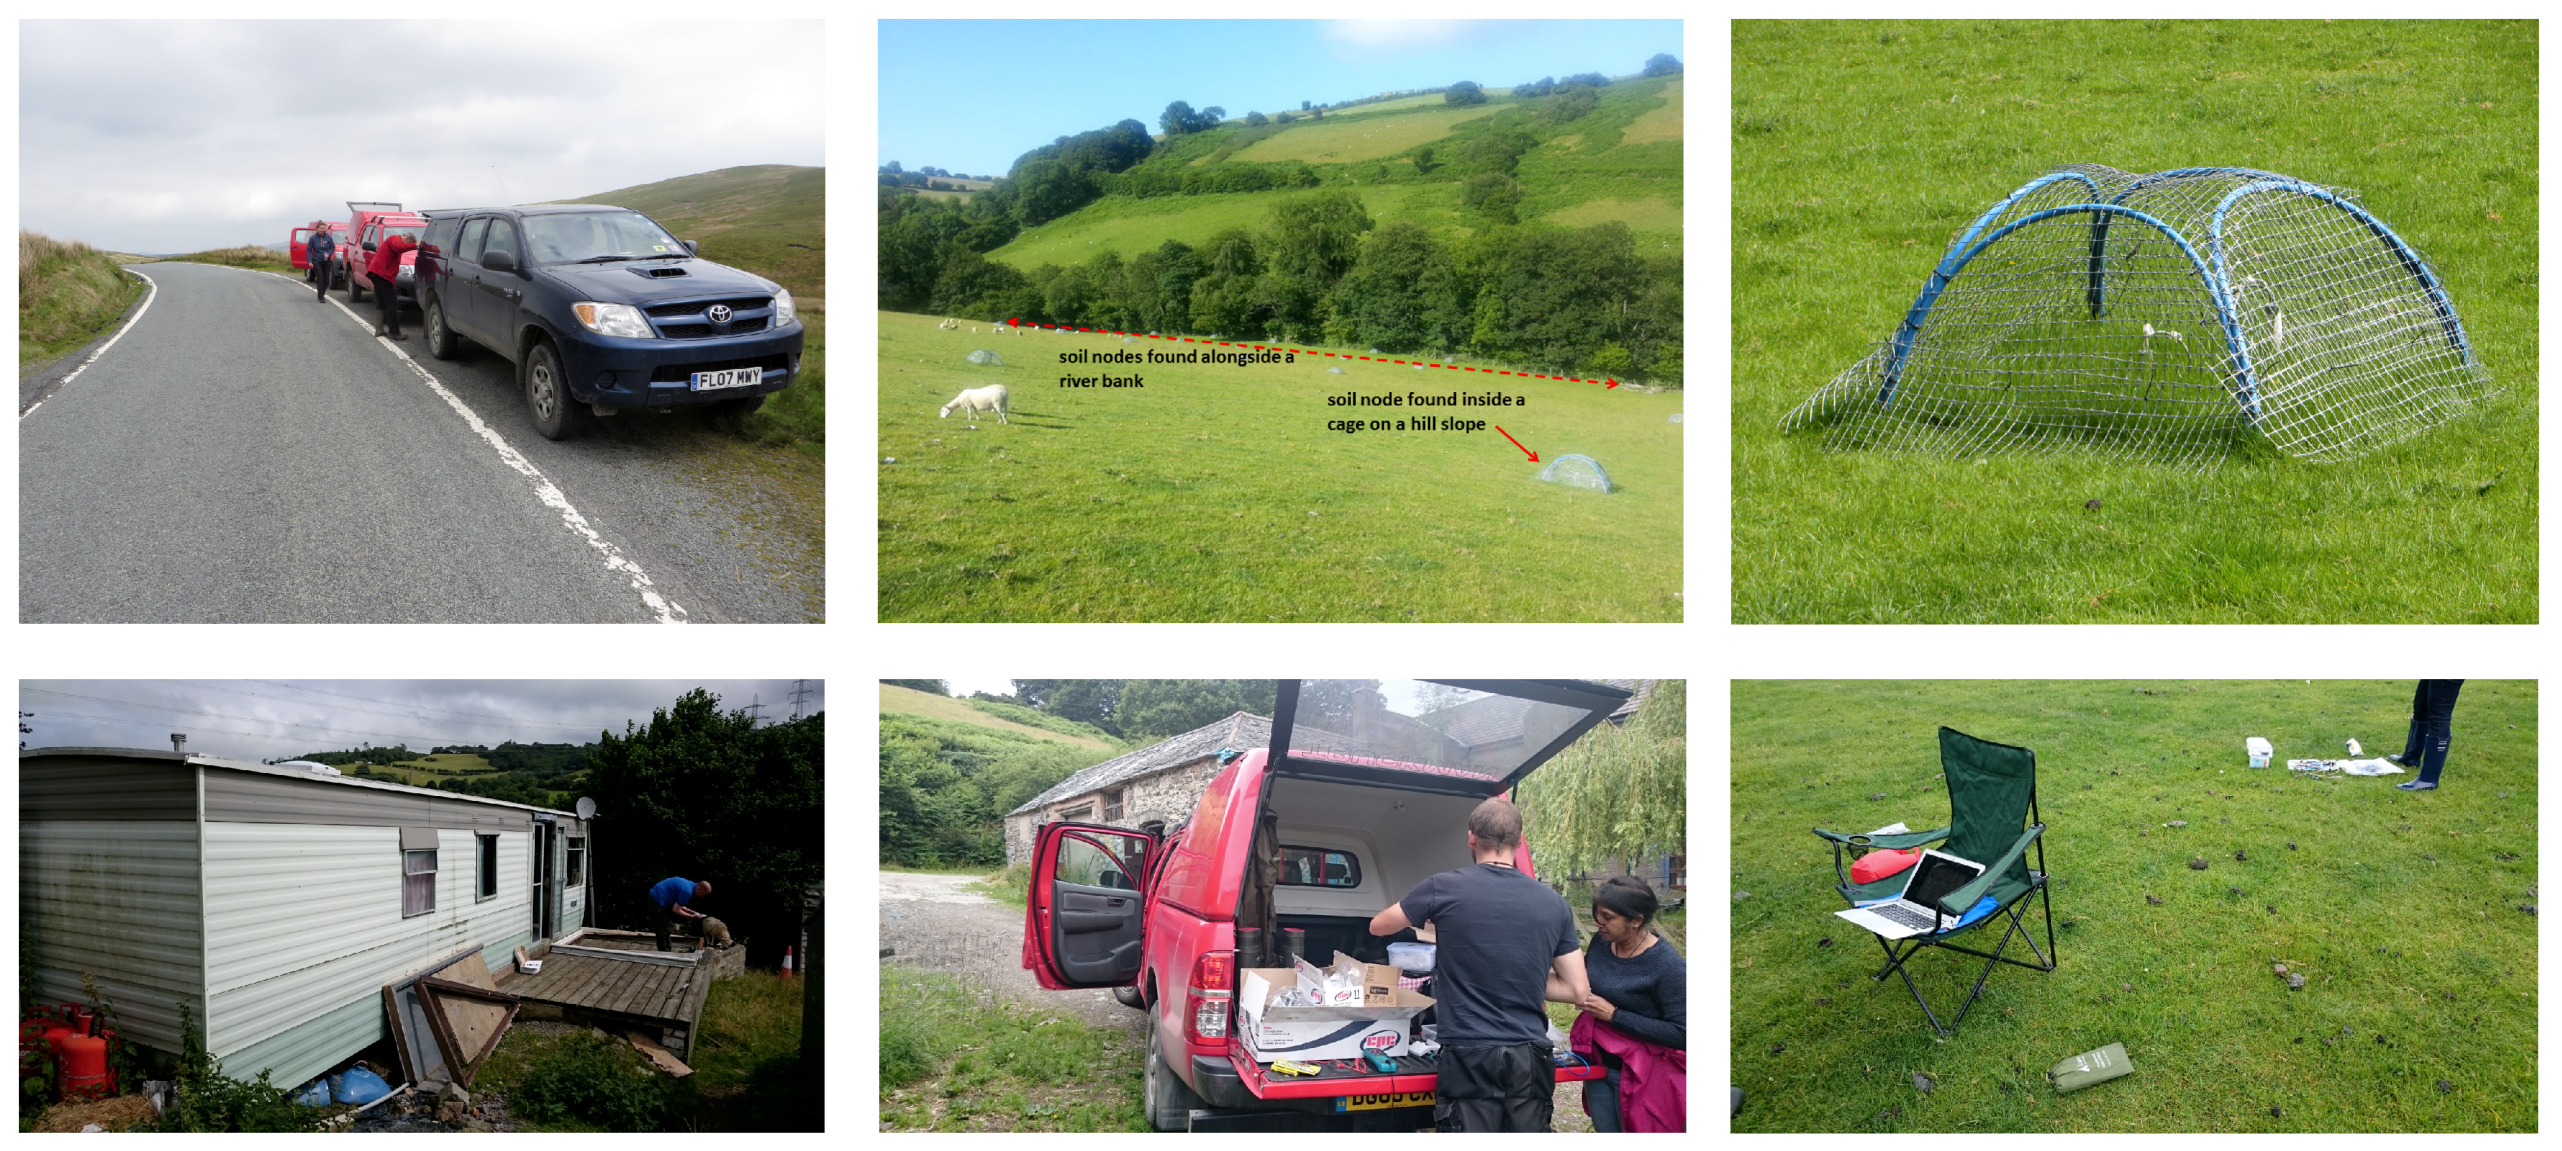
Figure 13 shows the deployment area in Hiraethlyn, which is in a strategic location running alongside a tributary of the Conwy river. The river runs through the Snowdonia National Park in the Migneint range and drifts through intensive agricultural land out to an estuary important for the shellfish industry. A collection of images from this deployment experience is shown in
Figure 14. One of the objectives of the IoT experiment is to enable the stakeholders to make informed decisions regarding any possibility of flooding of the Conwy river. The fact that this field slants towards the river tributary is one of the key contributors towards achieving this objective. As shown in
Figure 13, the soil nodes are scattered around the Hiraethlyn field and also around the river bank. These soil nodes help to detect the soil moisture content of this field. This value coupled with the met office weather data can help to inform the environmental scientists about any possibility of flooding of the river.
Another objective is to determine whether there is a danger of pollution or contamination to the river water due to the run-off of pathogens from the soil to the river. Given that the sheep roaming in this field contribute to the accumulation of pathogens that wash down to the river, it was decided to fit few sheep with a collar reporting their every movement through the IoT infrastructure. Therefore, the deployment procedure entails setting up this IoT infrastructure, consisting of the soil nodes in the field, the tracker collars placed round the neck of sheep roaming in this area, as well as installing the relay and gateway nodes. The following section gives more insight into this deployment process.
We first note that our deployment timing coincided (by chance) with one of the most severe storm and flooding periods in UK history, during November–December 2015, creating extraordinarily challenging conditions for operating technology in the field. The most significant problems caused by this were lower than anticipated solar charging levels and terminal water damage to some nodes. Nevertheless, our deployment was broadly successful, resulting in large volumes of real-time data collection from both the soil nodes and the animal trackers.
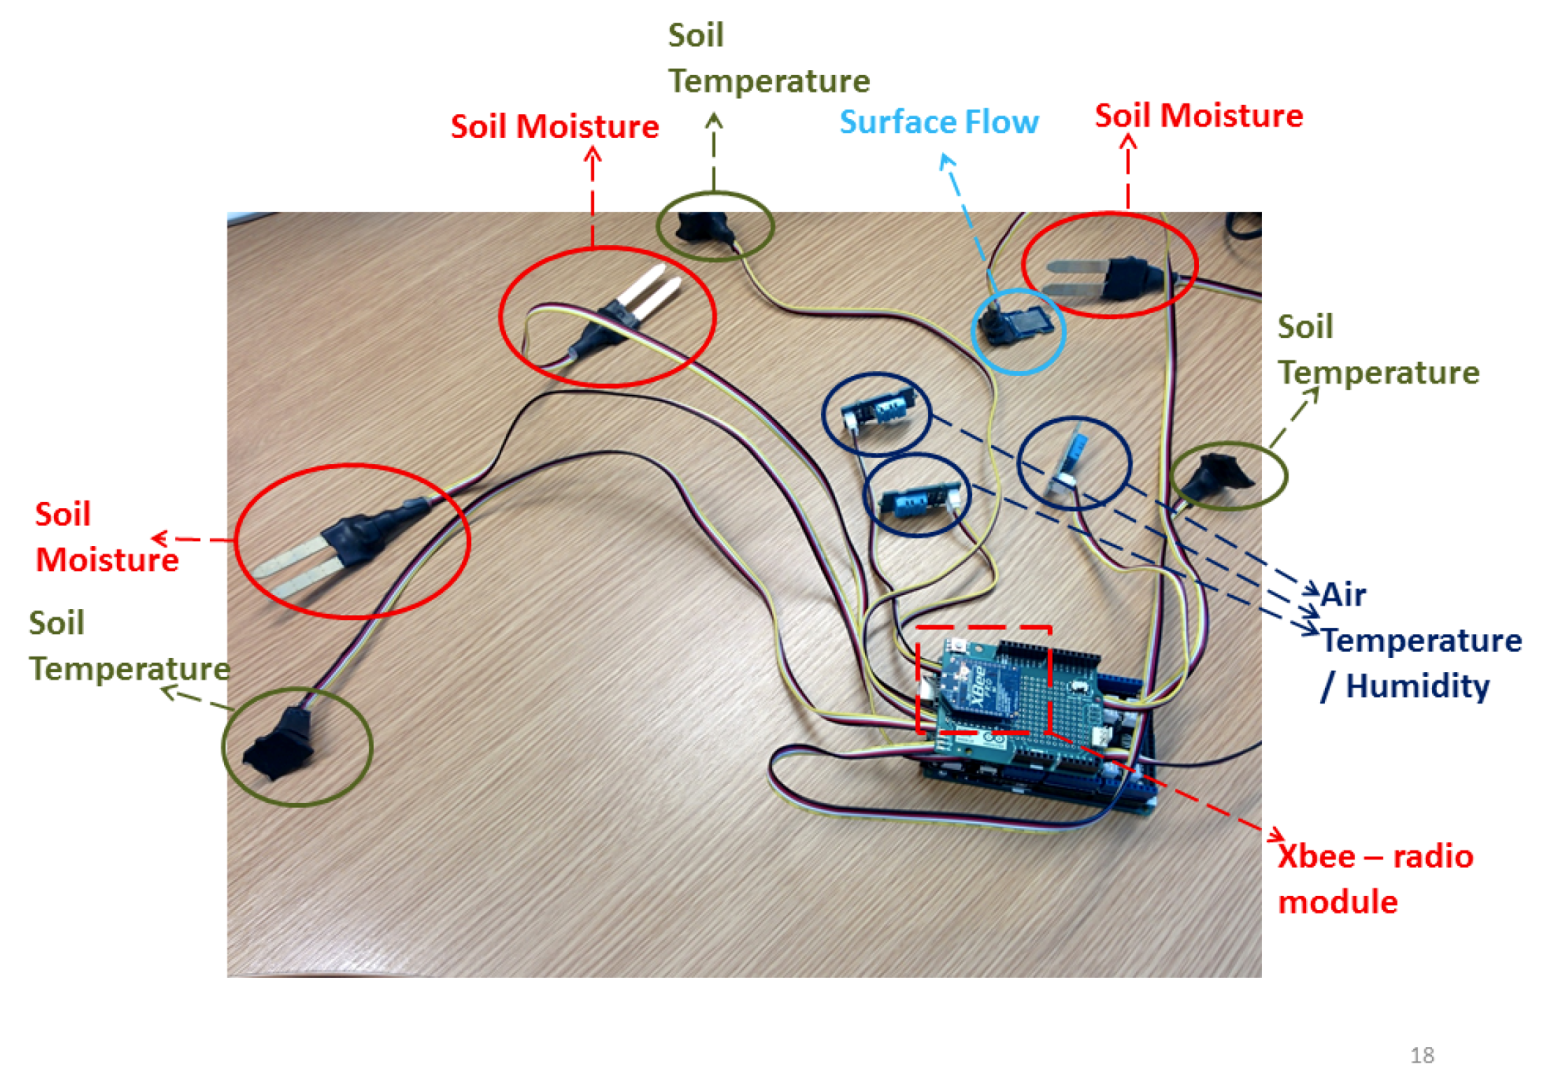
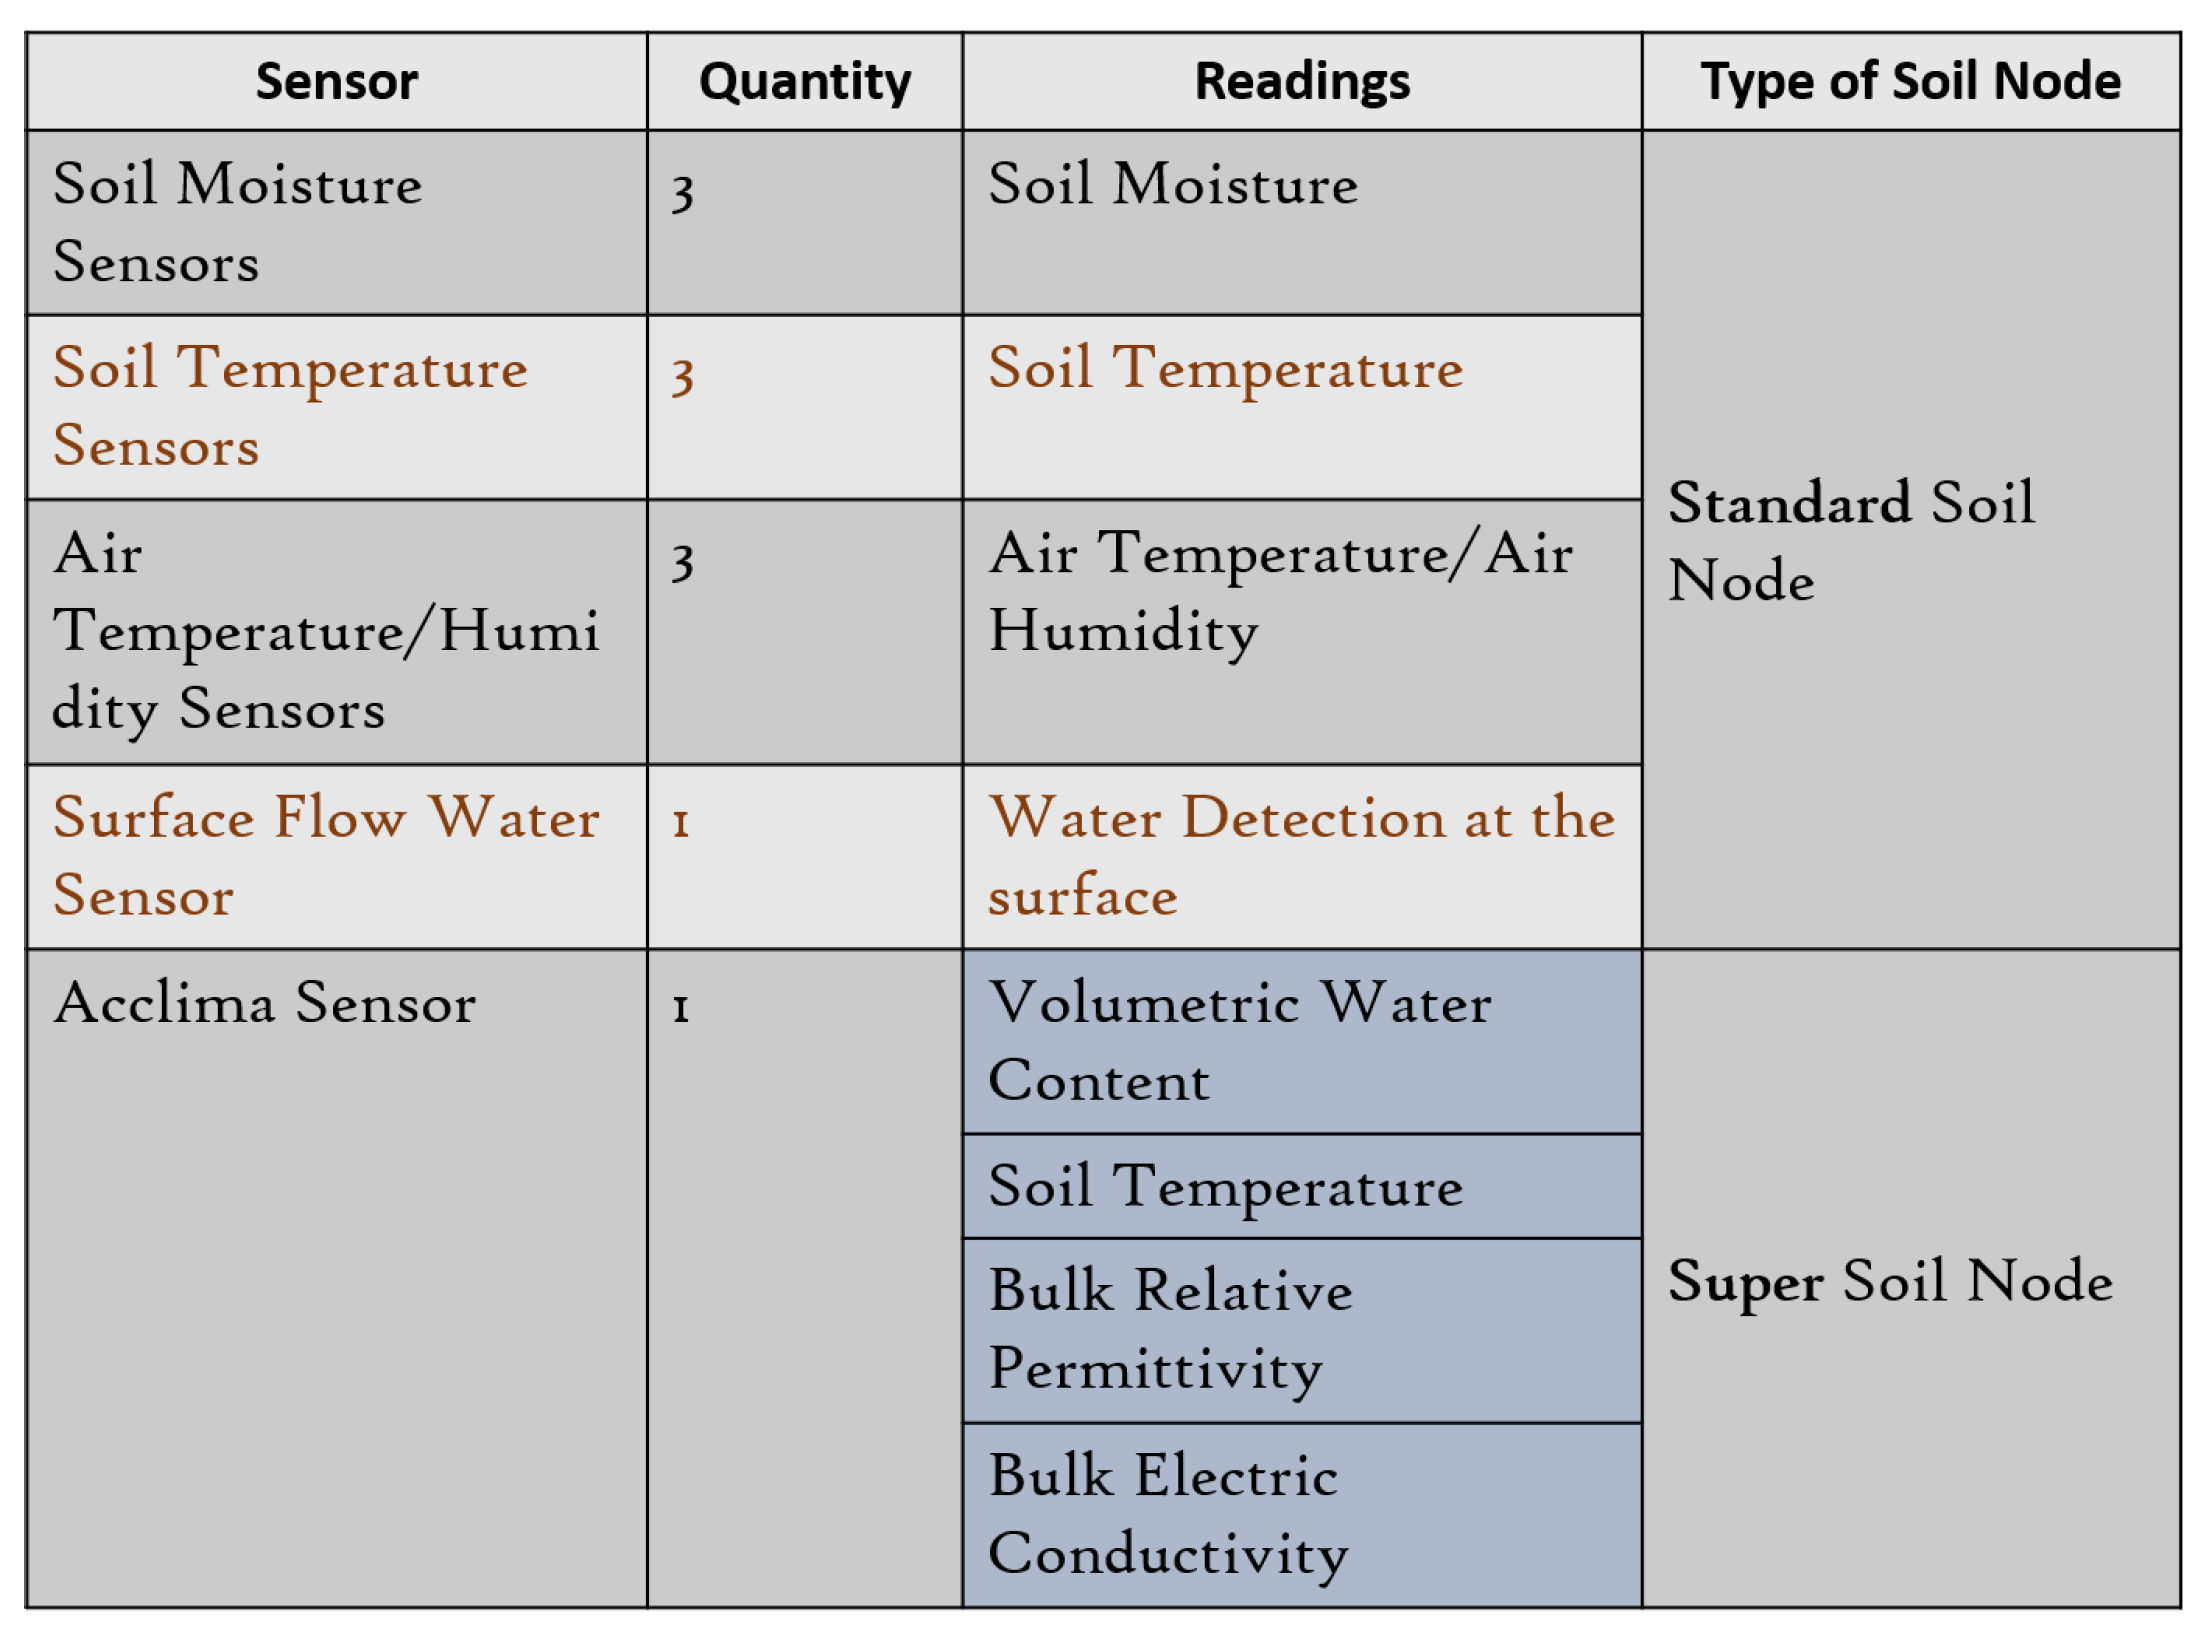
5.1. Design of the Soil Node
The basic enclosures were sufficient to exclude rain from the relay and soil nodes. There was some difficulty in excluding heavy rain from the hardware during soil node battery changes, which could be resolved with an external battery connected via a waterproof connector, avoiding the need to open the housing of the IoT node itself. Additionally, soil nodes near to the watercourse, in particular, were damaged by water ingress when submerged by flooding.
5.2. Design of the Animal Tracking Node
This node performed well and was unaffected by rain issues, though some build-up of condensation inside the node housing was observed, likely a particular problem as these nodes were in prolonged contact with warm animals and an unusually cold and wet environment. Reports from the local farmers indicated that the sheep to which the nodes were attached appeared behaviourally unaffected by the deployment.
5.3. Battery Usage (Interval for Changing Batteries)
The runtime of all of the nodes was shorter than anticipated, requiring attendance at the field site at 5-day intervals by the environmental science team to attend to nodes which had ceased reporting. We consider four reasons for this: (1) Additional consumption of power by the attached sensors may have been greater than estimated. (2) The 3.6-V battery packs connected in series, each include an internal circuit protecting against over-charge and discharge. Any discrepancy in charge between the packs comprising a unit would result in one component pack reaching upper/lower protection thresholds ahead of others, interrupting the circuit for all component packs. With this experience, we consider that 12-V, deep-cycle, sealed lead acid batteries would offer a more cost-effective and suitable power source despite a somewhat larger and heavier format. These could be connected externally and maintained by a solar panel depending on node situation. (3) Later in the project, we detected a problem with the sleep/wake cycle of the XBee, which resulted in nodes ceasing to report and which may have been mistaken for a discharged battery. The frequency of this occurrence during field deployment is not clear, but in hindsight, the observation that nodes could often be restarted by cycling the power rather than replacing the battery, and observation that a healthy voltage was often measured in batteries recovered for charging suggests that this error may account for a significant number of early drop-outs. (4) Exceptionally poor weather limited solar recharge effectiveness across the deployment. In addition, we note that we were never able to operate the accelerometers on the animal tracker nodes as the volume of radio traffic generated was too high a drain on their batteries. Independent trials suggested that on-node classification algorithms could have been used to process data locally before sending a simple summary status of the animal such as “standing”, “sleeping”, etc. As a general comment on our platform, we found that the Arduino hardware that we chosen had a surprisingly high power draw even in sleep mode; a modified solution that uses a low-power micro-controller to wake up the main Arduino chip when needed could have significantly helped with this but was beyond our capability to implement in the time constraints that we had.
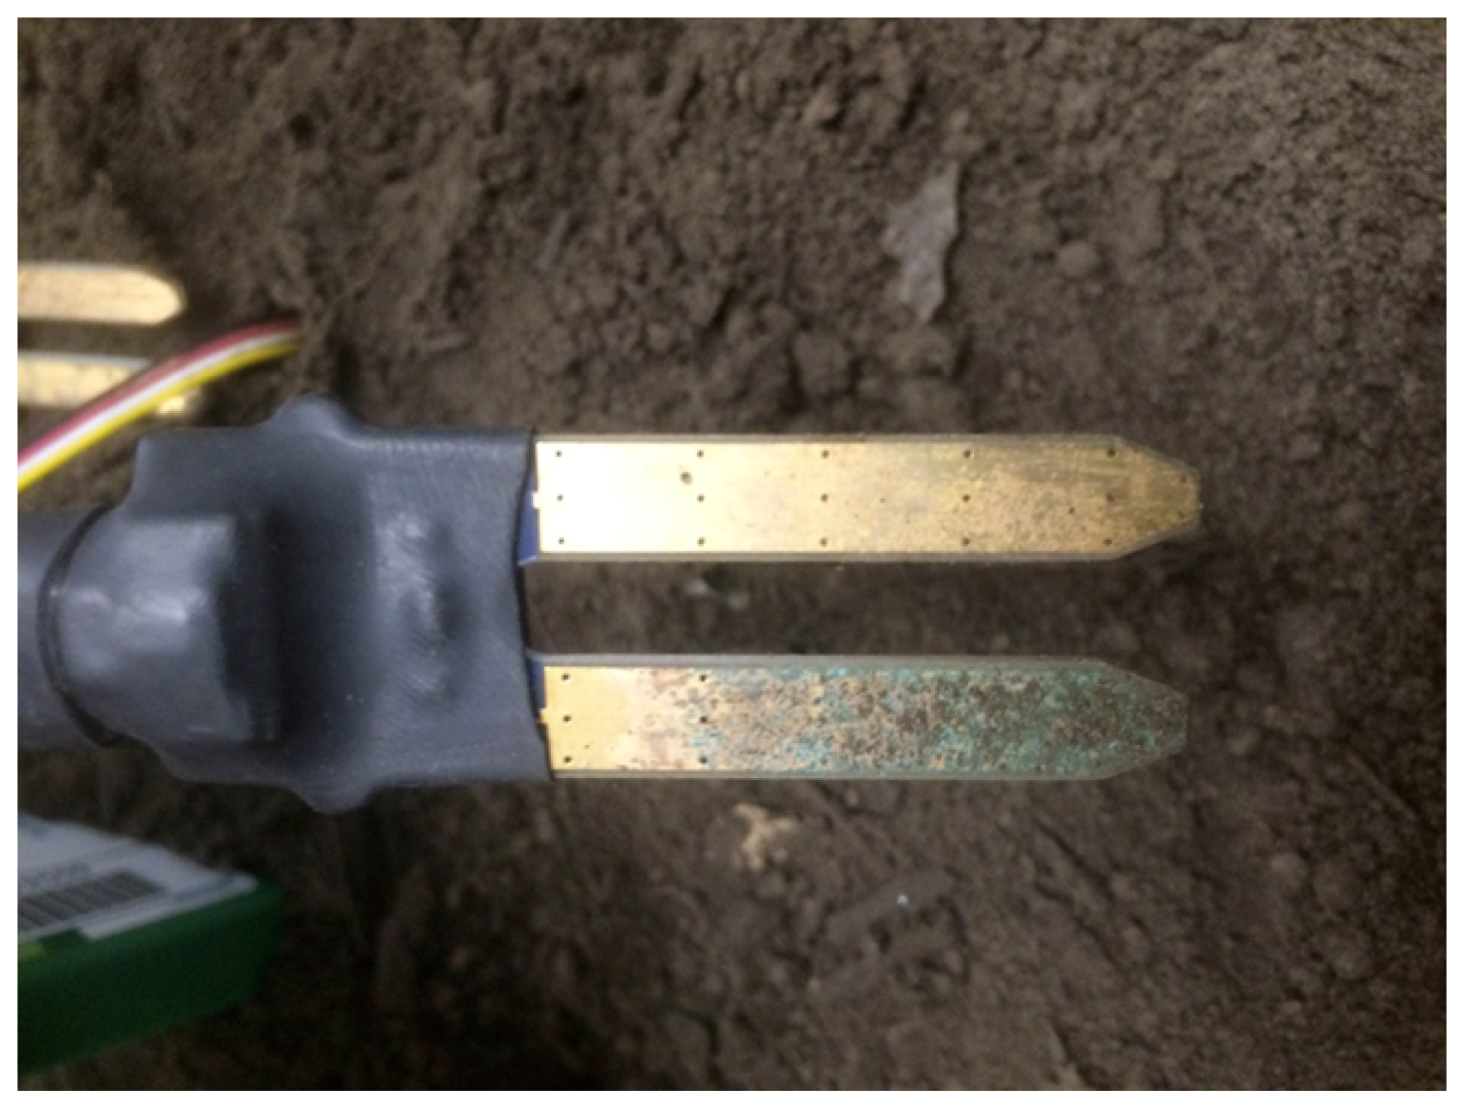
An early guide from the environmental science team indicated a desire to try using a large number of cheap sensors rather than fewer more expensive sensors. The motivation behind this was to reduce deployment cost, sacrificing data quality for quantity in some cases, while still maintaining selected high-quality sensors in the field as calibration points. For our particular deployment conditions (particularly the extreme weather), this does not appear to have paid off, with a high frequency of anomalies in sensor data being apparent. For the prototype overland flow detector and the air temperature/humidity sensors, problems with the constructed housings are likely to have contributed to anomalous data. Overland flow detectors are not commercially available due to difficulties in designing a reliable instrument, and our prototype suffered problems with false positives due to internal condensation and blocked drainage. Subsequently the Grove water sensor, incorporated to detect the presence of water in the channel, became corroded due to the relatively cheap copper alloy used in its construction. Research-grade air temperature and humidity sensors are usually enclosed in radiation shields to minimise heating by solar radiation and direct exposure to precipitation. These may be passively or actively aspirated. These shields cost much more than our chosen sensors. We used white plastic cups as shields which excluded precipitation but were not vented and may have trapped heat and condensation. The Grove soil moisture sensors also generated anomalous data due to the same copper corrosion noted above; while we were able to protect the control circuitry, we could not defend against electrolytic corrosion of the moisture probes.
Figure 15 shows a corroded Grove soil moisture sensor. We stress that the Grove soil moisture sensors are not intended for this kind of “heavy duty” use with long-term submersion in standing water—had the weather been closer to general trends for this time of year, we would likely have had less problems in corrosion as most locations in the field of study are less moist.
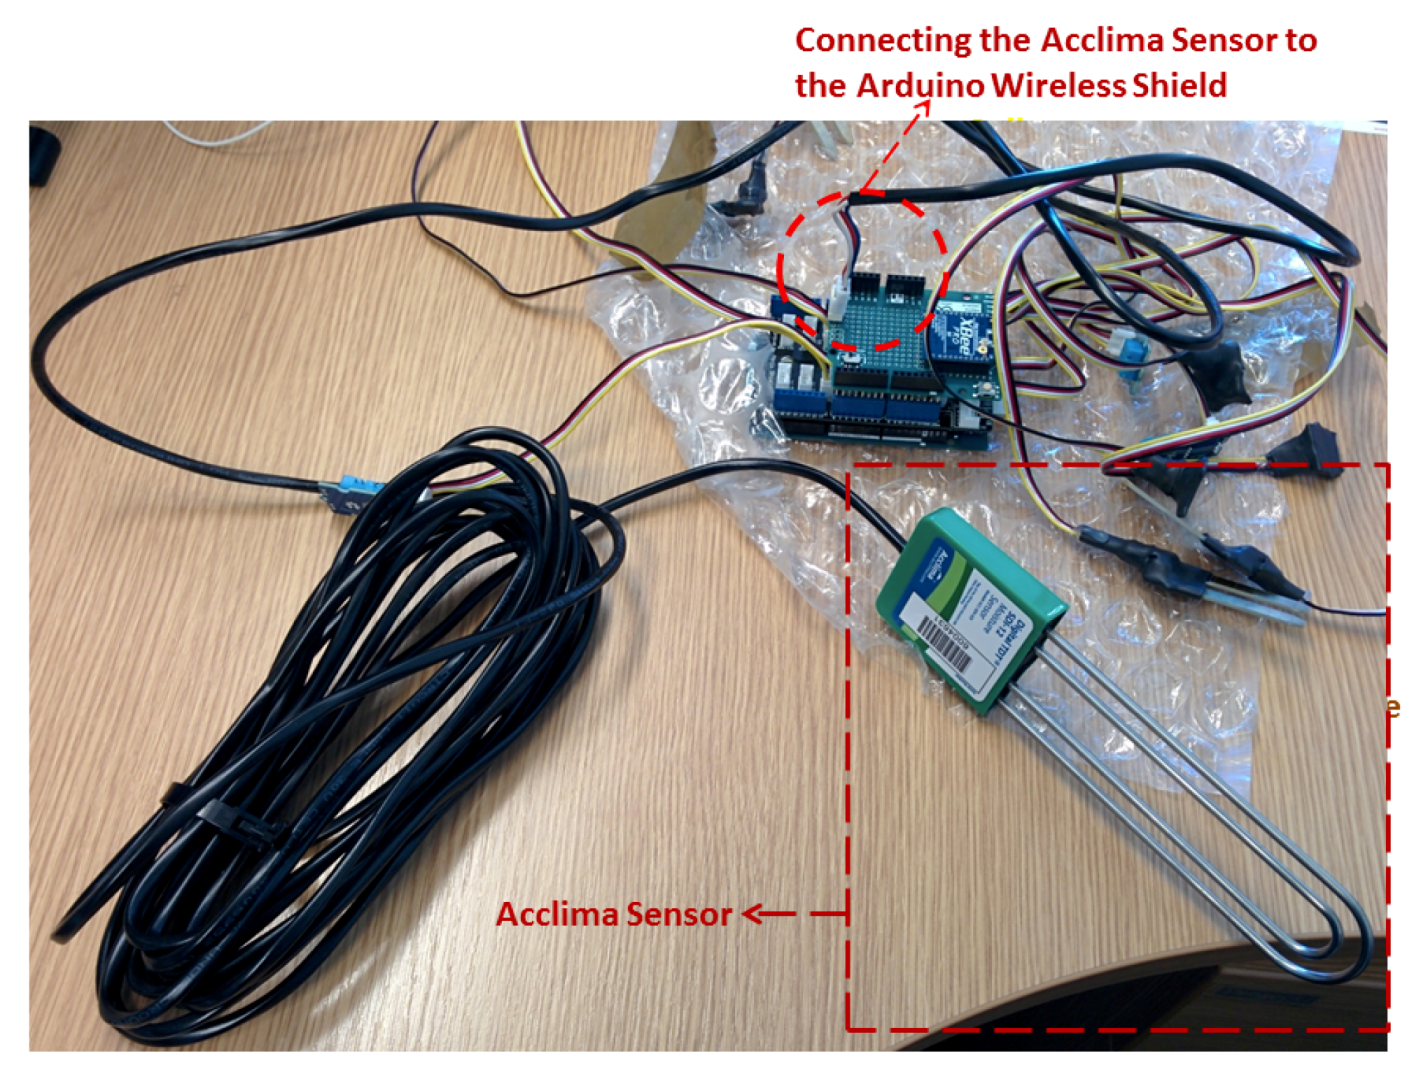
5.4. Calibration of the Sensors (Grove vs. Acclima)
As we had collected a significant volume of data from the deployment, at the end of the field deployment period, we devised a lab-based experiment to seek a calibration of the Grove Soil Moisture sensor data against that of an Acclima TDT. We powered 4x nodes at a constant 12 V using a laboratory power supply. We attached Acclima TDT sensors to the nodes and assigned each node to one of four 35-litre planters filled with topsoil. We installed the sensors as per the field deployment and placed the relay and gateway nearby. We then saturated the planters with water before drilling holes and leaving the planters to dry out to compare the drying curves revealed by the two soil moisture sensor types. This phase of our work (which is ongoing) was carried out without direct assistance from the computer science team and is a positive indication that we are able to reuse the field technology in different settings without expert knowledge. In the future, we hope to be able to redeploy the network in other fields of interest.
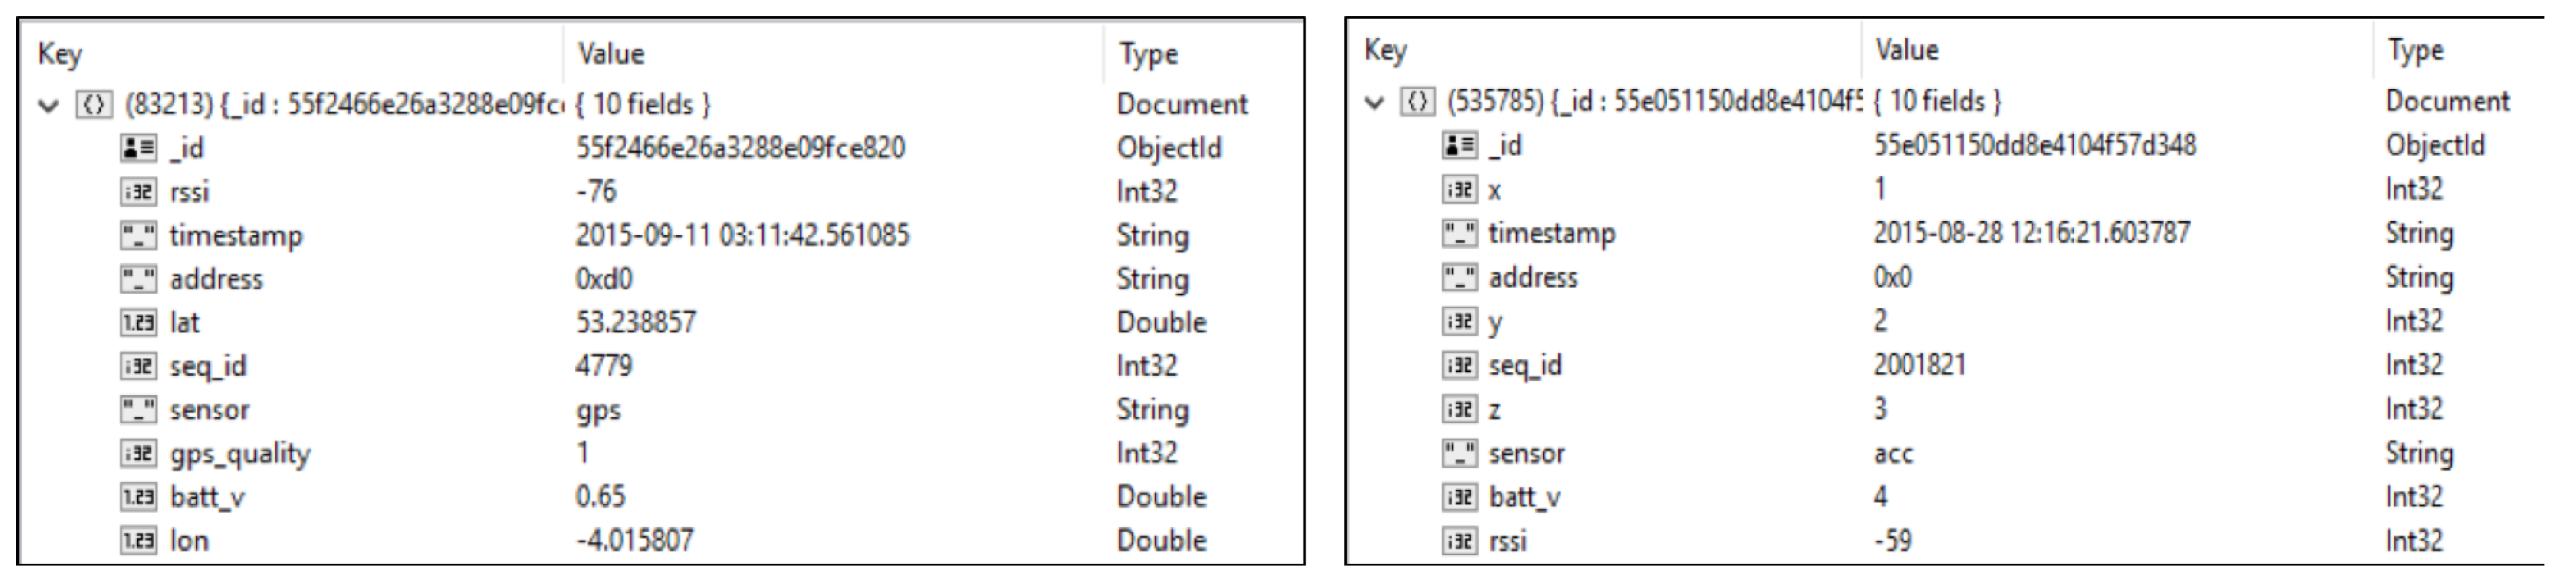
5.5. Data
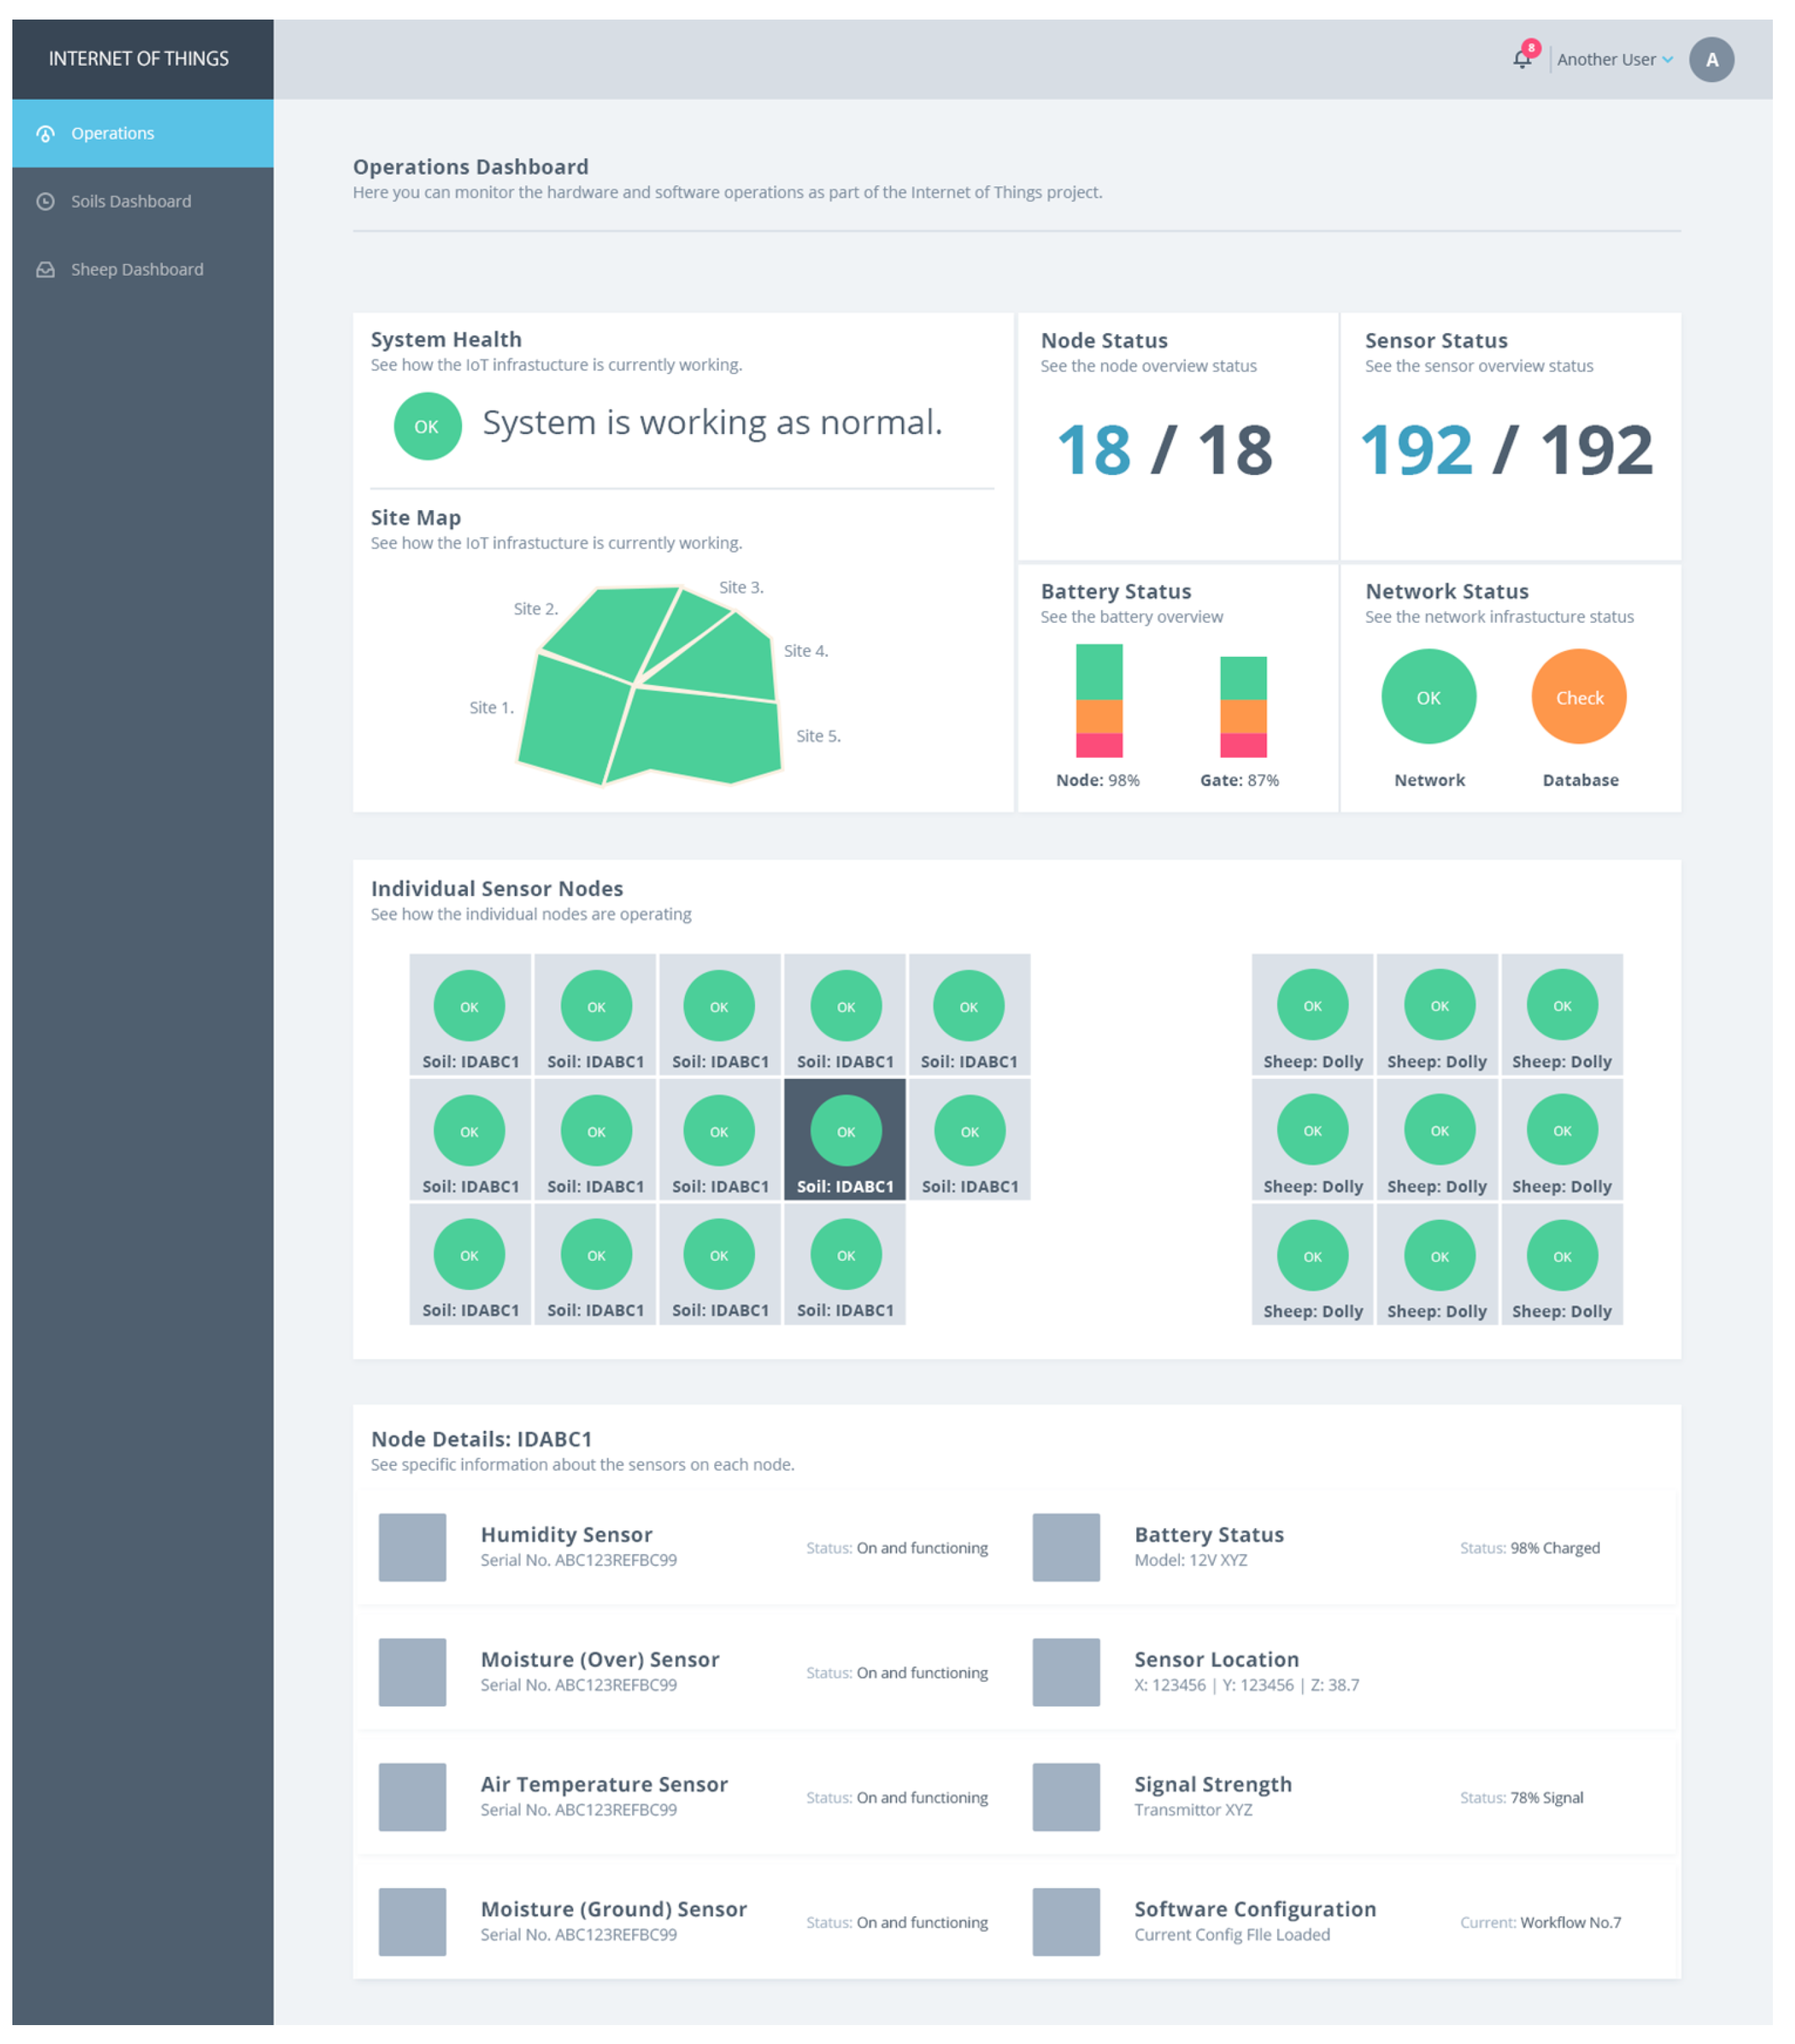
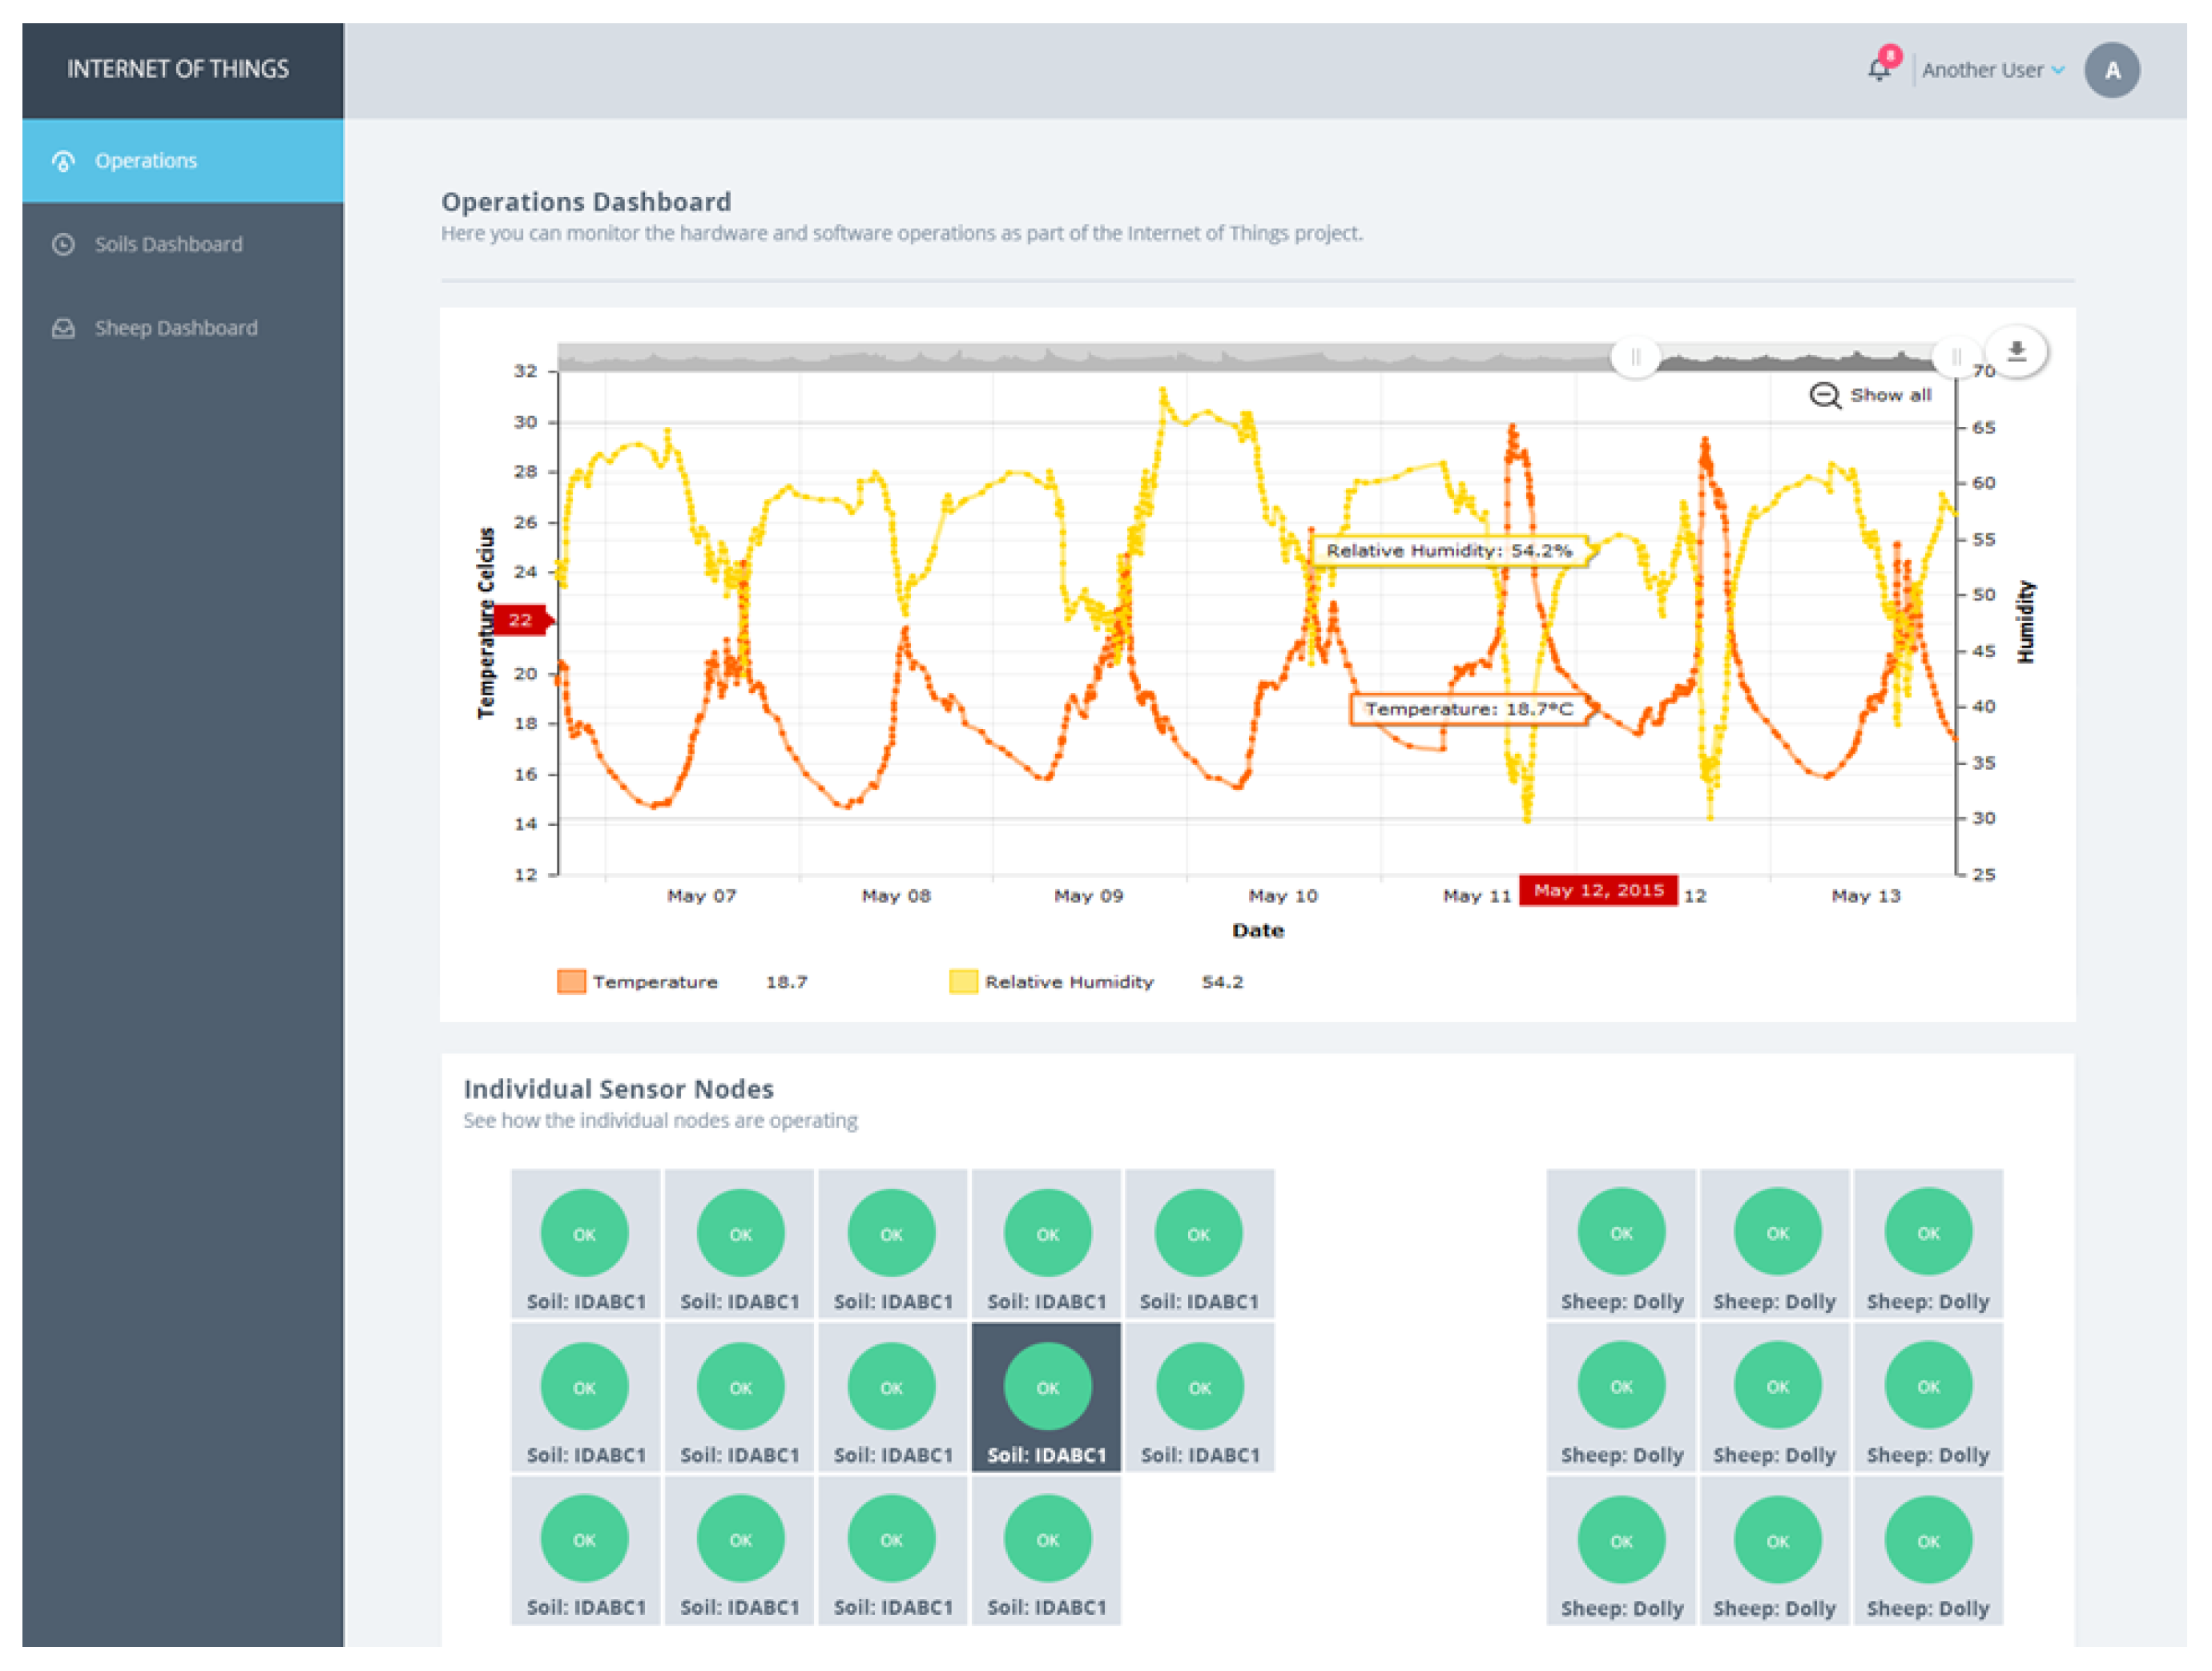
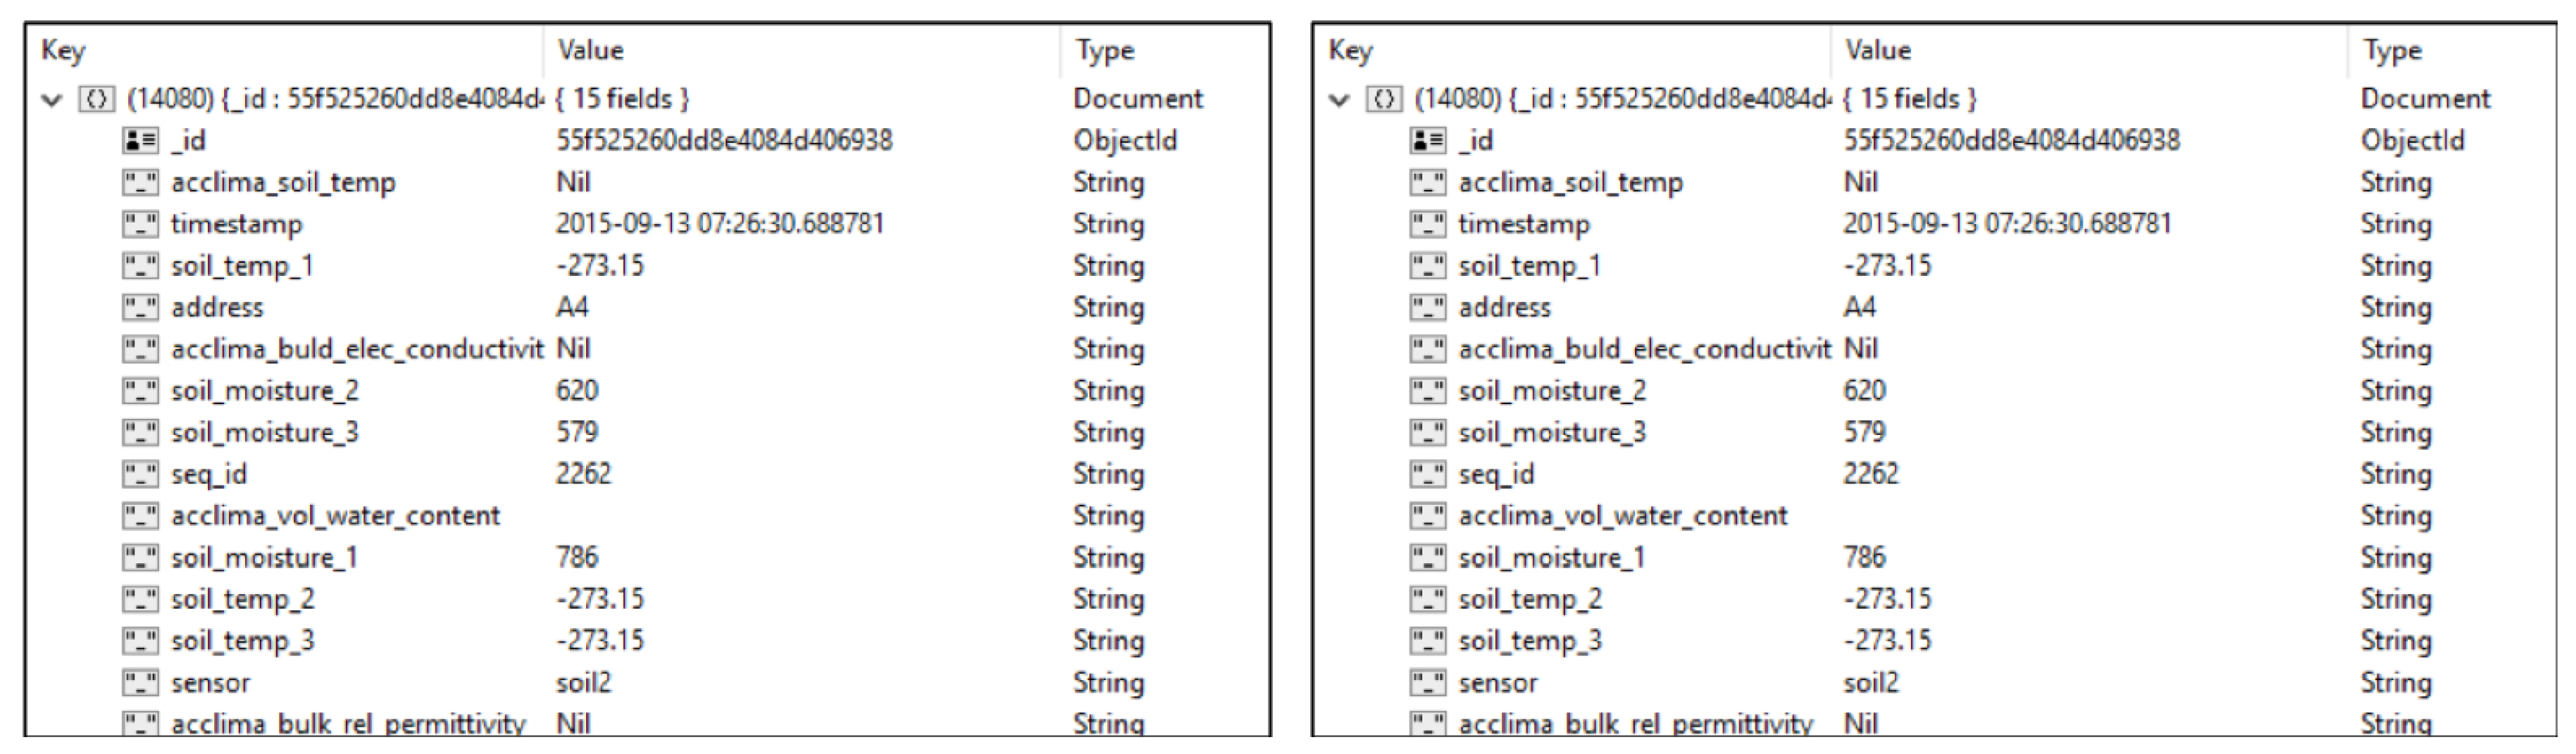
Figure 16 and
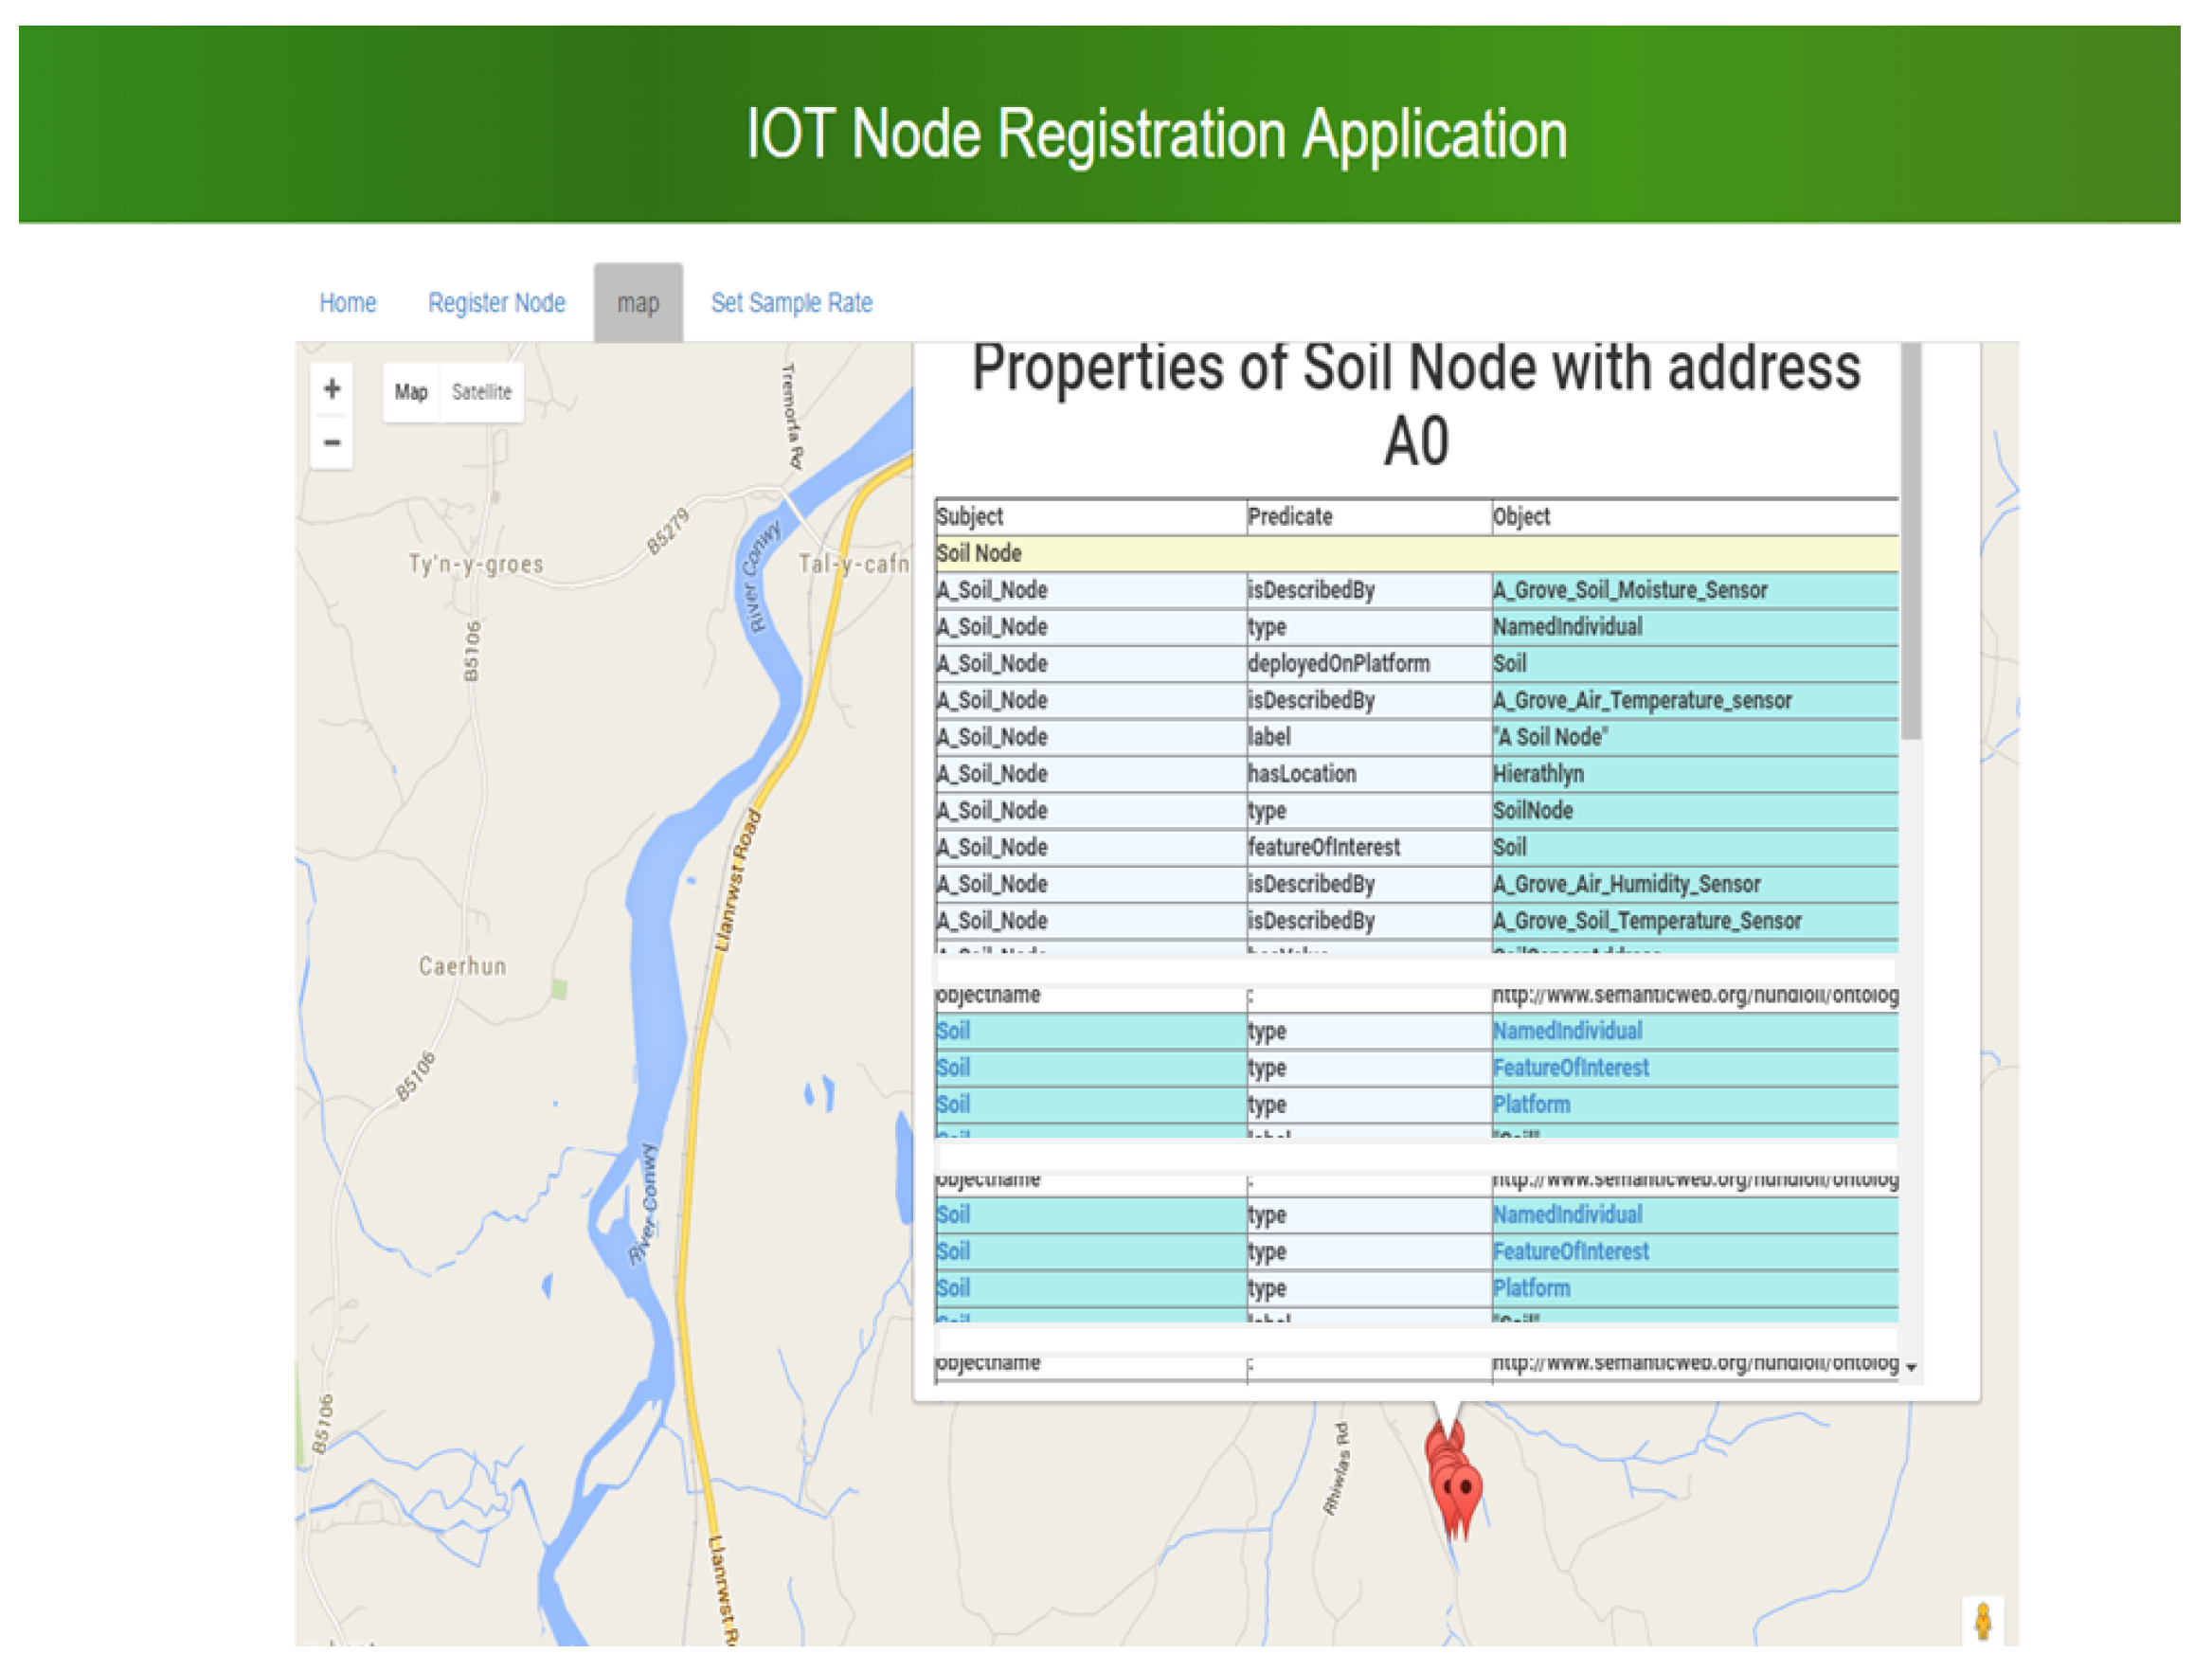
Figure 17 respectively show the type of data gathered from the soil sensor nodes and the animal trackers. The soil nodes sense the environmental parameters such as soil moisture, soil temperature, humidity, air temperature, etc., whilst the animal tracker reports the location of the animal and accelerometer data. On the other hand,
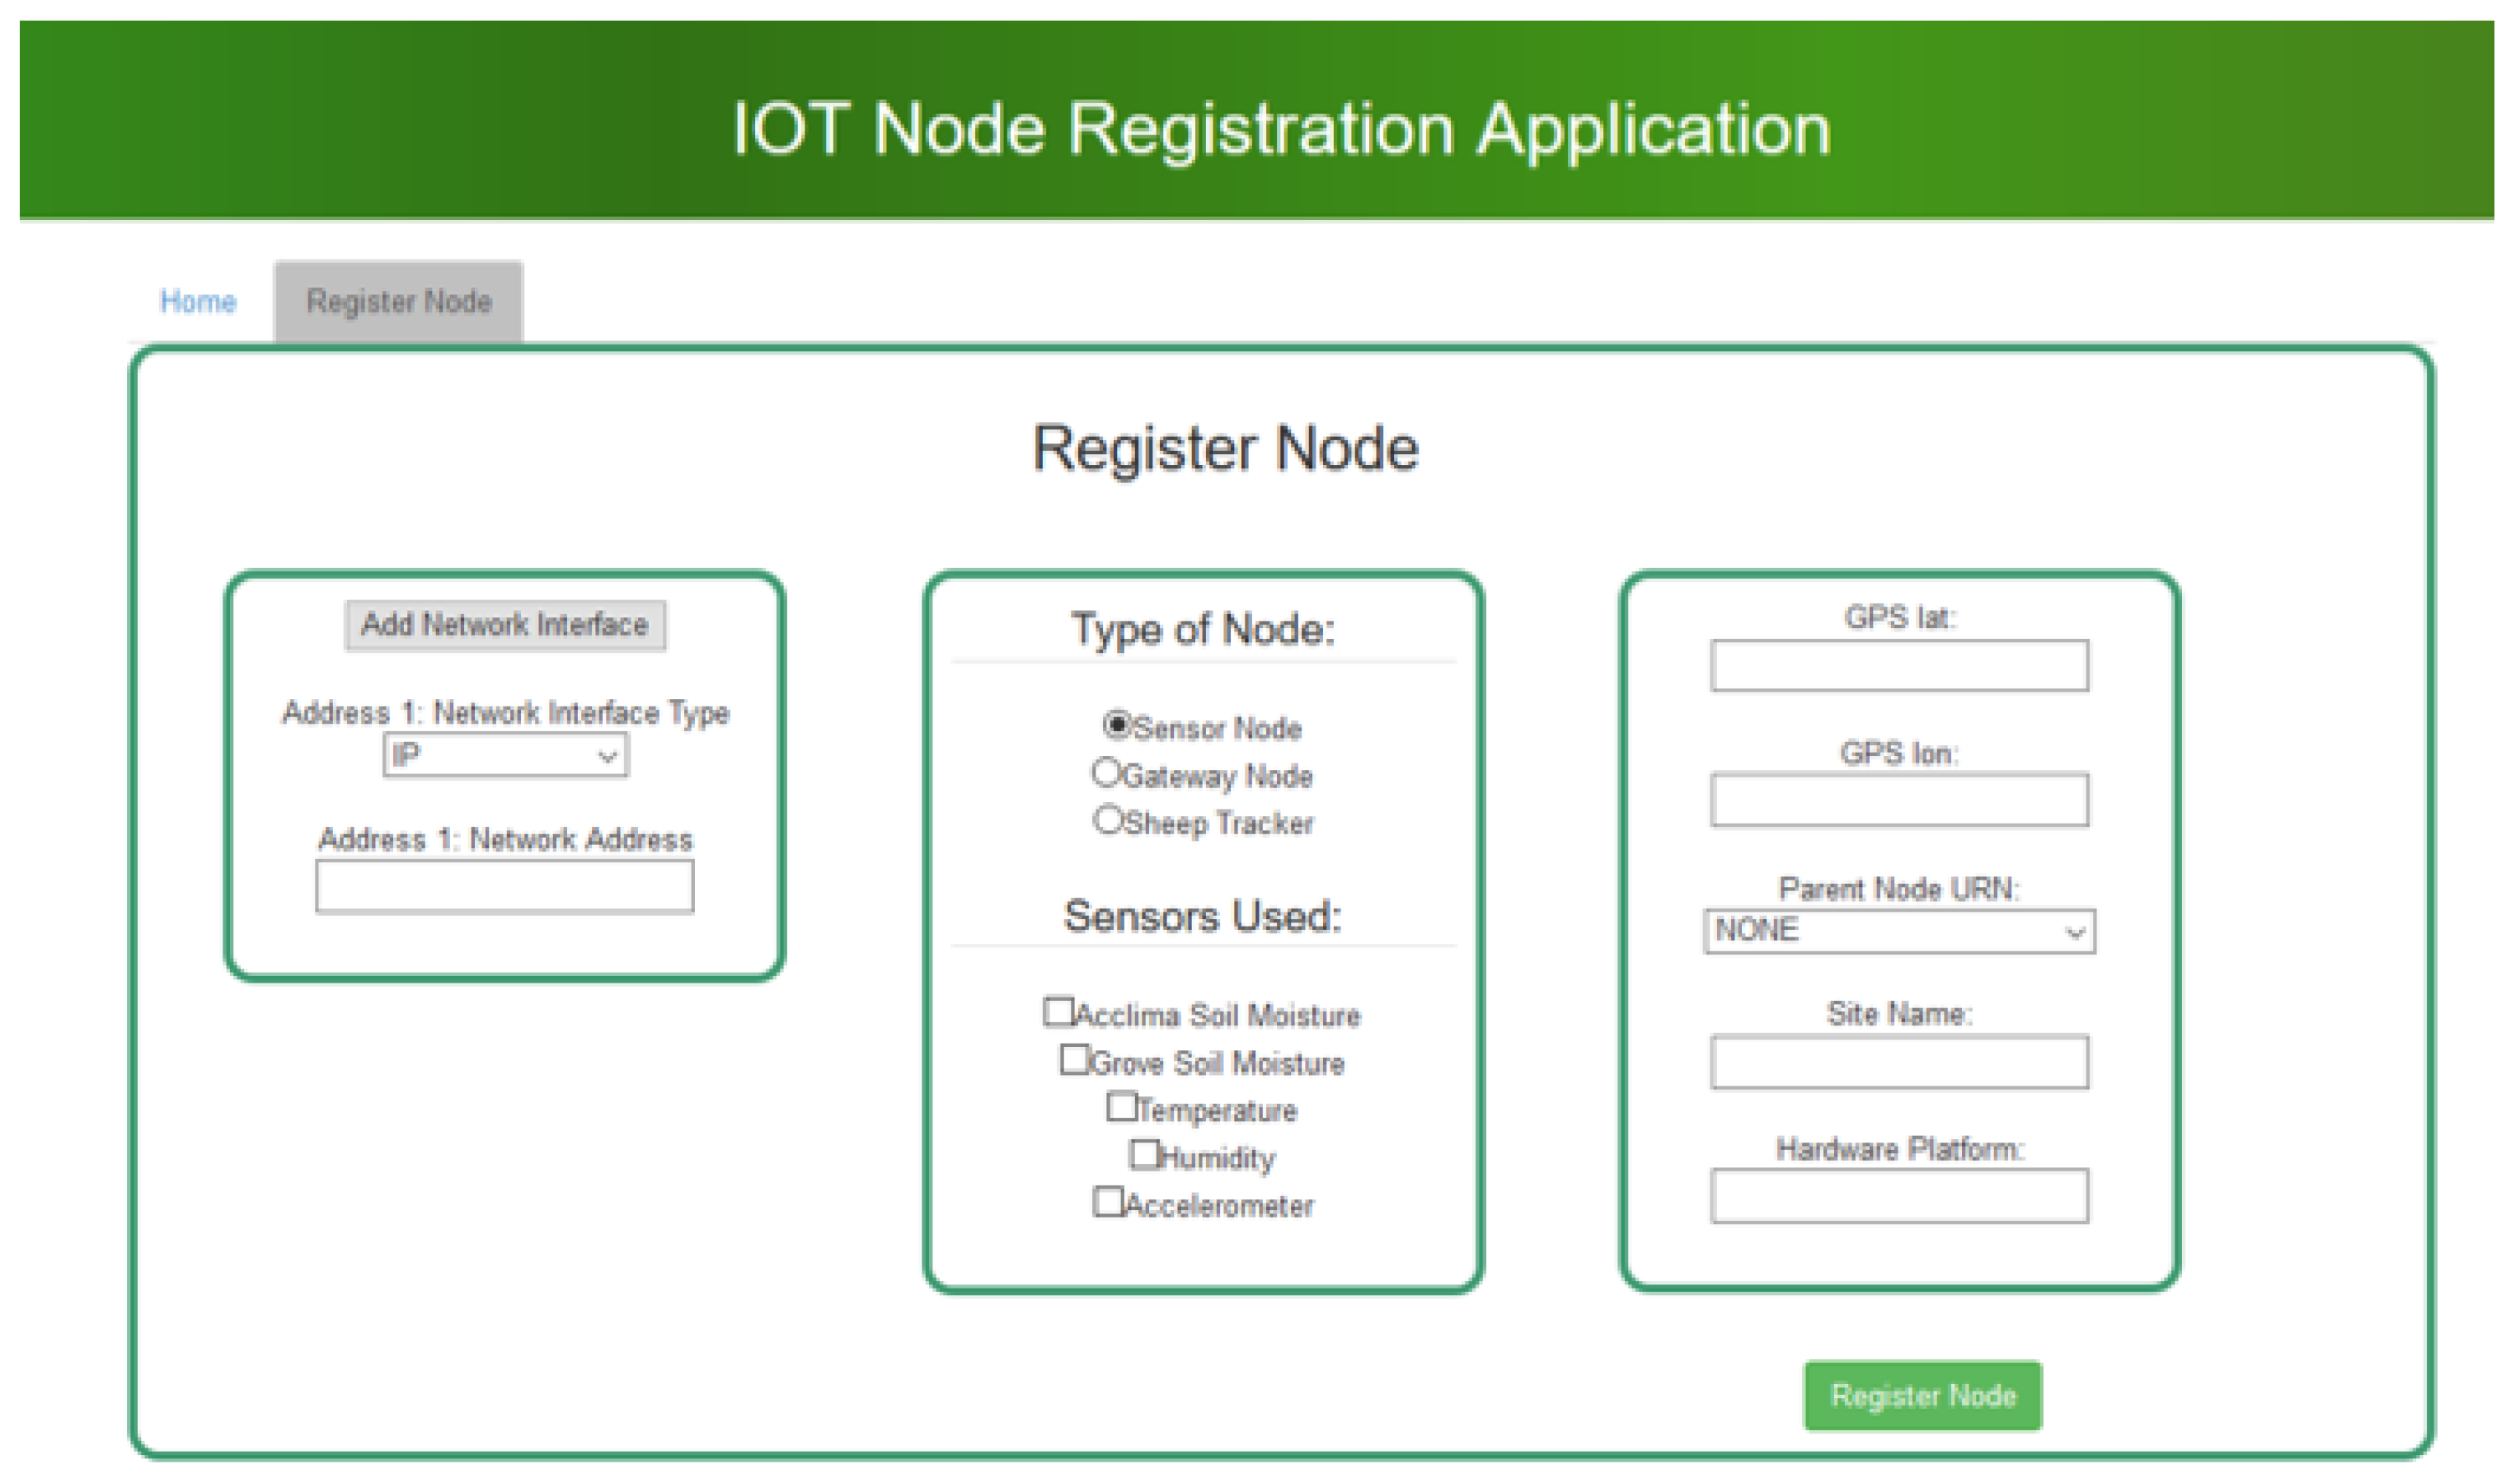
Figure 18 shows an example of a semantic application using the IoT data. The application reports nodes that have been deployed in the field, and upon a click of one such node, it opens up a dialog showing not only the reading at this given node (as shown in
Figure 16 and
Figure 17) but also the provenance information of this node such as the location, the types of sensors found on this particular node, etc.
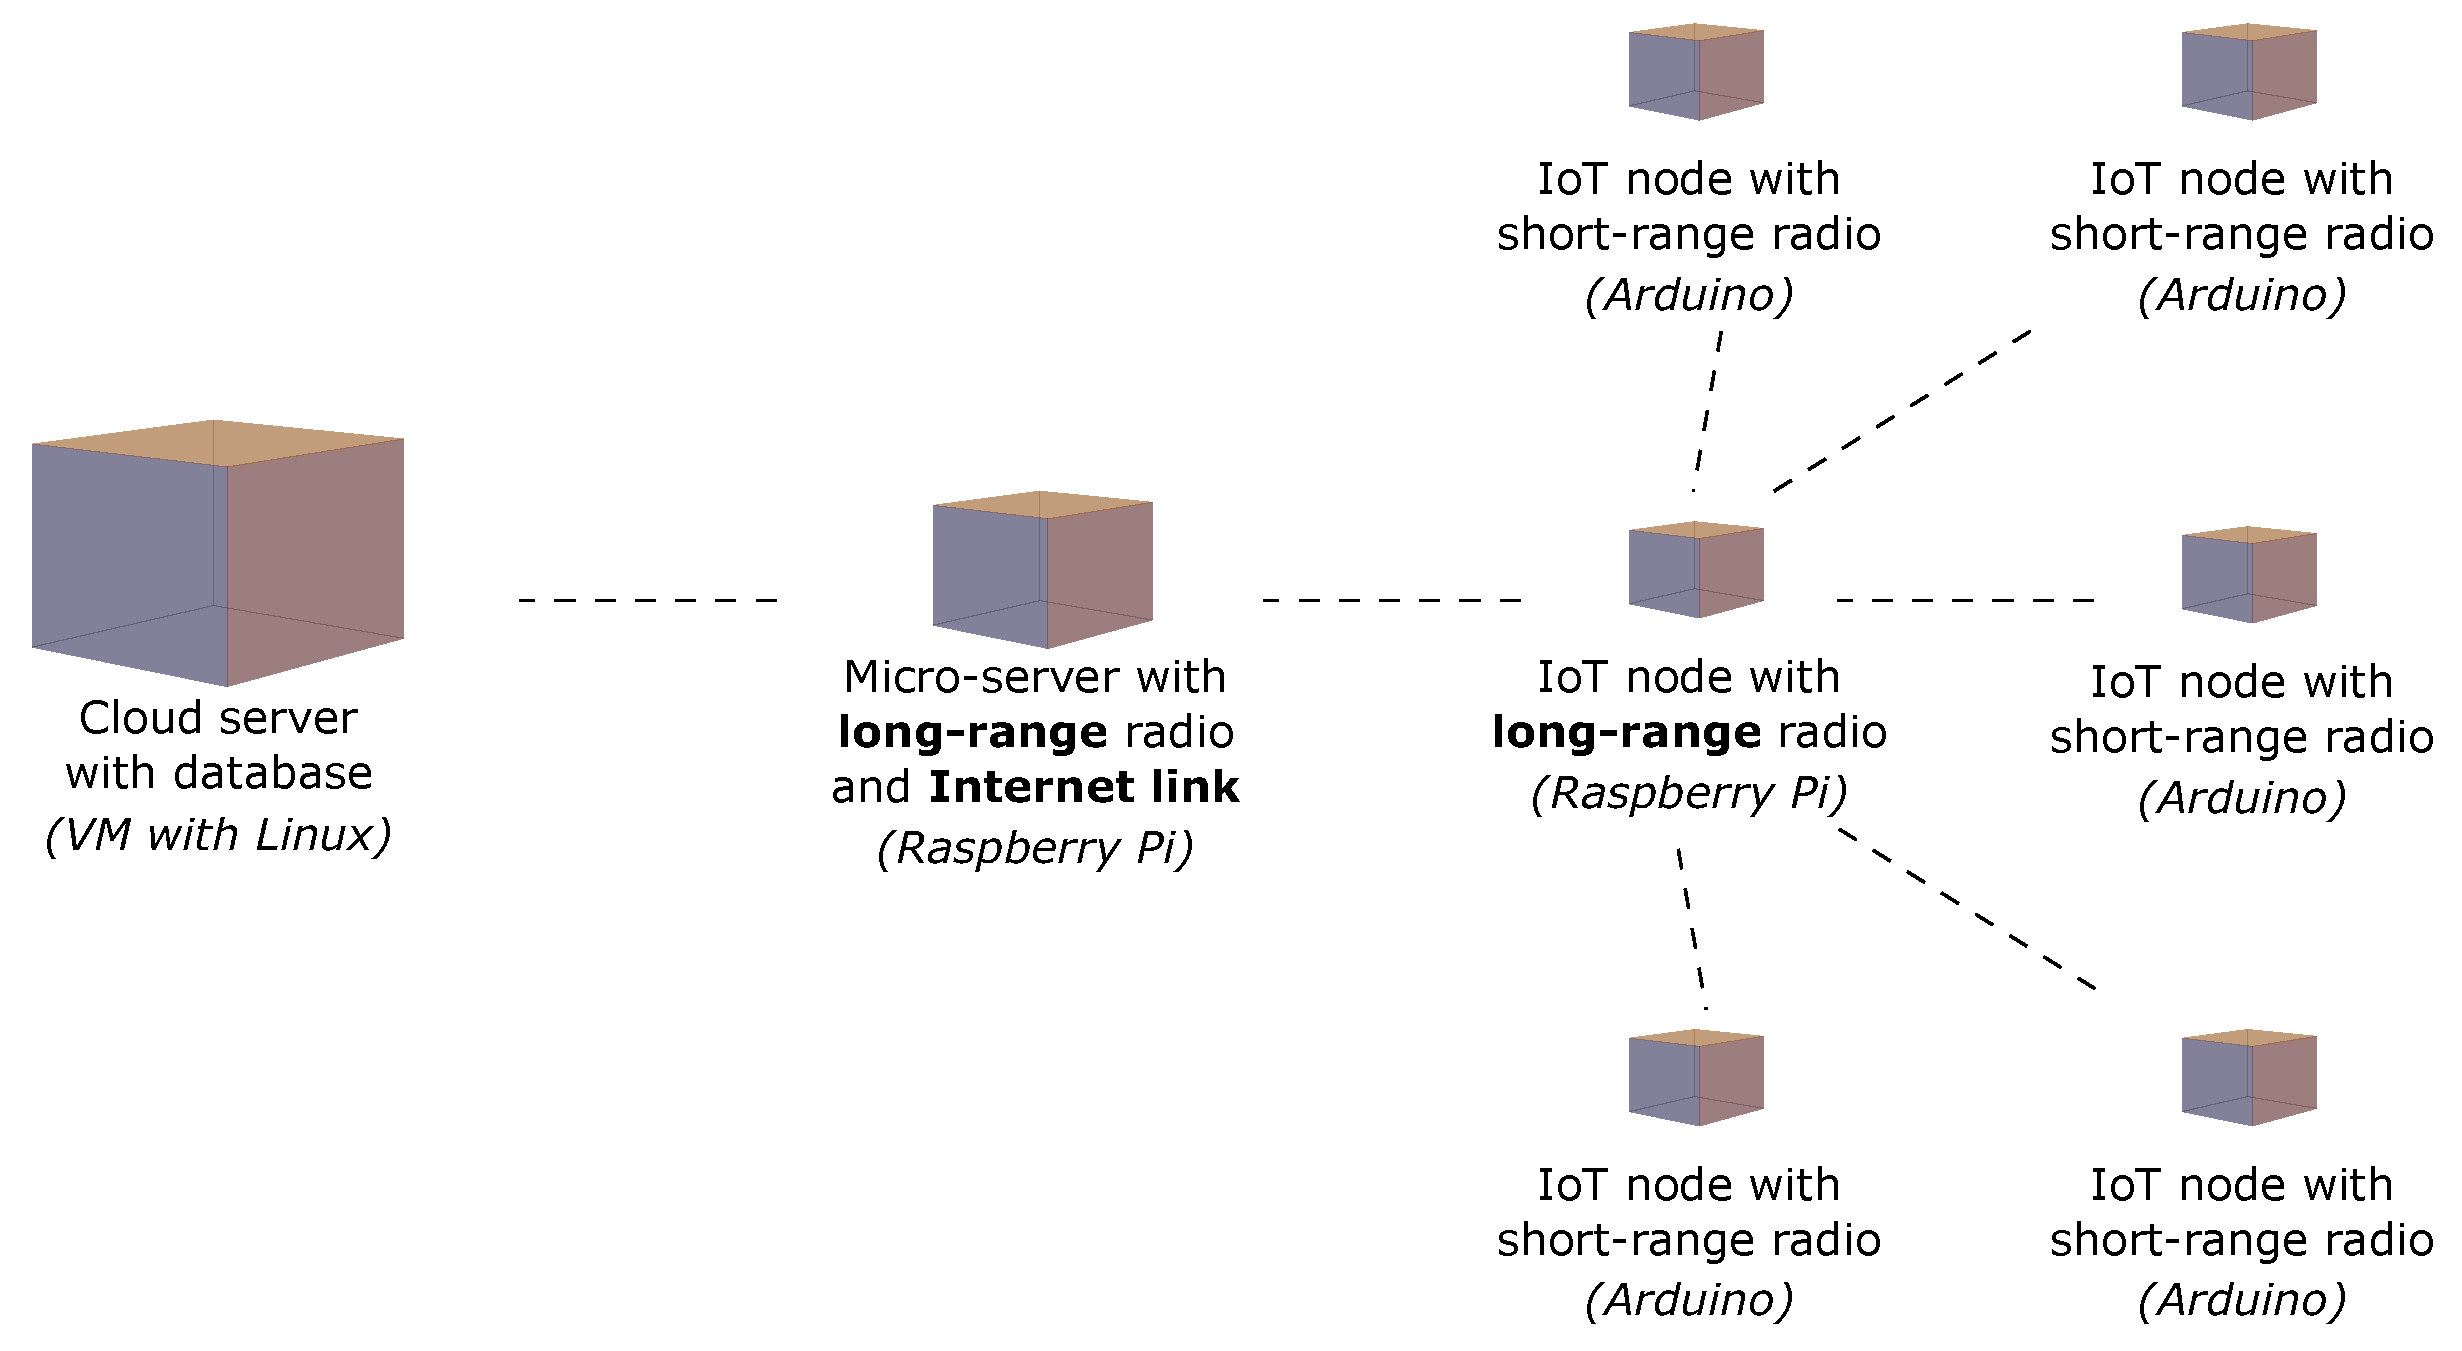
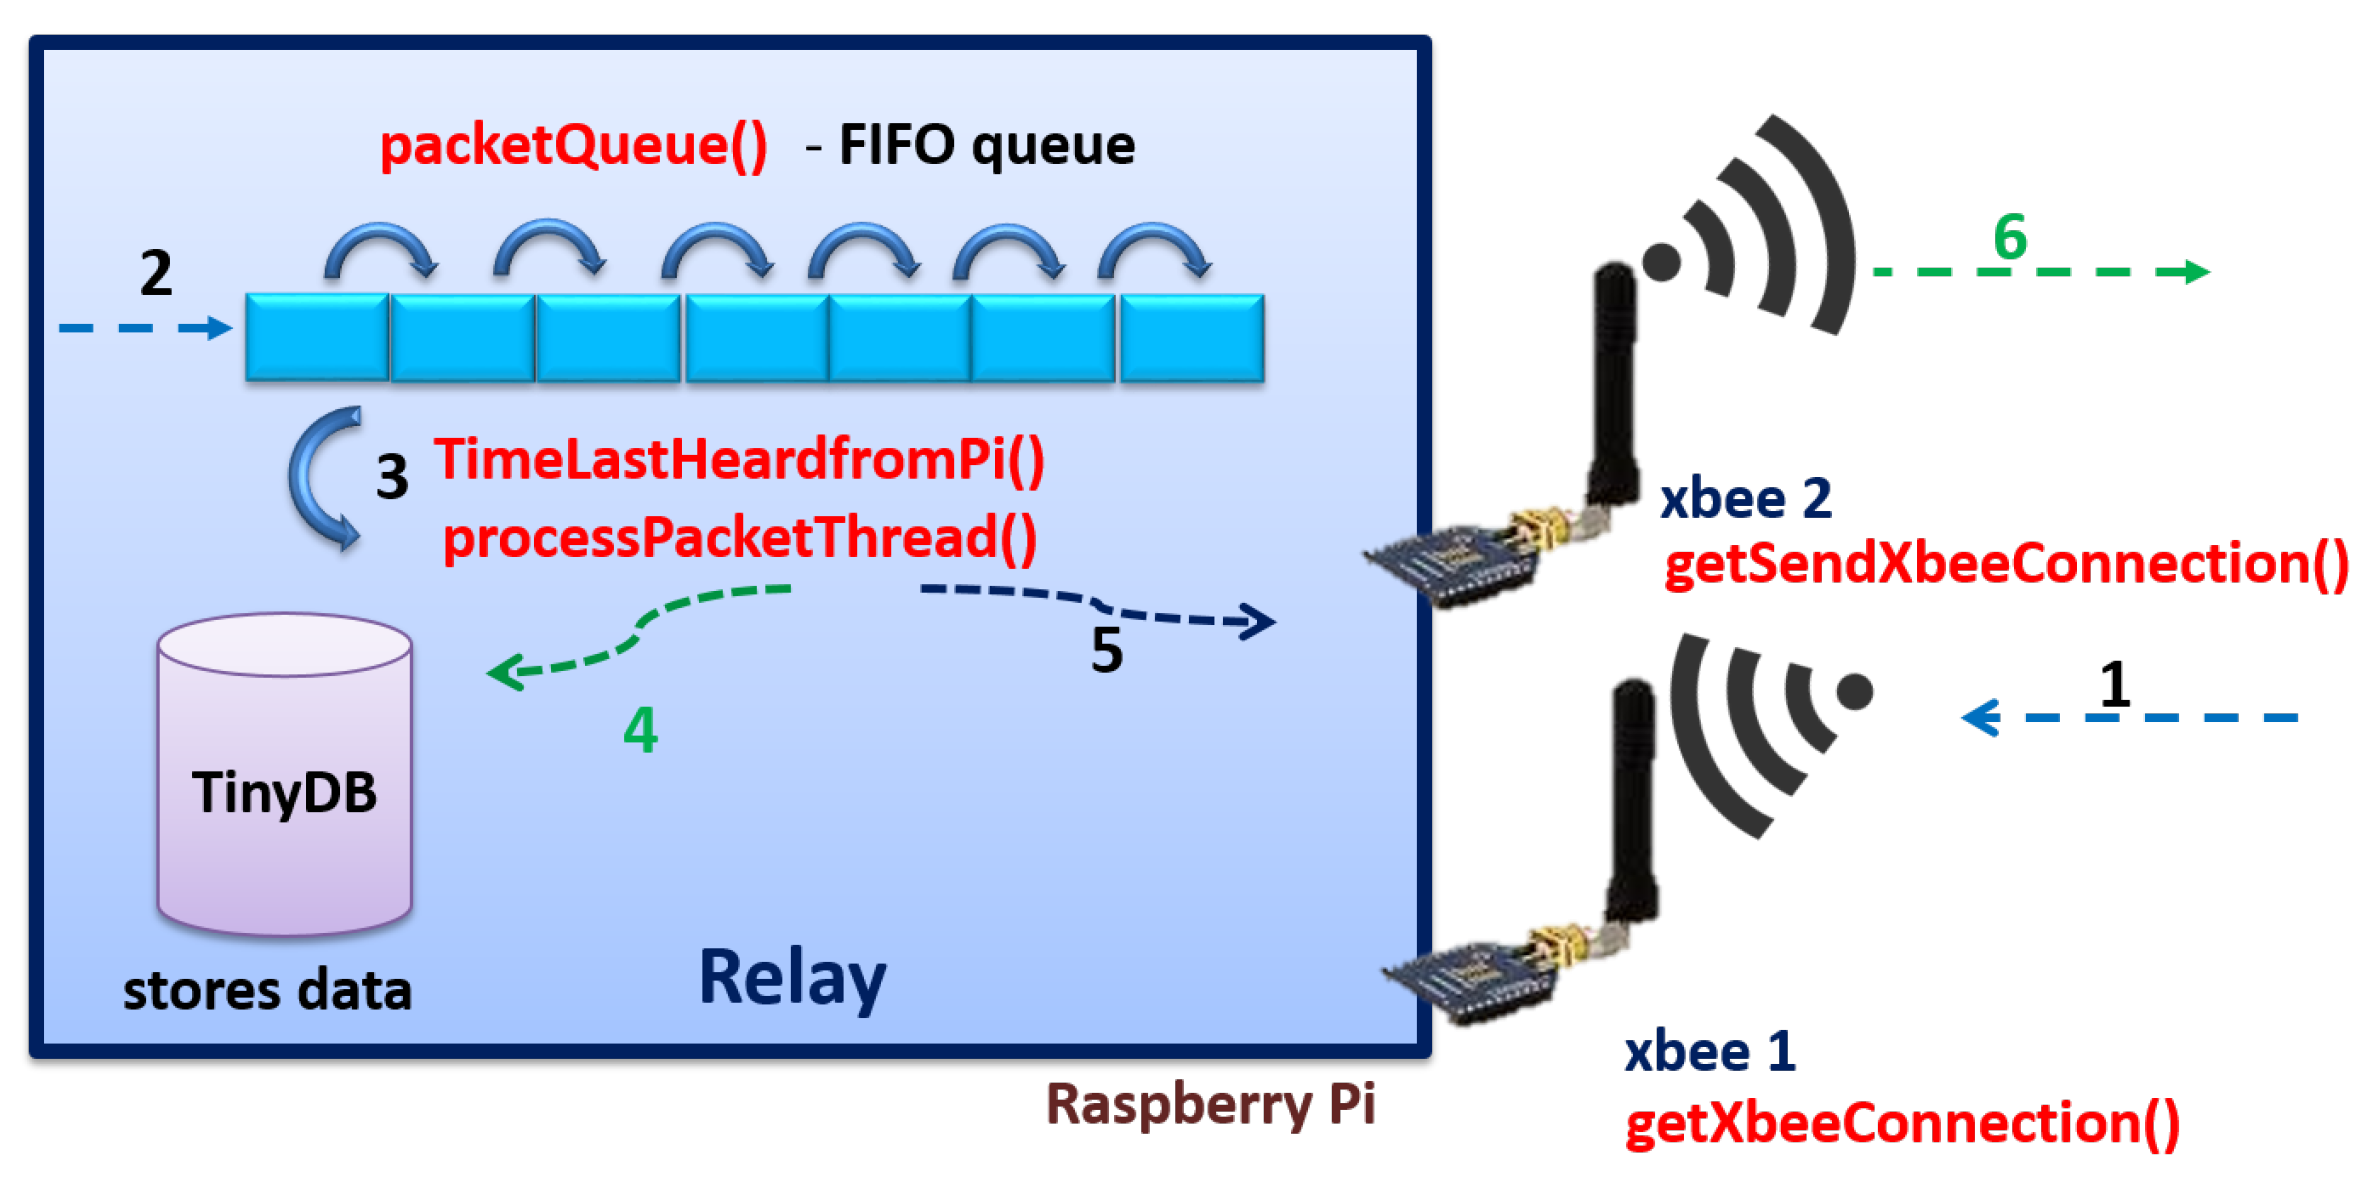
5.6. Simple Network Design
Our final network design was effectively a simple star network with one long-range hop to the Internet gateway. This was the result of significant field testing of a range of radio technology at the deployment site. Our initial plan was to make use of a multi-hop data collection protocol, as is common in the literature, but field testing indicated that this would not be required. In fact, we observed extremely good levels of point-to-point connectivity across long distances with treelines and other obstacles between nodes. As an anecdotal example of this, one of our nodes was transported in an off-road vehicle to a distant location for range testing; this node remained in contact with our base station for the entire journey despite being inside an enclosed steel vehicle. As a result, we adopted our current simple network design with one node sitting at the top of the hill in the field of study, acting as a relay for all other nodes in the field. The relay then sends its data to a gateway node which sits in the barn at the site. This is, in reality, a very common architecture for IoT deployments when working in the relative constraints of a real deployment at a remote location, where mains-powered sites are very limited. The logic here is that, instead of relying on redundancy, we rely on design heuristics in which the long-range node is sited at a“safe location" and is built from more reliable components relative to the end nodes. As long as these properties are true, this gives the long-range node significantly more reliability than each of the end-nodes and so failover support is less of a concern. In our case, the characteristics of the long-range node’s location were (1) indoor, entirely sheltered from the environment, and (2) on a reliable mains power, avoiding reliance on batteries or energy harvesting; the node itself was a Raspberry Pi which is a mass-produced VLSI-style device with excellent reliability. These factors compensate for the lack of redundancy at a deployment location containing no other mains-powered locations besides the one that we used. If future deployments were to need a node dispersal over a larger physical radius (more than 2 km apart), a more complex network design may then be required—our most likely solution would be to adopt a design using further relay nodes as cluster-heads in more distant parts of the network, such that only the relays communicated over longer distances.
6. Discussion
This section provides a more high-level discussion of the contributions of the project, revisiting in particular the three key aspects of the project: the technological, scientific, and methodological aspects. We look at each area in turn, reflecting on the key contributions and insights in each area.
6.1. Technological Contributions
This project was by definition an “in the wild” deployment in a complex and remote area of North Wales, and this dictated a lot of the design choices. In addition, the work was in support of real scientific enquiry and hence had to provide a complete and comprehensive solution from a sensor to data portal. This resulted in a pragmatic and end-to-end architecture that achieves seamless integration across both Internet of Things and cloud domains. The pragmatism is most evident in the network architecture (as presented in
Section 4). For example, we initially planned to deploy a mesh network architecture for added coverage and resilience. With the range and effectiveness of the XBee Pro radios, this was however deemed unnecessary, and instead, we opted for the simpler point to point architecture, supplemented by the additional bridging nodes with long range radios (effectively better antennae). With careful placement of the bridging node(s), this solution proved successful. We also initially planned to achieve end-to-end integration through IP, as advocated by many researchers in the IoT community [
29,
30]. This however was not implemented, and instead, we opted for a more “systems-of-systems” architecture, reasoning about individual systems and the boundaries between them. This again proved to be a successful strategy and allowed us to optimise the protocols in the IoT deployment site for their particular purpose. The micro-server was then particularly important in acting as an Internet gateway in our systems-of-systems approach. Further investigation of systems-of-systems architectures is being carried out in the Dionasys project (
https://www.dionasys.eu/); and one of their publications is [
31].
The work highlighted the importance of a flexible and adaptive placement of computation in the resultant systems-of-systems approach. Our experiences indicate that it is far too simplistic to bring the data back to the cloud for processing, and this is particularly important in this domain. For example, in many circumstances, the data is rather static and predictable, but at times of extreme events, such as storms/heavy rainfall, the data then becomes critical to understand flooding behaviours of potential water quality issues. It is also too draining in resources (bandwidth and battery) to communicate all data and also sensors such as our accelerometers (on the sheep) generated vast volumes of data. These insights have led to future work in (i) the dynamic enhancement of the micro-server to be an edge device looking at constructing a micro-cloud out of a number of Raspberry Pis, (ii) strategies looking at the dynamic placement of computation on the resultant complex distributed environment (including the pushing of behaviour to end or edge devices, and (iii) self-organisation strategies for the above based on machine learning.
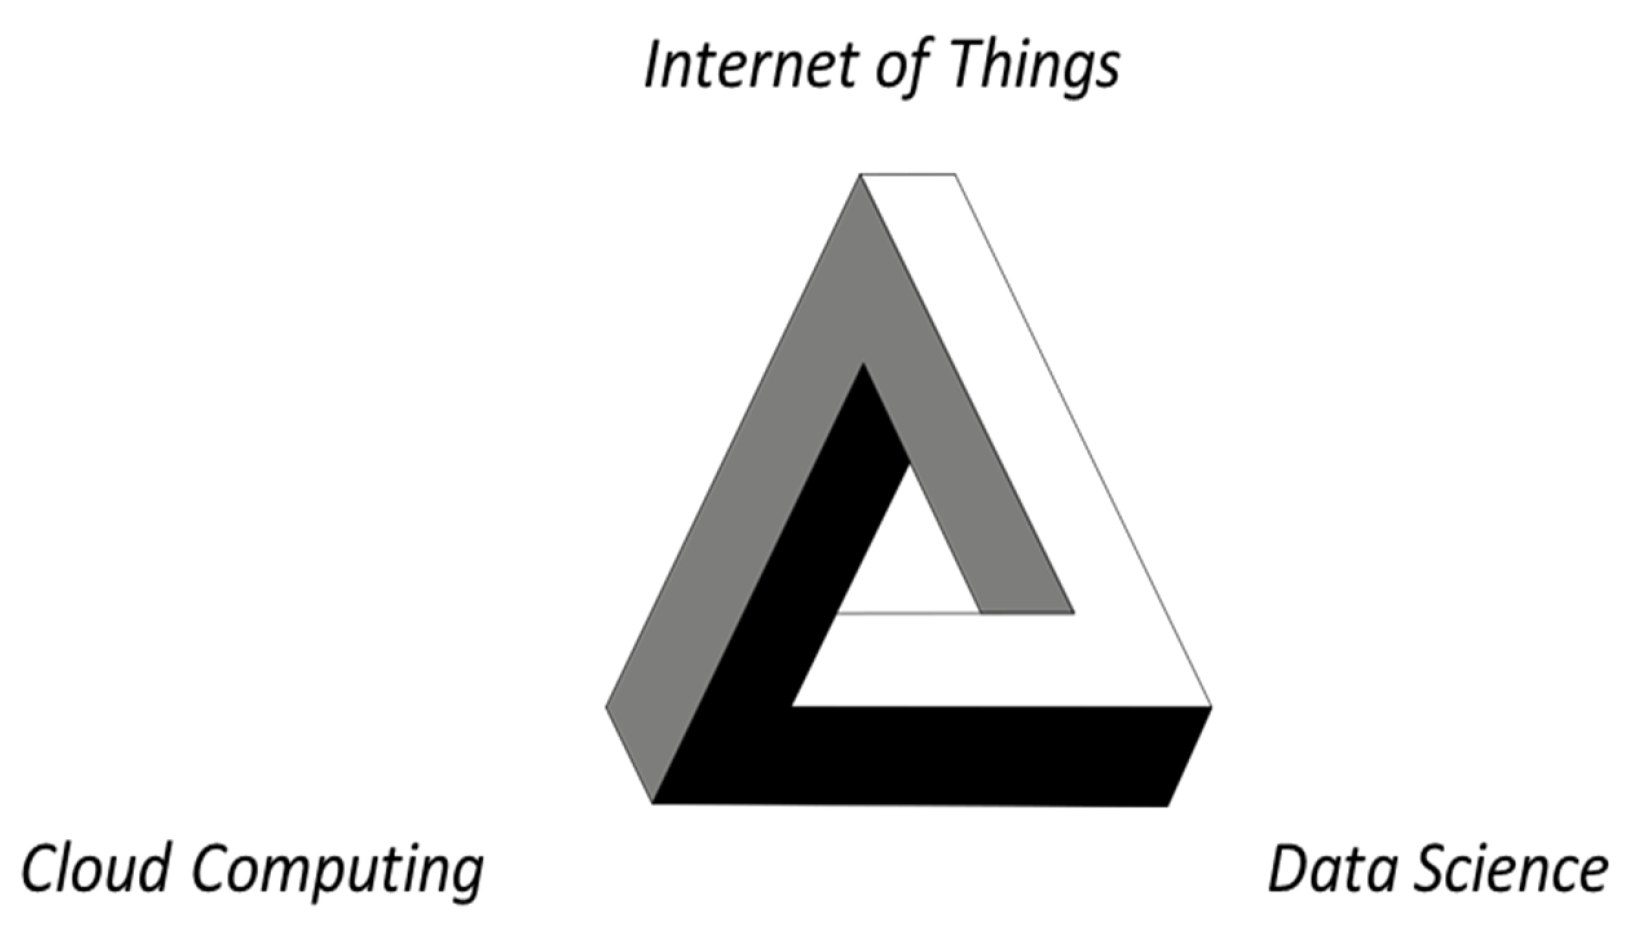
The combination of IoT technology and cloud computing is powerful—with IoT providing a source of rich, ubiquitous data coupled with an ability to intervene in the real world through means of actuation and cloud computing offering massive and elastic capacity in terms of storage and processing, coupled with an associated service architecture to interpret, manipulate, and visualise this data. There is however one missing piece—data science—and it is clear from our work that more effort is required to make sense of the rich volumes of data generated by an Environmental IoT. It is also clear that this domain represents different challenges for data science than many areas of big data; the data in this area tends to be a larger collection of heterogeneous data elements requiring complex analysis around, for example, interdependency. Researchers refer to this as the “long tail of science” [
32]. As a further follow-up, we are investigating this eternal braid of the three synergistic technologies (as displayed in
Figure 19) in the understanding, mitigating, and adapting to climate change.
6.2. Scientific Contributions
Arguably the biggest success of the project was that we provided a working and fully functional Environmental IoT that enabled new modes of scientific discovery. The key to this was the deployment of a wide range of sensors covering hydrology, soil science, and animal behaviour. This enabled a new kind of integrative scientific enquiry, and also by bringing the data together, this also brought the associated scientific communities together to collaboratively understand the interdependencies in the complex environmental catchment under consideration. This acts as a beacon for future integrative and collaborative science in this area. The examination of this multi-faceted data across different geographic areas and (importantly) at different scales also enables this broader and deeper understanding of a catchment in all its complexities. The more obvious but equally profound contribution is providing real-time data to scientists. As mentioned in related work, environmental and earth sciences are overly reliant on data logging which require trips out to (often remote and inaccessible) locations to download data. The accessibility of rich, real-time data therefore represents a real paradigm shift for this area and a major opportunity to support improved response to issues such as, for example, extreme events and natural disasters.
One key issue that emerged was the need to understand the semantics of the data, most notably related to the provenance of data (what type of sensors, their perceived accuracy, and so on). For example, we deployed a range of soil sensors covering a range of prices and qualities. This is important as scientists are interested in what can be achieved from dense deployment of very cheap sensors but equally need more accurate technologies for calibration. Hybrid technologies are therefore important. We have thus devoted significant effort to the resultant (semantic) data model, covering provenance but also other meta-data descriptions and supporting more conceptual reasoning about the data. This data model is briefly mentioned in
Section 4 and
Section 5 and is also the subject of a sister paper which will be published shortly.
A final important design decision was the provision of data in the cloud as a key means of enabling integration and collaboration but also crucially in supporting open access to data (available through MongoDB). The importance of open data has already been recognised by many observers, most notably by the Royal Society [
33]. This is particularly important in the field of environmental and earth sciences as the communities respond to the requirements of a new kind of “big” science as required by the challenges of environmental change. Open data also encourages innovation around both uses of the data and (importantly) associated services. Access to the Environmental IoT data is available through the associated data portal, but the open API also encouraged consideration of a range of apps including a “MySheep” app and also the potential for integration into the existing MySoils app [
34].
6.3. Methodological Contributions
It is often the case that IoT developments are carried out by the computer science community on behalf of end users, and this can result in technology for its own sake. In this case, it was crucial that the project was a truly equal collaboration between technologists and environmental scientists. This was necessary to allow the scientists to appreciate what is possible from the underlying technology, often to enable a broader vision to develop, and also for the technologists to fully understand what is needed to achieve a true paradigm shift in scientific understanding. This was achieved, representing arguably the biggest contribution to the project dwarfing, for example, any technological insights. The key to this was an agile development method and the associated use of flexible technologies such as Arduinos and Raspberry Pis. While these technologies are not necessarily optimal in terms of final development, they are ideal for rapid prototyping and exploring a space and indeed as a basis for having a conversation between the different constituent disciplines involved. It was notable that, within a short time, the scientists in the project were adapting the initial designs to better match their needs and also to extend the functionality. In effect, the technological and methodological approaches enabled a conversation on the role of Internet of Things technology in the environment, and there is also evidence emerging through follow-on projects that this has resulted in a deeper and more sustainable level of understanding.
7. Conclusions
This paper has examined the potential role of Internet of Things technology in supporting a deeper understanding of the natural environment, reporting in particular in the design and “in the wild” deployment of an exemplar Environmental IoT examining a range of environmental factors in a catchment in North Wales.
The project has utilised field deployment of sensors and cloud computing to offer a shared repository of data to stakeholders. This data can be easily accessible and can be used to feed into models, to deal with uncertainty in models, and to discuss the results with other stakeholders and communities. We have also reported our experiences based on these challenges through our IoT system.
The one barrier is the lack of maturity of Internet of Things technology based partly on the lack of standardization in this domain and also the many open research questions to be resolved, for example around minimization of energy and self-management. The slow uptake of the technology from the lab to the field is because most of these systems rely on nonstandard, custom-designed elements that need specialised expertise. The other challenges faced in setting up an Internet of Things in the natural environment are power limitations, poor Internet connectivity, and hostile operational conditions. Nonetheless, our aim through our Environment IoT system is to provide a major opportunity to fill the gap between different environmental science disciplines. The idea is to bring together data and assets from across different domains (soil, water, plant ecology, and animals) and organisations (public, regulatory, and industry) to enable integrated problem solving for the agriculture and water industries but with a clear potential to link to other critical industries in the future. We are particularly interested in new kinds of collaborations and associated management strategies that can stem from bringing real-time data sets together and observing related interdependencies.
Prior to investing in expensive hardware, it is good to know if an IoT system can operate under the given conditions of an environment. We believe that the insight gained through our Environmental IoT project can serve as a basis for validating challenging environments when setting up an IoT system for such environments. Our overriding motivation was to develop a platform that was cheap and flexible and because we were limited in our equipment budget. Looking at other technologies, IoT solutions tend to to be either too specific in their application domains or came at a higher price point per node than we could afford. On the other hand, Acclima was a preferred sensor to Grove by the environmental scientists; however, they wanted to experiment with a cheaper alternative as the Acclima sensor is very expensive. They were willing to compromise on quality for quantity of real-time data points as long as there were a few of the high-quality inputs in the field as a known reference point.
We have outlined some key areas of future research following on from this work most notably on areas such as systems of systems architectures, the role of edge devices in setting up a micro-cloud and bringing some computation with techniques such as machine learning on the micro-cloud, and self-organisation in complex distributed systems.
In concluding the paper, we return to our central hypothesis: “A combination of IoT technology coupled with Cloud Computing enables a paradigm shift in our understanding and management of the natural environment, especially related to understanding ecosystem interdependencies, in times of unprecedented environmental change.” This is clearly a rather bold and open-ended claim, but nevertheless our experiences indicate that this is an area of huge potential and that our experiments have shown that new styles of scientific enquiry can be supported by such emerging technology. We also flag this as an important area of future development of IoT technology. While it is often the case that IoT deployments feel like a technology in search of a problem, it is absolutely the case that, in the environmental and earth sciences, it is the other way round—a problem in search of a solution where at least part of the solution lies in the combination of cloud and IoT technologies, coupled with emerging techniques from data science as discussed above.

 ,
, 


