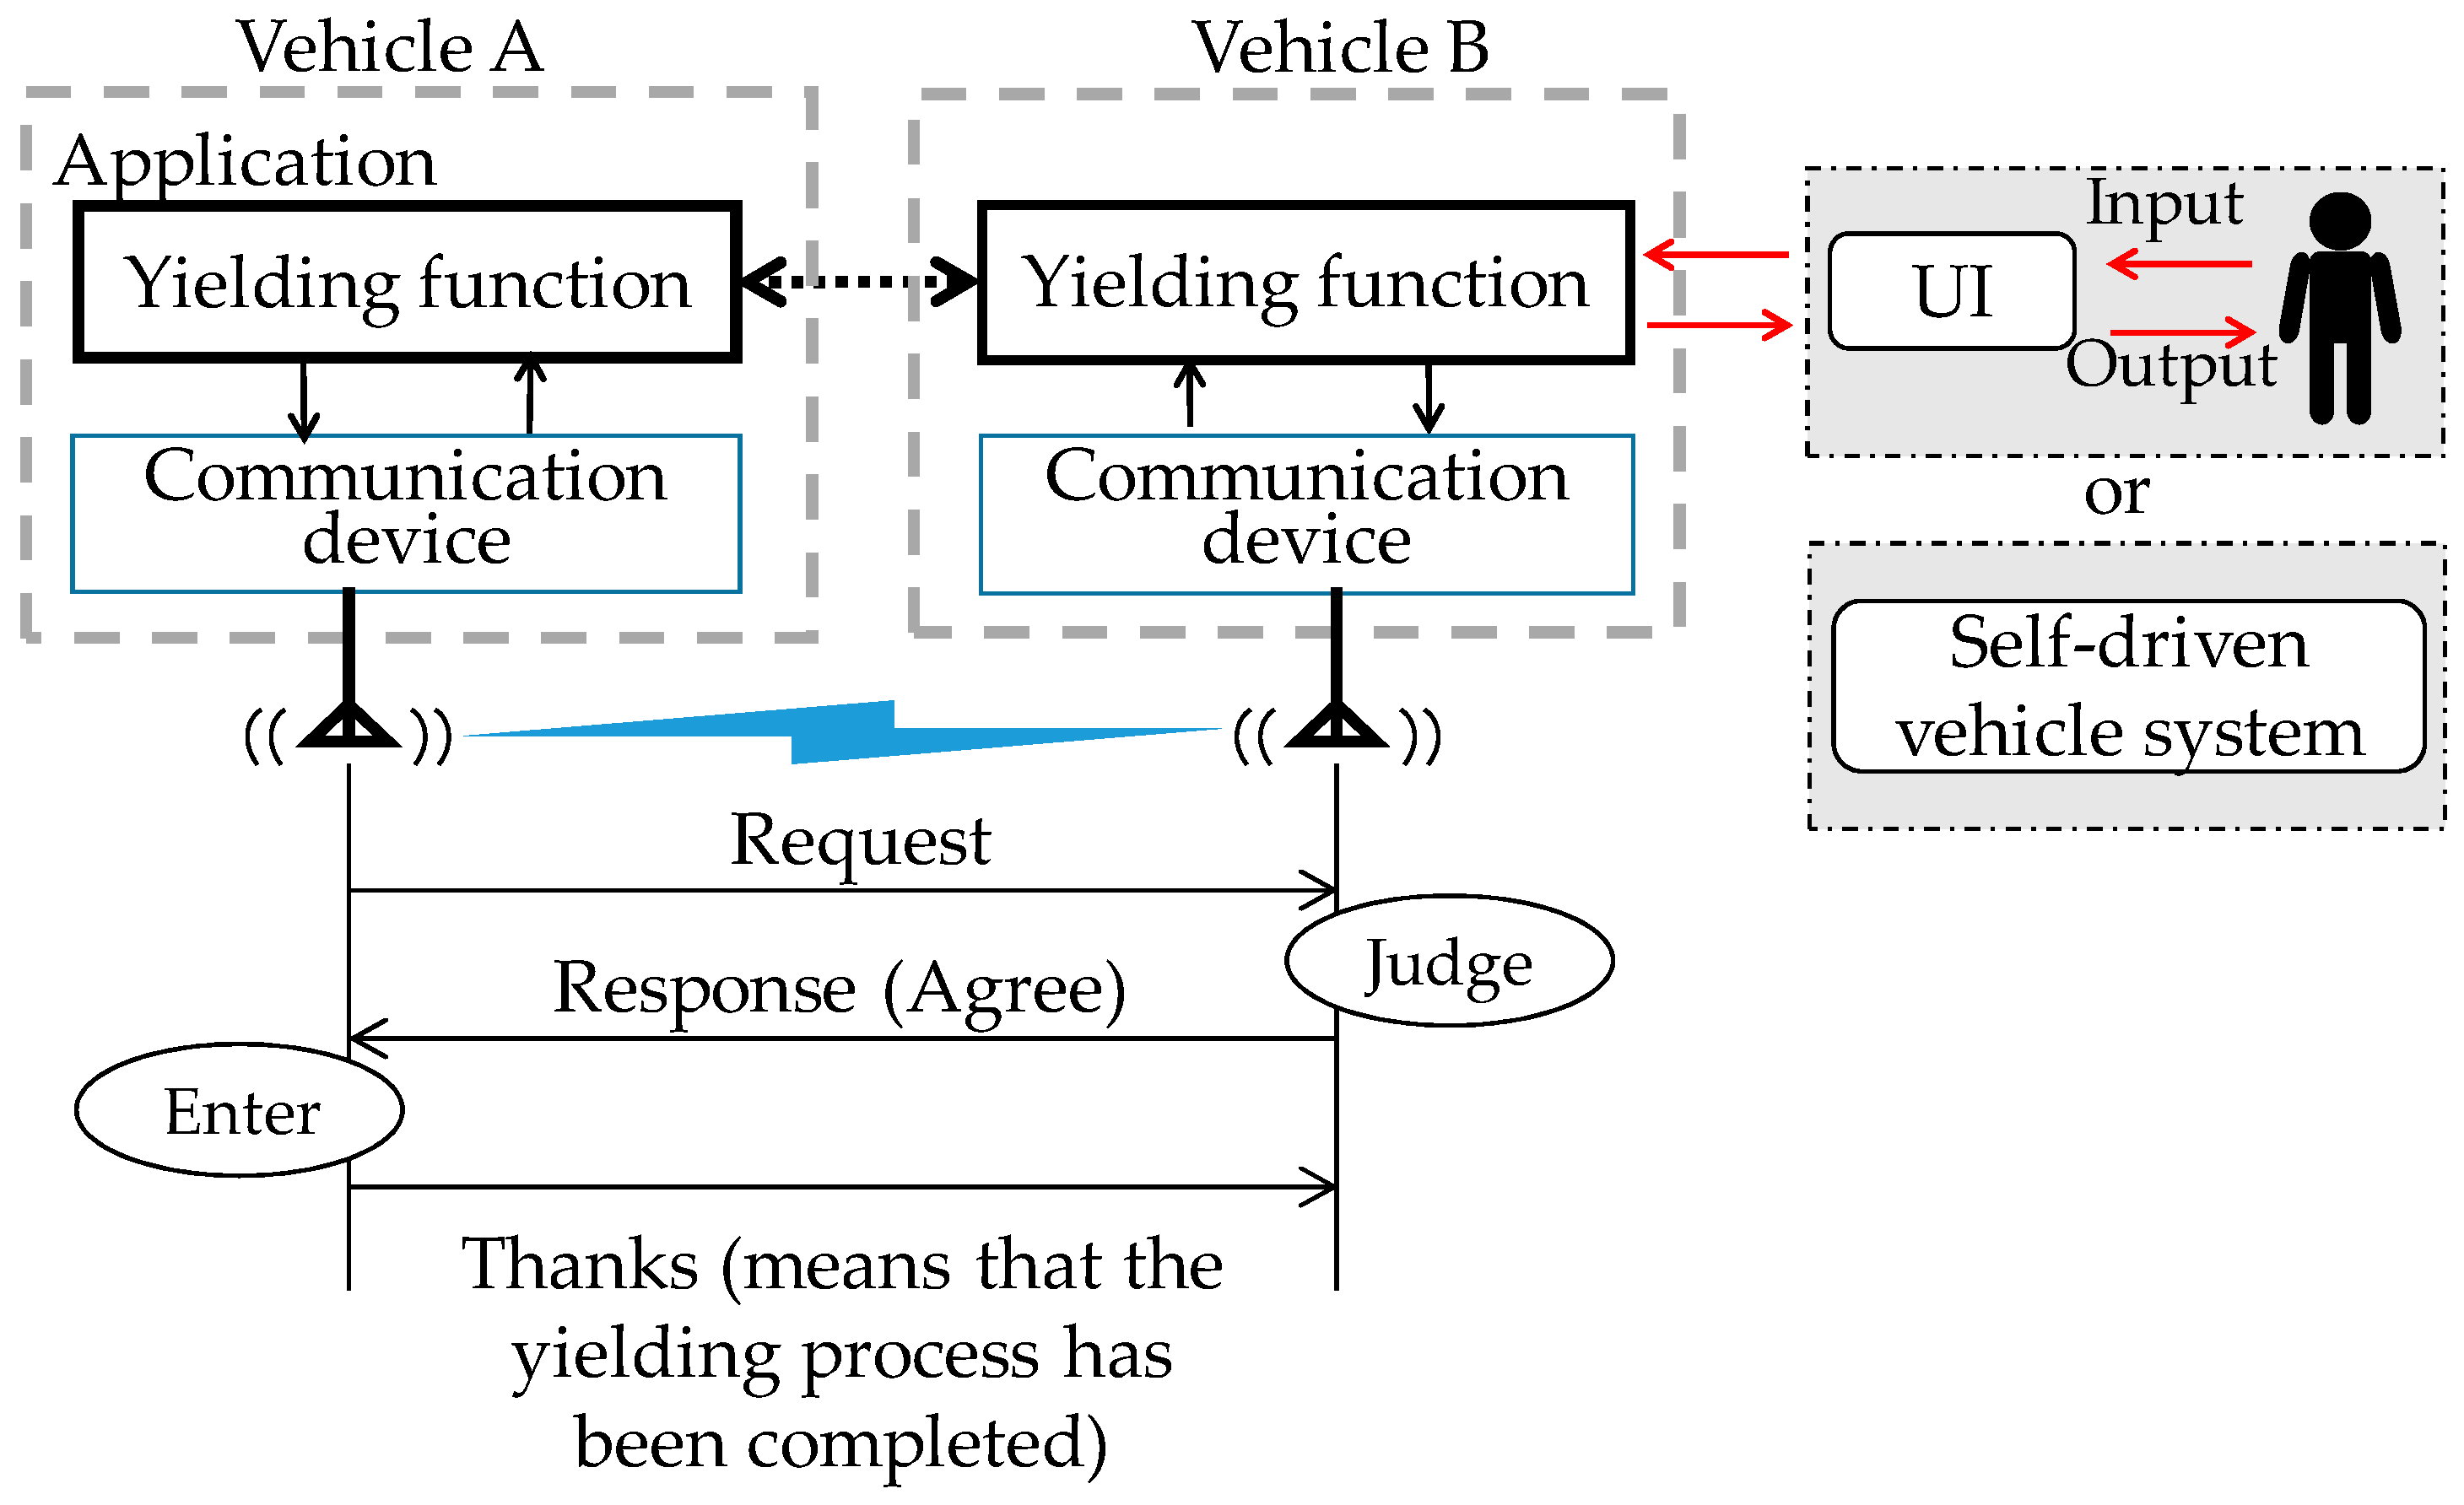
Figure 1.
Overview of the yielding process.
Figure 1.
Overview of the yielding process.
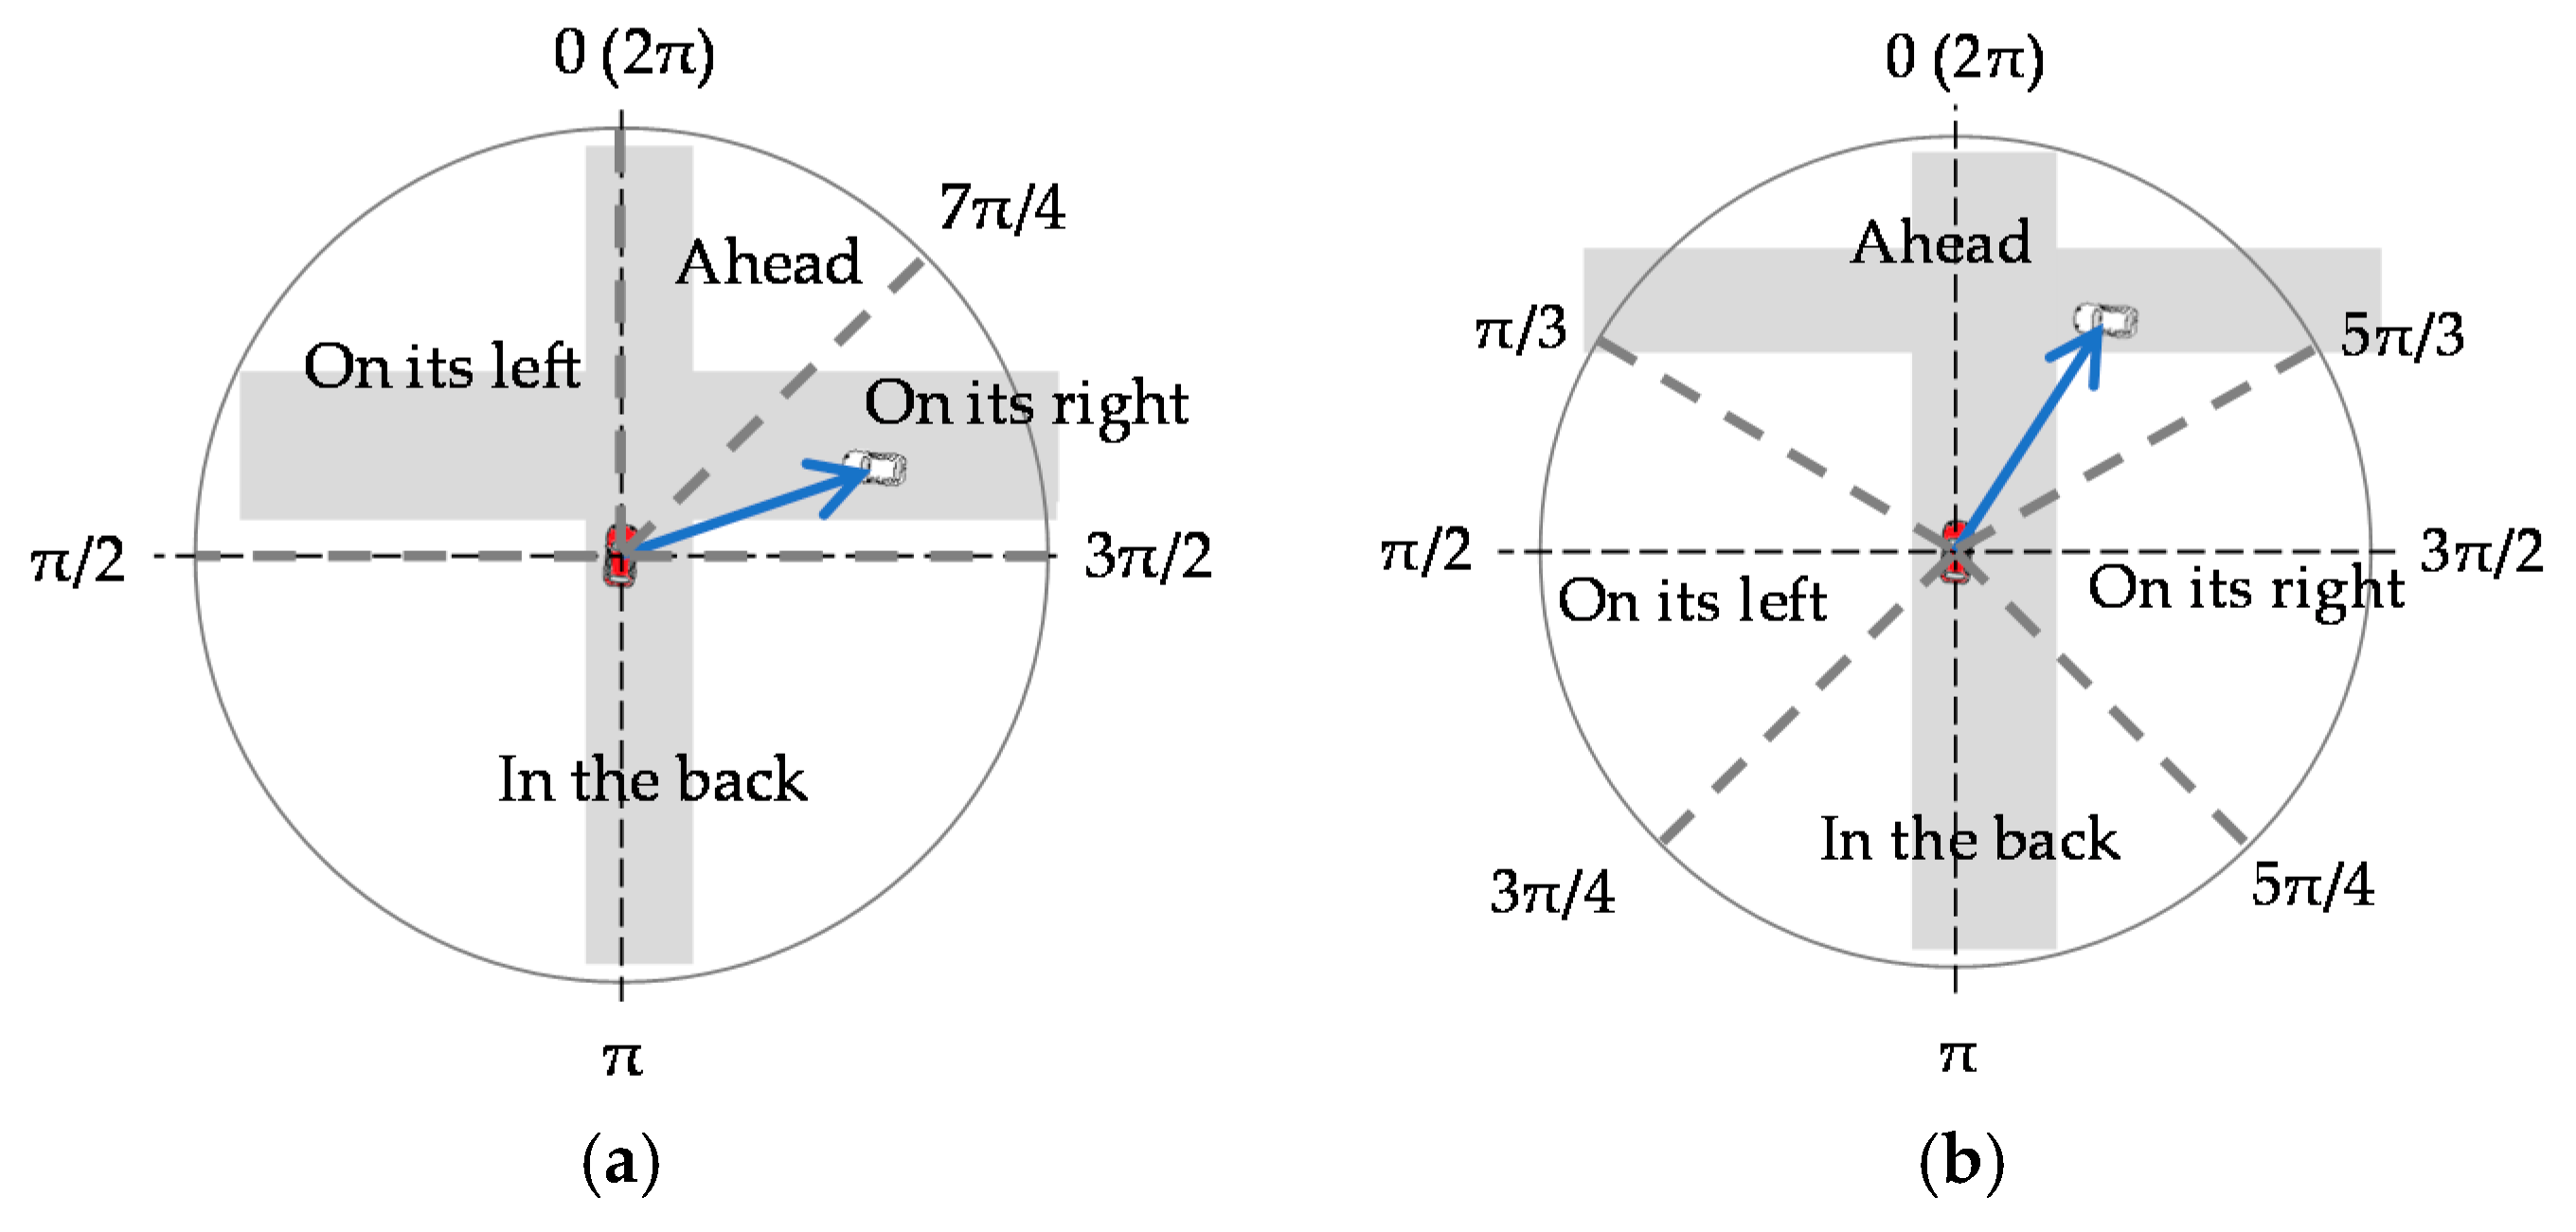
Figure 2.
Determining the relative position of the communicating vehicle. The red vehicle is the own vehicle and the white vehicle is the other vehicle. (a) The own vehicle is the requesting vehicle; (b) the own vehicle is the responding vehicle.
Figure 2.
Determining the relative position of the communicating vehicle. The red vehicle is the own vehicle and the white vehicle is the other vehicle. (a) The own vehicle is the requesting vehicle; (b) the own vehicle is the responding vehicle.
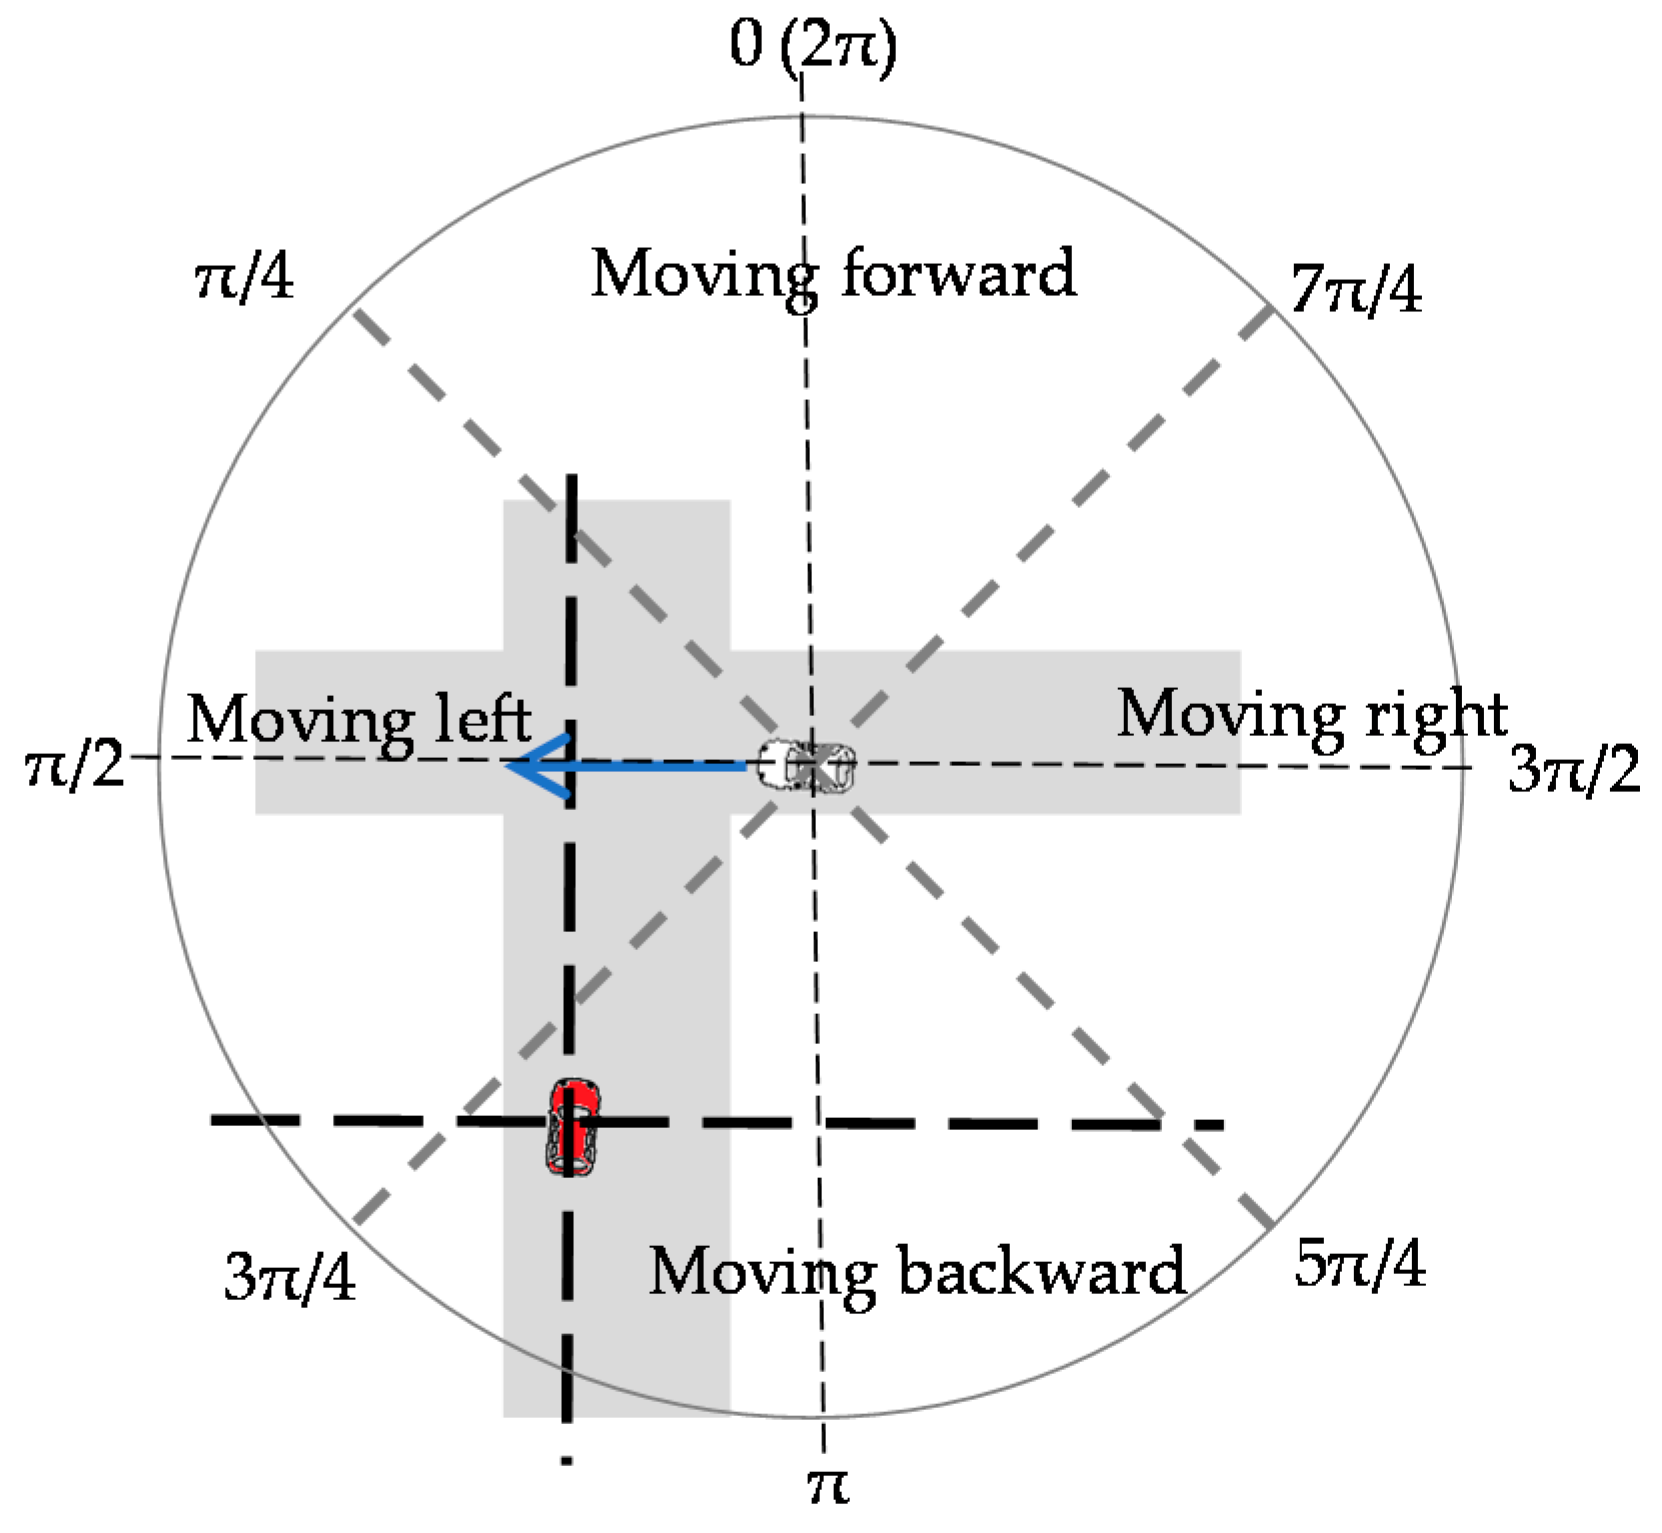
Figure 3.
Determining the relative direction of the communicating vehicle. The red vehicle is the own vehicle.
Figure 3.
Determining the relative direction of the communicating vehicle. The red vehicle is the own vehicle.
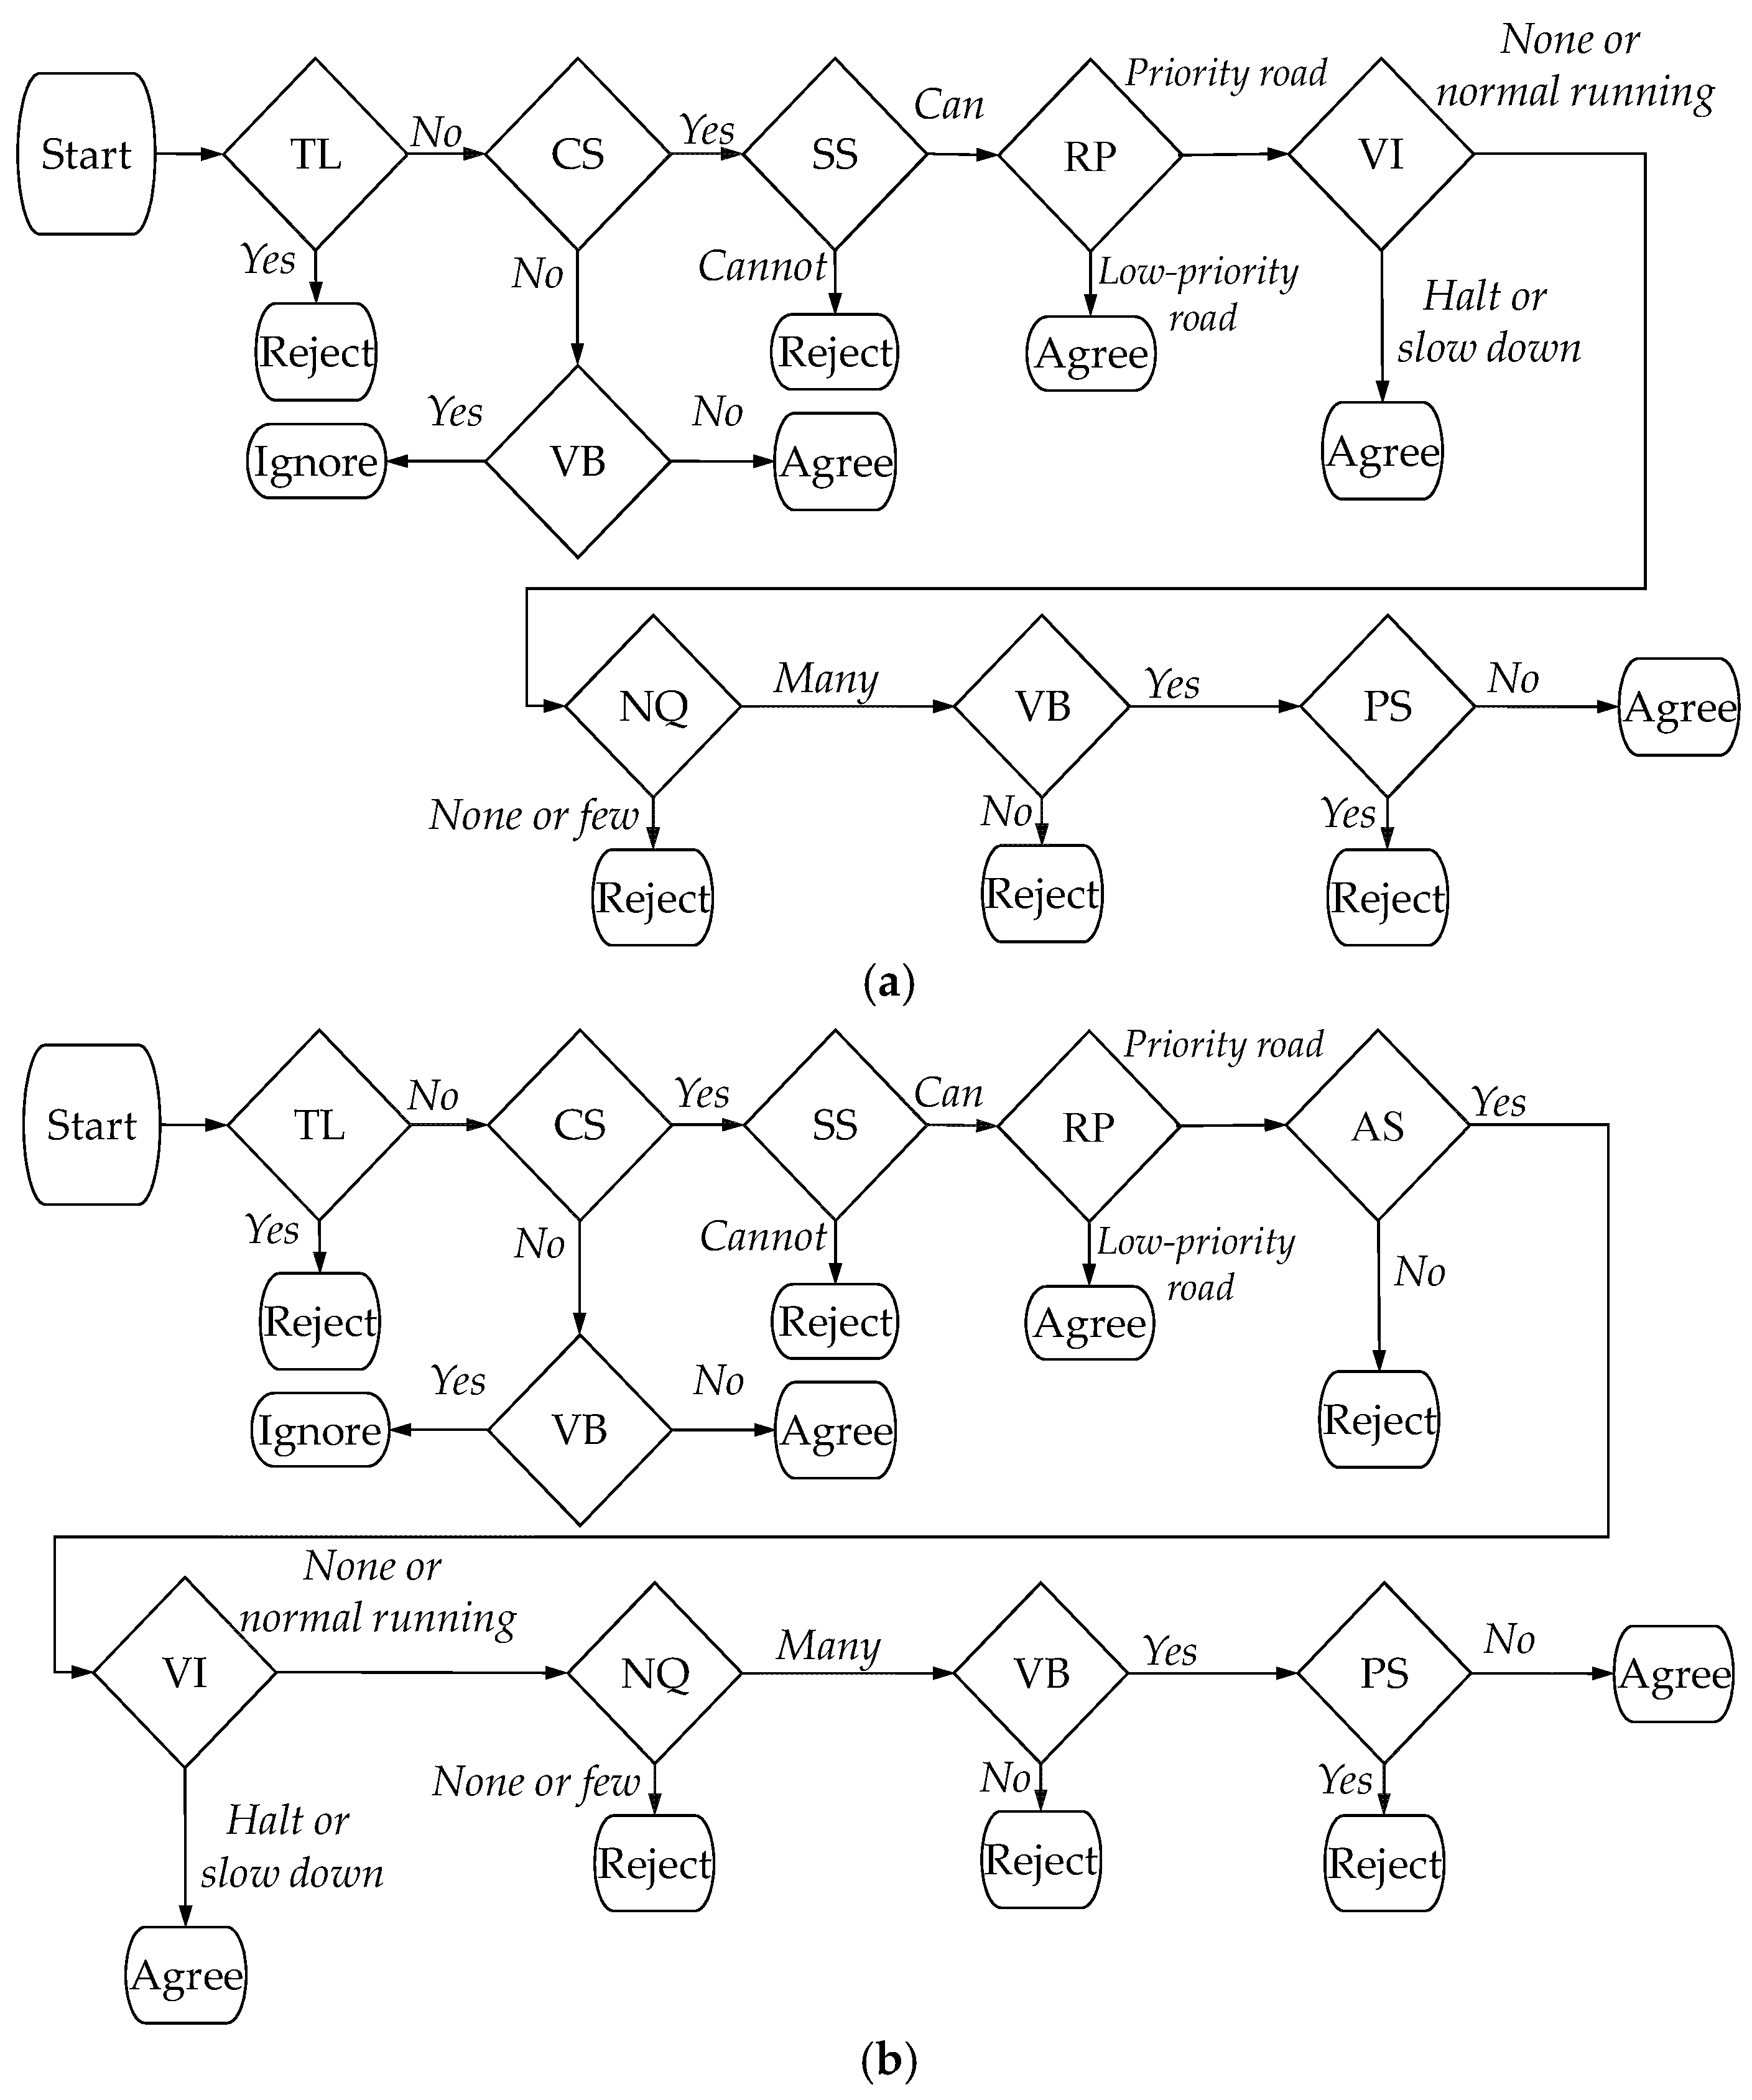
Figure 4.
Yielding decision flow. TL: Traffic light; CS: Conflict situation; SS: Stop safely; RP: Road priority; VI: Vehicle beyond the intersection; VB: Vehicle in the back; NQ: Number of queuing vehicles; PS: Pedestrians in the surroundings; AS: Availability of enough space. (a) Patterns 1 and 4; (b) patterns 2 and 3.
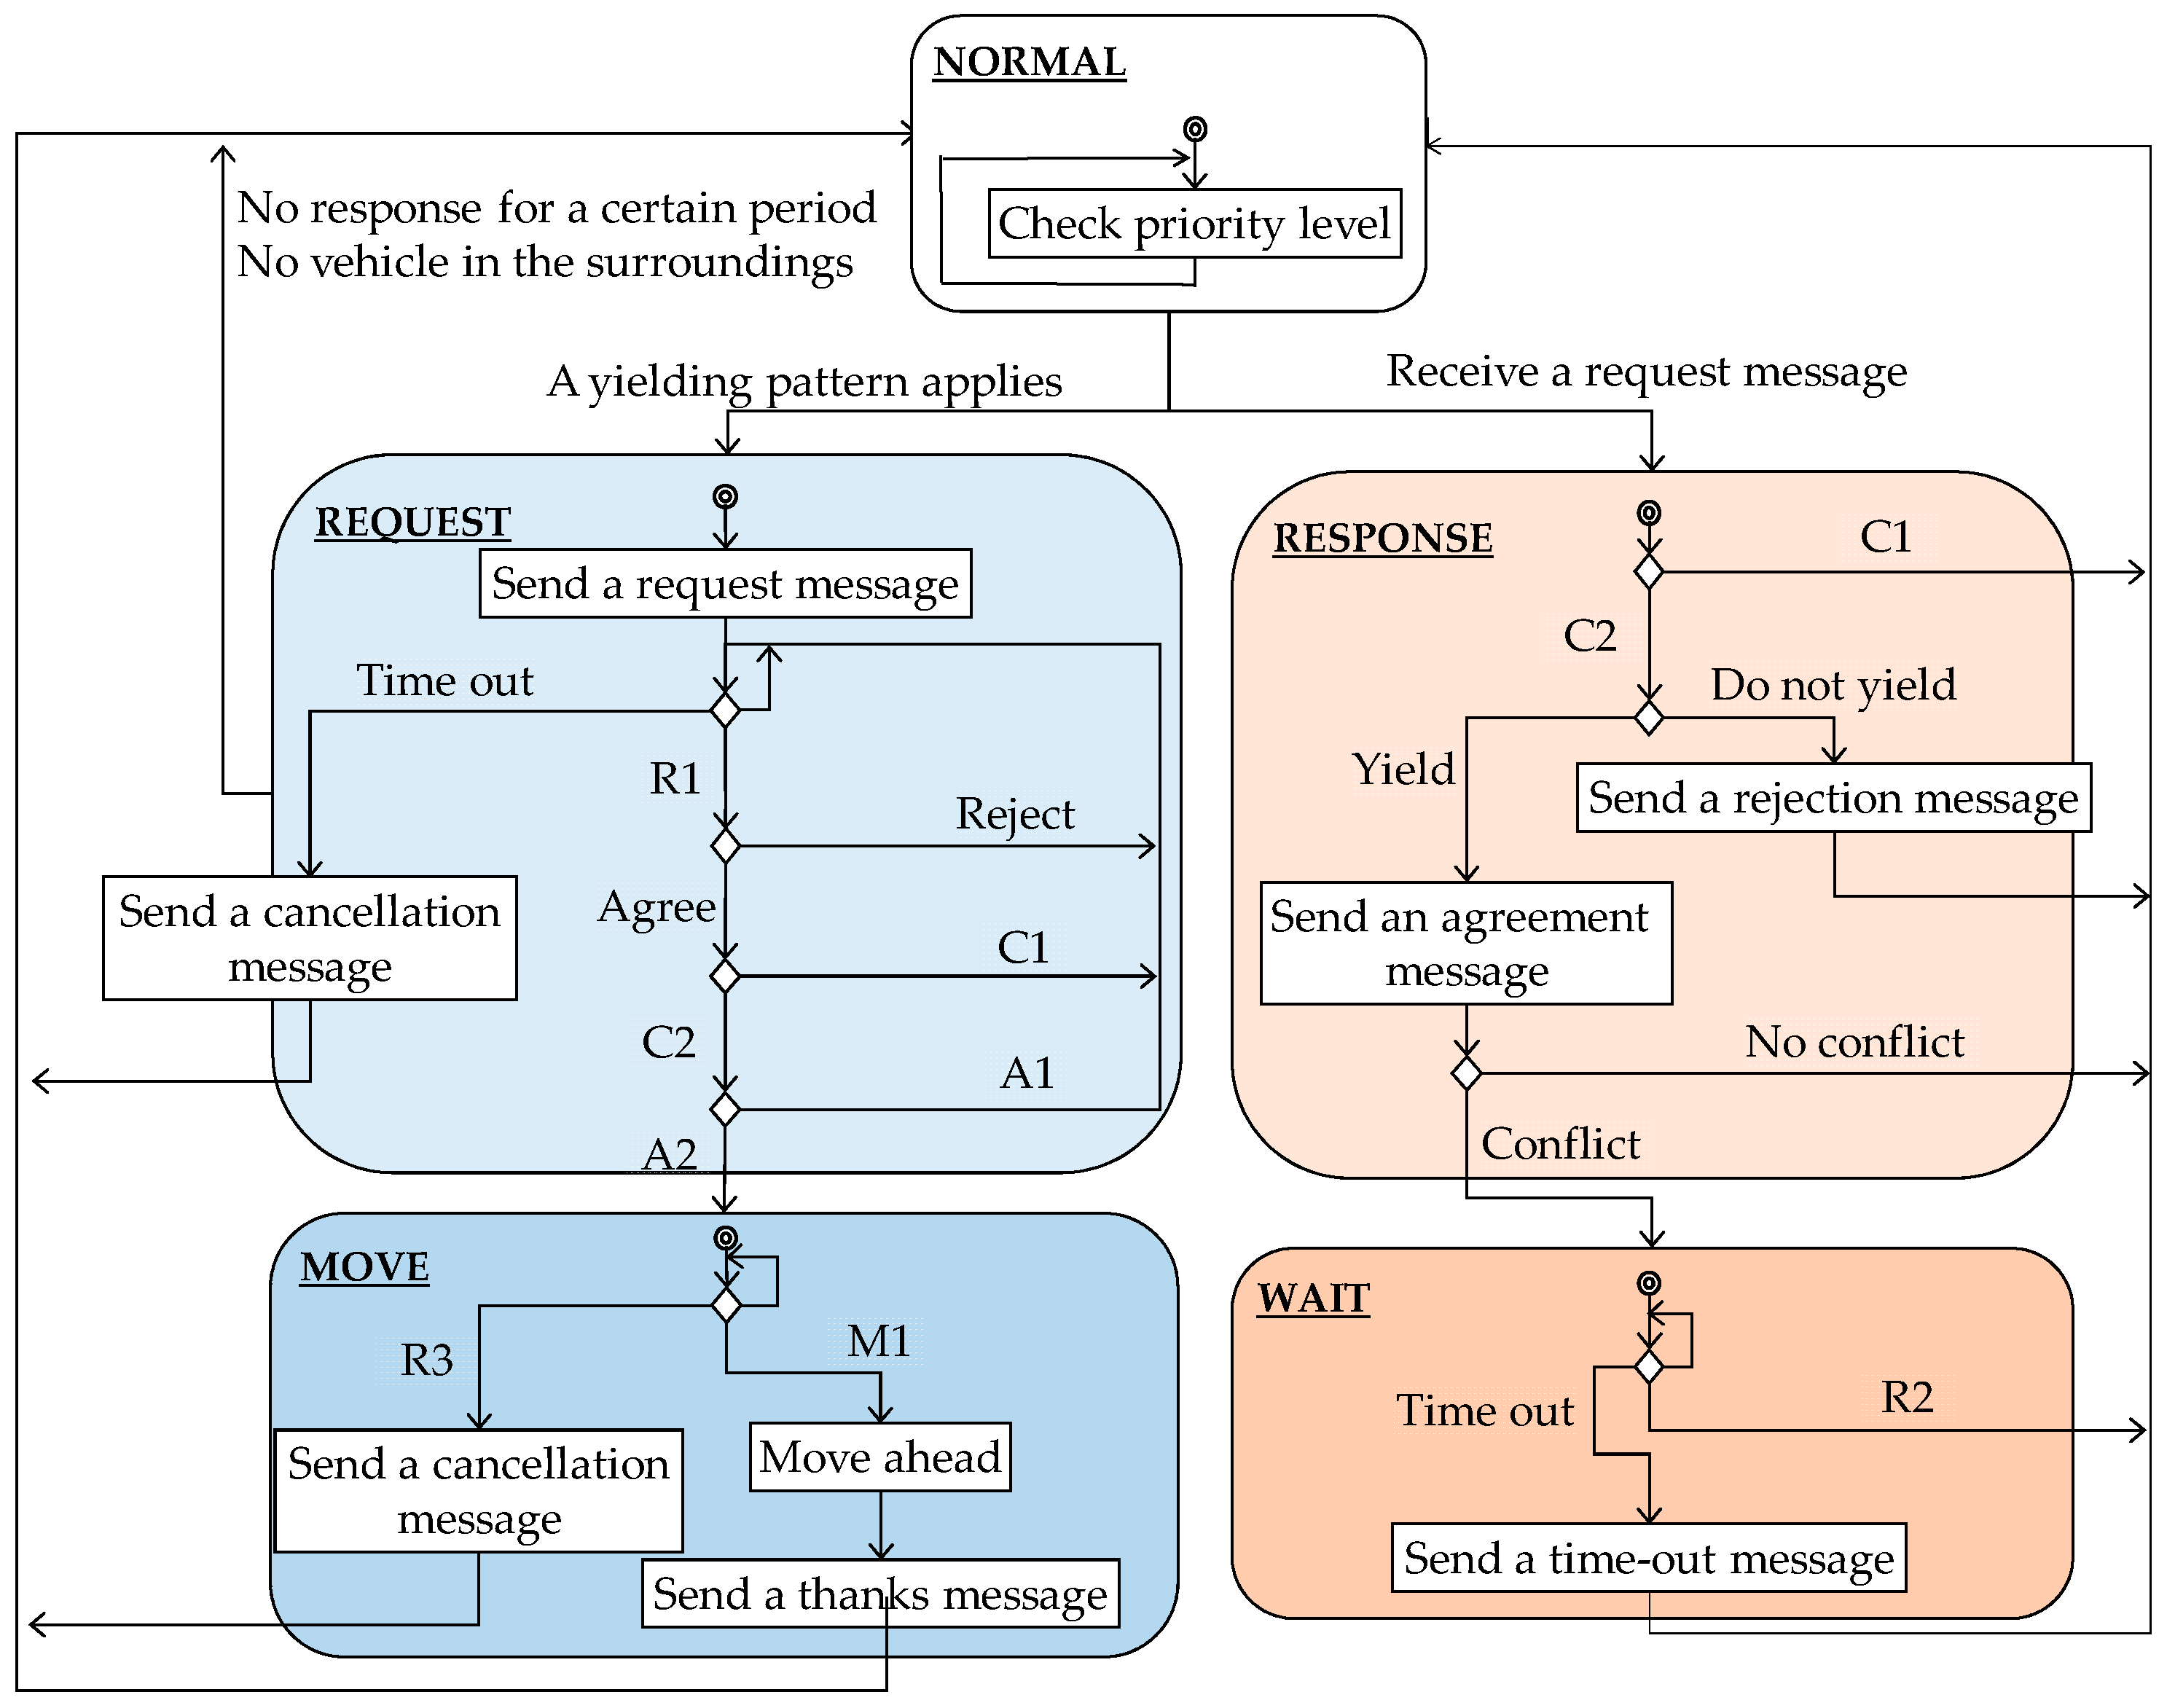
Figure 5.
State transition diagram for the yielding algorithms. R1: Receive the message; R2: Receive a thanks message or receive a cancellation message; R3: Receive a time-out message; C1: Communicating vehicle unidentified; C2: Communicating vehicle identified; A1: Incomplete agreement; A2: Complete agreement; M1: Can move ahead safely.
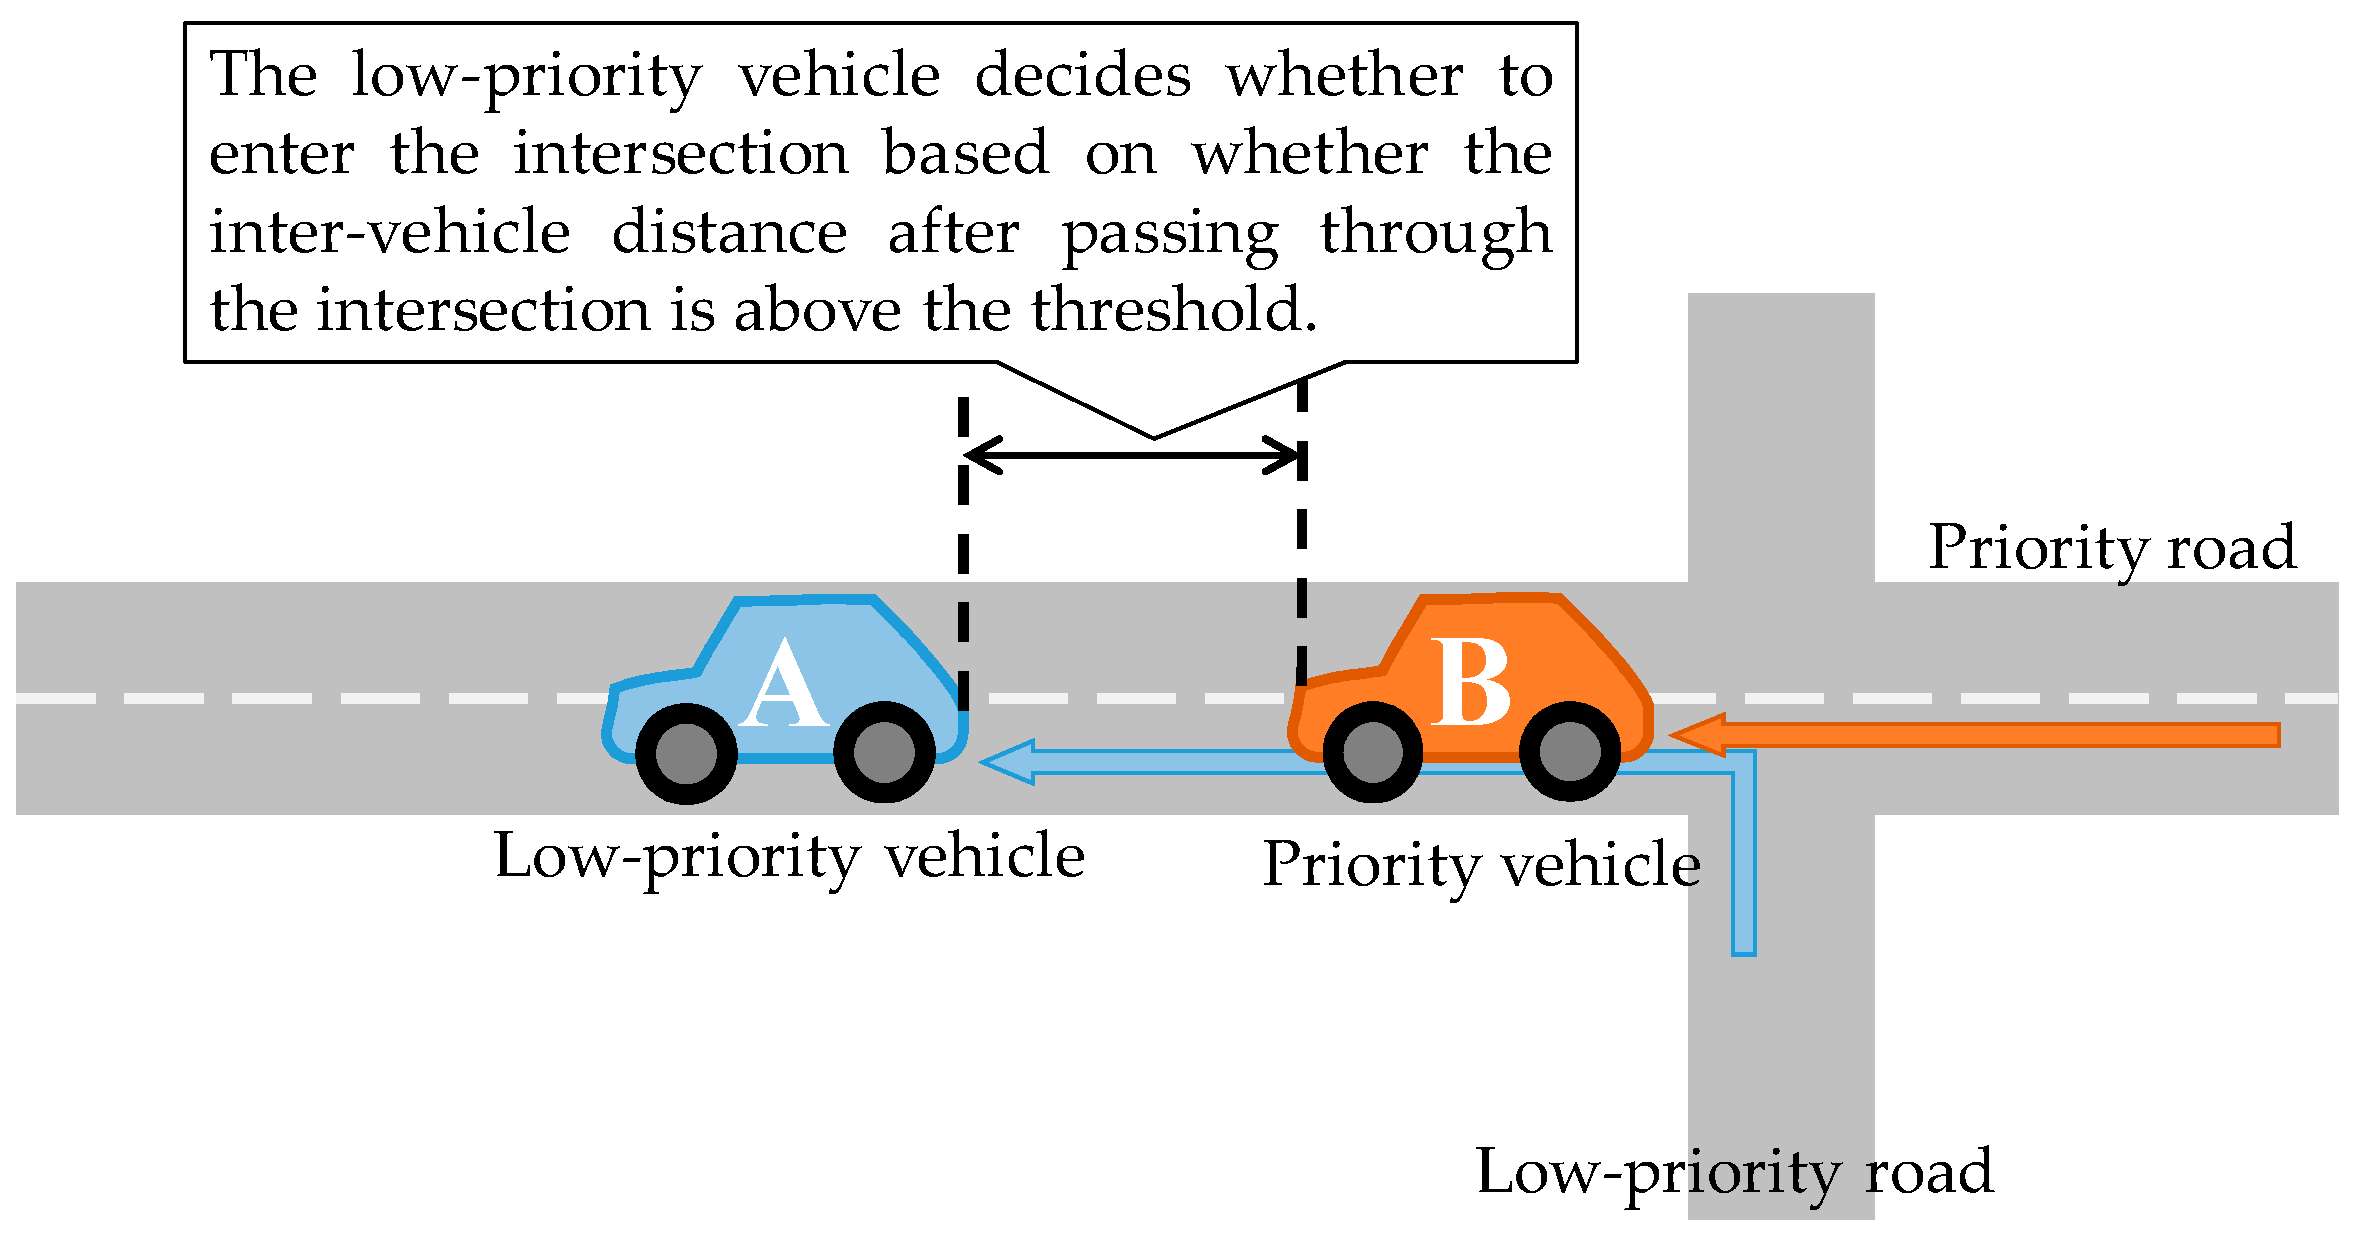
Figure 6.
Concept of the inter-vehicle distance based on which the low-priority vehicle decides whether to enter the intersection.
Figure 6.
Concept of the inter-vehicle distance based on which the low-priority vehicle decides whether to enter the intersection.
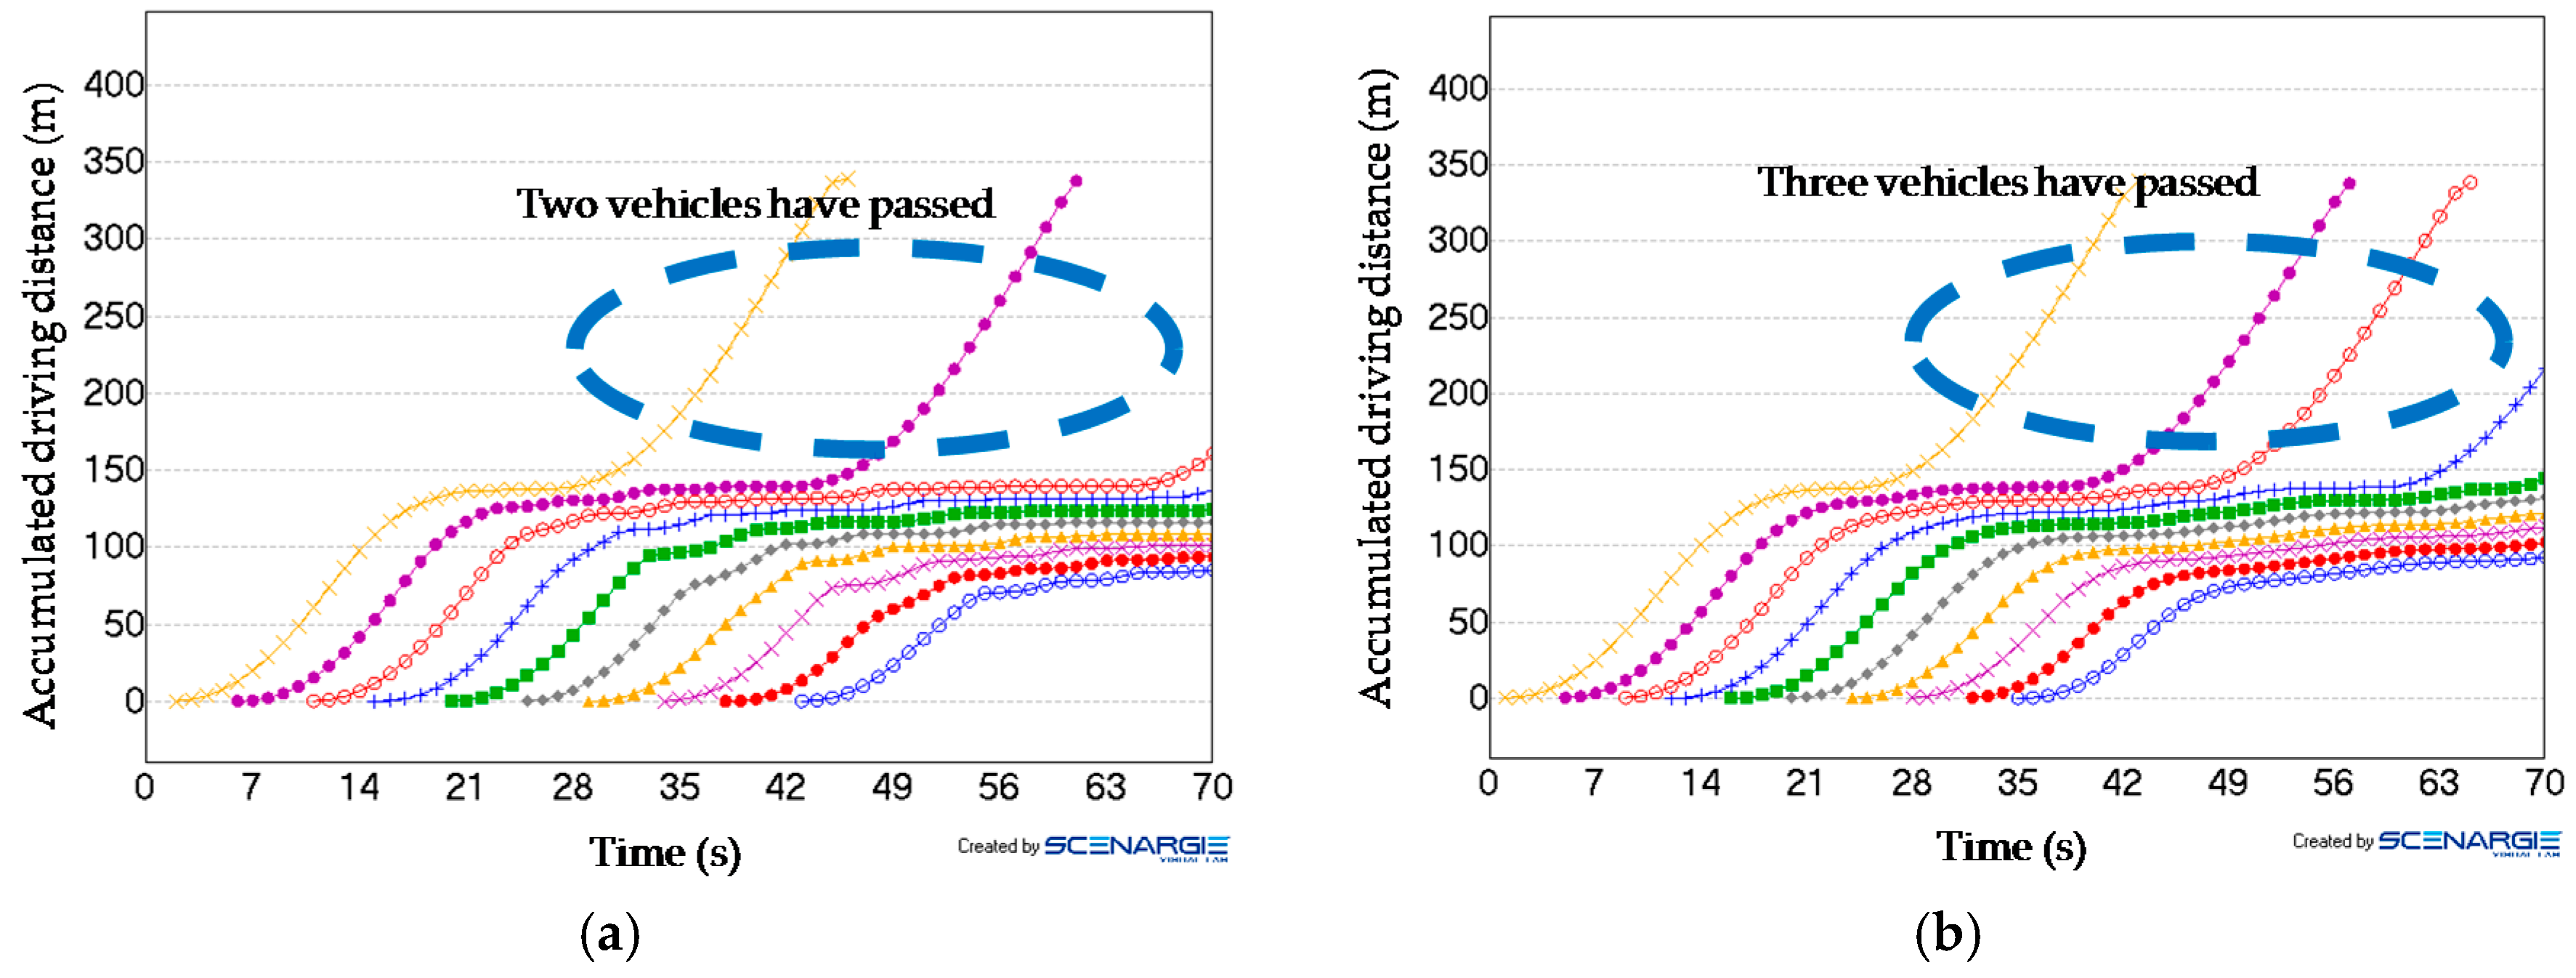
Figure 7.
Impact on the vehicle in the back after the low-priority vehicle has stopped at, and then passed through, the intersection. (a) Human-driven vehicle; (b) self-driven vehicle.
Figure 7.
Impact on the vehicle in the back after the low-priority vehicle has stopped at, and then passed through, the intersection. (a) Human-driven vehicle; (b) self-driven vehicle.
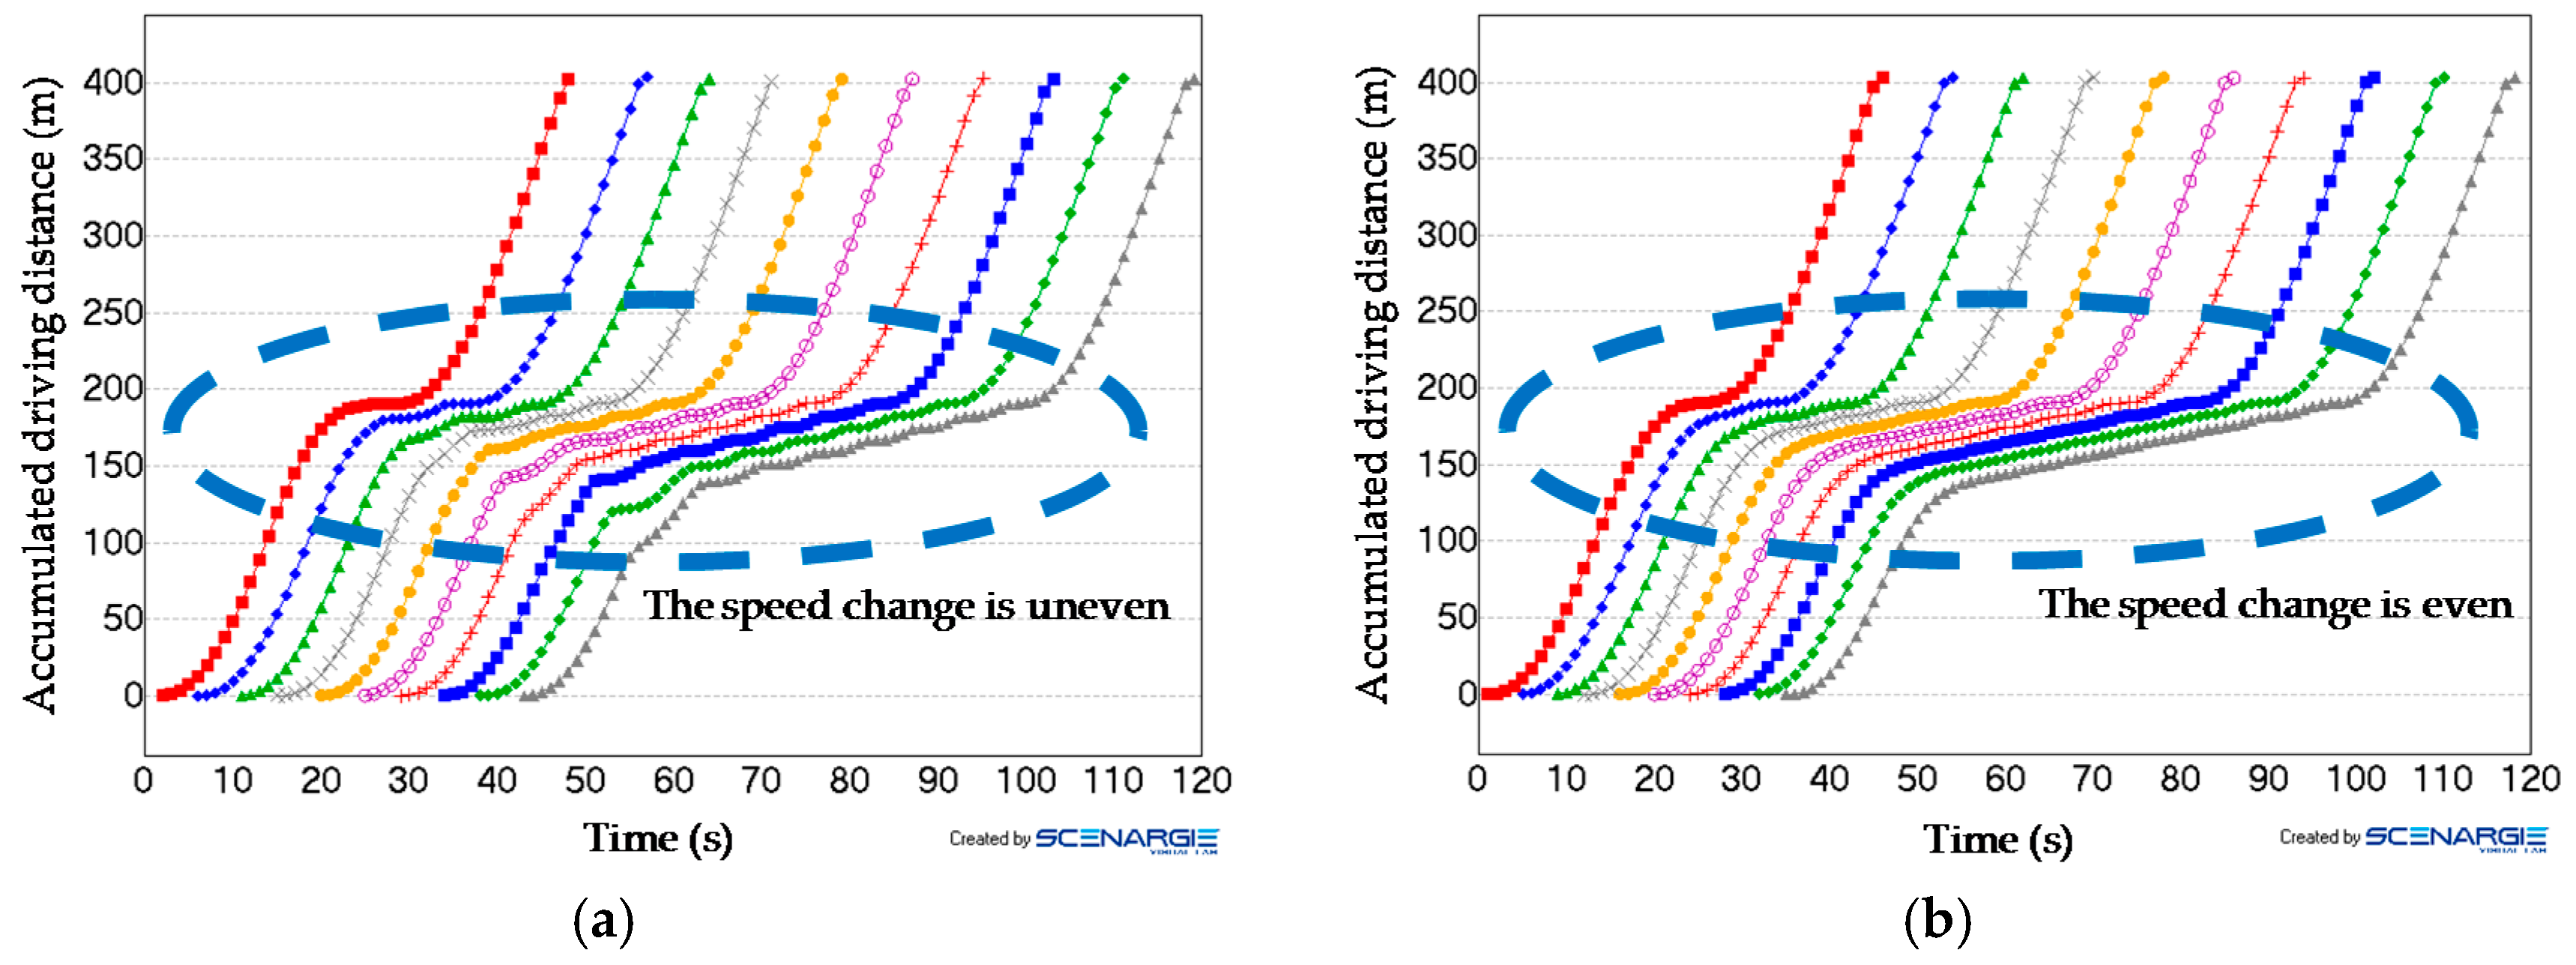
Figure 8.
The behavior of vehicles that move from the low-priority road into the priority road in the case where the yielding protocol is not in operation. (a) Human-driven vehicle; (b) self-driven vehicle.
Figure 8.
The behavior of vehicles that move from the low-priority road into the priority road in the case where the yielding protocol is not in operation. (a) Human-driven vehicle; (b) self-driven vehicle.
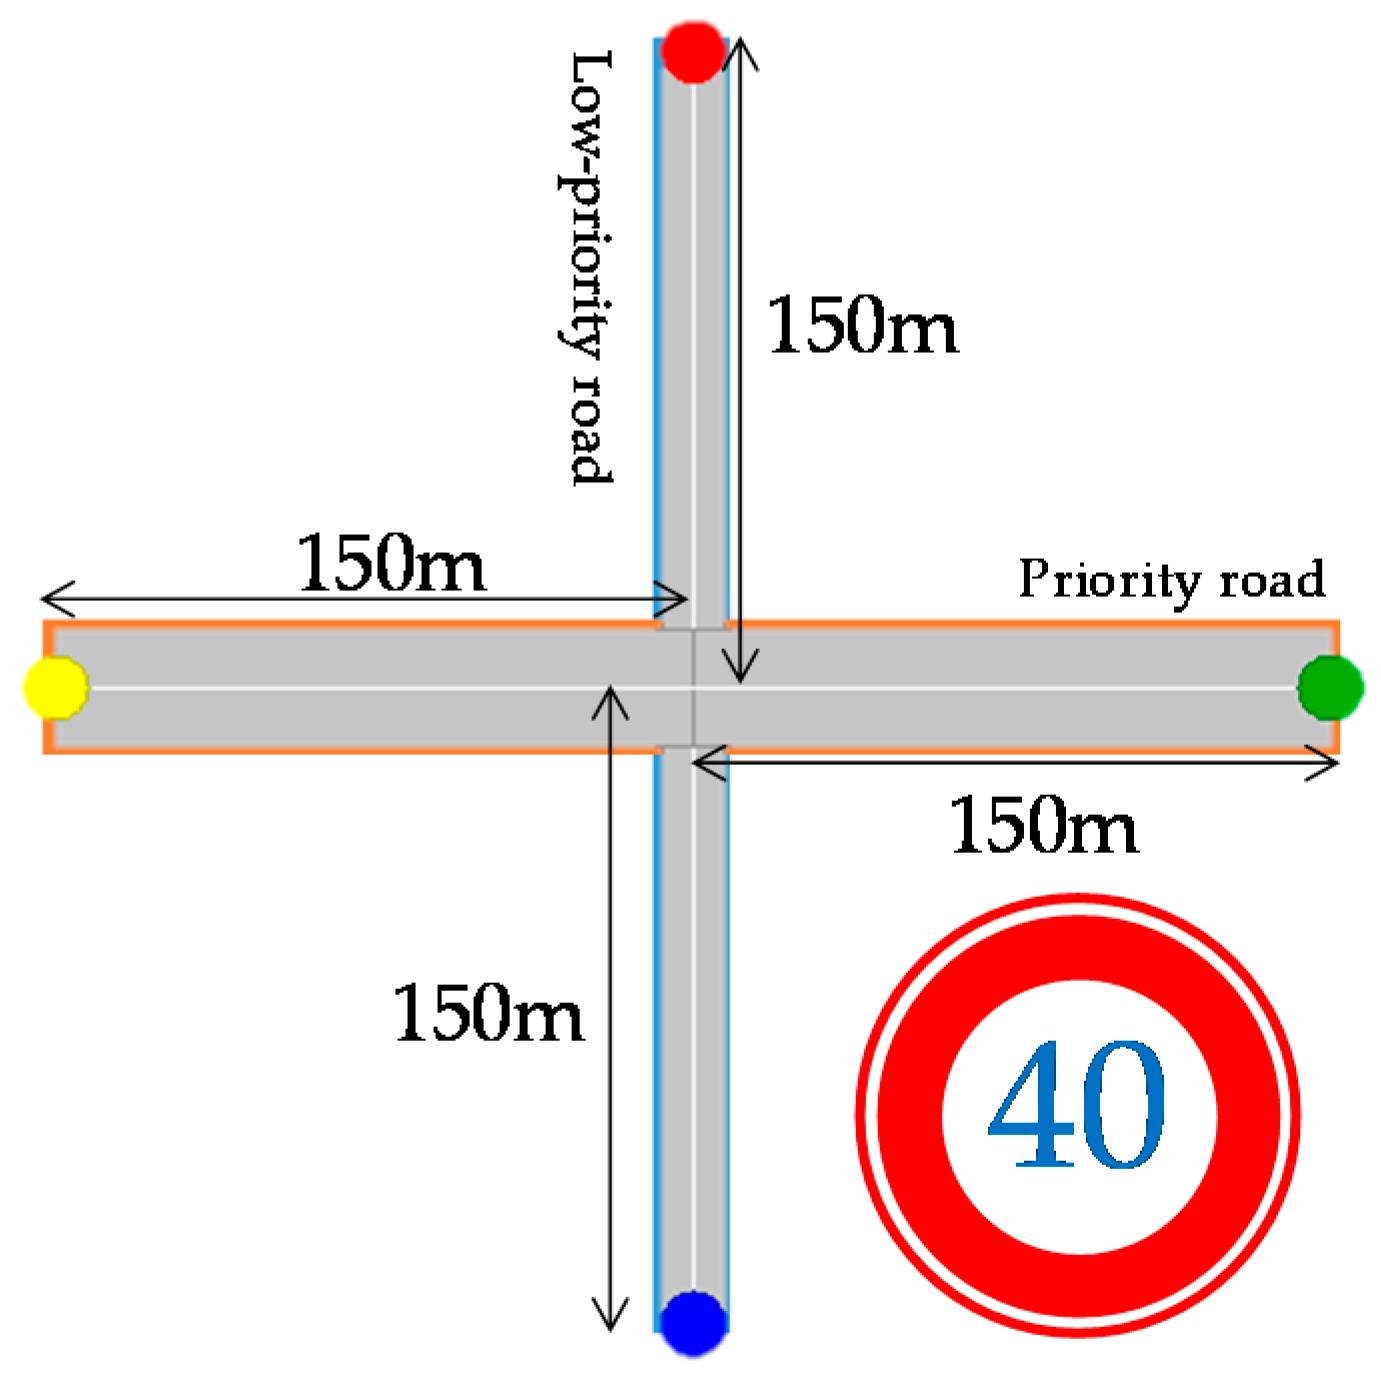
Figure 9.
Simulated field.
Figure 9.
Simulated field.
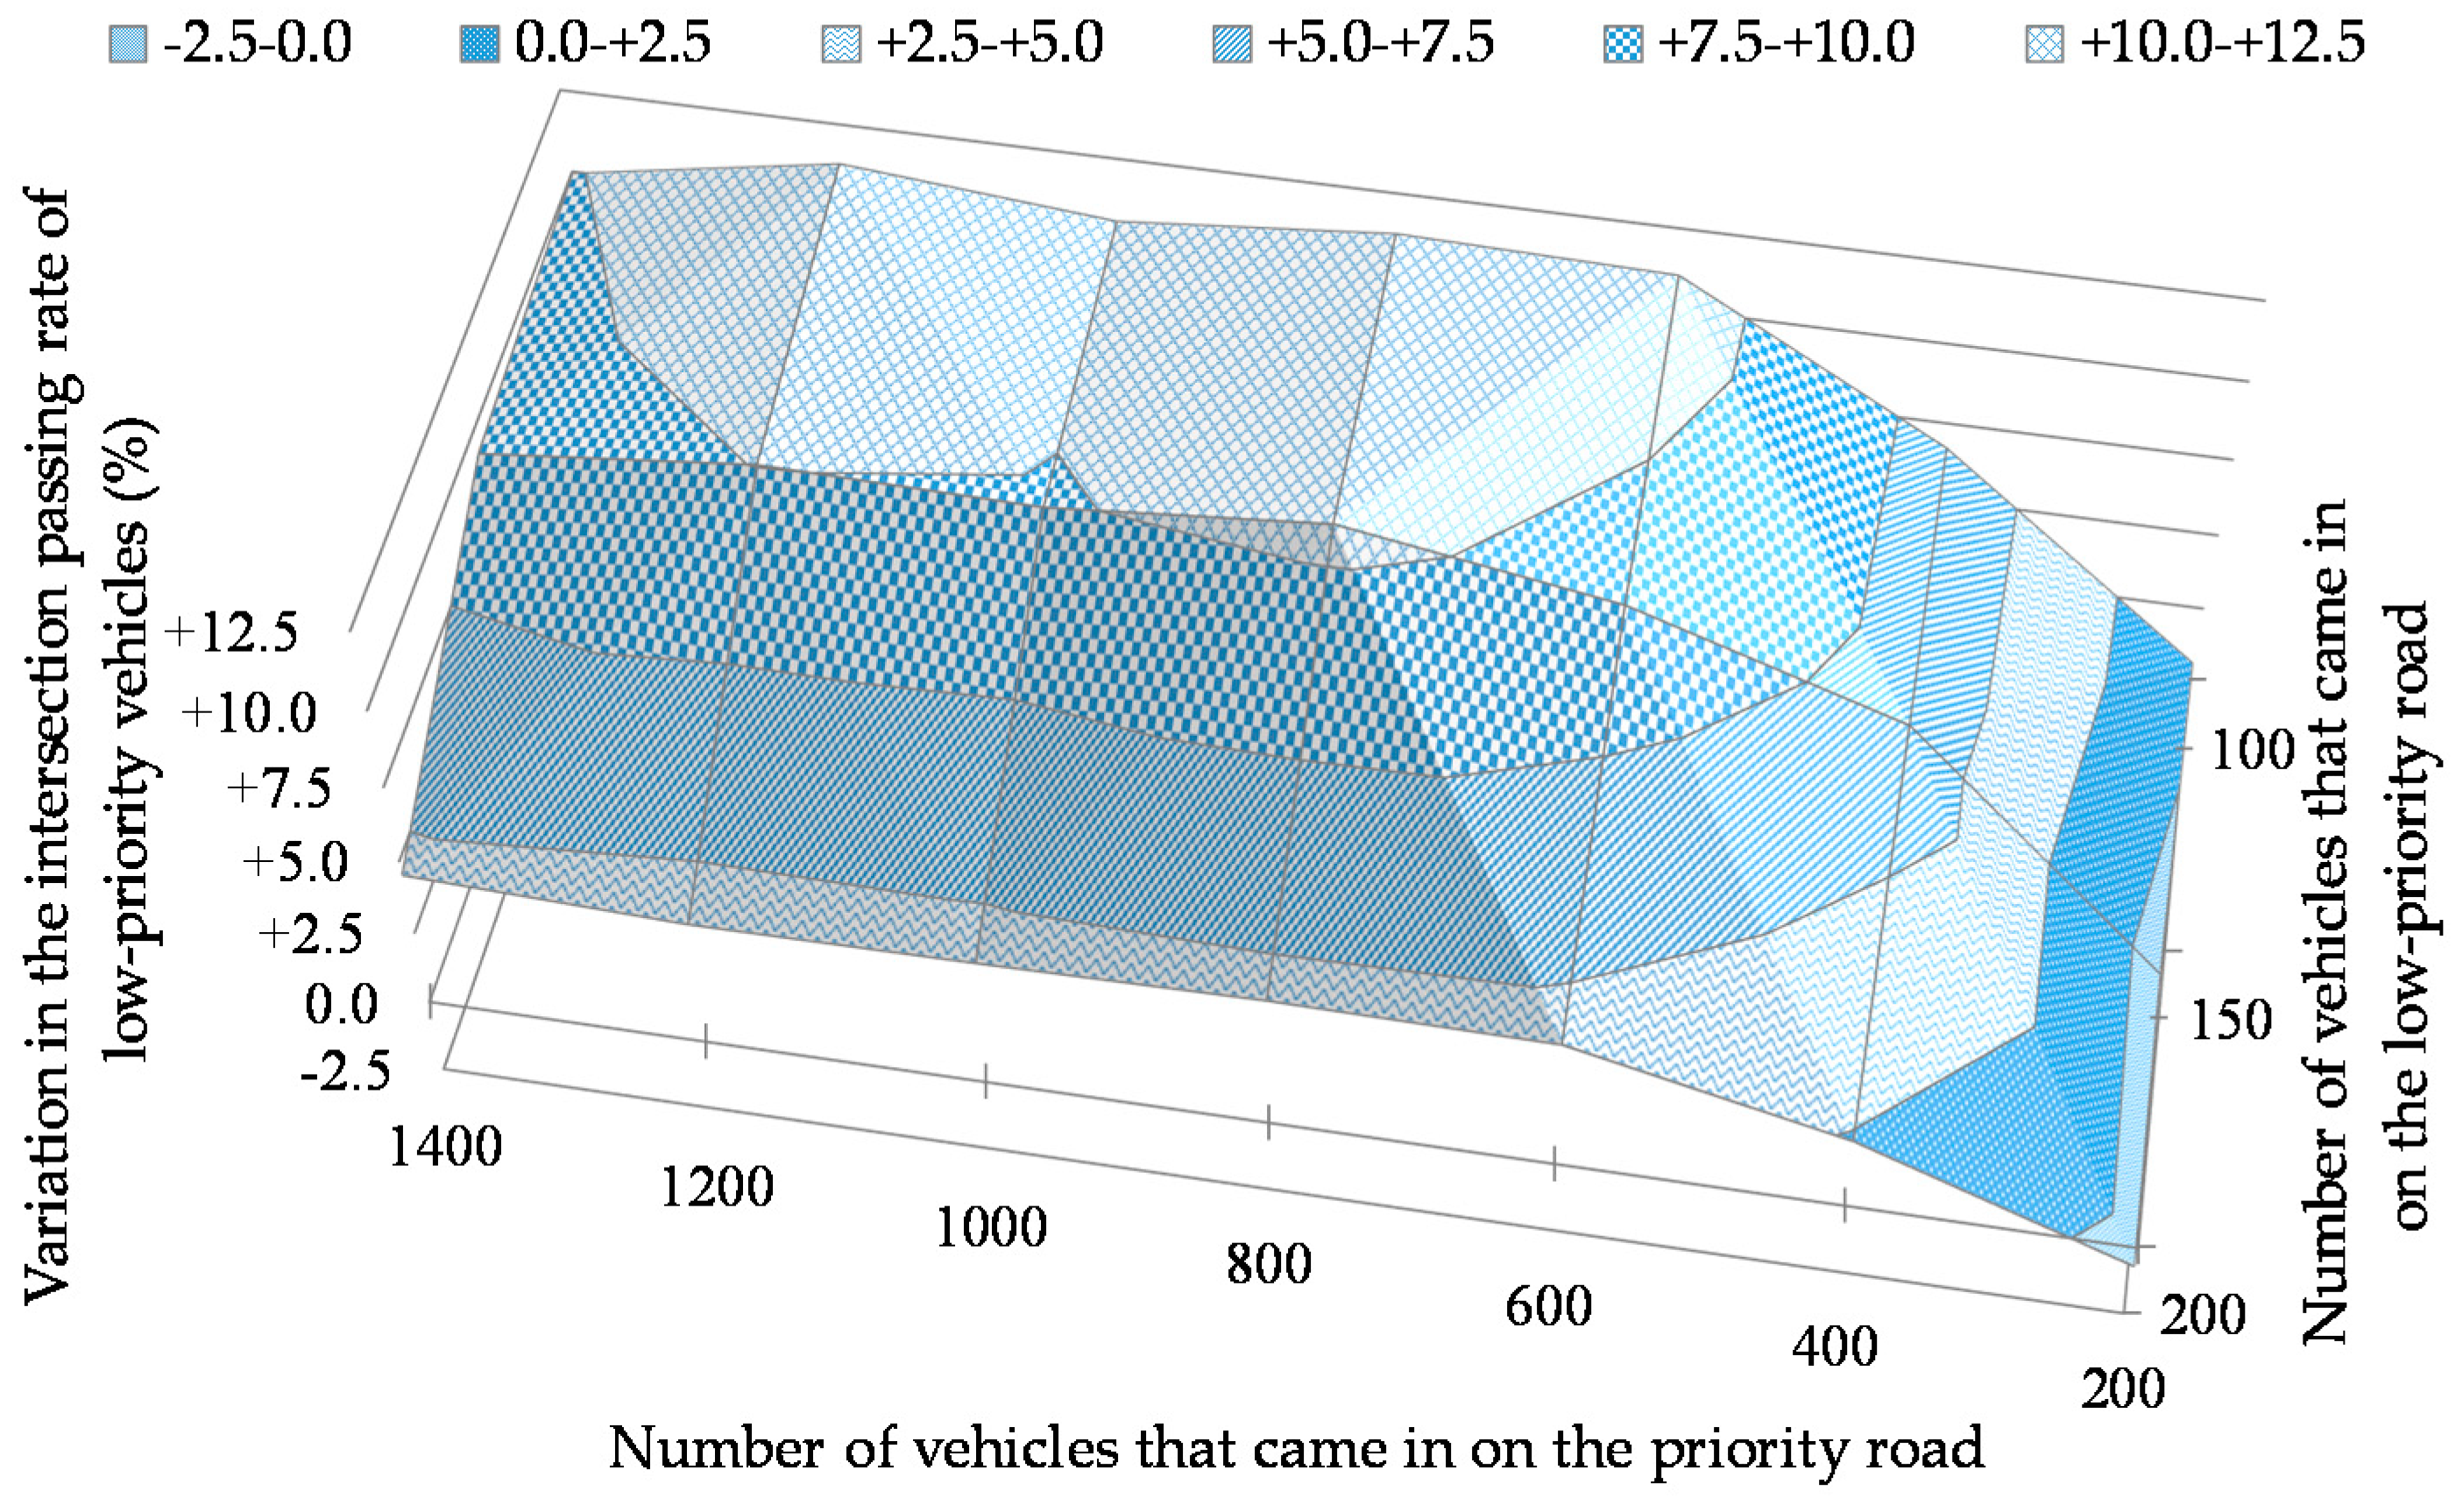
Figure 10.
Variation in the intersection passing rate of low-priority vehicles when the number of vehicles that came in were varied. The intersection passing rate was the average for the entire percentage range of self-driven vehicles.
Figure 10.
Variation in the intersection passing rate of low-priority vehicles when the number of vehicles that came in were varied. The intersection passing rate was the average for the entire percentage range of self-driven vehicles.
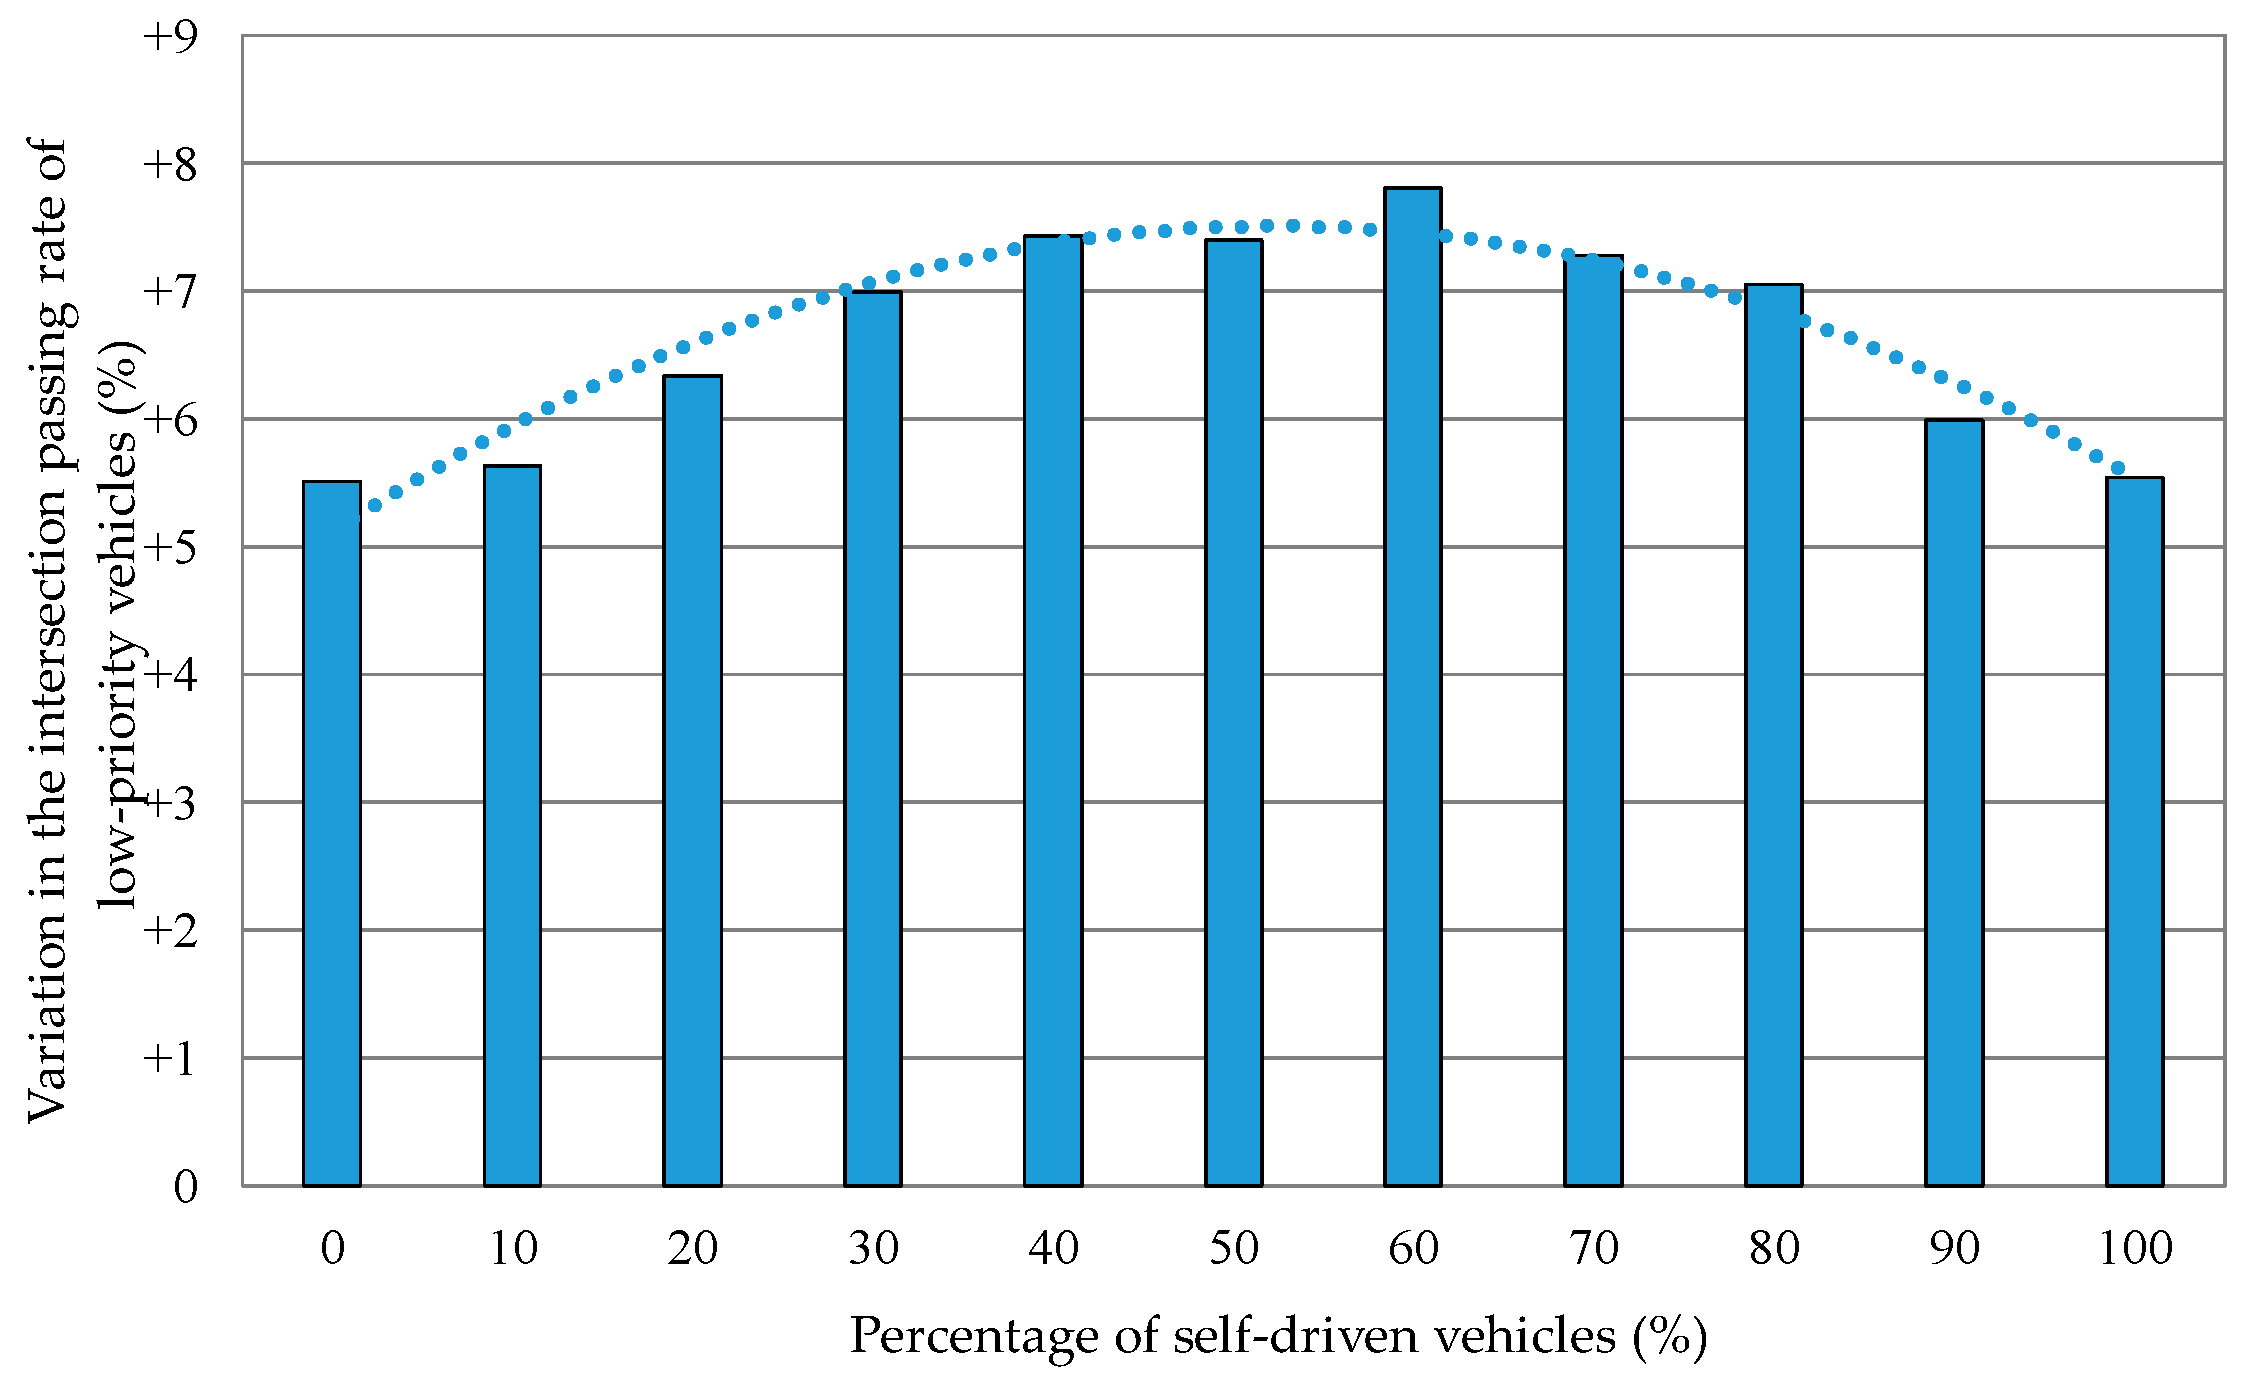
Figure 11.
Variation in the intersection passing rate of low-priority vehicles when the percentage of self-driven vehicles was varied. The intersection passing rate was the average for all the vehicles that came in.
Figure 11.
Variation in the intersection passing rate of low-priority vehicles when the percentage of self-driven vehicles was varied. The intersection passing rate was the average for all the vehicles that came in.
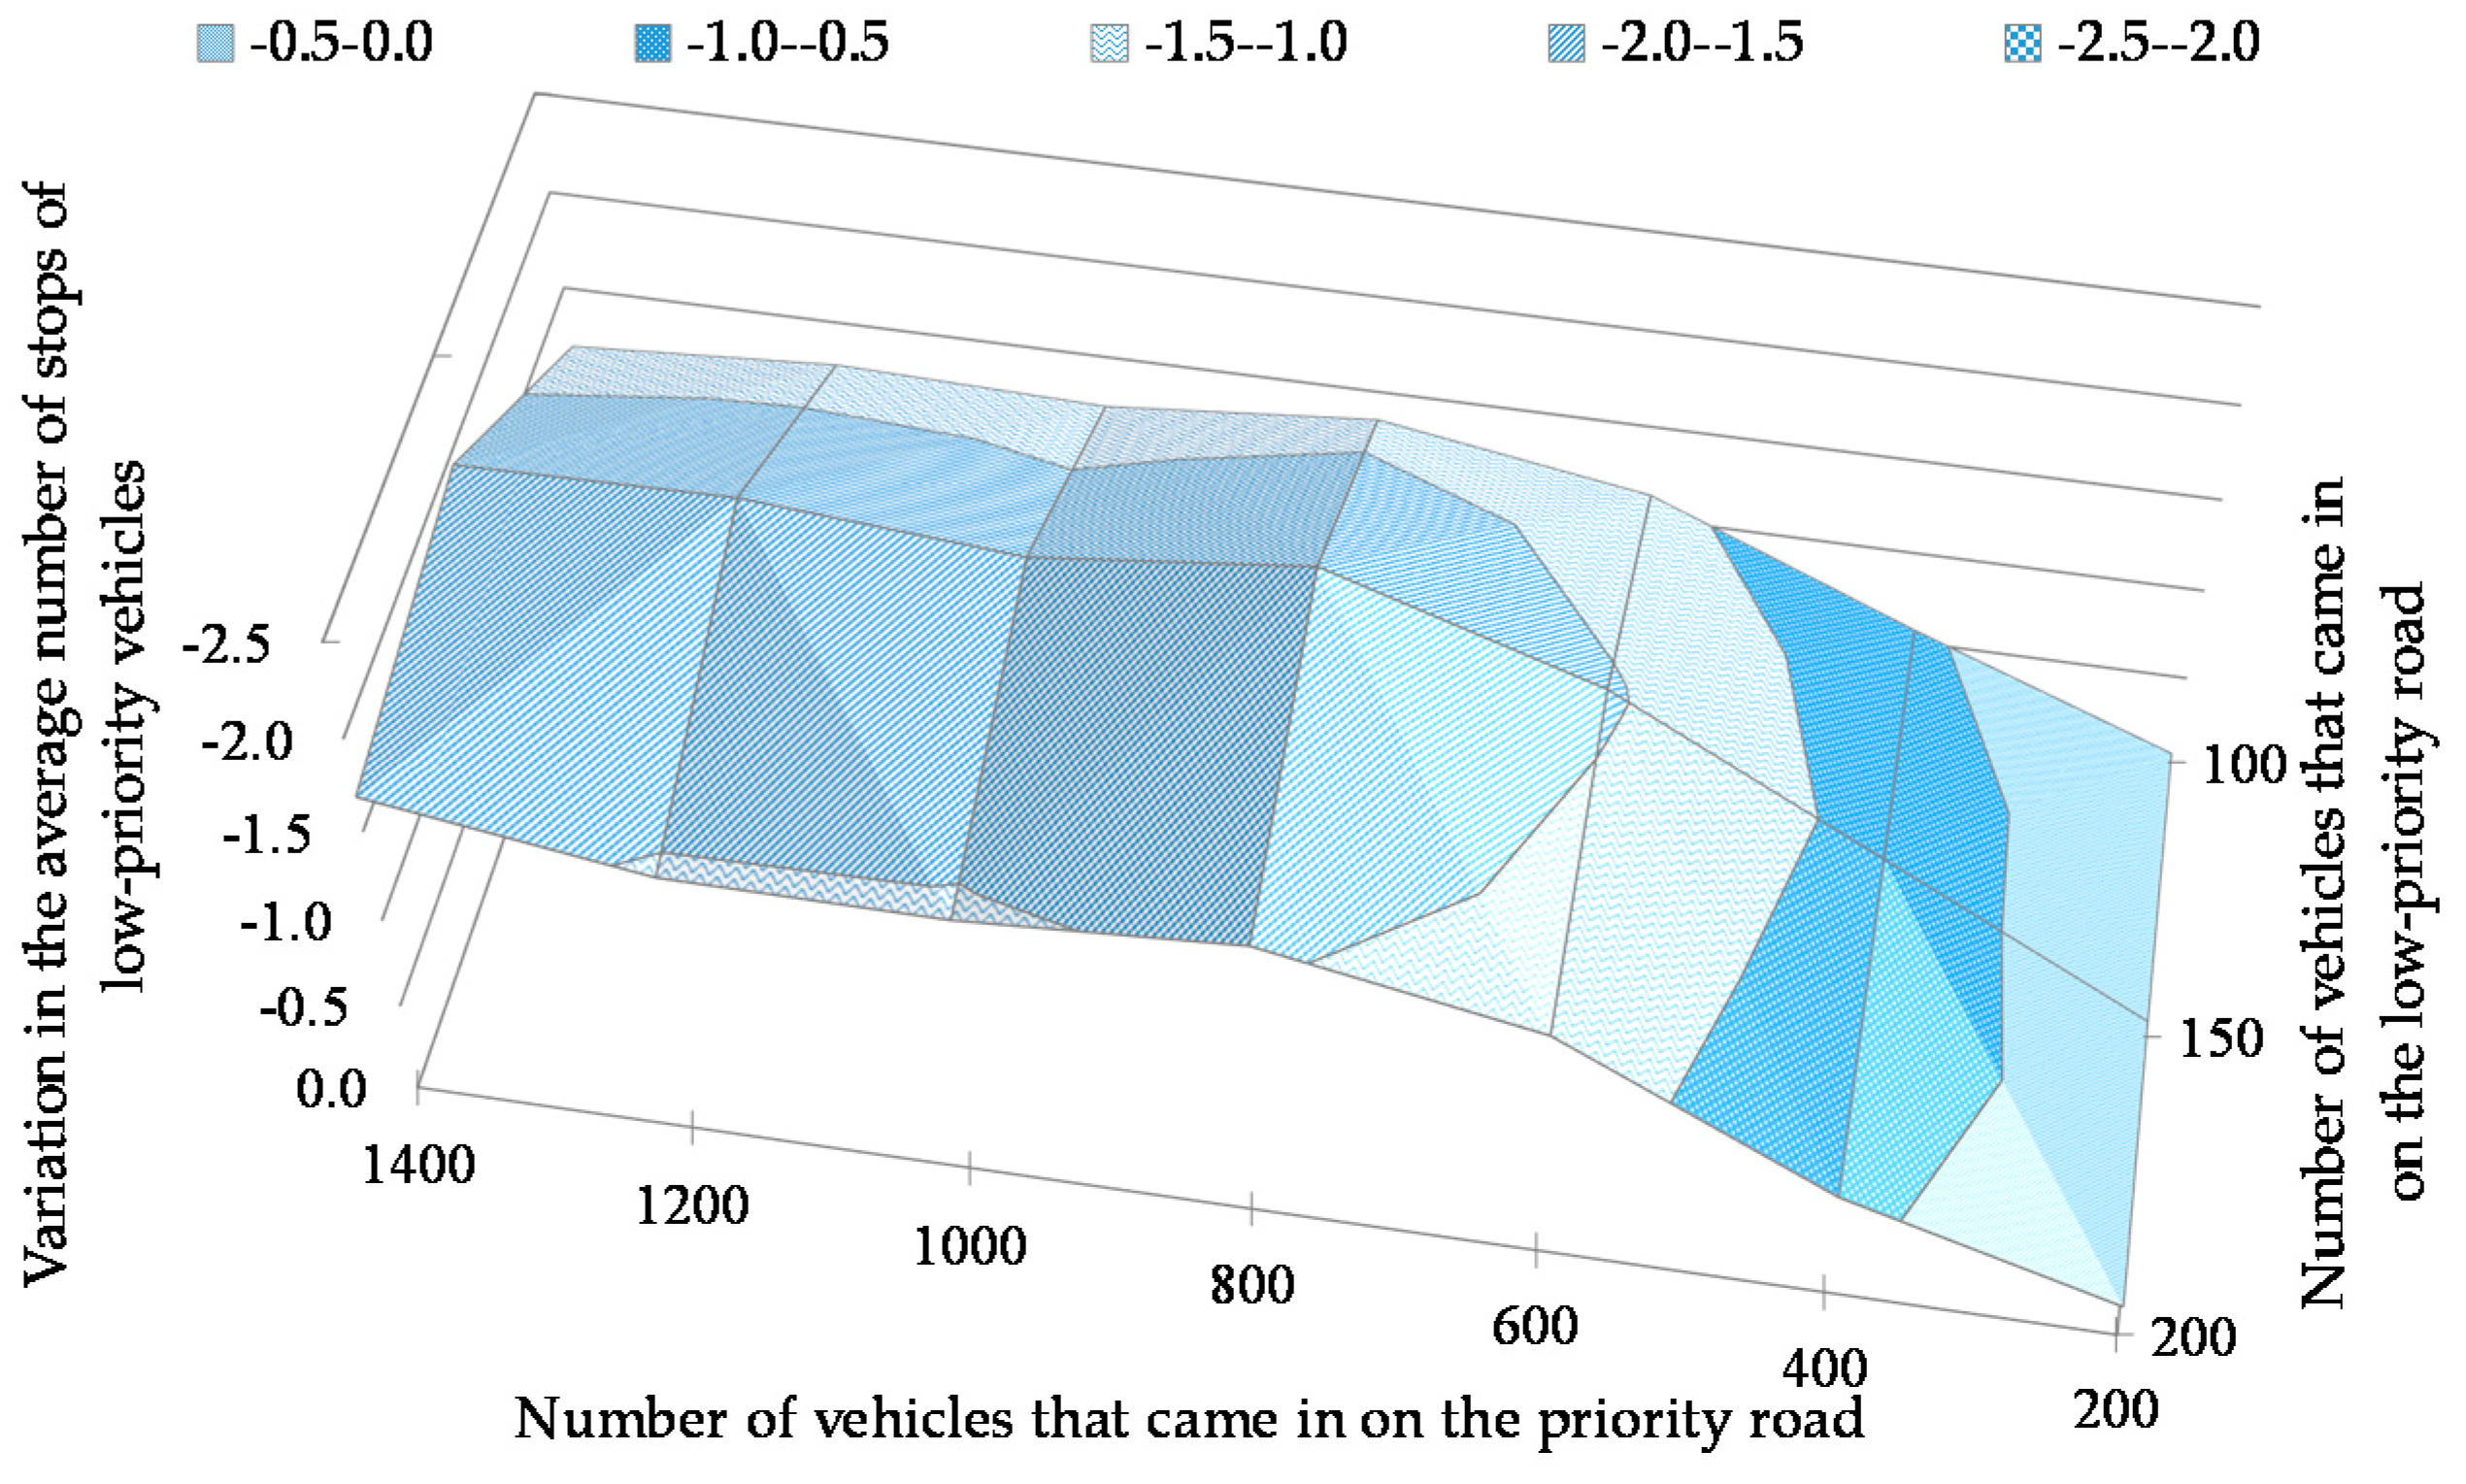
Figure 12.
Variation in the average number of stops of low-priority vehicles when the number of vehicles coming in was varied. The average number of stops was the average for the entire percentage range of self-driven vehicles.
Figure 12.
Variation in the average number of stops of low-priority vehicles when the number of vehicles coming in was varied. The average number of stops was the average for the entire percentage range of self-driven vehicles.
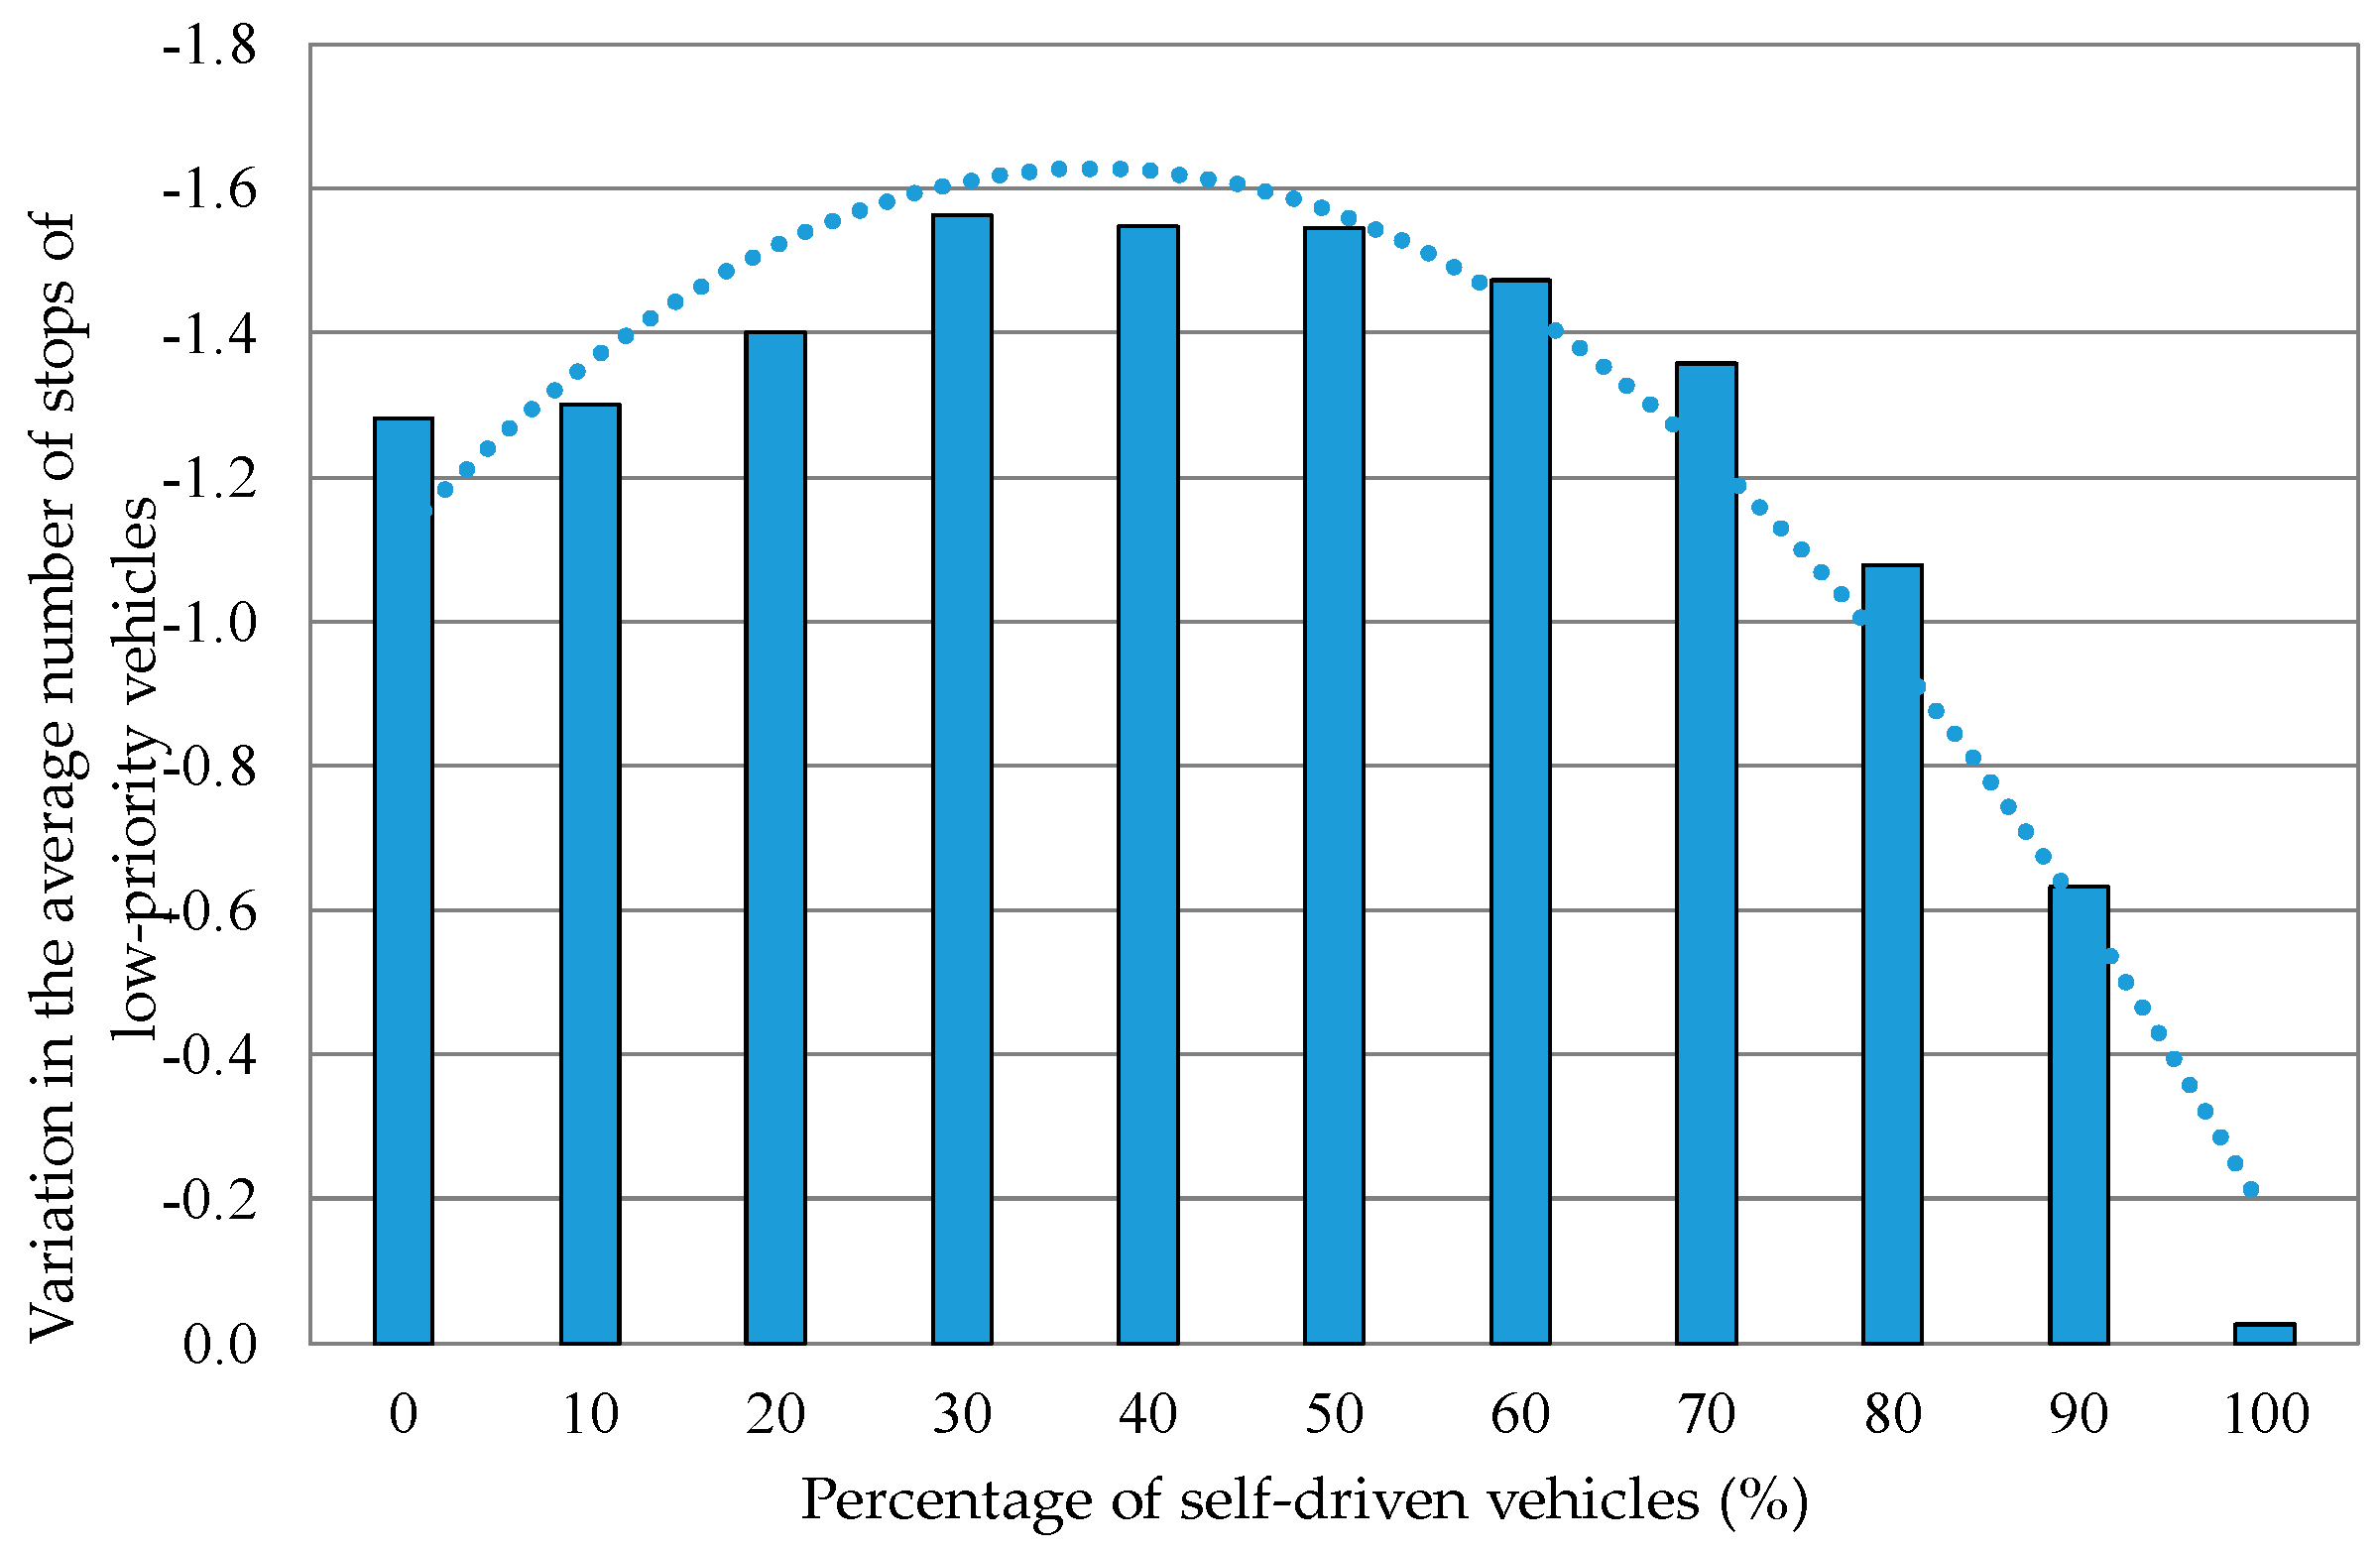
Figure 13.
Variation in the average number of stops of low-priority vehicles when the percentage of self-driven vehicles was varied. The average number of stops was the average for all the vehicles that came in.
Figure 13.
Variation in the average number of stops of low-priority vehicles when the percentage of self-driven vehicles was varied. The average number of stops was the average for all the vehicles that came in.
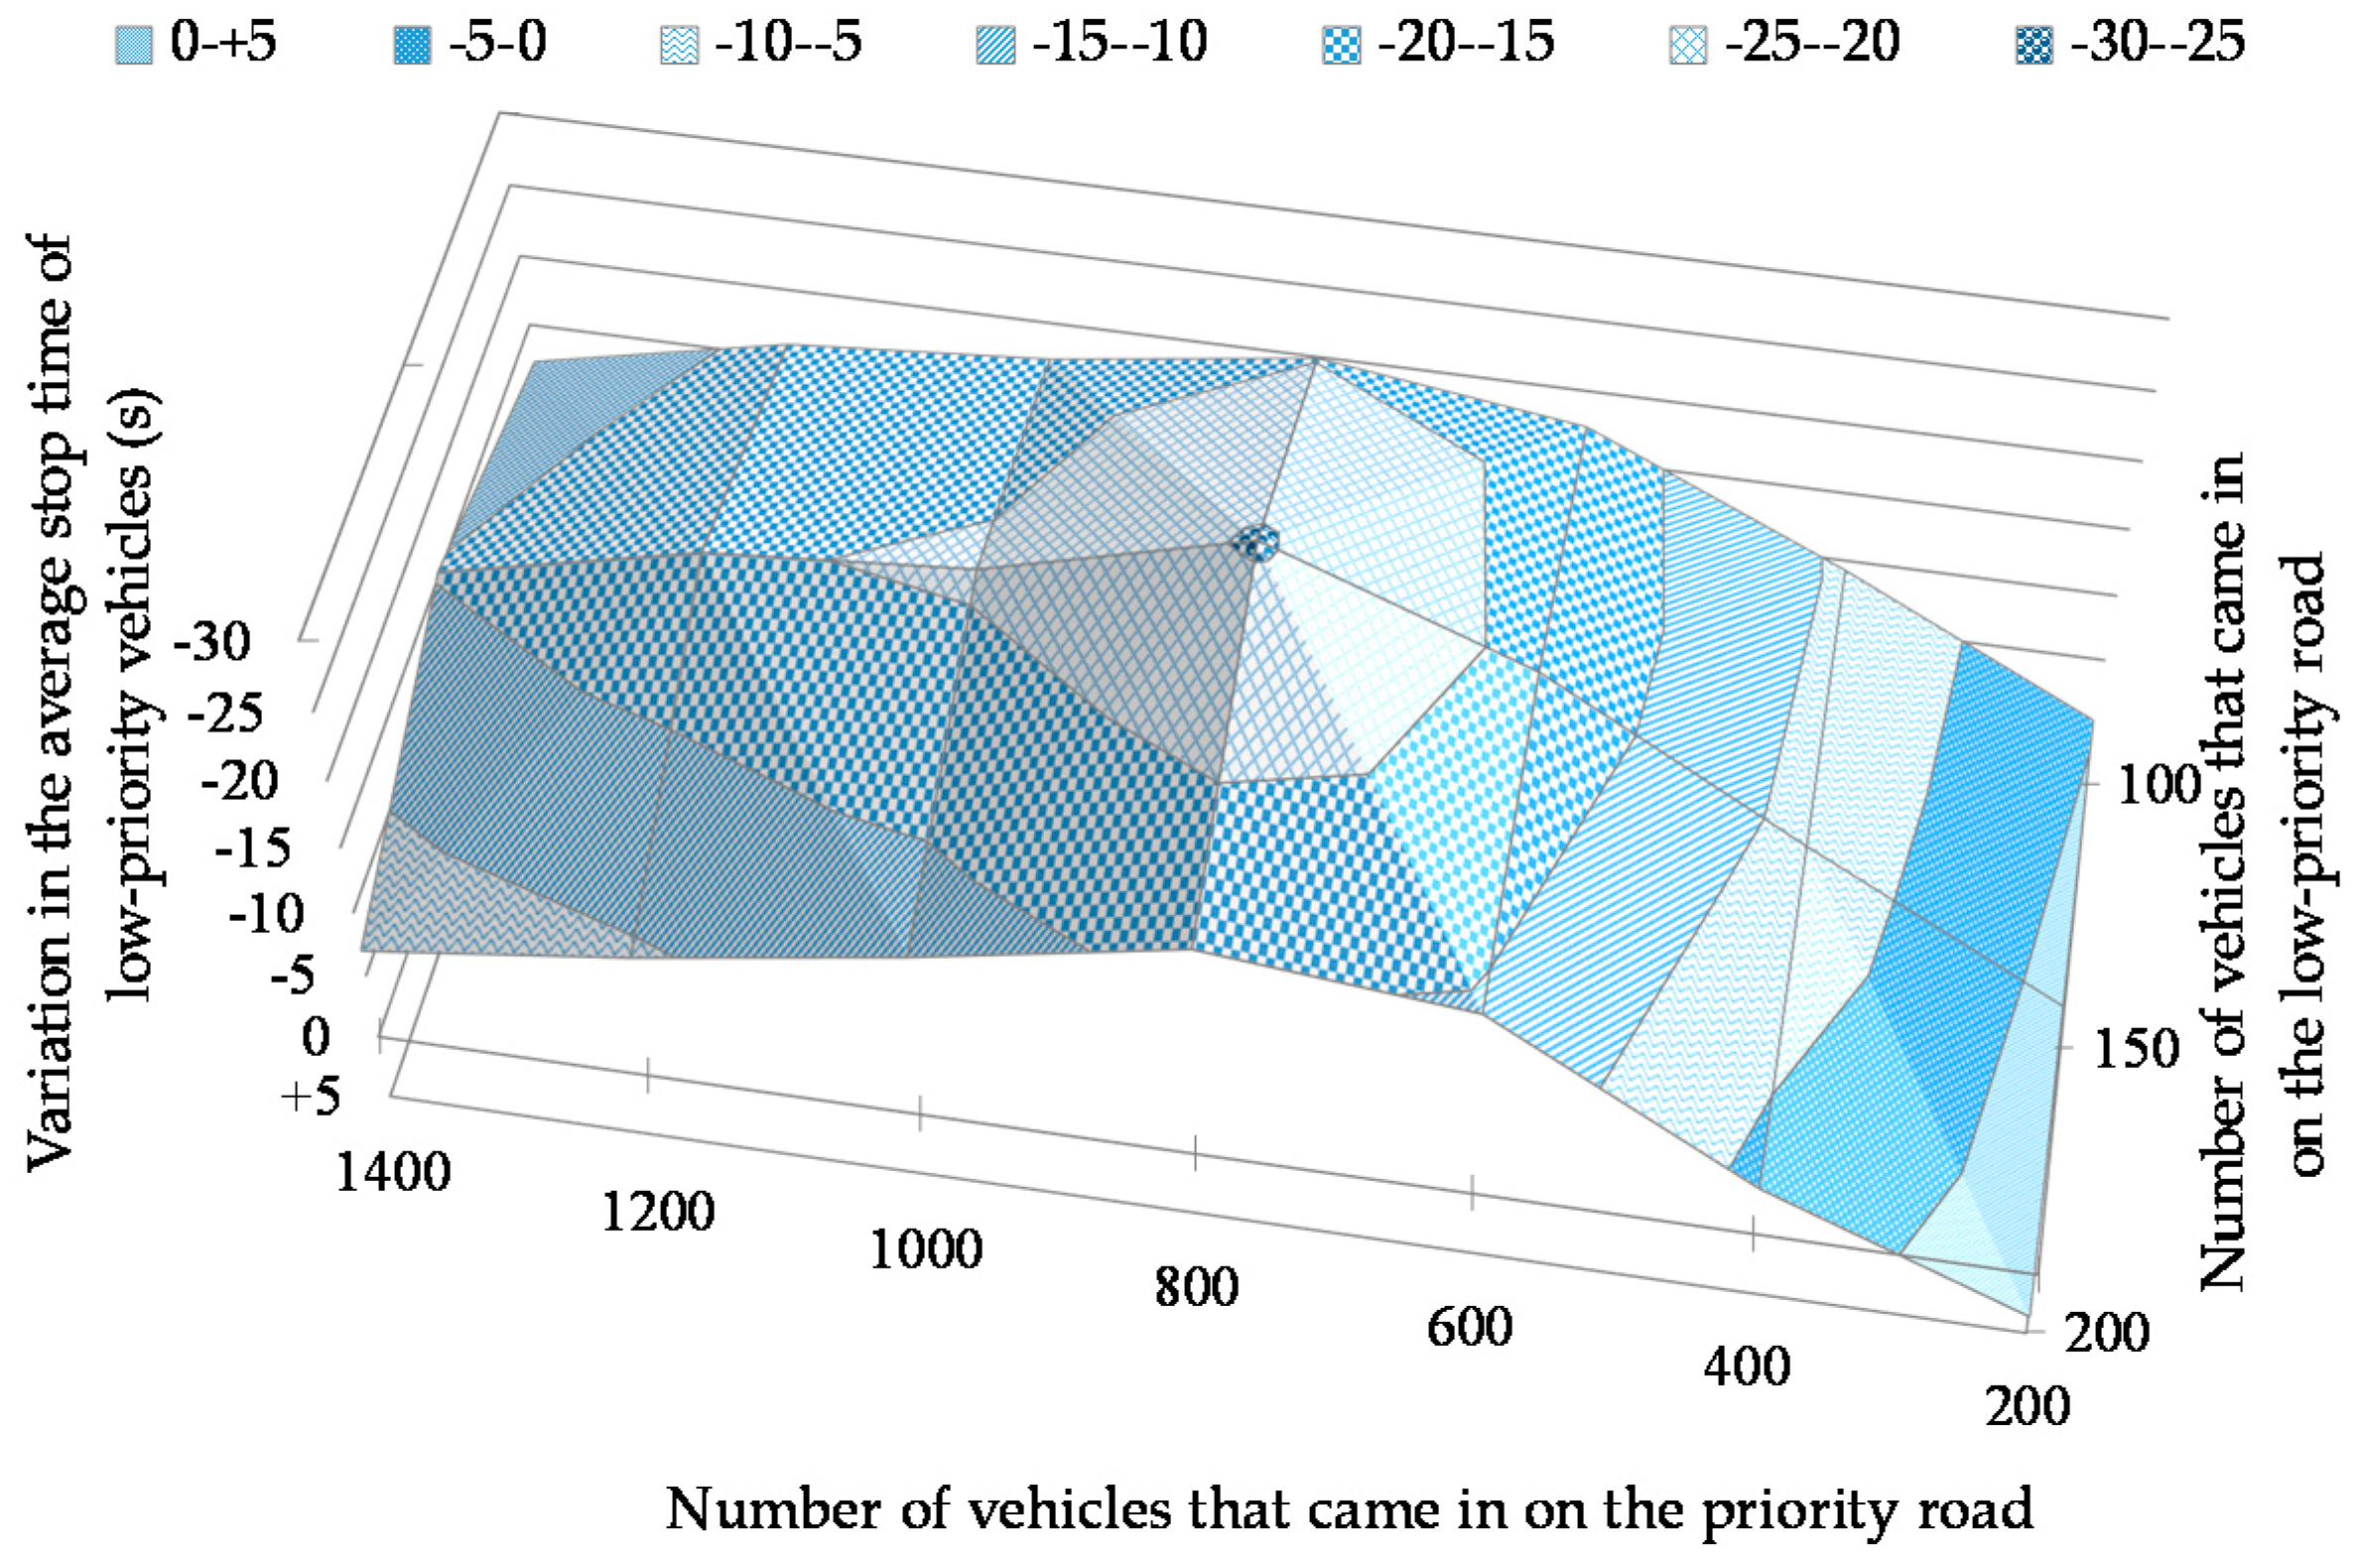
Figure 14.
Variation in the average stop time when the number of vehicles that came in was varied. The average stop time was the average for the entire percentage range of self-driven vehicles.
Figure 14.
Variation in the average stop time when the number of vehicles that came in was varied. The average stop time was the average for the entire percentage range of self-driven vehicles.
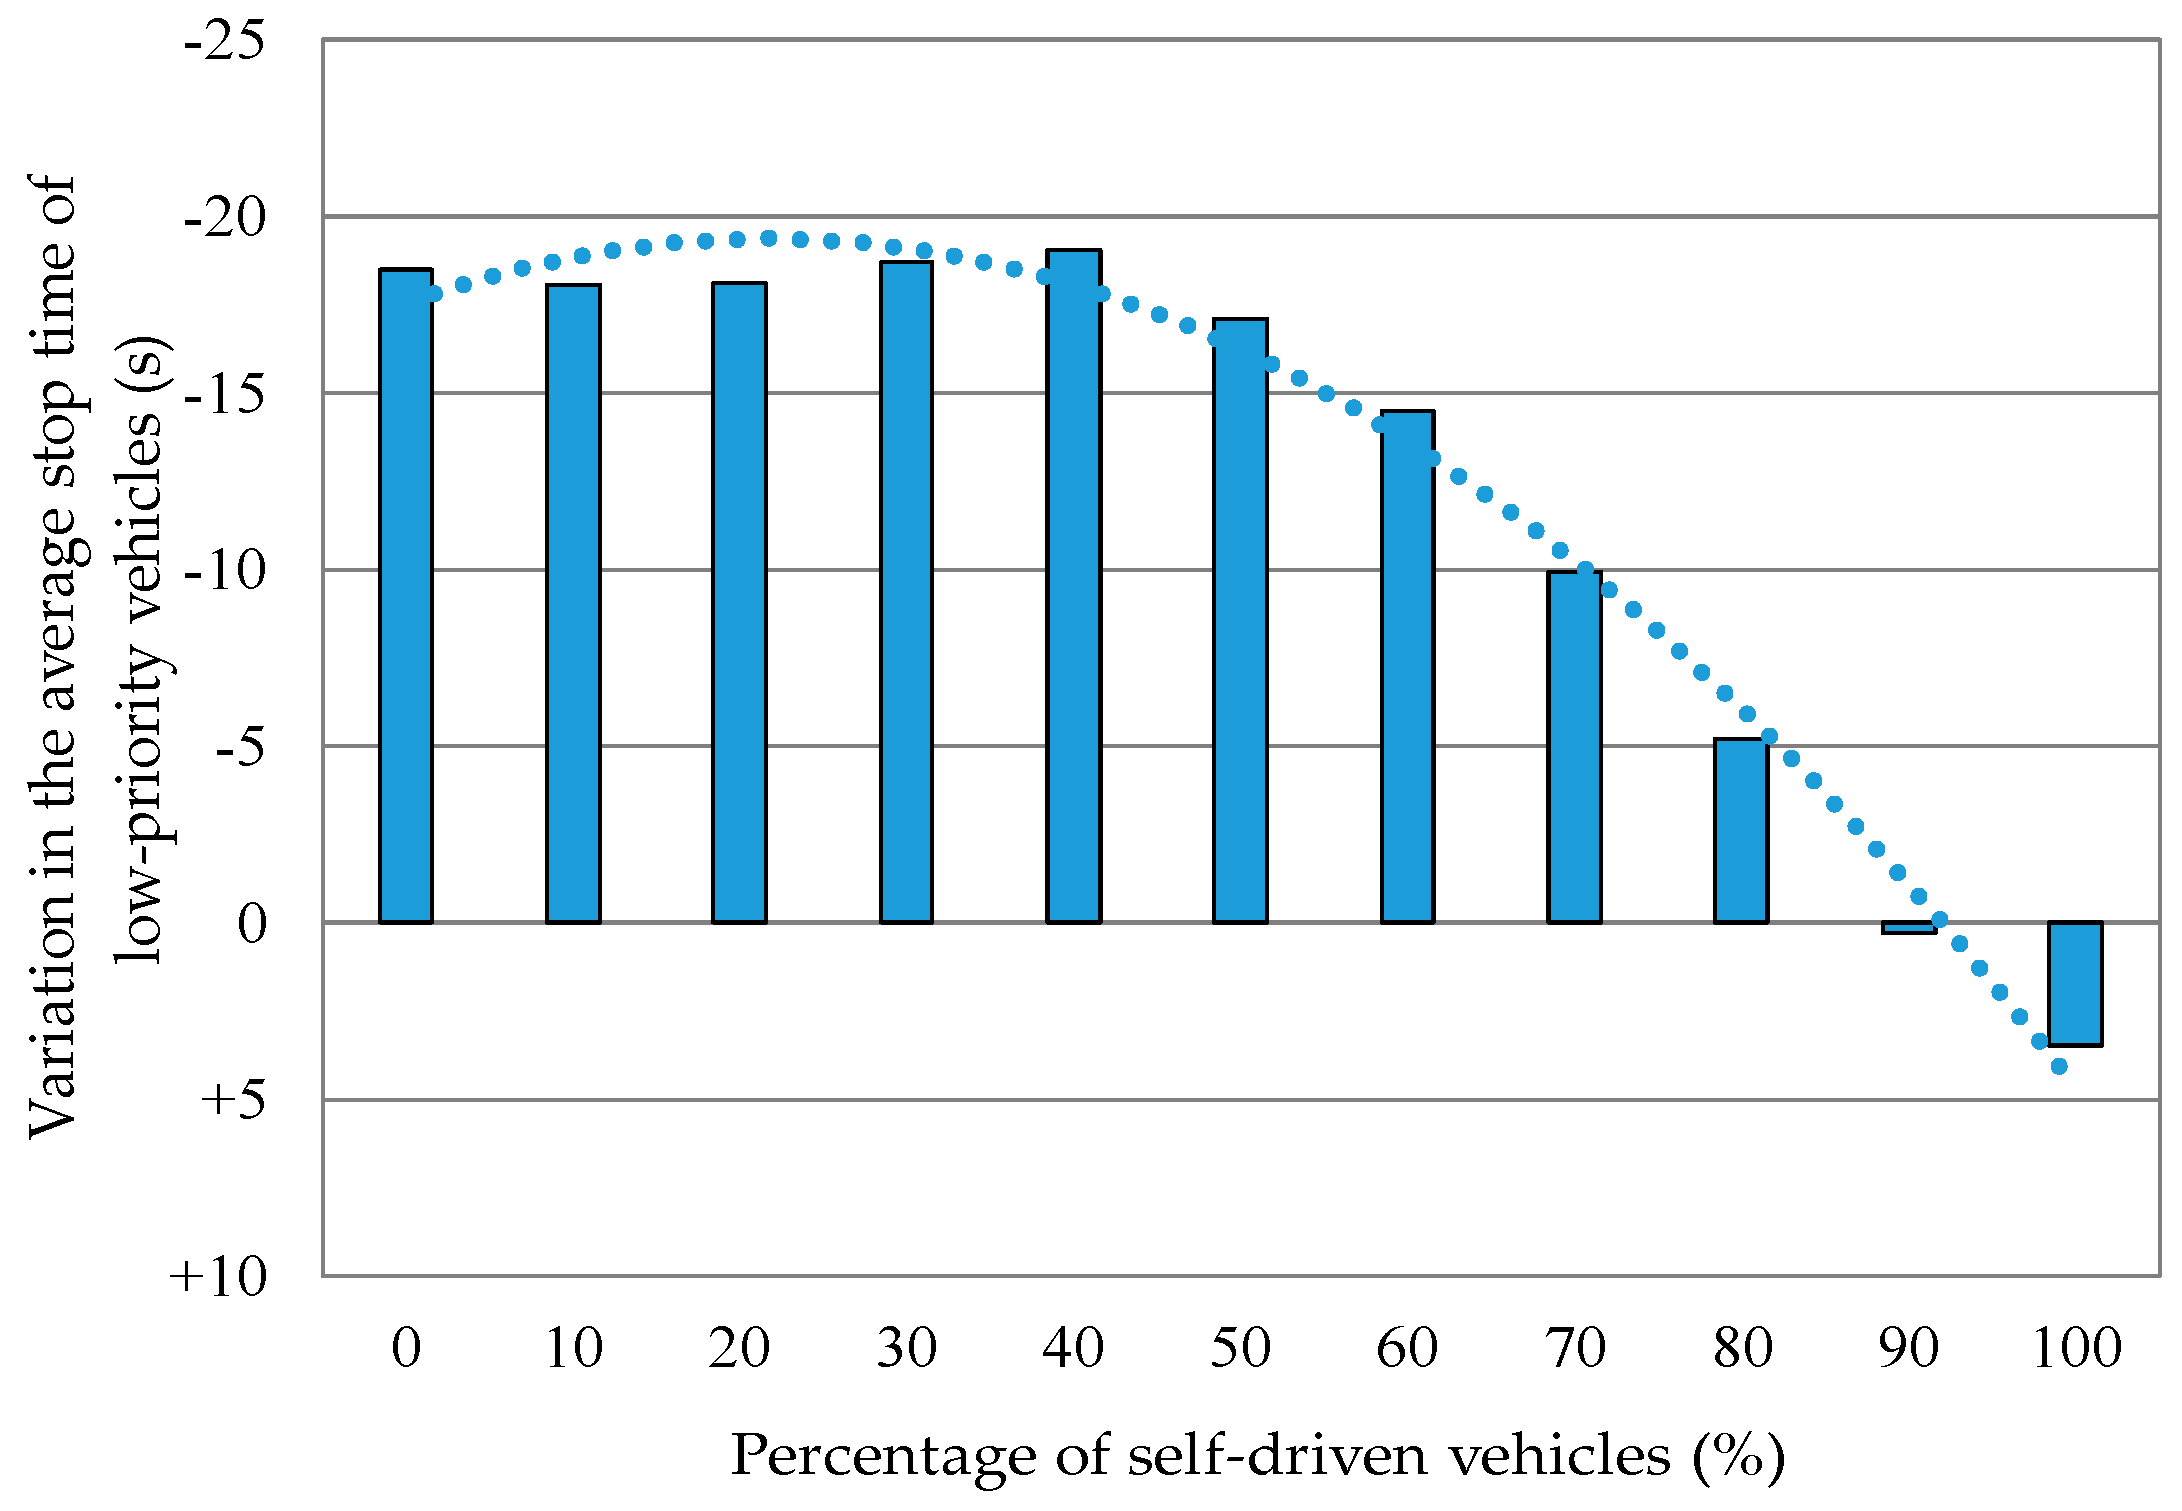
Figure 15.
Variation in the average stop time of low-priority vehicles when the percentage of self-driven vehicles was varied. The average stop time was the average for all the vehicles that came in.
Figure 15.
Variation in the average stop time of low-priority vehicles when the percentage of self-driven vehicles was varied. The average stop time was the average for all the vehicles that came in.
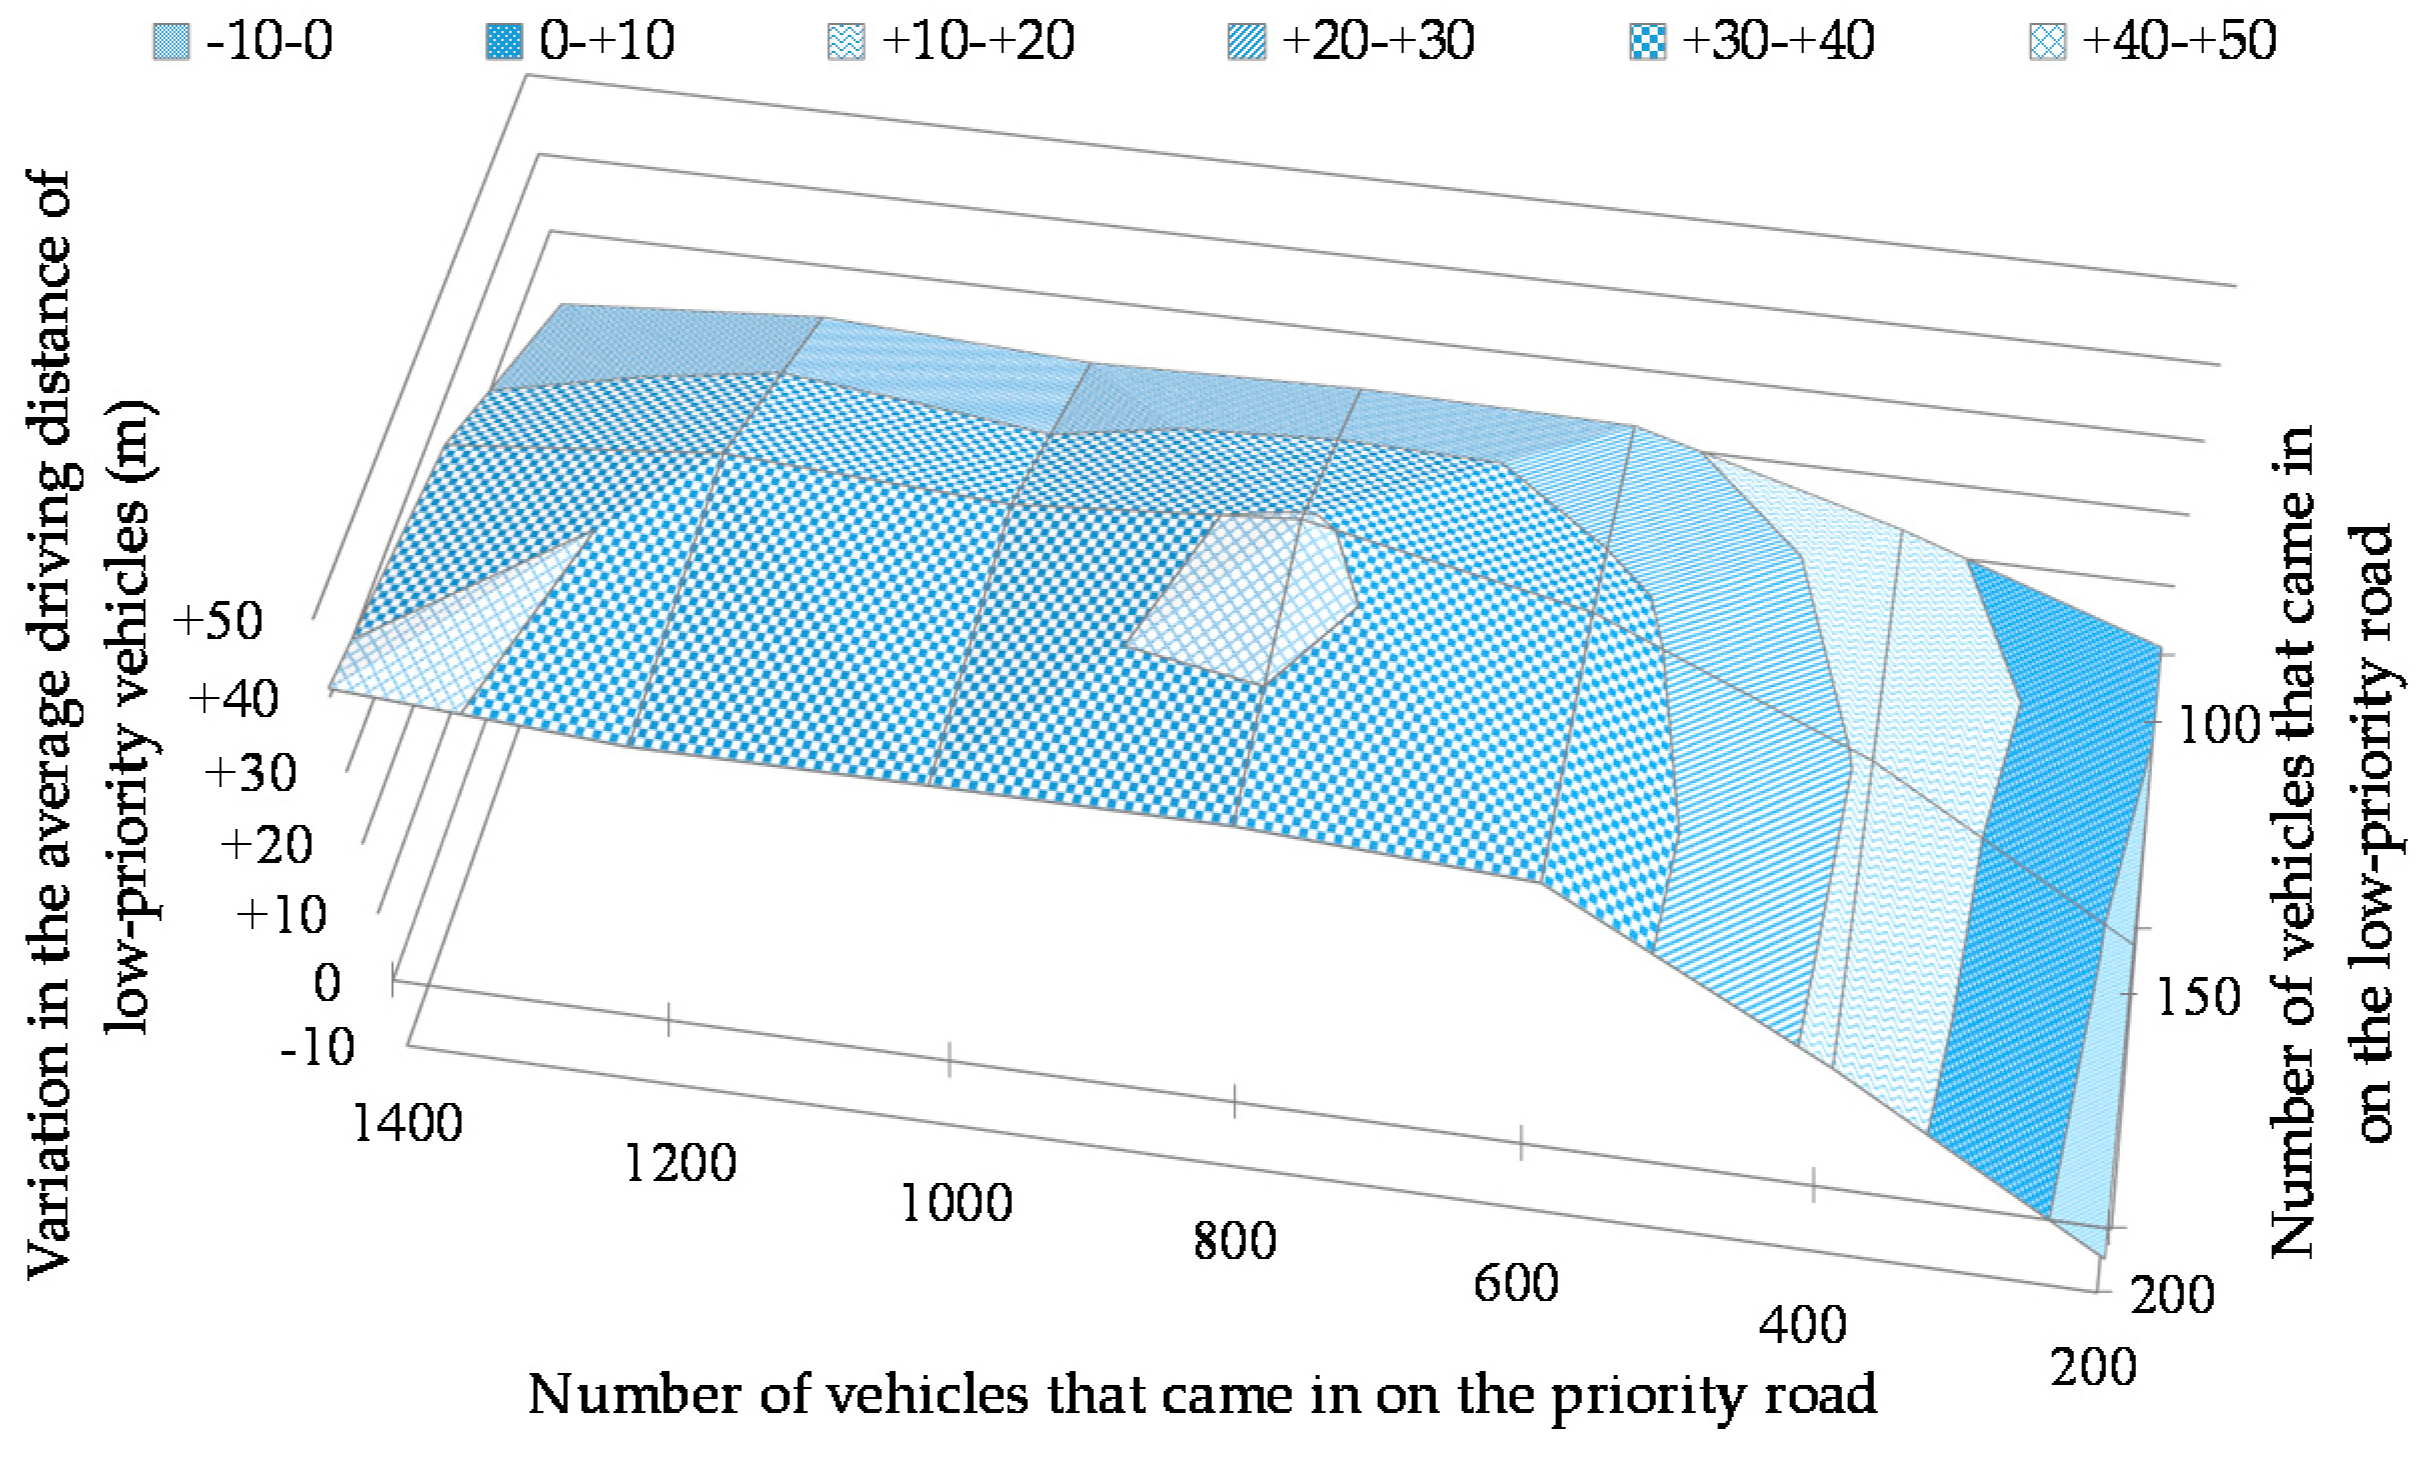
Figure 16.
Variation in the average driving distance of low-priority vehicles that came in when the number of vehicles that came in was varied. The average driving distance was the average for the entire percentage range of self-driven vehicles.
Figure 16.
Variation in the average driving distance of low-priority vehicles that came in when the number of vehicles that came in was varied. The average driving distance was the average for the entire percentage range of self-driven vehicles.
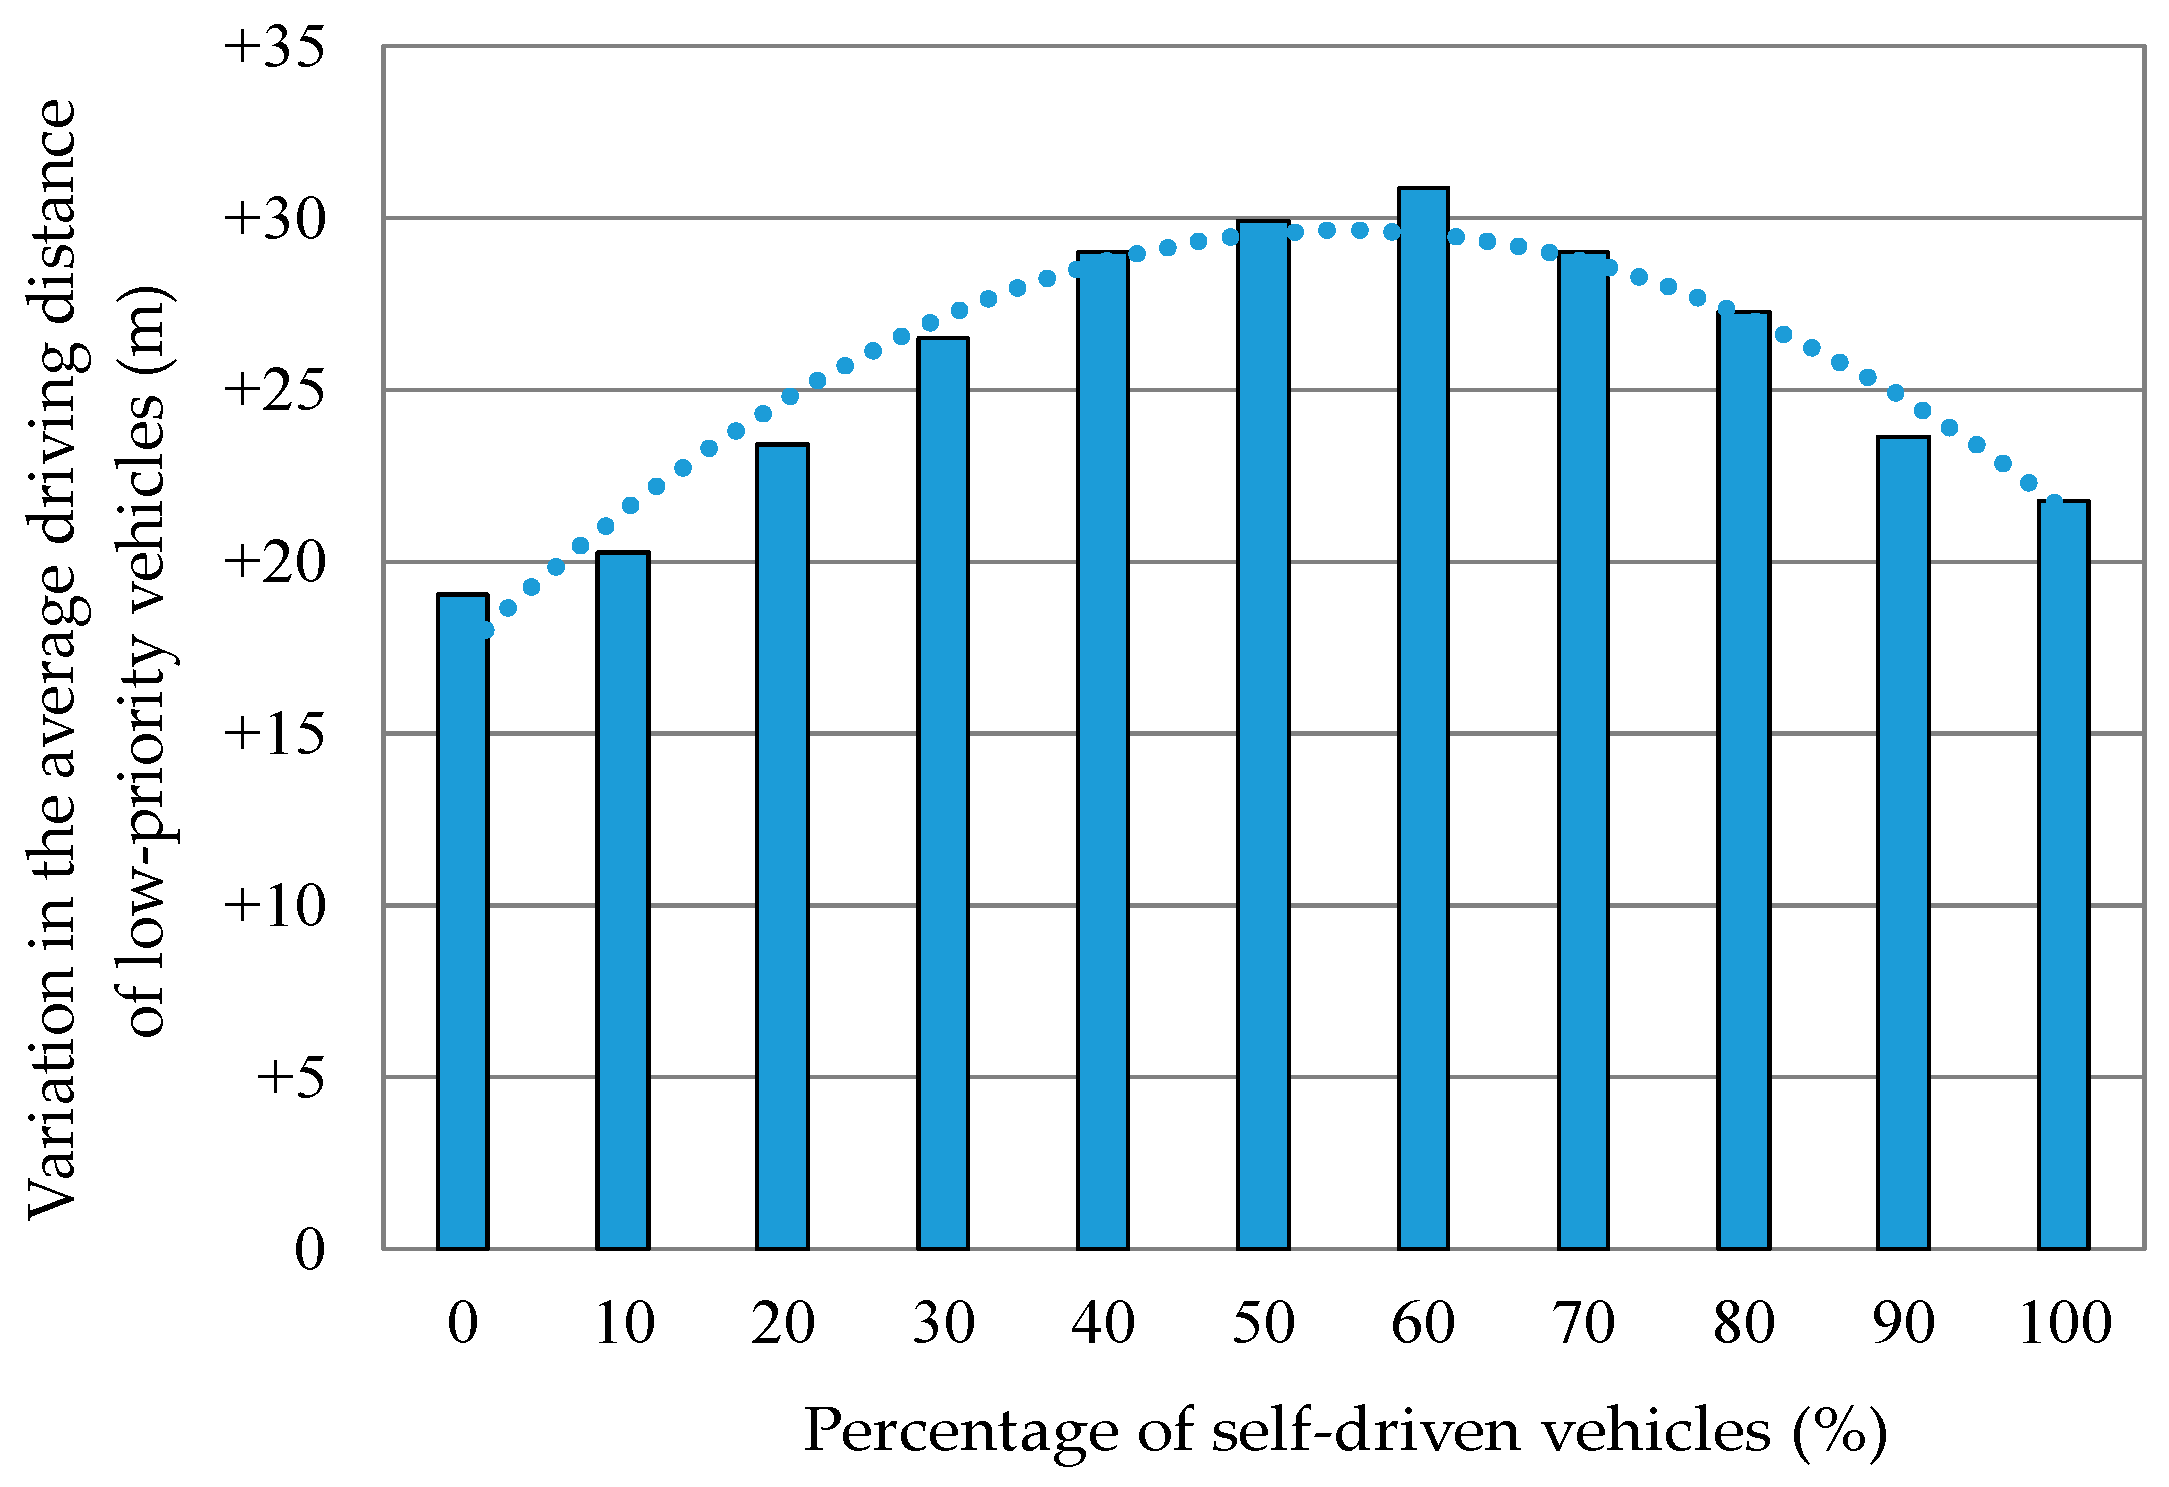
Figure 17.
Variation in the average driving distance of low-priority vehicles when the percentage of self-driven vehicles was varied. The average driving distance was the average for all the vehicles that came in.
Figure 17.
Variation in the average driving distance of low-priority vehicles when the percentage of self-driven vehicles was varied. The average driving distance was the average for all the vehicles that came in.
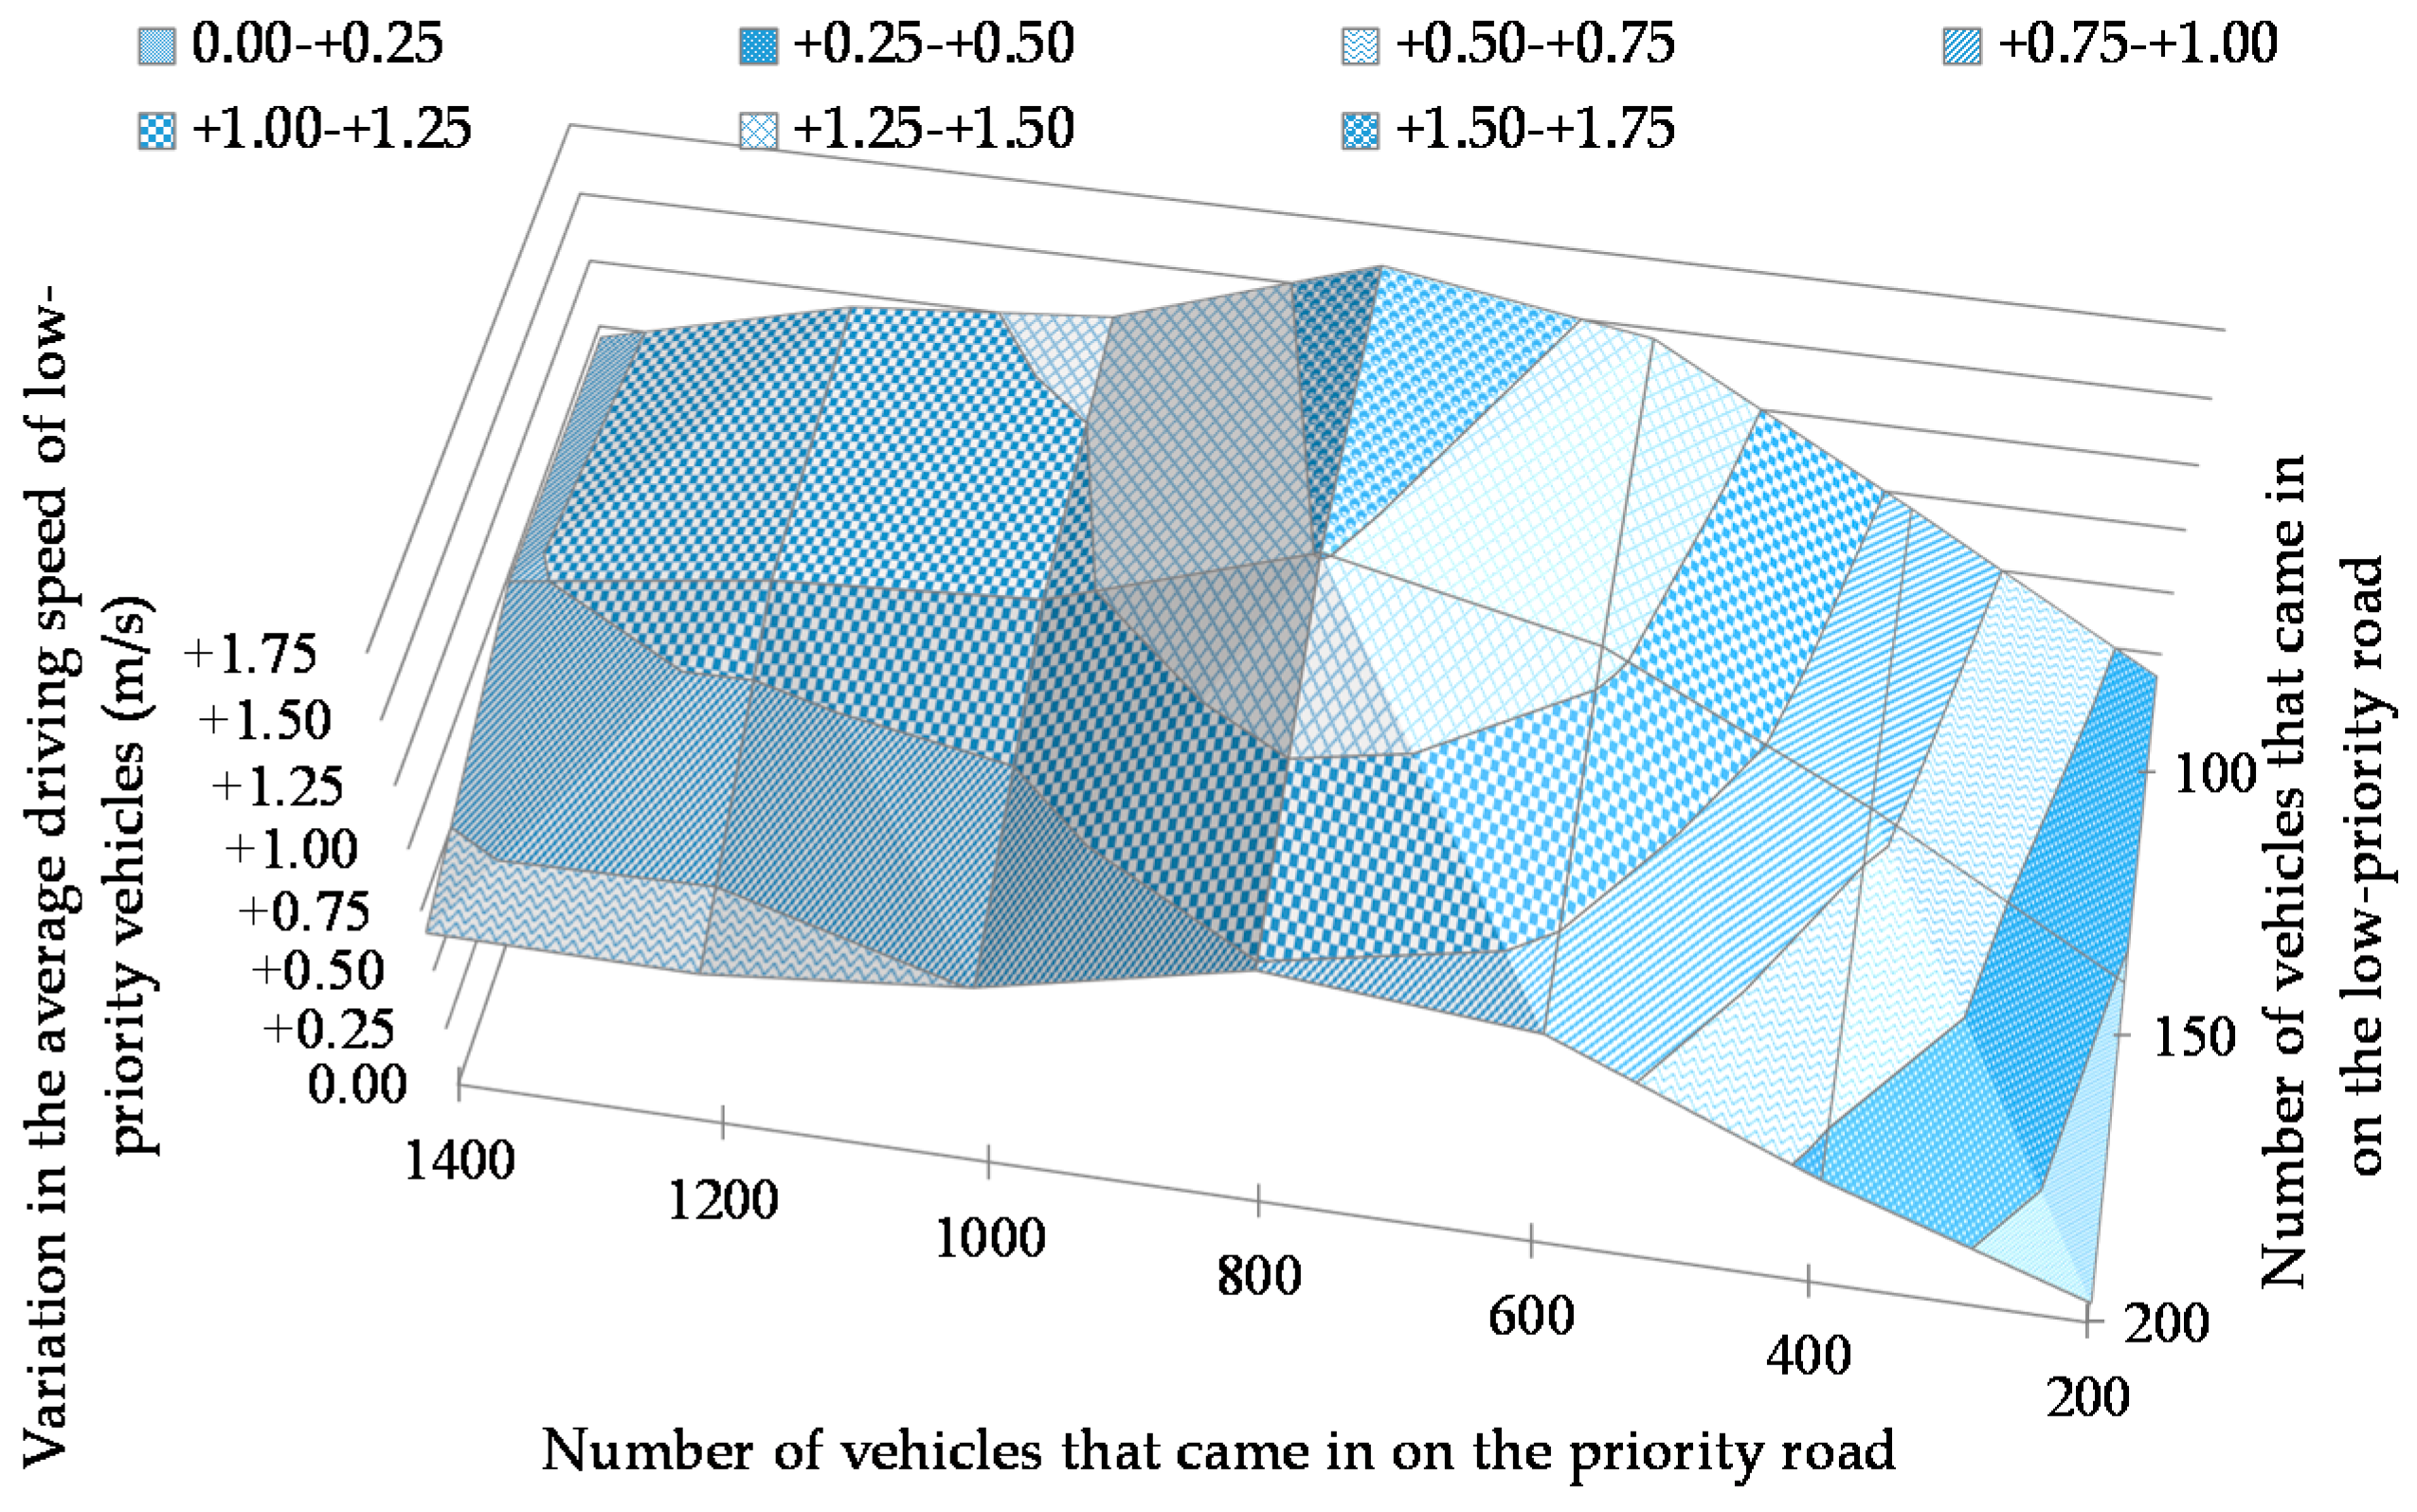
Figure 18.
Variation in the average driving speed of low-priority vehicles when the number of vehicles that came in was varied. The average driving speed was the average for the entire percentage range of self-driven vehicles.
Figure 18.
Variation in the average driving speed of low-priority vehicles when the number of vehicles that came in was varied. The average driving speed was the average for the entire percentage range of self-driven vehicles.
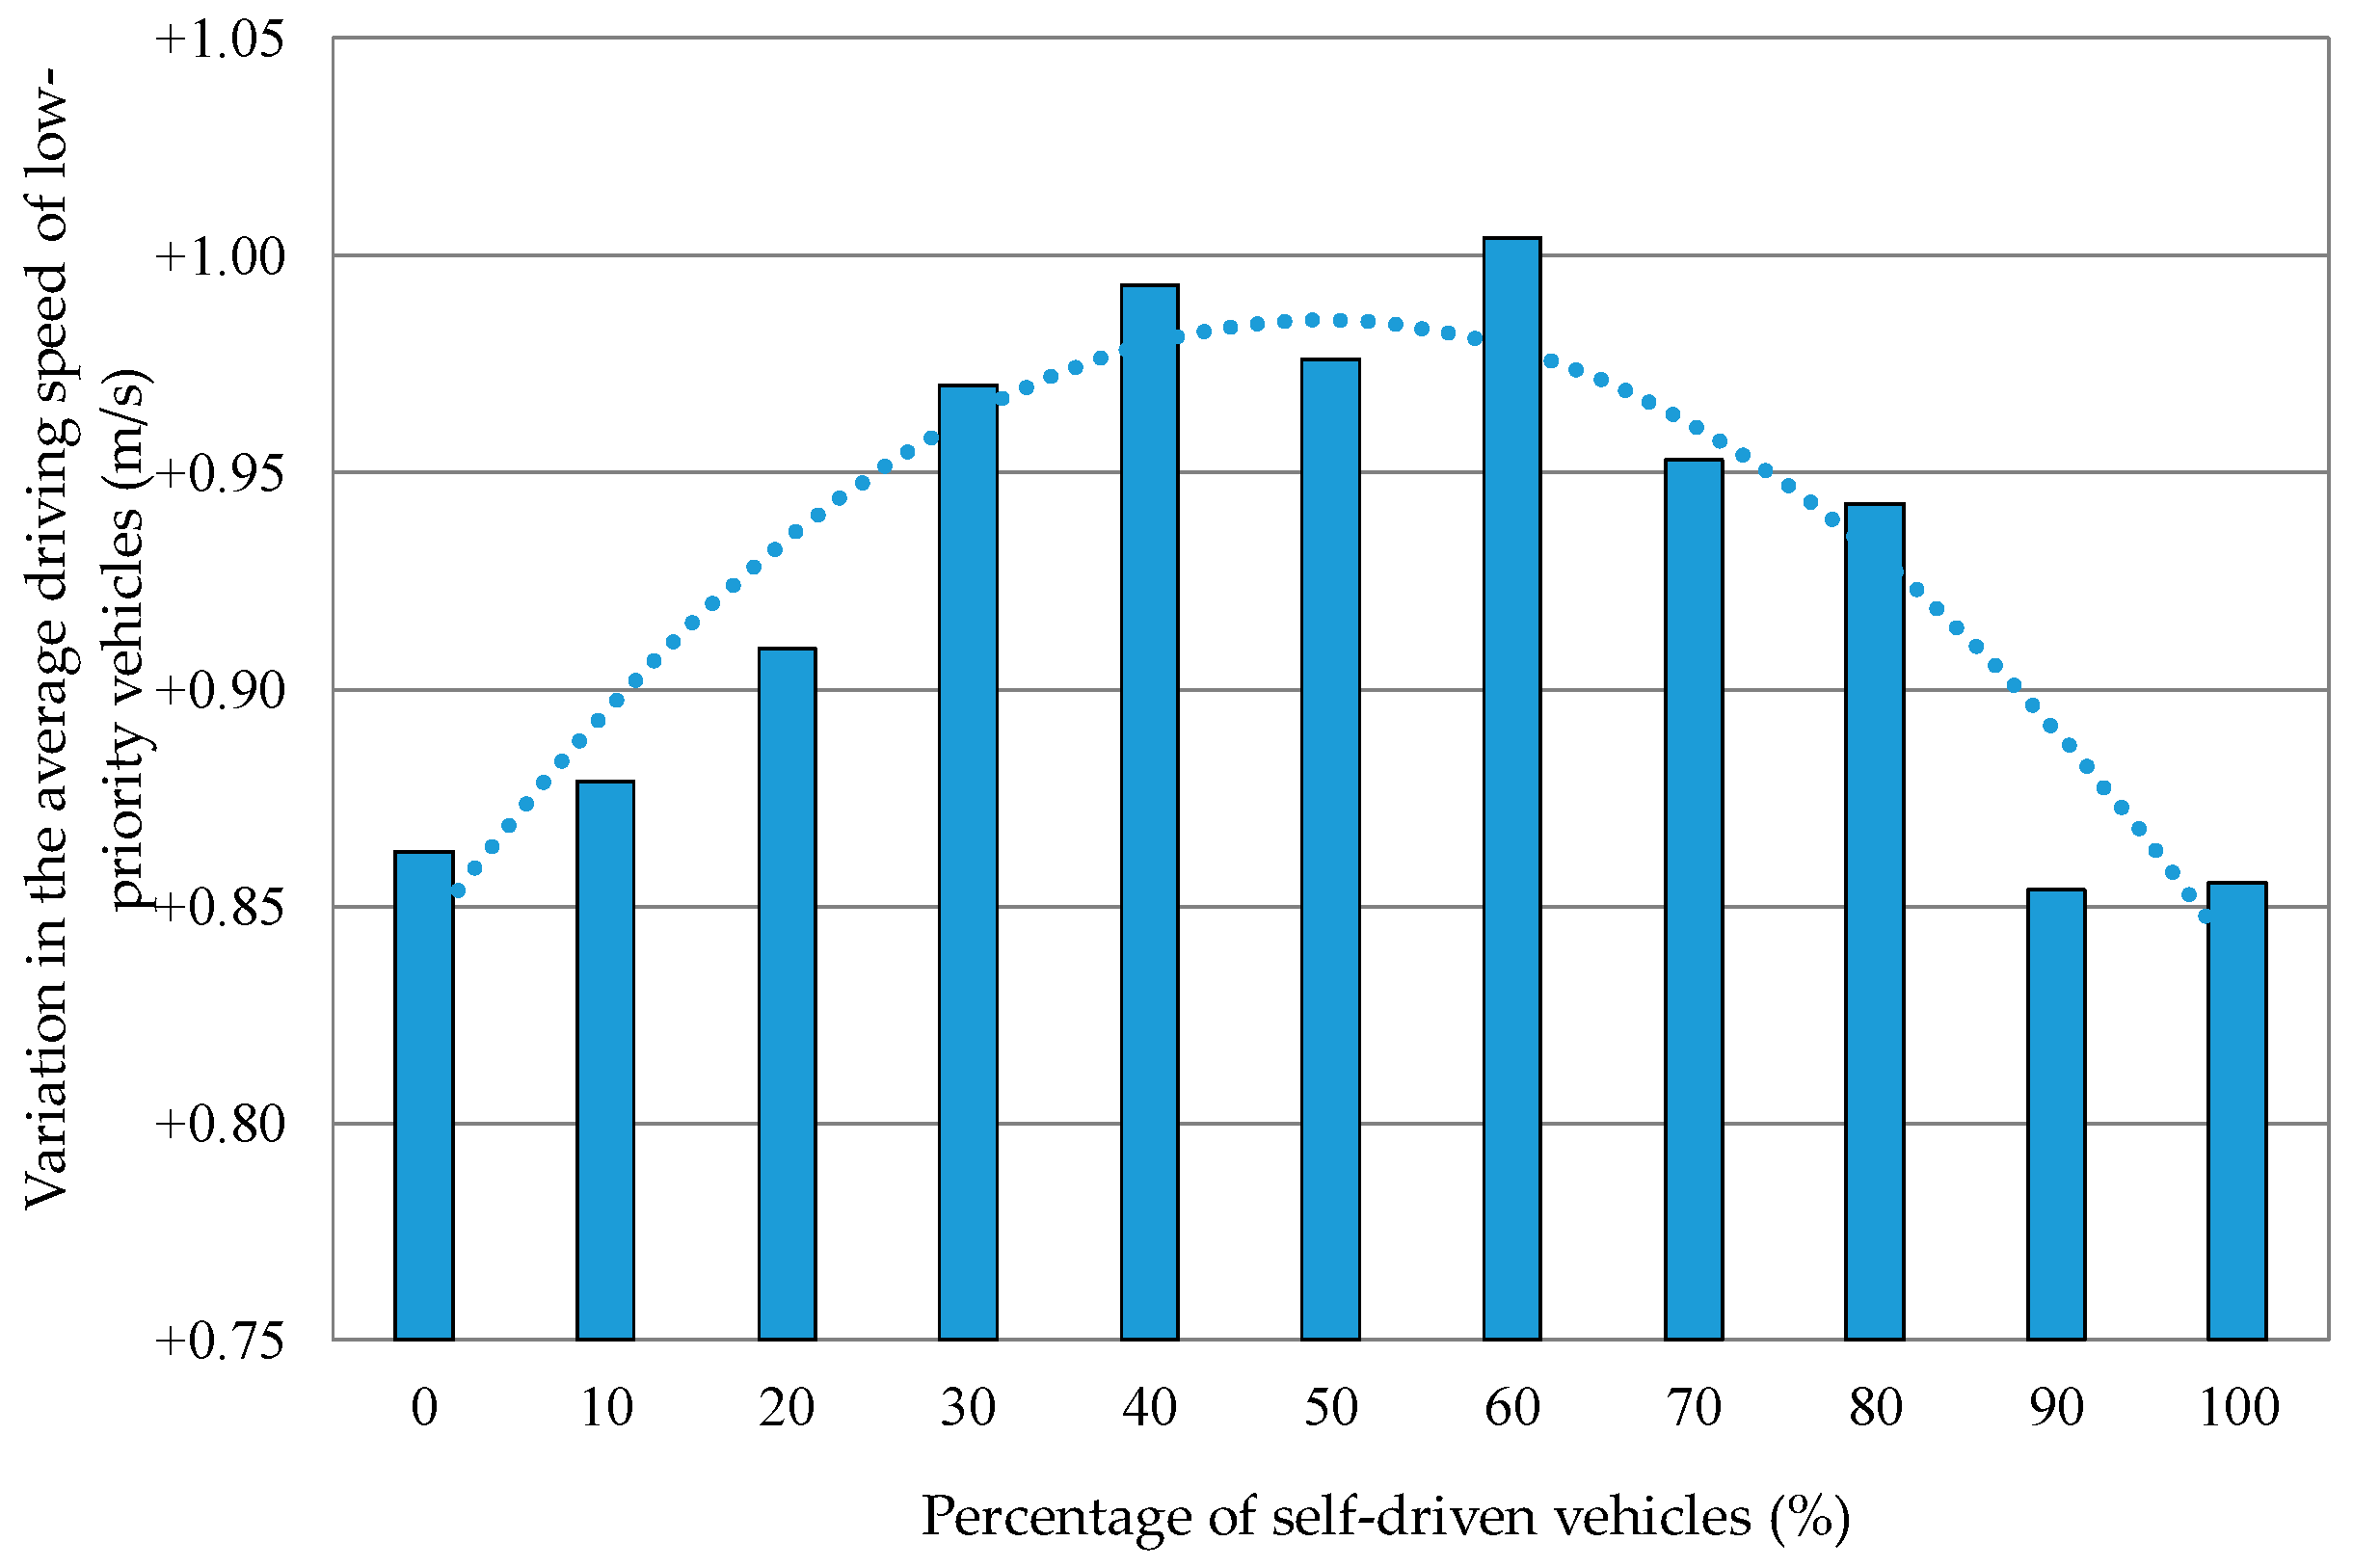
Figure 19.
Variation in the average driving speed of low-priority vehicles when the percentage of self-driven vehicles was varied. The average driving speed was the average for all the vehicles that came in.
Figure 19.
Variation in the average driving speed of low-priority vehicles when the percentage of self-driven vehicles was varied. The average driving speed was the average for all the vehicles that came in.
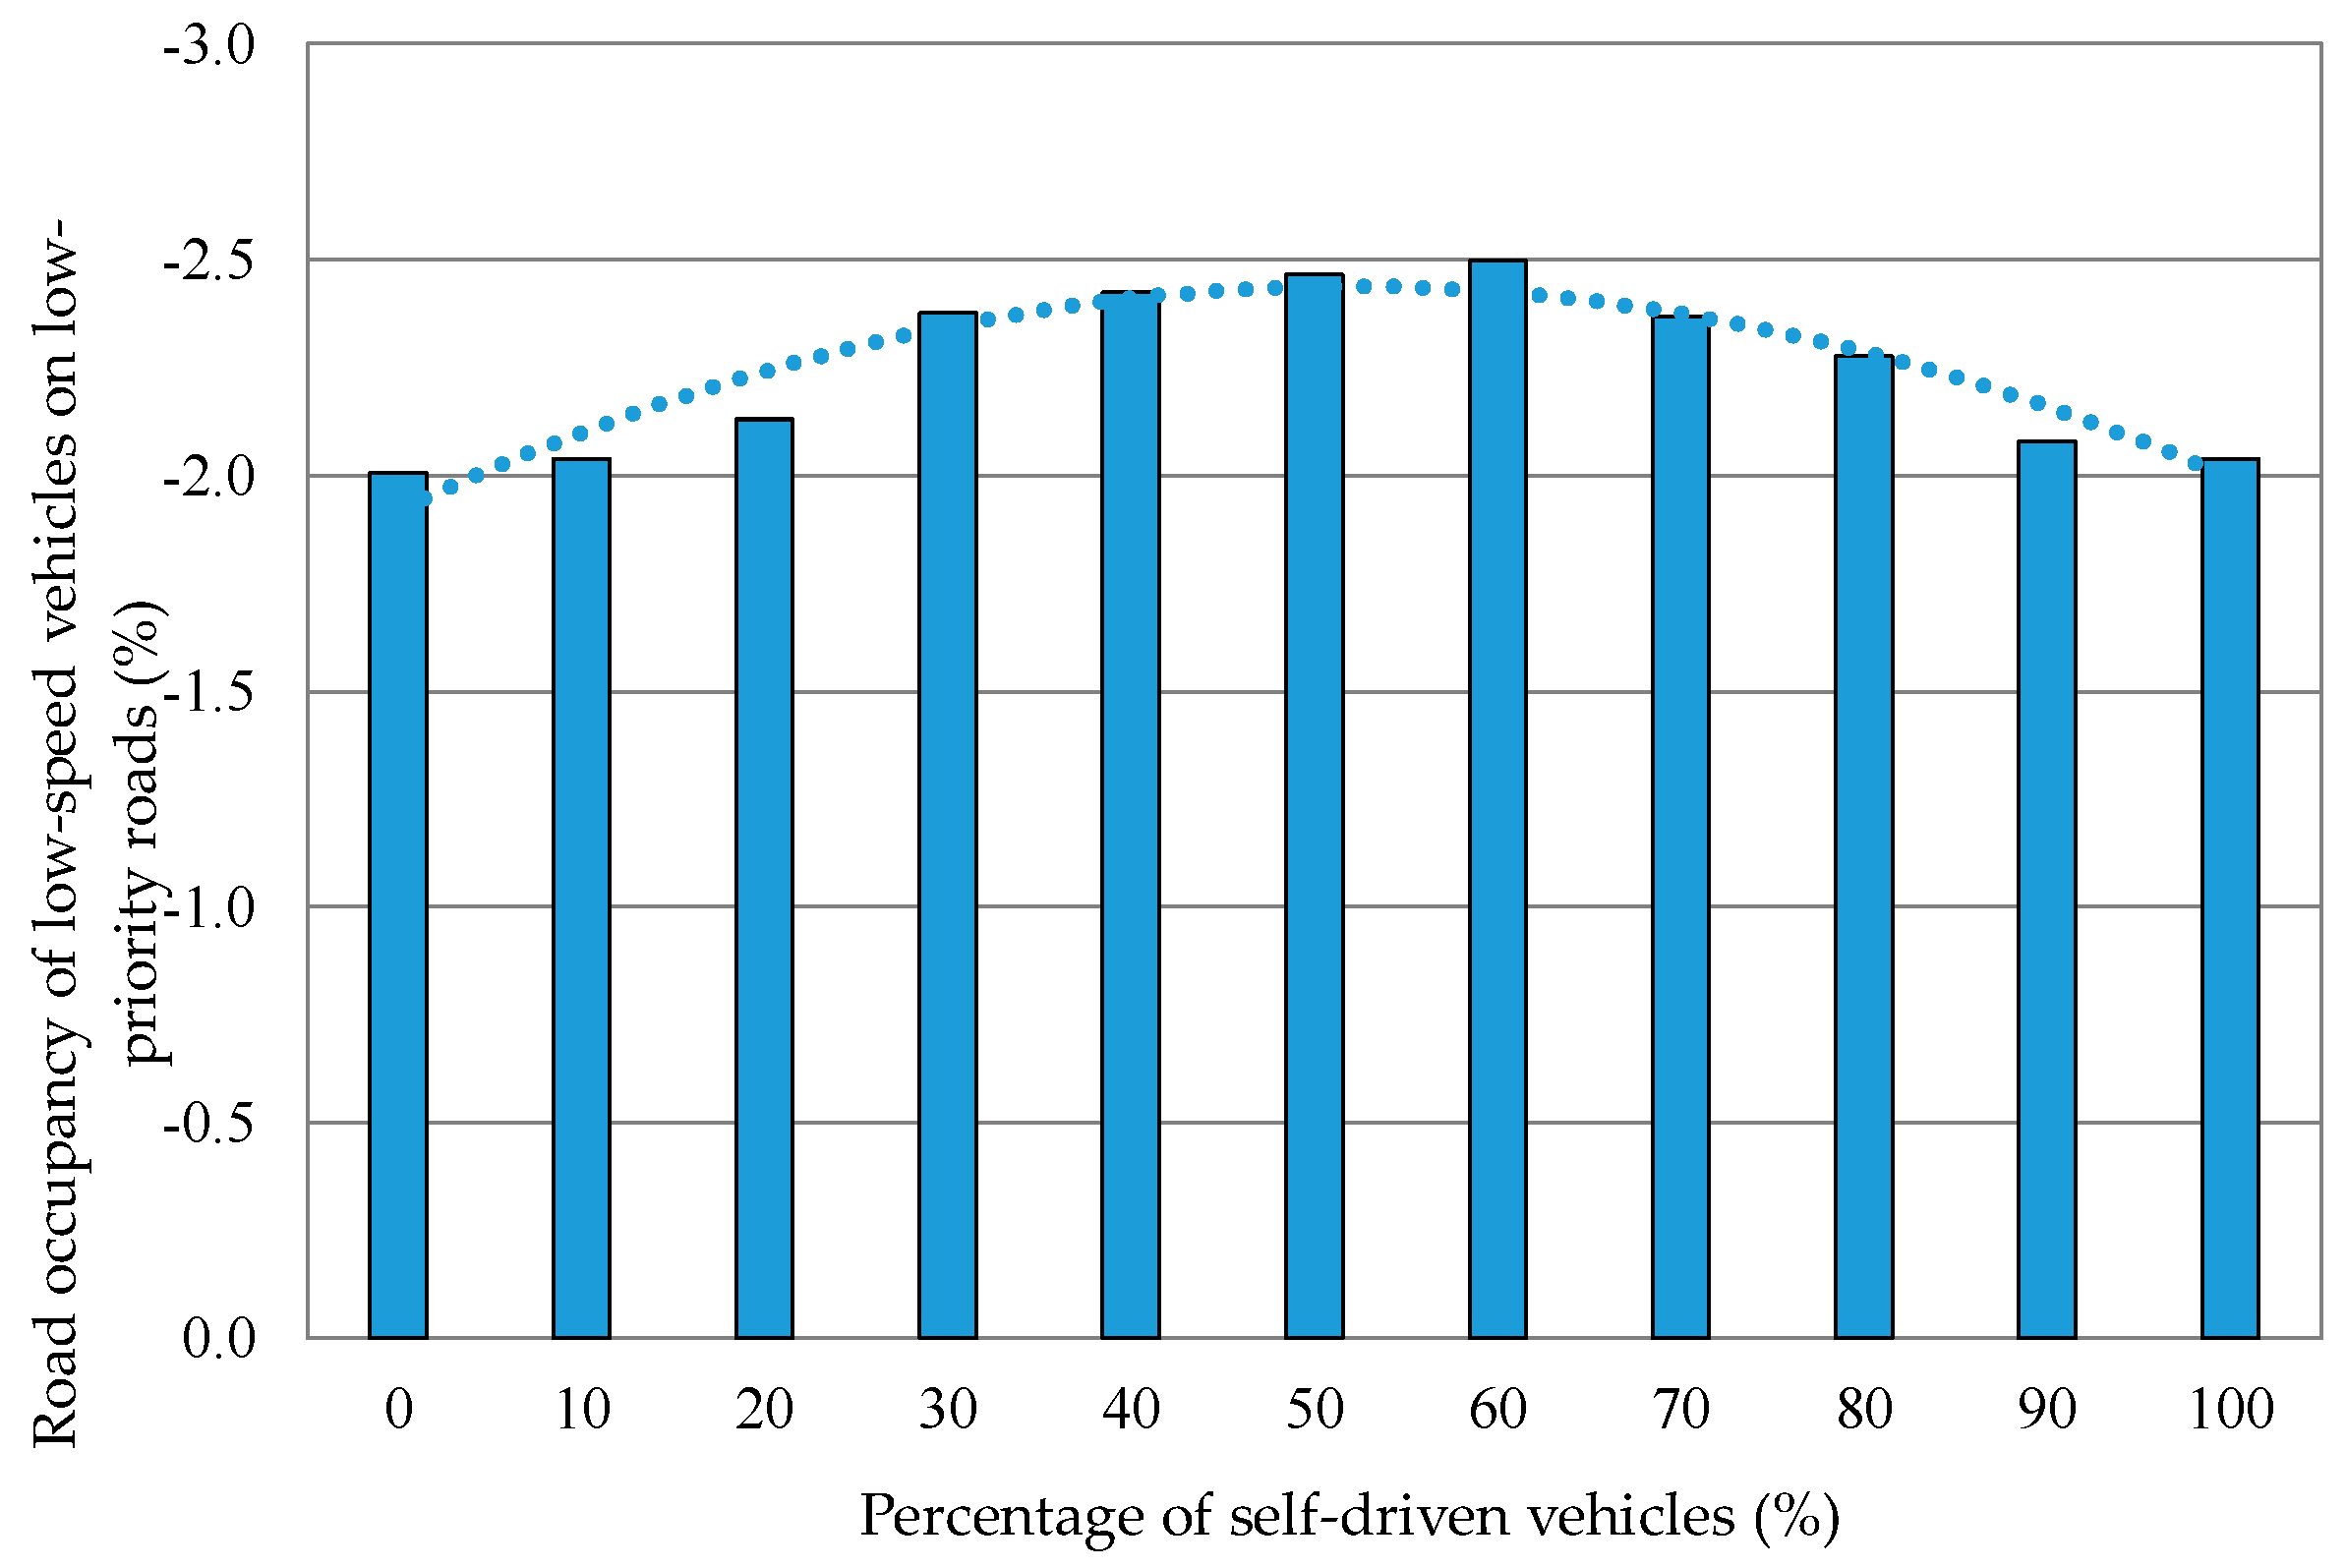
Figure 20.
Variation in the road occupancy of low-speed vehicles on low-priority roads when the number of vehicles that came in was varied. The average driving speed was the average for the entire percentage range of self-driven vehicles.
Figure 20.
Variation in the road occupancy of low-speed vehicles on low-priority roads when the number of vehicles that came in was varied. The average driving speed was the average for the entire percentage range of self-driven vehicles.
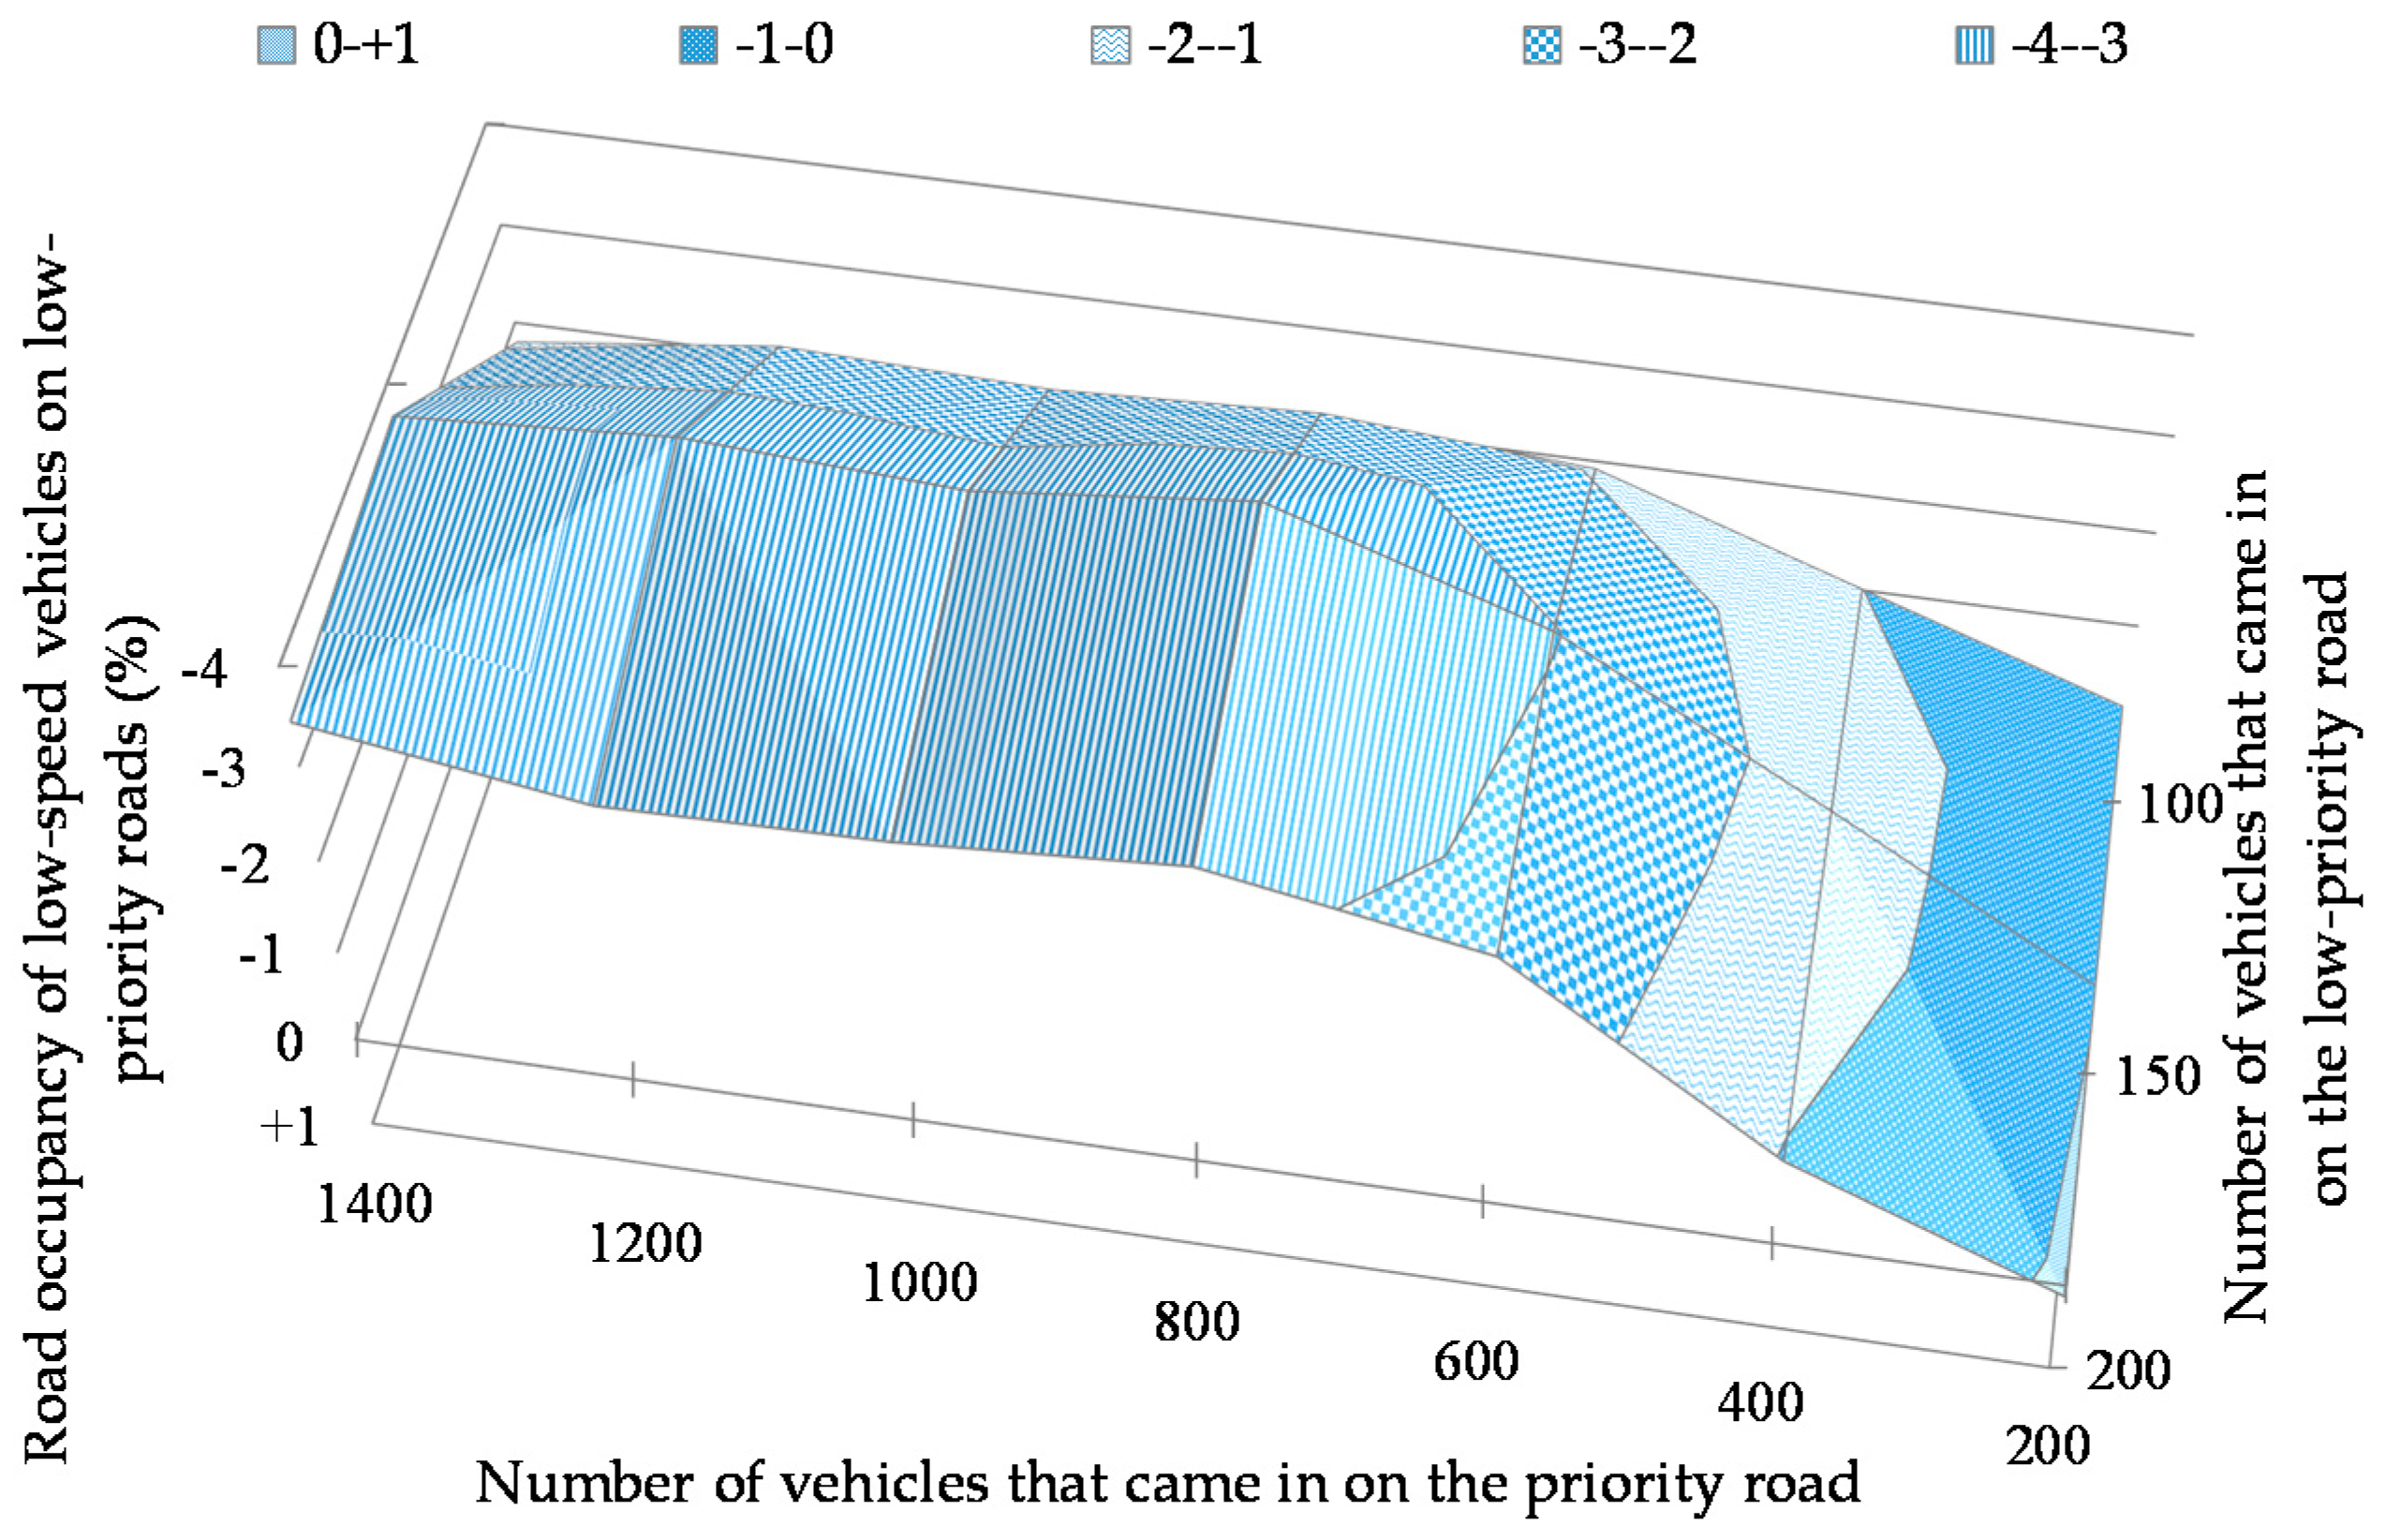
Figure 21.
Variation in the road occupancy of low-speed vehicles on low-priority roads when the percentage of self-driven vehicles was varied. The average driving speed was the average for all the vehicles that came in.
Figure 21.
Variation in the road occupancy of low-speed vehicles on low-priority roads when the percentage of self-driven vehicles was varied. The average driving speed was the average for all the vehicles that came in.
Table 1.
Factors that cause differences in judgments between self-driven and human-driven vehicles.
Table 1.
Factors that cause differences in judgments between self-driven and human-driven vehicles.
| Factors that Cause Differences in Judgments | Self-Driven Vehicles | Human-Driven Vehicles |
|---|
| Response time | Self-driven << human-driven |
| Max. rate of acceleration | Self-driven < human-driven |
| Max. rate of deceleration |
| Min. inter-vehicle distance | Fixed | Widely varied |
Table 2.
Comparison of methods of controlling the traffic of both self-driven and human-driven vehicles.
Table 2.
Comparison of methods of controlling the traffic of both self-driven and human-driven vehicles.
| | Method | [3] | [4] | [5,7] | Proposed Method |
|---|
| Comparison Item | |
|---|
| Intersection shape | Crossroads with multiple lanes | T-shaped | Crossroads |
| Traffic light | None |
| Roadside unit | Present | None |
| Prioritization of roads at the intersection | No | Yes | No | Yes |
| Pedestrians | Not considered | Considered |
| Differences in judgments between self-driven and human-driven vehicles | Not considered | Only the difference in response time is considered | Not considered | All factors shown in Table 1 are considered |
| Control of entry into the intersection | The order in which vehicles enter each lane at the intersection is adjusted based on the intersection passing reservation notices that vehicles send to the roadside unit | Intersection passing times of competing vehicles are adjusted based on the entry requests they send to the roadside unit | The order in which two competing vehicles enter the intersection is adjusted based on the intersection passing time each sends to the other directly via inter-vehicle communication | Whether a vehicle yields the way to the other vehicle is adjusted based on the entry request the latter sends to the former via inter-vehicle communication |
Table 3.
Situations in which yielding is required.
Table 3.
Situations in which yielding is required.
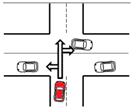
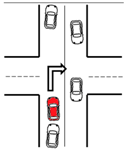
| Pattern No. | Situation | Schematic View |
|---|
| 1 | Turning left from a low-priority road | ![Futureinternet 11 00110 i001]() |
| 2 | Turning right from a low-priority road |
| 3 | Going straight from a low-priority road |
| 4 | Turning right from a priority road
(There are no lanes that are dedicated to vehicles going to any specific direction) | ![Futureinternet 11 00110 i002]() |
Table 4.
Yielding message structure.
Table 4.
Yielding message structure.
| Item | Message Element |
|---|
| Header | Yielding message identifier |
| Message length |
| Yielding ID |
| Body | Sender vehicle information | Maker |
| Vehicle model |
| Vehicle color |
| Longitude |
| Latitude |
| Angle of moving direction |
| Yielding pattern number |
| Message type |
Table 5.
Parameter values that cause differences in operations between self-driven and human-driven vehicles.
Table 5.
Parameter values that cause differences in operations between self-driven and human-driven vehicles.
| Parameter | Self-Driven Vehicle | Human-Driven Vehicle |
|---|
| Response time [s] | 0.1 | 0.9 |
| Max. rate of acceleration [G] | 0.15 | 0.25 |
| Max. rate of deceleration [G] | −0.175 | −0.25 |
| Min. inter-vehicle distance [m] | 3 | 2.5~3.5 |
Table 6.
Thresholds.
| Item | Value |
|---|
| Defined slow speed | 2.78 m/s |
| Number of queuing low-priority vehicles | 5 |
| Distance to the vehicle in the back | 50 m |
| Maximum communication distance | 100 m |
| Time-out | 5 s |
Table 7.
Simulation conditions.
Table 7.
Simulation conditions.
| Item | Value |
|---|
| Simulation time | 1800 s |
| Execution time step | 100 ms |
| Whether the yielding protocol is in operation | Yes and no |
| Percentage of self-driven vehicles | 0, 10, 20, 30, 40, 50, 60, 70, 80, 90, 100 |
| Number of vehicles that came in on the priority road | 100, 200, 300,400, 500, 600, 700 per POI |
| Number of vehicles that came in on the low-priority road | 50, 75, 100 per POI |
| Number of pedestrians | 20 |
| Mobility seed value | 123-132 |


