1. Introduction
With the rapid development of the Internet and the emergence of big data, information and data have exploded in size, and it is more difficult for people to obtain accurate and efficient information in time. Therefore, recommendation systems [
1,
2] have received more and more attention, including content-based recommendation algorithms [
3,
4], collaborative filtering algorithms [
5,
6,
7], and hybrid approaches [
8,
9]. A good recommendation algorithm can better understand the user’s purchase intention and can improve the user’s viscosity for the e-commerce platform, thereby increasing the user’s purchase rate. Among these algorithms, the collaborative filtering algorithm is widely used in various recommendation systems, such as Amazon, Netflix, and others. The reason is that it has no special requirements on the recommended items and can achieve significant recommendation results.
The nearest neighbors approach (KNN) and matrix factorization (MF) are major collaborative filtering techniques. Most of them are designed with explicit feedback data such as rating data, which needs the recommendation systems to guide the users in terms of score. However, users are often reluctant to spend time reviewing items in the field of e-commerce, which causes the rating data to be difficult to obtain and sparse.
Some recommendation algorithms are based on user’s behavior logs and can solve the difficulty of data acquisition. However, the user’s behavior logs lack negative feedback—we cannot be directly aware of user’s preferences, which makes it more difficult to find the nearest neighbors accurately. In order to solve this problem, we fully mined the consumer’s implicit feedback, such as the purchase behavior, comparison behavior, and item-sequences. The TF-IDF (Term Frequency-Inverse Document Frequency) algorithm and the word-embedding technology of the natural language processing (NLP) field were improved and applied to the collaborative filtering algorithm. The contributions of our work are as follows:
Refine the user’s behavior, build item-pairs, and consider not only the user’s purchase behavior but also the comparison behavior, and apply TF-IDF to collaborative filtering (CF) to calculate the user’s similarity more reasonably.
Extract the user’s browse sequence for items from the user’s behavior log, use word-embedding technology to map items to low-latitude vector spaces, and calculate the similarity of the items.
Construct a secondary reordering model to generate the recommendation results for the users.
2. Related Work
According to the classification method proposed by Breese [
10], CF algorithms can be divided into two categories: memory-based CF, which includes information based on the user’s CF [
11,
12] and item CF [
13]; and model-based CF [
14]. Traditional collaborative filtering algorithms are mostly based on explicit data, such as ratings or stars, which is sparse in e-commerce. Therefore, more and more scholars have studied the user’s implicit feedback to recommend items to users.
Hu [
15] treated the data as an indication of positive and negative and tailored a factor model for implicit feedback to recommend television shows. Choi [
8] considered only the purchase data of the user to derive implicit ratings, to enable CF to be applied, and then they integrated CF and (sequence pattern analysis) SPA to improve the recommendation quality. Rendle [
16] directly optimized for ranking by Bayesian personalized ranking (BPR). In Reference [
17], the authors incorporated visual features with BPR for the task of personalized ranking. Li [
18] trained multiple GBDT (Gradient Boosting Decision Tree) models with a user’s characteristics extracted from the user’s behavior log, and the output was regarded as the input for LR (Logistic Regression) to obtain the final recommendation results. Reference [
19] analyzed the user’s shopping log with SVD++ to obtain the user’s brand preference. Zhao [
6] studied CF in an interactive setting. They used a probabilistic matrix factorization model to capture the distributions of the users and item feature vectors. Barka [
20] produced embedding for items in a latent space to analyze item–item relations to produce item similarities. Ozsoy [
21] applied Word2Vec to a recommendation system to learn a latent representation of the users and items, and then combined a collaborative filtering algorithm to recommend items to the user.
Compared with the above methods, in this paper, we mined not only the user’s purchase behavior but also comparison behavior and item-sequences to recommend items to users. We combined the user’s purchase behavior and comparison behavior to modify the method of measuring the user’s similarity. The purchase behavior was easy to capture, but not the comparison behavior. Thus, we built item pairs to capture the user’s comparison behavior to obtain the user’s preferences. In addition to this step, we extracted the item sequences based on the user’s behavior log and calculated the items’ similarities through an item-embedding technique. Lastly, we built a secondary reordering model to recommend items to users. The results of our method on the JData dataset were compared with other recommendation algorithms, and our method obtained better performance.
3. User’s Similarity Calculation by Combining User’s Purchase Behavior and Comparison Behavior
Due to the lack of rating information in the user’s behavior log, the user’s similarities cannot be directly calculated. Therefore, in this part, we considered the user’s purchase behavior and comparison behavior to measure the user’s similarity. By analyzing the user’s purchase behavior, we can directly know the user’s love for the item. However, in the user’s behavior log, there are many other behaviors, such as clicking behavior, adding item to shopping cart behavior, and collecting behavior. When a user wants to buy an item in JD (a large e-commerce platform in China), the different behaviors reflect different degrees of user interest for the item. Additionally, if two users select the same item when facing the same two items, they have similar comparison behavior and are more similar in preference.
3.1. User’s Browsing Behavior Analysis
In e-commerce, a user’s behavior is divided into clicking, add item to shopping cart (represented by adding in the following), collecting, and buying. We defined the user’s behavior as
where
means clicking,
means adding,
means collecting, and
means buying. Intuitively, in the user’s behavior log, a certain behavior occurs more with lower interest, and otherwise with higher interest.
Table 1 shows the user’s behavior-matrix extracted from the user’s behavior log. Here,
describes a type of feedback behavior, and
describes the average number of
for user
. Then, we obtained the user’s behavioral-habit matrix, as shown in
Table 2, by Equation (1):
where
describes the average number of
, and
describes the weight of
. Here,
describes the weight of the user’s different feedback in
Table 2.
Unlike the explicit feedback, we do not have any direct data from the users with regard to their preferences, but we can extract the user’s behavior-habit instead, which is represented by
. Otherwise, we analyzed the user’s behavior log and build the user’s interaction vector for items that are represented by
. Therefore, we obtained the user’s preferences for items based on the user’s interaction with the recommendation system by Equation (2):
where
represents the user’s preference for items.
3.2. User’s Comparison Behavior Analysis
When purchasing items, users will compare a series of items and finally purchase one. The process of selecting items reflects the user’s comparison behavior. If users have similar comparison behaviors, they should be more similar. In this section, we built item pairs to capture a user’s comparison behavior and obtain a user’s real preference for items.
Definition 1. Purchase cycle T. In real life, users often buy items on an e-commerce platform for a period of time. Therefore, we split the user’s behavior log into different purchase cycles based on the time when the user’s purchase behavior occurs,.
Definition 2. Item-pair. This concept describes a user’s comparison behavior before purchasing items in a purchase cycle, and it can be used to measure the user’s similarity.
Table 3 is an example to show how to build an item-pair.
Table 3 shows the user’s interaction vectors to items represented by
,
, and
. The user’s behavior-habits matrix has been obtained in “
Section 3.1”, and thus, the preference to items of
can be obtained by Equation (2). Then we can build the item-pairs
,
, and
.
3.3. User’s Similarity Calculation
Each user has their own item-pair sets, and different item-pairs have different weights for the user, to calculate user’s similarity. An example is shown in
Table 4.
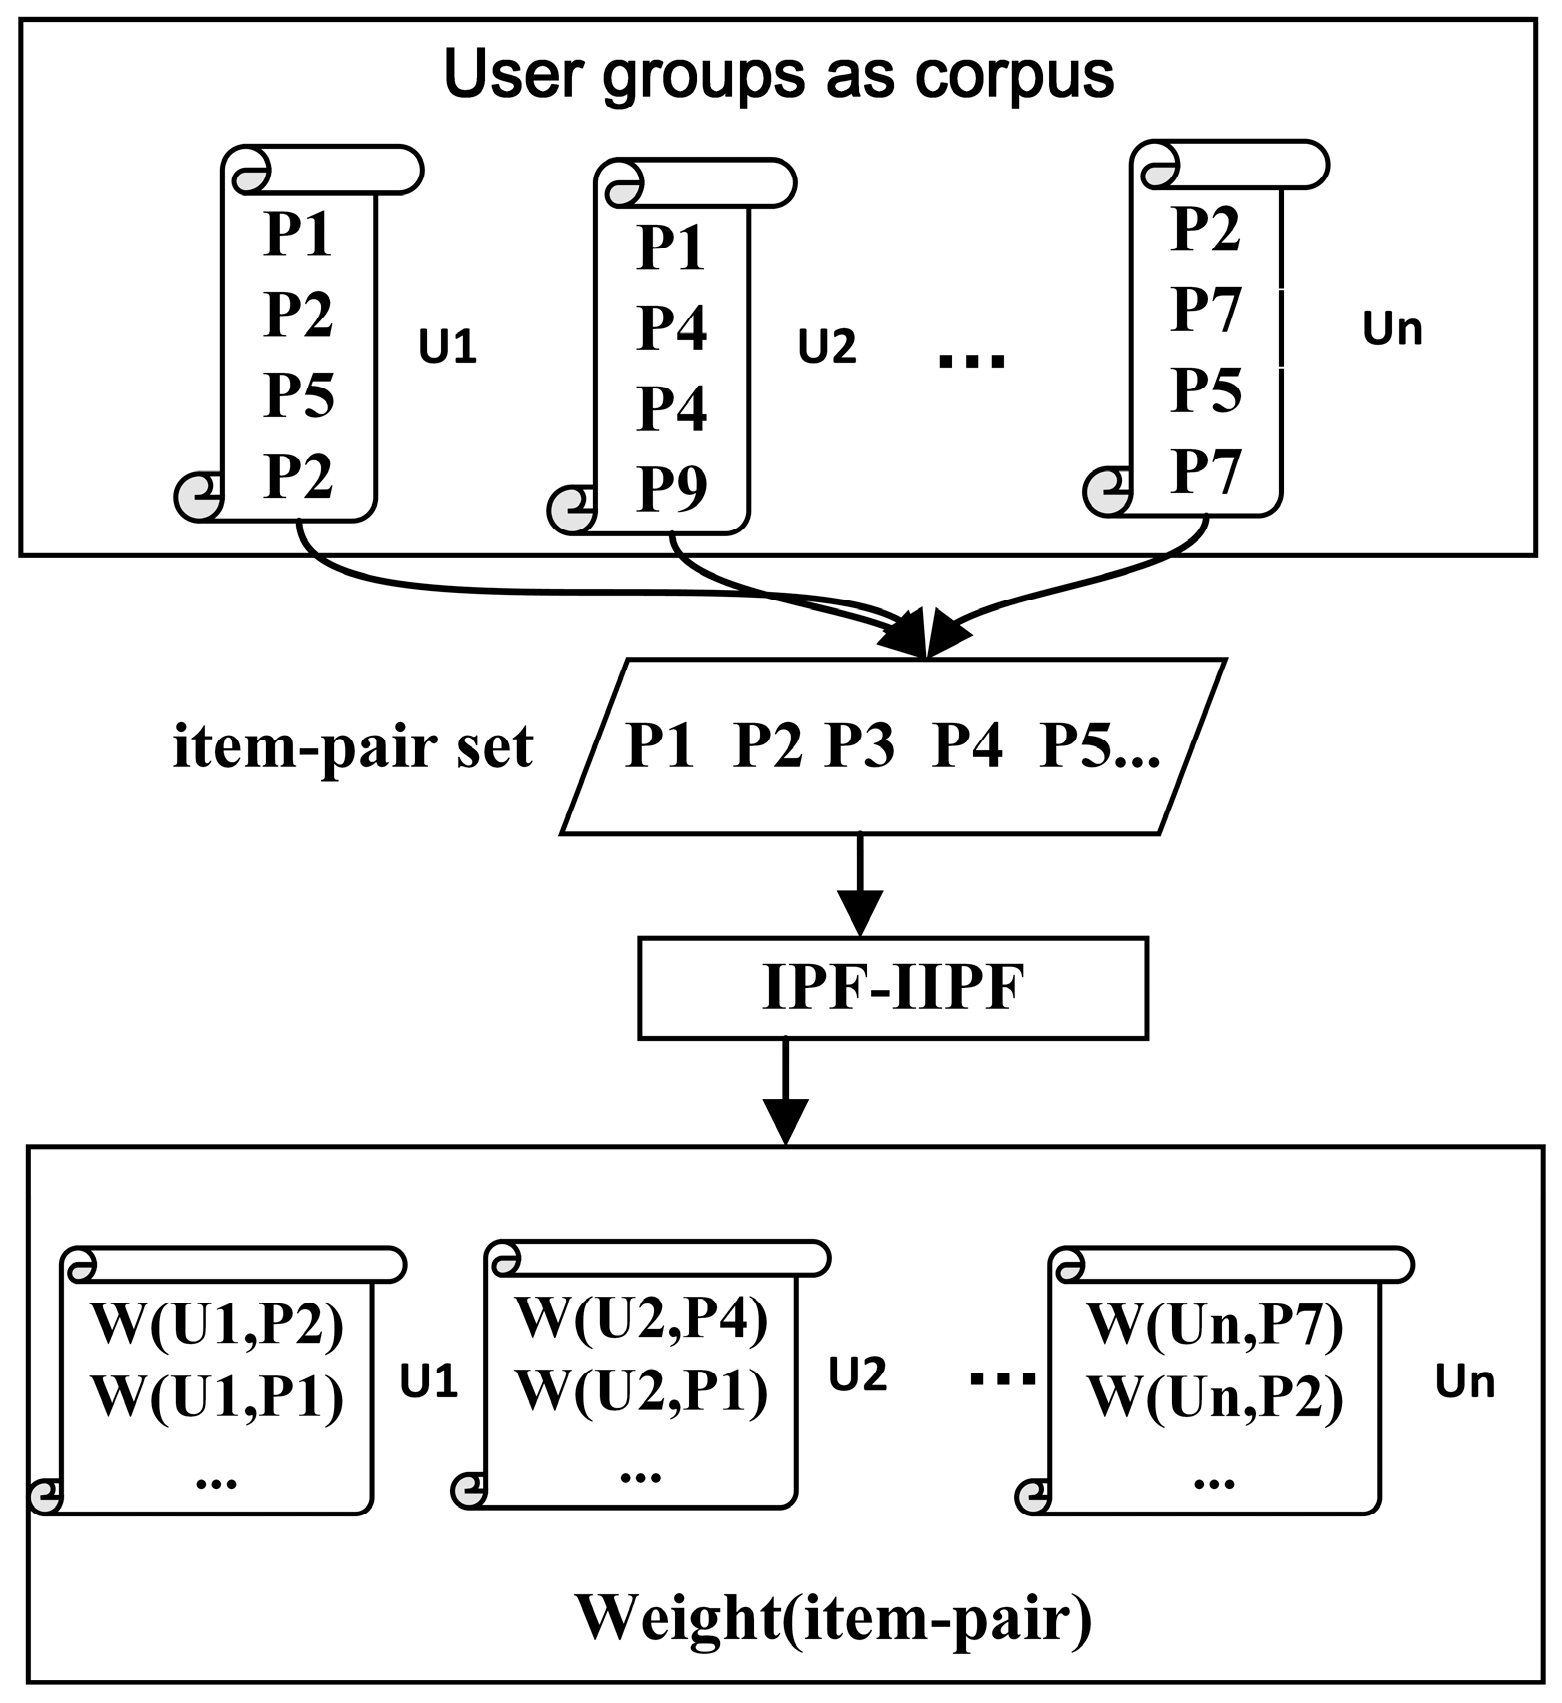
In the field of natural language processing (NLP), the TF-IDF algorithm is a statistical method to assess the importance of the same word for one file or one corpus. The corpus is similar for user groups. Therefore, in this paper, we tried to apply TF-IDF to a recommendation algorithm. We regarded the user groups as a corpus, the user’s item-pair sets as one file, and an item-pair as a word.
Definition 3. Item-pair Frequency (IPF). This concept describes the times that an item-pair appears in the item-pair sets of a user. The larger the number of times is, the more important the item-pair is to the user.
Definition 4. Inverse item-pair Frequency (IIPF). This concept describes how many user’s item-pair sets contain the item-pair. The larger the number of times that an item-pair appears in all user’s item-pair sets, the worse the item-pair is for distinguishing the user when calculating the user’s similarity.
Figure 1 shows the process of IPF–IIPF, and the weight of the item-pair for each user can be calculated by Equation (3):
where
means an item-pair,
means a user,
means the number of occurrences of
in the item-pair set of
, and
means all users.
Then, the user’s similarity can be calculated by Equation (4):
where
means the common item-pairs of user
u and user
v,
,
means the item-pair, and
means the average weight of the user’s item-pairs.
4. Item’s Similarity Calculation Based on Item Embedding
In the user’s behavior log, the user’s interaction record over time contains a large amount of information on the items. For example, if a user wants to buy a computer, they will compare a series of computers, and the compared sequence shows a high degree of similarity between items. To calculate the similarity of these items, we applied word-embedding technology to train item-sequences to obtain item vectors and measure the item’s similarity.
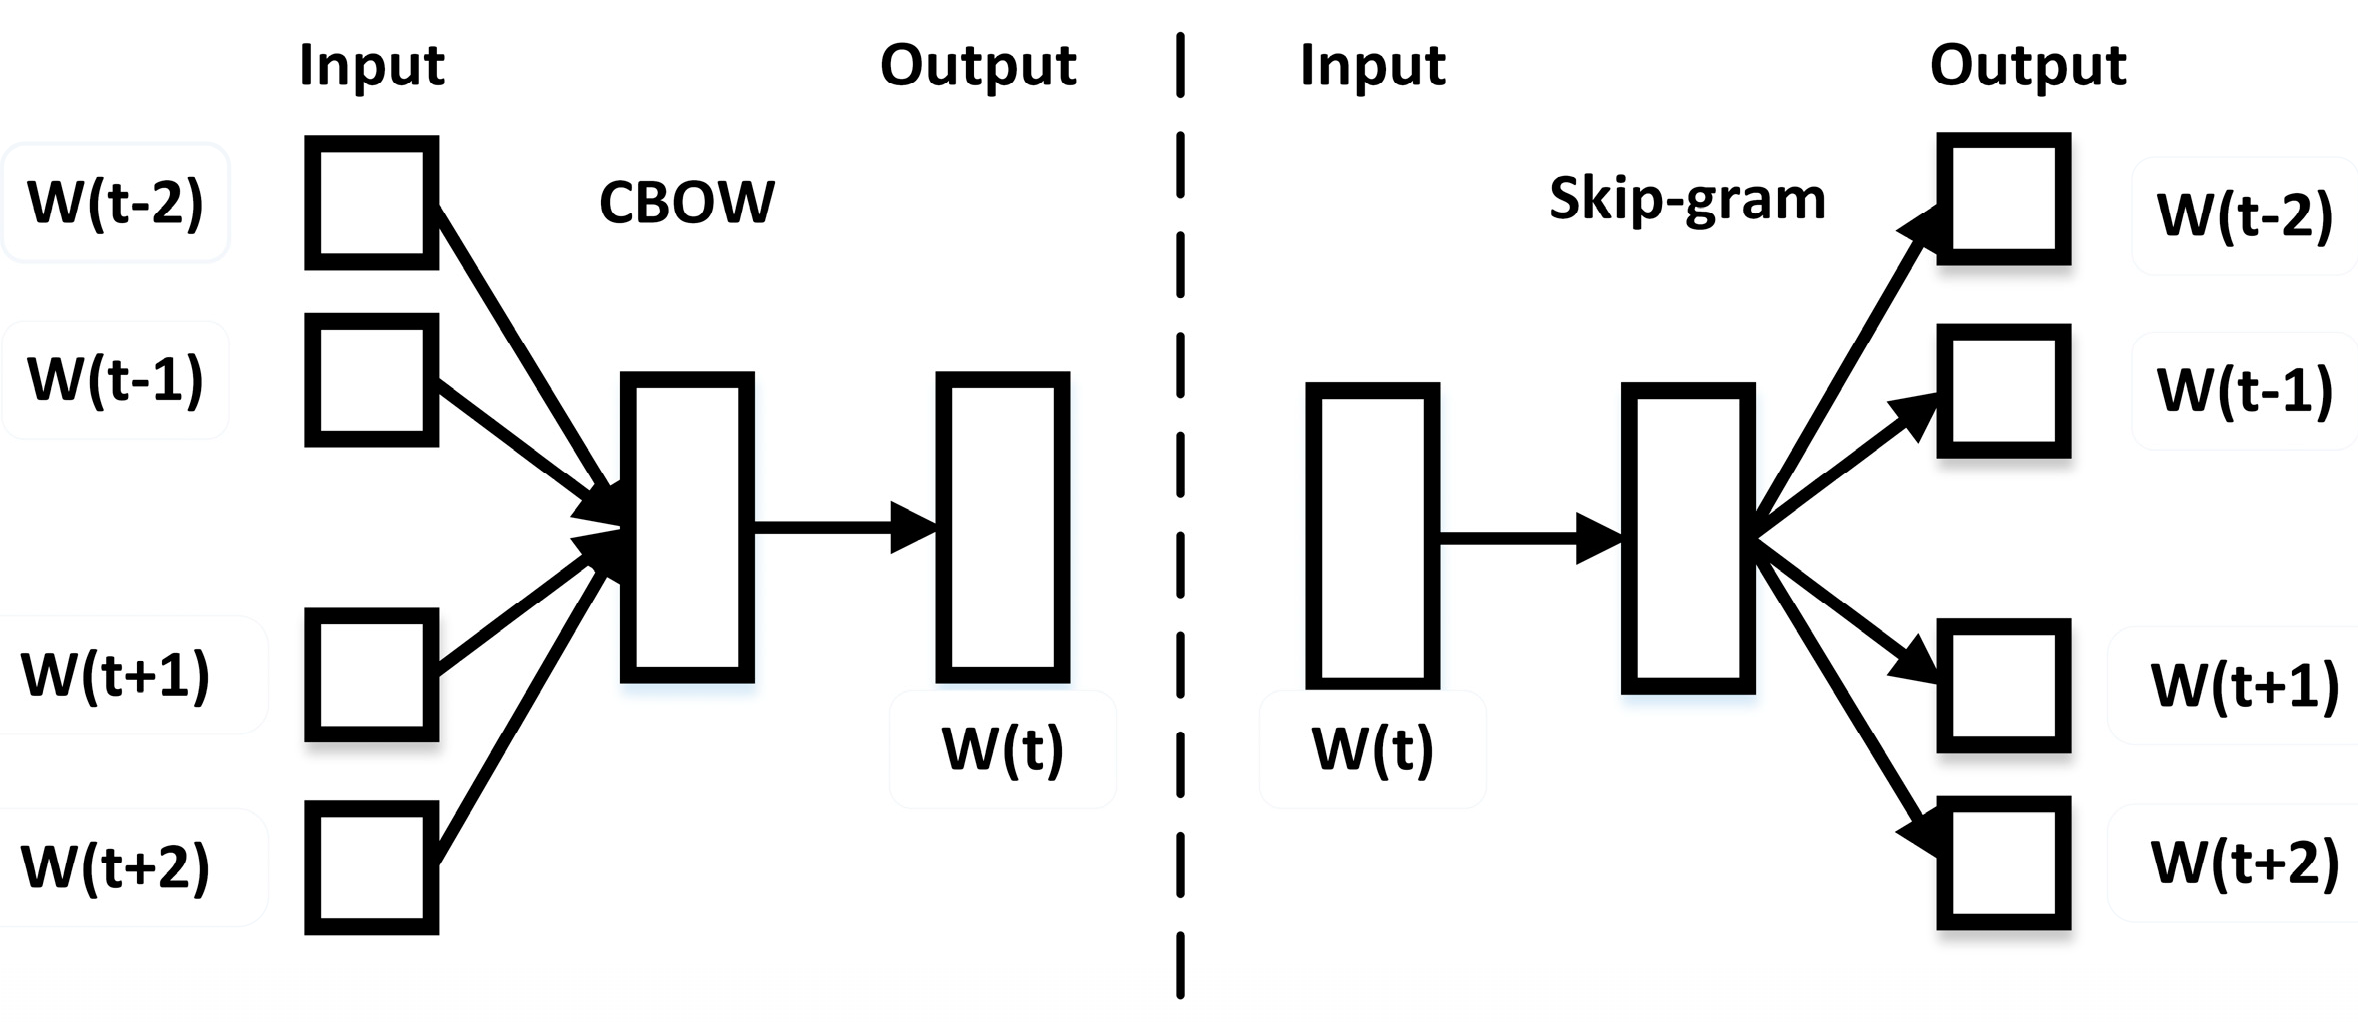
Word2vec is a group of models of word-embedding technologies, which was proposed by Mikolov [
22,
23]. It contains two different models, namely Skip-gram and CBOW (Continuous Bag-of-Words), which use either hierarchical softmax or negative sampling. Skip-gram and CBOW models are all shallow three-layer neural network models, and in contrast to traditional DNN (Deep Neural Networks) models, they use a Huffman tree to replace neurons in the hidden and output layers, which reduced the calculations. In this section, we used both of the models to process the sequence of items that were browsed by a user.
4.1. Extract the Item-Sequences
Applying word2vec technology to a recommendation algorithm [
24], we must first obtain training data that is similar to the corpus, which is composed of sentences.
We split the user’s behavior log into different purchase cycles by the algorithm shown in Algorithm 1 and extracted the item-sequences shown in
Table 5. In each cycle, only one item is purchased by the user.
| Algorithm 1: The algorithm for extracting the item-sequences |
| 1 Input: logs dataset, “4” means buying. |
| 2 Output: sets of item-sequences of all users. |
| 3 Function getItemSequences(logs dataset): |
| 4 allT{} // save all purchase cycles T |
| 5 for u∈|U| Do |
| 6 u_log {} //single user’s behavior log |
| 7 end for |
| 8 sort(u_log) // sort user’s records by time |
| 9 for r ∈ u_log do |
| 10 if r == 4 then |
| 11 T{} |
| 12 allT.add(T) |
| 13 end if |
| 14 end for |
| 15 return allT |
| 16 end function |
4.2. Item Vector Representation and Similarity Calculation
In this part, we applied the word2vec to train the item-sequences and obtain the item vectors. The main models of word2vec are CBOW and Skip-gram, with the input a large corpus of sentences. Word2vec builds a dictionary as an input to the training models, which is a three-layer neural network for words that appear in the corpus.
The CBOW predicts the target word from the original sentence. We entered the words
around the target word
and maximized the likelihood function, as shown in Equation (5), by the stochastic gradient descent algorithm, to obtain a vector of the target word. The Skip-gram is the opposite.
Figure 2 shows the difference of the two models.
The process of recommendation is similar to the process of CBOW and Skip-gram to predict vectors of words, and therefore, we regarded items as words and extracted item-sequences from the user’s behavior log as sentences. Then, we put these data into the CBOW model and Skip-gram model to obtain the item’s vectors, and we calculated the similarity of the items by Equation (6):
means the vectors of item
i and
j. Then, we proposed two algorithms called CBOW-CF and Skip-CF. In the experiment, we have discussed the different influences of the different dimensions of vectors on the recommendation results.
5. The Recommendation Algorithm Based on the User’s Implicit Feedback
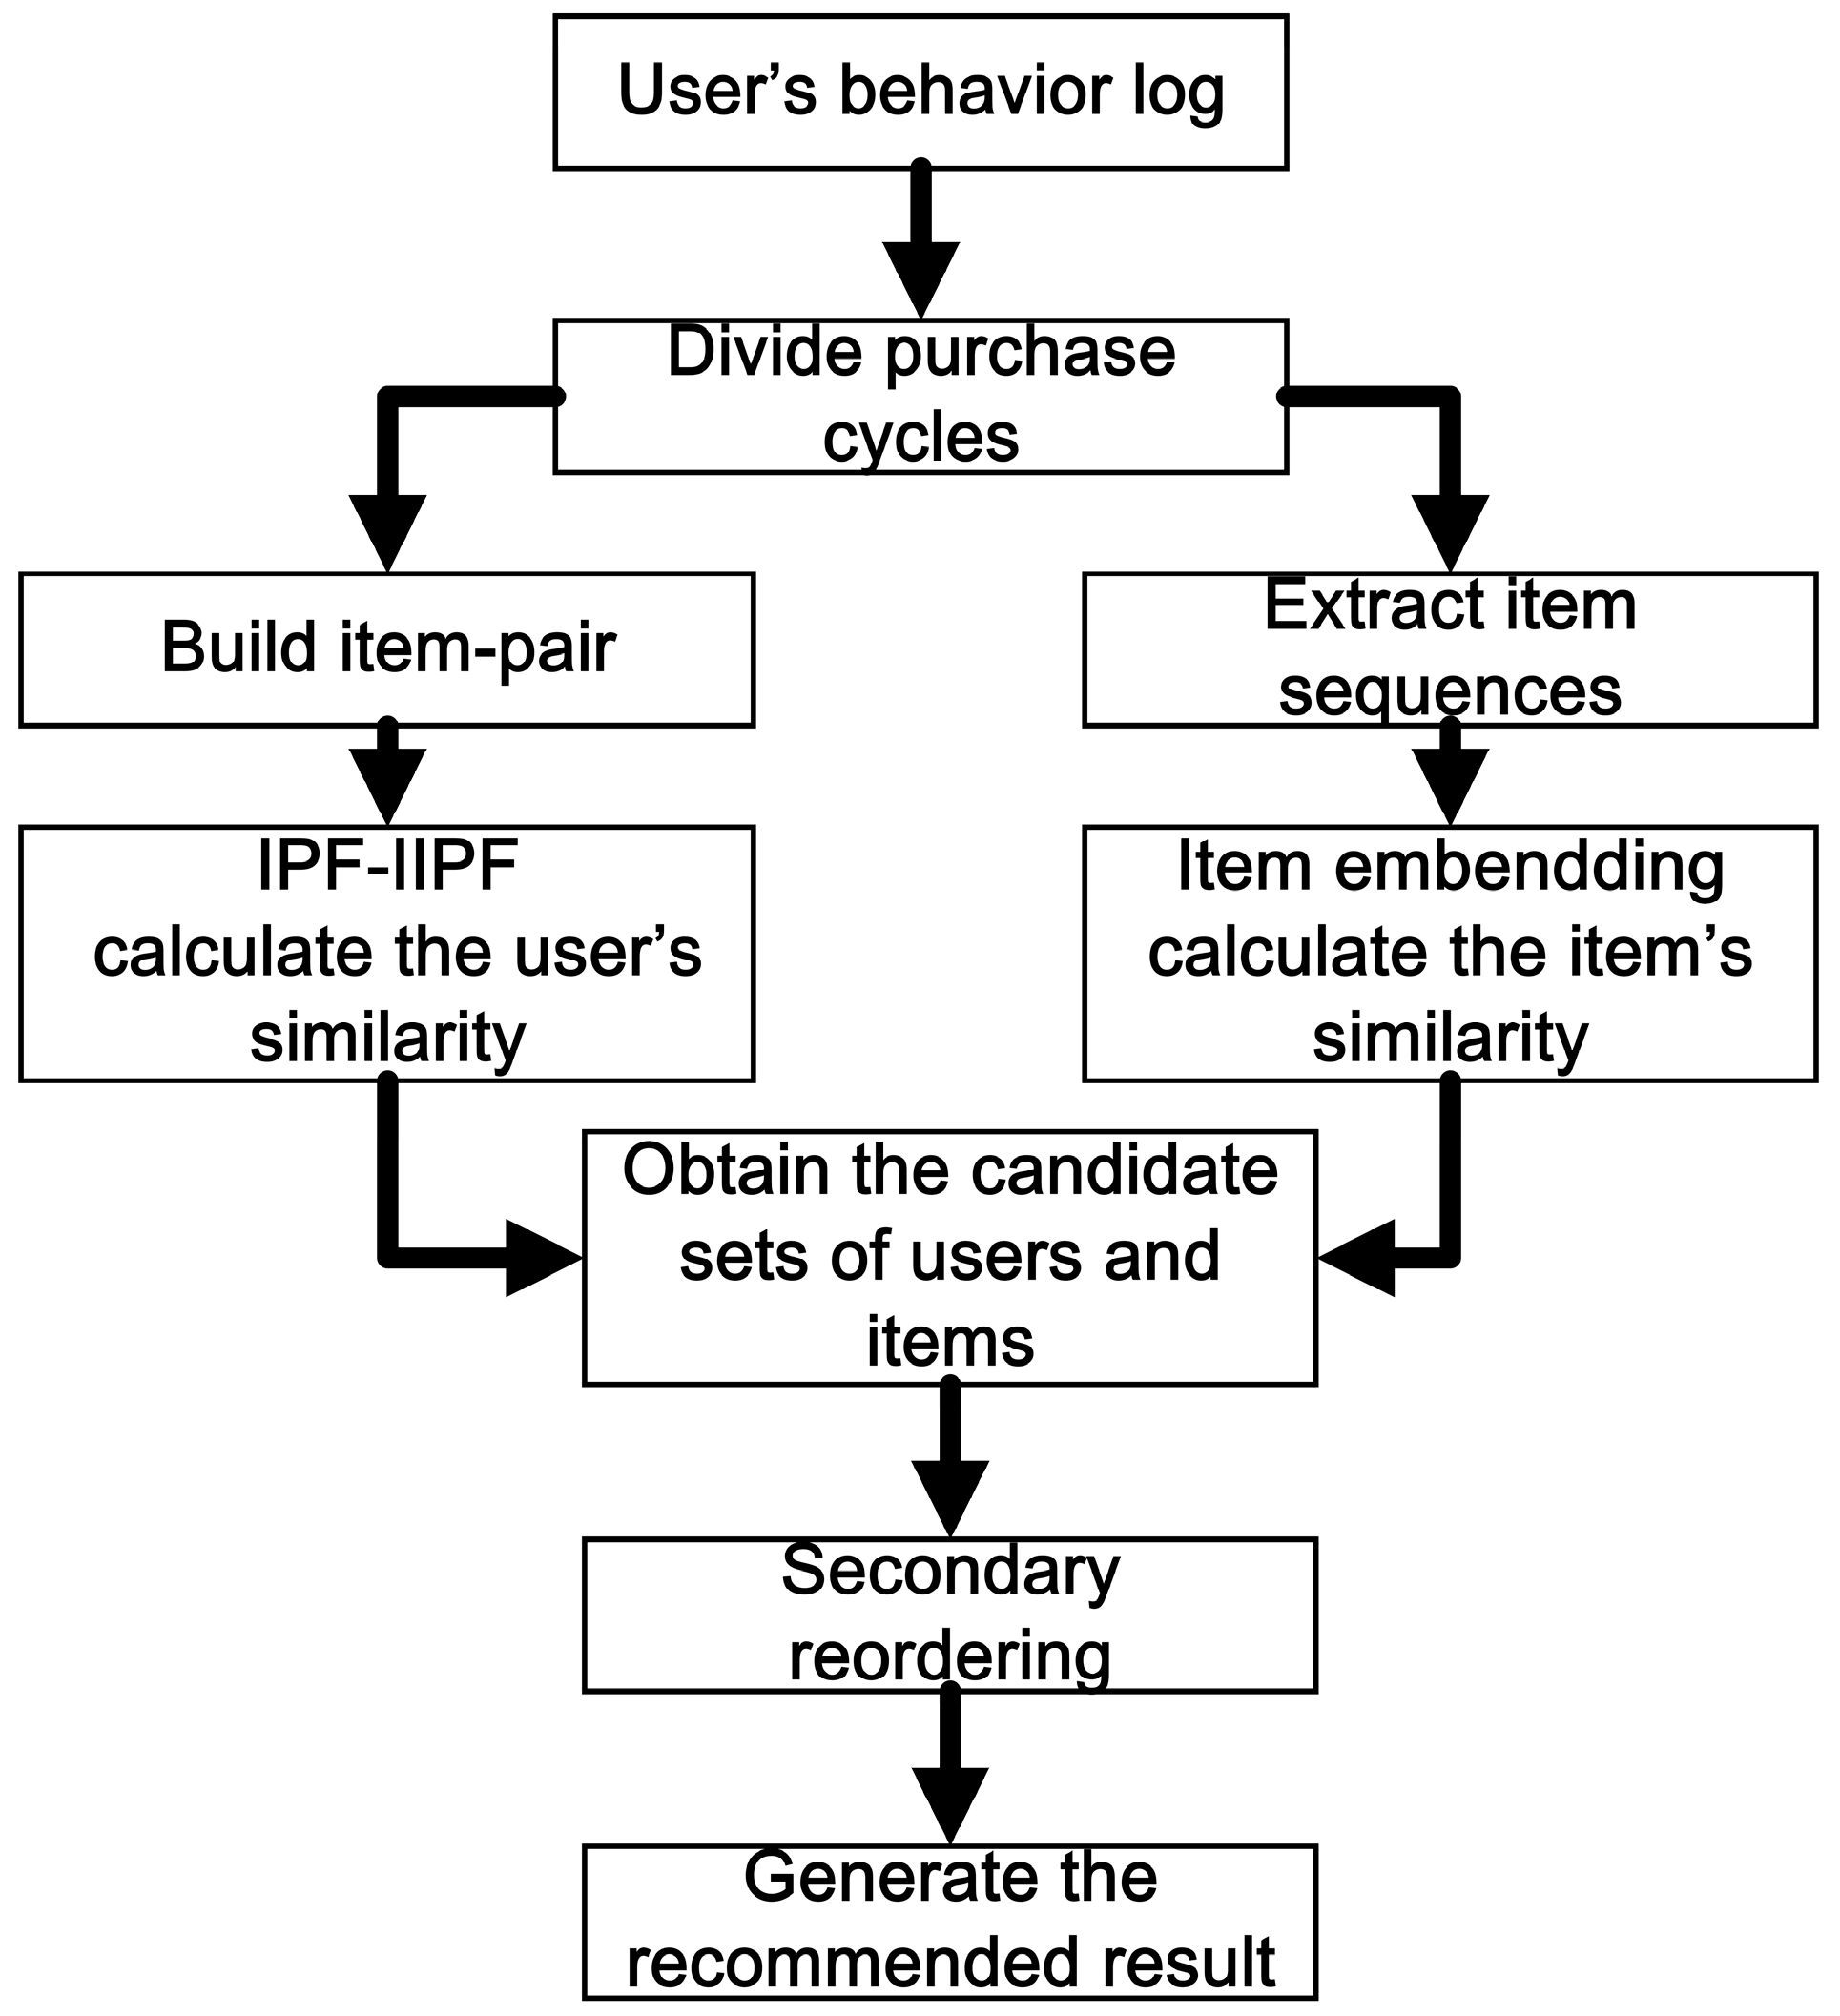
Based on the previous introduction, we considered the user’s clicking, adding, collecting, and buying behaviors and built item pairs by the user’s interaction with the JD system to calculate the user’s similarity more accurately, and we learned the vector space representation of items with word2vec technology to calculate the items’ similarity more reasonably. Additionally, we obtained the user’s candidate set and item’s candidate set and relied on the two methods, and then, the recommended results were generated by the secondary reordering.
Figure 3 shows the overview of the whole algorithm.
When recommending items to users, we should first choose the K nearest neighbors of the users. Traditional CF always chooses the K nearest neighbors from all of the users, which increases the calculation time. To solve this problem, we set a threshold
to obtain a candidate set of users. Here,
is repressed by Equation (7):
where
is the average similarity of the target user. If
, then user
v will be added to the candidate set of user
u.
Different from the method in Reference [
18], which calculates the item’s similarity by a single item vector, we considered the item-sequences that users had before purchasing a specific item, and we attempted to predict the user’s purchase intention, as represented by
, which is expressed by Equation (8):
where
indicates the vector of the item that the user had browsed recently, and
indicates the weight of
of the user.
The same as with a user, we also set a threshold
to obtain a candidate set of items. Here,
is the average similarity to the user’s purchase intention
, as expressed by Equation (9):
If , then item j will be added to the candidate set of .
Reference [
3] has proved that the CF based on the items is superior to the CF based on the users. Therefore, we focused on selecting the item’s nearest neighbors for recommendations. Equation (10) expresses the traditional CF based on the items.
We obtained , which means the preference of user u to item i, and then, recommended the items by from high to low.
In contrast to the traditional CF, we considered the user’s candidate set to reorder the item’s candidate set to obtain better recommendation results. Suppose that
describes the item-support of items
i and
j, respectively; then, it is calculated by Equation (11):
where
i and
j means items, and
means the behavior log of user
. If
, then
; otherwise,
. Therefore, we calculated the
more accurately by Equation (12):
We illustrate the specific principle with an example: assume that the candidate set of user u is , and the candidate set of item i is , .
Analyzing the behavior logs of , we obtained:
and , , , . Therefore, we reordered the items’ candidate set by Equations (11) and (12) to generate better recommendation results to the users.
6. Experiments and Analysis
6.1. Dataset
The JData dataset of our experiment was provided by JD, which is the second largest Chinese e-commerce platform. The JData dataset contains user behavior logs from 1 February to 15 April, and the time is accurate to the second, which is the main reason why we used the JData dataset. The download site of JData dataset is on the first page. The user’s behavior contains four main types: clicking, adding shopping cart, collecting, and buying. In addition, the user’s Id, item’s Id, precise time of user’s behavior, item’s category, item’s brand, and the type of user’s behavior were also included.
First, we preprocessed the data, retaining only the users who had purchased during this period of time. Then, we obtained 6,841,000 behavior records that contained 29,485 users and 21,267 items. We divided these records into training data and testing data. The training data were composed of the records from 1 February to 10 April, and the testing data were composed of the records from 10 April to 15 April. In the training data, there were 6,168,390 behavior records. We divided them into different purchase-cycles and obtained 122,954 purchase-cycles.
6.2. Evaluation Criterion
In this paper, our position was to predict the items that users will purchase in the next period by mining the user’s behavior log. Therefore, we used precision, recall, and F-score to evaluate the quality of the algorithms.
where TP means the set of items in the recommendation results and purchased by the user. FP means the set of items in the recommendation results but not purchased by the user. FN means the set of items that were purchased by user but not in the recommendation results. F is the harmonic average of the precision and recall.
6.3. Experimental Results and Analysis
6.3.1. Experiment 1: Discuss the Methods of Calculating the User’s Similarity
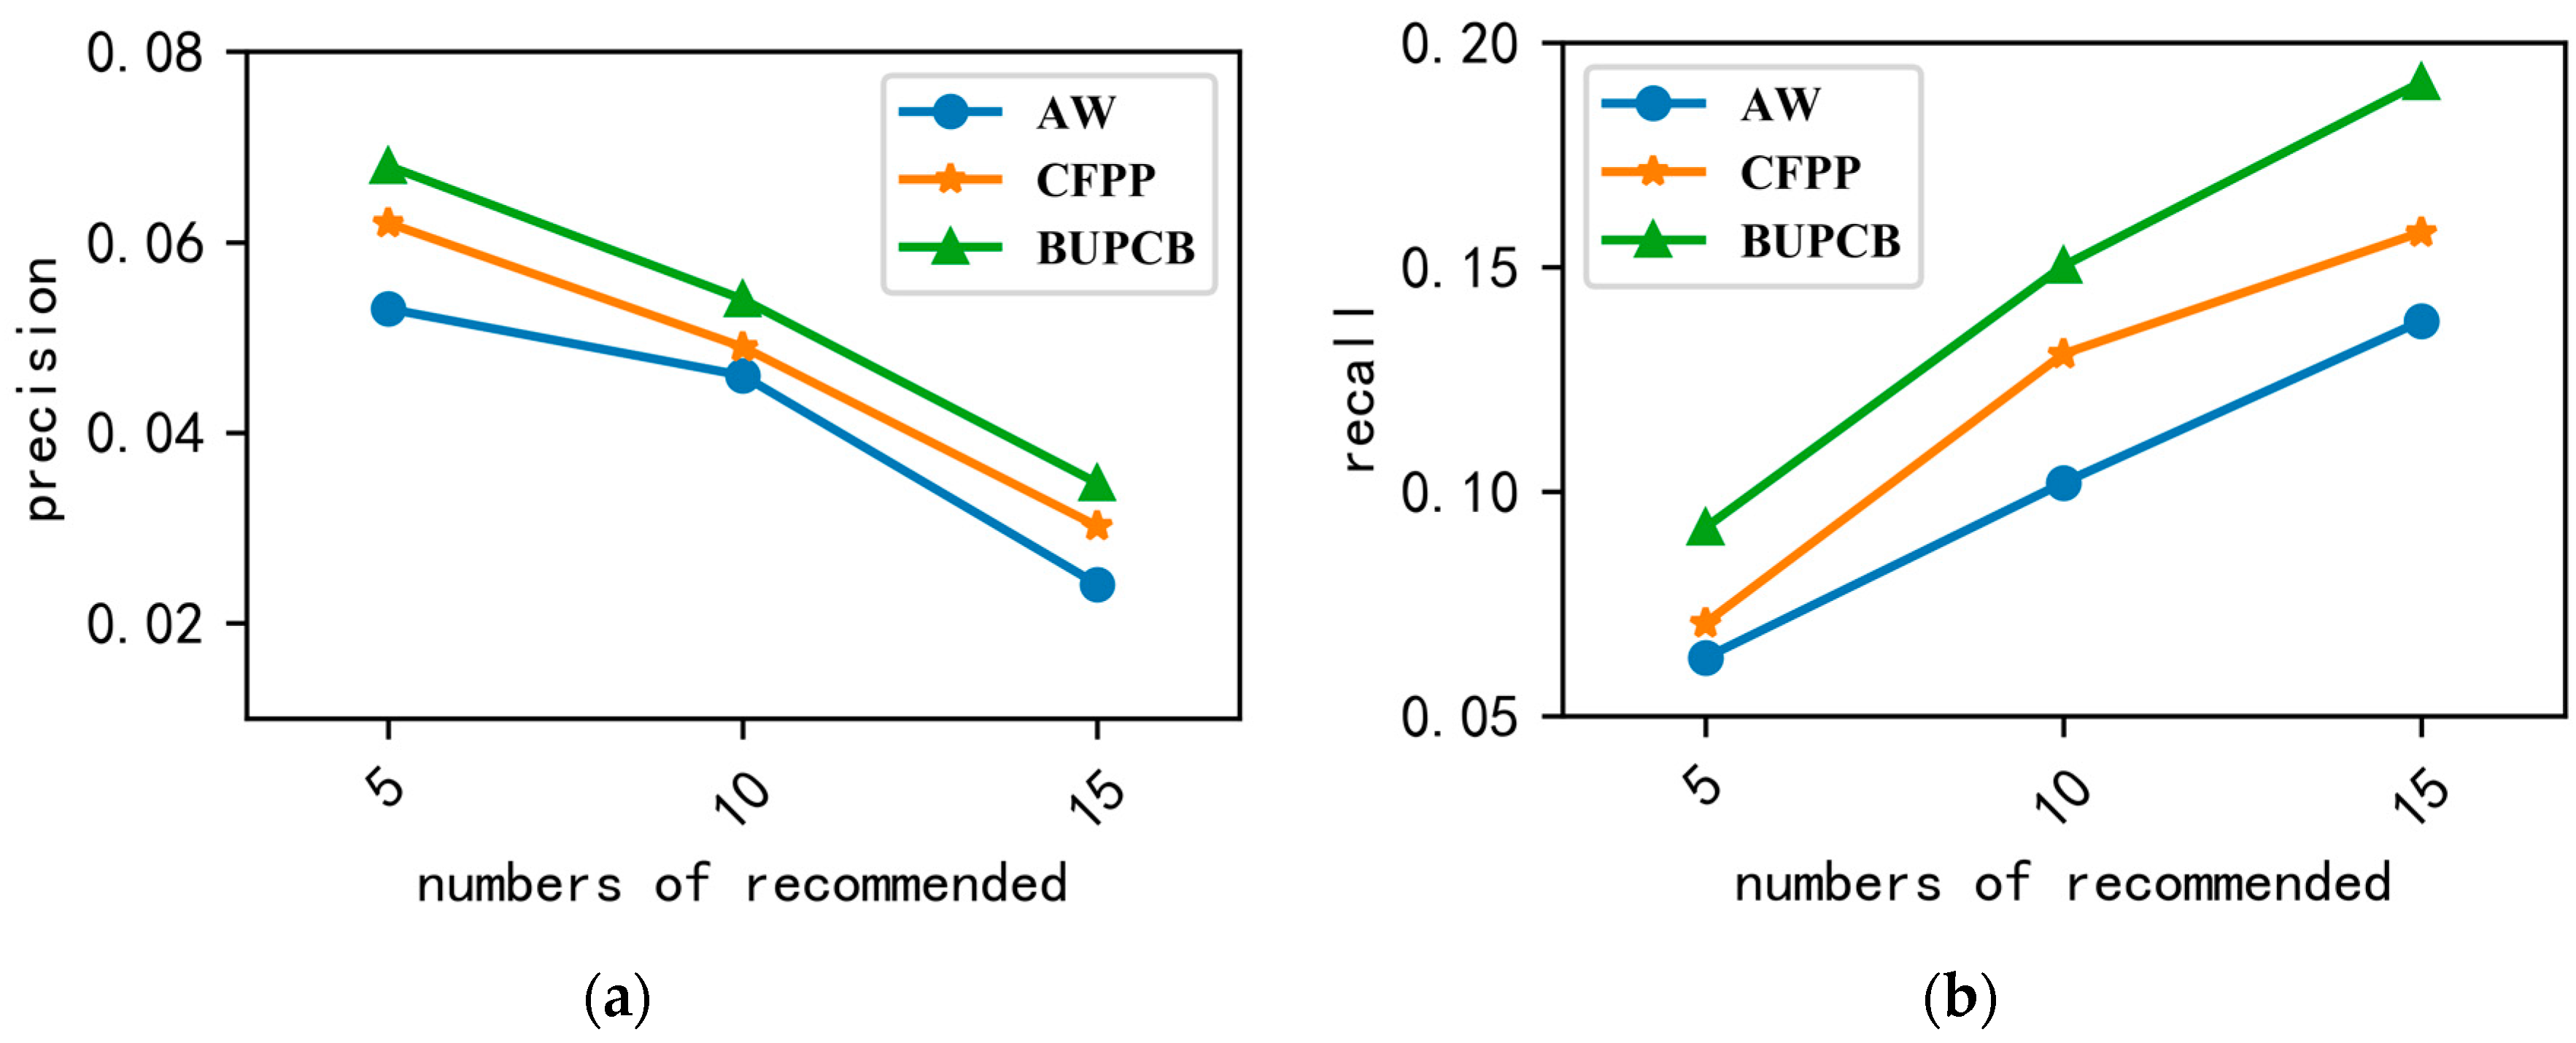
Different methods to measure the similarity of the users can obtain different nearest neighbors, and the recommendation results will be influenced. To illustrate that our method was better, we chose the following methods:
AW: add weight directly to the user’s different behaviors. Clicking with 1, adding with 2, collecting with 3, buying with 5. Then, we calculated the user’s similarity with the Pearson Correlation Coefficient.
CFPP [6]: calculate the user’s similarity by the Pearson correlation coefficient with the user’s preference, which is computed solely based on the purchase data.
BUPSP (based-user-purchase-comparison-behavior): calculate the user’s similarity by the Pearson correlation coefficient with the user’s purchase behavior and comparison behavior.
It can be seen that the precision and recall of AW is the worst, from
Figure 4. The reason is that AW does not consider the user’s individual preference. The result of CFPP is better than AW but worse than BUPCB, which is because CFPP only considers the user’s purchase behavior. Different from the two above methods, BUPCB quantifies the user’s different behaviors according to the user’s behavior habits and calculates the user’s similarity with the user’s comparison behavior. In addition, the results prove the importance of considering the user’s comparison behavior when calculating the user’s similarity.
Figure 4a also shows that the precision is lower when the number recommended increase, which occurs because the test data only include 5 days of JData, and the number of items purchased by a user is small.
6.3.2. Experiment 2: Discuss the Methods of Calculating the Item’s Similarity
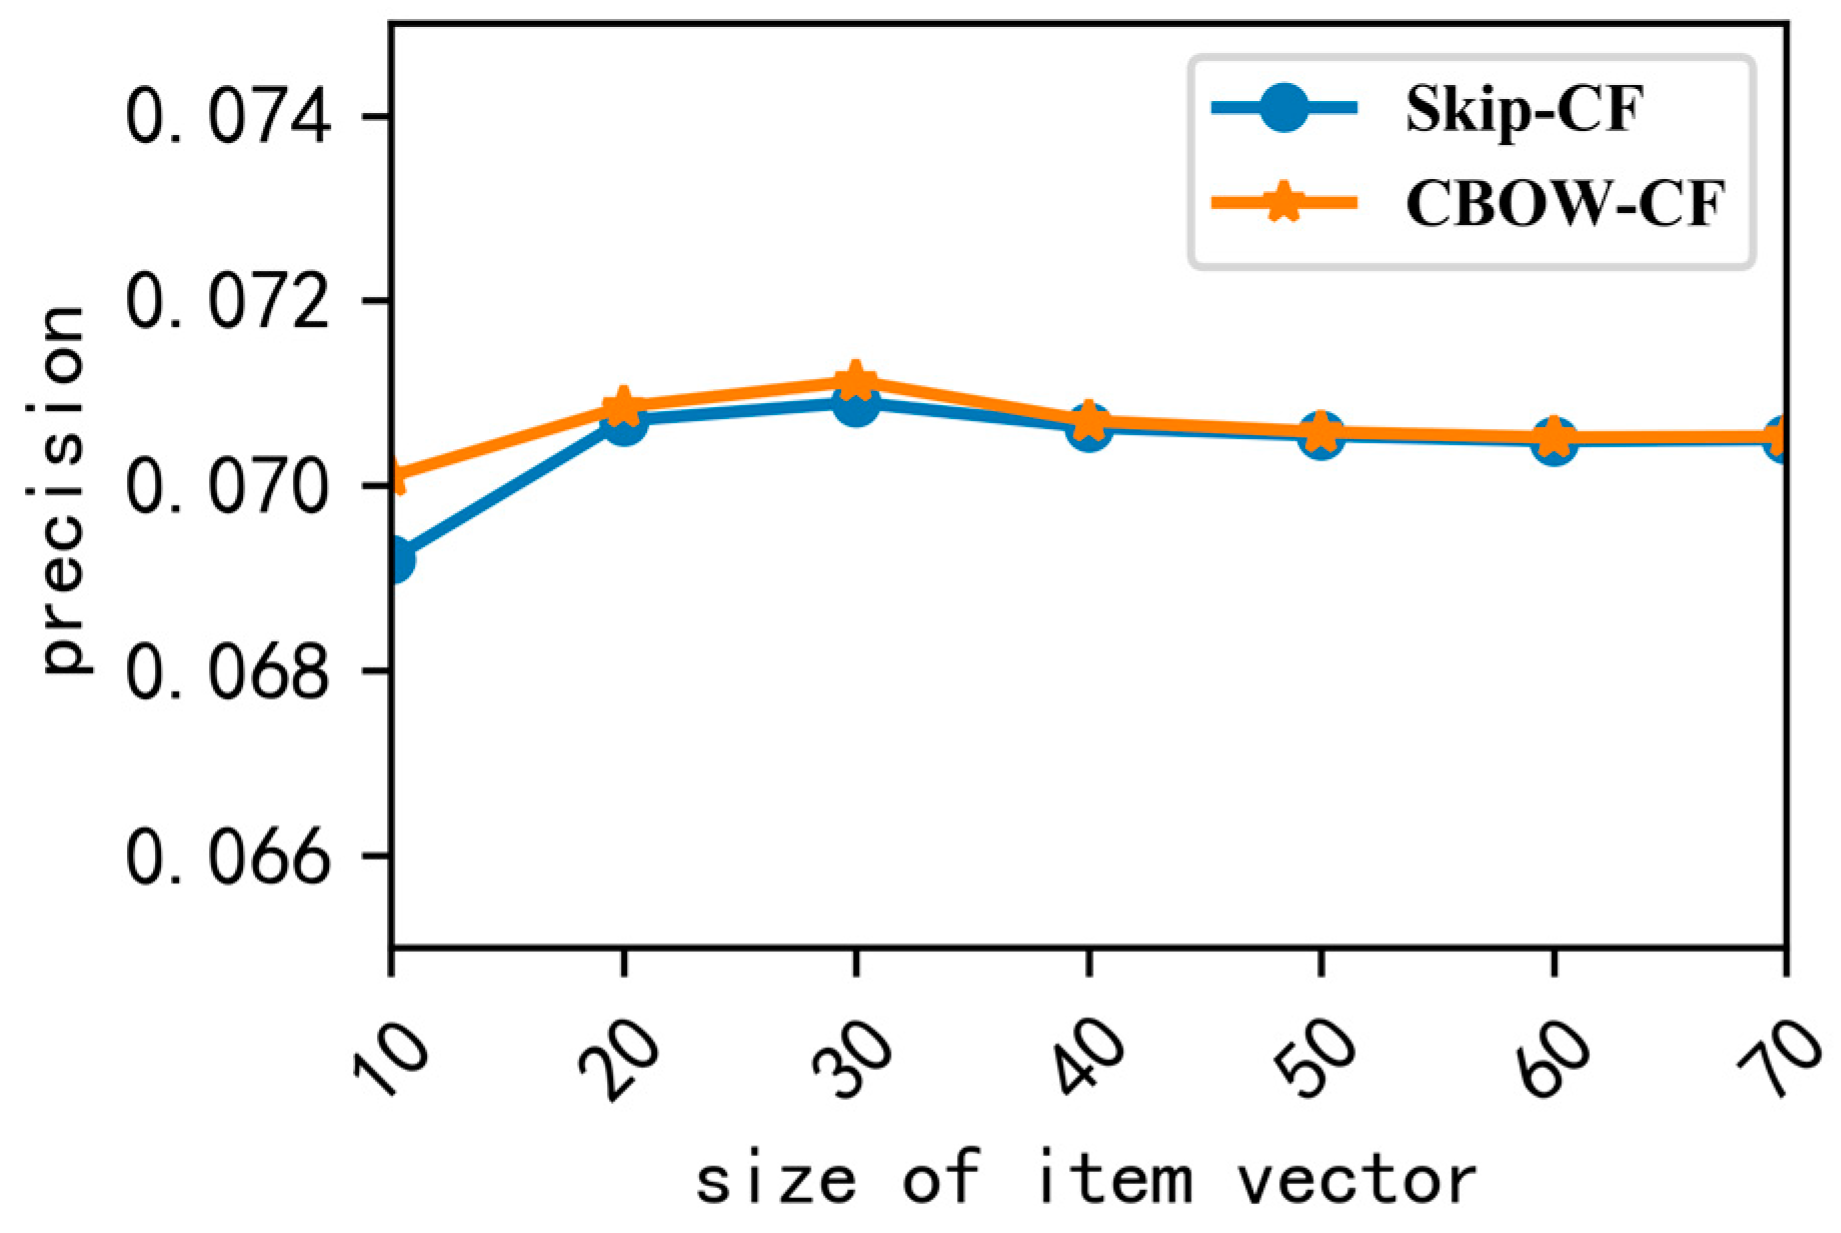
In this paper, we used the CBOW model and Skip-gram model to map items to low-latitude vector space, and we used cosine to calculate the item’s similarity; the two methods are represented by CBOW-CF and Skip-CF. First, we set the vector size to be from 10 to 70, and obtained the precision shown in
Figure 5.
Figure 5 shows that when the vector’s dimension is 30, the precision is the best. Therefore, the constant values for the parameters were set to the following: embedding-size = 30, skip-window = 1, and train-times = 50,000, and we removed the items that appeared less than two times.
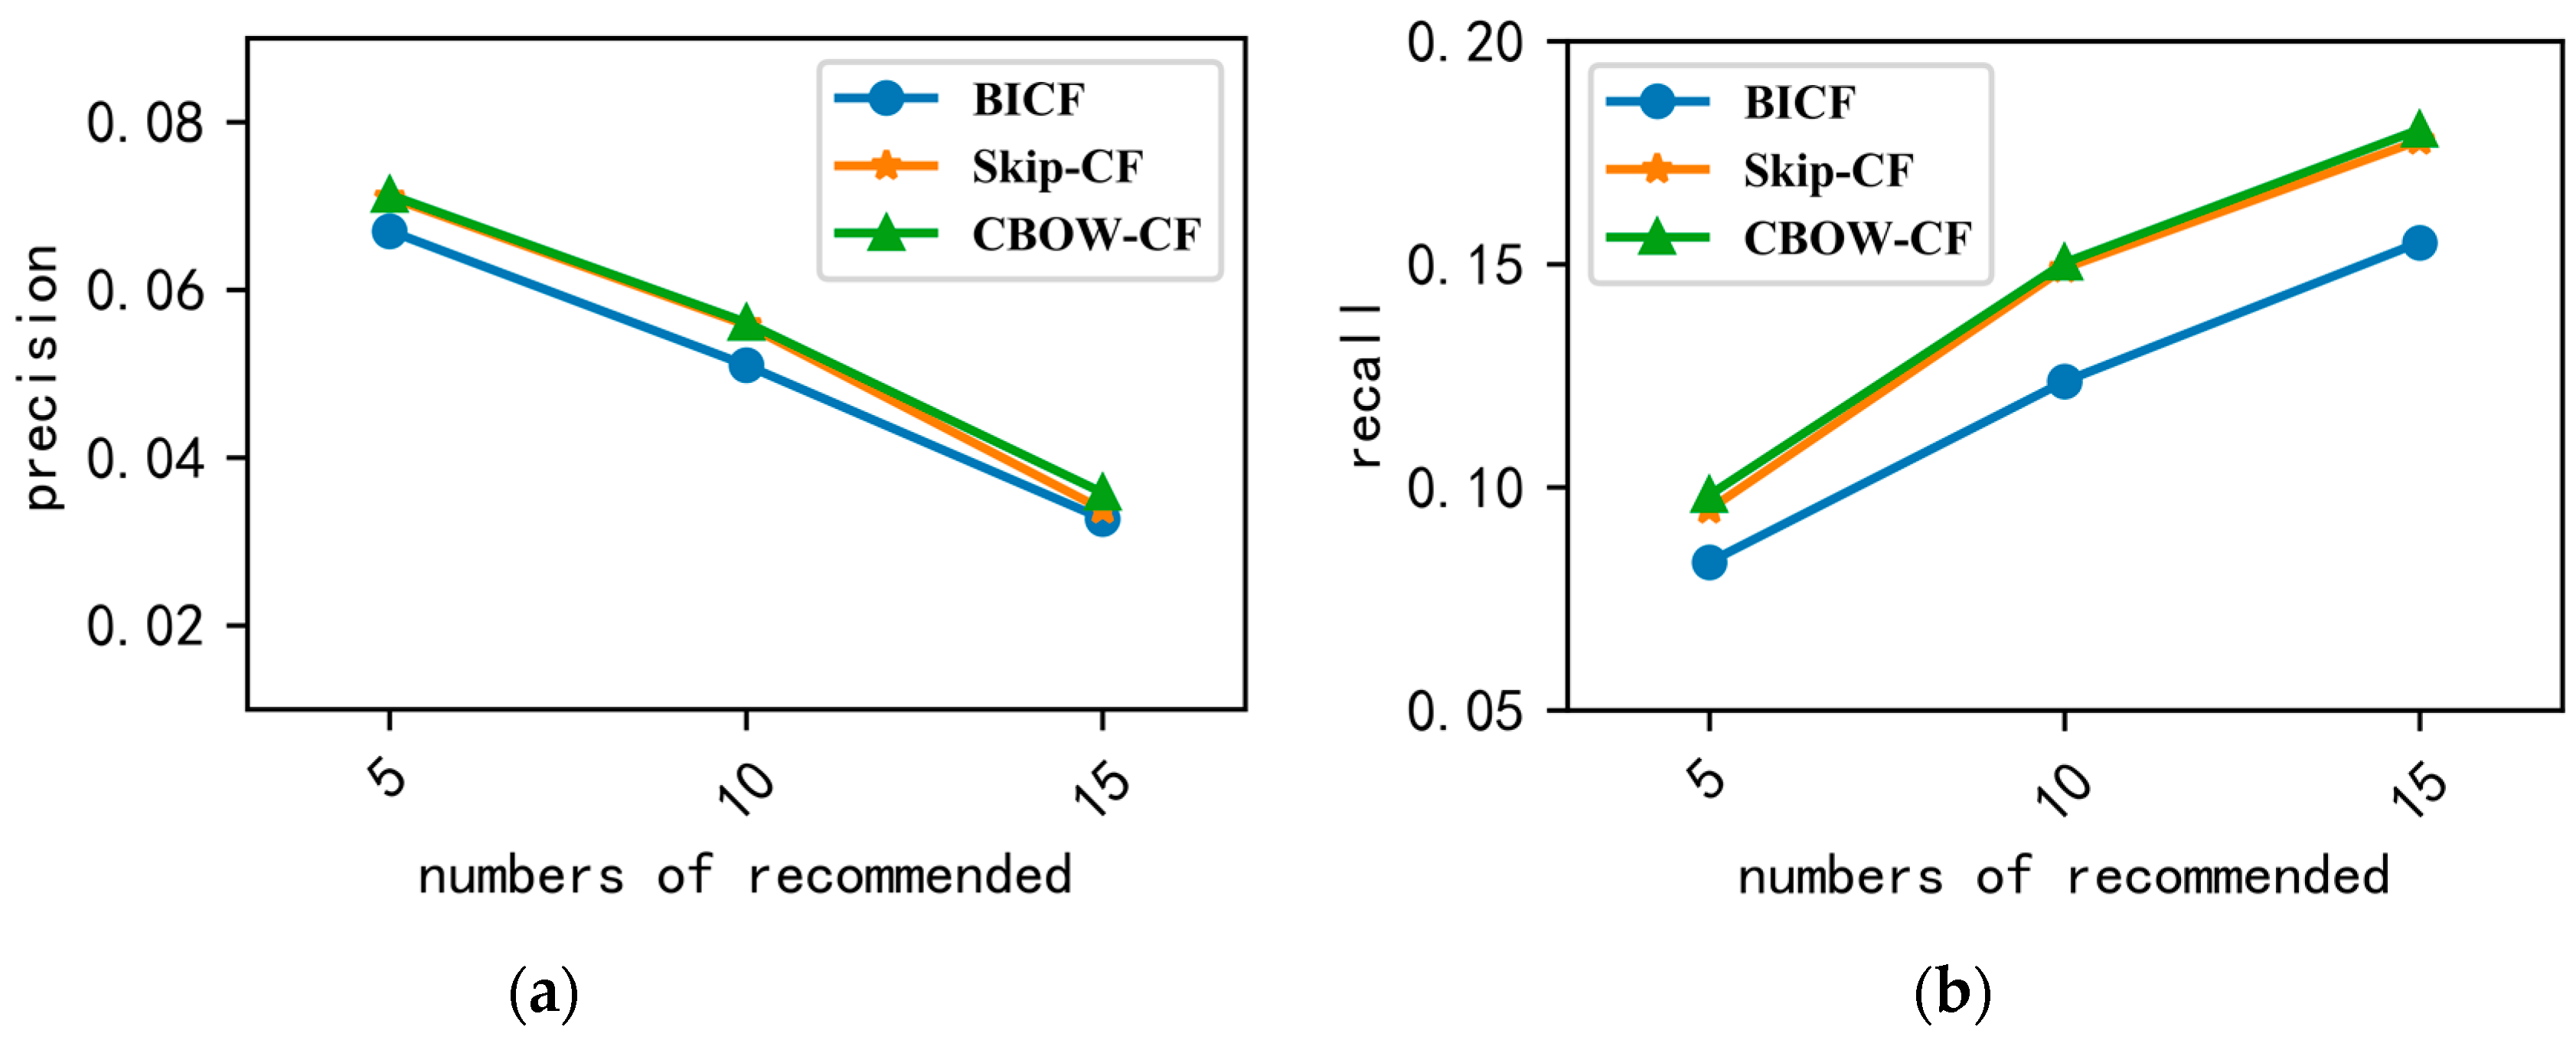
Figure 6a,b shows the comparison with BICF, which calculates the item’s similarity by the user’s rating, and the interactive times with the items is considered to be the rating data of the user to the items in BICF. The precision and recall of CBOW-CF and Skip-CF, proposed in this paper, were better than BICF, and the result of CBOW-CF was better than Skip-CF. This finding could arise because the training data were small, and the CBOW model performs better when the training data are small.
6.3.3. Experiment 3: Comparison with Other Methods
Because our method was based entirely on the user’s implicit feedback, we called it BUIF. To verify the effectiveness of BUIF, the precision, recall, and F1 were compared with the following algorithms while using the same dataset.
BUCF: traditional CF based on users. BUCF calculates the user’s similarity by the number of common items that are purchased by the users.
BICF [
3]: traditional CF based on items. BICF calculates the item’s similarity by the number of common users that purchased the same item.
FPP [
6]: builds a rating matrix solely based on the purchase data of the users. FPP integrates CF-based recommendations and SPA-based recommendations.
BUPCB: proposed in this paper, it calculates the user’s similarity by the Pearson correlation coefficient with the user’s purchase behavior and comparison behavior.
CBOW-CF: trains item-sequences with the CBOW model to obtain the item vectors, and then, combines the traditional CF to generate the algorithm CBOW-CF.
BUIF: Our methods described above.
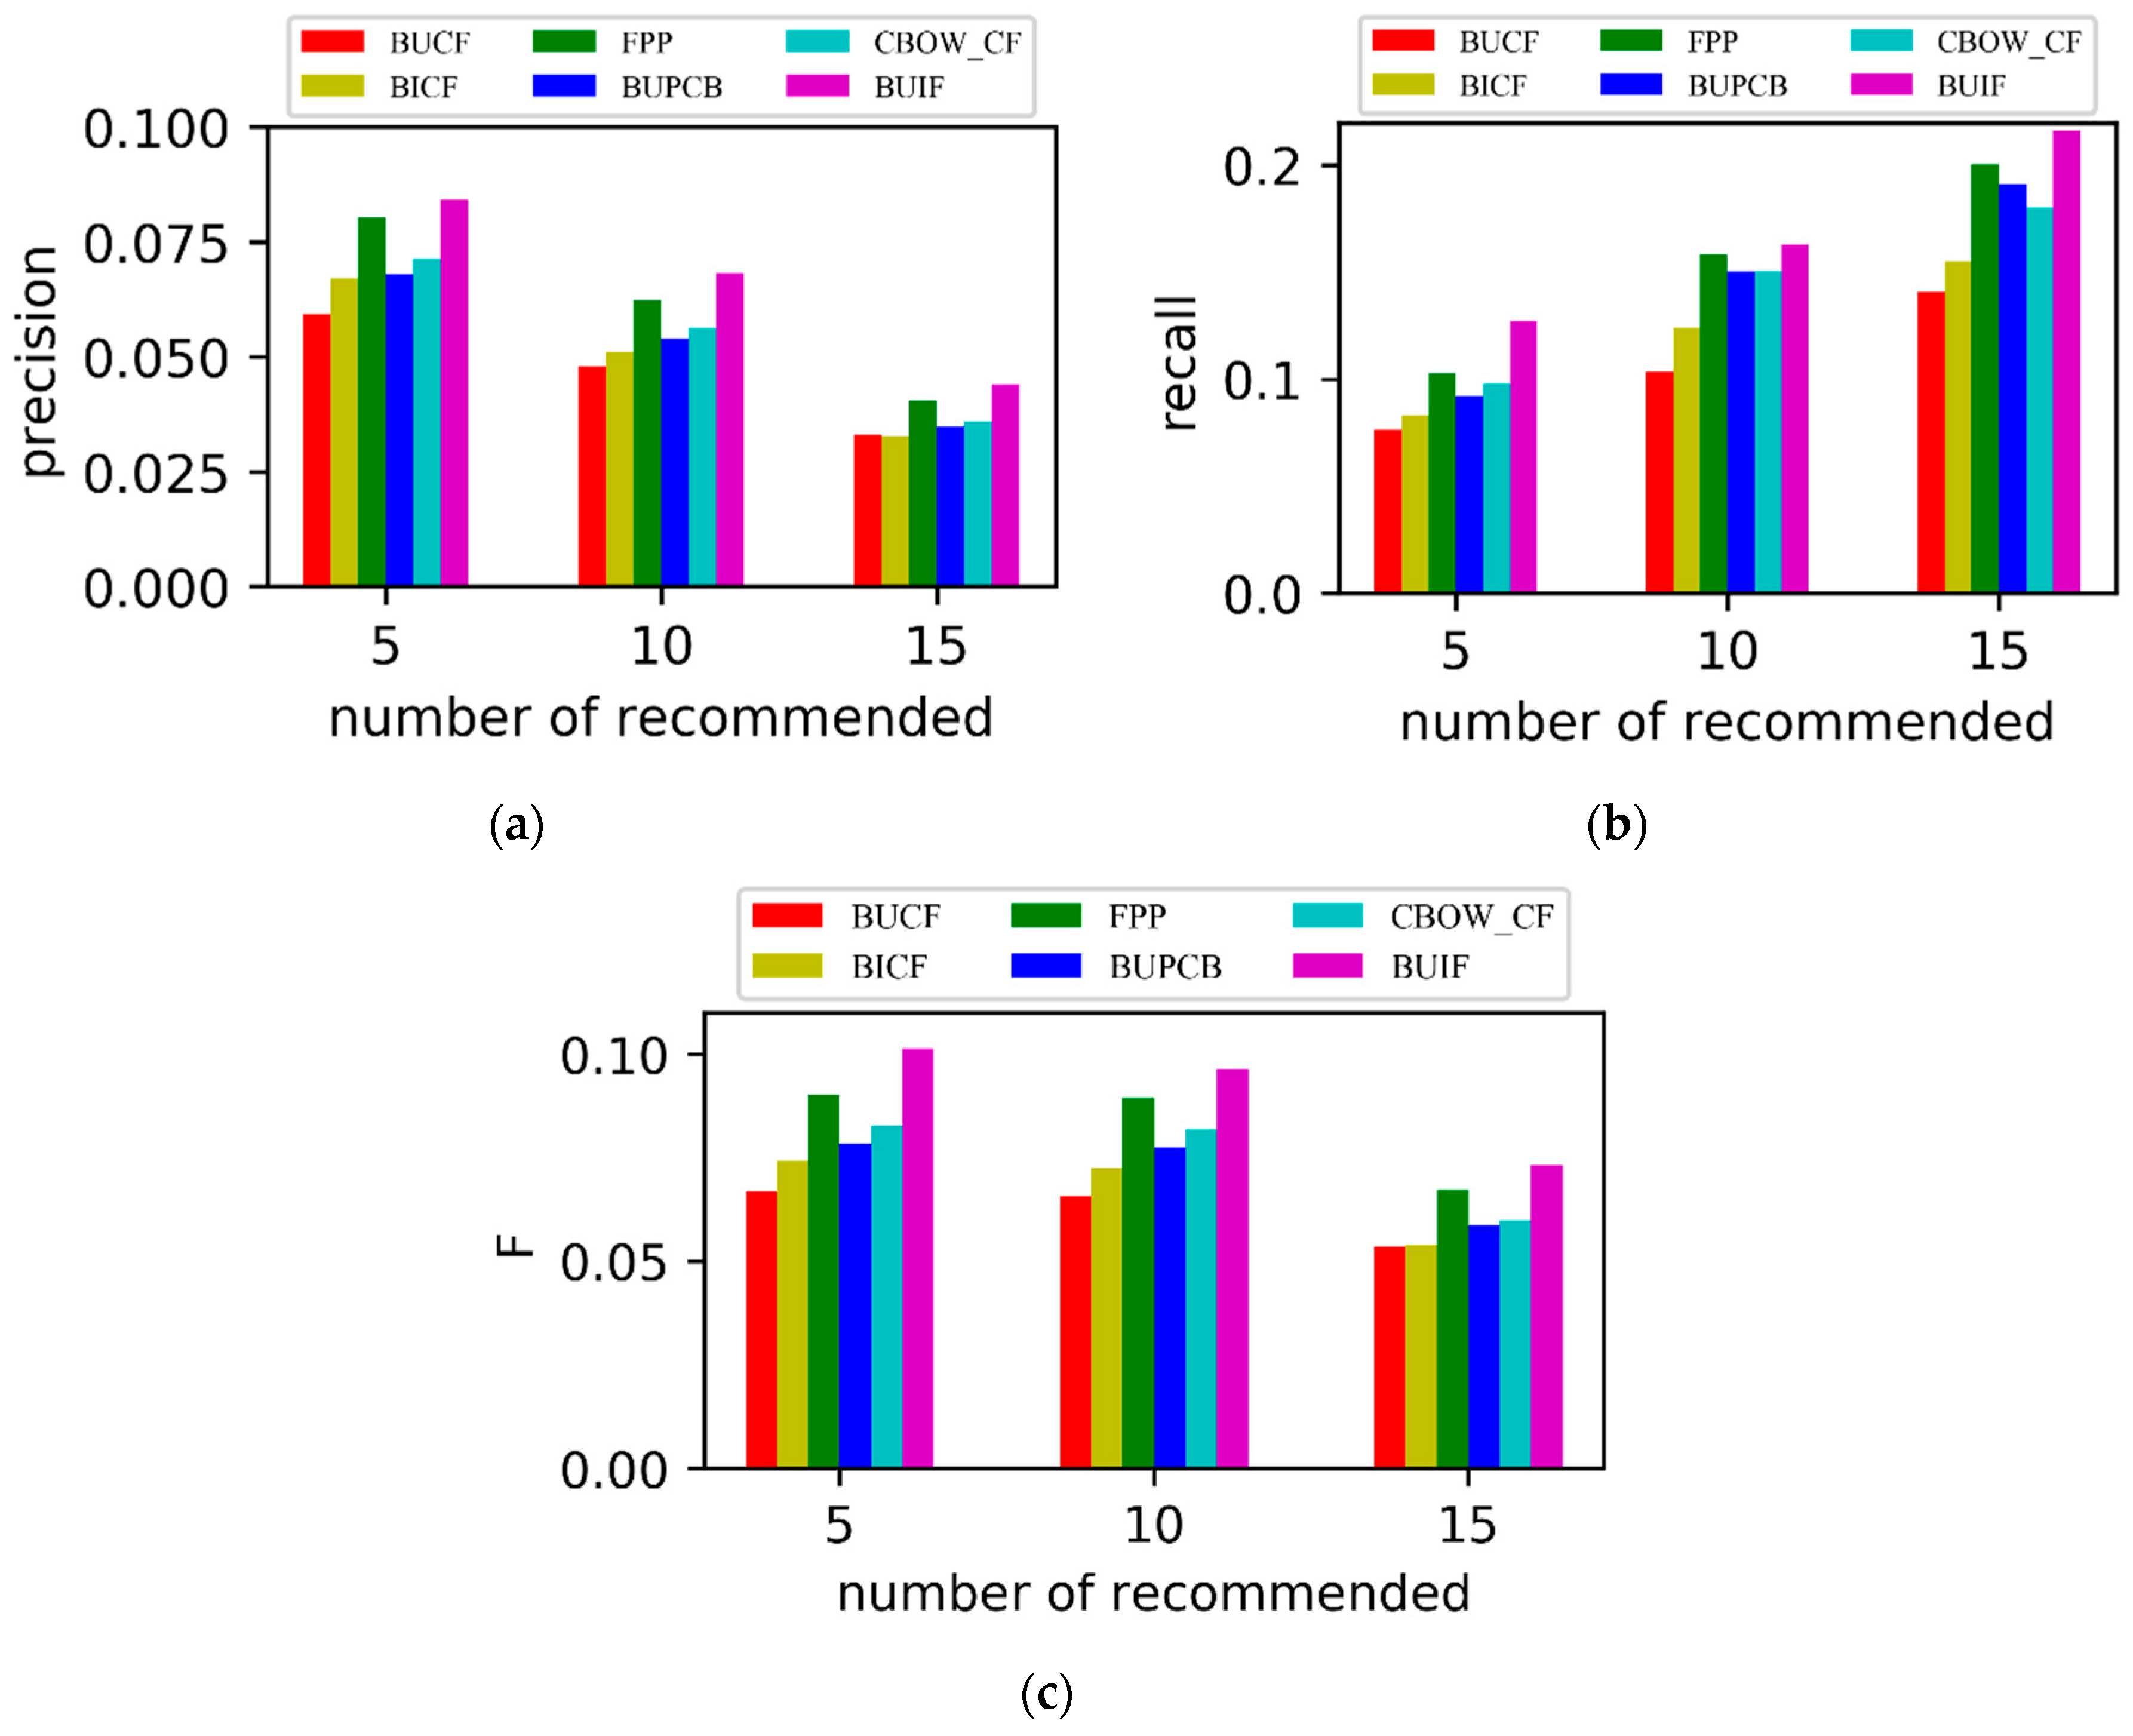
From
Figure 7a–c, it can be seen that the precision, recall, and F1 of BUCF and BICF are worse, which is because they regard all behaviors as one type and select the nearest neighbors based on the whole user set and item set. The FPP solely considers the user’s purchase data and disregards the information included in clicking, adding, and collecting, which causes the recommendation quality to be reduced. The BUIF method performed better than the others in terms of the precision and recall because BUIF not only considers the user’s purchase behavior but also comparison behavior that improved the accuracy of the user’s similarity, and BUIF calculates the item’s similarity by an item vector that considers the item-sequence information. In addition, the overall accuracy and quality of recommendation were improved effectively through reordering the item’s candidate items.
There is also an example of a real JD user represented by user_id (290054). We used the above methods to recommend items (number of recommended is five) to the user (290054) and the results are shown in
Table 6.
In
Table 6, the items are also represented by sku_id. Additionally, the red sku_id means purchased items by the user (290054) in the test data. From
Table 5, it can be seen that the recommendation results of BUIF were purchased more than other methods, which means our method will obtain a high degree of user satisfaction.
7. Conclusions
This paper proposed a new personalized recommendation algorithm based on the user’s implicit feedback. This method fully exploits the implicit information in the user’s behavior log, such as the purchase behavior, comparison behavior, and item sequences. Some algorithms in the NLP field, such as TF-IDF and word2vec technologies, were improved and applied to calculate the user’s similarity and item’s similarity, which make the user’s similarity and item’s similarity more accurate. Additionally, a secondary reordering screening process was constructed to obtain the final recommended items. From the results, it can be seen that the F1 of BUIF increased an average 28% and 22% compared with BUCF and BICF, respectively, when the number of recommended items is 5, 10, and 15. At present, the paper only mines the user’s behavior log. In the future, we will combine the user behavior log with the user’s demographic features (age, gender, and occupation) and the item’s features information (brand, category) and refine it on the basis of a specific group of people or items. In addition, the experiments in this paper were experiments on a part of the data. In future work, we will verify the performance of the algorithm on a larger data set.


