Article

Metformin-Sensitized Chemotherapy of Docetaxel Nanoemulsions Based on a Sequential Administration

1
College of Pharmaceutical Sciences, Zhejiang University, 866 Yuhangtang Road, Hangzhou 310058, China
2
Institute of Biochemistry, College of Life Sciences, Zhejiang University, 866 Yuhangtang Road, Hangzhou 310058, China
*
Authors to whom correspondence should be addressed.
These authors contributed equally to this work.
Pharmaceutics 2025, 17(7), 812; https://doi.org/10.3390/pharmaceutics17070812
Submission received: 9 May 2025 / Revised: 16 June 2025 / Accepted: 19 June 2025 / Published: 23 June 2025
(This article belongs to the Special Issue Combination Therapy Approaches for Cancer Treatment)

Abstract

Background: Chemotherapy has a broad-spectrum anti-tumor effect and is still the core strategy for cancer treatment. However, the side effects caused by its cytotoxicity, the chemoresistance caused by tumor heterogeneity and abnormal microenvironment seriously restrict the efficacy of chemotherapy. Metformin presents the ability to sensitize chemotherapy by interfering with metabolic processes of tumor cells. However, as a dynamic process, metabolic intervention requires a specific time sequence law to optimize its role. Methods: Different administration sequences were screened by in vitro experiments to determine the optimal sequence of metformin and docetaxel. The anti-tumor effect of administration sequence in vivo was investigated in mouse models. The therapeutic advantages were comprehensively evaluated by tumor size, weight change, and survival rate. The immunofluorescent staining and transcriptome analysis were performed to study the mechanisms of the sequential administration strategy. Results: Compared with the subsequent administration and concurrent administration, pretreatment with metformin exhibited a stronger ability toward cell cycle arrest and tumor inhibition with low-dose docetaxel. Moreover, this pre-administration sequence could enhance the anti-tumor immune responses and prevent postoperative recurrence. Conclusions: The optimized chemotherapy sensitization mediated by metabolic intervention required an appropriate administration sequence, which also strengthened the anti-tumor immune responses.

1. Introduction

Due to its broad-spectrum anti-tumor effects based on cytotoxicity to rapidly proliferating cells, chemotherapy is still a cornerstone in the management of malignant tumors [1,2,3,4]. However, the mechanisms to inhibit proliferation and induce apoptosis through interfering with DNA replication, suppressing microtubule dynamics or blocking nucleotide metabolism make chemotherapy a double-edged sword, as it also causes great damages to normal tissues [5,6,7,8,9]. Moreover, the tumor heterogeneity and abnormal microenvironment establish chemoresistance via metabolic reprogramming, cell differentiation, drug efflux, drug degradation and DNA damage repair [10,11,12,13]. It prompts dose escalation and multidrug combination, leading to the increased risk of toxic side effects [14,15,16,17]. Therefore, it is critical to develop strategies for chemotherapy sensitization.
Metformin (Met), a classic anti-diabetic agent, has become a promising sensitizer for different cancer treatments, especially for chemotherapy [18,19,20,21]. Because of its metabolic modulation ability, metformin can disturb tumor homeostasis [22,23,24]. Metformin can inhibit the activity of mitochondrial complex I, activating the adenosine 5′-monophosphate-activated protein kinase (AMPK) signal axis, which will suppress anabolic pathways through the mammalian target of the rapamycin (mTOR) pathway [25,26]. In addition, with the downregulation of insulin-like growth factor-1 (IGF-1) signal, metformin can also weaken pro-proliferation networks [27,28,29]. Notably, the ion-trapping effects of chemotherapy caused by acidic tumor microenvironment can be reversed because of the suppression ability to lactate dehydrogenase (LDH) of metformin [30,31,32,33,34]. In a word, metformin could enhance the efficacy of chemotherapy and improve cancer outcomes.
However, the metabolic activity of tumors is a dynamic and continuous process; so, the metabolic intervention caused by metformin is time-dependent [35,36,37]. In order to achieve the optimized sensitization effect, chemotherapy should be involved at the appropriate time, which suggests that a specific administration sequence is required. In addition, the metabolic regulation of metformin has also been proved to modulate the tumor immune microenvironment, resulting in the regulation of immune activities such as T cell memory differentiation and dendritic cell maturation [38,39,40]. But the current study on the immune status of tumor microenvironment after sequential administration of metformin and chemotherapy is not sufficient.
In this article, we evaluated different administration sequences of metformin and docetaxel both in vitro and in vivo to determine an optimal choice. The anti-tumor effect was investigated in mouse models with 4T1 breast cancer. Immunofluorescent staining and transcriptome analysis were performed to study the mechanisms of the sequential administration strategy, especially the influences on cell cycle and immune responses.

2. Materials and Methods

2.1. Materials

The Cell Counting Kit 8 (cck8), Lyso-Tracker Red and the Cell Cycle and Apoptosis Analysis Kit were purchased from Beyotime Institute of Biotechnology (Shanghai, China). Metformin was purchased from Meilun Biotechnology Co., Ltd. (Dalian, China). FITC-anti-CD3 antibody and other antibodies against cell surface markers for the flow cytometry (fluorescent-activated cell sorting) assay were purchased from eBioscience (San Diego, CA, USA). InVivomAb anti-mouse CD8α (clone 53–67) and anti-mouse CD4 (cloneGK1.5) were purchased from BioXcell (West Lebanon, NH, USA). Docetaxel was purchased from Nanfang pharmaceutcal Co., Ltd. (Fuzhou, Fujian, China), and medium-chain triglyceride (MCT), soyabean lecithin (S100), and Vitamin E (VE, alpha-tocopheryloxyacetic acid) were obtained from Lipoid Co. (Ludwigshafen, Germany). All the chemicals and solvents were of analytical grade and were used as received.

2.2. Cells and Animals

Human breast cancer cell line MCF7 and mouse breast cancer cell line 4T1 were originally obtained from the Institute of Biochemistry and Cell Biology (Shanghai, China), and maintained in high-glucose DMEM (GNM12800, JiNuo Biotechnology Co., Ltd., Hangzhou, Zhejiang, China) supplemented with 10% fetal bovine serum (FBS) (16140071, Gibco life technologies) in a humidified atmosphere containing 5% CO2.
Female BALB/c mice (6–8-weeks, 18–20 g) were purchased from Slaccas Experimental Animal Co., Ltd. (Shanghai, China) and housed under standard conditions of animal maintenance at 24 ± 1 °C with an alternate 12 h light–dark cycle. All experimental procedures were conducted according to the protocols approved by the Institutional Animal Care and Use Committee of Zhejiang University.

2.3. Preparation of Nanoemulsions

The docetaxel nanoemulsions (DOC nps) were prepared by high-energy emulsification method using high-pressure homogenization (HPH). Briefly, docetaxel was dissolved in a mixed medium of VE, S100, and MCT to form an oil phase, which was further dispersed in an aqueous phase containing sucrose. Finally, oil droplets were dispersed into nanoscale-sized particles using the HPH method, and then the solution was filtered through a 0.45 mm pore-sized membrane, lyophilized and stored at 4 °C for further use.
The blank nanoemulsions (Blank nps) and DiD-labeled nanoemulsions (DiD nps) were prepared in same way. For Blank nps, an oil phase without docetaxel was used; and for DiD nps, an 0.5% DiD oil phase without docetaxel was used.

2.4. In Vitro Therapeutic Efficacy of the Sequential Strategy Against Breast Cancer Cells

MCF7 cells were seeded into 96-well culture plate at a density of 5 × 10³ cells in 0.1 mL complete medium per well. When the cells reached the logarithmic growth phase, they were treated with different doses of Taxotere® and different administration sequence of 1 mg/mL metformin: for the 1M/2T group, the cells were treated with metformin 6 h before Taxotere®; for the 1T/2M group, the cells were treated with metformin 6 h after Taxotere®; for the M/T group, the cells were treated with metformin and Taxotere® at the same time; for the Tax group, the cells were treated with Taxotere® alone. Cell viability was monitored 24 h or 48 h after the treatment of Taxotere® by cck8 kit.
MCF or 4T1 cells were seeded into 96-well culture plate at a density of 5 × 10³ cells in 0.1 mL complete medium per well. When the cells reached the logarithmic growth phase, they were treated with different doses of DOC nps or metformin. Cell viability was monitored 48 h after the treatment by cck8 kit.
For the study of sequential strategy, MCF or 4T1 cells were treated with DOC nps (10 µg/mL docetaxel for MCF7, 5 µg/mL for docetaxel) and different administration sequences of 1 mg/mL metformin: for the 1M/2D group, the cells were treated with metformin 6 h before DOC nps; for the 1D/2M group, the cells were treated with metformin 6 h after DOC nps; for the M/D group, the cells were treated with metformin and DOC nps at the same time; for the Blank NPS group, the cells were treated with the nanoemulsions prepared by the same method of DOC nps but without docetaxel. Cell viability was monitored 48 h after the DOC nps treatment by cck8 kit.

2.5. Cellular Uptake and Distribution

4T1 cells were seeded into a 24-well culture plate at a density of 1 × 10⁴ cells in 0.5 mL complete medium per well and subsequently treated with 5 μL/mL of DiD-labeled nanoemulsions (DiD nps). Metformin was added into the wells (1 mg/mL in the medium) according to the prespecified group. Then, 24 h after DiD nps co-incubation, the cells were harvested.
For the cellular uptake study, the cells were washed twice with PBS and stained with Hoechst 33342 (10 μg/mL) for 30 min at room temperature to visualize the nucleus.
For intracellular distribution study, the cells were washed twice with PBS and received the following operations in sequence: stained with Lyso-Tracker Red (50 nM) for 15 min, treated with 3% glutaraldehyde for 10 min, and stained with Hoechst 33342 (10 μg/mL) for 10 min. The cells were washed with PBS between each operation.
After an extensive wash with PBS, fluorescence pictures were captured by a laser confocal fluorescence microscope (A1R, Nikon, Tokyo, Japan), and further analyzed using graphic processing software ImageJ (v1.52a) to semi-quantitate the fluorescence intensity of DiD.

2.6. Cell Cycle and Apoptosis Analysis

4T1 cells were treated with DOC nps (5 μg/mL docetaxel) and metformin (1 mg/mL) separately, simultaneously, or as the prespecified administration sequence. Then, 24 h after Doc nps co-incubation, the cells of every group were harvested and stained with Cell Cycle and Apoptosis Analysis Kit (Beyotime Institute of Biotechnology, Shanghai, China). The results were detected by a flow cytometer (ACEA Novo CyteTM, ACEA Biosciences, Inc., San Diego, CA, USA) and analyzed by FlowJo software (v10.8.1).

2.7. In Vivo Anti-Tumor Efficacy of Sequential Strategy in the 4T1 Breast Cancer Mouse Model

4T1 cells (1 × 10⁶) were orthotopic injected under the left breast fat pad of female Balb/c mice to establish the orthotopic breast cancer model. When the tumor volume reached 50 mm3, the mice were randomly divided into 5 groups (5 mice for each group): Saline, Free Met (5 mg/kg), DOC nps, M/D (treated with 5 mg/kg metformin and DOC nps at the same time), 1M/2D (treated with 5 mg/kg metformin 6 h before DOC nps).
Within 21 days, the mice received intravenous or intra-tumoral administration every 7 days, as described in the schematic diagram of the therapeutic regimen. The tumor volume was recorded and calculated with the following formula: width × length × height × π/6. At the end of the experiment or when the tumors were larger than 1500 mm3 or the body weight loss was >20%, the mice were sacrificed. The tumors and organs of the mice were collected.
For the intravenous administration of metformin, the dosage of docetaxel was 8 mg/kg (i.v.). And for the intra-tumoral administration of metformin, the dosage of docetaxel was 4 mg/kg (i.v.). A certain number of tumors in each group were made into a single-cell suspension, and stained with fluorescence-labeled antibodies following the manufacturer’s instruction for flow cytometry. All tissue sections’ H&E staining and immunofluorescence staining for animal experiments were authorized by Haoke Biotechnology Co., Ltd. (Hangzhou, China).
RNA sequencing and library construction were authorized by Lianchuan Biotechnology Co., Ltd. (Hangzhou, China). The RNA-seq data were subjected to quality control analysis by FastQC (v0.12.1) and MultiQC (v1.15). The sequencing reads were then aligned to the reference genome UCSC (mm10) using Hisat2 (v2.2.1), and the alignment results were quantified with HTseq (v2.0.5). Differential analysis was conducted on the quantification results using edgR (v4.2.2), and GO (Gene Ontology) analysis was performed based on org.Mm.eg.db (v3.19.1) using ClusterProfiler (v4.12.6). The R package ggplot2 (v3.5.1) was used for data visualization.

2.8. Statistical Analysis

Quantitative data are expressed as the mean ± S.D. When only two groups were compared, a paired t test was used. And an evaluation of significance was performed using a one-way ANOVA when more than two groups were compared. All statistical analyses were conducted using GraphPad Prism 8 software.

3. Results and Discussion

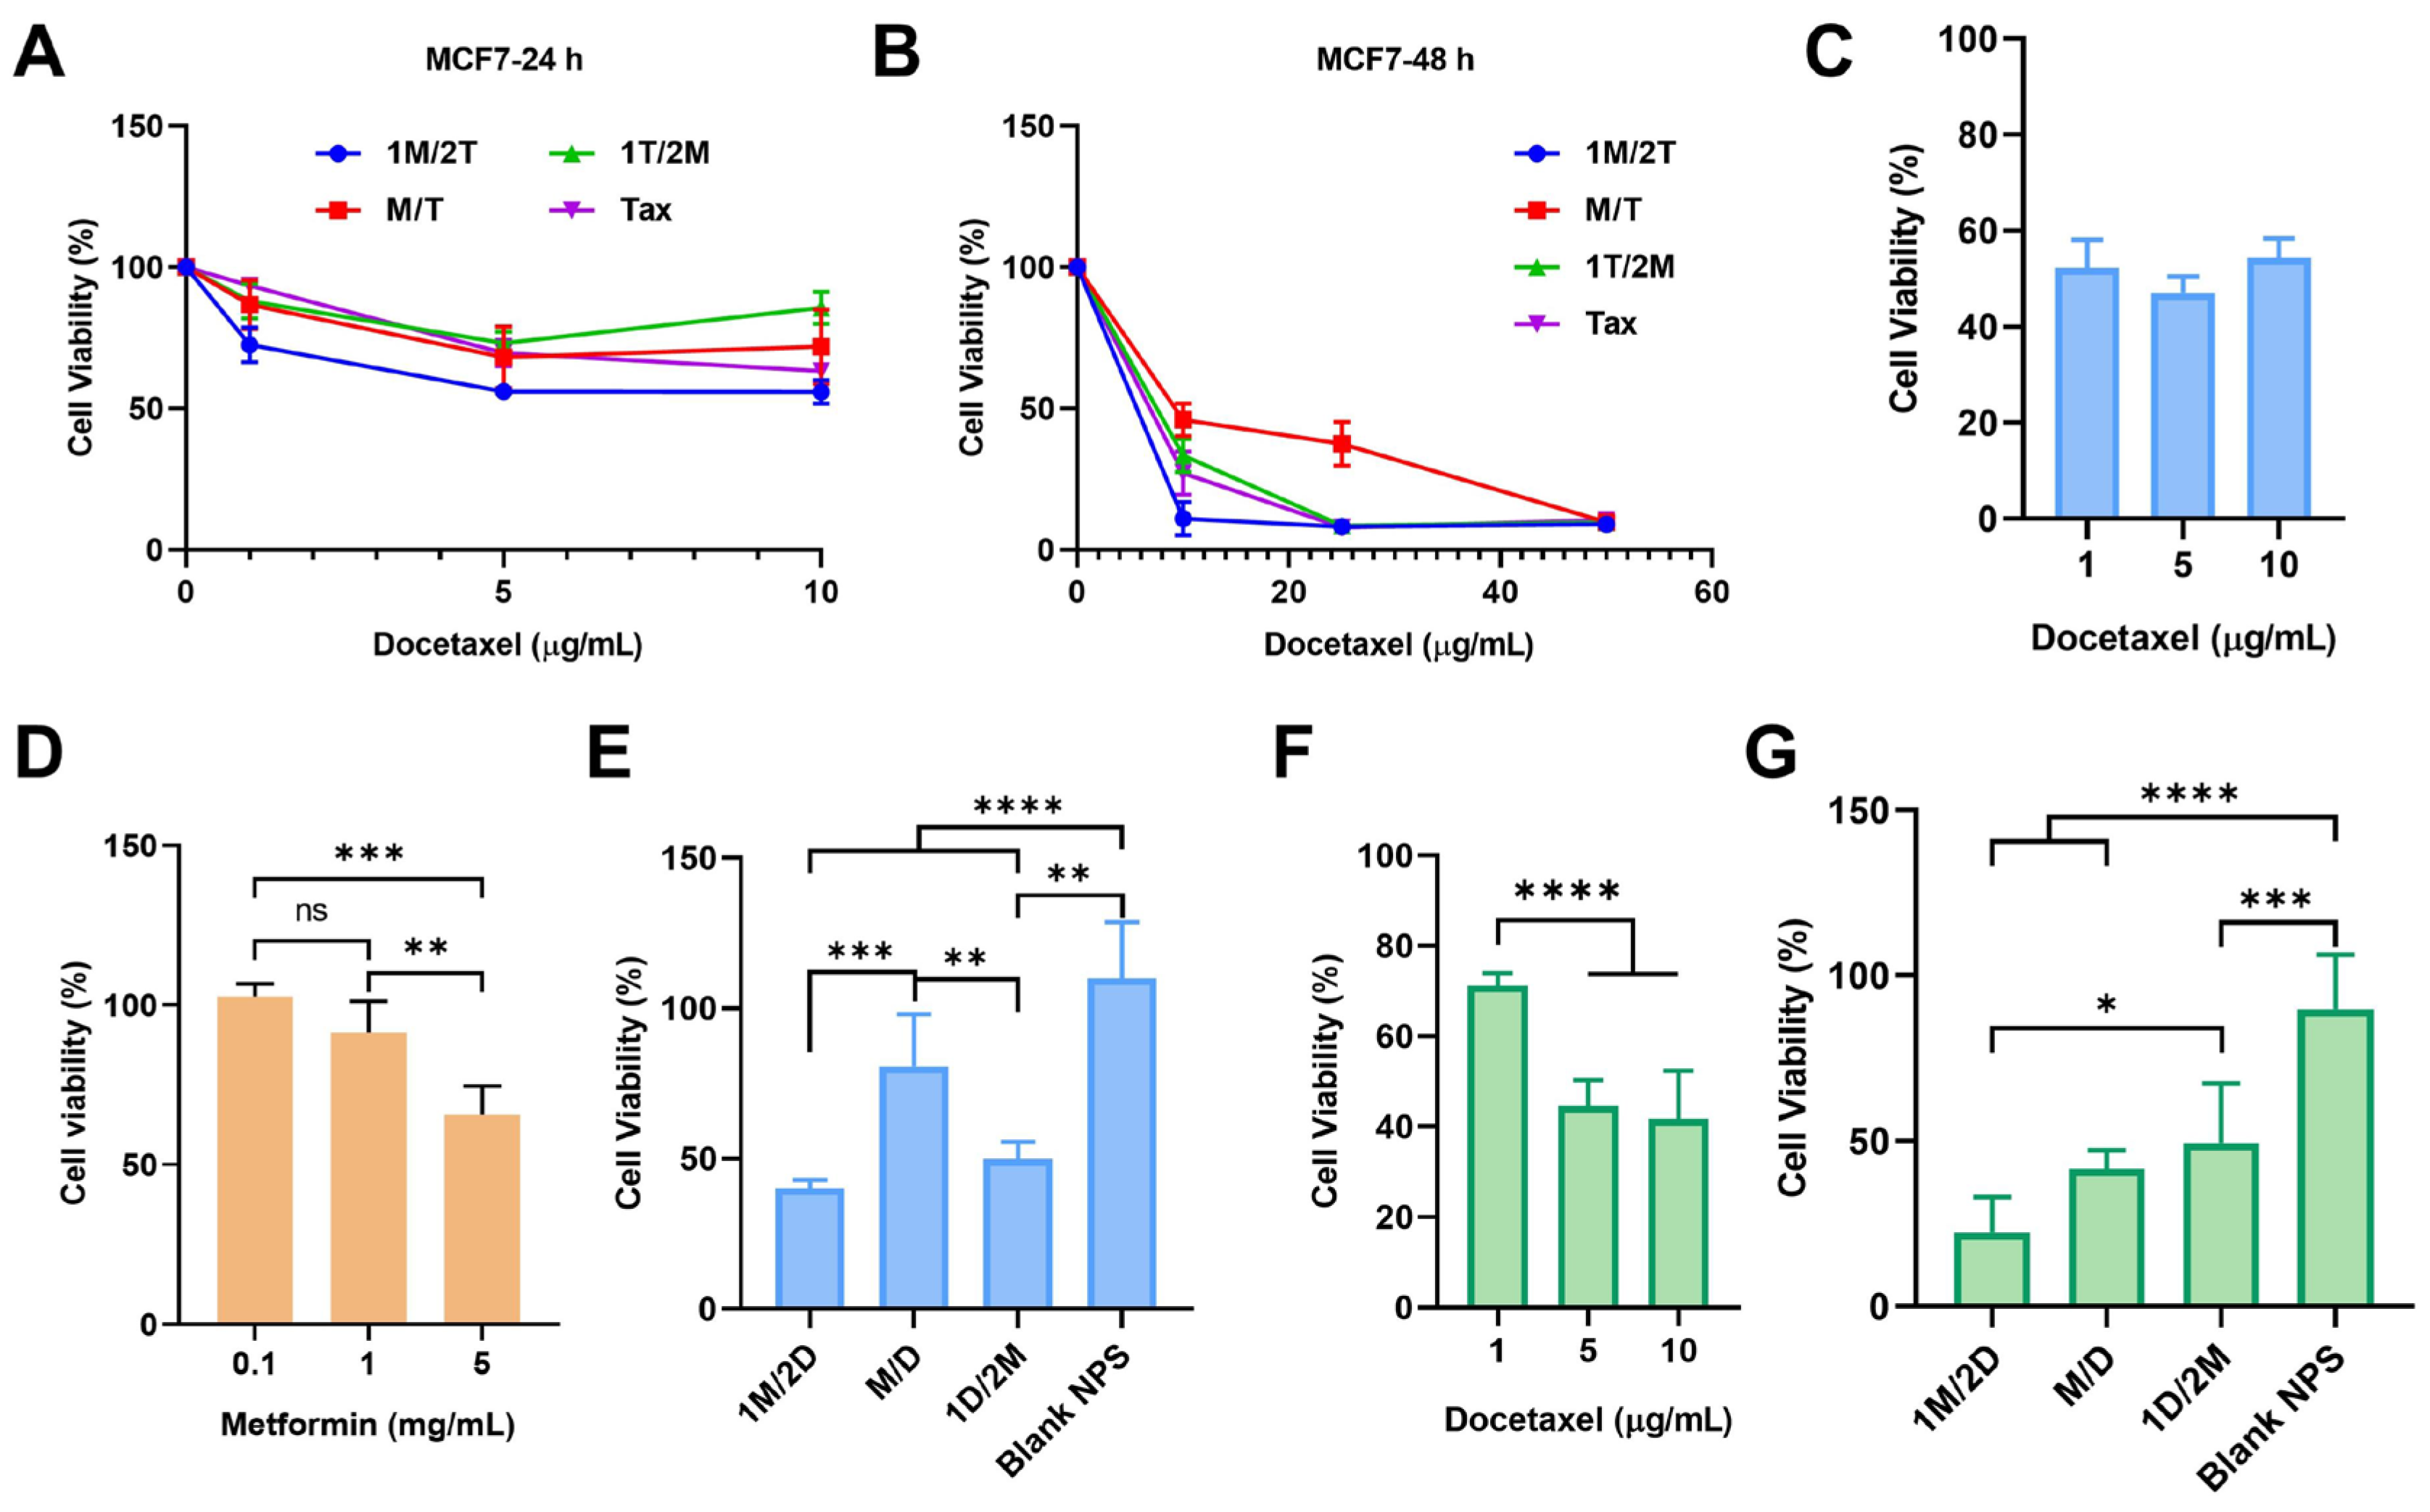
3.1. The Administration Sequence of Metformin Can Affect the Tumor Sensitivity to Chemotherapy

In an in vitro experiment using MCF7 cells (a human breast cancer cell line), we chose docetaxel as the chemotherapy agent. Due to the poor water solubility of docetaxel, Taxotere® (Tax), a commercially available free docetaxel injection, was used, because it provided a suitable solvent in which to dissolve docetaxel. And we set three different administration sequences for study: 1M/2T, treated with metformin 6 h before Tax; 1T/2M, treated with metformin 6 h after Tax; M/T, treated with metformin and Tax simultaneously.
It was found that the administration sequence of metformin had a significant effect on the function of docetaxel. Compared with the treatment of Tax alone, 1T/2M and M/T, 1M/2T presented the strongest inhibitory effect on tumor cell growth, especially at low docetaxel doses (Figure 1A,B). This suggested that the prior metformin treatment could enhance the sensitivity of tumor cells to chemotherapy.
Nano-particles’ platforms can effectively overcome the solubility problem of hydrophobic drugs and enhance their in vivo therapeutic efficacy. Since the docetaxel nanoemulsions (DOC nps) developed by our laboratory have been fully studied [41,42] and are under a phase I clinical trial (CXHL2200410), we repeated the above experiment with the use of DOC nps. Based on single-drug co-incubation experiments, we selected 10 µg/mL docetaxel for this study (Figure 1C). And it was also verified that 1 mg/mL metformin would not cause significant toxicity (Figure 1D). The results showed that the 1M/2D administration sequence could make DOC nps more toxic to MCF7 cells (Figure 1E). The same phenomenon could be observed on 4T1 cells (a murine breast cancer cell line) treated with 5 µg/mL docetaxel (Figure 1F,G). Moreover, due to the higher sensitivity of 4T1 cells to DOC nps, the enhancement of 1M/2D on chemotherapy was further amplified. At a lower dose of DOC nps, the proliferation of 4T1 cells was significantly inhibited.
The in vitro experiments indicated that metformin-induced sensitization to chemotherapy required a certain administration sequence. This chemosensitization could improve the efficacy and reduce the dose of docetaxel, which might avoid some side effects.

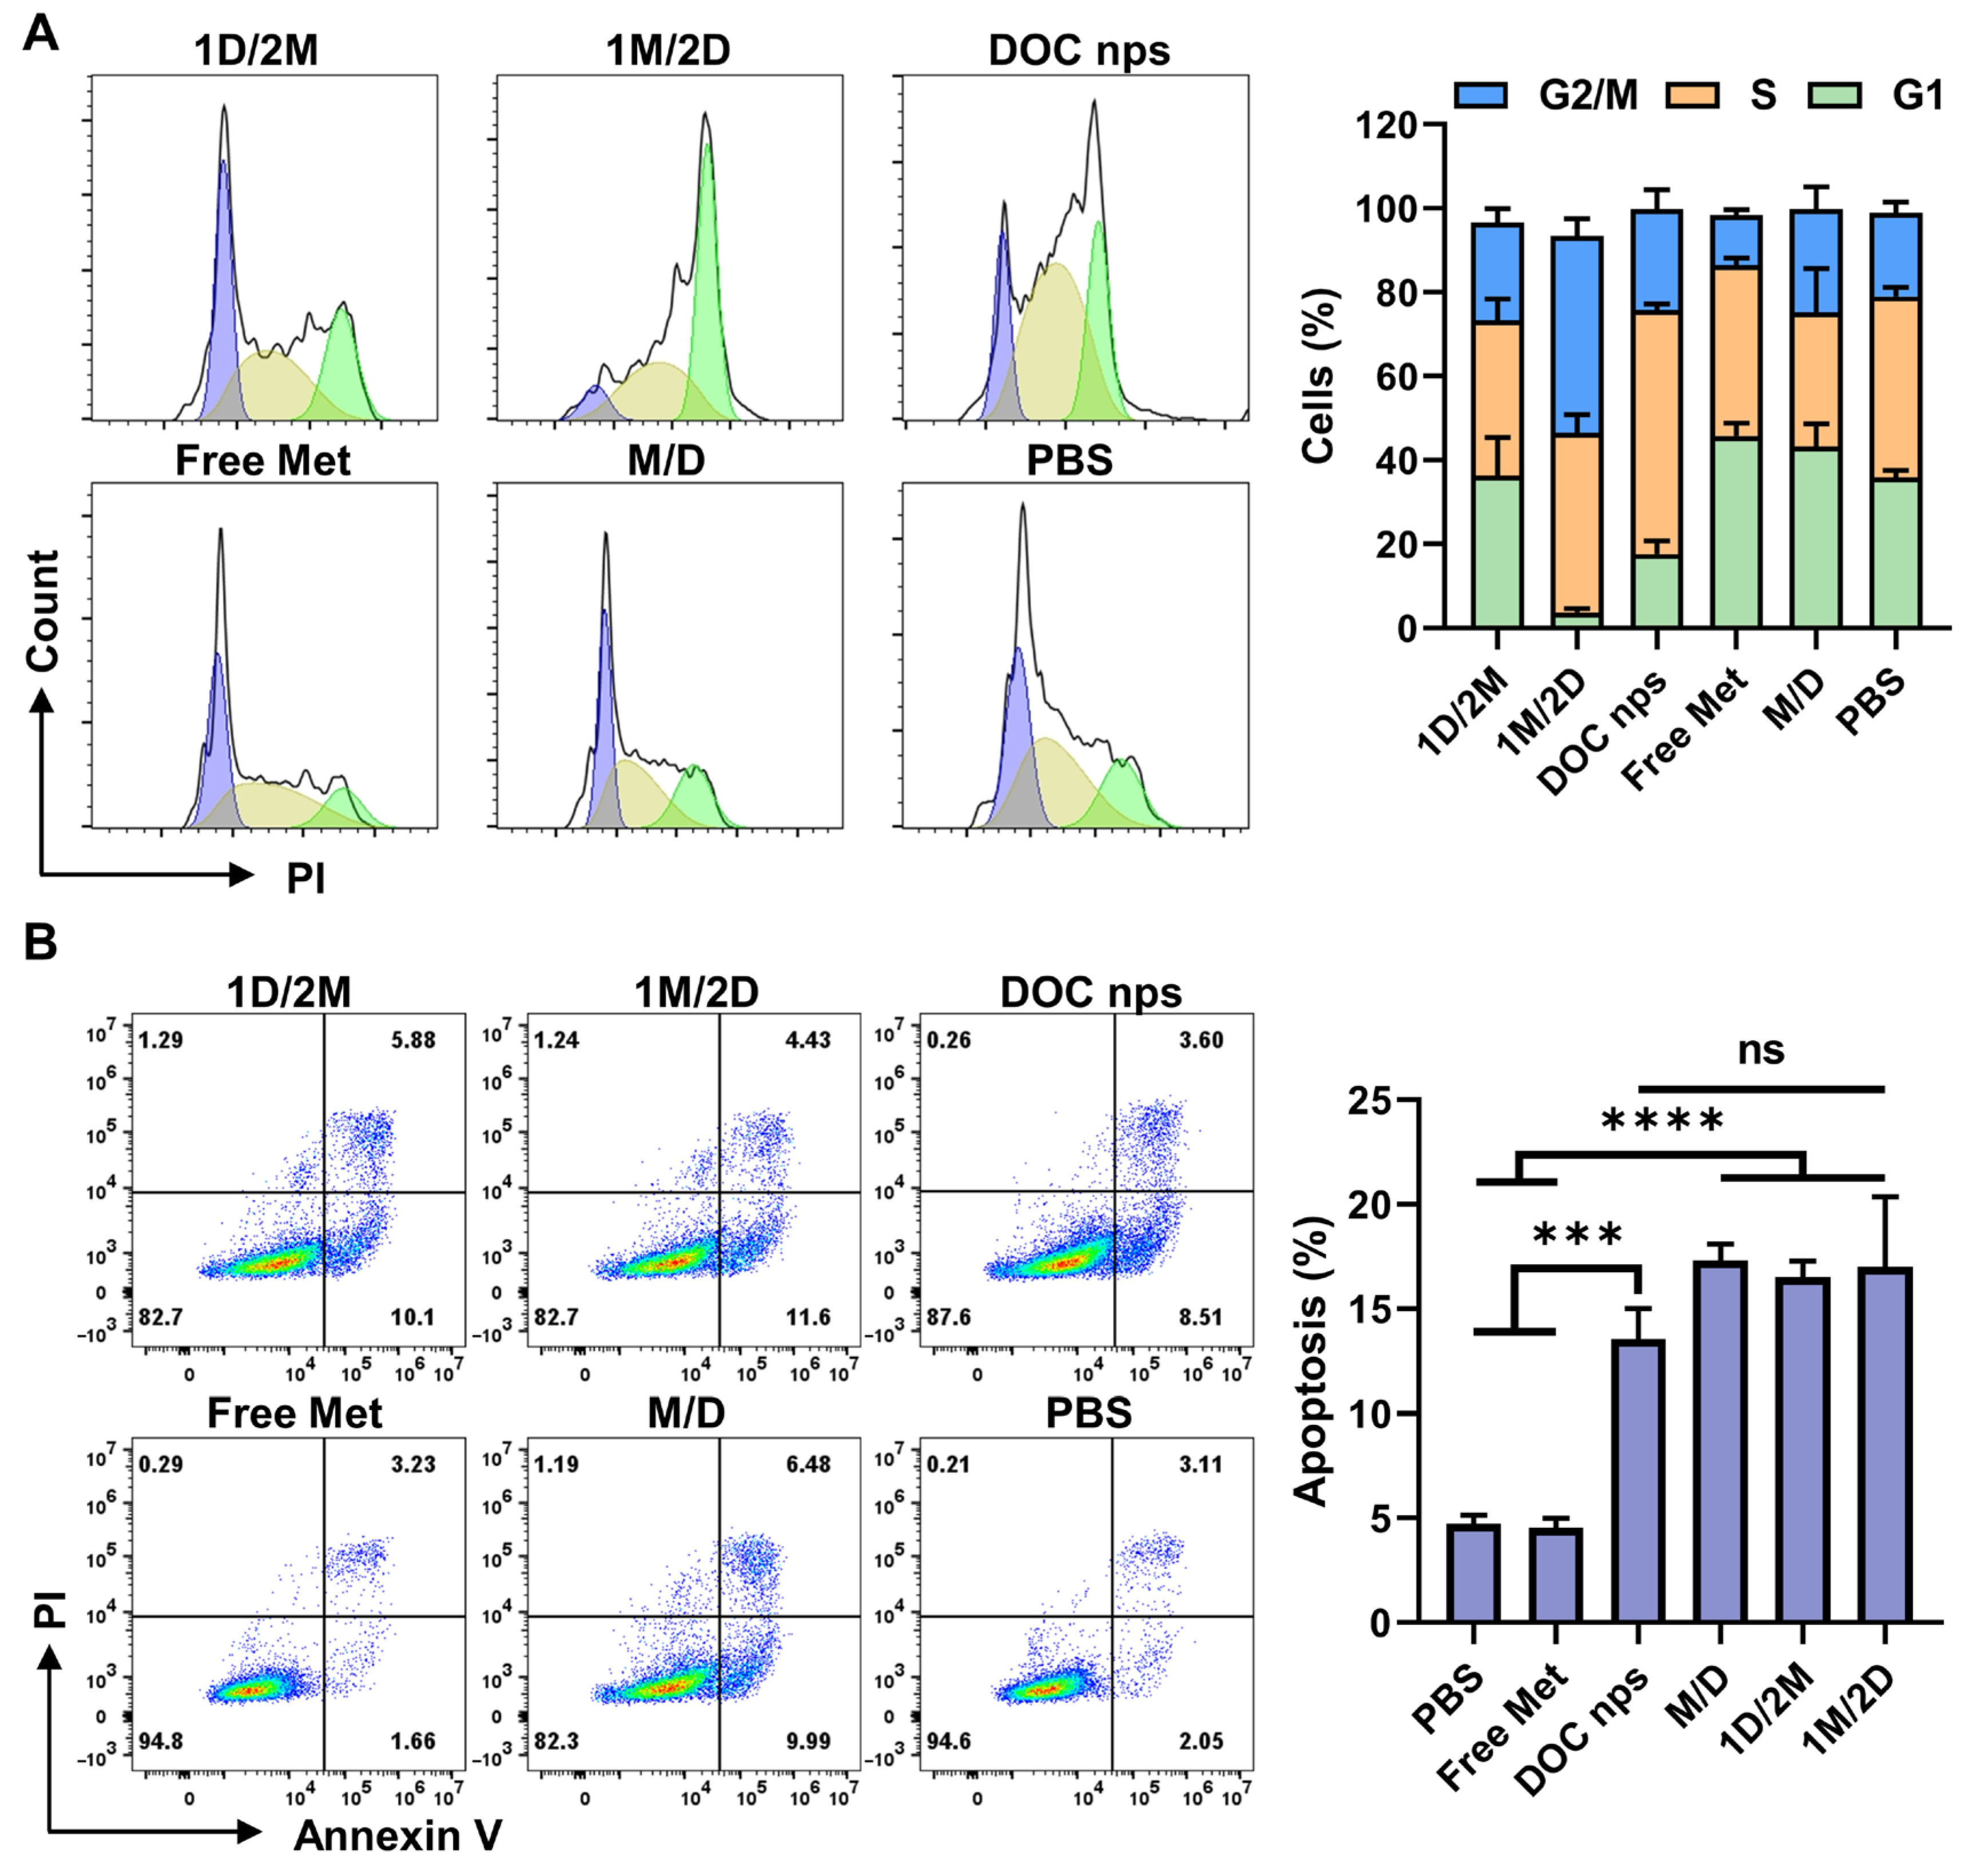
3.2. The 1M/2D Administration Sequence Enhanced the Effect of Docetaxel on Cell Cycle Arrest

The metabolic regulation induced by metformin may influence the transport function of cells. To eliminate the possibility that enhanced cytotoxicity was due to altered nanoemulsions uptake rather than true chemosensitization, we conducted further investigations into the uptake of nanoemulsions by 4T1 cells. The results demonstrated that the administration sequence of metformin did not affect the cellular uptake of nanoemulsions (Figure 2A,B), and the nanoemulsions were distributed in lysosomes (Figure 2C). Accordingly, we concluded that the enhanced inhibitory effect on tumor cell growth observed in the 1M/2D administration sequence was not attributable to variations in intracellular drug concentration.
Docetaxel is a taxane anti-tumor agent, which can bind to free tubulin and then promote the assembly of tubulin into stable microtubules to inhibit their disassembly, thereby suppressing cell mitosis. Through the flow cytometry analysis of cell cycle, the 1M/2D treatment led to a significant arrest of 4T1 cells in G2/M phase after 24 h of co-incubation with DOC nps (Figure 3A), which aligned with the pharmacological effects of docetaxel. Meanwhile, the combination of metformin did not enhance cell apoptosis (Figure 3B). Accordingly, we proposed that 1M/2D primarily achieved a pronounced inhibitory effect on tumor cells through synergy with docetaxel’s stabilization of microtubules, but not by inducing apoptosis directly.

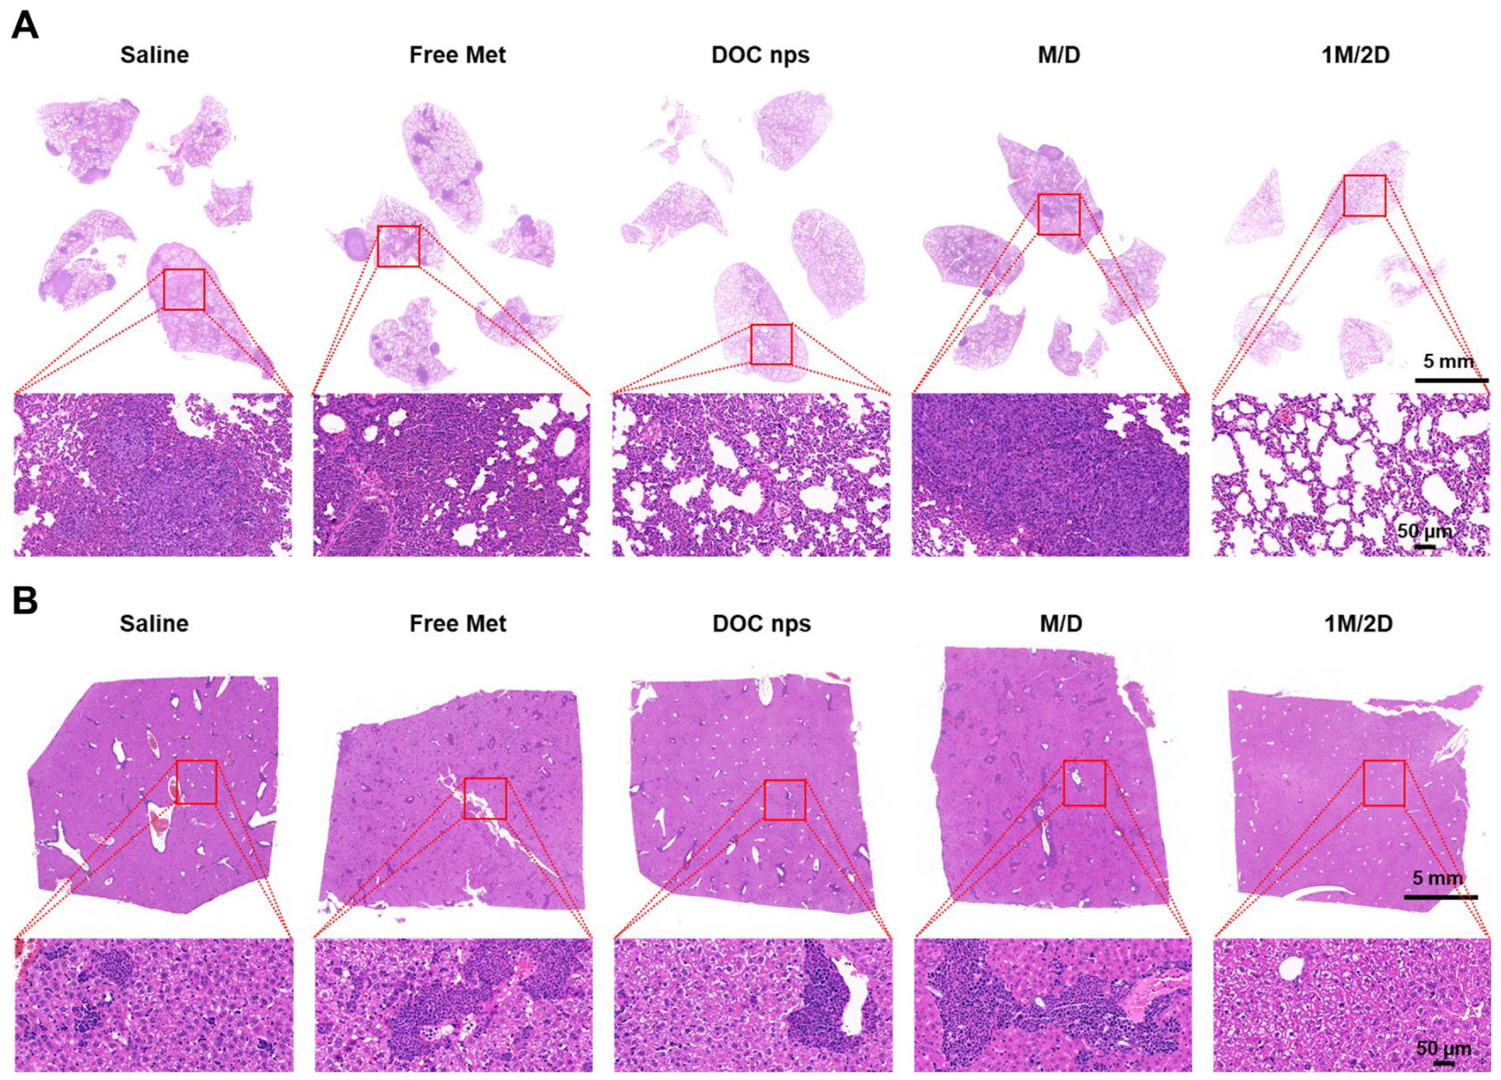
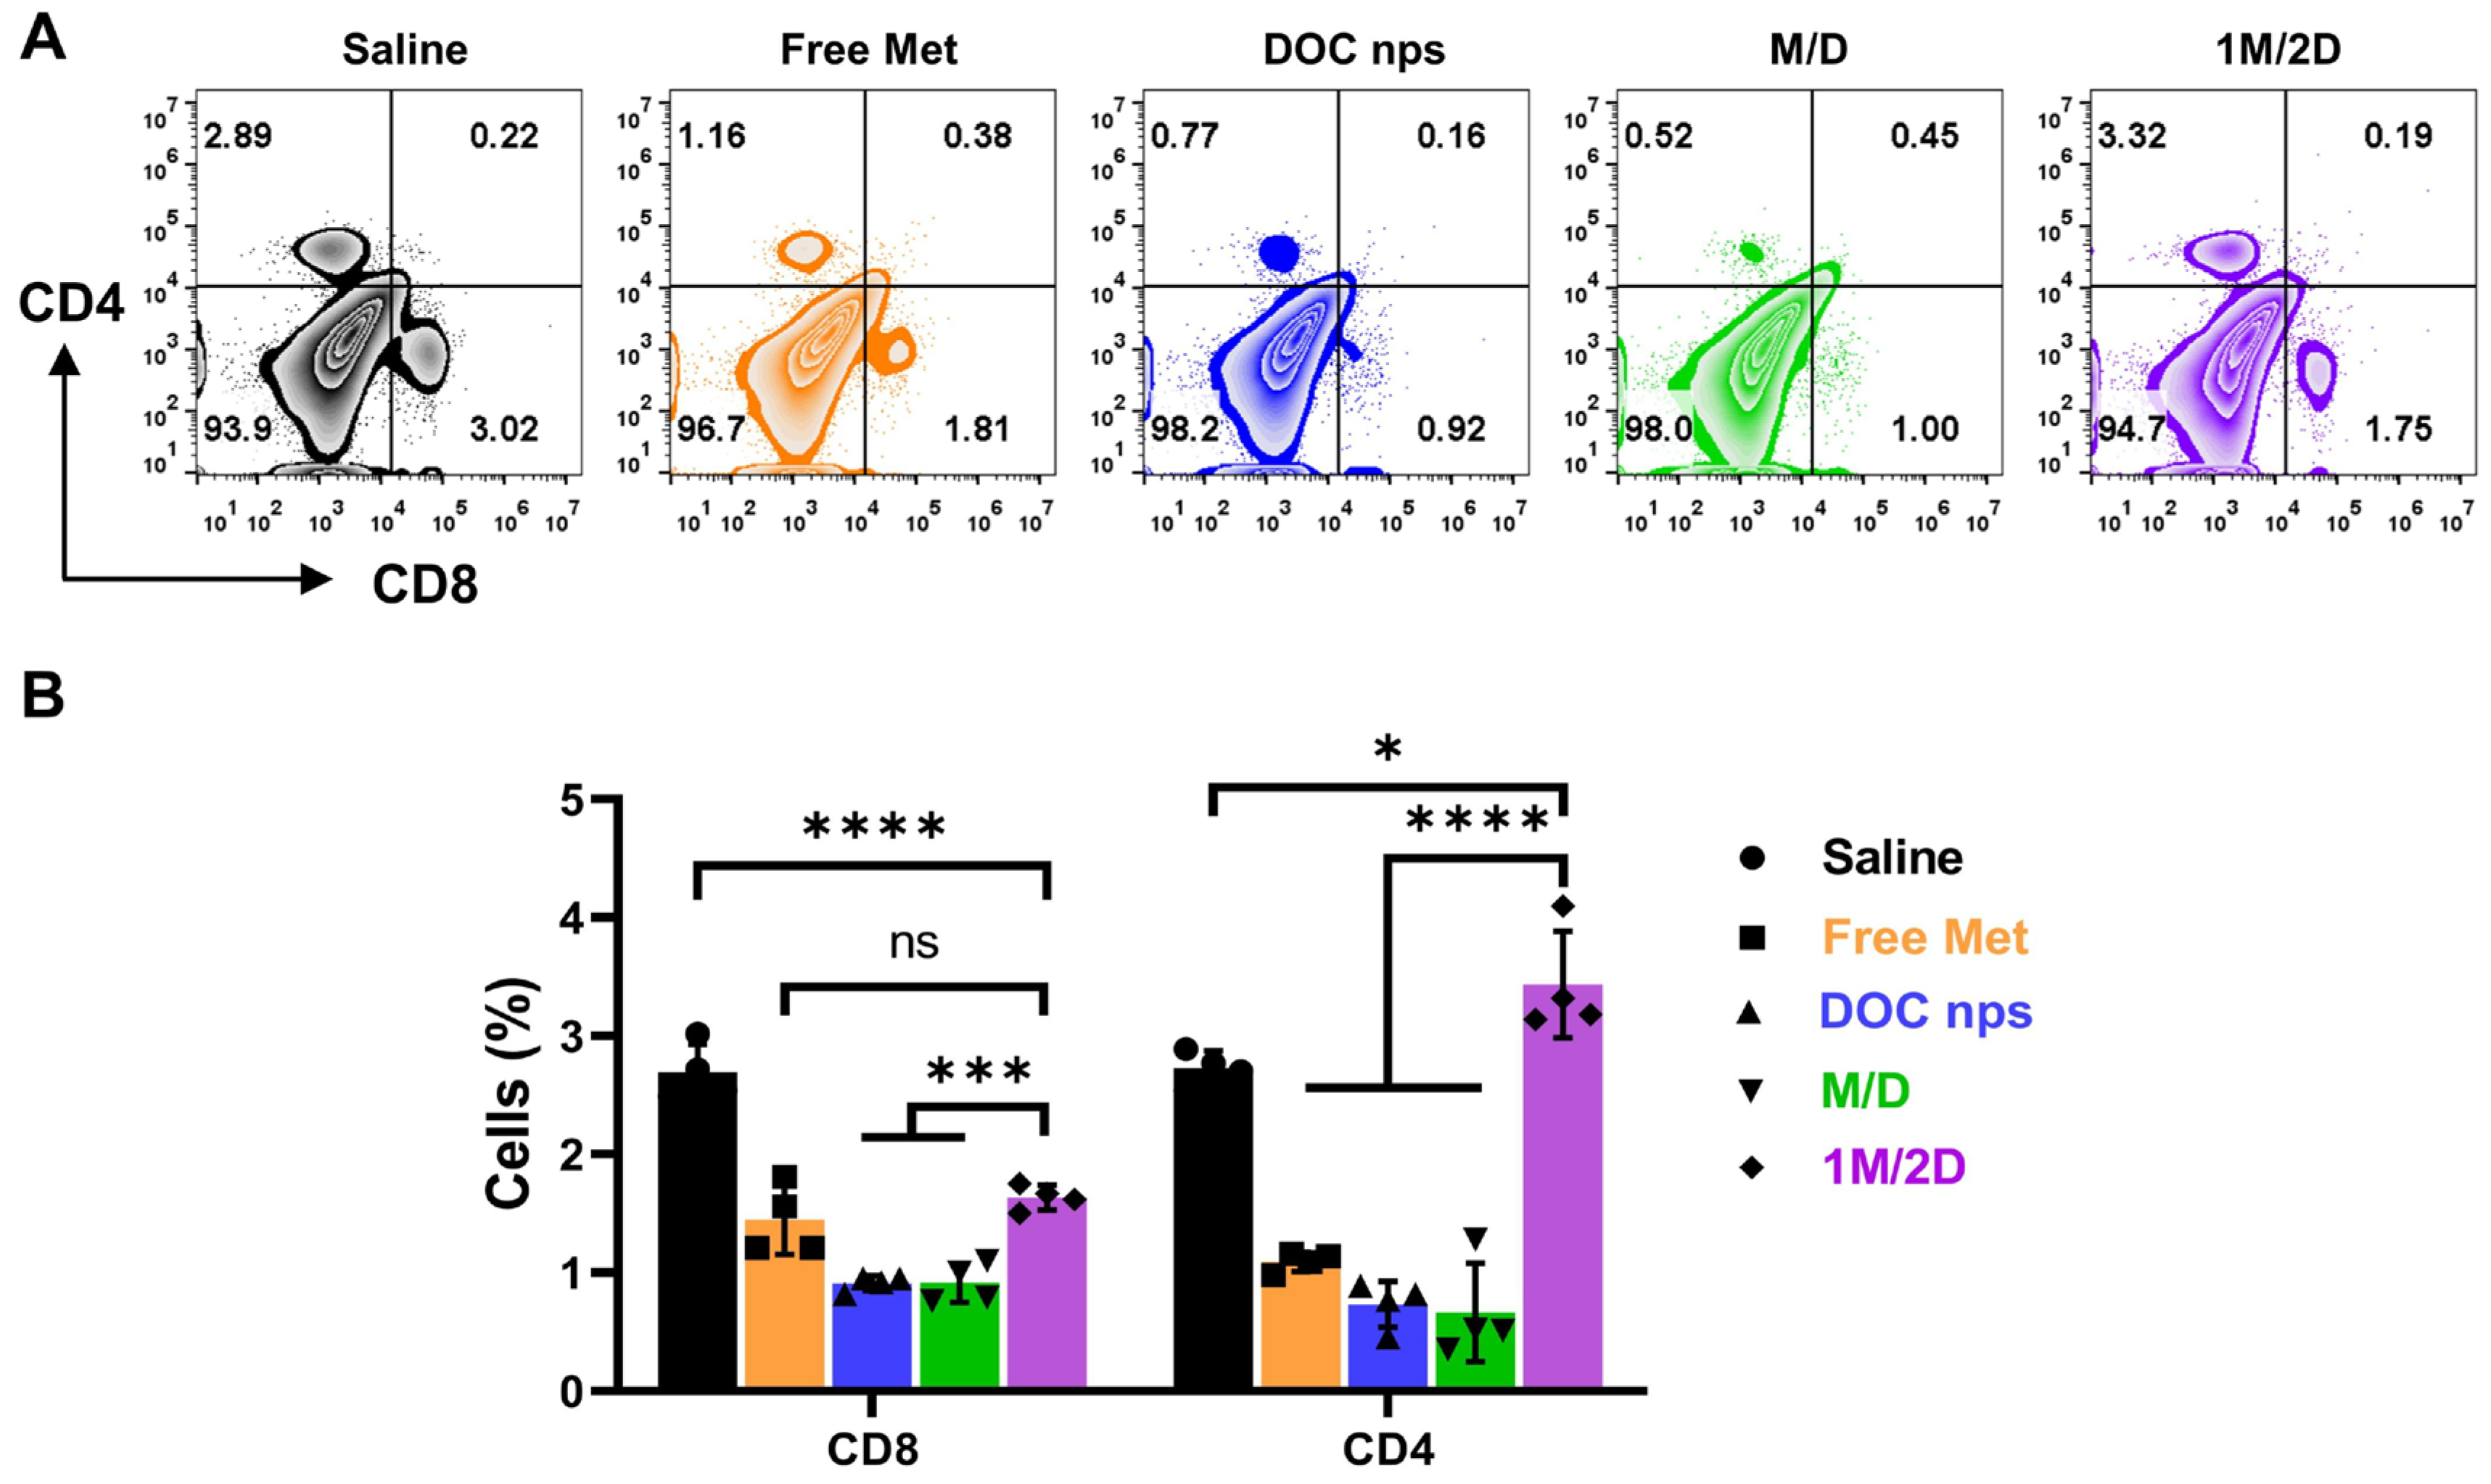
3.3. The In Vivo Therapeutic Effects of DOC nps with Different i.v. Administration Sequences of Metformin

The effect of metformin administration sequence on the efficacy of DOC nps was investigated in 4T1 mouse tumor models, in which metformin was administered intravenously (Figure 4A). The 1M/2D treatment could only slow tumor growth but did not inhibit tumor progression or prolong survival time (Figure 4B–E). After two cycles of treatment, the 1M/2D group showed significantly increased tumor growth, which indicated that the progress of tumor was out of control at this time.
However, the 1M/2D treatment could alleviate splenomegaly, which was a common phenomenon in the 4T1 tumor model (Figure 4F). The mice in all groups that received chemotherapy showed a downward trend in body weight at the later stage, which might be an indication of excessive doses of DOC nps or poor physical condition due to tumor growth (Figure 4G).

3.4. The In Vivo Therapeutic Effects of DOC nps with Different Intra-Tumoral Administration Sequences of Metformin

The results above suggested that the increased sensitivity to chemotherapy mediated by 1M/2D administration might require a certain amount of metformin accumulation in tumor tissues, which could not be achieved by intravenous administration. Therefore, we changed the form of metformin administration to intra-tumoral injection (Figure 5A). In addition, the dose of DOC nps was reduced to avoid toxicity to mice at the later stage.
During the four cycles of treatment, the 1M/2D group demonstrated a significant inhibitory effect on tumor growth (Figure 5B–D). Moreover, due to the reduced dose of DOC nps, the body weight of mice did not show a downward trend throughout the treatment process (Figure 5E). Similarly, the spleens of mice that received 1M/2D treatment did not exhibit obvious splenomegaly (Figure 5F), and there were no obvious tumor metastases in lungs and livers (Figure 6). On day 28 after the first treatment, we performed surgery on mice to remove tumors to simulate postoperative recurrence. During the 21 days after surgery, the recurrence in the 1M/2D treatment group was effectively suppressed (Figure 5G). Throughout the treatment and postoperative observation period, the mice in the 1M/2D group showed the longest survival (Figure 5H).
The markedly different spleen status and tumor recurrence suggested that the immune response to tumor was altered. Therefore, we examined the CD4+ and CD8+ T cell populations in tumor tissues by flow cytometry. The CD8+ T cell population in the 1M/2D group was slightly higher than that in the DOC nps and M/D groups and lower than that in the Saline group (Figure 7). However, its CD4+ T cell population was significantly higher than that of the other four groups.
This finding suggested that the 1M/2D treatment was able to influence the T cell population within the tumor microenvironment. To gain deeper insights into this effect, we conducted immunofluorescence staining on spleen and tumor samples. We focused on two key markers: IFN-γ and FoxP3. IFN-γ is an important indicator of anti-tumor immune responses, whose increase suggests enhanced activity of effector T cells. And FoxP3 is expressed by regulatory T cells (Tregs), which can contribute to an immunosuppressive microenvironment. Compared to other groups, the spleens and tumors of the 1M/2D group showed an extremely low level of FoxP3 while displaying an increased IFN-γ level (Figure 8). The balance between pro-inflammatory and immunosuppressive factors within the tumor microenvironment is crucial for the outcome of cancer treatments. By modulating this balance, the 1M/2D treatment appears to create a more favorable environment for anti-tumor immune responses.
Considering the metabolic intervention of metformin would cause a comprehensive effect rather than a few cytokines, we collected tumor tissues for transcriptome analysis to investigate the changes in cell activities. The Gene Ontology analysis of the biological process (GO BP) demonstrated that the cell cycle of tumors with 1M/2D treatment was obviously disturbed since the associated gene expression was highly downregulated, such as chromosome segregation, nuclear division and cell cycle phase transition (Figure 9). The results of the GO BP also indicated that, compared to other administration sequences, 1M/2D could induce stronger immune responses in tumors, accompanied by the upregulation of cell communication and immunity-related genes, such as immune effector process, chemotaxis, activating signaling pathway and inflammatory response (Figure 10).
The synergistic effect of co-delivering metformin has been studied in many research studies [20,43]. This article reveals that the pretreatment of metformin 6 h before docetaxel nanoemulsions’ administration can significantly optimize its cell cycle arrest and tumor suppression efficacy. These findings underscore the critical importance of the administration sequence in metabolic-intervention-induced chemosensitization. It was reported that treatment with metformin for 48 h followed by withdrawal for 24 h could synchronize cells to enter the S phase, which enhances the damage caused by cisplatin administrated on testicular germ cell tumors after metformin withdrawal [44]. Notably, this sensitization principle extends beyond chemotherapy. For instance, 1 h pretreatment of arginine could effectively disrupt intracellular NAD+ homeostasis, compromising cellular DNA repair capacity and consequently enhancing radiosensitivity in brain metastases [45]. Our study may provide a reference for metformin-associated chemotherapy. However, the sequencing administration should be designed based on tumor types, the targets of metabolic intervention and the mechanisms of sensitized therapies.
Furthermore, the chemosensitization with intra-tumoral administration of metformin was stronger as compared to that of i.v. metformin. These results indicate that the metabolic intervention requires high drug levels within the tumor. These levels are not achieved by i.v. administration of the free drug because it does not have tumor-targeting ability and blood perfusion is usually poor in tumor tissue [46]. Although intra-tumoral administration can be applied for superficial tumors and some deeper tumors with the combination of imaging navigation and endoscopic techniques, its clinical application is still limited. Thus, targeted systems would be a better option for drug delivery to the tumor. Various tumor-targeted delivery systems of metformin, such as liposomes, drug conjugates and cell-derived microparticles, have already been reported [47,48,49,50]. Considering the dynamic nature of tumor metabolism and potential homeostatic recovery mechanisms, transient metabolic interventions may yield suboptimal outcomes [51,52]. This can be solved by the development of sustained-release formulations, which can maintain therapeutic metabolic modulation over the treatment duration.
Cellular metabolism constitutes the fundamental basis of biological functions. Recent advances in research on tumor carbon and nitrogen metabolic pathways have gained increasing interest in oncology [53,54]. The clinical availability of diverse drugs for metabolic modulation presents promising opportunities for developing metabolism-based synergetic therapies. As there is no urgent need for the development of new metabolic drugs, optimizing the administration sequence to further amplify its therapeutic effects seems to be a reasonable and practical way to improve the existing clinical treatment protocols. According to the in vivo experiments, the optimized administration sequence can strengthen tumor inhibition, lower chemotherapy doses and enhance immune responses. We speculate that this strategy might be able to reduce the toxicity of chemotherapy for patients, decrease the incidence of complications, and improve the life quality, especially for those undergoing long-term chemotherapy.
Some possible treatment-related issues should also be taken into consideration. The adverse events that are associated with both metformin and chemotherapy, such as gastrointestinal reaction, may be exacerbated due to combination therapy [55,56]. While metformin may enhance chemotherapy efficacy by enhancing anti-tumor immunity, it could simultaneously attenuate normal immune function by suppressing immune cell metabolism. Metformin clearance is dependent on renal excretion. The nephrotoxicity induced by chemotherapy may facilitate drug accumulation, establishing a vicious cycle of renal damage and lactic acidosis [57]. The heterogeneity and high mutability of tumors may weaken the effects of sequencing strategy. The metabolic-related complications and the emergence of metformin resistance can bring some unexpected risks. Accordingly, further in-depth studies are needed.
Our proposed sequencing strategy may provide valuable insights for addressing current challenges in conventional chemotherapy regimens, particularly in overcoming drug resistance and minimizing systemic toxicity.

4. Conclusions

This study systematically investigated the therapeutic potential of administration sequence of metformin and DOC nps. The in vitro evaluations indicated that the 1M/2D treatment could significantly enhance the inhibition on tumor proliferation. This chemosensitization effect was induced by magnifying the cell cycle arrest of docetaxel, which was not related to cellular uptake or cell apoptosis. With reduced docetaxel dosage and intra-tumoral administration of metformin, the 1M/2D treatment presented remarkable therapeutic effects in 4T1 tumor-bearing mice, leading to limited tumor progression, prolonged survival, and enhanced metastasis inhibition. The investigations of immunity demonstrated that the 1M/2D treatment could strengthen anti-tumor immune responses, which decreased postoperative recurrence rates. The obtained results also revealed the necessity to improve the tumor-targeted delivery of metformin. Therefore, we will focus on developing co-encapsulated platforms with controlled-release profiles to optimize spatiotemporal delivery in future research.

Author Contributions

J.Z.: conceptualization, investigation, data curation, visualization, methodology, writing—original draft and editing. J.M.: investigation, data curation, validation, visualization, methodology, writing—editing and review. Y.H.: formal analysis, methodology. X.H.: formal analysis, visualization. L.L. and J.Y.: supervision, conceptualization, project administration. All authors have read and agreed to the published version of the manuscript.

Funding

This work was funded by the National Natural Science Foundation of China (No. 82473852 Lihua Luo) and the postdoctoral fellowship program of CPSF (No. GZC20232329).

Institutional Review Board Statement

This study was conducted in accordance with the Declaration of Helsinki and approved by the Institutional Review Board of Zhejiang University (ZJU20230275, 25 July 2023).

Informed Consent Statement

Not applicable.

Data Availability Statement

The data are contained within this article.

Acknowledgments

Thanks for the technical support by the Core Facilities, Zhejiang University School of Medicine and Research and Service Center. We thank J.Pan and D.Wu of the Research and Service Center (College of Pharmaceutical Sciences, Zhejiang University) for technical assistance with laser scanning confocal microscope. The graphic abstract was created in BioRender (https://BioRender.com/0em9b73 (accessed on 18 June 2025)).

Conflicts of Interest

The authors declare no conflicts of interest.

References

  1. Swain, S.M. Chemotherapy: Updates and new perspectives. Oncologist 2011, 16 (Suppl. S1), 30–39. [Google Scholar] [CrossRef] [PubMed]
  2. Stoop, T.F.; Theijse, R.T.; Seelen, L.W.F.; Groot Koerkamp, B.; van Eijck, C.H.J.; Wolfgang, C.L.; van Tienhoven, G.; van Santvoort, H.C.; Molenaar, I.Q.; Wilmink, J.W.; et al. Preoperative chemotherapy, radiotherapy and surgical decision-making in patients with borderline resectable and locally advanced pancreatic cancer. Nat. Rev. Gastroenterol. Hepatol. 2024, 21, 101–124. [Google Scholar] [CrossRef] [PubMed]
  3. Pirker, R. Chemotherapy remains a cornerstone in the treatment of nonsmall cell lung cancer. Curr. Opin. Oncol. 2020, 32, 63–67. [Google Scholar] [CrossRef] [PubMed]
  4. Miller, K.D.; Nogueira, L.; Devasia, T.; Mariotto, A.B.; Yabroff, K.R.; Jemal, A.; Kramer, J.; Siegel, R.L. Cancer treatment and survivorship statistics, 2022. CA Cancer J. Clin. 2022, 72, 409–436. [Google Scholar] [CrossRef]
  5. Anand, U.; Dey, A.; Chandel, A.K.S.; Sanyal, R.; Mishra, A.; Pandey, D.K.; De Falco, V.; Upadhyay, A.; Kandimalla, R.; Chaudhary, A.; et al. Cancer chemotherapy and beyond: Current status, drug candidates, associated risks and progress in targeted therapeutics. Genes. Dis. 2023, 10, 1367–1401. [Google Scholar] [CrossRef]
  6. Tilsed, C.M.; Fisher, S.A.; Nowak, A.K.; Lake, R.A.; Lesterhuis, W.J. Cancer chemotherapy: Insights into cellular and tumor microenvironmental mechanisms of action. Front. Oncol. 2022, 12, 960317. [Google Scholar] [CrossRef]
  7. Tamargo, J.; Caballero, R.; Delpón, E. Cancer Chemotherapy and Cardiac Arrhythmias: A Review. Drug Saf. 2015, 38, 129–152. [Google Scholar] [CrossRef]
  8. Zhou, J.; Giannakakou, P. Targeting microtubules for cancer chemotherapy. Curr. Med. Chem. Anticancer. Agents 2005, 5, 65–71. [Google Scholar] [CrossRef]
  9. Han, Y.; Smith, M.T. Pathobiology of cancer chemotherapy-induced peripheral neuropathy (CIPN). Front. Pharmacol. 2013, 4, 156. [Google Scholar] [CrossRef]
  10. Wang, M.; Chen, X.; Tan, P.; Wang, Y.; Pan, X.; Lin, T.; Jiang, Y.; Wang, B.; Xu, H.; Wang, Y.; et al. Acquired semi-squamatization during chemotherapy suggests differentiation as a therapeutic strategy for bladder cancer. Cancer Cell 2022, 40, 1044–1059 e8. [Google Scholar] [CrossRef]
  11. Bokil, A.; Sancho, P. Mitochondrial determinants of chemoresistance. Cancer Drug Resist. 2019, 2, 634–646. [Google Scholar] [CrossRef] [PubMed]
  12. Park, S.J.; Yoo, H.C.; Ahn, E.; Luo, E.; Kim, Y.; Sung, Y.; Yu, Y.C.; Kim, K.; Min, D.S.; Lee, H.S.; et al. Enhanced Glutaminolysis Drives Hypoxia-Induced Chemoresistance in Pancreatic Cancer. Cancer Res. 2023, 83, 735–752. [Google Scholar] [CrossRef] [PubMed]
  13. Yeldag, G.; Rice, A.; Del Rio Hernandez, A. Chemoresistance and the Self-Maintaining Tumor Microenvironment. Cancers 2018, 10, 471. [Google Scholar] [CrossRef] [PubMed]
  14. Guo, X.J.; Zhao, F.X.; Ma, X.F.; Shen, G.S.; Ren, D.F.; Zheng, F.C.; Du, F.; Wang, Z.Y.; Ahmad, R.; Yuan, X.Y.; et al. A comparison between triplet and doublet chemotherapy in improving the survival of patients with advanced gastric cancer: A systematic review and meta-analysis. BMC Cancer 2019, 19, 1125. [Google Scholar] [CrossRef]
  15. Tam, C.; Rao, S.; Waye, M.M.Y.; Ng, T.B.; Wang, C.C. Autophagy signals orchestrate chemoresistance of gynecological cancers. Biochim. Biophys. Acta Rev. Cancer 2021, 1875, 188525. [Google Scholar] [CrossRef]
  16. Martins-Neves, S.R.; Sampaio-Ribeiro, G.; Gomes, C.M.F. Chemoresistance-Related Stem Cell Signaling in Osteosarcoma and Its Plausible Contribution to Poor Therapeutic Response: A Discussion That Still Matters. Int. J. Mol. Sci. 2022, 23, 11416. [Google Scholar] [CrossRef]
  17. Bukowski, K.; Kciuk, M.; Kontek, R. Mechanisms of Multidrug Resistance in Cancer Chemotherapy. Int. J. Mol. Sci. 2020, 21, 3233. [Google Scholar] [CrossRef]
  18. Panaampon, J.; Zhou, Y.B.; Saengboonmee, C. Metformin as a booster of cancer immunotherapy. Int. Immunopharmacol. 2023, 121, 110528. [Google Scholar] [CrossRef]
  19. Georgopoulos, N.S.; Tolia, M.; Mauri, D.; Kamposioras, K.; Charalampakis, N.; Tsoukalas, N.; Gkantaifi, A. Metformin: A Promising Radiosensitizer in Neoadjuvant Rectal Cancer Treatment. Rev. Recent. Clin. Tria 2023, 18, 172–180. [Google Scholar] [CrossRef]
  20. Mu, W.; Jiang, Y.Y.; Liang, G.Q.; Feng, Y.; Qu, F.L. Metformin: A Promising Antidiabetic Medication for Cancer Treatment. Curr. Drug Targets 2023, 24, 41–54. [Google Scholar] [CrossRef]
  21. Galal, M.A.; Al-Rimawi, M.; Hajeer, A.; Dahman, H.; Alouch, S.; Aljada, A. Metformin: A Dual-Role Player in Cancer Treatment and Prevention. Int. J. Mol. Sci. 2024, 25, 4083. [Google Scholar] [CrossRef] [PubMed]
  22. Wong, C.S.; Chu, W.; Ashamalla, S.; Fenech, D.; Berry, S.; Kiss, A.; Koritzinsky, M. Metformin with neoadjuvant chemoradiation to improve pathologic response in rectal cancer: A pilot phase I/II trial. Clin. Transl. Radiat. Oncol. 2021, 30, 60–64. [Google Scholar] [CrossRef] [PubMed]
  23. Tseng, S.C.; Huang, Y.C.; Chen, H.J.; Chiu, H.C.; Huang, Y.J.; Wo, T.Y.; Weng, S.H.; Lin, Y.W. Metformin-mediated downregulation of p38 mitogen-activated protein kinase-dependent excision repair cross-complementing 1 decreases DNA repair capacity and sensitizes human lung cancer cells to paclitaxel. Biochem. Pharmacol. 2013, 85, 583–594. [Google Scholar] [CrossRef]
  24. Abo-Elmatty, D.M.; Ahmed, E.A.; Tawfik, M.K.; Helmy, S.A. Metformin enhancing the antitumor efficacy of carboplatin against Ehrlich solid carcinoma grown in diabetic mice: Effect on IGF-1 and tumoral expression of IGF-1 receptors. Int. Immunopharmacol. 2017, 44, 72–86. [Google Scholar] [CrossRef] [PubMed]
  25. Wang, Y.; Xu, W.B.; Yan, Z.X.; Zhao, W.L.; Mi, J.Q.; Li, J.M.; Yan, H. Metformin induces autophagy and G0/G1 phase cell cycle arrest in myeloma by targeting the AMPK/mTORC1 and mTORC2 pathways. J. Exp. Clin. Canc Res. 2018, 37, 63. [Google Scholar] [CrossRef]
  26. Ko, E.; Baek, S.; Kim, J.; Park, D.; Lee, Y. Antitumor Activity of Combination Therapy with Metformin and Trametinib in Non-Small Cell Lung Cancer Cells. Dev. Reprod. 2020, 24, 113–123. [Google Scholar] [CrossRef]
  27. Wang, C.; Sun, Y.; Cong, S.; Zhang, F. Insulin-Like Growth Factor-1 Promotes Human Uterine Leiomyoma Cell Proliferation via PI3K/AKT/mTOR Pathway. Cells Tissues Organs 2023, 212, 194–202. [Google Scholar] [CrossRef]
  28. Yang, S.P.; Su, Q.; Zhang, Y.R.; Sun, Y.; Chai, Y.R. Metformin ameliorates thymus degeneration of mice by regulating mitochondrial function. Int. Immunopharmacol. 2022, 108, 108744. [Google Scholar] [CrossRef]
  29. Zaidi, S.; Gandhi, J.; Joshi, G.; Smith, N.L.; Khan, S.A. The anticancer potential of metformin on prostate cancer. Prostate Cancer Prostatic Dis. 2019, 22, 351–361. [Google Scholar] [CrossRef]
  30. Peng, T.; Shao, X.; Song, W.; Xu, W.; Xiong, W.; He, Y.; Ding, Y.; Huang, Y. Intratumoral lactic acid neutralization strategy for boosting chemoimmunotherapy using liposomal sodium bicarbonate. Sci. Bull. 2024, 69, 3936–3948. [Google Scholar] [CrossRef]
  31. Kolosenko, I.; Avnet, S.; Baldini, N.; Viklund, J.; De Milito, A. Therapeutic implications of tumor interstitial acidification. Semin. Cancer Biol. 2017, 43, 119–133. [Google Scholar] [CrossRef] [PubMed]
  32. Sharma, D.; Singh, M.; Rani, R. Role of LDH in tumor glycolysis: Regulation of LDHA by small molecules for cancer therapeutics. Semin. Cancer Biol. 2022, 87, 184–195. [Google Scholar] [CrossRef] [PubMed]
  33. Wu, S.; Zhang, H.; Chen, N.; Zhang, C.; Guo, X. Metformin protects cardiomyocytes against oxygen-glucose deprivation injury by promoting autophagic flux through AMPK pathway. J. Drug Target. 2021, 29, 551–561. [Google Scholar] [CrossRef]
  34. Wu, Z.; Bai, Y.; Qi, Y.; Chang, C.; Jiao, Y.; Bai, Y.; Guo, Z. Metformin ameliorates ferroptosis in cardiac ischemia and reperfusion by reducing NOX4 expression via promoting AMPKalpha. Pharm. Biol. 2023, 61, 886–896. [Google Scholar] [CrossRef]
  35. Sebestyén, A.; Dankó, T.; Sztankovics, D.; Moldvai, D.; Raffay, R.; Cervi, C.; Krencz, I.; Zsiros, V.; Jeney, A.; Petovari, G. The role of metabolic ecosystem in cancer progression—Metabolic plasticity and mTOR hyperactivity in tumor tissues. Cancer Metast Rev. 2021, 40, 989–1033. [Google Scholar] [CrossRef]
  36. Schiliro, C.; Firestein, B.L. Mechanisms of Metabolic Reprogramming in Cancer Cells Supporting Enhanced Growth and Proliferation. Cells 2021, 10, 1056. [Google Scholar] [CrossRef]
  37. Elia, I.; Haigis, M.C. Metabolites and the tumour microenvironment: From cellular mechanisms to systemic metabolism. Nat. Metab. 2021, 3, 21–32. [Google Scholar] [CrossRef]
  38. Turpin, R.; Liu, R.X.; Munne, P.M.; Peura, A.; Rannikko, J.H.; Philips, G.; Boeckx, B.; Salmelin, N.; Hurskainen, E.; Suleymanova, I.; et al. Respiratory complex I regulates dendritic cell maturation in explant model of human tumor immune microenvironment. J. Immunother. Cancer 2024, 12, e008053. [Google Scholar] [CrossRef]
  39. Luo, L.H.; Li, X.; Zhang, J.L.; Zhu, C.Q.; Jiang, M.S.; Luo, Z.Y.; Qin, B.; Wang, Y.Q.; Chen, B.; Du, Y.Z.; et al. Enhanced immune memory through a constant photothermal-metabolism regulation for cancer prevention and treatment. Biomaterials 2021, 270, 120678. [Google Scholar] [CrossRef]
  40. Luo, L.H.; Qin, B.; Jiang, M.S.; Xie, L.; Luo, Z.Y.; Guo, X.M.; Zhang, J.L.; Li, X.; Zhu, C.Q.; Du, Y.Z.; et al. Regulating immune memory and reversing tumor thermotolerance through a step-by-step starving-photothermal therapy. J. Nanobiotechnol. 2021, 19, 297. [Google Scholar] [CrossRef]
  41. Zhu, C.Q.; Luo, L.H.; Jiang, X.D.; Jiang, M.S.; Luo, Z.Y.; Li, X.; Qiu, W.G.; Jin, Z.L.; Shen, T.X.; Li, C.L.; et al. Selective Intratumoral Drug Release and Simultaneous Inhibition of Oxidative Stress by a Highly Reductive Nanosystem and Its Application as an Anti-tumor Agent. Theranostics 2020, 10, 1166–1180. [Google Scholar] [CrossRef] [PubMed]
  42. Zhu, C.Q.; Shi, Y.Y.; Li, Q.P.; Luo, L.H.; Li, X.; Luo, Z.Y.; Lu, Y.C.; Zhang, J.L.; Jiang, M.S.; Qin, B.; et al. Rational administration sequencing of immunochemotherapy elicits powerful anti-tumor effect. J. Control Release 2022, 341, 769–781. [Google Scholar] [CrossRef] [PubMed]
  43. Tossetta, G. Metformin Improves Ovarian Cancer Sensitivity to Paclitaxel and Platinum-Based Drugs: A Review of In Vitro Findings. Int. J. Mol. Sci. 2022, 23, 12893. [Google Scholar] [CrossRef] [PubMed]
  44. He, K.C.; Li, Z.T.Y.; Ye, K.; Zhou, Y.H.; Yan, M.B.; Qi, H.; Hu, H.T.; Dai, Y.B.; Tang, Y.X. Novel sequential therapy with metformin enhances the effects of cisplatin in testicular germ cell tumours via YAP1 signalling. Cancer Cell Int. 2022, 22, 113. [Google Scholar] [CrossRef]
  45. Marullo, R.; Castro, M.; Yomtoubian, S.; Calvo-Vidal, M.N.; Revuelta, M.V.; Krumsiek, J.; Cho, A.; Morgado, P.C.; Yang, S.; Medina, V.; et al. The metabolic adaptation evoked by arginine enhances the effect of radiation in brain metastases. Sci. Adv. 2021, 7, eabg1964. [Google Scholar] [CrossRef]
  46. Goel, S.; Duda, D.G.; Xu, L.; Munn, L.L.; Boucher, Y.; Fukumura, D.; Jain, R.K. Normalization of the Vasculature for Treatment of Cancer and Other Diseases. Physiol. Rev. 2011, 91, 1071–1121. [Google Scholar] [CrossRef]
  47. Gong, C.A.; Yu, X.Y.; Zhang, W.; Han, L.; Wang, R.; Wang, Y.J.; Gao, S.; Yuan, Y.F. Regulating the immunosuppressive tumor microenvironment to enhance breast cancer immunotherapy using pH-responsive hybrid membrane-coated nanoparticles. J. Nanobiotechnol. 2021, 19, 58. [Google Scholar] [CrossRef]
  48. Wei, Z.H.; Zhang, X.Q.; Yong, T.Y.; Bie, N.N.; Zhan, G.T.; Li, X.; Liang, Q.L.; Li, J.Y.; Yu, J.J.; Huang, G.; et al. Boosting anti-PD-1 therapy with metformin-loaded macrophage-derived microparticles. Nat. Commun. 2021, 12, 440. [Google Scholar] [CrossRef]
  49. Liu, B.; Liang, B.B.; Cao, W.D.; Su, X.X.; Cao, Q.; Mao, Z.W. Platinum-Metformin Conjugates Acting as Promising PD-L1 Inhibitors through the AMP-Activated Protein Kinase Mediated Lysosomal Degradation Pathway. Angew. Chem. Int. Ed. 2024, 136, e202410586. [Google Scholar] [CrossRef]
  50. Xiong, W.; Qi, L.; Jiang, N.; Zhao, Q.; Chen, L.X.; Jiang, X.; Li, Y.; Zhou, Z.G.; Shen, J.L. Metformin Liposome-Mediated PD-L1 Downregulation for Amplifying the Photodynamic Immunotherapy Efficacy. ACS Appl. Mater. Inter. 2021, 13, 8026–8041. [Google Scholar] [CrossRef]
  51. Canale, F.P.; Basso, C.; Antonini, G.; Perotti, M.; Li, N.; Sokolovska, A.; Neumann, J.; James, M.J.; Geiger, S.; Jin, W.J.; et al. Metabolic modulation of tumours with engineered bacteria for immunotherapy. Nature 2021, 598, 662–666. [Google Scholar] [CrossRef] [PubMed]
  52. Zhang, J.; Wang, S.; Guo, X.; Lu, Y.; Liu, X.; Jiang, M.; Li, X.; Qin, B.; Luo, Z.; Liu, H.; et al. Arginine Supplementation Targeting Tumor-Killing Immune Cells Reconstructs the Tumor Microenvironment and Enhances the Antitumor Immune Response. ACS Nano 2022, 16, 12964–12978. [Google Scholar] [CrossRef] [PubMed]
  53. Halma, M.T.J.; Tuszynski, J.A.; Marik, P.E. Cancer Metabolism as a Therapeutic Target and Review of Interventions. Nutrients 2023, 15, 4245. [Google Scholar] [CrossRef] [PubMed]
  54. Martinez-Reyes, I.; Chandel, N.S. Cancer metabolism: Looking forward. Nat. Rev. Cancer 2021, 21, 669–680. [Google Scholar] [CrossRef]
  55. Akhter, M.S.; Uppal, P. Toxicity of Metformin and Hypoglycemic Therapies. Adv. Chronic Kidney D 2020, 27, 18–30. [Google Scholar] [CrossRef]
  56. Wang, G.S.; Hoyte, C. Review of Biguanide (Metformin) Toxicity. J. Intensive Care Med. 2019, 34, 863–876. [Google Scholar] [CrossRef]
  57. Graham, G.G.; Punt, J.; Arora, M.; Day, R.O.; Doogue, M.P.; Duong, J.K.; Furlong, T.J.; Greenfield, J.R.; Greenup, L.C.; Kirkpatrick, C.M.; et al. Clinical Pharmacokinetics of Metformin. Clin. Pharmacokinet. 2011, 50, 81–98. [Google Scholar] [CrossRef]
Figure 1. The cell viability of MCF7 cells 24 h (A) or 48 h (B) after the co-incubation of different concentrations of Tax with the different administration sequences of metformin, n = 3. (C) The cell viability of MCF7 cells treated with different concentrations of DOC nps at 48 h, n = 3. (D) The cell viability of MCF7 cells treated with different concentrations of metformin at 48 h, n = 4. (E) The cell viability of MCF7 cells 48 h after the co-incubation of 10 µg/mL docetaxel with the different administration sequences of 1 mg/mL metformin, n = 6. (F) The cell viability of 4T1 cells treated with different concentration of DOC nps at 48 h, n = 5. (G) The cell viability of 4T1 cells 48 h after the co-incubation of 10 µg/mL docetaxel with the different administration sequences of 1 mg/mL metformin, n = 6. Tax: treated with Taxotere® alone; 1M/2T: treated with metformin 6 h before Taxotere®; 1T/2M: treated with metformin 6 h after Taxotere®; M/T: treated with metformin and Taxotere® simultaneously; 1M/2D: treated with metformin 6 h before DOC nps; 1D/2M: treated with metformin 6 h after DOC nps; M/D: treated with metformin and DOC nps simultaneously. Quantitative data are expressed as the mean ± S.D., and one-way ANOVA method was used for statistical analysis. * p < 0.05, ** p < 0.01, *** p < 0.001, **** p < 0.0001, ns: no significance.
Pharmaceutics 17 00812 g001
Figure 2. (A) The representative fluorescence images of 4T1 cells co-incubating with DiD nps after 24 h. (B) Semi-quantitative results obtained by ImageJ (v1.52a) software, n = 3. (C) The representative fluorescence images of intracellular distribution. DiD nps: DiD-labeled nanoemulsions; 1M/2DiD: treated with metformin 6 h before DiD nps; 1DiD/2M: treated with metformin 6 h after DiD nps; M/DiD: treated with metformin and DiD nps simultaneously. Quantitative data are expressed as the mean ± S.D., and one-way ANOVA method was used for statistical analysis, ns: no significance.
Pharmaceutics 17 00812 g002
Figure 3. (A) The flow cytometry results of cell cycle calculated by FlowJo (v10.8.1) software and its statistical analysis, n = 4. (B) The flow cytometry results of cell apoptosis and the statistical analysis of total apoptosis (viable and non-viable apoptotic cells), n = 3. DOC nps: docetaxel nanoemulsions; Met: metformin; 1M/2D: treated with metformin 6 h before DOC nps; 1D/2M: treated with metformin 6 h after DOC nps; M/D: treated with metformin and DOC nps simultaneously. Quantitative data are expressed as the mean ± S.D., and one-way ANOVA method was used for statistical analysis. *** p < 0.001, **** p < 0.0001, ns: no significance.
Pharmaceutics 17 00812 g003
Figure 4. (A) Schematic diagram of therapeutic regimen. (B) Average tumor volume of each group, n = 5. (C) Pictures of tumors at day 28. (D) Tumor weight of each group, n = 5. (E) Survival rate of each group, n = 5. (F) Spleen weight of each group, n = 5. (G) Body weight of each group, n = 5. DOC nps: docetaxel nanoemulsions; Met: metformin; 1M/2D: treated with metformin 6 h before DOC nps; M/D: treated with metformin and DOC nps simultaneously. Quantitative data are expressed as the mean ± S.D., two-way ANOVA method was used for statistical analysis of (B), and one-way ANOVA method was used for statistical analysis of (D,F). * p < 0.05, ** p < 0.01, **** p < 0.0001.
Pharmaceutics 17 00812 g004
Figure 5. (A) Schematic diagram of therapeutic regimen. (B) Tumor volume of each group, n = 5. (C) Tumor weight of each group, n = 5. (D) Pictures of tumors at day 28. (E) Body weight of each group, n = 5. (F) Representative spleen pictures of each group. (G) Tumor recurrence after surgery in each group of mice, n = 5. (H) Survival rate of each group, n = 5. DOC nps: docetaxel nanoemulsions; Met: metformin; 1M/2D: treated with metformin 6 h before DOC nps; M/D: treated with metformin and DOC nps simultaneously. Quantitative data are expressed as the mean ± S.D., two-way ANOVA method was used for statistical analysis of (B), one-way ANOVA method was used for statistical analysis of (C), and Log-rank (Mantel-Cox) test was used for statistical analysis of (H). * p < 0.05, ** p < 0.01, *** p < 0.001, **** p < 0.0001.
Pharmaceutics 17 00812 g005
Figure 6. Representative H&E-stained images of lung (A) and liver (B) from each group of mice. DOC nps: docetaxel nanoemulsions; Met: metformin; 1M/2D: treated with metformin 6 h before DOC nps; M/D: treated with metformin and DOC nps simultaneously.
Pharmaceutics 17 00812 g006
Figure 7. Flow cytometry results (A) and statistical analysis (B) of tumor tissues from each group, n = 4. DOC nps: docetaxel nanoemulsions; Met: metformin; 1M/2D: treated with metformin 6 h before DOC nps; M/D: treated with metformin and DOC nps simultaneously. Quantitative data are expressed as the mean ± S.D, and one-way ANOVA method was used for statistical analysis. * p < 0.05, *** p < 0.001, **** p < 0.0001, ns: no significance.
Pharmaceutics 17 00812 g007
Figure 8. Representative images of IFN-γ (A) and FoxP3 (B) immunofluorescence staining of spleens and tumors of mice, left: panoramic scan, right: local magnification. DOC nps: docetaxel nanoemulsions; Met: metformin; 1M/2D: treated with metformin 6 h before DOC nps; M/D: treated with metformin and DOC nps simultaneously.
Pharmaceutics 17 00812 g008
Figure 9. The GO BP enrichment results of downregulated cell cycle-related gene expression between 1M/2D and other groups. DOC nps: docetaxel nanoemulsions; Met: metformin; 1M/2D: treated with metformin 6 h before DOC nps; M/D: treated with metformin and DOC nps simultaneously.
Pharmaceutics 17 00812 g009
Figure 10. The GO BP enrichment results of upregulated cell communication and immunity-related gene expression between 1M/2D and other groups. DOC nps: docetaxel nanoemulsions; Met: metformin; 1M/2D: treated with metformin 6 h before DOC nps; M/D: treated with metformin and DOC nps simultaneously.
Pharmaceutics 17 00812 g010
Disclaimer/Publisher’s Note: The statements, opinions and data contained in all publications are solely those of the individual author(s) and contributor(s) and not of MDPI and/or the editor(s). MDPI and/or the editor(s) disclaim responsibility for any injury to people or property resulting from any ideas, methods, instructions or products referred to in the content.

