Novel Polymorphic Patterns for Elacestrant Dihydrochloride


Abstract
1. Introduction
2. Materials and Methods
2.1. Materials
2.2. Instruments and Method
2.2.1. X-Ray Powder Diffraction (XRPD)
2.2.2. Single-Crystal X-Ray Diffraction (SCXRD)
2.2.3. Nuclear Magnetic Resonance (NMR)
2.2.4. Differential Scanning Calorimetry (DSC)
2.2.5. Thermo-Gravimetric Analysis (TGA)
2.2.6. Chemical Purity Determination by HPLC
2.2.7. Ion Chromatography (IC)
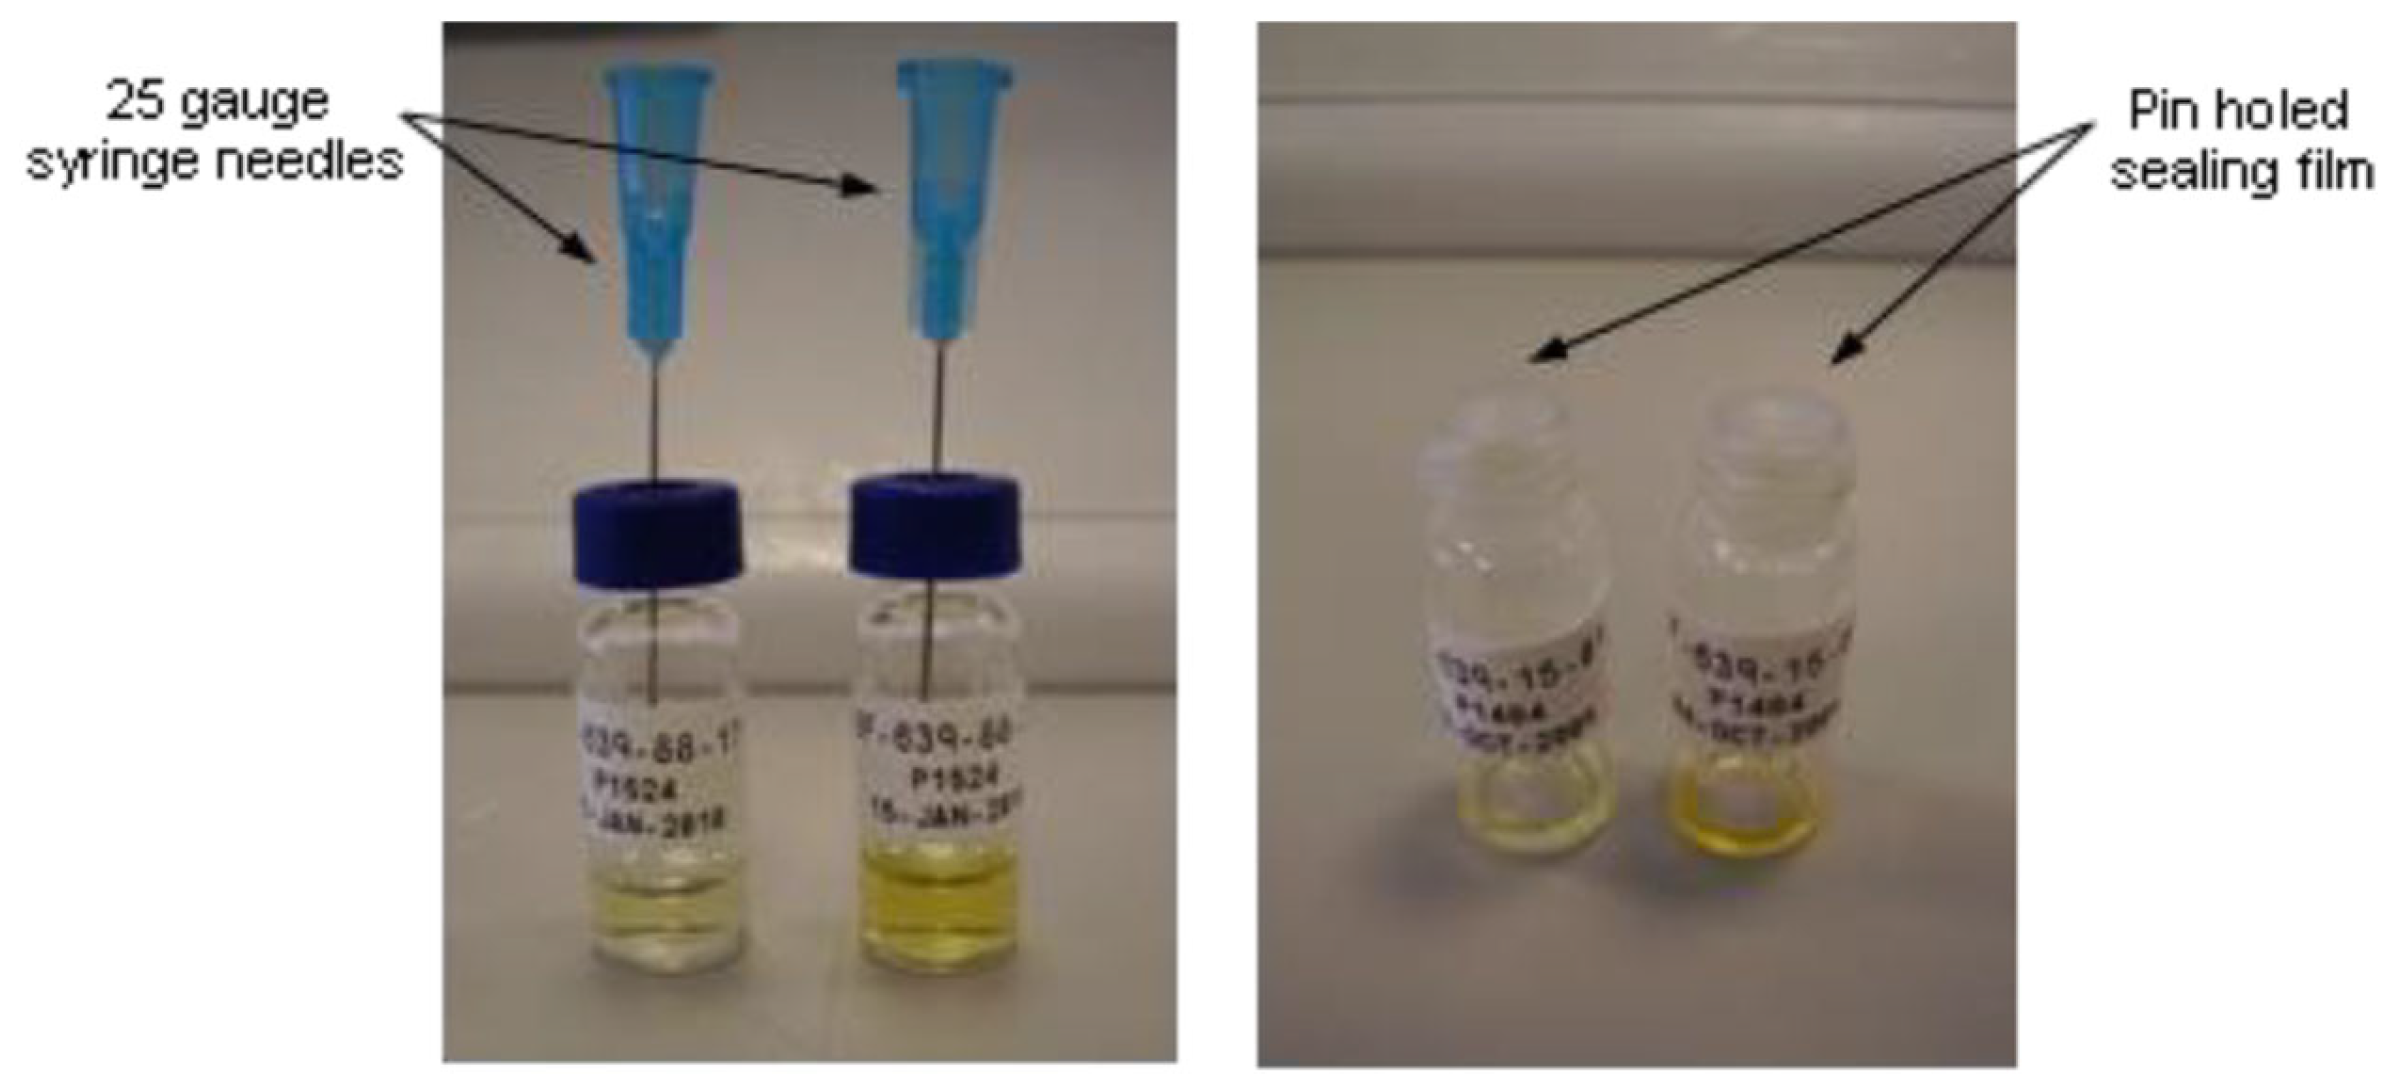
2.3. Sample Preparation for Single-Crystal X-Ray Diffraction (SCXRD)
2.4. Preparation of Amorphous Material
2.5. Crystallization Methodologies and Polymorph Screening
2.5.1. Solvent-Mediated Techniques
Maturation/Slurry Ripening
Procedure Using Maturation Chamber
Procedure Using Polar Bear Device
Cooling Crystallization
Controlled Evaporation
2.5.2. Solubility Assessment, Crystallization, and Polymorph Screening Procedure (Crystalline API)
2.5.3. Polymer Template Crystallizations (Crystalline API)
2.5.4. Solvent-Drop Grinding Experiments (Crystalline API)
2.5.5. Solubility Assessment and Polymorph Screening Procedure (Amorphous API)
2.5.6. Crystallization by Anti-Solvent Addition (Crystalline API)
3. Results and Discussion
3.1. Input/Starting API Characterization, Elacestrant (Form 2/3)
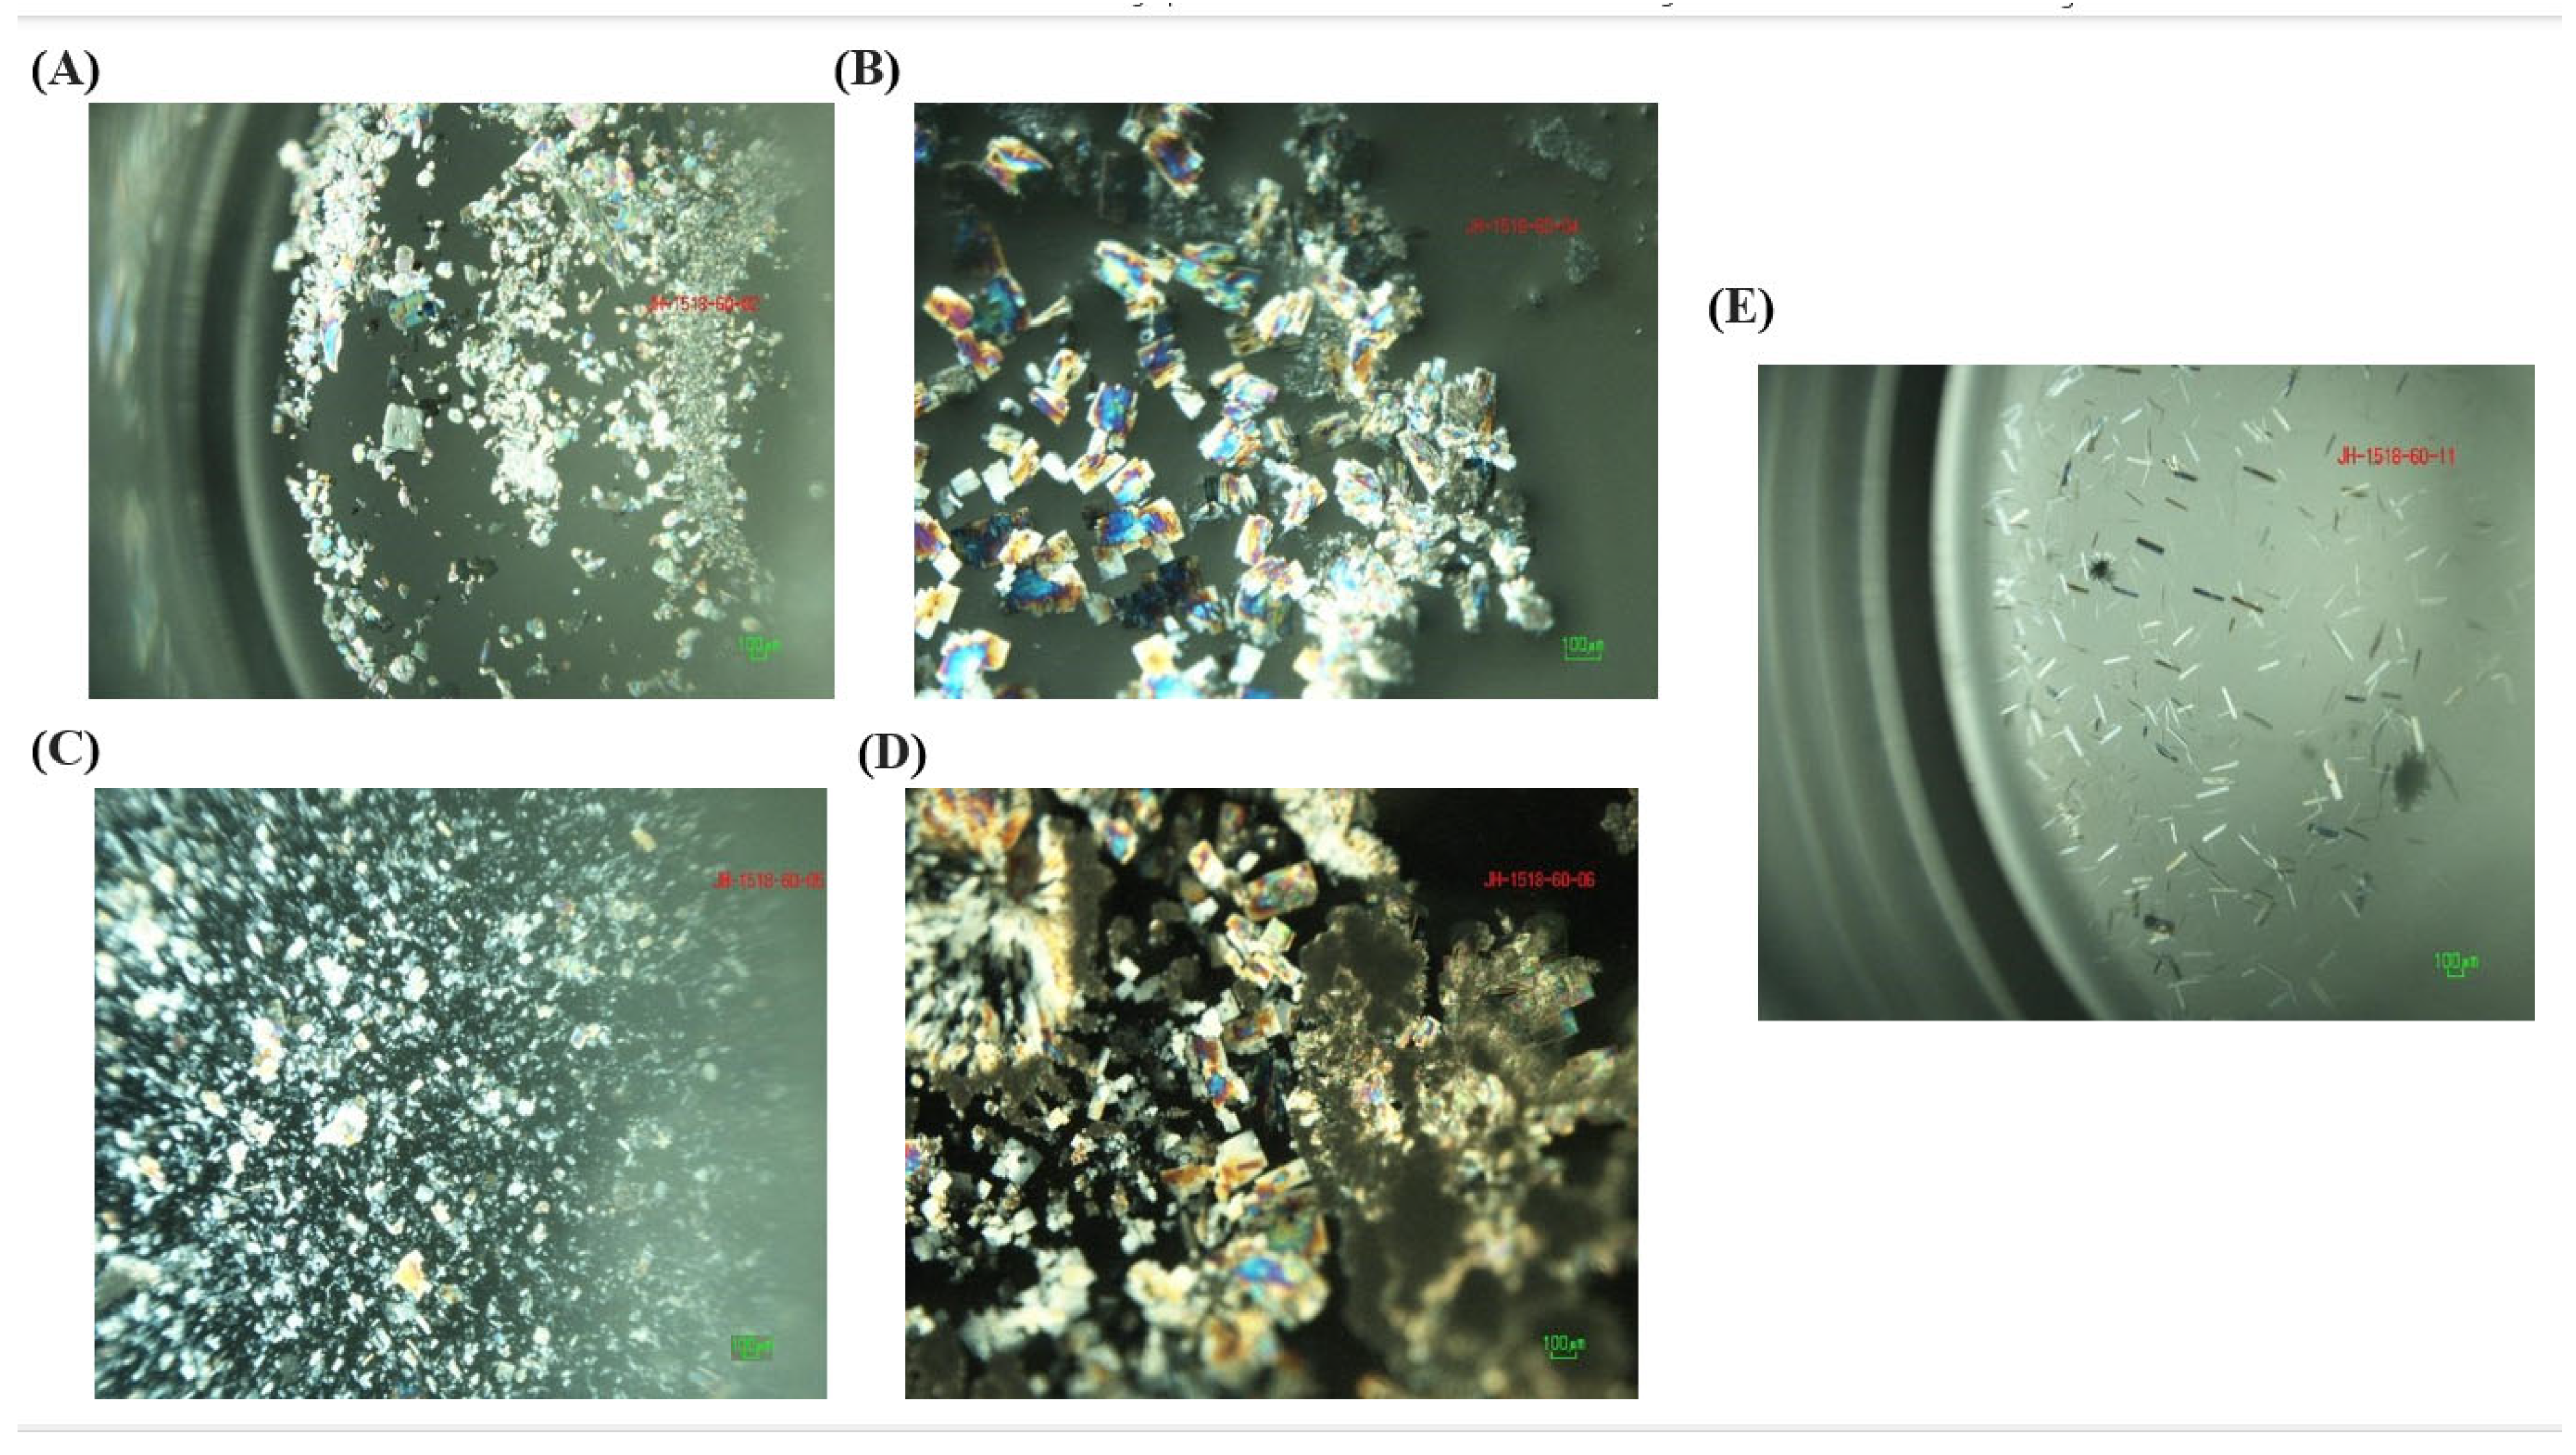
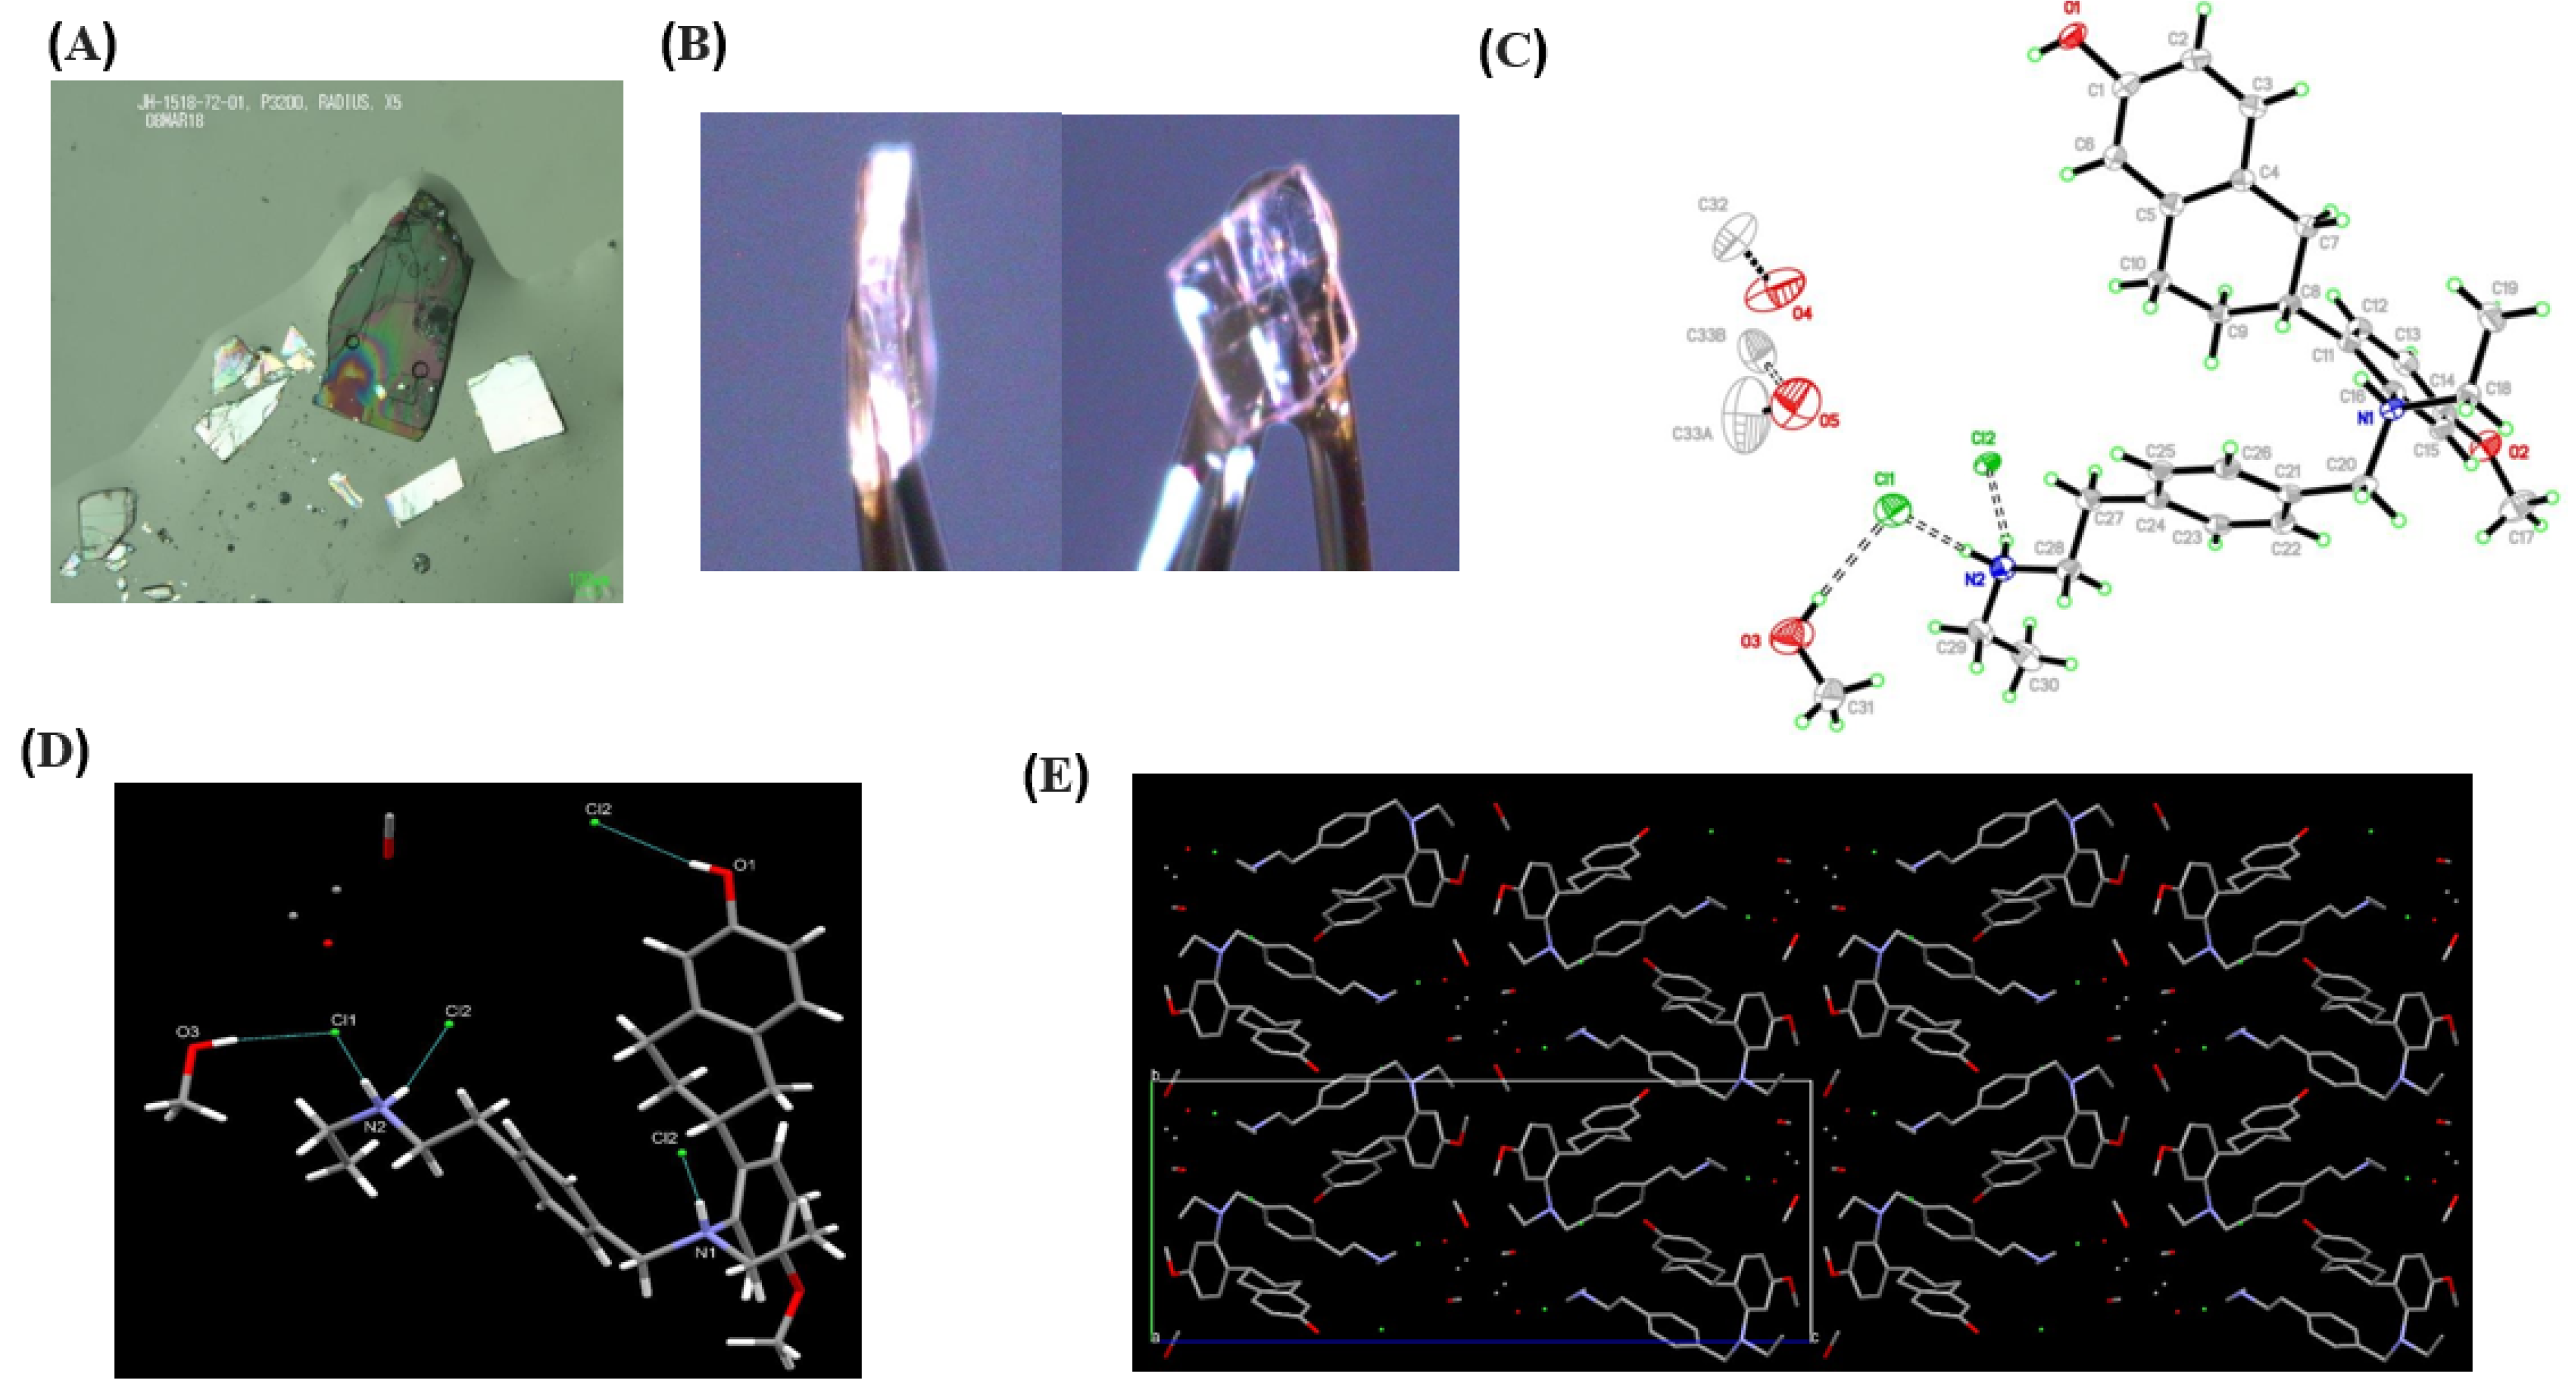
3.2. Single-Crystal Experiments
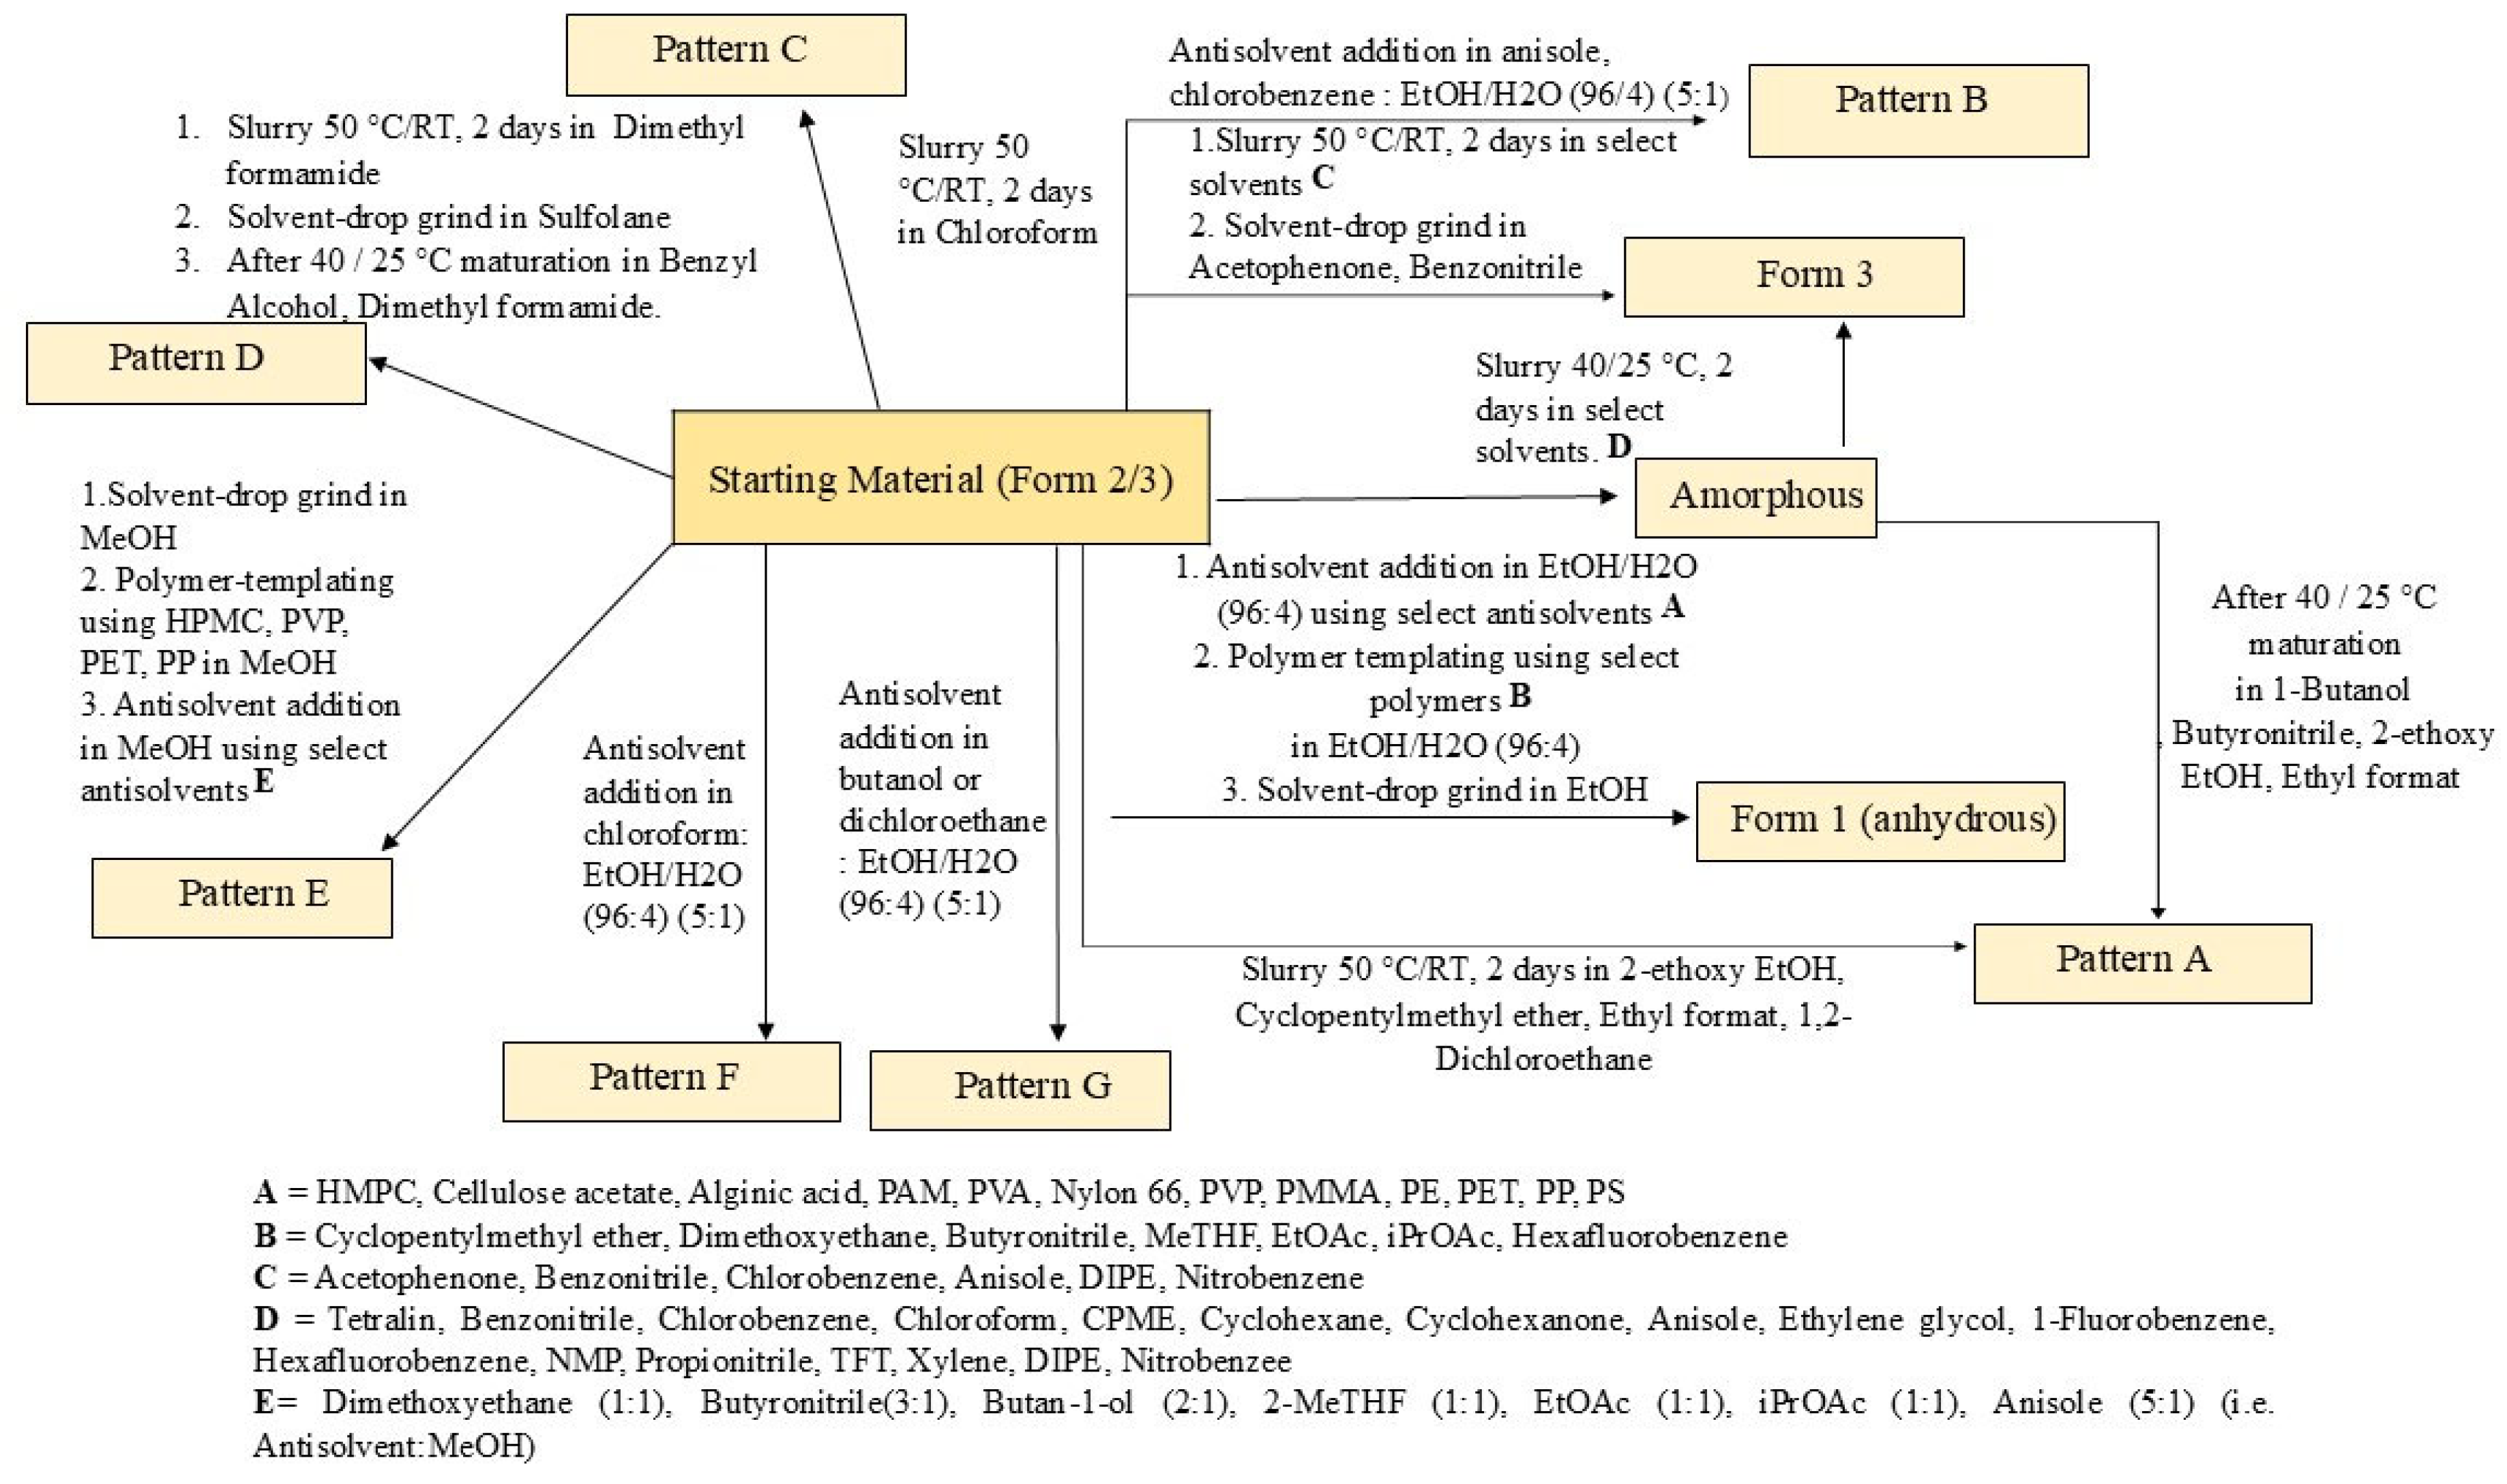
3.3. Extensive Polymorphic Screening Experiment on Crystalline Elacestrant (Form 2/3)
3.3.1. Solubility Assessment and Polymorph Screening
3.3.2. Polymer Template Crystallizations
3.3.3. Solvent-Drop Grinding Experiments
3.3.4. Anti-Solvent Addition Experiments
3.4. Polymorphic Screening Experiments on Amorphous Elacestrant
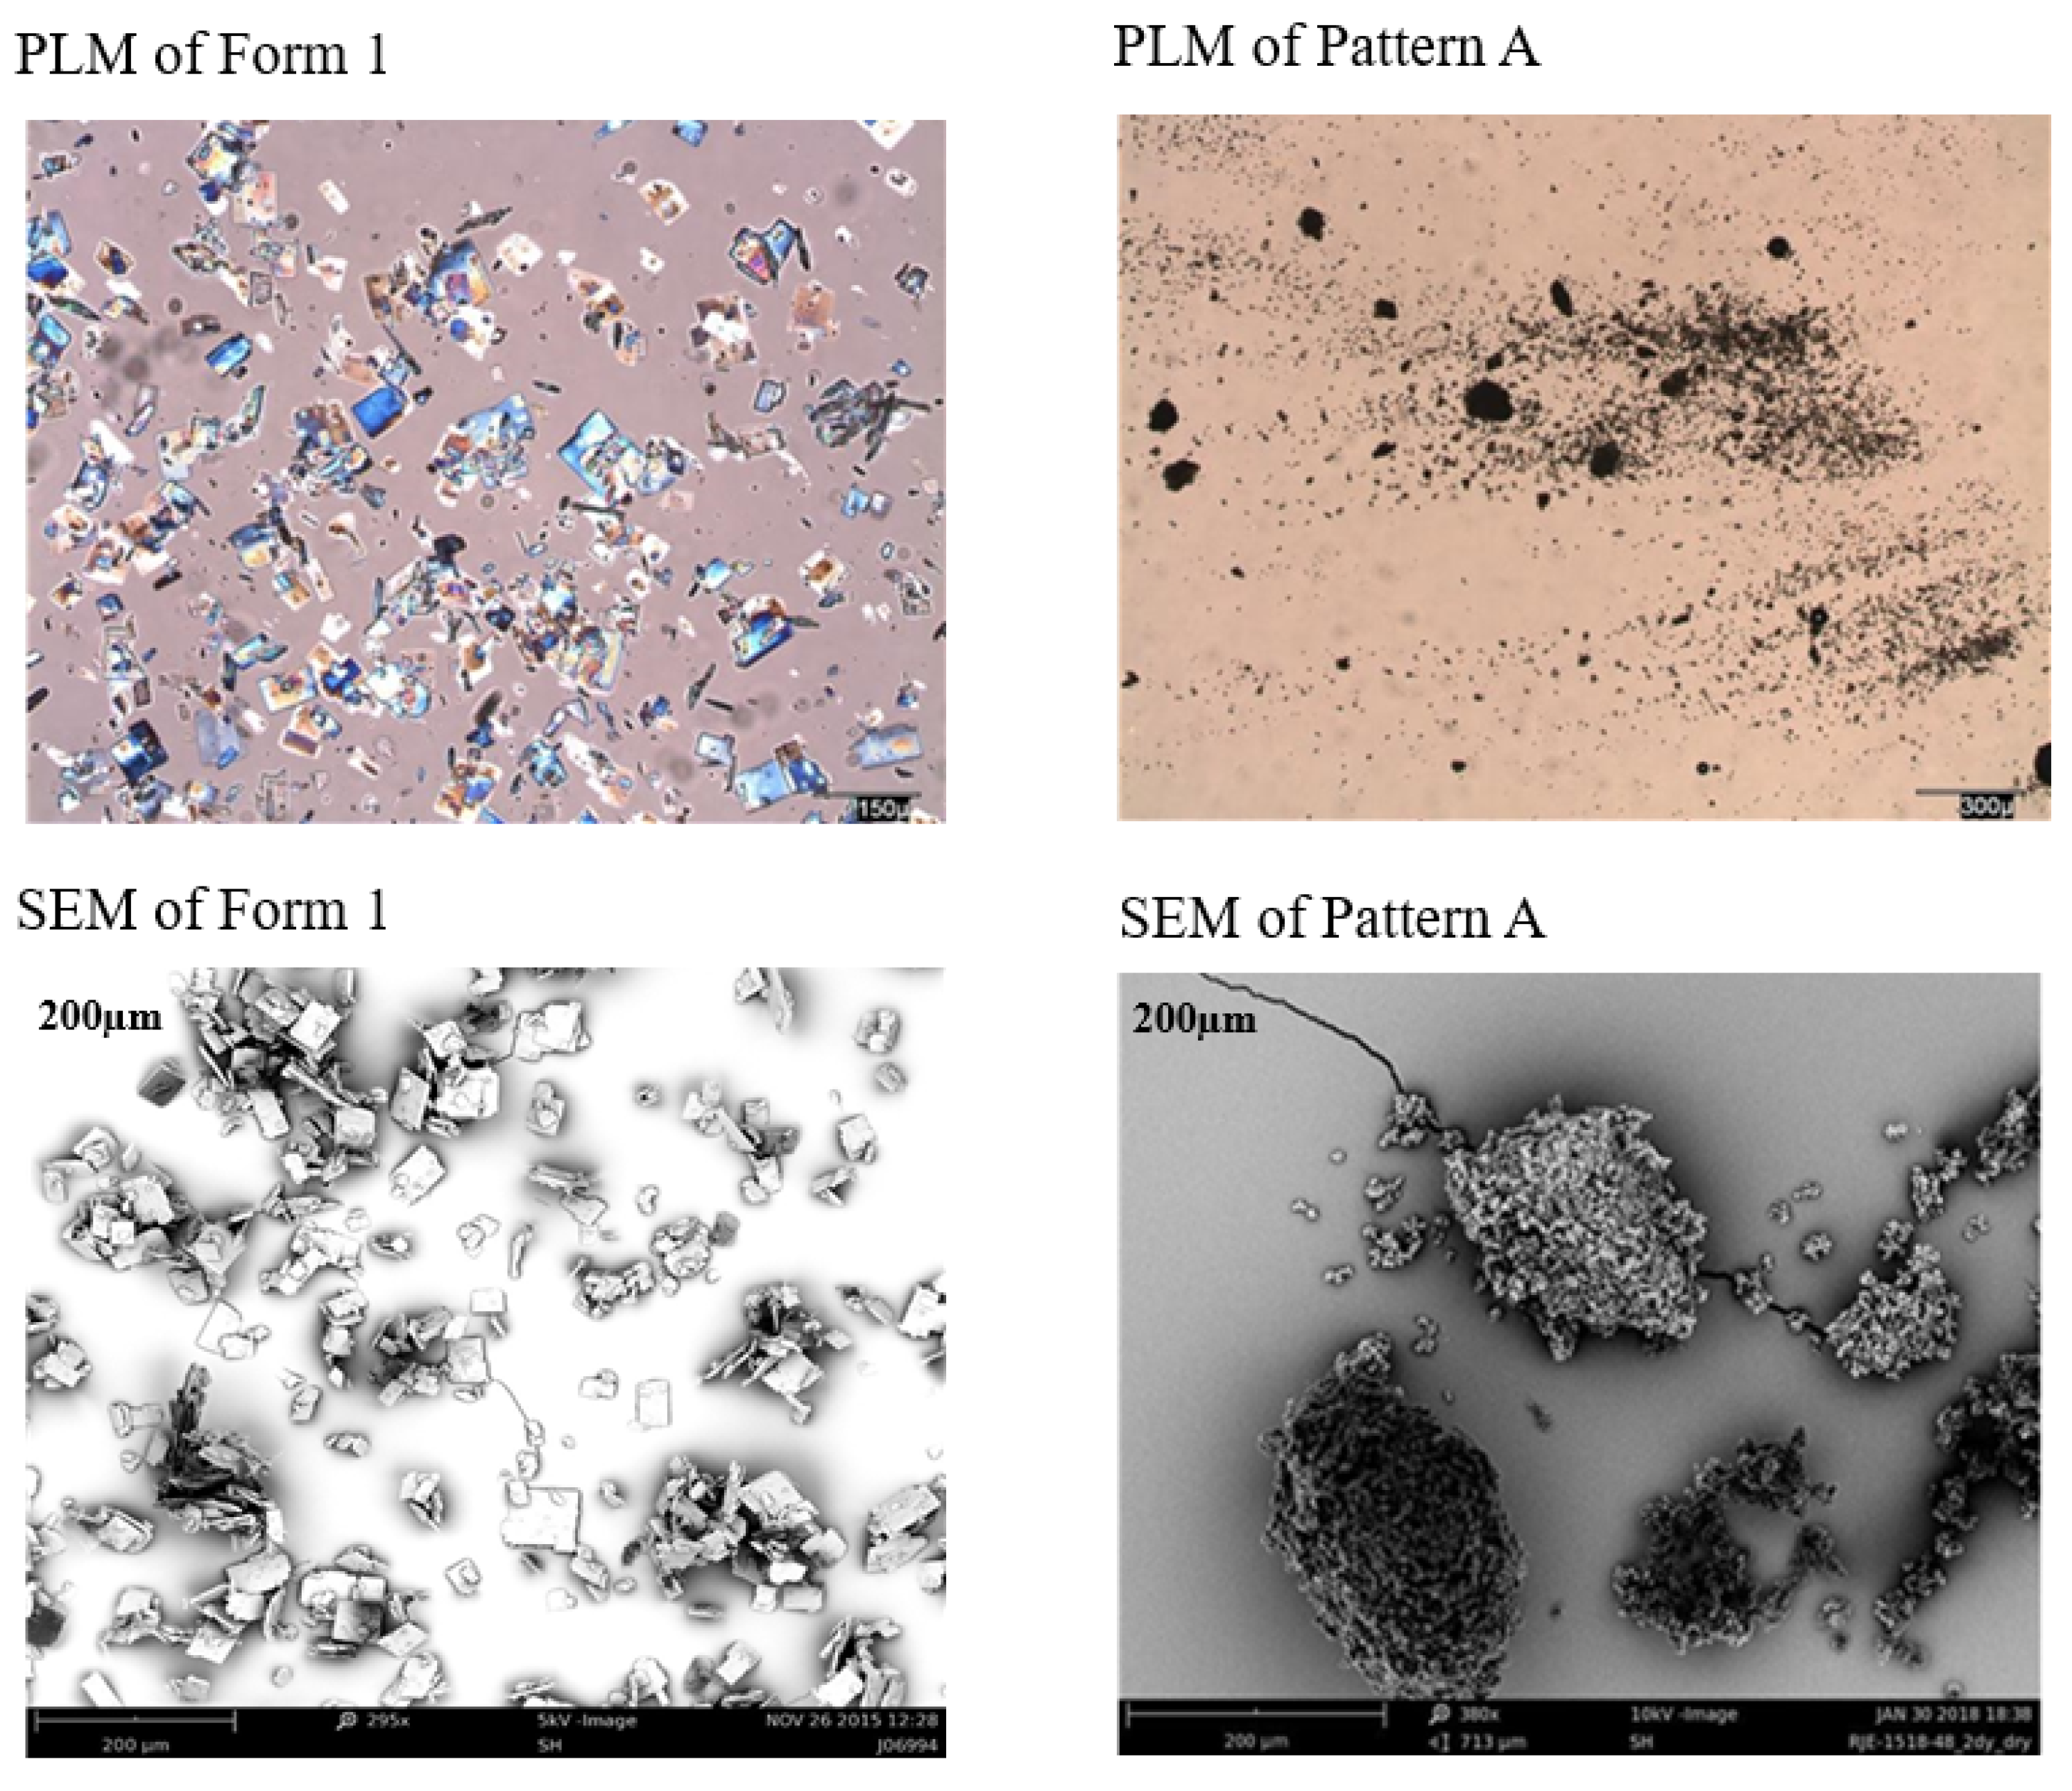
3.5. Solid State Characterization of the Generated New Patterns
3.6. Determination of the Unit Cell Dimensions and the Space Group of the Generated New Patterns
4. Conclusions
Supplementary Materials
Author Contributions
Funding
Institutional Review Board Statement
Informed Consent Statement
Data Availability Statement
Conflicts of Interest
References
- Bizuayehu, H.M.; Ahmed, K.Y.; Kibret, G.D.; Dadi, A.F.; Belachew, S.A.; Bagade, T.; Tegegne, T.K.; Venchiarutti, R.L.; Kibret, K.T.; Hailegebireal, A.H.; et al. Global Disparities of Cancer and Its Projected Burden in 2050. JAMA Netw. Open 2024, 7, e2443198. [Google Scholar] [CrossRef] [PubMed]
- Chaurasia, M.; Singh, R.; Sur, S.; Flora, S.J.S. A Review of FDA Approved Drugs and Their Formulations for the Treatment of Breast Cancer. Front. Pharmacol. 2023, 14, 1184472. [Google Scholar] [CrossRef] [PubMed]
- Cancer Statistics—NCI. Available online: https://www.cancer.gov/about-cancer/understanding/statistics (accessed on 7 January 2025).
- Momenimovahed, Z.; Salehiniya, H. Epidemiological Characteristics of and Risk Factors for Breast Cancer in the World. Breast Cancer Dove Med. Press 2019, 11, 151–164. [Google Scholar] [CrossRef] [PubMed]
- Yara, D.; Oroszi, T. Understanding Breast Cancer: A Comprehensive Review of Epidemiology, Risk Factors, and Treatment Strategies. Adv. Breast Cancer Res. 2025, 14, 1–15. [Google Scholar] [CrossRef]
- Burciu, O.M.; Sas, I.; Popoiu, T.-A.; Merce, A.-G.; Moleriu, L.; Cobec, I.M. Correlations of Imaging and Therapy in Breast Cancer Based on Molecular Patterns: An Important Issue in the Diagnosis of Breast Cancer. Int. J. Mol. Sci. 2024, 25, 8506. [Google Scholar] [CrossRef]
- Breast Cancer. Available online: https://www.who.int/news-room/fact-sheets/detail/breast-cancer (accessed on 7 January 2025).
- Breast Cancer Facts & Stats 2024. Available online: https://www.nationalbreastcancer.org/breast-cancer-facts (accessed on 7 January 2025).
- Rautela, K.; Kumar, D.; Kumar, V. A comprehensive review on computational techniques for breast cancer: Past, present, and future. Multimed. Tools Appl. 2024, 83, 76267–76300. [Google Scholar] [CrossRef]
- Key Statistics for Breast Cancer in Men. Available online: https://www.cancer.org/cancer/types/breast-cancer-in-men/about/key-statistics.html (accessed on 7 January 2025).
- Lumachi, F.; Santeufemia, D.A.; Basso, S.M. Current Medical Treatment of Estrogen Receptor-Positive Breast Cancer. World J. Biol. Chem. 2015, 6, 231–239. [Google Scholar] [CrossRef]
- Alataki, A.; Dowsett, M. Human Epidermal Growth Factor Receptor-2 and Endocrine Resistance in Hormone-Dependent Breast Cancer. Endocr.-Relat. Cancer 2022, 29, R105–R122. [Google Scholar] [CrossRef]
- Neupane, N.; Bawek, S.; Gurusinghe, S.; Ghaffary, E.M.; Mirmosayyeb, O.; Thapa, S.; Falkson, C.; O’Regan, R.; Dhakal, A. Oral SERD, a Novel Endocrine Therapy for Estrogen Receptor-Positive Breast Cancer. Cancers 2024, 16, 619. [Google Scholar] [CrossRef]
- Gheysen, M.; Punie, K.; Wildiers, H.; Neven, P. Oral SERDs Changing the Scenery in Hormone Receptor Positive Breast Cancer, a Comprehensive Review. Cancer Treat. Rev. 2024, 130, 102825. [Google Scholar] [CrossRef]
- FDA Approves Elacestrant for ER+/HER2—Advanced Breast Cancer. Available online: https://www.targetedonc.com/view/fda-approves-elacestrant-for-er-her2--advanced-breast-cancer (accessed on 7 January 2025).
- Keenan, J.C.; Medford, A.J.; Dai, C.S.; Wander, S.A.; Spring, L.M.; Bardia, A. Novel Oral Selective Estrogen Receptor Degraders (SERDs) to Target Hormone Receptor Positive Breast Cancer: Elacestrant as the Poster-Child. Expert Rev. Anticancer Ther. 2024, 24, 397–405. [Google Scholar] [CrossRef] [PubMed]
- Findlay, M.; von Minckwitz, G.; Wardley, A. Effective Oral Chemotherapy for Breast Cancer: Pillars of Strength. Ann. Oncol. Off. J. Eur. Soc. Med. Oncol. 2008, 19, 212–222. [Google Scholar] [CrossRef] [PubMed]
- Hoy, S.M. Elacestrant: First Approval. Drugs 2023, 83, 555–561. [Google Scholar] [CrossRef]
- Bhatia, N.; Thareja, S. Elacestrant: A New FDA-Approved SERD for the Treatment of Breast Cancer. Med. Oncol. Northwood Lond. Engl. 2023, 40, 180. [Google Scholar] [CrossRef]
- Sanchez, K.G.; Nangia, J.R.; Schiff, R.; Rimawi, M.F. Elacestrant and the Promise of Oral SERDs. J. Clin. Oncol. 2022, 40, 3227–3229. [Google Scholar] [CrossRef]
- ER+/HER2—ESR1m mBC Treatment|ORSERDUTM. Available online: https://www.orserdu.com/ (accessed on 7 January 2025).
- ORSERDU (Elacestrant) FDA Labeling. Available online: https://www.accessdata.fda.gov/drugsatfda_docs/label/2023/217639s000lbl.pdf (accessed on 7 January 2025).
- Label: ORSERDU—Elacestrant Tablet, Film-Coated. Available online: https://dailymed.nlm.nih.gov/dailymed/drugInfo.cfm?setid=aa66ae5c-2bd2-4444-8178-b55651e054ef (accessed on 7 January 2025).
- Masum, Z.U.; Spoors, P.G.; Cruskie, M.; Bolger, J.; McKenzie, J.; Sheth, P.; Edwards, R.; Eberlin, A.; Markey, M.; Gupta, V. Stability & Polymorphic Characterization of Elacestrant Dihydrochloride. Res. Sq. 2025. [Google Scholar] [CrossRef]
- Elacestrant Hydrochloride|C30H40Cl2N2O2. Available online: https://pubchem.ncbi.nlm.nih.gov/compound/Elacestrant-hydrochloride (accessed on 6 April 2025).
- Beumer, J.H.; Foldi, J. Pharmacology and Pharmacokinetics of Elacestrant. Cancer Chemother. Pharmacol. 2023, 92, 157–163. [Google Scholar] [CrossRef]
- Elacestrant: Uses, Interactions, Mechanism of Action—DrugBank. Available online: https://go.drugbank.com/drugs/DB06374 (accessed on 7 January 2025).
- Bauer, J.; Spanton, S.; Henry, R.; Quick, J.; Dziki, W.; Porter, W.; Morris, J. Ritonavir: An Extraordinary Example of Conformational Polymorphism. Pharm. Res. 2001, 18, 859–866. [Google Scholar] [CrossRef]
- Hilfiker, R.; Von Raumer, M. (Eds.) Polymorphism in the Pharmaceutical Industry: Solid Form and Drug Development; John Wiley & Sons: Hoboken, NJ, USA, 2019; pp. 151–512. [Google Scholar]
- Gardner, C.R.; Walsh, C.T.; Almarsson, Ö. Drugs as Materials: Valuing Physical Form in Drug Discovery. Nat. Rev. Drug Discov. 2004, 3, 926–934. [Google Scholar] [CrossRef]
- Lee, E.H. A Practical Guide to Pharmaceutical Polymorph Screening & Selection. Asian J. Pharm. Sci. 2014, 9, 163–175. [Google Scholar]
- Aguiar, A.J.; Krc, J.; Kinkel, A.W.; Samyn, J.C. Effect of polymorphism on the absorption of chloramphenicol from chloramphenicol palmitate. J. Pharm. Sci. 1967, 56, 847–853. [Google Scholar] [CrossRef] [PubMed]
- Cruskie, M.P.; Bogler, J.B.; McKenzie, J.B.; Sheth, P.; Edwards, R.; Eberlin, A.; Markey, M. Polymorphic Forms of RAD1901-2HCL. U.S. Patent 10385008B2, 5 January 2018. Available online: https://patents.google.com/patent/US10385008B2/en (accessed on 7 January 2025).
- Masum, Z.U.; Grant Spoors, P.; Burke, M.D.; Gupta, V. Identification of New Polymorphic Patterns for Elacestrant Dihydrochloride. Med. Pharmacol. 2024, 6, 1250. [Google Scholar] [CrossRef]
- Eventova, V.A.; Belov, K.V.; Efimov, S.V.; Khodov, I.A. Conformational Screening of Arbidol Solvates: Investigation via 2D NOESY. Pharmaceutics 2023, 15, 226. [Google Scholar] [CrossRef]
- Kitamura, M. Strategy for Control of Crystallization of Polymorphs. Cryst. Eng. Comm. 2009, 11, 949–964. [Google Scholar] [CrossRef]
- Minamisono, T.; Takiyama, H. Control of Polymorphism in the Anti-Solvent Crystallization with a Particular Temperature Profile. J. Cryst. Growth 2013, 362, 135–139. [Google Scholar] [CrossRef]
- Ma, K.; Wang, N.; Cheng, L.; Wei, Y.; Zhang, J.; Gao, Y.; Qian, S. Identification of Novel Adefovir Dipivoxil-Saccharin Cocrystal Polymorphs and Their Thermodynamic Polymorphic Transformations. Int. J. Pharm. 2019, 566, 361–370. [Google Scholar] [CrossRef]
- U.S. Food and Drug Administration. Pharmaceutical Solid Polymorphism Chemistry, Manufacturing, and Controls Information. Available online: http://www.fda.gov/downloads/Drugs/Guidances/UCM072866.pdf (accessed on 7 January 2025).
- Gruene, T.; Hahn, H.W.; Luebben, A.V.; Meilleur, F.; Sheldrick, G.M. Refinement of Macromolecular Structures against Neutron Data with SHELXL2013. J. Appl. Crystallogr. 2014, 47 Pt 1, 462–466. [Google Scholar] [CrossRef]
- Griesser, U.J.; Stowell, J.G. Solid-state analysis and polymorphism. In Pharmaceutical Analysis; Lee, D.C., Webb, M., Eds.; CRC Press: Boca Raton, FL, USA, 2003; pp. 240–294. [Google Scholar]
- Brittain, H.G. Polymorphism in pharmaceutical solids. Drugs Pharm. Sci. 1999, 95, 183–226. [Google Scholar]
- Myerson, A. Handbook of Industrial Crystallization; Butterworth-Heinemann: Oxford, UK, 2002. [Google Scholar]
- Process for the Parallel Detection of Crystalline Forms of Molecular Solids. Available online: https://patents.google.com/patent/WO2005037424A1/en (accessed on 7 January 2025).
- Smyth, M.S.; Martin, J.H.J. X Ray Crystallography. Mol. Pathol. 2000, 53, 8–14. [Google Scholar] [CrossRef]
- Cox, P.J.; Wardell, J.L. Studies of Polymorphism in Three Compounds by Single Crystal X-Ray Diffraction. Int. J. Pharm. 2000, 194, 147–153. [Google Scholar] [CrossRef]
- Uvarov, V. The Influence of X-Ray Diffraction Pattern Angular Range on Rietveld Refinement Results Used for Quantitative Analysis, Crystallite Size Calculation and Unit-Cell Parameter Refinement. J. Appl. Crystallogr. 2019, 52, 252–261. [Google Scholar] [CrossRef]
- Doebelin, N.; Kleeberg, R. Profex: A Graphical User Interface for the Rietveld Refinement Program BGMN. J. Appl. Crystallogr. 2015, 48 Pt 5, 1573–1580. [Google Scholar] [CrossRef]
- Döbelin, N.; Archer, R.; Tu, V. A Free and Open-Source Solution for Rietveld Refinement of XRD Data from the CheMin Instrument Onboard the Mars Rover Curiosity. Planet. Space Sci. 2022, 224, 105596. [Google Scholar] [CrossRef]
- Pawley, G.S. Unit-Cell Refinement from Powder Diffraction Scans. J. Appl. Crystallogr. 1981, 14, 357–361. [Google Scholar] [CrossRef]
- David, W.I.F. On the Equivalence of the Rietveld Method and the Correlated Integrated Intensities Method in Powder Diffraction. J. Appl. Crystallogr. 2004, 37, 621–628. [Google Scholar] [CrossRef]


| Properties | Value |
|---|---|
| Molecular Structure | 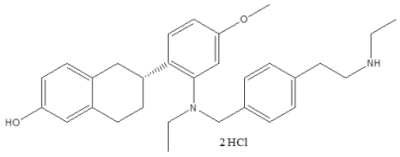 |
| Molecular Weight | 531.6 g/mol |
| pKa | 9.8 (BH+, aliphatic amine) |
| cLogP | 6.8 |
| LogD | 3.6 |
| Hydrogen Bond Donor Count | 4 |
| Hydrogen Bond Acceptor Count | 4 |
| Rotatable Bond Count | 10 |
| Test Parameter | Result/Value |
|---|---|
| Method | Reverse phase (gradient elution) |
| Preparation of samples | 0.5–0.7 mg/mL using water:acetonitrile (1:1) |
| Column type | C18 Supelco Ascentis Express, 100× (4.6 mm, 2.7 μm) |
| Temperature of Column (°C) | 25 |
| Injection volume (µL) | 2 or 4 |
| Wavelength (nm) | 255 |
| Bandwidth (nm) | 90 |
| Rate of Flow (mL per min) | 2 |
| Phase A | Water containing 0.1% TFA |
| Phase B | Acetonitrile containing 0.085% TFA |
| Test Parameter | Result/Value |
|---|---|
| Method type | Anion exchange |
| Type of Column | Metrosep A Supp 5–150 (4.0 × 150 mm) |
| Temperature of Column (°C) | Room temperature |
| Injection volume (µL) | Various |
| Type of Detection | Conductivity detector |
| Rate of flow (mL/min) | 0.7 |
| Eluent | Sodium Carbonate (3.2 mM), Sodium Hydrogen Carbonate (1.0 Mm) in an aqueous solution of 5% acetone. |
| D-H···A | d(D-H) Å | d(H···A) Å | d(D···A) Å | <(DHA)° |
| O1-H1···Cl2 #1 | 0.78 (4) | 2.34 (4) | 3.110 (3) | 168 (4) |
| N1-H1A···Cl2 #2 | 0.89 (4) | 2.43 (4) | 3.246 (3) | 153 (3) |
| N2-H2B···Cl1 | 0.95 (5) | 2.17 (5) | 3.106 (3) | 170 (4) |
| N2-H2A···Cl2 | 0.89 (5) | 2.26 (5) | 3.121 (3) | 163 (4) |
| O3-H3A···Cl1 | 0.88 (6) | 2.34 (6) | 3.174 (4) | 158 (5) |
| Sample Details | Crystal Data |
|---|---|
| Compound | Elacestrant methanol solvate |
| Crystallization solvents | Methanol |
| Crystallization method | slow cooling |
| Empirical formula | C32.5H44Cl2N2O4.50 |
| Formula weight | 605.59 |
| Temperature | 100(2) K |
| Wavelength | 1.54184 Å |
| Crystal size | 0.380 × 0.380 × 0.050 mm |
| Crystal habit | colorless plate |
| Crystal system | Orthorhombic |
| Space group | P212121 |
| Unit cell dimensions | a = 8.93126(11) Å α = 90° |
| b = 11.70665(14) Å β = 90° | |
| c = 31.4469(4) Å γ = 90° | |
| Volume | 3287.93(7) Å3 |
| Z | 4 |
| Density (calculated) | 1.223 mg/m3 |
| Absorption coefficient | 2.086 mm−1 |
| Pattern | Description | Conclusion |
|---|---|---|
| Starting /Input Material | Elacestrant supplied as a mixture of Form 2 and Form 3 | Mixture of Form 2 and Form 3 |
| A | Obtained frequently, had the highest melt temperature at 225–226 °C (onset) | New Polymorph |
| B | Similar to Form 3 but with a unique XRPD pattern | New Polymorph |
| C | Obtained from chloroform on one occasion and is tentatively assigned as a dihydrate form | New Polymorph |
| D | Obtained on two occasions using dimethyl formamide and benzyl alcohol, but found to have degraded (78% purity by HPLC) | Potential New Polymorph with Degradation |
| E | Obtained on numerous occasions from anti-solvent addition experiments with methanol, tentatively assigned as a dihydrate form | New Polymorph |
| F | Obtained on one occasion by adding chloroform anti-solvent to a solution of elacestrant in ethanol (4% aq.). Tentatively assigned as a hemihydrate form. | New Polymorph |
| G | Obtained on two occasions by the addition of butan-1-ol or 1,2-dichloroethane to a solution of elacestrant in ethanol (4% aq.). Tentatively assigned as a hemihydrate form, exhibiting a small mass loss prior to a melt consistent with Form 1. | New Polymorph |
| Technique | Elacestrant (Form 2/3 Mixture-Input Material) | Elacestrant (Form 1) | 1,2-Dichloroethane (Table S9) | 1,2-Dichloroethane (Table S4) | Chloroform (Dry) (Table S4) |
|---|---|---|---|---|---|
| XRPD | Input material (Form 2/3 mixture) | Form 1 | Crystalline, Pattern A | Crystalline, Pattern C | |
| 1H-NMR | Consistent with NMR of previous batch Form 2/3 reference material but with 0.08 eq. residual MeOH. | Consistent with structure | Consistent with as supplied. No residual solvent. | Consistent with as supplied, but with 0.1 eq dichloroethane | Consistent with as supplied. No residual solvent. |
| DSC | Broad endo. RT to 150 °C, minimum at 86.4 °C (peak). Endo. at 163.1 °C (onset), 51 J/g. Sample degrades above 200 °C. | Endotherm at 218 °C(onset) 150.0 J/g(melt) | Endo. At 56.7 °C (peak), 10 J/g. Melt endo. at 225.5 °C (onset), 119 J/g. | Endo. At 50.4 °C (onset), 16 J/g. Melt endo. at 224.9 °C (onset), 116 J/g. | Broad endo at 69.5 °C (onset), 151 J/g. Melt recryst. at 153.8 °C (onset, endo), 20 J/g, 170.3 °C (peak, exo). Melt endo at 219.5 °C (onset), 111 J/g. |
| TGA | 8.4% wt. loss from RT to 150 °C and 0.6% wt. loss from 150 to 190 °C | 0.4% weight loss between ambient and 100 °C | 0.5% wt. loss from RT to 80 °C | 0.8% wt. loss from RT to 90 °C and 0.7% wt. loss from 90 to 180 °C | 5.2% wt. loss from RT to 100 °C and 1.2% wt. loss from 140 to 190 °C |
| IC (adjusted for water/solvent) | 1.82 eq. | 2.0 eq. | 1.84 eq. | 1.79 eq. | 1.82 eq. |
| HPLC (%, AUC) | 99.2% | 99.2% | 98.8% | 98.2% | 97.6% |
| XRPD post storage at 40 °C/75% RH for 1 week | N/P | Form 1 | Pattern A + Form 3 | Pattern A + Form 3 | Pattern C with increased crystallinity |
| Comments | Form 2/3 anhydrous/hydrate mixture | Form 1 anhydrous | Similar to Form 1 but exhibits lower crystallinity and converts towards Form 3 at 40 °C/75% RH, as shown in Figure S10 | Thermal data shows water loss, melt/recrys. of the anhydrous form and then melt consistent with Form 1 | |
| Technique | Elacestrant (Form 2/3 Mixture-Input Material) | Elacestrant (Form 1) | Anisole _5C_Dry_Table S7 | Butyronitrile_5C_Dry_Table S7 | EtOAc_5C_Dry_Table S7 | Chloroform_5C_Dry_Table S7 | Butan-1-ol_5C_Dry_Table S7 |
|---|---|---|---|---|---|---|---|
| XRPD | Input material (Form 2/3 mixture) | Form 1 | Crystalline, Pattern B | Pattern E | Poorly crystalline, Pattern F | Crystalline, Pattern G | |
| 1H-NMR | Consistent with NMR of previous reference batch, but with 0.08 eq. residual MeOH. | Consistent with structure | Consistent with as supplied, no residual solvent observed | Consistent with as supplied, but with 0.04 eq. residual MeOH | Consistent with as supplied, but with 0.06 eq. residual MeOH and trace EtOAc | Consistent with as supplied, no residual solvent observed | Consistent with as supplied, but with 0.77–0.83 eq. butan-1-ol, 0.18–0.28 eq. EtOH 0.06 eq. MeOH |
| DSC | Broad endo. RT to 150 °C, minimum at 86.4 °C (peak). Endo. at 163.1 °C (onset), 51 J/g. Sample degrades above 200 °C. | Endotherm at 218 °C (onset) 150.0 J/g (melt) | Broad endo at 37.9 °C (onset), 73 J/g. Meltrecryst. at 183.4 °C (onset, endo), 52 J/g, 199.9 °C (peak, exo). Melt endo at 209.4 °C (onset), 48 J/g. | Broad endo from RT to 170 °C, with endo/exo event at 150.1 °C (onset, endo), 116 J/g, °C (peak, 184.0 exo) and melt endo at 205.0 °C (onset), 39 J/g | Broad endo from RT to 170 °C, with endo/exo event at 154.2 °C (onset, endo), 106 J/g, 185.6 °C (peak, exo) and melt endo at 205.4 °C (onset), 19 J/g | Broad endo at 35.2 °C (onset), 13 J/g. small endo/exo event at 135.5 °C (onset, endo), 4 J/g, 158.5 °C (peak, exo) and melt endo at 222.0 °C (onset), 123 J/g | Sharp endo at 99.6 °C (onset), 73 J/g, and melt endo at 222.3 °C (onset), 90 J/g |
| TGA | 8.4% wt. loss from RT to 150 °C and 0.6% wt. loss from 150 to 190 °C | 0.4% wt. loss from RT to 100 °C | 3.1% wt. loss from RT to 90 °C and 1.8% wt. loss from 170 to 210 °C | 5.5% wt loss from RT to 170 °C | 5.3% wt loss from RT to 170 °C | 1.3% wt loss from RT to 100 °C and 0.3% wt loss from 110 to 180 °C | 1.9% wt loss from RT to 90 °C and 8.1% wt loss from 90 to 150 °C |
| HPLC (%, AUC) | 99.2% | 99.2% | 98.9% | 99.3% | 99.4% | 99.1% | 98.8% |
| XRPD post storage at 40 °C/75% RH 1 week. | Not performed | Form 1 | Pattern A | Pattern E | Pattern E | Form 1 | Form 3 |
| Comments | Form 2/3 anhydrous/hydrate mixture | Form 1 anhydrous | Thermal consistent with Form 3, hydrated form | Thermal behavior and water content very similar to Pattern C, with melt/recryst. event onset at ~150 °C, exo peak at 170–180 °C, and melt consistent with Form 1 | Similar to Pattern C but weaker thermal events (both show melt/recryst. prior to melt consistent with Form 1) | Thermal and NMR show high solvent content (on surface or bound) and melt consistent with Form 1 | |
| Software: Profex 5.4.1 | ||||||||||
|---|---|---|---|---|---|---|---|---|---|---|
| Method: Rietveld Refinement | ||||||||||
| Parameters | Form 1 | Starting /Input Material | Form 3 | Pattern A | Pattern B | Pattern C | Pattern D | Pattern E | Pattern F | Pattern G |
| Phase | BGMN (SiC6H) | BGMN (Kaolinite) | BGMN (Kaolinite) | BGMN (SiC15R) | BGMN (Magnesite) | BGMN (Magnesite) | BGMN (SiC6H) | BGMN (Hematite) | BGMN (SiC6H) | BGMN (SiC6H) |
| Unit cell dimensions | a = 3.081 Å | a = 5.16 Å | a = 5.16 Å | a = 3.07 Å | a = 4.63 Å | a = 4.63 Å | a = 3.08 Å | a = 5.04 Å | a = 3.08 Å | a = 3.08 Å |
| b = undf | b = 5.16 Å | b = 8.95 Å | b = undf | b = undf | b = undf | b = undf | b = undf | b = undf | b = undf | |
| c = 15.17 Å | c = 7.40 Å | c = 7.40 Å | c = 37.70 Å | c = 15.01 Å | c = 15.01 Å | c = 15.12 Å | c = 13.77 Å | c = 15.12 Å | c = 15.12 Å | |
| α = β = 90°, γ = 120° | α = 91°, β = 105°, γ = 89° | α = 91°, β = 105°, γ = 89° | α = β = 90°, γ = 120° | α = β = 90°, γ = 120° | α = β = 90°, γ = 120° | α = β = 90°, γ = 120° | α = β = 90°, γ = 120° | α = β = 90°, γ = 120° | α = β = 90°, γ = 120° | |
| Space group | 186 Hermann Mauguin = P6_3mc | 1 Hermann Mauguin = P1 | 1 HermannMauguin = P1 | 160 HermannMauguin = R3m | 167 HermannMauguin = R-32/c | 167 HermannMauguin = R-32/c | 186 HermannMauguin = P6_3mc | 167 HermannMauguin = R-32/c | 186 HermannMauguin = P6_3mc | 186 HermannMauguin = P6_3mc |
| Crystal Shape | Hexagonal | Triclinic | Triclinic | Trigonal | Trigonal | Trigonal | Hexagonal | Trigonal | Hexagonal | Hexagonal |
Disclaimer/Publisher’s Note: The statements, opinions and data contained in all publications are solely those of the individual author(s) and contributor(s) and not of MDPI and/or the editor(s). MDPI and/or the editor(s) disclaim responsibility for any injury to people or property resulting from any ideas, methods, instructions or products referred to in the content. |
© 2025 by the authors. Licensee MDPI, Basel, Switzerland. This article is an open access article distributed under the terms and conditions of the Creative Commons Attribution (CC BY) license (https://creativecommons.org/licenses/by/4.0/).
Share and Cite
Masum, Z.U.; Spoors, P.G.; Burke, M.D.; Gupta, V. Novel Polymorphic Patterns for Elacestrant Dihydrochloride. Pharmaceutics 2025, 17, 745. https://doi.org/10.3390/pharmaceutics17060745
Masum ZU, Spoors PG, Burke MD, Gupta V. Novel Polymorphic Patterns for Elacestrant Dihydrochloride. Pharmaceutics. 2025; 17(6):745. https://doi.org/10.3390/pharmaceutics17060745
Chicago/Turabian StyleMasum, Zia Uddin, P. Grant Spoors, Matt D. Burke, and Vivek Gupta. 2025. "Novel Polymorphic Patterns for Elacestrant Dihydrochloride" Pharmaceutics 17, no. 6: 745. https://doi.org/10.3390/pharmaceutics17060745
APA StyleMasum, Z. U., Spoors, P. G., Burke, M. D., & Gupta, V. (2025). Novel Polymorphic Patterns for Elacestrant Dihydrochloride. Pharmaceutics, 17(6), 745. https://doi.org/10.3390/pharmaceutics17060745