
Development of Rapidly Dissolving Microneedles Integrated with Valsartan-Loaded Nanoliposomes for Transdermal Drug Delivery: In Vitro and Ex Vivo Evaluation


Abstract

1. Introduction
2. Materials and Methodology
2.1. Materials
2.2. Preparation of Liposomes (VAL-LP)
2.3. Optimization of VAL-LP Formulation
2.4. Particle Size (PS), PDI (Polydispersity Index), Zeta Potential (ZP), and Entrapment Efficiency (EE%)
HPLC Method
2.5. Differential Scanning Calorimetry (DSC), Fourier Transform Infrared Spectroscopy (FTIR), and X-Ray Diffraction (XRD) Analysis
2.6. Surface Morphology and Size Analysis
2.7. Confocal Laser Scanning Microscopy (CLSM)
2.8. Ex Vivo Analysis of Skin Permeation
2.9. MTT Assay
2.9.1. Cell Line Preparation
2.9.2. MTT Assay
2.10. Preparation of Dissolving Microneedles (DMNs)
2.10.1. Integration of Optimized VAL-LP Formulations into SA-HPMC-DMNs (VAL-LP-DMNs)
2.10.2. Morphology of DMNs
2.10.3. Mechanical Strength of DMNs
2.10.4. Insertion Capability of DMNs
2.10.5. Dissolution of DMNs Using Rat Skin
2.10.6. SEM and CSLM Analyses of Rat Skin Punctured with VAL-LP-DMNs
2.10.7. Drug Content Determination in DMNs
2.10.8. Ex Vivo (Skin Permeation and Deposition) Analysis of VAL-LP-DMNs
2.11. Statistical Analysis
3. Results and Discussion
3.1. Optimization of VAL-LP Formulations
3.1.1. Response 1: Impact of Independent Variables on VAL-LP Vesicle Size
3.1.2. Response 2: Impact of Independent Variables on VAL-LP Zeta Potential
3.1.3. Response 3: Impact of Independent Variables on VAL-LP Entrapment Efficiency (EE%)
3.1.4. Optimization of VAL-LP
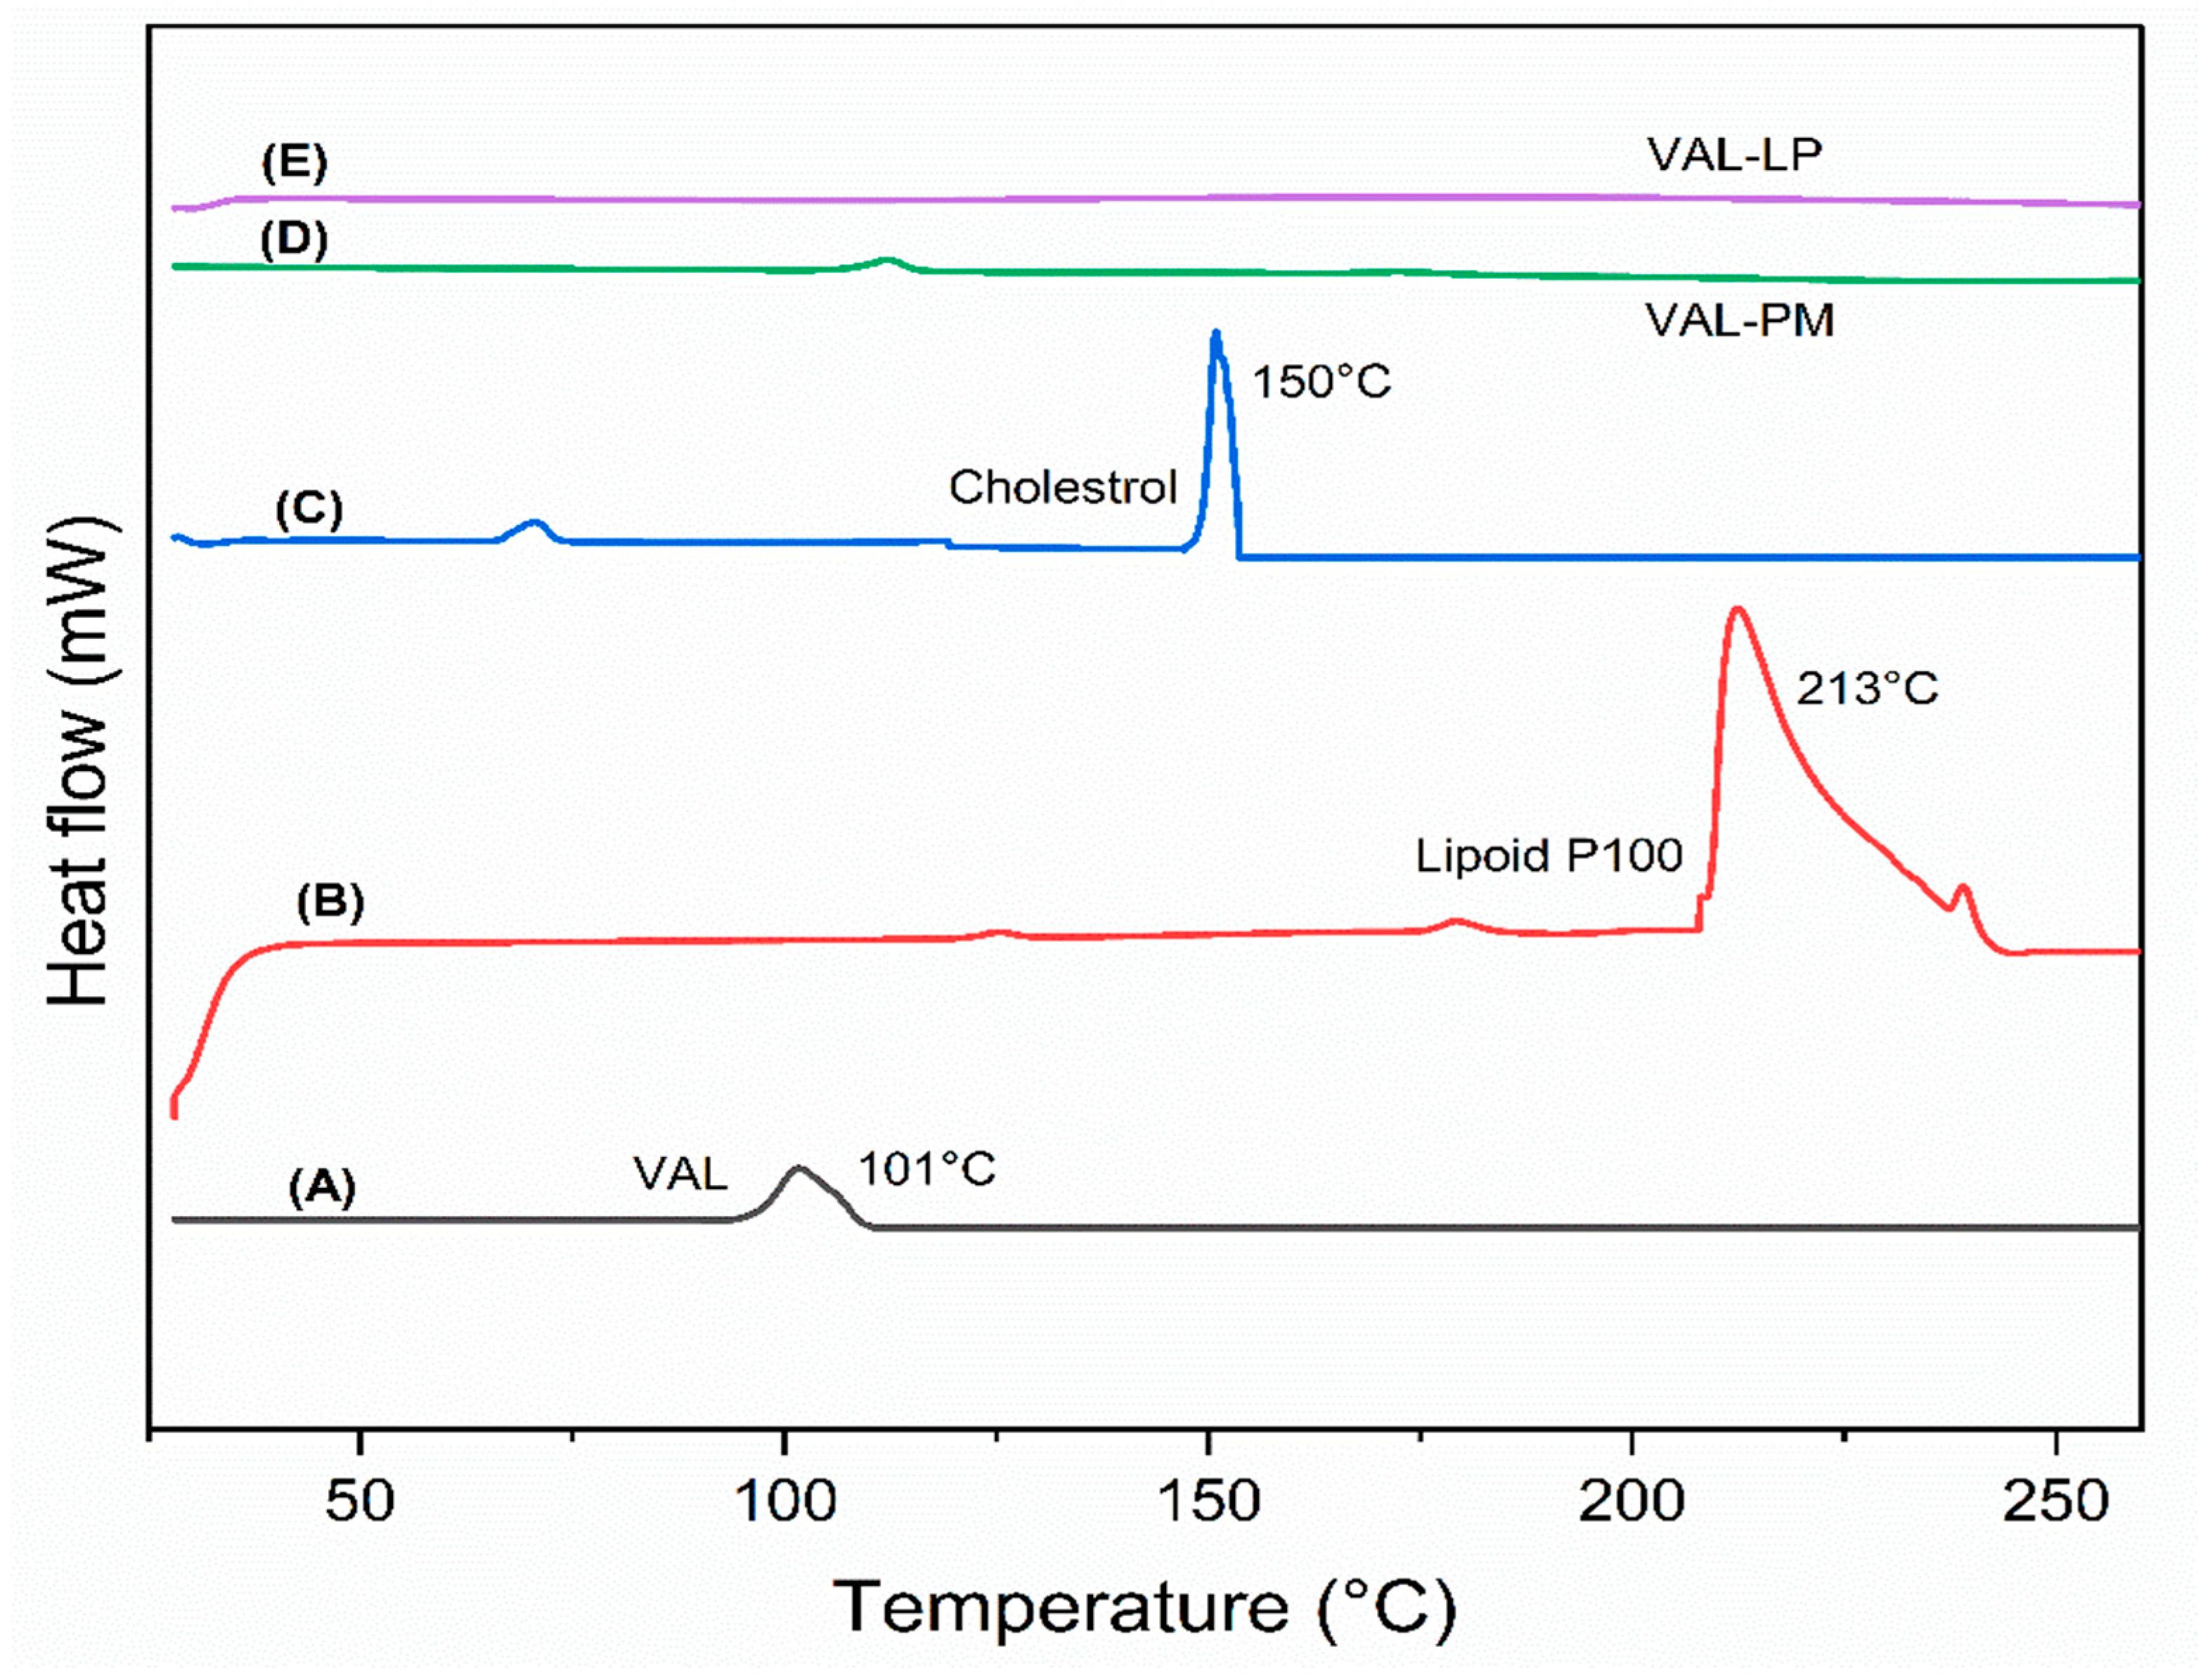
3.1.5. Differential Scanning Calorimetry (DSC)
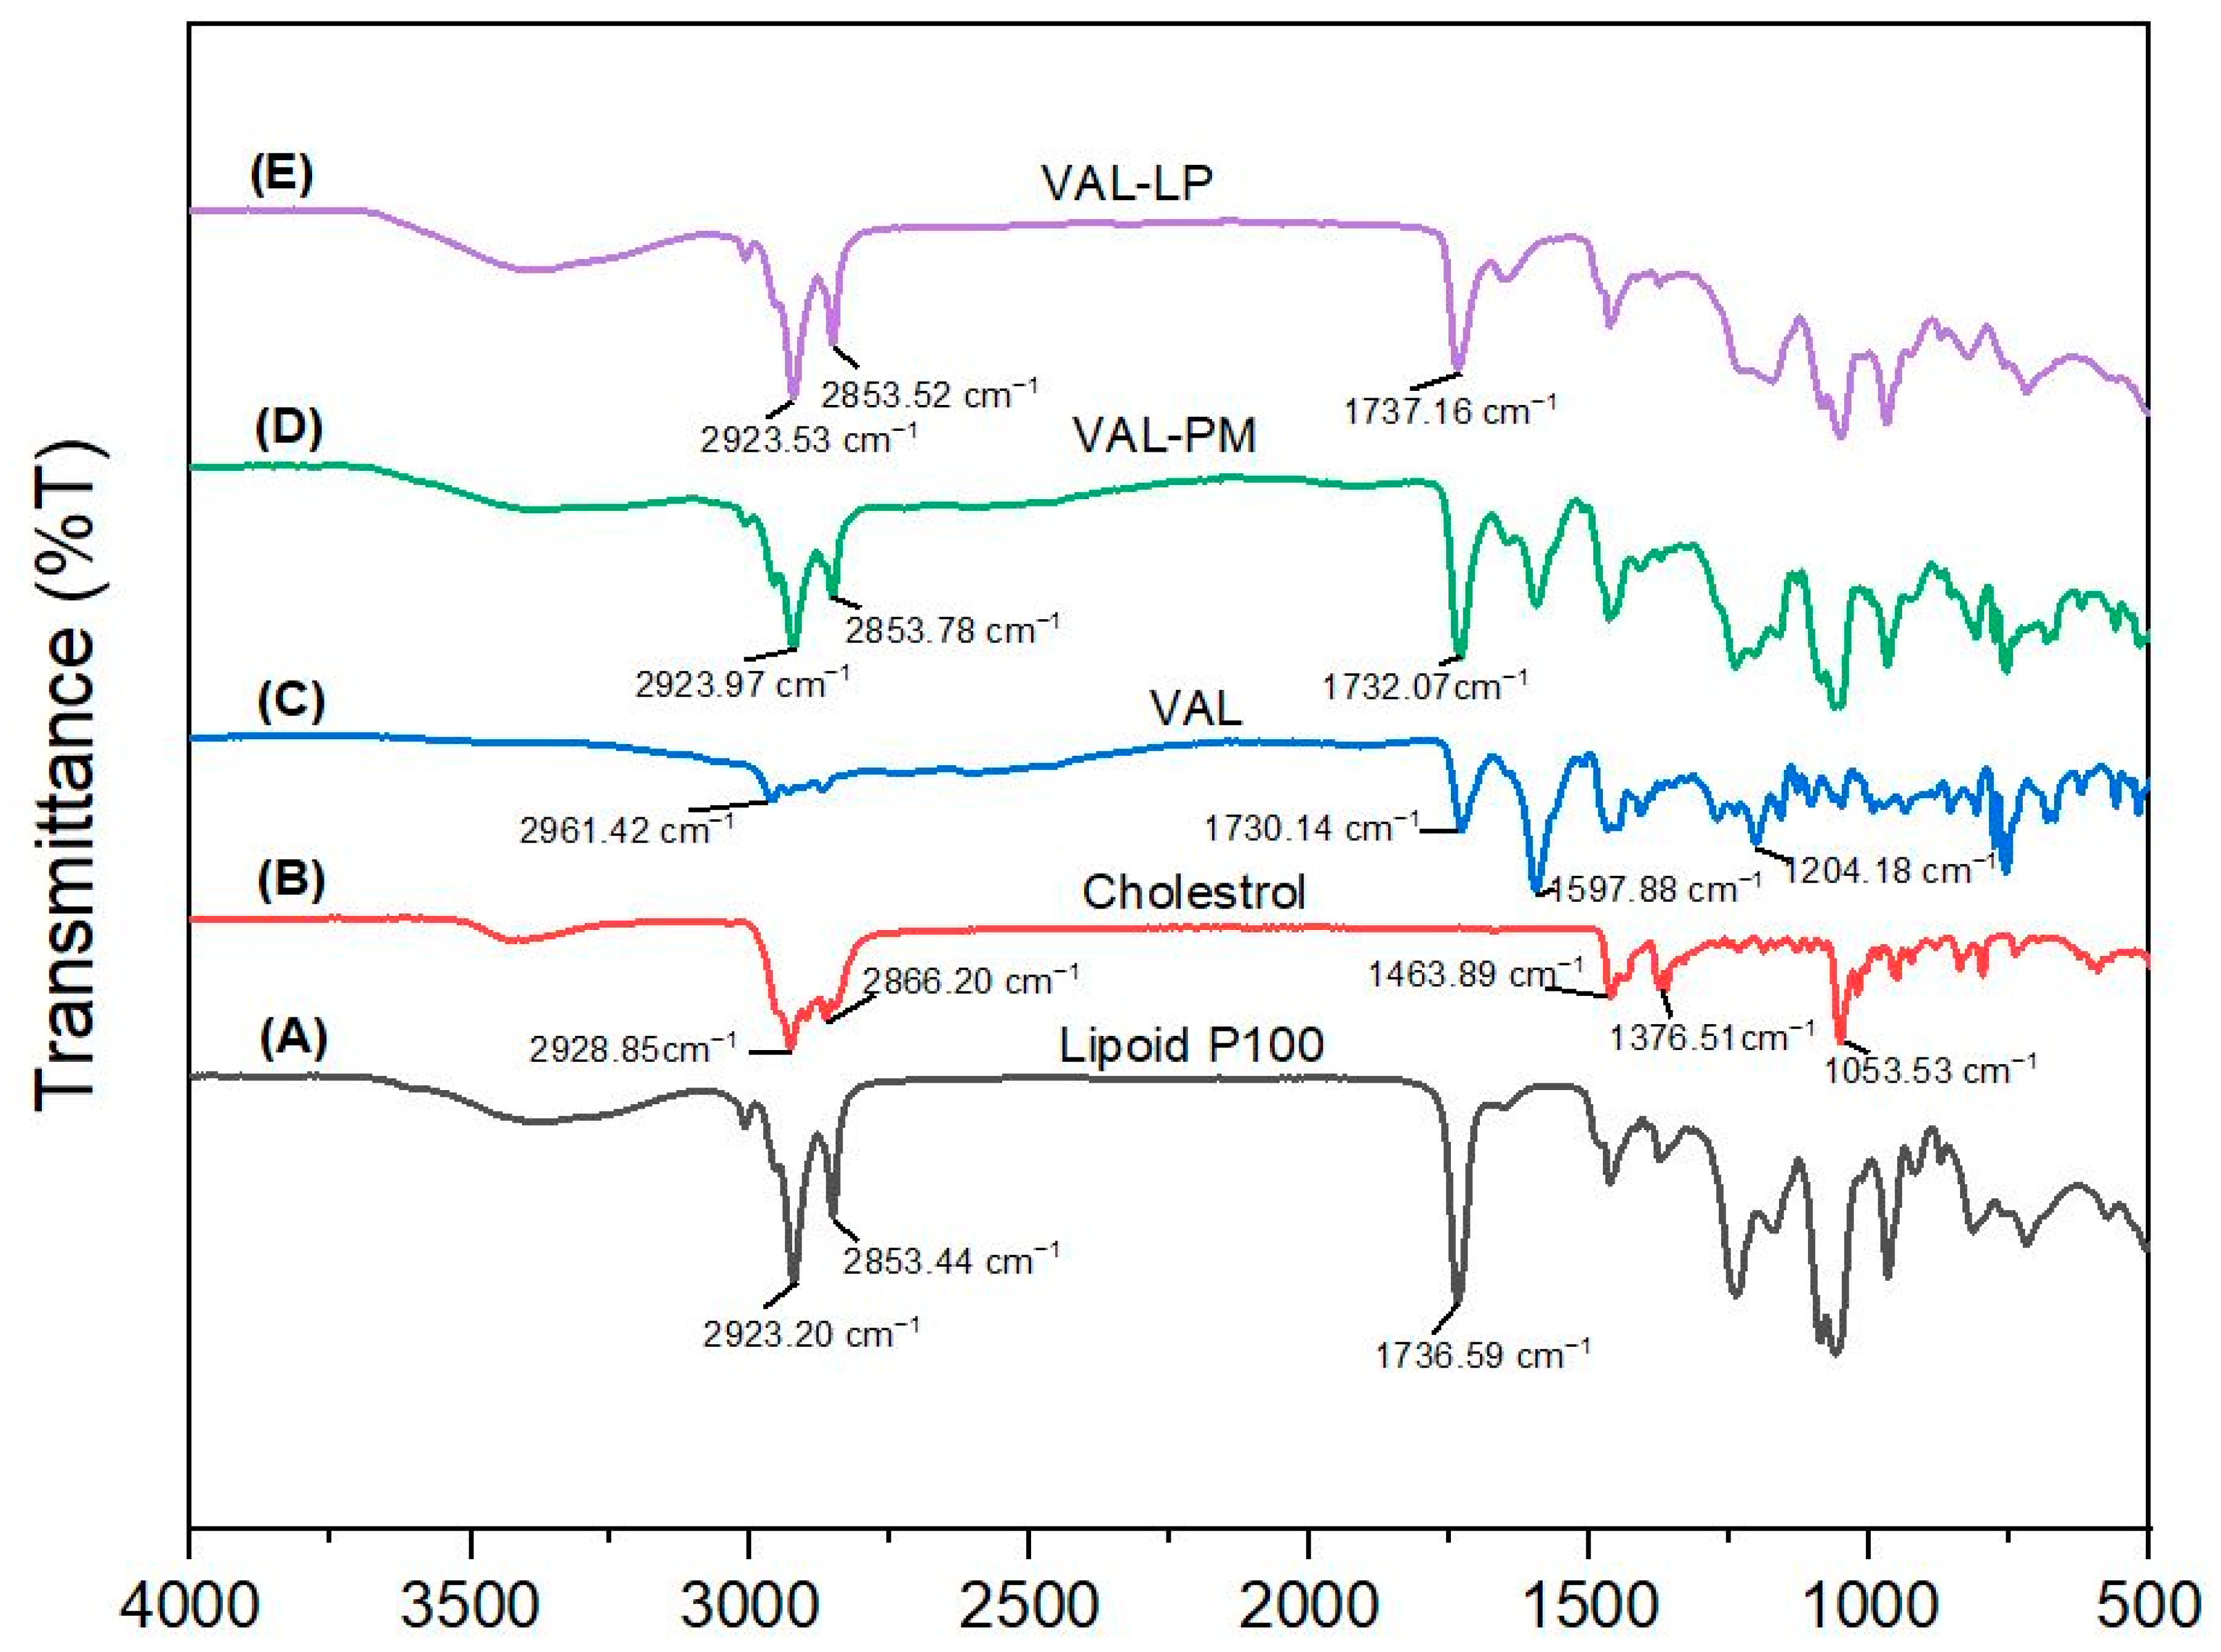
3.1.6. Fourier Transform Infrared Spectroscopy (FTIR)
3.1.7. X-Ray Diffraction (XRD)
3.1.8. Field Emission Scanning Electron Microscopy (FESEM), High-Resolution Transmission Electron Microscopy (HRTEM), and Atomic Force Microscopy (AFM)
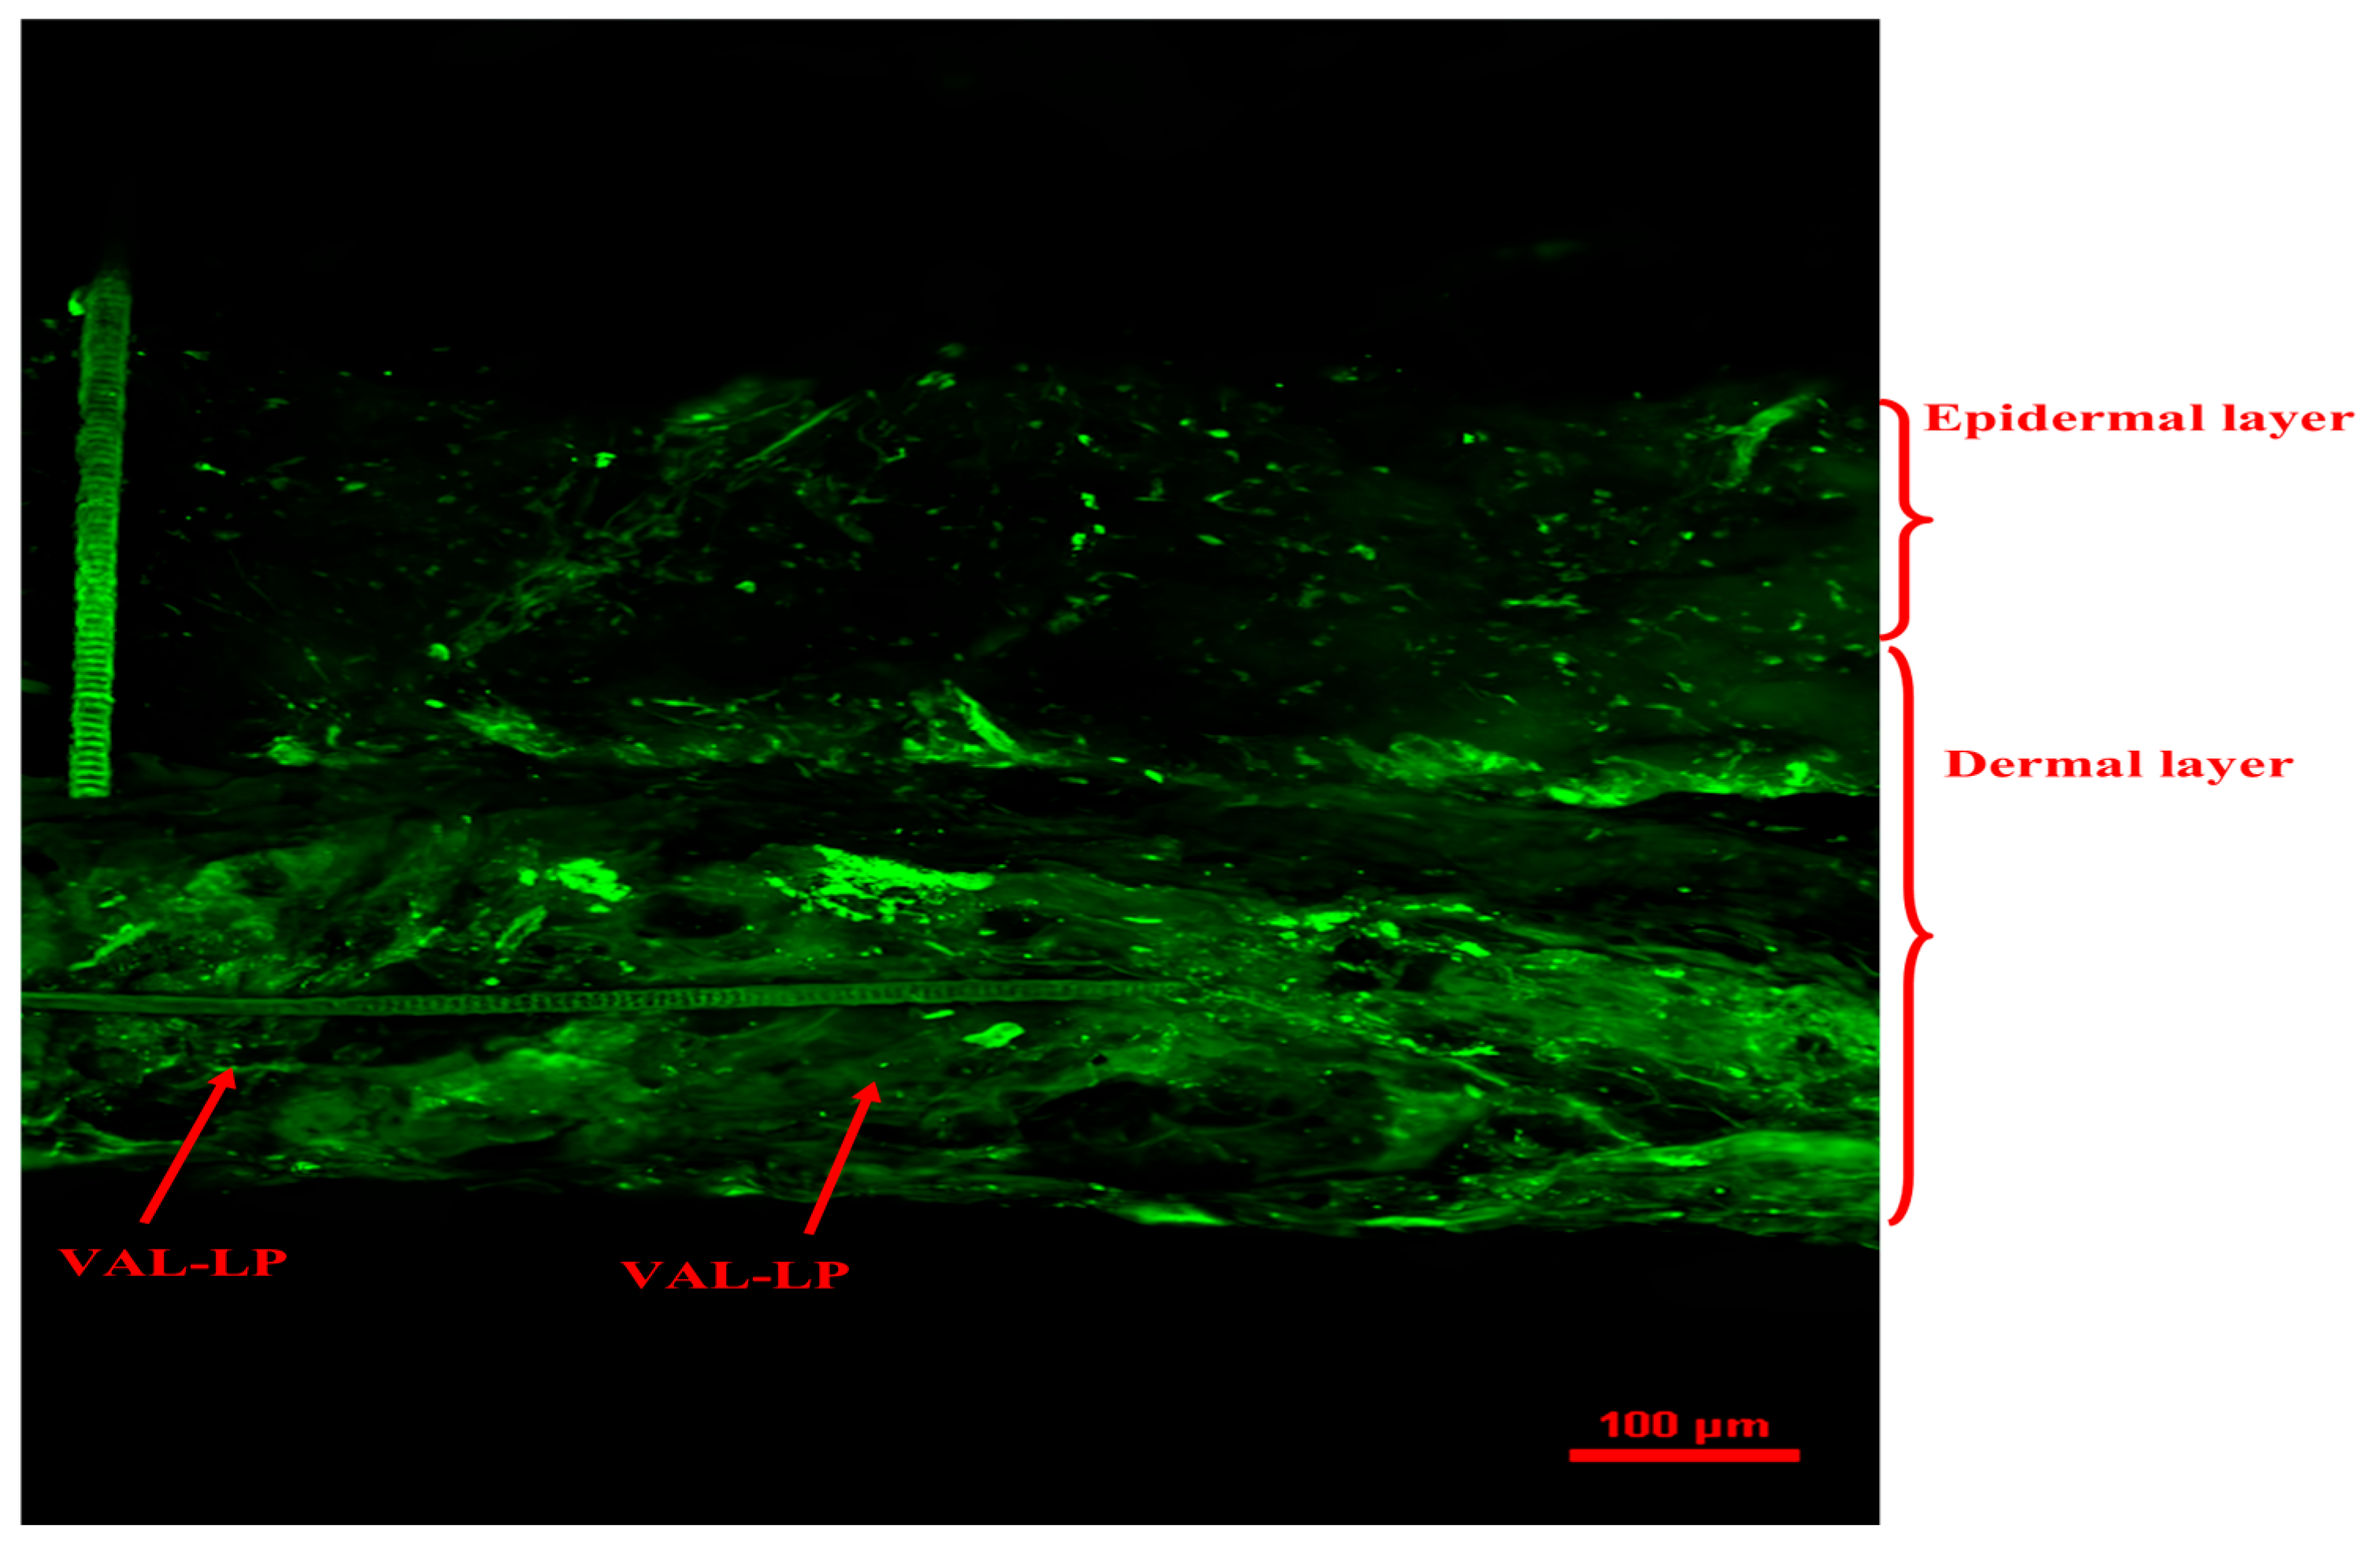
3.1.9. Confocal Laser Scanning Microscopy (CSLM)
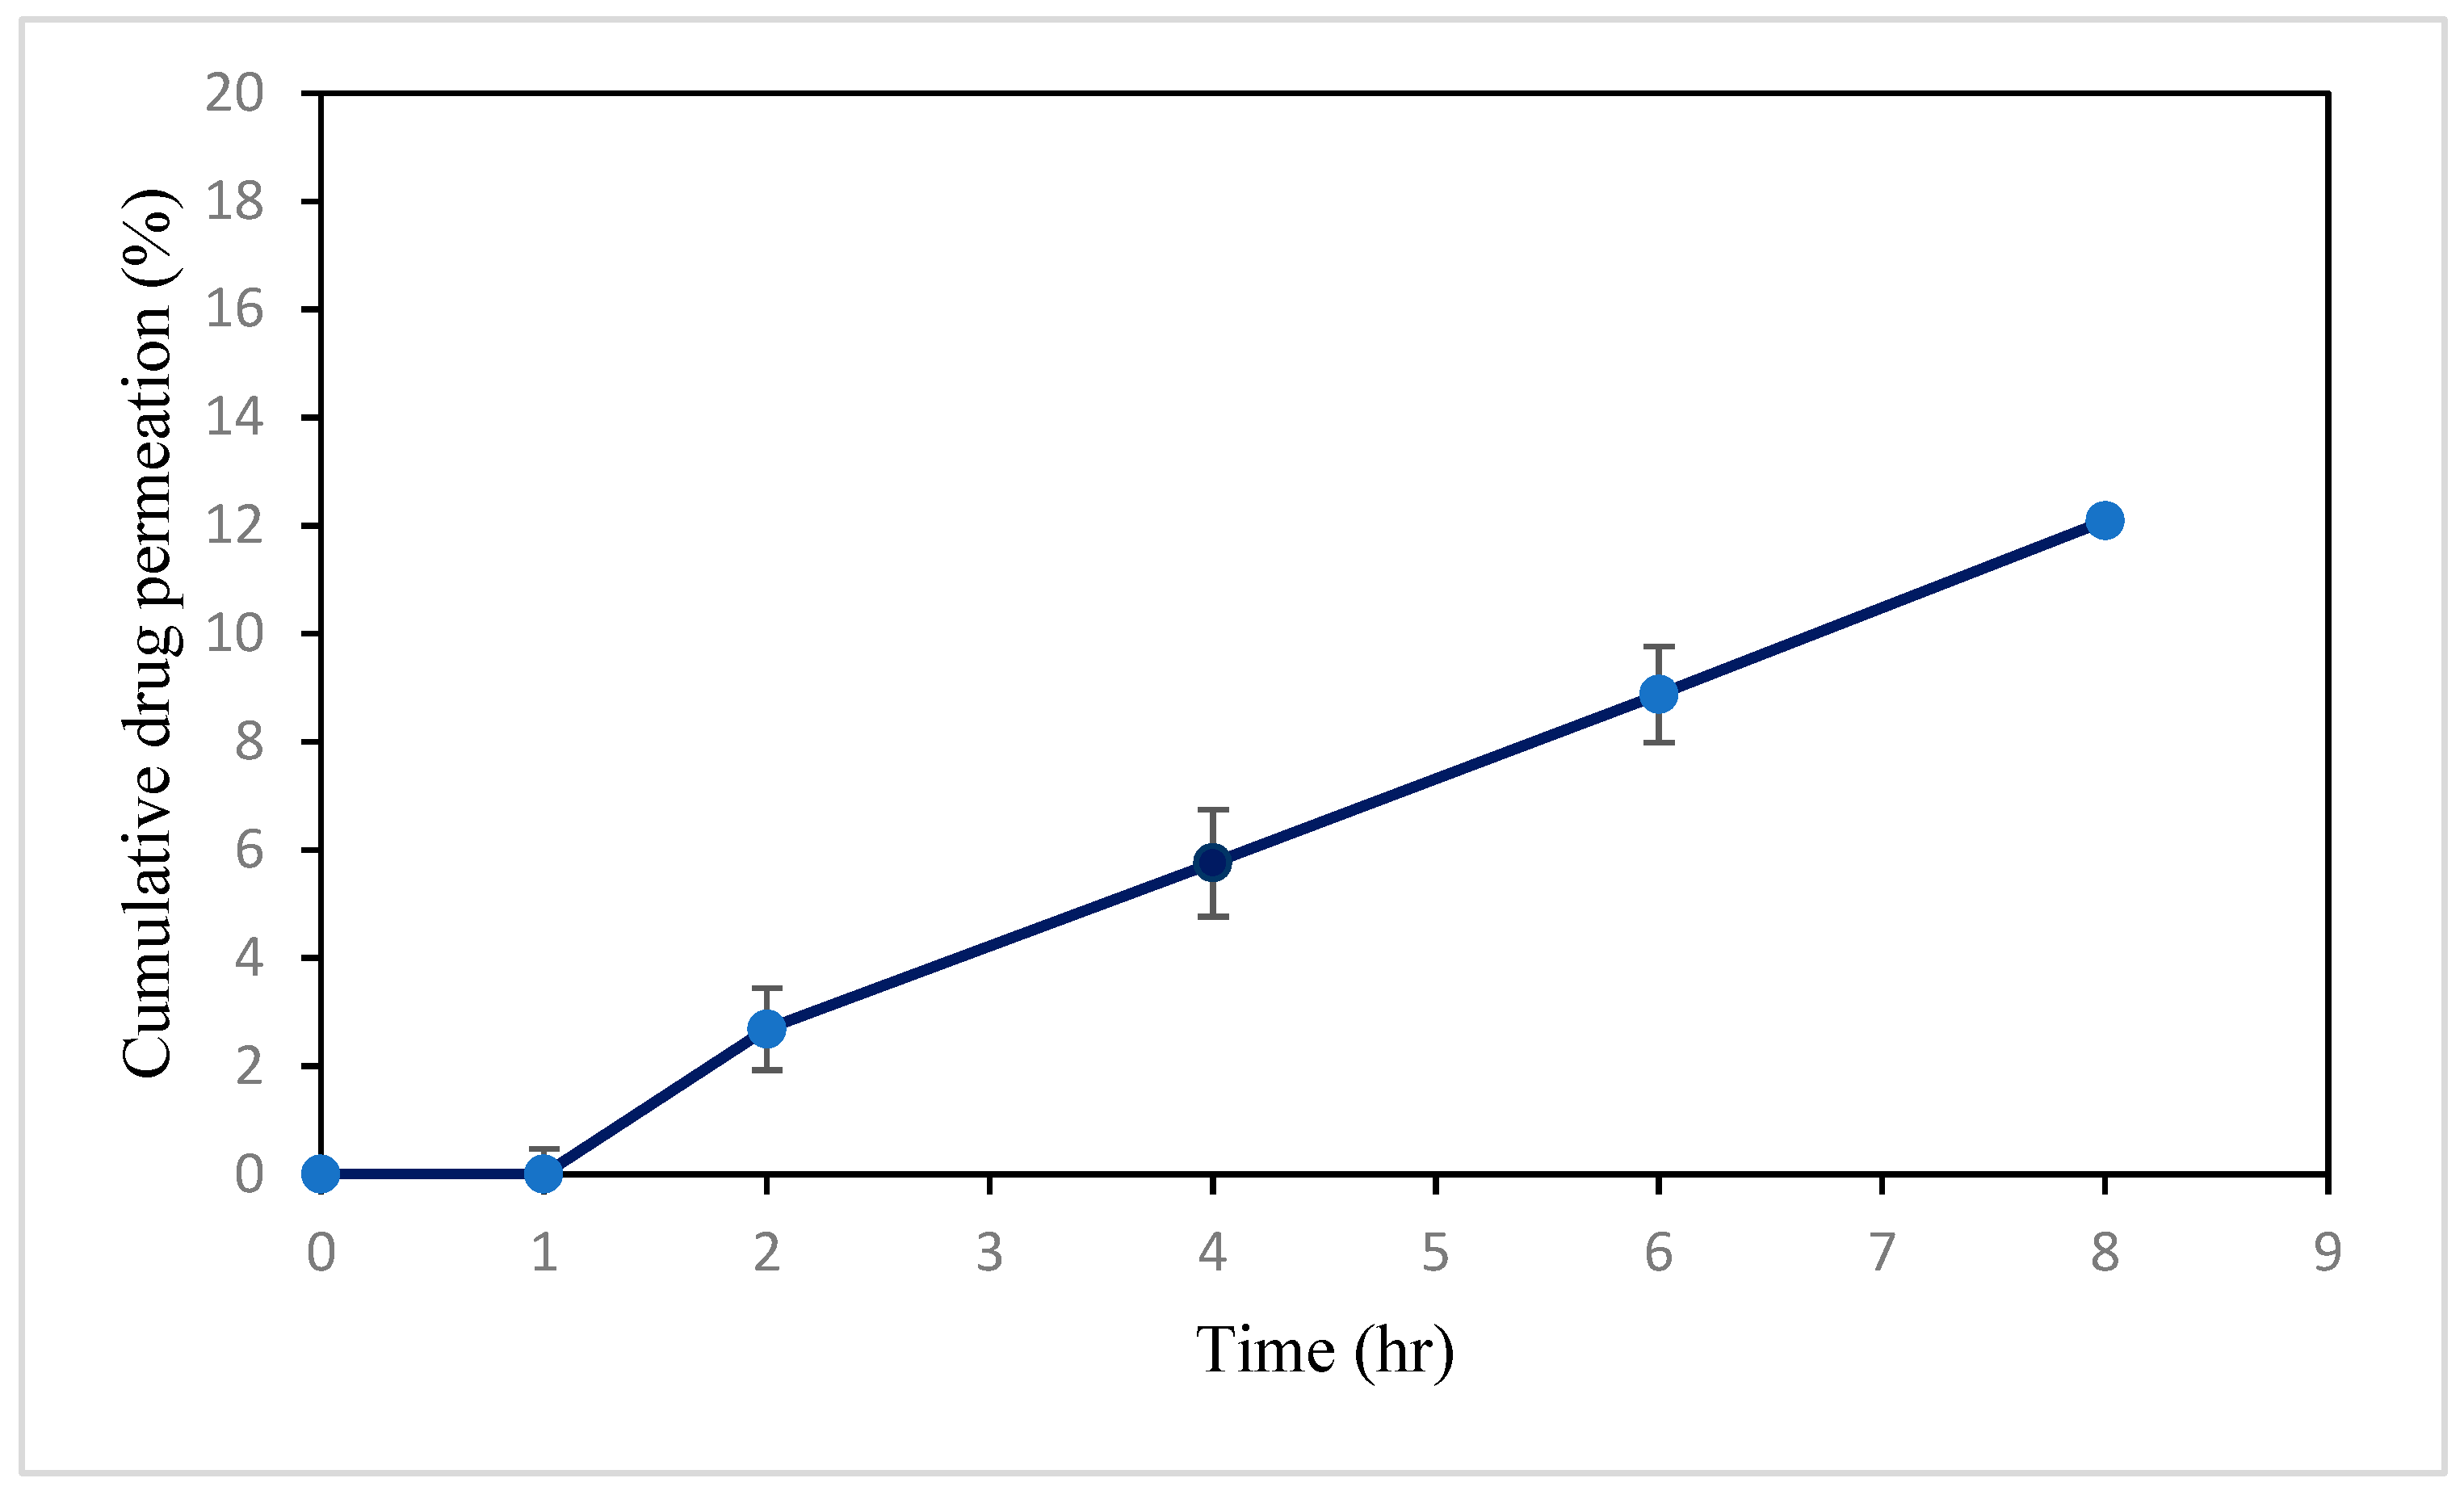
3.1.10. Ex Vivo Study of VAL-LP
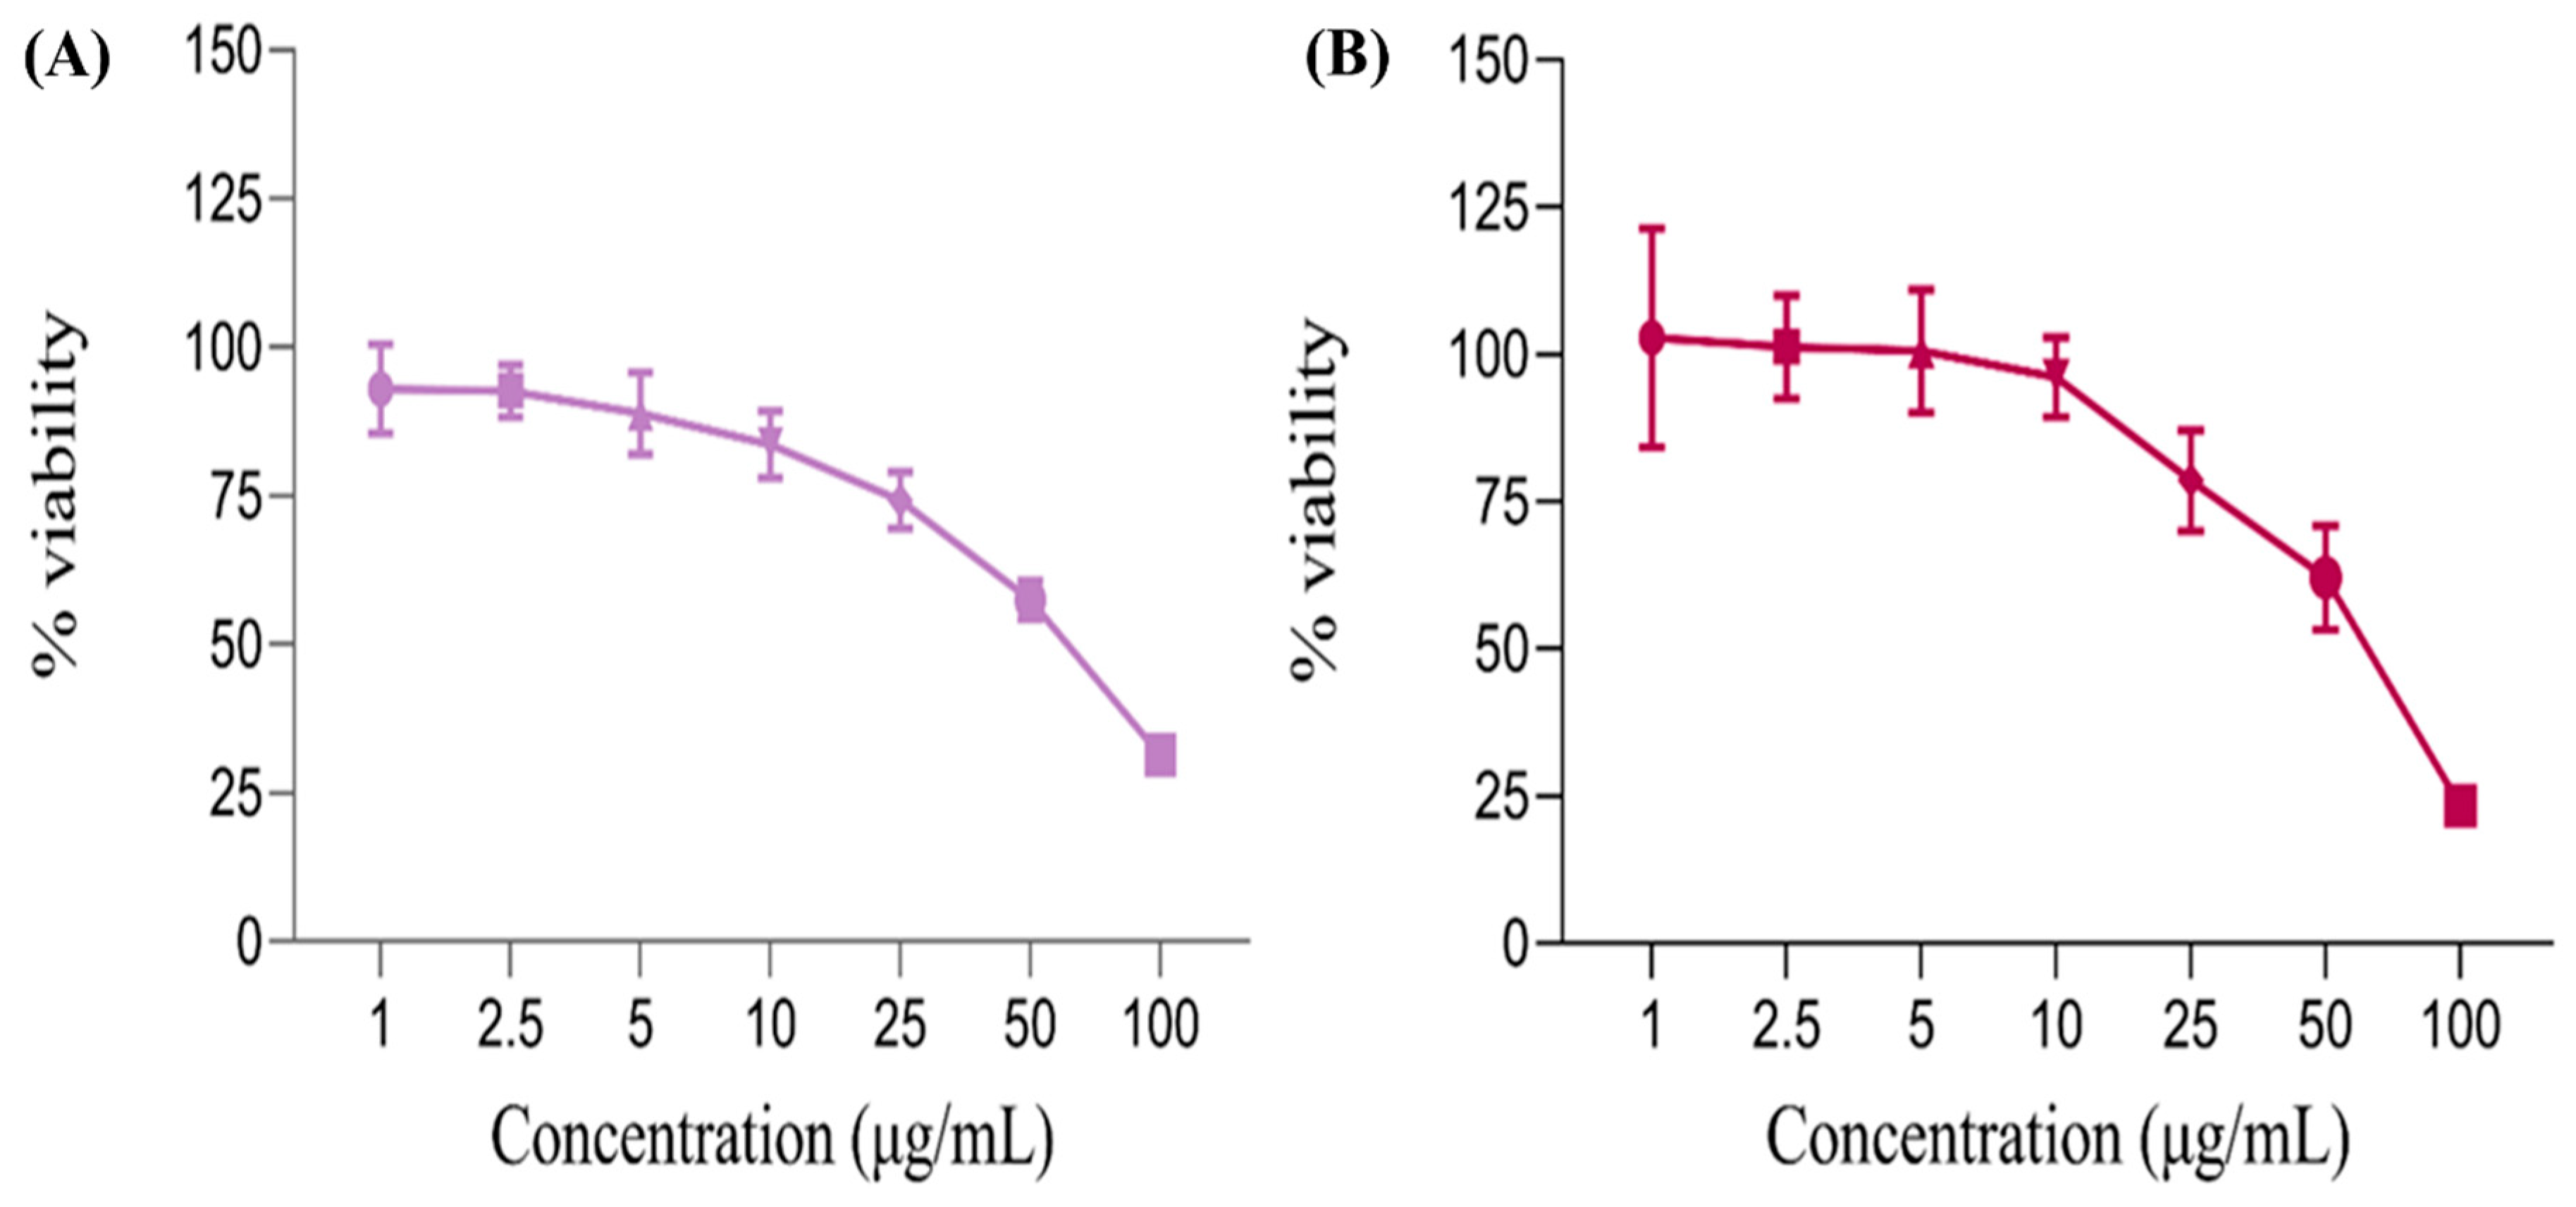
3.1.11. MTT Assay
3.2. Fabrication and Characterization of DMNs
3.2.1. Integration of Optimized VAL-LP Formulation into DMNs and Their Characterizations (VAL-LP-DMNs):
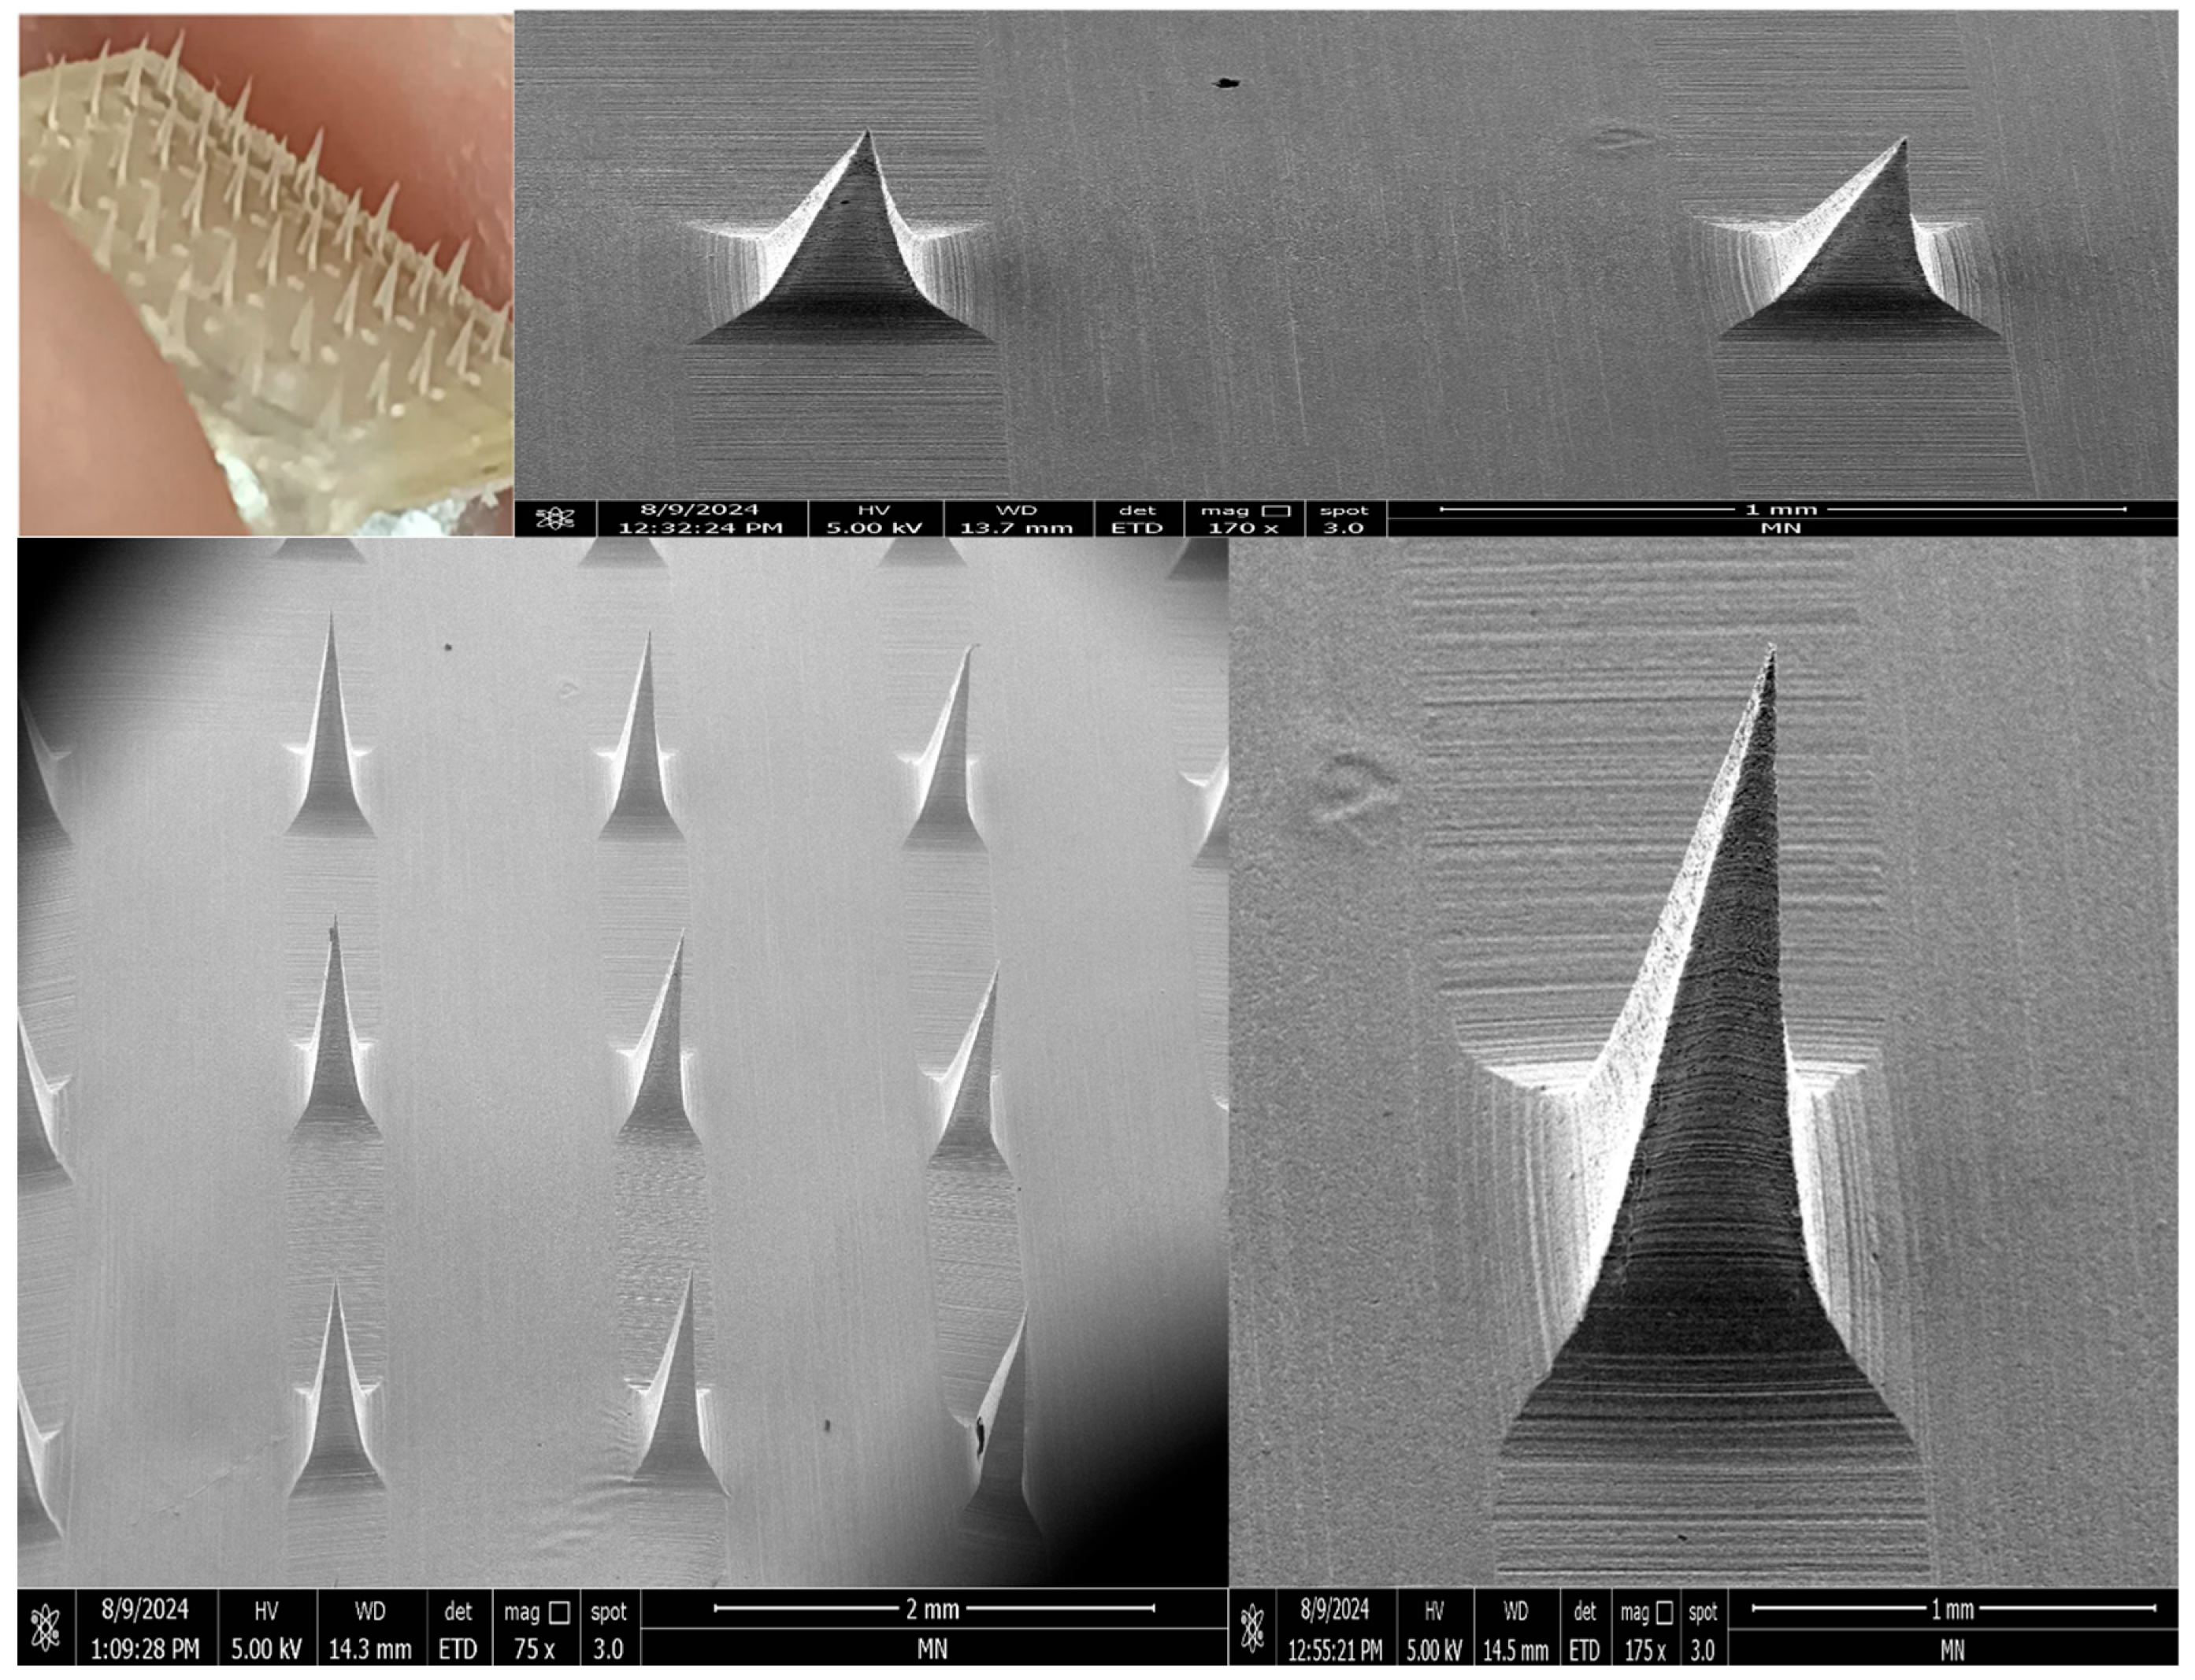
Morphology of VAL-LP-DMNs
Mechanical Strength of VAL-LP-DMNs
Insertion Capability of VAL-LP-DMNs
Dissolution of VAL-LP-DMNs
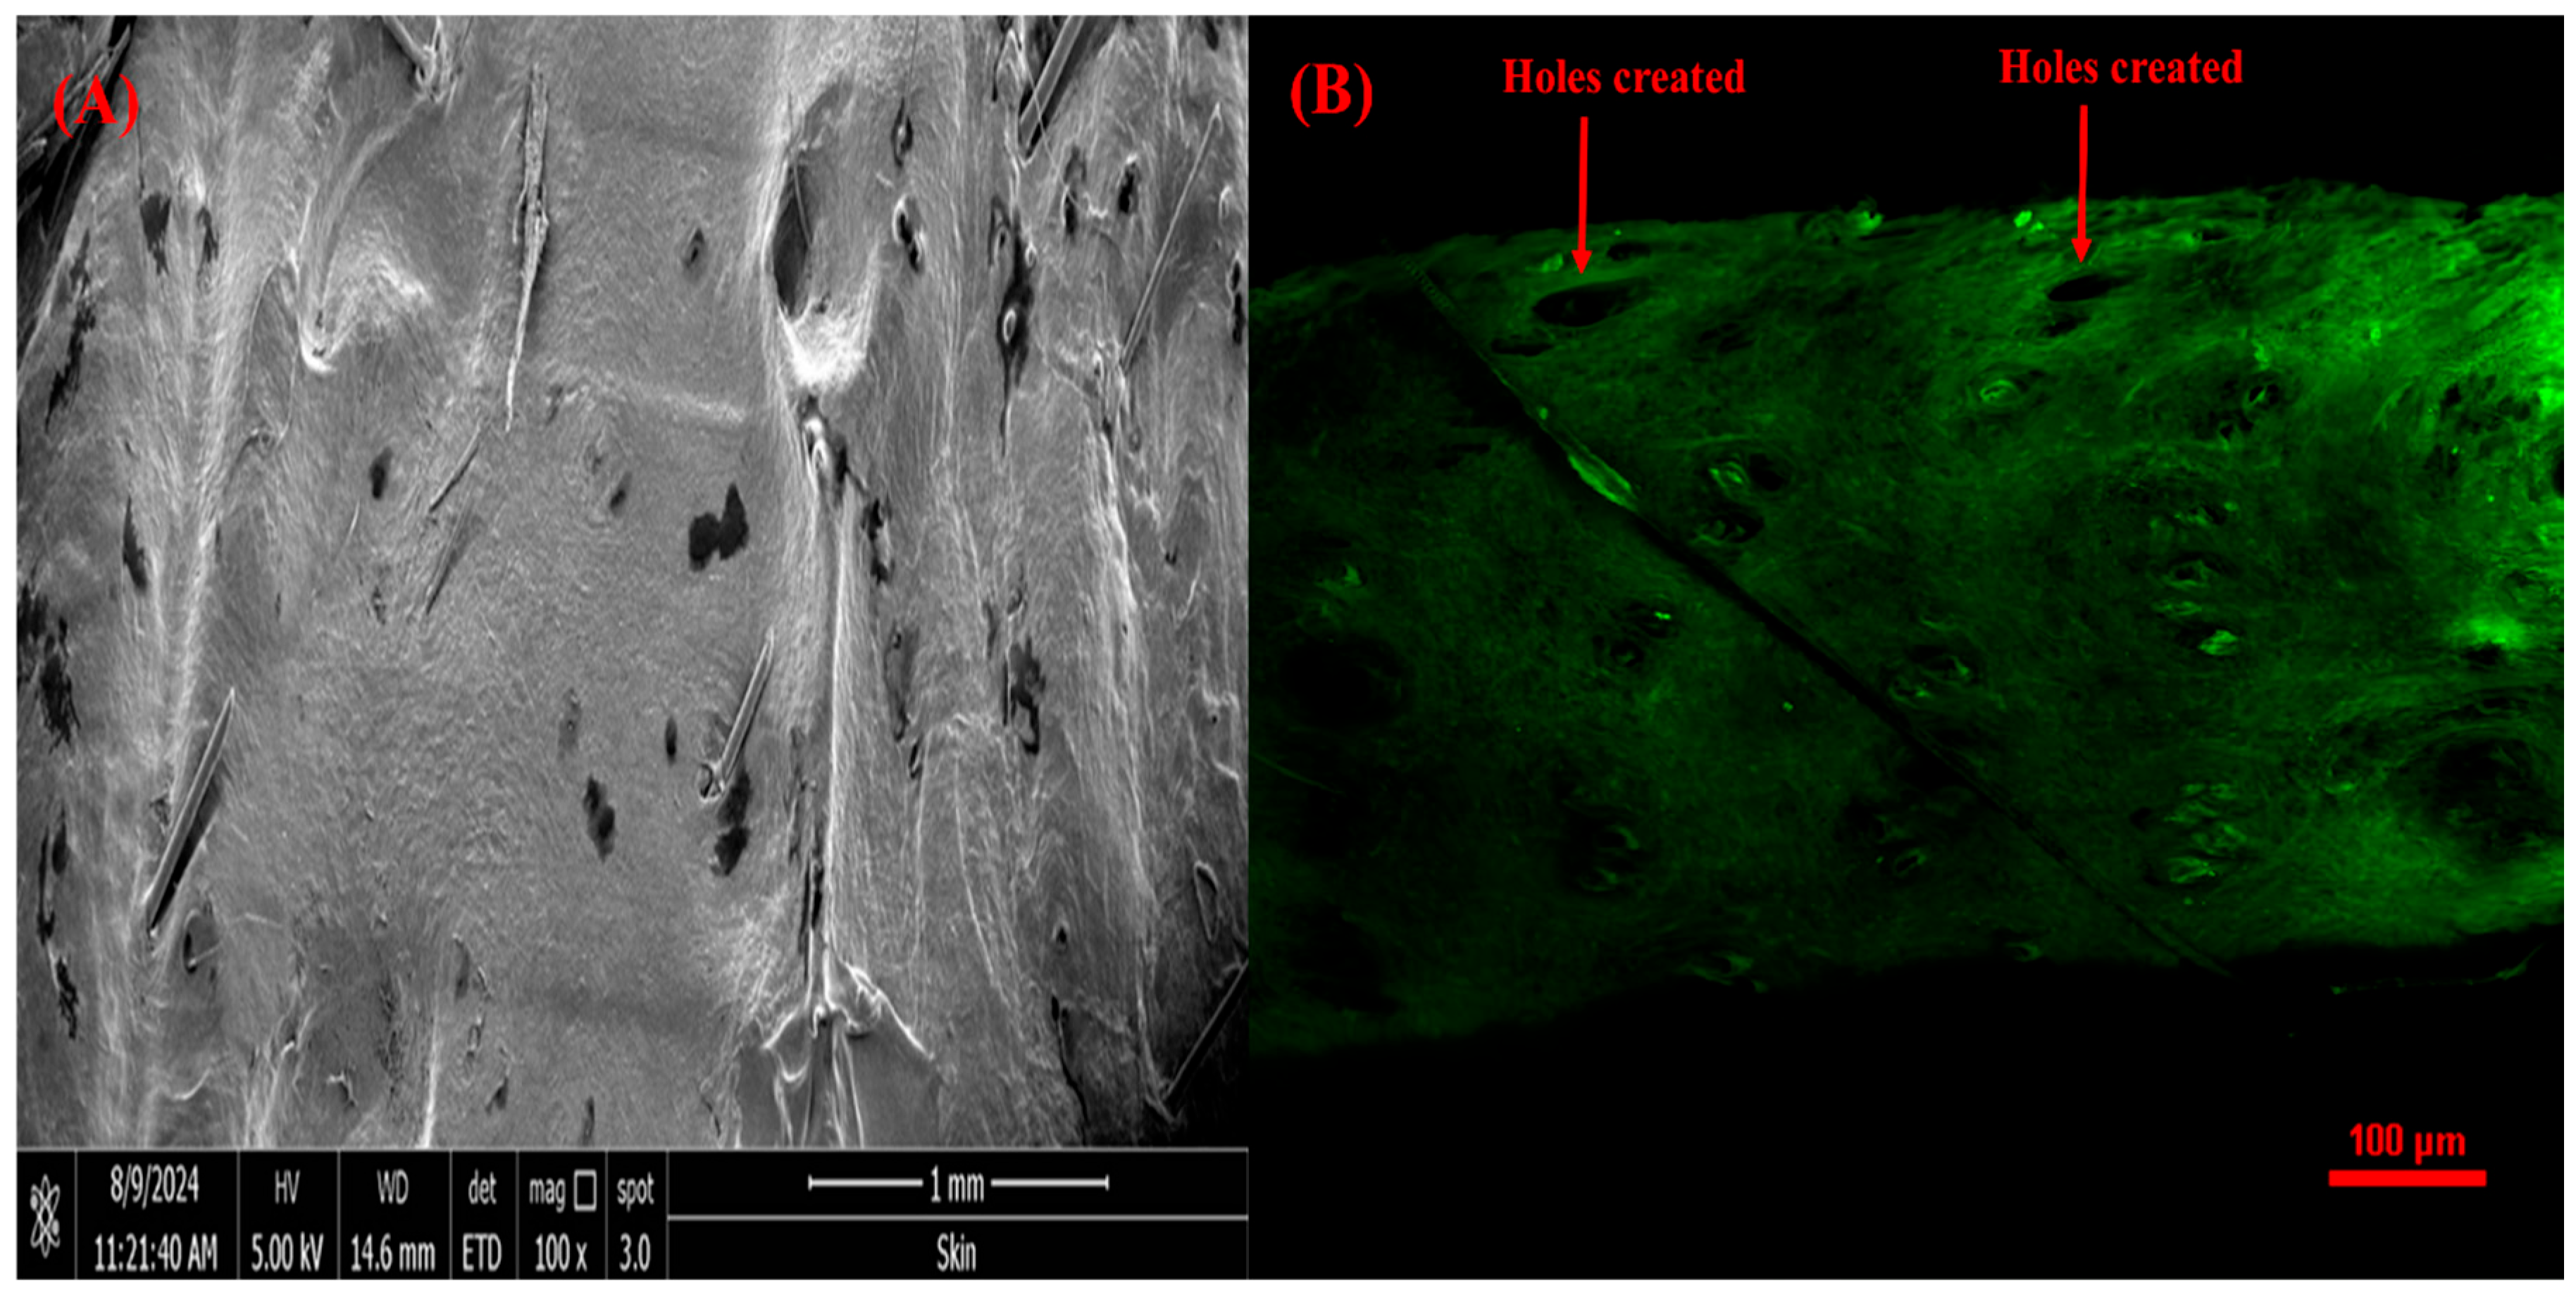
SEM and CSLM Analysis of Rat Skin Punctured with VAL-LP-DMNs
Drug Content in Optimized VAL-LP-DMNs
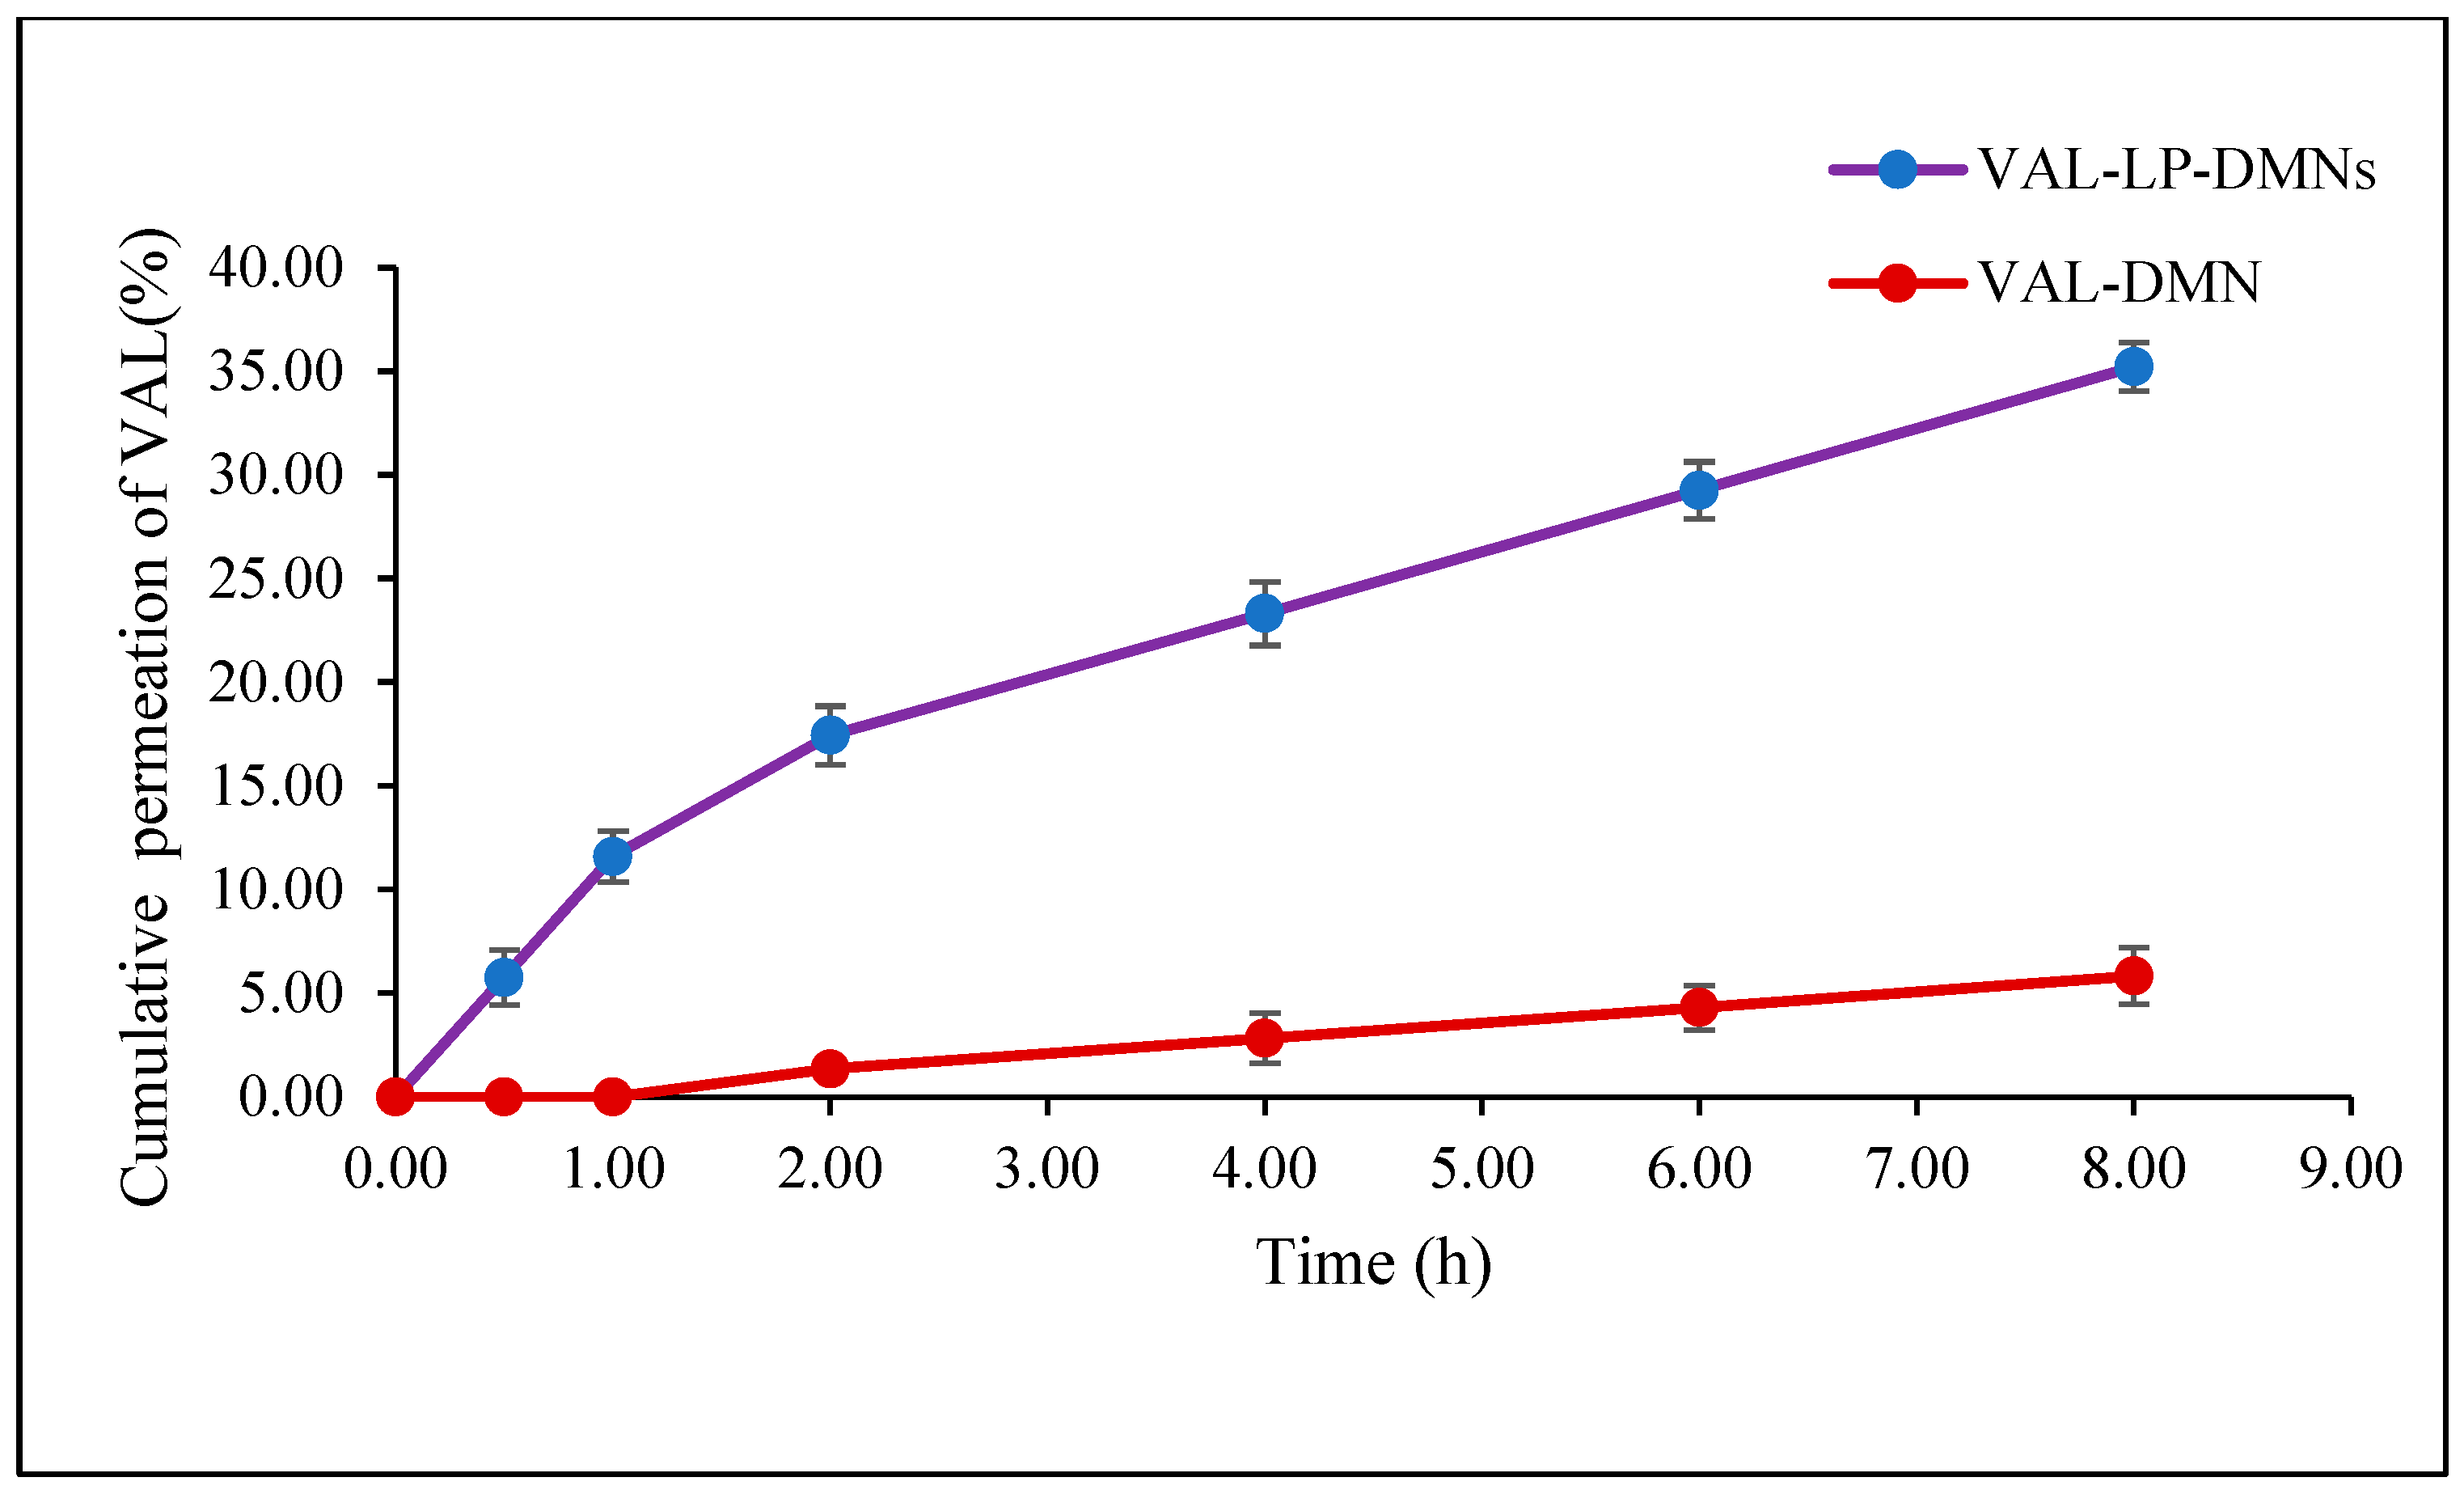
3.2.2. Ex Vivo Skin Permeation Study of VAL-LP-DMNs
4. Conclusions
Supplementary Materials
Author Contributions
Funding
Institutional Review Board Statement
Informed Consent Statement
Data Availability Statement
Acknowledgments
Conflicts of Interest
References
- Jeong, S.Y.; Park, J.H.; Lee, Y.S.; Kim, Y.S.; Park, J.Y.; Kim, S.Y. The current status of clinical research involving microneedles: A systematic review. Pharmaceutics 2020, 12, 1113. [Google Scholar] [CrossRef]
- Nasr, A.M.; Moftah, F.; Abourehab, M.A.; Gad, S. Design, Formulation, and Characterization of Valsartan Nanoethosomes for Improving Their Bioavailability. Pharmaceutics 2022, 14, 2268. [Google Scholar] [CrossRef] [PubMed]
- Anjani, Q.K.; Pandya, A.K.; Demartis, S.; Domínguez-Robles, J.; Moreno-Castellanos, N.; Li, H.; Gavini, E.; Patravale, V.B.; Donnelly, R.F. Liposome-loaded polymeric microneedles for enhanced skin deposition of rifampicin. Int. J. Pharm. 2023, 646, 123446. [Google Scholar] [PubMed]
- Guimarães, D.; Cavaco-Paulo, A.; Nogueira, E. Design of liposomes as drug delivery system for therapeutic applications. Int. J. Pharm. 2021, 601, 120571. [Google Scholar] [CrossRef] [PubMed]
- Balata, G.F.; Faisal, M.M.; Elghamry, H.A.; Sabry, S.A. Preparation and characterization of ivabradine HCl transfersomes for enhanced transdermal delivery. J. Drug Deliv. Sci. Technol. 2020, 60, 101921. [Google Scholar] [CrossRef]
- Mousa, I.A.; Hammady, T.M.; Gad, S.; Zaitone, S.A.; El-Sherbiny, M.; Sayed, O.M. Formulation and characterization of metformin-loaded ethosomes for topical application to experimentally induced skin cancer in mice. Pharmaceuticals 2022, 15, 657. [Google Scholar] [CrossRef]
- Karthikeyan, E.; Sivaneswari, S. Advancements in Transdermal Drug Delivery Systems: Enhancing Medicine with Pain-Free and Controlled Drug Release. Intell. Pharm. 2024; In Press. [Google Scholar]
- Gowda, B.J.; Ahmed, M.G.; Sahebkar, A.; Riadi, Y.; Shukla, R.; Kesharwani, P. Stimuli-responsive microneedles as a transdermal drug delivery system: A demand-supply strategy. Biomacromolecules 2022, 23, 1519–1544. [Google Scholar] [CrossRef]
- Khalid, R.; Mahmood, S.; Mohamed Sofian, Z.; Hilles, A.R.; Hashim, N.M.; Ge, Y. Microneedles and Their Application in Transdermal Delivery of Antihypertensive Drugs—A Review. Pharmaceutics 2023, 15, 2029. [Google Scholar] [CrossRef]
- Khater, A.J.; Almurisi, S.H.; Abdul-Halim, N.; Mahmood, S. Dissolving microneedle integrated with benidipine loaded ethosomes for transdermal delivery. Surf. Interfaces 2024, 52, 104903. [Google Scholar]
- Xie, J.; Zhu, X.; Wang, M.; Liu, C.; Ling, G.; Zhang, P. Dissolving microneedle-mediated transdermal delivery of flurbiprofen axetil-loaded pH-responsive liposomes for arthritis treatment. Chem. Eng. J. 2024, 482, 148840. [Google Scholar] [CrossRef]
- Du, H.; Liu, P.; Zhu, J.; Lan, J.; Li, Y.; Zhang, L.; Zhu, J.; Tao, J. Hyaluronic acid-based dissolving microneedle patch loaded with methotrexate for improved treatment of psoriasis. ACS Appl. Mater. Interfaces 2019, 11, 43588–43598. [Google Scholar]
- Fonseca, D.F.; Costa, P.C.; Almeida, I.F.; Dias-Pereira, P.; Correia-Sá, I.; Bastos, V.; Oliveira, H.; Duarte-Araújo, M.; Morato, M.; Vilela, C.; et al. Pullulan microneedle patches for the efficient transdermal administration of insulin envisioning diabetes treatment. Carbohydr. Polym. 2020, 241, 116314. [Google Scholar] [PubMed]
- Dave, R.; Shinde, S.; Kalayil, N.; Budar, A. Engineering microscopic delivery systems: A review of dissolving microneedle design, fabrication, and function. Micro Nano Syst. Lett. 2024, 12, 14. [Google Scholar]
- Dawud, H.; Ammar, A.A. Rapidly Dissolving Microneedles for the Delivery of Steroid-Loaded Nanoparticles Intended for the Treatment of Inflammatory Skin Diseases. Pharmaceutics 2023, 15, 526. [Google Scholar] [CrossRef] [PubMed]
- Kulkarni, D.; Gadade, D.; Chapaitkar, N.; Shelke, S.; Pekamwar, S.; Aher, R.; Ahire, A.; Avhale, M.; Badgule, R.; Bansode, R.; et al. Polymeric Microneedles: An Emerging Paradigm for Advanced Biomedical Applications. Sci. Pharm. 2023, 91, 27. [Google Scholar] [CrossRef]
- Tiraton, T.; Suwantong, O.; Chuysinuan, P.; Ekabutr, P.; Niamlang, P.; Khampieng, T.; Supaphol, P. Biodegradable microneedle fabricated from sodium alginate-gelatin for transdermal delivery of clindamycin. Mater. Today Commun. 2022, 32, 104158. [Google Scholar]
- Demir, Y.K.; Akan, Z.; Kerimoglu, O. Sodium alginate microneedle arrays mediate the transdermal delivery of bovine serum albumin. PLoS ONE 2013, 8, e63819. [Google Scholar] [CrossRef]
- Chandana, M.; Venkata Ramana, M.; Rama Rao, N. Formulation and evaluation of Valsartan solid lipid nanoparticles. J. Drug Deliv. Ther. 2021, 11, 103–108. [Google Scholar]
- Peddapalli, H.; Radha, G.V.; Chinnaiyan, S.K. Formulation optimization and PK/PD evaluation of novel valsartan bilosomes enhancing transdermal drug delivery. J. Drug Deliv. Sci. Technol. 2024, 92, 105400. [Google Scholar]
- Torres-Flores, G.; Gonzalez-Horta, A.; Vega-Cantu, Y.I.; Rodriguez, C.; Rodriguez-Garcia, A. Preparation and Characterization of Liposomal Everolimus by Thin-Film Hydration Technique. Adv. Polym. Technol. 2020, 2020, 5462949. [Google Scholar]
- Ahad, A.; Aqil, M.; Kohli, K.; Sultana, Y.; Mujeeb, M. Enhanced transdermal delivery of an anti-hypertensive agent via nanoethosomes: Statistical optimization, characterization and pharmacokinetic assessment. Int. J. Pharm. 2013, 443, 26–38. [Google Scholar] [PubMed]
- Mahmood, S.; Taher, M.; Mandal, U.K. Experimental design and optimization of raloxifene hydrochloride loaded nanotransfersomes for transdermal application. Int. J. Nanomed. 2014, 9, 4331–4346. [Google Scholar]
- Okafor, N.I.; Nkanga, C.I.; Walker, R.B.; Noundou, X.S.; Krause, R.W.M. Encapsulation and physicochemical evaluation of efavirenz in liposomes. J. Pharm. Investig. 2020, 50, 201–208. [Google Scholar]
- Kachave, R.N.; Mundhe, A.G. Development and validation of bioanalytical method for determination of nebivolol and valsartan in human plasma by using RP-HPLC. Eur. Pharm. J. 2021, 68, 49–58. [Google Scholar]
- Shah, H.; Madni, A.; Rahim, M.A.; Jan, N.; Khan, A.; Khan, S.; Jabar, A.; Ali, A. Fabrication, in vitro and ex vivo evaluation of proliposomes and liposomal derived gel for enhanced solubility and permeability of diacerein. PLoS ONE 2021, 16, e0258141. [Google Scholar]
- Aleskndrany, A.; Sahin, I. The effects of Levothyroxine on the structure and dynamics of DPPC liposome: FTIR and DSC studies. Biochim. Biophys. Acta (BBA)-Biomembr. 2020, 1862, 183245. [Google Scholar]
- Kumar, N.; Goindi, S. Development, characterization and preclinical evaluation of nanosized liposomes of itraconazole for topical application: 32 full factorial design to estimate the relationship between formulation components. J. Drug Deliv. Sci. Technol. 2021, 66, 102785. [Google Scholar]
- Altamimi, M.A.; Hussain, A.; Imam, S.S.; Alshehri, S.; Singh, S.K.; Webster, T.J. Transdermal delivery of isoniazid loaded elastic liposomes to control cutaneous and systemic tuberculosis. J. Drug Deliv. Sci. Technol. 2020, 59, 101848. [Google Scholar]
- Mahmood, S.; Mandal, U.K.; Chatterjee, B. Transdermal delivery of raloxifene HCl via ethosomal system: Formulation, advanced characterizations and pharmacokinetic evaluation. Int. J. Pharm. 2018, 542, 36–46. [Google Scholar]
- Wahyudiono; He, J.; Hu, X.; Machmudah, S.; Yasuda, K.; Takami, S.; Kanda, H.; Goto, M. Curcumin-loaded liposome preparation in ultrasound environment under pressurized carbon dioxide. Foods 2022, 11, 1469. [Google Scholar] [CrossRef]
- Vorselen, D.; Piontek, M.C.; Roos, W.H.; Wuite, G.J. Mechanical characterization of liposomes and extracellular vesicles, a protocol. Front. Mol. Biosci. 2020, 7, 139. [Google Scholar]
- Abd El-Alim, S.H.; Kassem, A.A.; Basha, M.; Salama, A. Comparative study of liposomes, ethosomes and transfersomes as carriers for enhancing the transdermal delivery of diflunisal: In vitro and in vivo evaluation. Int. J. Pharm. 2019, 563, 293–303. [Google Scholar] [PubMed]
- Ahad, A.; Aqil, M.; Kohli, K.; Sultana, Y.; Mujeeb, M. Design, formulation and optimization of valsartan transdermal gel containing iso-eucalyptol as novel permeation enhancer: Preclinical assessment of pharmacokinetics in Wistar albino rats. Expert Opin. Drug Deliv. 2014, 11, 1149–1162. [Google Scholar]
- Vaddi, H.K.; Ho, P.C.; Chan, S.Y. Terpenes in propylene glycol as skin-penetration enhancers: Permeation and partition of haloperidol, fourier transform infrared spectroscopy, and differential scanning calorimetry. J. Pharm. Sci. 2002, 91, 1639–1651. [Google Scholar] [PubMed]
- Tran, H.M.; Yang, C.Y.; Wu, T.H.; Yen, F.L. Liposomes Encapsulating Morin: Investigation of Physicochemical Properties, Dermal Absorption Improvement and Anti-Aging Activity in PM-Induced Keratinocytes. Antioxidants 2022, 11, 1183. [Google Scholar] [CrossRef]
- Yan, Q.; Weng, J.; Shen, S.; Wang, Y.; Fang, M.; Zheng, G.; Yang, Q.; Yang, G. Finite element analysis for biodegradable dissolving microneedle materials on skin puncture and mechanical performance evaluation. Polymers 2021, 13, 3043. [Google Scholar] [CrossRef]
- Demartis, S.; Anjani, Q.K.; Volpe-Zanutto, F.; Paredes, A.J.; Jahan, S.A.; Vora, L.K.; Donnelly, R.F.; Gavini, E. Trilayer dissolving polymeric microneedle array loading Rose Bengal transfersomes as a novel adjuvant in early-stage cutaneous melanoma management. Int. J. Pharm. 2022, 627, 122217. [Google Scholar]
- Alimardani, V.; Abolmaali, S.S.; Yousefi, G.; Nowroozzadeh, M.H.; Tamaddon, A.M. In-situ nanomicelle forming microneedles of poly NIPAAm-b-poly glutamic acid for trans-scleral delivery of dexamethasone. J. Ind. Eng. Chem. 2023, 119, 485–498. [Google Scholar]
- Larrañeta, E.; Lutton, R.E.; Woolfson, A.D.; Donnelly, R.F. Microneedle arrays as transdermal and intradermal drug delivery systems: Materials science, manufacture and commercial development. Mater. Sci. Eng. R Rep. 2016, 104, 1–32. [Google Scholar]
- Yang, H.; Wu, X.; Zhou, Z.; Chen, X.; Kong, M. Enhanced transdermal lymphatic delivery of doxorubicin via hyaluronic acid based transfersomes/microneedle complex for tumor metastasis therapy. Int. J. Biol. Macromol. 2019, 125, 9–16. [Google Scholar]
- Ito, Y.; Kobuchi, S.; Inoue, G.; Kakumu, E.; Aoki, M.; Sakaeda, T.; Takada, K. Dissolving microneedles for enhanced local delivery of capsaicin to rat skin tissue. J. Drug Target. 2017, 25, 420–424. [Google Scholar] [CrossRef] [PubMed]
- De Martino, S.; Battisti, M.; Napolitano, F.; Palladino, A.; Serpico, L.; Amendola, E.; Martone, A.; De Girolamo, P.; Squillace, A.; Dardano, P.; et al. Effect of microneedles shape on skin penetration and transdermal drug administration. Biomater. Adv. 2022, 142, 213169. [Google Scholar]
- Zhang, L.; Guo, R.; Wang, S.; Yang, X.; Ling, G.; Zhang, P. Fabrication, evaluation and applications of dissolving microneedles. Int. J. Pharm. 2021, 604, 120749. [Google Scholar] [CrossRef] [PubMed]
- Mohammed, M.I.; Makky, A.M.; Teaima, M.H.; Abdellatif, M.M.; Hamzawy, M.A.; Khalil, M.A. Transdermal delivery of vancomycin hydrochloride using combination of nano-ethosomes and iontophoresis: In vitro and in vivo study. Drug Deliv. 2016, 23, 1558–1564. [Google Scholar]
- Von Zuben, E.D.S.; Eloy, J.O.; Araujo, V.H.S.; Gremião, M.P.D.; Chorilli, M. Insulin-loaded liposomes functionalized with cell-penetrating peptides: Influence on drug release and permeation through porcine nasal mucosa. Colloids Surf. A Physicochem. Eng. Asp. 2021, 622, 126624. [Google Scholar]
- Guillot, A.J.; Martínez-Navarrete, M.; Garrigues, T.M.; Melero, A. Skin drug delivery using lipid vesicles: A starting guideline for their development. J. Control. Release 2023, 355, 624–654. [Google Scholar] [CrossRef]
- Nava, G.; Piñón, E.; Mendoza, L.; Mendoza, N.; Quintanar, D.; Ganem, A. Formulation and in vitro, ex vivo and in vivo evaluation of elastic liposomes for transdermal delivery of ketorolac tromethamine. Pharmaceutics 2011, 3, 954–970. [Google Scholar] [CrossRef]
- Shaker, S.; Gardouh, A.R.; Ghorab, M.M. Factors affecting liposomes particle size prepared by ethanol injection method. Res. Pharm. Sci. 2017, 12, 346–352. [Google Scholar] [CrossRef]
- Taghizadeh, S.M.; Bajgholi, S. A new liposomal-drug-in-adhesive patch for transdermal delivery of sodium diclofenac. J. Biomater. Nanobiotechnol. 2011, 2, 576. [Google Scholar] [CrossRef]
- Ahmed, T.A. Preparation of transfersomes encapsulating sildenafil aimed for transdermal drug delivery: Plackett–Burman design and characterization. J. Liposome Res. 2015, 25, 1–10. [Google Scholar] [CrossRef]
- Danaei, M.R.M.M.; Dehghankhold, M.; Ataei, S.; Hasanzadeh Davarani, F.; Javanmard, R.; Dokhani, A.; Khorasani, S.; Mozafari, M.R. Impact of particle size and polydispersity index on the clinical applications of lipidic nanocarrier systems. Pharmaceutics 2018, 10, 57. [Google Scholar] [CrossRef] [PubMed]
- Dai, W.; Zhang, D.; Duan, C.; Jia, L.; Wang, Y.; Feng, F.; Zhang, Q. Preparation and characteristics of oridonin-loaded nanostructured lipid carriers as a controlled-release delivery system. J. Microencapsul. 2010, 27, 234–241. [Google Scholar] [PubMed]
- Chibowski, E.; Szcześ, A. Zeta potential and surface charge of DPPC and DOPC liposomes in the presence of PLC enzyme. Adsorption 2016, 22, 755–765. [Google Scholar]
- Khosa, A.; Reddi, S.; Saha, R.N. Nanostructured lipid carriers for site-specific drug delivery. Biomed. Pharmacother. 2018, 103, 598–613. [Google Scholar]
- Gupta, H.; Aqil, M.; Khar, R.K.; Ali, A.; Bhatnagar, A.; Mittal, G. Sparfloxacin-loaded PLGA nanoparticles for sustained ocular drug delivery. Nanomed. Nanotechnol. Biol. Med. 2010, 6, 324–333. [Google Scholar]
- Zhang, D.; Chen, L.; Zhao, Y.; Ni, H.; Quan, Q.; Ma, J.; Guo, L. As1411-modified liposomes to enhance drug utilization and augment the anti-tumor efficacy. Cancer Nanotechnol. 2024, 15, 25. [Google Scholar]
- Gupta, T.; Nema, P.; Soni, S.; Yadav, V.; Jain, S.; Soni, V. Preparation and in vitro evaluation of BBG-250 loaded liposomal formulation for anticancer potential. Future J. Pharm. Sci. 2024, 10, 19. [Google Scholar]
- Trotta, M.; Peira, E.; Carlotti, M.E.; Gallarate, M. Deformable liposomes for dermal administration of methotrexate. Int. J. Pharm. 2004, 270, 119–125. [Google Scholar]
- Sabry, S.A.; Abd El Razek, A.M.; Nabil, M.; Khedr, S.M.; El-Nahas, H.M.; Eissa, N.G. Brain-targeted delivery of Valsartan using solid lipid nanoparticles labeled with Rhodamine B; a promising technique for mitigating the negative effects of stroke. Drug Deliv. 2023, 30, 2179127. [Google Scholar]
- Ning, M.Y.; Guo, Y.Z.; Pan, H.Z.; Yu, H.M.; Gu, Z.W. Preparation and evaluation of proliposomes containing clotrimazole. Chem. Pharm. Bull. 2005, 53, 620–624. [Google Scholar]
- Nekkanti, V.; Wang, Z.; Betageri, G.V. Pharmacokinetic evaluation of improved oral bioavailability of valsartan: Proliposomes versus self-nanoemulsifying drug delivery system. AAPS PharmSciTech 2016, 17, 851–862. [Google Scholar] [CrossRef] [PubMed]
- Ahad, A.; Aqil, M.; Kohli, K.; Sultana, Y.; Mujeeb, M.; Ali, A. Formulation and optimization of nanotransfersomes using experimental design technique for accentuated transdermal delivery of valsartan. Nanomed. Nanotechnol. Biol. Med. 2012, 8, 237–249. [Google Scholar]
- Gupta, B.; Poudel, B.K.; Pathak, S.; Tak, J.W.; Lee, H.H.; Jeong, J.-H.; Choi, H.-G.; Yong, C.S.; Kim, J.O. Effects of formulation variables on the particle size and drug encapsulation of imatinib-loaded solid lipid nanoparticles. Aaps Pharmscitech 2016, 17, 652–662. [Google Scholar]
- Lewis, R.N.; Mannock, D.A.; McElhaney, R.N. Differential scanning calorimetry in the study of lipid phase transitions in model and biological membranes: Practical considerations. Methods Membr. Lipids 2007, 400, 171–195. [Google Scholar]
- Zhao, L.; Feng, S.S. Effects of cholesterol component on molecular interactions between paclitaxel and phospholipid within the lipid monolayer at the air–water interface. J. Colloid Interface Sci. 2006, 300, 314–326. [Google Scholar]
- Chatterjee, B.; Reddy, A.; Santra, M.; Khamanga, S. Amorphization of drugs for transdermal delivery-a recent update. Pharmaceutics 2022, 14, 983. [Google Scholar] [CrossRef]
- Shariare, M.H.; Khan, M.A.; Al-Masum, A.; Khan, J.H.; Uddin, J.; Kazi, M. Development of stable liposomal drug delivery system of thymoquinone and its in vitro anticancer studies using breast cancer and cervical cancer cell lines. Molecules 2022, 27, 6744. [Google Scholar] [CrossRef]
- Shashidhar, G.M.; Manohar, B. Nanocharacterization of liposomes for the encapsulation of water soluble compounds from Cordyceps sinensis CS1197 by a supercritical gas anti-solvent technique. RSC Adv. 2018, 8, 34634–34649. [Google Scholar]
- Jayachandran, P.; Ilango, S.; Suseela, V.; Nirmaladevi, R.; Shaik, M.R.; Khan, M.; Khan, M.; Shaik, B. Green synthesized silver nanoparticle-loaded liposome-based nanoarchitectonics for cancer management: In vitro drug release analysis. Biomedicines 2023, 11, 217. [Google Scholar] [CrossRef]
- Hajba-Horváth, E.; Biró, E.; Mirankó, M.; Fodor-Kardos, A.; Trif, L.; Feczkó, T. Preparation and in vitro characterization of valsartan-loaded ethyl cellulose and poly(methyl methacrylate) nanoparticles. RSC Adv. 2020, 10, 43915–43926. [Google Scholar]
- Singh, S.K.; Vuddanda, P.R.; Singh, S.; Srivastava, A.K. A Comparison between Use of Spray and Freeze Drying Techniques for Preparation of Solid Self-Microemulsifying Formulation of Valsartan and In Vitro and In Vivo Evaluation. BioMed Res. Int. 2013, 2013, 909045. [Google Scholar] [CrossRef] [PubMed]
- Dhavale, R.P.; Nadaf, S.J.; Bhatia, M.S. Quantitative structure property relationship assisted development of Fluocinolone acetonide loaded transfersomes for targeted delivery. J. Drug Deliv. Sci. Technol. 2021, 65, 102758. [Google Scholar] [CrossRef]
- Mahmood, S.; Chatterjee, B.; Mandal, U.K. Pharmacokinetic evaluation of the synergistic effect of raloxifene loaded transfersomes for transdermal delivery. J. Drug Deliv. Sci. Technol. 2021, 63, 102545. [Google Scholar] [CrossRef]
- Mahmood, S.; Mandal, U.K. Morphological characterization of lipid structured nanoparticles by atomic force microscopy while minimizing the formation of failed artefacts. Curr. Nanomater. 2017, 2, 24–32. [Google Scholar] [CrossRef]
- Kateh Shamshiri, M.; Momtazi-Borojeni, A.A.; Khodabandeh Shahraky, M.; Rahimi, F. Lecithin soybean phospholipid nano-transfersomes as potential carriers for transdermal delivery of the human growth hormone. J. Cell. Biochem. 2019, 120, 9023–9033. [Google Scholar] [CrossRef]
- Torres Di Bello, D.; Narváez, D.M.; Groot de Restrepo, H.; Vives, M.J. Cytotoxic Evaluation in HaCaT Cells of the Pa. 7 Bacteriophage from Cutibacterium (Propionibacterium) acnes, Free and Encapsulated Within Liposomes. Phage 2023, 4, 26–34. [Google Scholar] [CrossRef]
- Zhang, Y.-T.; Zhang, K.; Li, Z.; Zhang, H.-Y.; Guo, T.; Li, Y.-Y.; Zhao, J.-H.; Feng, N.-P. DOC-LS, a new liposome for dermal delivery, and its endocytosis by HaCaT and CCC-ESF-1 cells. IET Nanobiotechnol. 2018, 12, 1037–1041. [Google Scholar] [CrossRef]
- Fakhraei Lahiji, S.; Jang, Y.; Huh, I.; Yang, H.; Jang, M.; Jung, H. Exendin-4–encapsulated dissolving microneedle arrays for efficient treatment of type 2 diabetes. Sci. Rep. 2018, 8, 1170. [Google Scholar] [CrossRef]
- Prausnitz, M.R. Langer, Robert, Transdermal drug delivery. Nat. Biotechnol. 2008, 26, 1261–1268. [Google Scholar] [CrossRef]
- Bauleth-Ramos, T.; El-Sayed, N.; Fontana, F.; Lobita, M.; Shahbazi, M.A.; Santos, H.A. Recent approaches for enhancing the performance of dissolving microneedles in drug delivery applications. Mater. Today 2023, 63, 239–287. [Google Scholar] [CrossRef]
- Ali, M.; Namjoshi, S.; Benson, H.A.; Mohammed, Y.; Kumeria, T. Dissolvable polymer microneedles for drug delivery and diagnostics. J. Control. Release 2022, 347, 561–589. [Google Scholar] [PubMed]
- Shen, S.; Zheng, X.; Dong, X.; Fang, M.; Wan, A.; Zhu, T.; Yang, Q.; Xie, J.; Yan, Q. Methotrexate-loaded hyaluronan-modified liposomes integrated into dissolving microneedles for the treatment of psoriasis. Eur. J. Pharm. Sci. 2024, 195, 106711. [Google Scholar] [PubMed]
- Sala, M.; Miladi, K.; Agusti, G.; Elaissari, A.; Fessi, H. Preparation of liposomes: A comparative study between the double solvent displacement and the conventional ethanol injection—From laboratory scale to large scale. Colloids Surf. A Physicochem. Eng. Asp. 2017, 524, 71–78. [Google Scholar]
- Salimi, A.; Ghobadian, H.; Sharif Makhmalzadeh, B. Dermal pharmacokinetics of rivastigmine-loaded liposomes: An ex vivo–in vivo correlation study. J. Liposome Res. 2021, 31, 246–254. [Google Scholar]
- Zhou, P.; Chen, C.; Yue, X.; Zhang, J.; Huang, C.; Zhao, S.; Wu, A.; Li, X.; Qu, Y.; Zhang, C. Strategy for osteoarthritis therapy: Improved the delivery of triptolide using liposome-loaded dissolving microneedle arrays. Int. J. Pharm. 2021, 609, 121211. [Google Scholar]


| Factors | Levels Employed in BBD | ||
|---|---|---|---|
| Low Level (−1) | Medium Level (0) | High Level (+1) | |
| Specified independent variables for BBD | |||
| A = Lipoid P100 (mg) | 150 | 225 | 300 |
| B = sonication (s) | 60 | 120 | 180 |
| C = valsartan (mg) | 15 | 22.5 | 30 |
| Specified dependent variables for BBD | |||
| Y1 = particle size of vesicles (nm) | |||
| Y2 = ZP (mV) | |||
| Y3 = EE (%) | |||
| VAL-LP Formulations Design | Independent Variables for BBD | Dependent Variables for BBD | ||||
|---|---|---|---|---|---|---|
| A (mg) | B (s) | C (mg) | Y1 (nm) | Y2 (mV) | Y3 (%) | |
| VAL-LP D1 | 0 [225] | +1 [180] | −1 [15] | 288.9 (1.01) | −21.4 (0.35) | 99.85 (0.02) |
| VAL-LP D2 | −1 [150] | −1 [60] | 0 [22.5] | 128.9 (0.01) | −21.6 (0.41) | 89.06 (0.05) |
| VAL-LP D3 | 0 [225] | −1 [60] | −1 [15] | 240.9 (0.91) | −21.3 (0.26) | 99.85 (0.07) |
| VAL-LP D4 | 0 [225] | +1 [180] | +1 [30] | 269.4 (1.60) | −18.0 (0.18) | 91.65 (0.01) |
| VAL-LP D5 | +1 [300] | 0 [120] | +1 [30] | 294.7 (1.01) | −17.2 (0.40) | 96.46 (0.03) |
| VAL-LP D6 | −1 [150] | 0 [120] | −1 [15] | 148.2 (0.58) | −21.9 (0.20) | 95.12 (0.08) |
| VAL-LP D7∗ | 0 [225] | 0 [120] | 0 [22.5] | 249.4 (0.95) | −23.3 (0.50) | 97.91 (0.04) |
| VAL-LP D8 | +1 [300] | +1 [180] | 0 [22.5] | 246.4 (0.25) | −18.3 (0.25) | 98.56 (0.25) |
| VAL-LP D9 | +1 [300] | 0 [120] | −1 [15] | 226.9 (0.18) | −20.2 (0.75) | 98.62 (0.03) |
| VAL-LP D10∗ | 0 [225] | 0 [120] | 0 [22.5] | 257.4 (0.58) | −23.9 (0.50) | 97.69 (0.11) |
| VAL-LP D11 | 0 [225] | −1[60] | +1 [30] | 291.6 (0.79) | −20.6 (0.46) | 94.56 (0.21) |
| VAL-LP D12∗ | 0 [225] | 0 [120] | 0 [22.5] | 244.3 (1.42) | −24.4 (0.75) | 97.98 (0.08) |
| VAL-LP D13 | −1 [150] | +1 [180] | 0 [22.5] | 127.4 (1.01) | −20.9 (0.46) | 86.8 (0.05) |
| VAL-LP D14 | +1 [300] | −1 [60] | 0 [22.5] | 295.4 (0.31) | −17.6 (0.40) | 98.56 (0.31) |
| VAL-LP D15∗ | 0 [225] | 0 [120] | 0 [22.5] | 252.8 (0.81) | −22.3 (0.23) | 96.00 (0.01) |
| VAL-LP D16 | −1 [150] | 0 [120] | +1 [30] | 132.0 (0.25) | −25.9 (0.75) | 84.00 (0.05) |
| VAL-LP D17∗ | 0 [225] | 0 [120] | 0 [22.5] | 238.7 (0.50) | −22.9 (0.50) | 97.57 (0.08) |
| Source | F-Value | p-Value | |
|---|---|---|---|
| Model | 34.90 | <0.0001 | Significant |
| A-Lipoid P100 | 196.80 | <0.0001 | |
| B-Sonication | 0.4325 | 0.5318 | |
| C-Valsartan | 4.87 | 0.0631 | |
| AB | 3.20 | 0.1168 | |
| AC | 10.00 | 0.0159 | |
| BC | 7.00 | 0.0332 | |
| A2 | 87.76 | <0.0001 | |
| B2 | 3.23 | 0.1153 | |
| C2 | 3.76 | 0.0937 | |
| Lack of Fit | 6.42 | 0.0521 | not significant |
| Source | F-Value | p-Value | |
|---|---|---|---|
| Model | 8.27 | 0.0055 | significant |
| A-lipid | 30.18 | 0.0009 | |
| B-Sonication | 0.6825 | 0.4360 | |
| C-Valsartan | 0.9956 | 0.3516 | |
| AB | 0.3684 | 0.563 | |
| AC | 10.15 | 0.0154 | |
| BC | 1.51 | 0.2588 | |
| A2 | 6.85 | 0.0346 | |
| B2 | 19.70 | 0.0030 | |
| C2 | 1.52 | 0.2579 | |
| Lack of Fit | 2.82 | 0.1712 | not significant |
| Source | F-Value | p-Value | |
|---|---|---|---|
| Model | 43.28 | <0.0001 | Significant |
| A-lipid | 194.44 | <0.0001 | |
| B-Sonication | 3.74 | 0.0943 | |
| C-Valsartan | 100.58 | <0.0001 | |
| AB | 1.43 | 0.2707 | |
| AC | 22.54 | 0.0021 | |
| BC | 2.37 | 0.1674 | |
| A2 | 59.79 | 0.0001 | |
| B2 | 1.87 | 0.2138 | |
| C2 | 0.4927 | 0.5054 | |
| Lack of Fit | 1.79 | 0.2888 | not significant |
| Optimum Independent Variables | Model Coded Levels | Model Actual Levels |
|---|---|---|
| A: Lipoid P100 amount (mg) | −0.851 | 161 |
| B: Sonication time (s) | −0.21 | 107 |
| C: Amount of VAL (mg) | −0.595 | 18 |
| Dependent variables | Predicted values | Experimental values |
| X: Particle size of vesicles (nm) | 154.30 | 150.23 (0.47) |
| Y: ZP (mV) | −23.21 | –23.37 (0.50) |
| Z: EE% | 94.02 | 94.72 (0.44) |
Disclaimer/Publisher’s Note: The statements, opinions and data contained in all publications are solely those of the individual author(s) and contributor(s) and not of MDPI and/or the editor(s). MDPI and/or the editor(s) disclaim responsibility for any injury to people or property resulting from any ideas, methods, instructions or products referred to in the content. |
© 2025 by the authors. Licensee MDPI, Basel, Switzerland. This article is an open access article distributed under the terms and conditions of the Creative Commons Attribution (CC BY) license (https://creativecommons.org/licenses/by/4.0/).
Share and Cite
Khalid, R.; Mahmood, S.; Mohamed Sofian, Z.; Chik, Z.; Ge, Y. Development of Rapidly Dissolving Microneedles Integrated with Valsartan-Loaded Nanoliposomes for Transdermal Drug Delivery: In Vitro and Ex Vivo Evaluation. Pharmaceutics 2025, 17, 483. https://doi.org/10.3390/pharmaceutics17040483
Khalid R, Mahmood S, Mohamed Sofian Z, Chik Z, Ge Y. Development of Rapidly Dissolving Microneedles Integrated with Valsartan-Loaded Nanoliposomes for Transdermal Drug Delivery: In Vitro and Ex Vivo Evaluation. Pharmaceutics. 2025; 17(4):483. https://doi.org/10.3390/pharmaceutics17040483
Chicago/Turabian StyleKhalid, Ramsha, Syed Mahmood, Zarif Mohamed Sofian, Zamri Chik, and Yi Ge. 2025. "Development of Rapidly Dissolving Microneedles Integrated with Valsartan-Loaded Nanoliposomes for Transdermal Drug Delivery: In Vitro and Ex Vivo Evaluation" Pharmaceutics 17, no. 4: 483. https://doi.org/10.3390/pharmaceutics17040483
APA StyleKhalid, R., Mahmood, S., Mohamed Sofian, Z., Chik, Z., & Ge, Y. (2025). Development of Rapidly Dissolving Microneedles Integrated with Valsartan-Loaded Nanoliposomes for Transdermal Drug Delivery: In Vitro and Ex Vivo Evaluation. Pharmaceutics, 17(4), 483. https://doi.org/10.3390/pharmaceutics17040483