

PBPK Modeling Approach to Predict the Behavior of Drugs Cleared by Metabolism in Pregnant Subjects and Fetuses

Abstract
1. Introduction
2. Material and Methods
2.1. Pregnancy Model
2.1.1. Maternal Changes: Enzymes
2.1.2. Fetal Changes: Liver Size and Enzyme Expression
2.2. Model Validation Compounds
2.2.1. MET PBPK Model
2.2.2. MID PBPK Model
2.2.3. MTD PBPK Model
3. Results
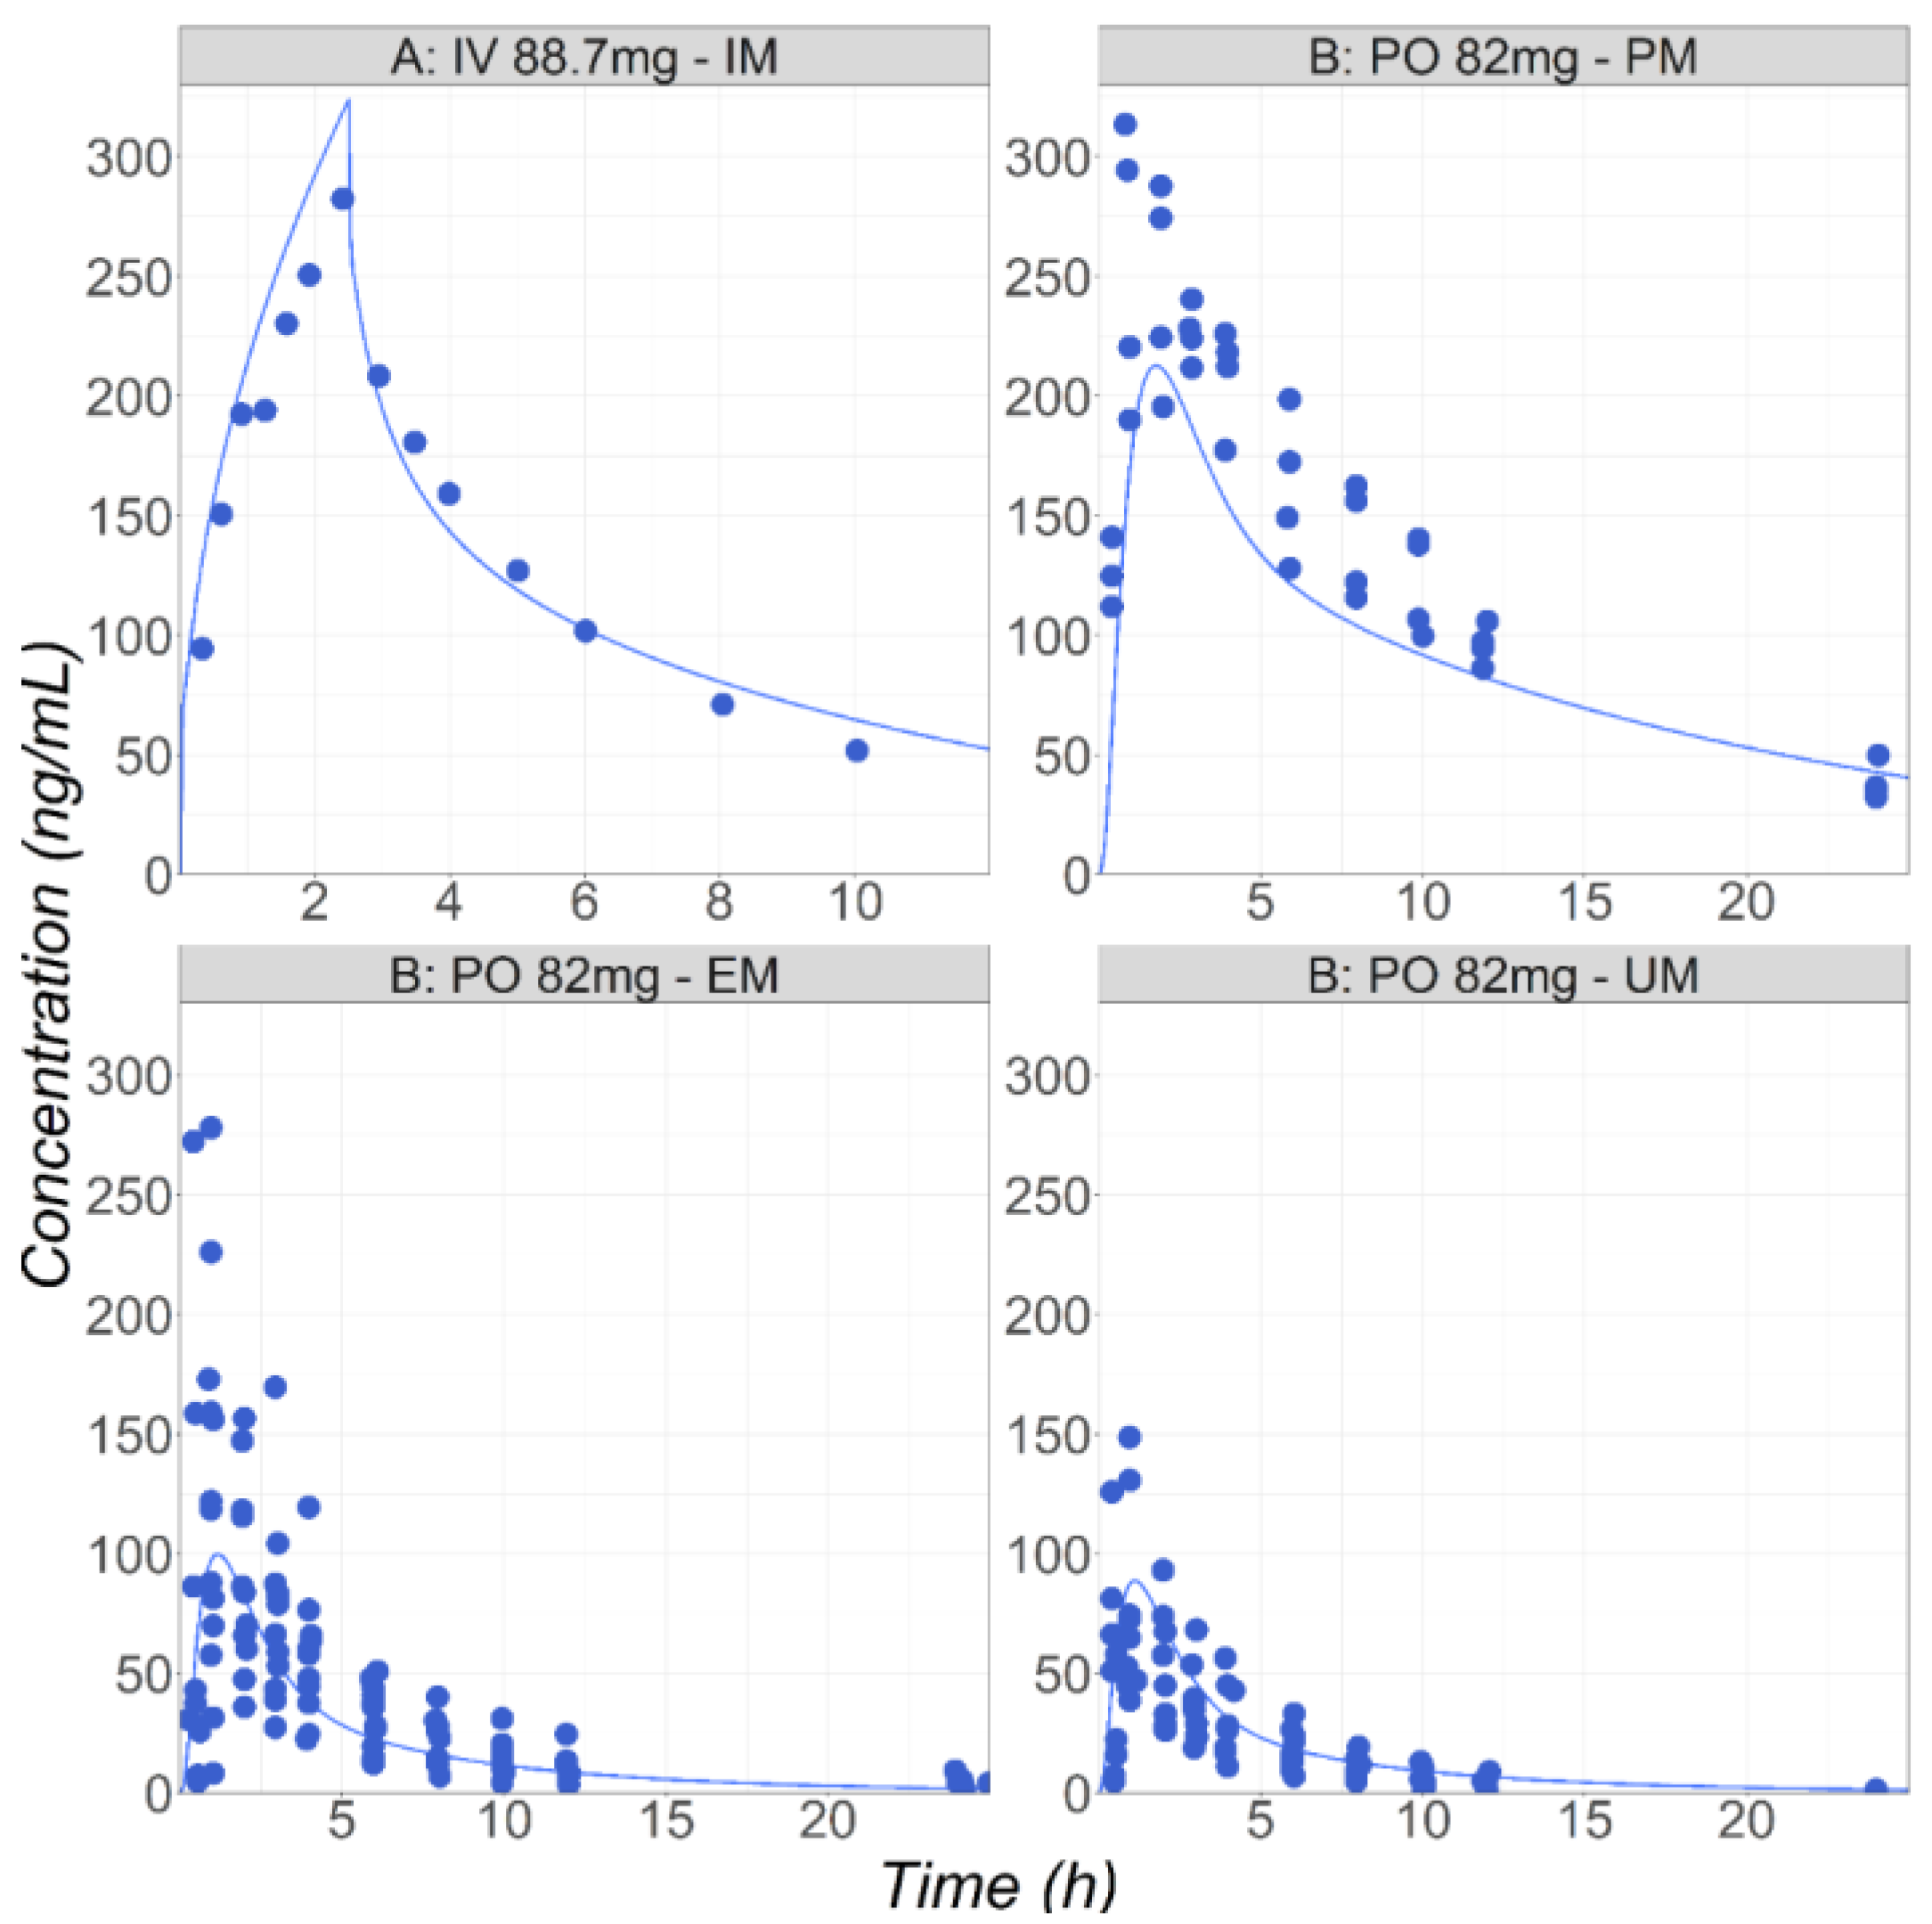
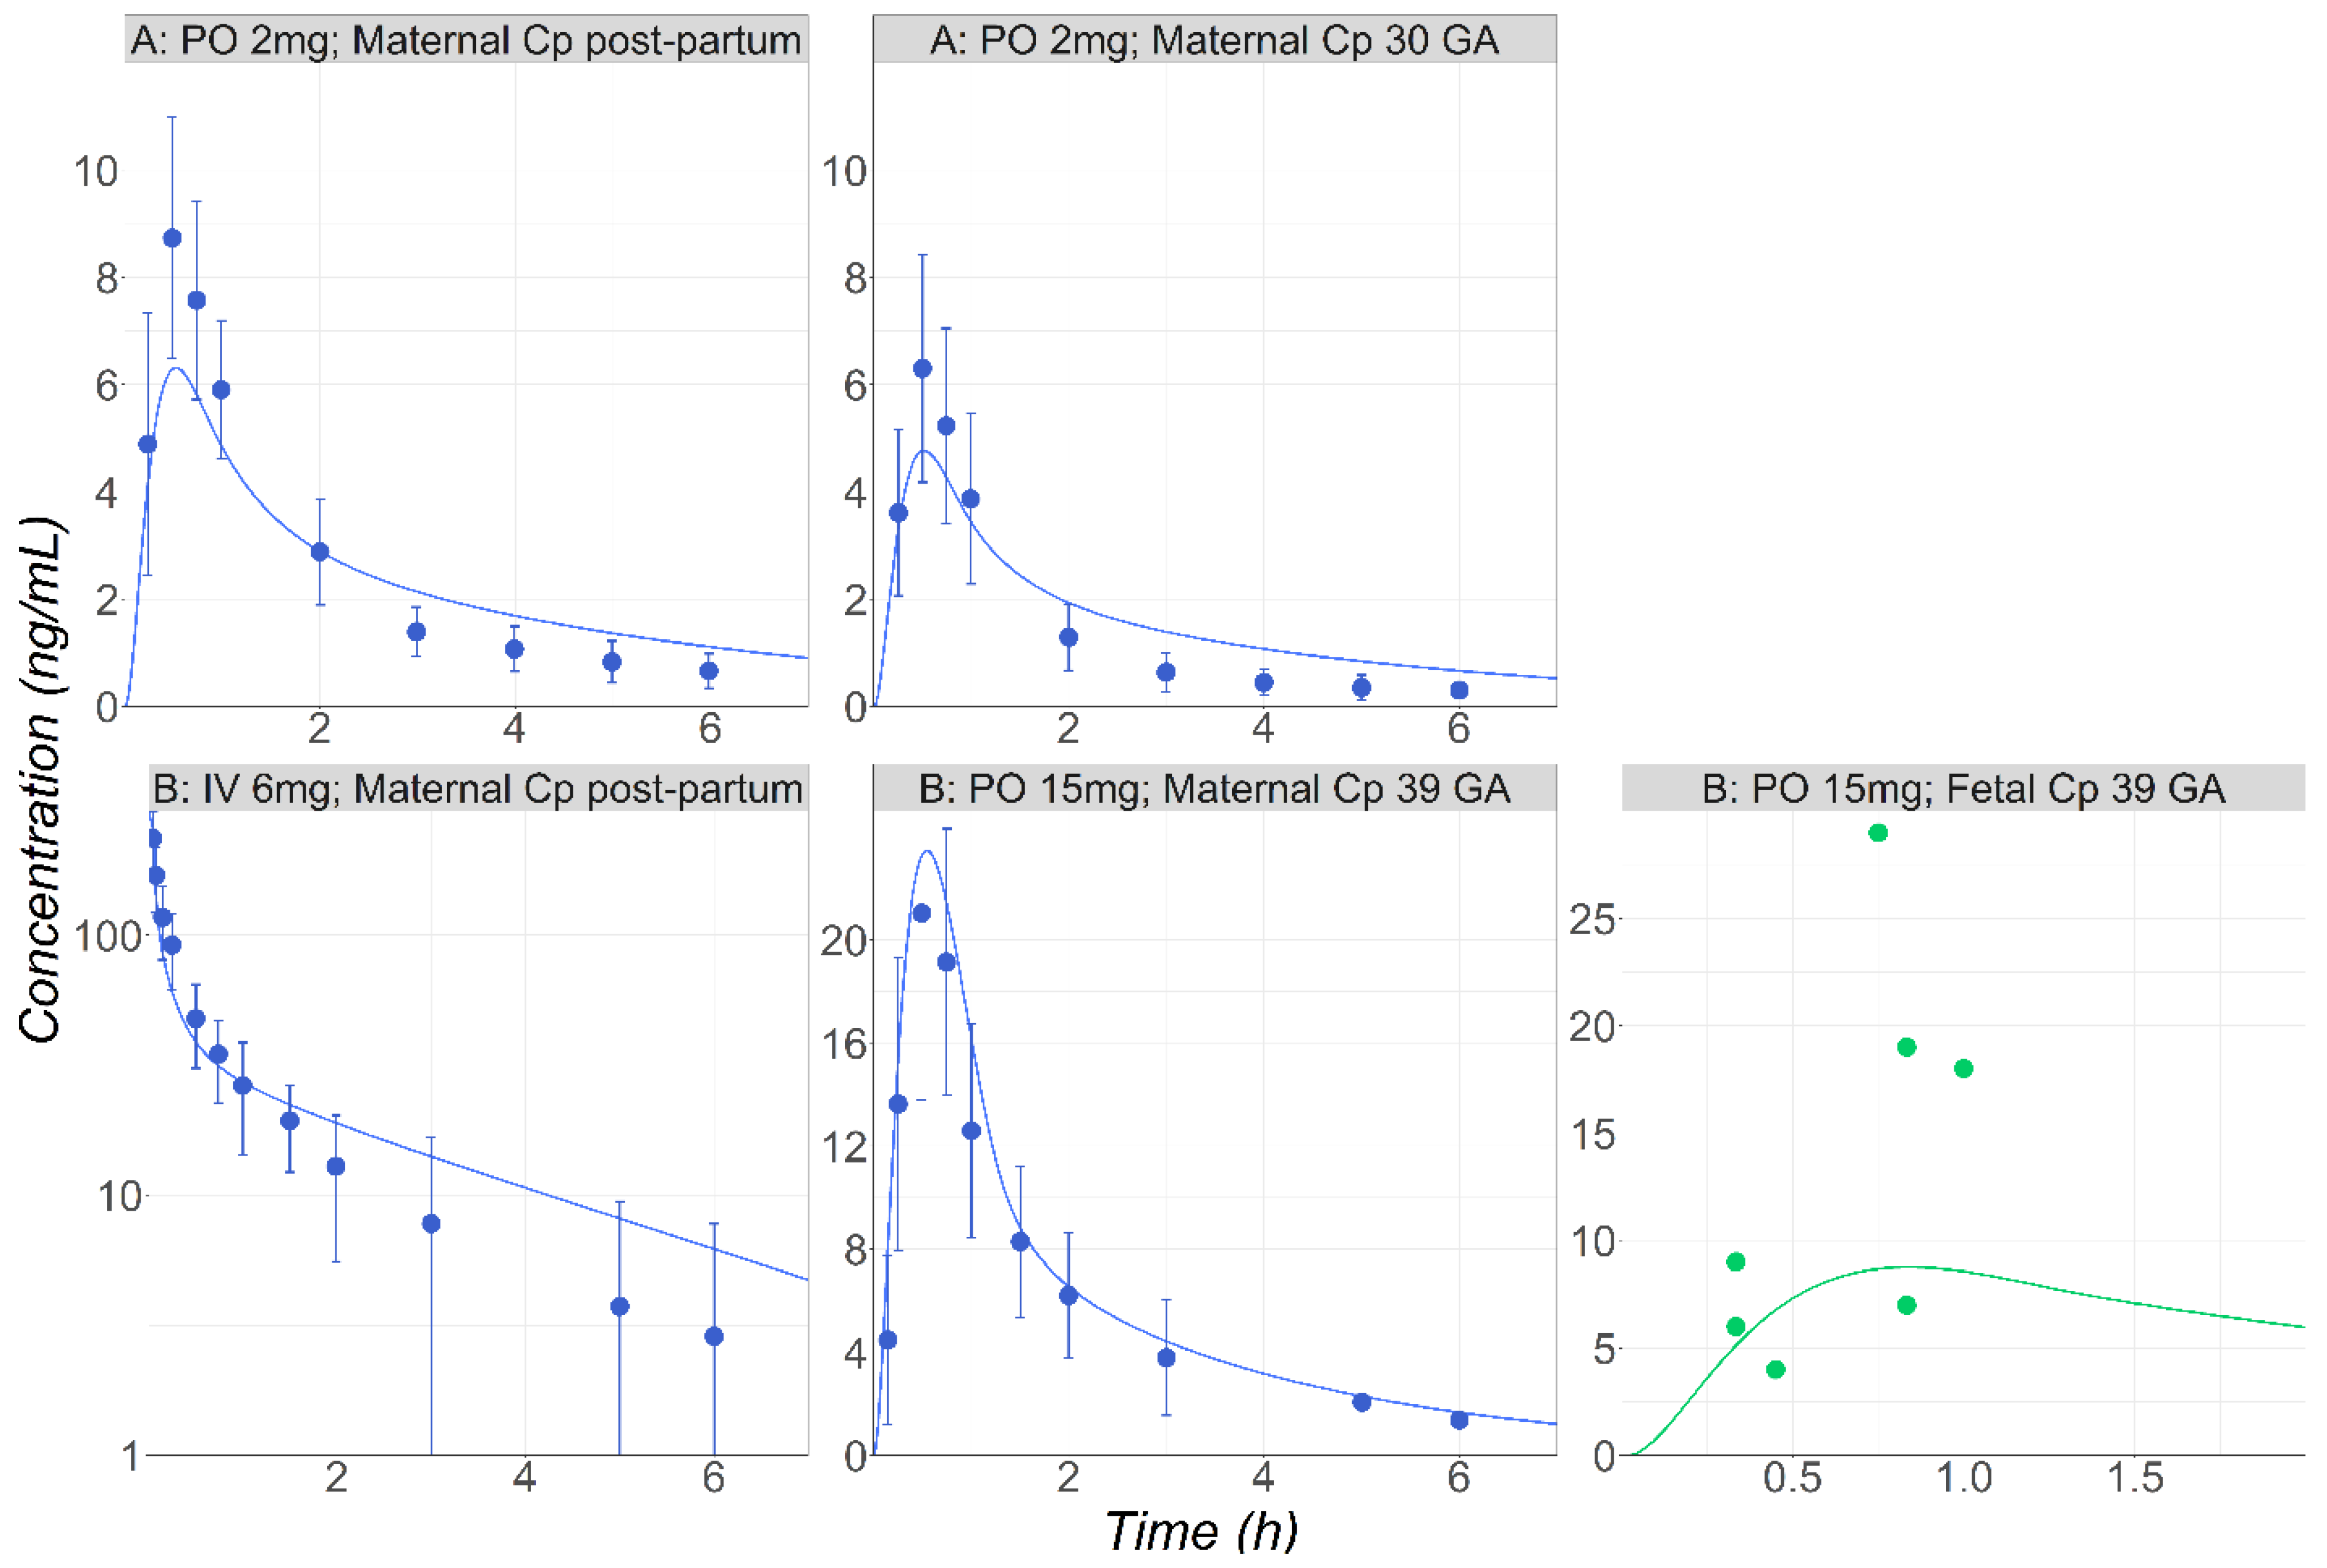
3.1. Metoprolol
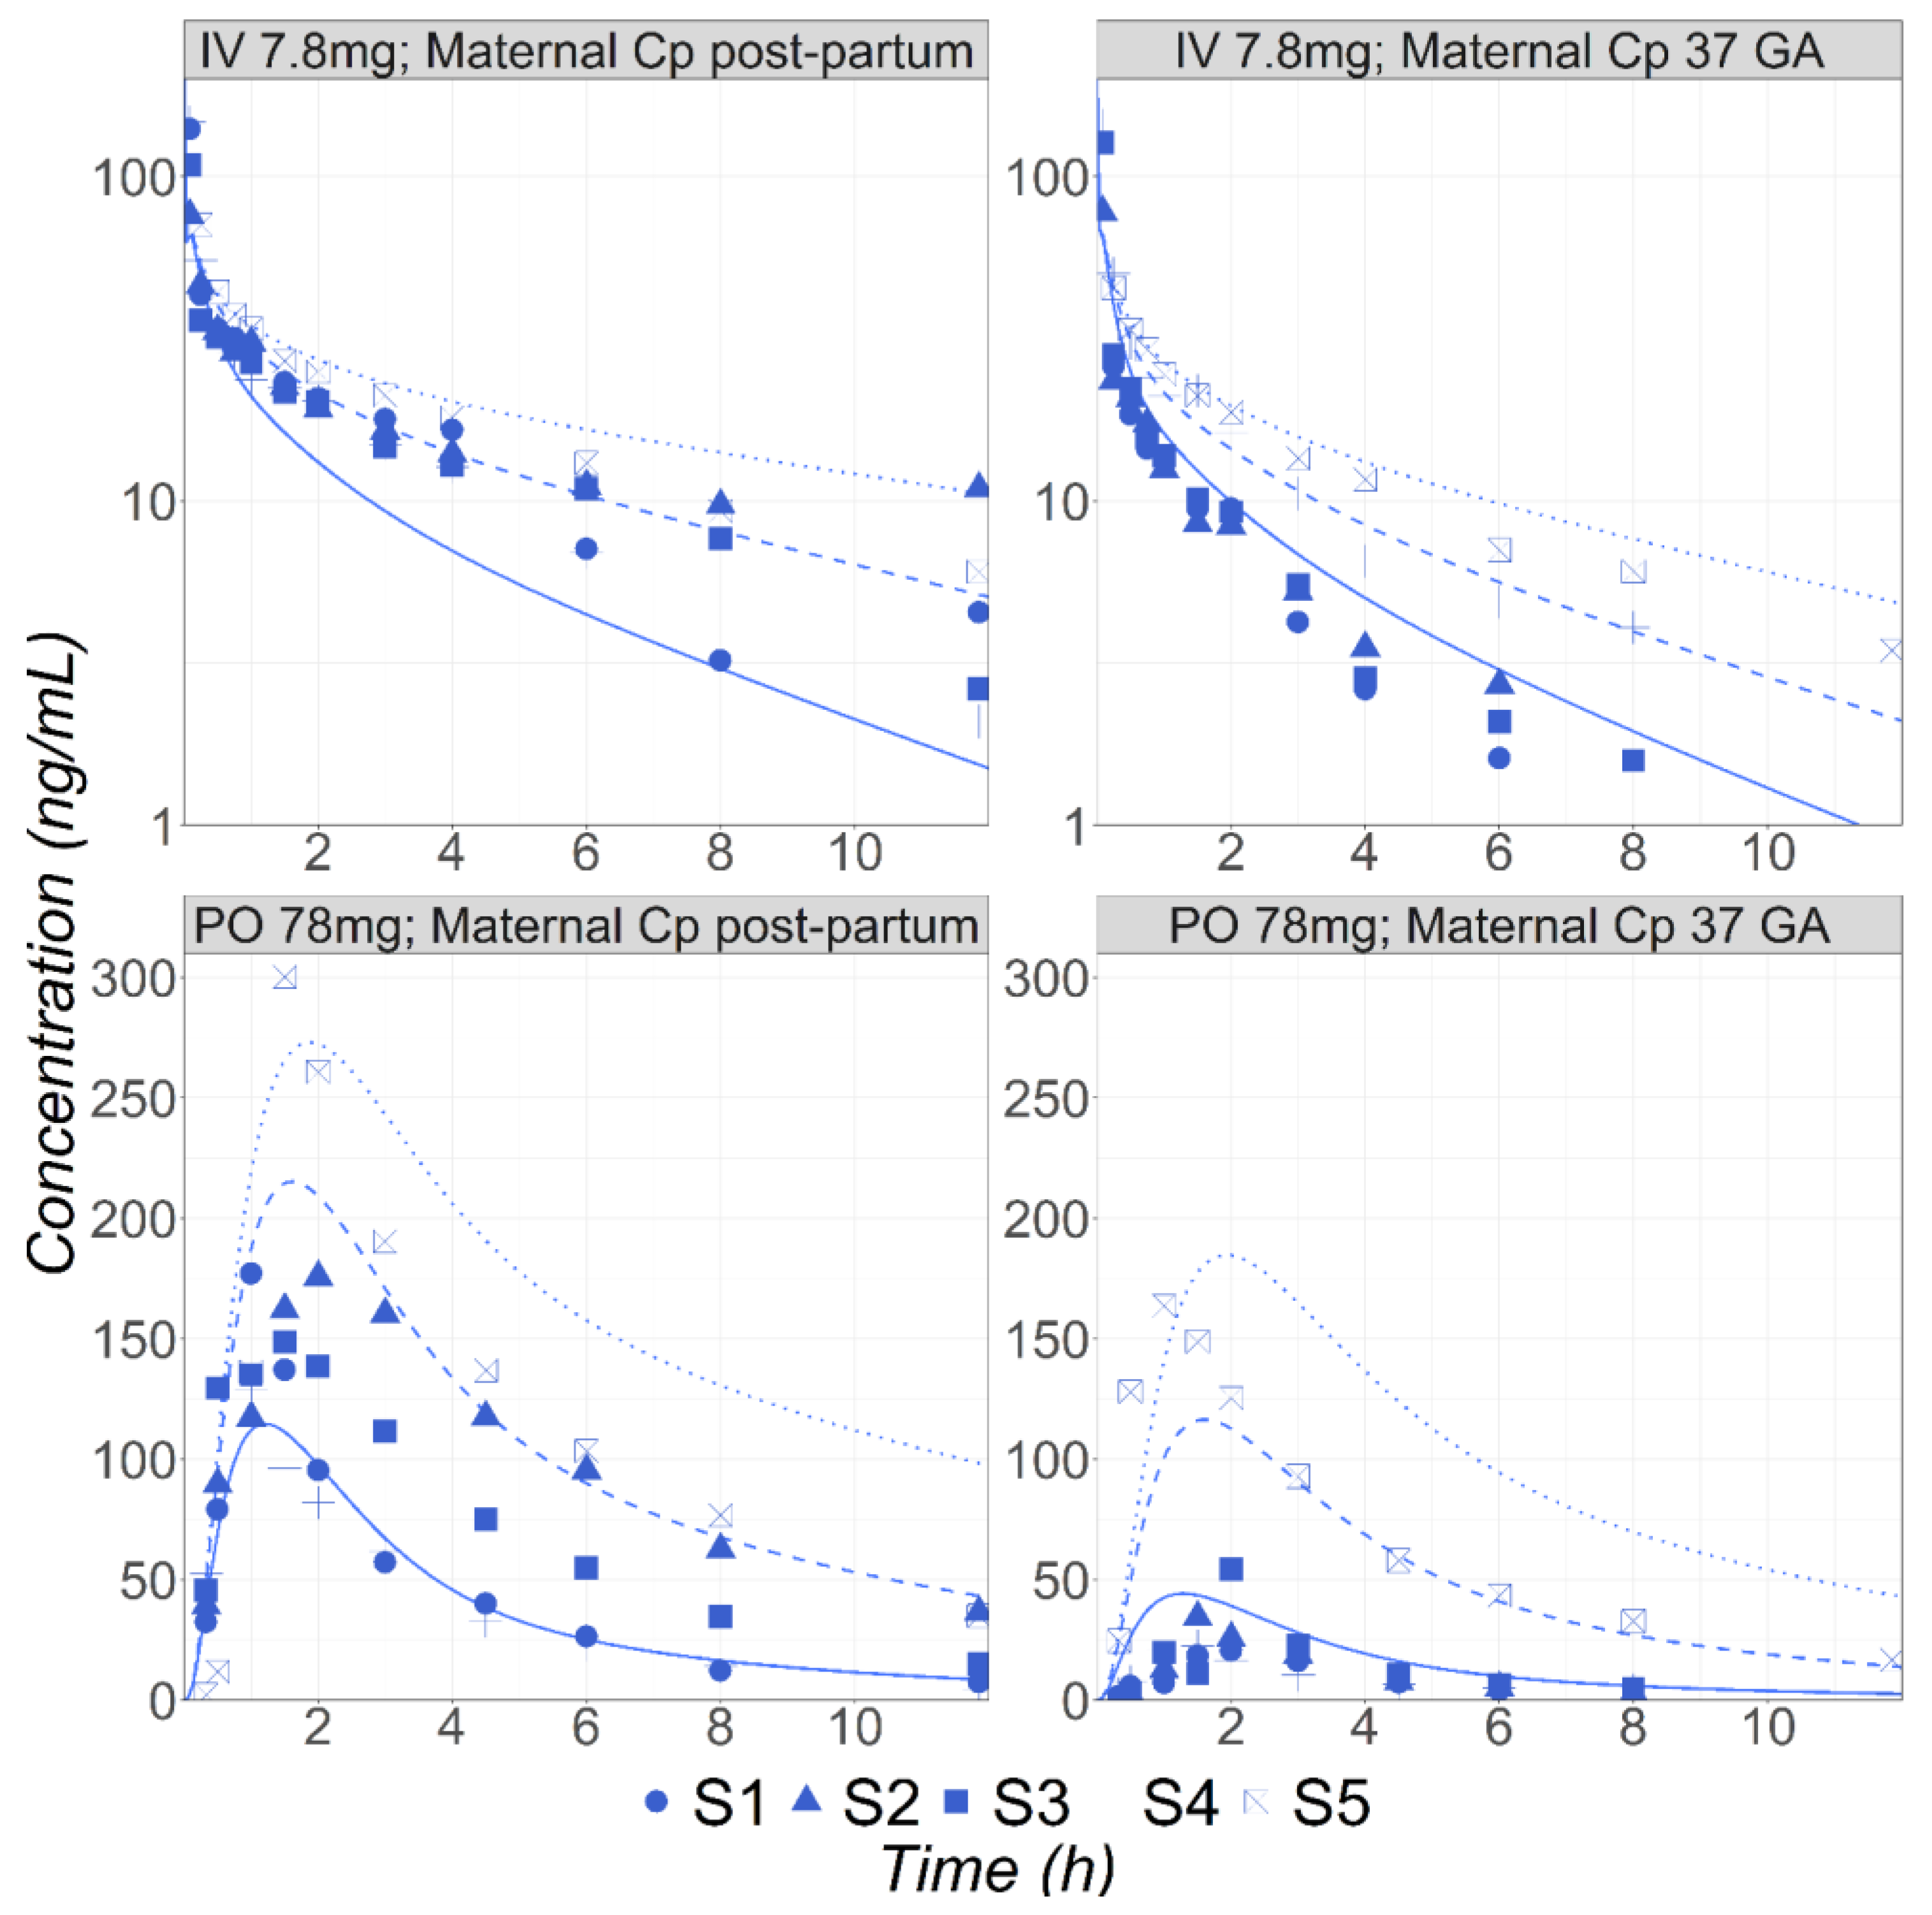
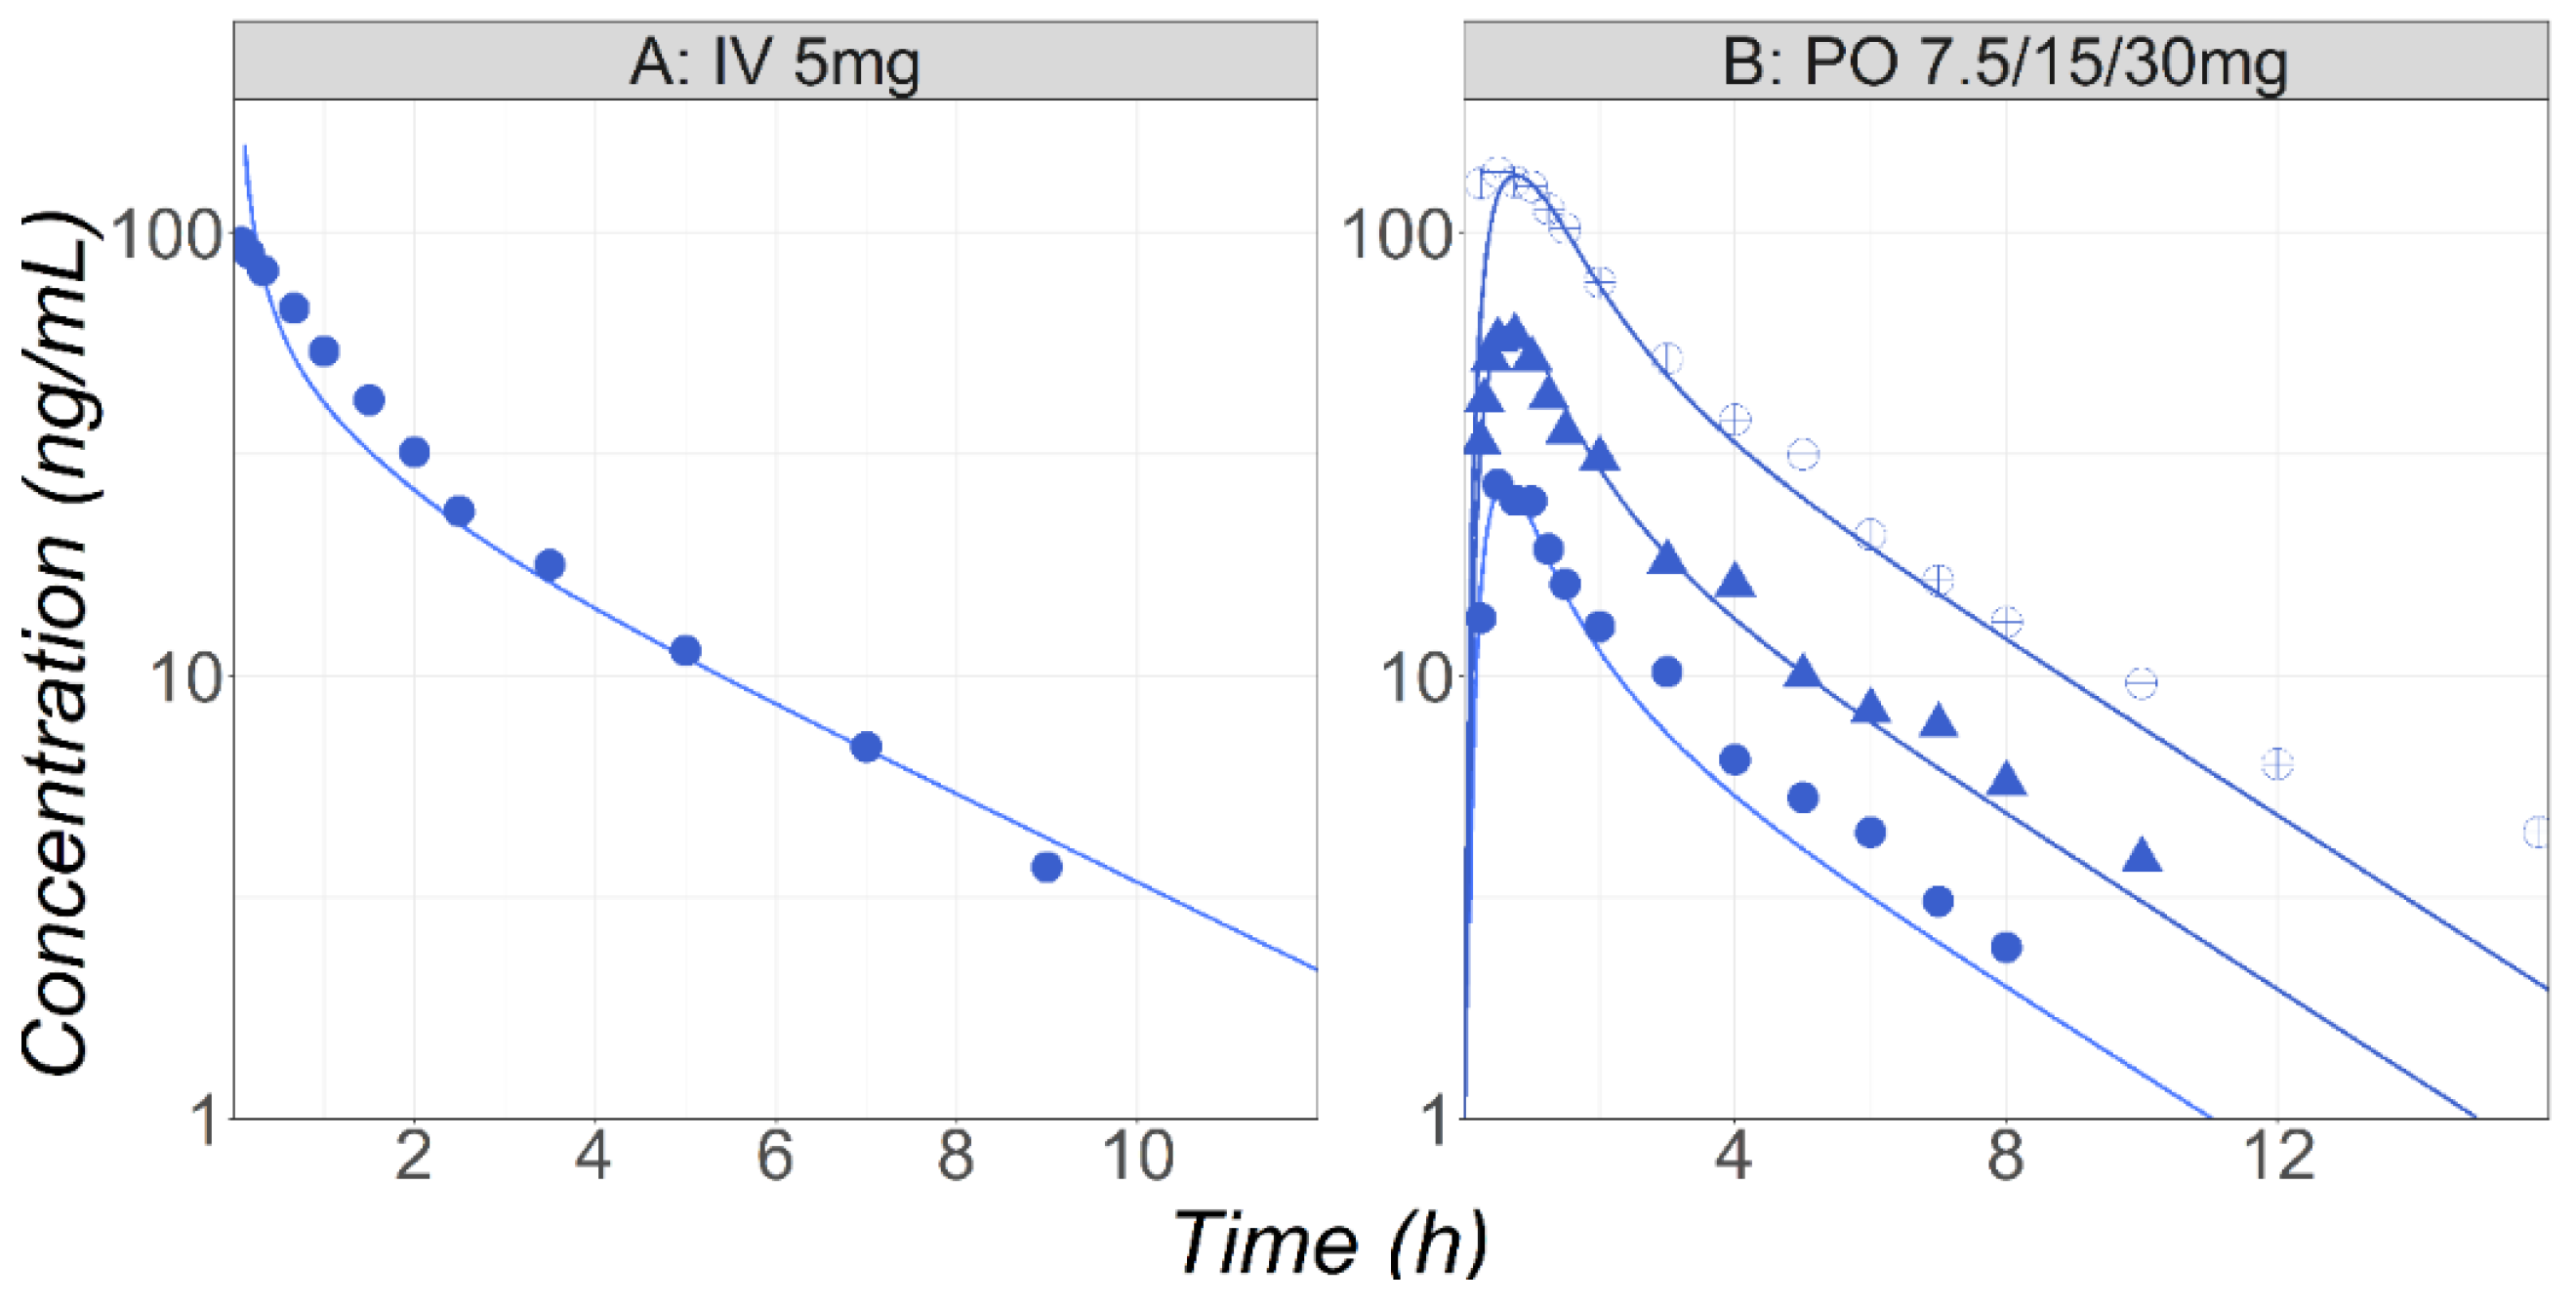
3.2. Midazolam
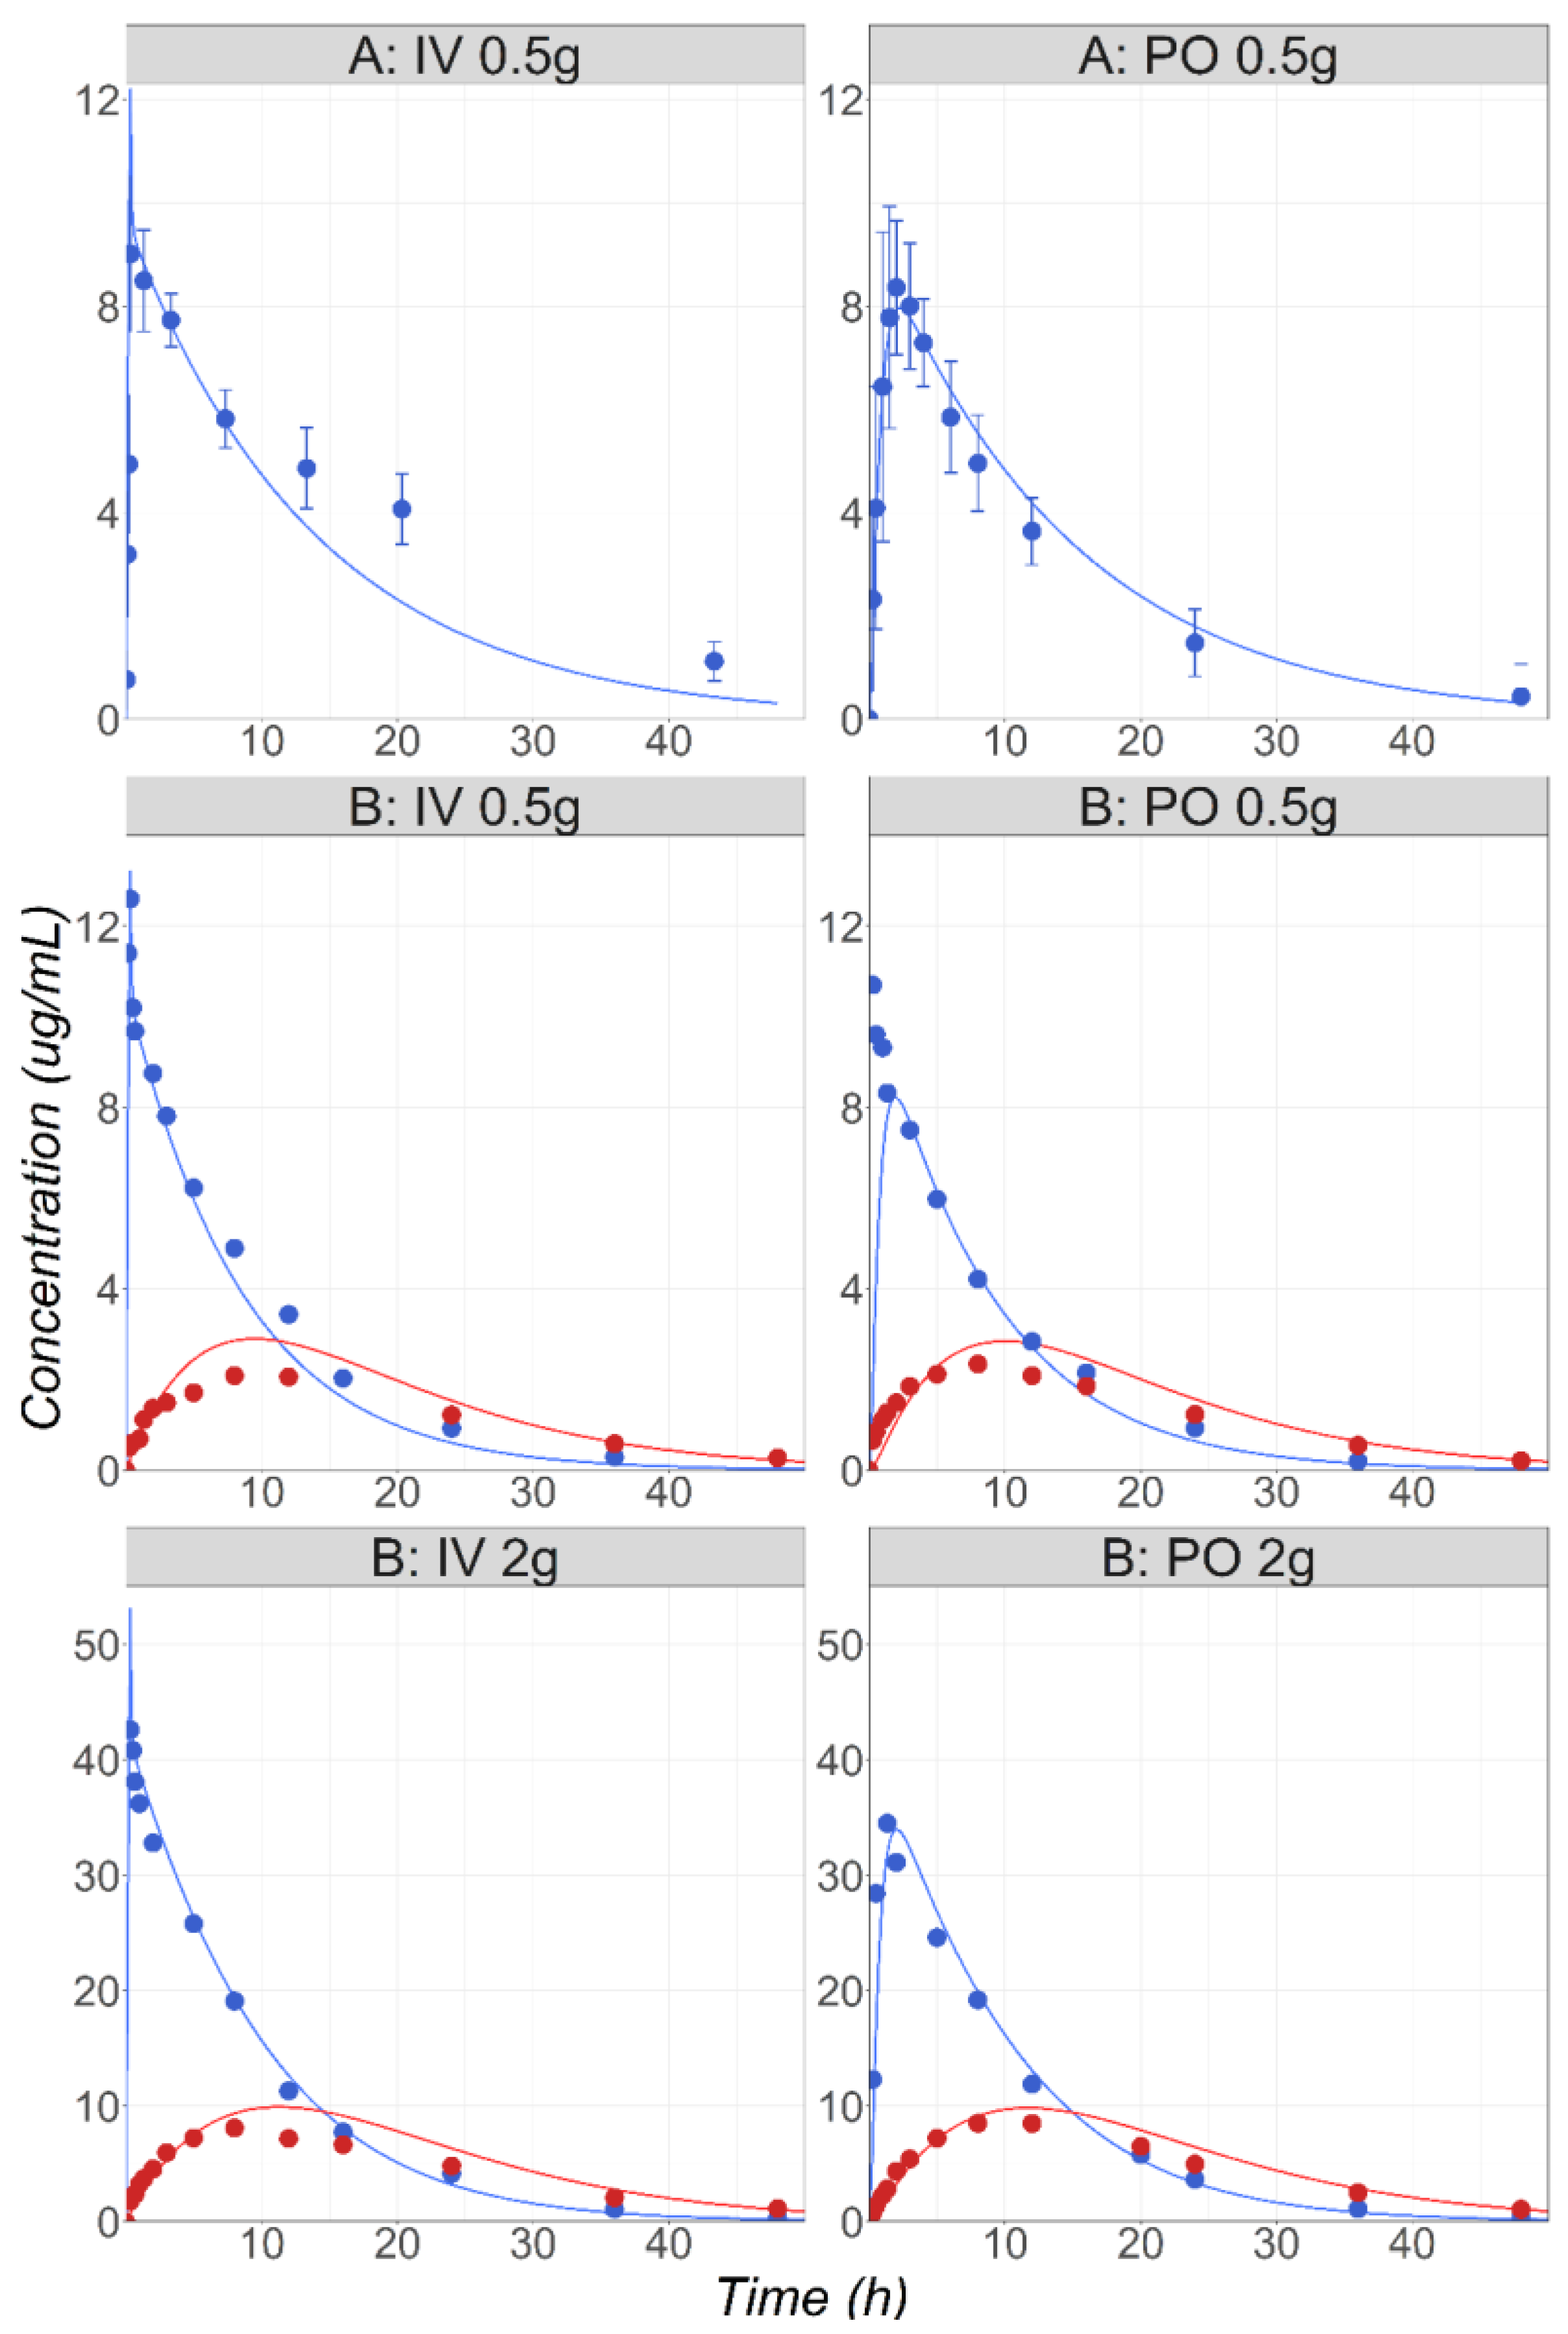
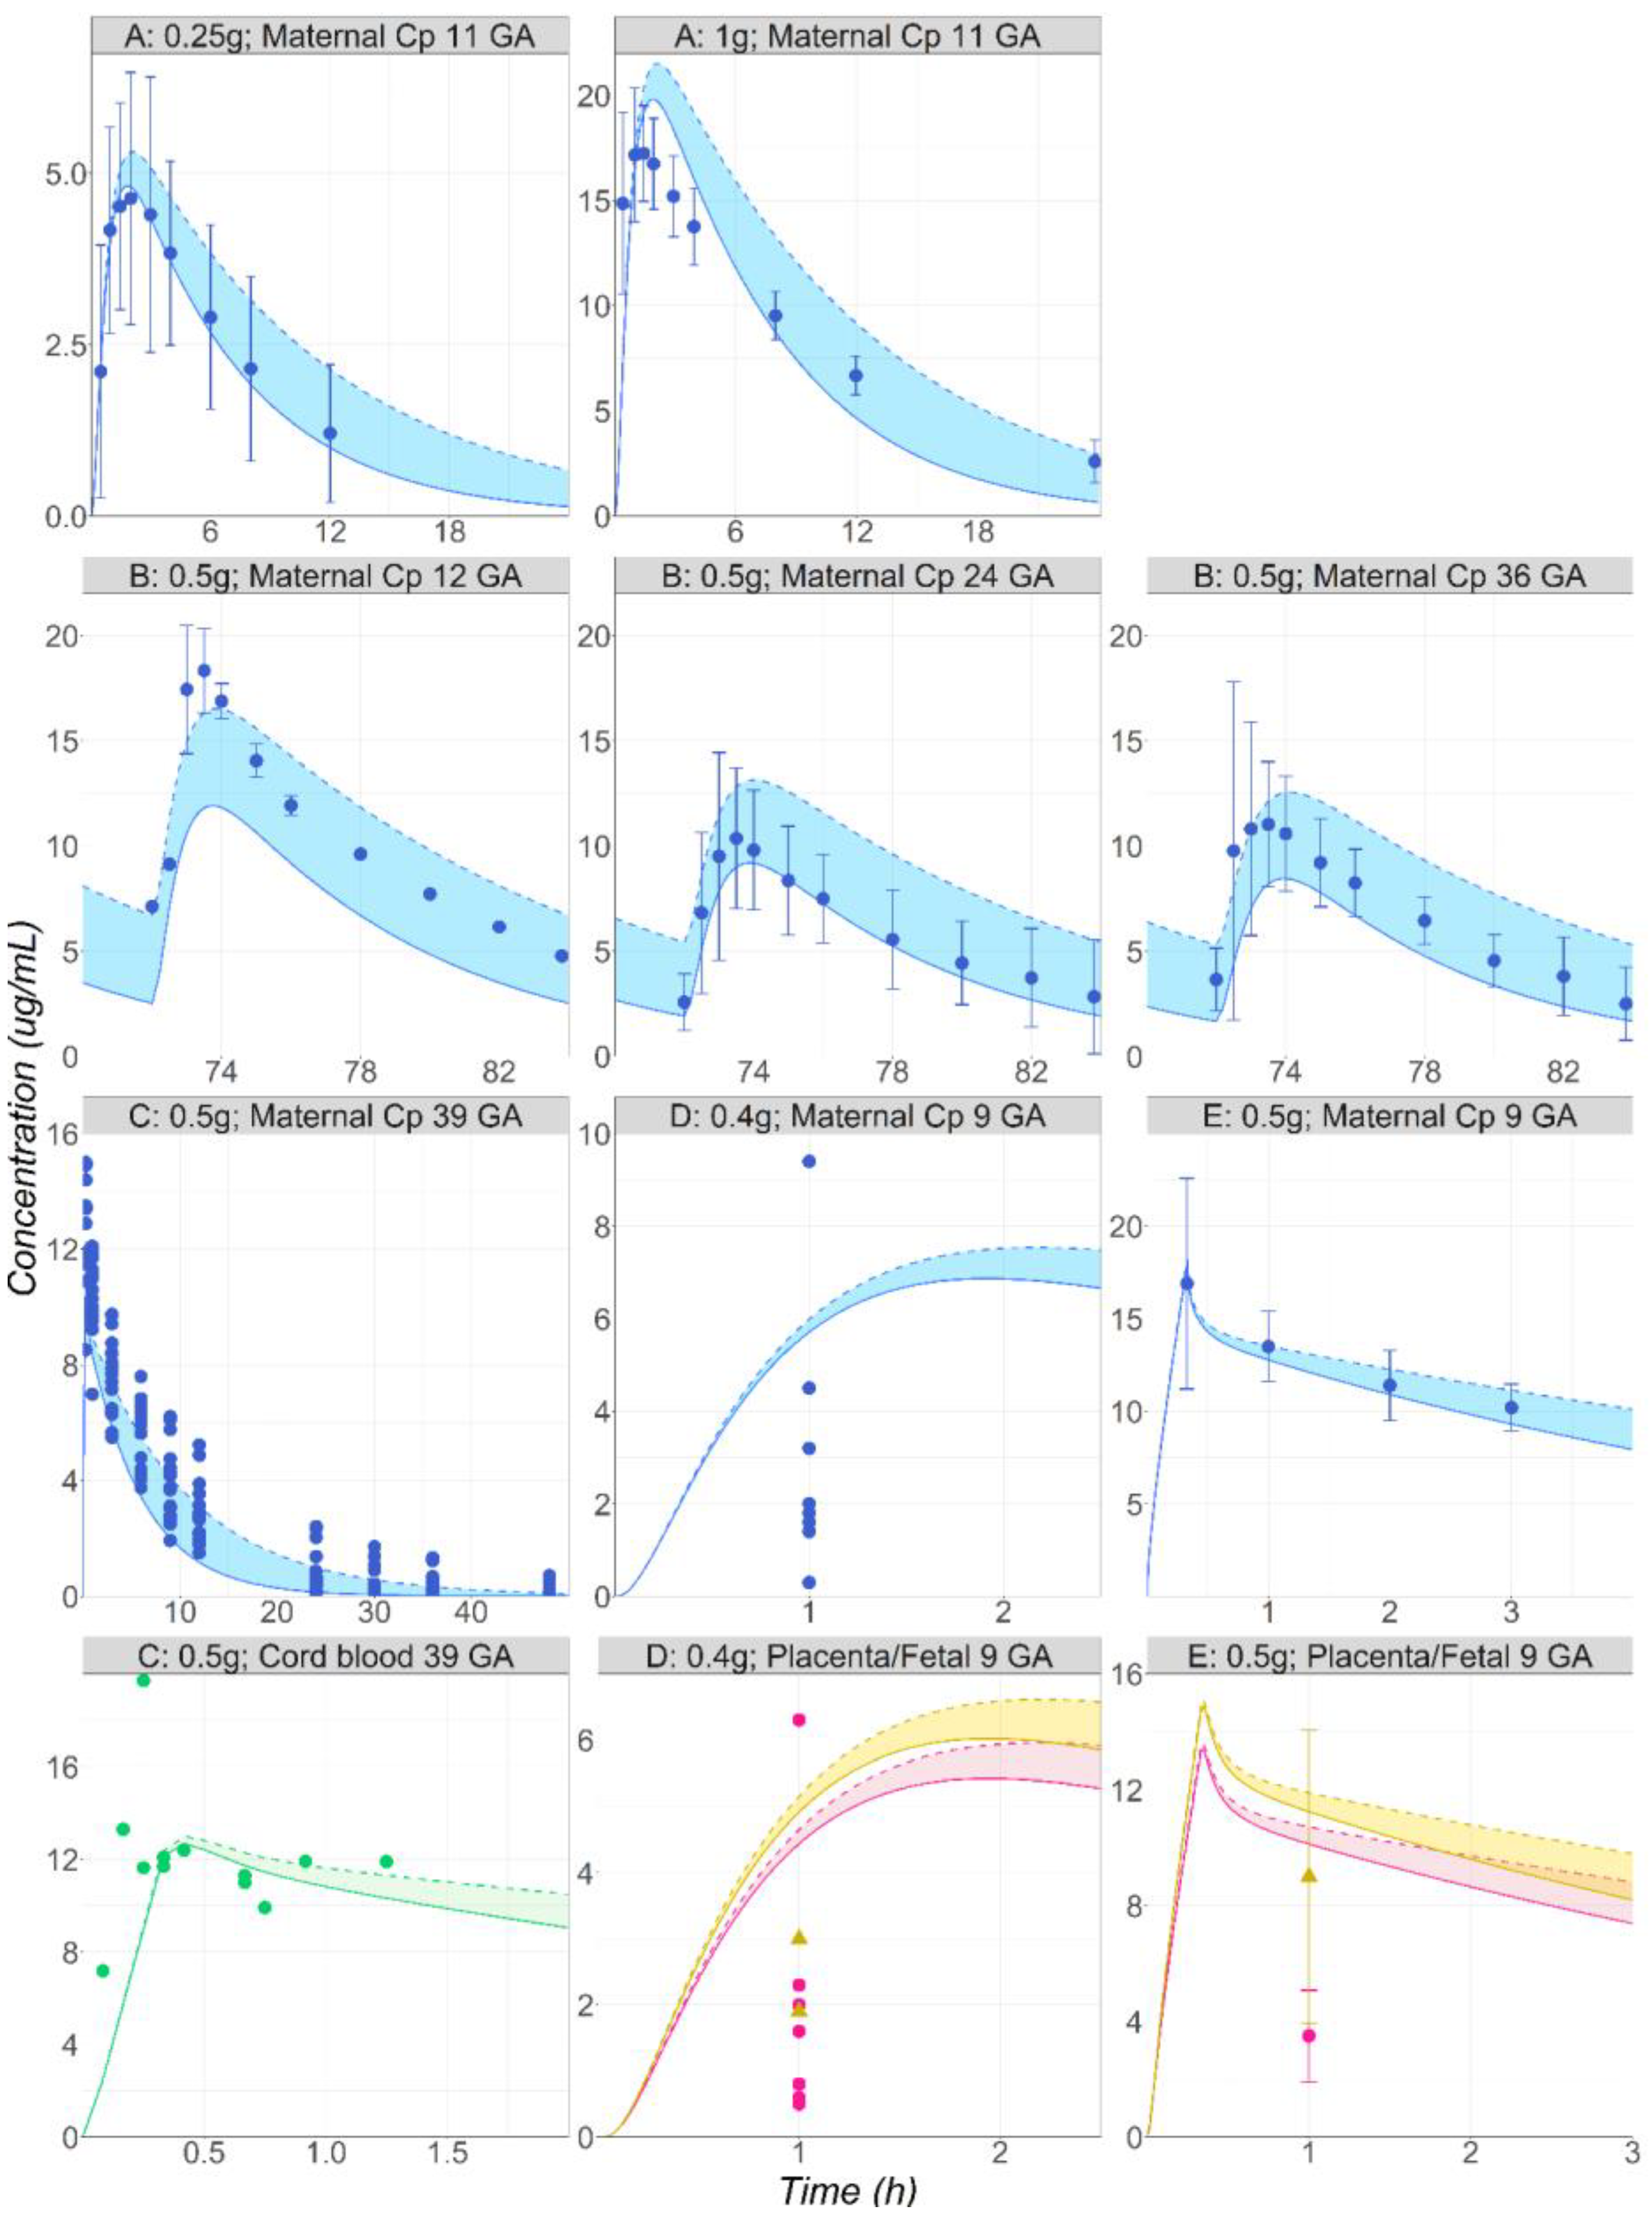
3.3. Metronidazole
4. Discussion
5. Conclusions
Supplementary Materials
Author Contributions
Funding
Data Availability Statement
Conflicts of Interest
References
- U.S. Food and Drug Administration. Pregnant Women: Scientific and Ethical Considerations for Inclusion in Clinical Trials Guidance for Industry. 2018. Available online: https://www.fda.gov/media/112195/download (accessed on 12 December 2023).
- European Medicines Agency. Guideline on Risk Assessment of Medicinal Products on Human Reproduction and Lactation: From Data to Labelling. 2009. Available online: https://www.ema.europa.eu/en/documents/scientific-guideline/guideline-risk-assessment-medicinal-products-human-reproduction-lactation-data-labelling_en.pdf (accessed on 12 December 2023).
- Kappel, D.; Sahin, L.; Yao, L.; Thor, S.; Kweder, S. A Comparison of FDA and EMA Pregnancy and Lactation Labeling. Clin. Pharmacol. Ther. 2023, 113, 1251–1257. [Google Scholar] [CrossRef] [PubMed]
- Brent, R.L. Utilization of animal studies to determine the effects and human risks of environmental toxicants (drugs, chemicals, and physical agents). Pediatrics 2004, 113, 984–995. [Google Scholar] [CrossRef]
- European Medicines Agency. Guideline on the Exposure to Medicinal Products during Pregnancy: Need for Post-Authorisation Data. 2006. Available online: https://www.ema.europa.eu/en/documents/regulatory-procedural-guideline/guideline-exposure-medicinal-products-during-pregnancy-need-post-authorisation-data_en.pdf (accessed on 12 December 2023).
- Berezowska, M.; Sharma, P.; Pilla Reddy, V.; Coppola, P. Physiologically Based Pharmacokinetic modelling of drugs in pregnancy: A mini-review on availability and limitations. Fundam. Clin. Pharmacol. 2023, e12967. [Google Scholar] [CrossRef] [PubMed]
- Coppola, P.; Kerwash, E.; Cole, S. Physiologically Based Pharmacokinetics Model in Pregnancy: A Regulatory Perspective on Model Evaluation. Front. Pediatr. 2021, 9, 687978. [Google Scholar] [CrossRef] [PubMed]
- Szeto, K.X.; Le Merdy, M.; Dupont, B.; Bolger, M.B.; Lukacova, V. PBPK Modeling Approach to Predict the Behavior of Drugs Cleared by Kidney in Pregnant Subjects and Fetus. AAPS J. 2021, 23, 89. [Google Scholar] [CrossRef] [PubMed]
- Almazroo, O.A.; Miah, M.K.; Venkataramanan, R. Drug Metabolism in the Liver. Clin. Liver Dis. 2017, 21, 1–20. [Google Scholar] [CrossRef]
- Benedetti, M.S.; Whomsley, R.; Poggesi, I.; Cawello, W.; Mathy, F.-X.; Delporte, M.-L.; Papeleu, P.; Watelet, J.-B. Drug metabolism and pharmacokinetics. Drug Metab. Rev. 2009, 41, 344–390. [Google Scholar] [CrossRef]
- Manikandan, P.; Nagini, S. Cytochrome P450 Structure, Function and Clinical Significance: A Review. Curr. Drug Targets 2018, 19, 38–54. [Google Scholar] [CrossRef]
- Abduljalil, K.; Furness, P.; Johnson, T.N.; Rostami-Hodjegan, A.; Soltani, H. Anatomical, physiological and metabolic changes with gestational age during normal pregnancy: A database for parameters required in physiologically based pharmacokinetic modelling. Clin. Pharmacokinet. 2012, 51, 365–396. [Google Scholar] [CrossRef]
- Dallmann, A.; Ince, I.; Coboeken, K.; Eissing, T.; Hempel, G. A Physiologically Based Pharmacokinetic Model for Pregnant Women to Predict the Pharmacokinetics of Drugs Metabolized Via Several Enzymatic Pathways. Clin. Pharmacokinet. 2017, 57, 749–768. [Google Scholar] [CrossRef]
- Gong, C.; Bertagnolli, L.N.; Boulton, D.W.; Coppola, P. A Literature Review of Changes in Phase II Drug-Metabolizing Enzyme and Drug Transporter Expression during Pregnancy. Pharmaceutics 2023, 15, 2624. [Google Scholar] [CrossRef] [PubMed]
- De Sousa Mendes, M.; Lui, G.; Zheng, Y.; Pressiat, C.; Hirt, D.; Valade, E.; Bouazza, N.; Foissac, F.; Blanche, S.; Treluyer, J.-M.; et al. A Physiologically-Based Pharmacokinetic Model to Predict Human Fetal Exposure for a Drug Metabolized by Several CYP450 Pathways. Clin. Pharmacokinet. 2017, 56, 537–550. [Google Scholar] [CrossRef] [PubMed]
- Simulations Plus. GastroPlus Manual; Simulations Plus: Lancaster, CA, USA, 2023. [Google Scholar]
- Johnson, T.N.; Rostami-Hodjegan, A.; Tucker, G.T. Prediction of the clearance of eleven drugs and associated variability in neonates, infants and children. Clin. Pharmacokinet. 2006, 45, 931–956. [Google Scholar] [CrossRef] [PubMed]
- Madani, S.; Paine, M.F.; Lewis, L.; Thummel, K.E.; Shen, D.D. Comparison of CYP2D6 content and metoprolol oxidation between microsomes isolated from human livers and small intestines. Pharm. Res. 1999, 16, 1199–1205. [Google Scholar] [CrossRef] [PubMed]
- Lukacova, V.; Parrott, N.J.; Fraczkiewicz, G.; Bolger, M.B.; Woltosz, W.S. General approach to calculation of tissue:plasma partition coefficients for physiologically based pharmacokinetic (PBPK) modeling. In Proceedings of the AAPS Annual Meeting, Atlanta, GA, USA, 16–20 November 2008. [Google Scholar]
- Paine, M.F.; Khalighi, M.; Fisher, J.M.; Shen, D.D.; Kunze, K.L.; Marsh, C.L.; Perkins, J.D.; Thummel, K.E. Characterization of interintestinal and intraintestinal variations in human CYP3A-dependent metabolism. J. Pharmacol. Exp. Ther. 1997, 283, 1552–1562. [Google Scholar] [PubMed]
- Trevaskis, N.L.; Nguyen, G.; Scanlon, M.J.; Porter, C.J.H. Fatty acid binding proteins: Potential chaperones of cytosolic drug transport in the enterocyte? Pharm. Res. 2011, 28, 2176–2190. [Google Scholar] [CrossRef] [PubMed]
- Pearce, R.E.; Cohen-Wolkowiez, M.; Sampson, M.R.; Kearns, G.L. The role of human cytochrome P450 enzymes in the formation of 2-hydroxymetronidazole: CYP2A6 is the high affinity (low Km) catalyst. Drug Metab. Dispos. 2013, 41, 1686–1694. [Google Scholar] [CrossRef]
- Proctor, N.J.; Tucker, G.T.; Rostami-Hodjegan, A. Predicting drug clearance from recombinantly expressed CYPs: Intersystem extrapolation factors. Xenobiotica 2004, 34, 151–178. [Google Scholar] [CrossRef]
- Mattila, J.; Männistö, P.T.; Mäntylä, R.; Nykänen, S.; Lamminsivu, U. Comparative pharmacokinetics of metronidazole and tinidazole as influenced by administration route. Antimicrob. Agents Chemother. 1983, 23, 721–725. [Google Scholar] [CrossRef]
- Loft, S.; Døssing, M.; Poulsen, H.E.; Sonne, J.; Olesen, K.L.; Simonsen, K.; Andreasen, P.B. Influence of dose and route of administration on disposition of metronidazole and its major metabolites. Eur. J. Clin. Pharmacol. 1986, 30, 467–473. [Google Scholar] [CrossRef]
- Stambaugh, J.E.; Feo, L.G.; Manthei, R.W. The isolation and identification of the urinary oxidative metabolites of metronidazole in man. J. Pharmacol. Exp. Ther. 1968, 161, 373–381. [Google Scholar] [PubMed]
- Blake, C.; Kharasch, E.; Schwab, M.; Nagele, P. Meta-Analysis of cyp2d6 Metabolizer Phenotype and Metoprolol Pharmacokinetics. Clin. Pharmacol. Ther. 2013, 94, 394–399. [Google Scholar] [CrossRef] [PubMed]
- U.S. Food and Drug Administration. LOPRESSOR (Metoprolol Tartrate) Tablet FDA Label. Available online: https://www.accessdata.fda.gov/drugsatfda_docs/label/2008/017963s062,018704s021lbl.pdf (accessed on 12 December 2023).
- Kirchheiner, J.; Heesch, C.; Bauer, S.; Meisel, C.; Seringer, A.; Goldammer, M.; Tzvetkov, M.; Meineke, I.; Roots, I.; Brockmöller, J. Impact of the ultrarapid metabolizer genotype of cytochrome P450 2D6 on metoprolol pharmacokinetics and pharmacodynamics. Clin. Pharmacol. Ther. 2004, 76, 302–312. [Google Scholar] [CrossRef] [PubMed]
- Godbillon, J.; Evard, D.; Vidon, N.; Duval, M.; Schoeller, J.P.; Bernier, J.J.; Hirtz, J. Investigation of drug absorption from the gastrointestinal tract of man. Br. J. Clin. Pharmacol. 1985, 19, 113S–118S. [Google Scholar] [CrossRef] [PubMed]
- Högstedt, S.; Lindberg, B.; Peng, D.R.; Regårdh, C.G.; Rane, A. Pregnancy-induced increase in metoprolol metabolism. Clin. Pharmacol. Ther. 1985, 37, 688–692. [Google Scholar] [CrossRef]
- U.S. Food and Drug Administration. MIdazolam Injectable Pharmacology and Toxicology Review. 1984. Available online: https://www.accessdata.fda.gov/drugsatfda_docs/nda/pre96/018654Orig1s000rev.pdf (accessed on 12 December 2023).
- Kupferschmidt, H.H.; Ha, H.R.; Ziegler, W.H.; Meier, P.J.; Krähenbühl, S. Interaction between grapefruit juice and midazolam in humans. Clin. Pharmacol. Ther. 1995, 58, 20–28. [Google Scholar] [CrossRef] [PubMed]
- Bornemann, L.D.; Min, B.H.; Crews, T.; Rees, M.M.; Blumenthal, H.P.; Colburn, W.A.; Patel, I.H. Dose dependent pharmacokinetics of midazolam. Eur. J. Clin. Pharmacol. 1985, 29, 91–95. [Google Scholar] [CrossRef] [PubMed]
- Hebert, M.F.; Easterling, T.R.; Kirby, B.; Carr, D.B.; Buchanan, M.L.; Rutherford, T.; Thummel, K.E.; Fishbein, D.P.; Unadkat, J.D. Effects of pregnancy on CYP3A and P-glycoprotein activities as measured by disposition of midazolam and digoxin: A University of Washington specialized center of research study. Clin. Pharmacol. Ther. 2008, 84, 248–253. [Google Scholar] [CrossRef]
- Inoue, S.; Howgate, E.M.; Rowland-Yeo, K.; Shimada, T.; Yamazaki, H.; Tucker, G.T.; Rostami-Hodjegan, A. Prediction of in vivo drug clearance from in vitro data. II: Potential inter-ethnic differences. Xenobiotica 2006, 36, 499–513. [Google Scholar] [CrossRef]
- Kanto, J.; Sjövall, S.; Erkkola, R.; Himberg, J.J.; Kangas, L. Placental transfer and maternal midazolam kinetics. Clin. Pharmacol. Ther. 1983, 33, 786–791. [Google Scholar] [CrossRef]
- Houghton, G.W.; Thorne, P.S.; Smith, J.; Templeton, R.; Collier, J. Comparison of the pharmacokinetics of metronidazole in healthy female volunteers following either a single oral or intravenous dose. Br. J. Clin. Pharmacol. 1979, 8, 337–341. [Google Scholar] [CrossRef]
- Raunio, H.; Rautio, A.; Gullstén, H.; Pelkonen, O. Polymorphisms of CYP2A6 and its practical consequences. Br. J. Clin. Pharmacol. 2001, 52, 357–363. [Google Scholar] [CrossRef] [PubMed]
- López-Flores, L.A.; Pérez-Rubio, G.; Falfán-Valencia, R. Distribution of polymorphic variants of CYP2A6 and their involvement in nicotine addiction. EXCLI J. 2017, 16, 174–196. [Google Scholar] [CrossRef]
- Amon, I.; Amon, K.; Franke, G.; Mohr, C. Pharmacokinetics of Metronidazole in pregnant women. Chemotherapy 1981, 27, 73–79. [Google Scholar] [CrossRef] [PubMed]
- Wang, X.; Nanovskaya, T.N.; Zhan, Y.; Abdel-Rahman, S.M.; Jasek, M.; Hankins, G.D.V.; Ahmed, M.S. Pharmacokinetics of metronidazole in pregnant patients with bacterial vaginosis. J. Matern. Fetal. Neonatal. Med. 2011, 24, 444–448. [Google Scholar] [CrossRef] [PubMed]
- Visser, A.A.; Hundt, H.K. The pharmacokinetics of a single intravenous dose of metronidazole in pregnant patients. J. Antimicrob. Chemother. 1984, 13, 279–283. [Google Scholar] [CrossRef]
- Karhunen, M. Placental transfer of metronidazole and tinidazole in early human pregnancy after a single infusion. Br. J. Clin. Pharmacol. 1984, 18, 254–257. [Google Scholar] [CrossRef]
- Heisterberg, L. Placental transfer of metronidazole in the first trimester of pregnancy. J. Perinat. Med. 1984, 12, 43–45. [Google Scholar] [CrossRef]
- Kammala, A.K.; Richardson, L.; Menon, R. Development of physiologically based pharmacokinetic model using artificial intelligence based approaches for pravastatin during pregnancy. Am. J. Obstet. Gynecol. 2022, 226, S692–S693. [Google Scholar] [CrossRef]
- Darakjian, L.I.; Kaddoumi, A. Physiologically Based Pharmacokinetic/Pharmacodynamic Model for Caffeine Disposition in Pregnancy. Mol. Pharm. 2019, 16, 1340–1349. [Google Scholar] [CrossRef]
- Krzyzanski, W.; Milad, M.A.; Jobe, A.H.; Jusko, W.J. Minimal physiologically-based hybrid model of pharmacokinetics in pregnant women: Application to antenatal corticosteroids. CPT Pharmacomet. Syst. Pharmacol. 2023, 12, 668–680. [Google Scholar] [CrossRef] [PubMed]
- Zheng, L.; Yang, H.; Dallmann, A.; Jiang, X.; Wang, L.; Hu, W. Physiologically Based Pharmacokinetic Modeling in Pregnant Women Suggests Minor Decrease in Maternal Exposure to Olanzapine. Front. Pharmacol. 2022, 12, 793346. [Google Scholar] [CrossRef] [PubMed]
- Zhang, H.; Bastian, J.R.; Zhao, W.; Chen, H.; Shaik, I.H.; Chaphekar, N.; Caritis, S.N.; Venkataramanan, R. Pregnancy Alters CYP- and UGT-Mediated Metabolism of Buprenorphine. Ther. Drug Monit. 2020, 42, 264–270. [Google Scholar] [CrossRef]
- Petrenaite, V.; Öhman, I.; Ekström, L.; Sæbye, D.; Hansen, T.F.; Tomson, T.; Sabers, A. UGT polymorphisms and lamotrigine clearance during pregnancy. Epilepsy Res. 2018, 140, 199–208. [Google Scholar] [CrossRef] [PubMed]
- Dallmann, A.; Ince, I.; Meyer, M.; Willmann, S.; Eissing, T.; Hempel, G. Gestation-Specific Changes in the Anatomy and Physiology of Healthy Pregnant Women: An Extended Repository of Model Parameters for Physiologically Based Pharmacokinetic Modeling in Pregnancy. Clin. Pharmacokinet. 2017, 56, 1303–1330. [Google Scholar] [CrossRef] [PubMed]
- Institute of Medicine (US); National Research Council (US). Committee to Reexamine IOM Pregnancy Weight Guidelines. In Weight Gain During Pregnancy: Reexamining the Guidelines; Rasmussen, K.M., Yaktine, A.L., Eds.; National Academies Press: Washington, DC, USA, 2009. Available online: http://www.ncbi.nlm.nih.gov/books/NBK32813/ (accessed on 28 July 2020).
- Anoshchenko, O.; Prasad, B.; Neradugomma, N.K.; Wang, J.; Mao, Q.; Unadkat, J.D. Gestational Age-Dependent Abundance of Human Placental Transporters as Determined by Quantitative Targeted Proteomics. Drug Metab. Dispos. 2020, 48, 735–741. [Google Scholar] [CrossRef]
- Carmichael, S.; Abrams, B.; Selvin, S. The pattern of maternal weight gain in women with good pregnancy outcomes. Am. J. Public Health 1997, 87, 1984–1988. [Google Scholar] [CrossRef]
- Abduljalil, K.; Johnson, T.N.; Rostami-Hodjegan, A. Fetal Physiologically-Based Pharmacokinetic Models: Systems Information on Fetal Biometry and Gross Composition. Clin. Pharmacokinet. 2018, 57, 1149–1171. [Google Scholar] [CrossRef]
- Zhang, Z.; Imperial, M.Z.; Patilea-Vrana, G.I.; Wedagedera, J.; Gaohua, L.; Unadkat, J.D. Development of a Novel Maternal-Fetal Physiologically Based Pharmacokinetic Model I: Insights into Factors that Determine Fetal Drug Exposure through Simulations and Sensitivity Analyses. Drug Metab. Dispos. 2017, 45, 920–938. [Google Scholar] [CrossRef]
- Zhang, Z.; Unadkat, J.D. Development of a Novel Maternal-Fetal Physiologically Based Pharmacokinetic Model II: Verification of the model for passive placental permeability drugs. Drug Metab. Dispos. 2017, 45, 939–946. [Google Scholar] [CrossRef]
- Freriksen, J.J.M.; Schalkwijk, S.; Colbers, A.P.; Abduljalil, K.; Russel, F.G.M.; Burger, D.M.; Greupink, R. Assessment of Maternal and Fetal Dolutegravir Exposure by Integrating Ex Vivo Placental Perfusion Data and Physiologically-Based Pharmacokinetic Modeling. Clin. Pharmacol. Ther. 2020, 107, 1352–1361. [Google Scholar] [CrossRef] [PubMed]
- Mian, P.; Allegaert, K.; Conings, S.; Annaert, P.; Tibboel, D.; Pfister, M.; van Calsteren, K.; van den Anker, J.N.; Dallmann, A. Integration of Placental Transfer in a Fetal-Maternal Physiologically Based Pharmacokinetic Model to Characterize Acetaminophen Exposure and Metabolic Clearance in the Fetus. Clin. Pharmacokinet. 2020, 59, 911–925. [Google Scholar] [CrossRef]
- Brochot, C.; Casas, M.; Manzano-Salgado, C.; Zeman, F.A.; Schettgen, T.; Vrijheid, M.; Bois, F.Y. Prediction of maternal and foetal exposures to perfluoroalkyl compounds in a Spanish birth cohort using toxicokinetic modelling. Toxicol. Appl. Pharmacol. 2019, 379, 114640. [Google Scholar] [CrossRef]
- Atoyebi, S.A.; Rajoli, R.K.R.; Adejuyigbe, E.; Owen, A.; Bolaji, O.; Siccardi, M.; Olagunju, A. Using mechanistic physiologically-based pharmacokinetic models to assess prenatal drug exposure: Thalidomide versus efavirenz as case studies. Eur. J. Pharm. Sci. 2019, 140, 105068. [Google Scholar] [CrossRef]
- Anoshchenko, O.; Storelli, F.; Unadkat, J.D. Successful Prediction of Human Fetal Exposure to P-Glycoprotein Substrate Drugs Using the Proteomics-Informed Relative Expression Factor Approach and PBPK Modeling and Simulation. Drug Metab. Dispos. 2021, 49, 919–928. [Google Scholar] [CrossRef] [PubMed]
- Chen, J.; You, X.; Wu, W.; Guo, G.; Lin, R.; Ke, M.; Huang, P.; Lin, C. Application of PBPK modeling in predicting maternal and fetal pharmacokinetics of levetiracetam during pregnancy. Eur. J. Pharm. Sci. 2023, 181, 106349. [Google Scholar] [CrossRef] [PubMed]
- Codaccioni, M.; Bois, F.; Brochot, C. Placental transfer of xenobiotics in pregnancy physiologically-based pharmacokinetic models: Structure and data. Comput. Toxicol. 2019, 12, 100111. [Google Scholar] [CrossRef]
- Gaohua, L.; Abduljalil, K.; Jamei, M.; Johnson, T.N.; Rostami-Hodjegan, A. A pregnancy physiologically based pharmacokinetic (p-PBPK) model for disposition of drugs metabolized by CYP1A2, CYP2D6 and CYP3A4. Br. J. Clin. Pharmacol. 2012, 74, 873–885. [Google Scholar] [CrossRef]
- Ke, A.B.; Nallani, S.C.; Zhao, P.; Rostami-Hodjegan, A.; Unadkat, J.D. Expansion of a PBPK model to predict disposition in pregnant women of drugs cleared via multiple CYP enzymes, including CYP2B6, CYP2C9 and CYP2C19. Br. J. Clin. Pharmacol. 2014, 77, 554–570. [Google Scholar] [CrossRef]
- Dallmann, A.; Liu, X.I.; Burckart, G.J.; Anker, J. van den Drug Transporters Expressed in the Human Placenta and Models for Studying Maternal-Fetal Drug Transfer. J. Clin. Pharmacol. 2019, 59, S70–S81. [Google Scholar] [CrossRef]
- Yamashita, M.; Markert, U.R. Overview of Drug Transporters in Human Placenta. Int. J. Mol. Sci. 2021, 22, 13149. [Google Scholar] [CrossRef]


Disclaimer/Publisher’s Note: The statements, opinions and data contained in all publications are solely those of the individual author(s) and contributor(s) and not of MDPI and/or the editor(s). MDPI and/or the editor(s) disclaim responsibility for any injury to people or property resulting from any ideas, methods, instructions or products referred to in the content. |
© 2024 by the authors. Licensee MDPI, Basel, Switzerland. This article is an open access article distributed under the terms and conditions of the Creative Commons Attribution (CC BY) license (https://creativecommons.org/licenses/by/4.0/).
Share and Cite
Le Merdy, M.; Szeto, K.X.; Perrier, J.; Bolger, M.B.; Lukacova, V. PBPK Modeling Approach to Predict the Behavior of Drugs Cleared by Metabolism in Pregnant Subjects and Fetuses. Pharmaceutics 2024, 16, 96. https://doi.org/10.3390/pharmaceutics16010096
Le Merdy M, Szeto KX, Perrier J, Bolger MB, Lukacova V. PBPK Modeling Approach to Predict the Behavior of Drugs Cleared by Metabolism in Pregnant Subjects and Fetuses. Pharmaceutics. 2024; 16(1):96. https://doi.org/10.3390/pharmaceutics16010096
Chicago/Turabian StyleLe Merdy, Maxime, Ke Xu Szeto, Jeremy Perrier, Michael B. Bolger, and Viera Lukacova. 2024. "PBPK Modeling Approach to Predict the Behavior of Drugs Cleared by Metabolism in Pregnant Subjects and Fetuses" Pharmaceutics 16, no. 1: 96. https://doi.org/10.3390/pharmaceutics16010096
APA StyleLe Merdy, M., Szeto, K. X., Perrier, J., Bolger, M. B., & Lukacova, V. (2024). PBPK Modeling Approach to Predict the Behavior of Drugs Cleared by Metabolism in Pregnant Subjects and Fetuses. Pharmaceutics, 16(1), 96. https://doi.org/10.3390/pharmaceutics16010096